Tag Archives: Handy Tips

Deploying Zabbix Components with Docker and Docker Compose

Post Syndicated from Janis Eidaks original https://blog.zabbix.com/deploying-zabbix-components-with-docker-and-docker-compose/30025/

Installing Zabbix from packages can feel overwhelming, due to the availability of different configuration options. The detailed and comprehensive documentation certainly helps to check the purpose of these multiple options, what values can be set in their fields, and if one is required for your planned deployment. There are quite a few official Zabbix blog posts about Zabbix in containers, and this post is aimed at showcasing how additional Zabbix components can be easily set up in a docker environment, along with docker run and docker compose examples.

For those who would prefer to use Zabbix in a containerized environment such as Docker, or who want to try out Zabbix quickly, this guide is for you (you can also check out the other Zabbix Docker blog posts). You can also mix and match Zabbix components installed from packages or built from source with those running in containers.

Please follow the official guide on how to set up the docker here.

To better understand the Zabbix architecture for those who are trying out Zabbix for the first time, I will give you an overview that should make it much easier to follow and understand Zabbix.

Zabbix consists of 3 main components (the bare minimum to get started):

  • Zabbix Server – responsible for everything related to data collection, trigger evaluation, event generation, and alerting.
  • Zabbix Frontend – responsible for the configuration (modifying or changing the configuration of the monitoring targets) and visualization (dashboards, graphs, tables, and widgets).
  • Database – this is where the Zabbix configuration and monitoring history data are stored.

You can monitor your targets with the bare minimum setup; however, more comprehensive and complete monitoring can be achieved by using the C-based Zabbix-agent or GO-based Zabbix-agent2 in combination with templates, user parameters, and more. To set up the minimum necessary Zabbix components, you can use this example in the guide.

There are also official guides available on the Zabbix documentation page (for both: the docker run and docker compose) or the Docker/Github.

As of this writing , these official Zabbix docker components are available from the docker hub page:

  • Zabbix Server (with MySQL/PostgreSQL database)
  • Zabbix Proxy (with MySQL/SQLite3 database)
  • Zabbix Frontend (Apache/Nginx with MySQL/PostgreSQL DB)
  • Zabbix Agent (TLS encryption)
  • Zabbix Agent2 (TLS encryption)
  • Zabbix Java Gateway
  • Zabbix SNMP traps
  • Zabbix Web Service

Tags are used to select which OS container an image will be based on, as well as which Zabbix component version you wish to employ. If you only specify tag value – latest, you will get the latest Zabbix version based on the Alpine Linux. The images based on Linux Alpine are more lightweight than the other distros.

When something does not work as expected or fails, check the container error logs! This will be useful for debugging purposes and will help to narrow down the cause of an issue. Additionally, when debugging you can also specify additional options, such as specific lines of log, timestamp since or until, or following the log file content.

# docker logs --tail 50 container_name_or_id
    --details        Show extra details provided to logs
-f, --follow         Follow log output
    --since string   Show logs since timestamp (e.g. "2013-01-02T13:23:37Z") or relative (e.g. "42m" for 42 minutes)
-n, --tail string    Number of lines to show from the end of the logs (default "all")
-t, --timestamps     Show timestamps
    --until string   Show logs before a timestamp (e.g. "2013-01-02T13:23:37Z") or relative (e.g. "42m" for 42 minutes)

In some rare cases, when there is a container issue (everything else is correct, worked before, etc.), restarting the docker service can sometimes solve the issue.

So, what is different if you have only used Zabbix installed from packages?  The examples below illustrate the differences in configuration options based on different Zabbix deployment methods: a) package-based/compiled installation, b) docker run command, and c) docker compose file example. First of all, you will have to specify environment variables in the docker run command or docker compose file. The list of available environment variables for each docker image is available in both docker hub and Github.

A). Package-based config

# vi /etc/zabbix/zabbix_server.conf
...
DBName=zabbix
DBUser=zabbix_usr
DBPassword=zabbix_pwd
...

B).Docker run config

docker run --name zbxsrv -t \
...
-e MYSQL_DATABASE=zabbix\
-e MYSQL_USER=zabbix_usr \
-e MYSQL_PASSWORD=zabbix_pwd\
...

C). Docker compose config

# vi /../...yaml
...
  environment:
   MYSQL_DATABASE=zabbix
   MYSQL_USER=zabbix_usr
   MYSQL_PASSWORD=zabbix_pwd

The environment variables are represented as key-value pairs, e.g., VAR=VAL. The values can optionally be unquoted or double-quoted. If some environment variable value contains special characters, you will need to escape them. To properly escape them, check out the docker documentation page.

You can create custom, user-defined networks to connect multiple containers to the same network. On such networks, containers can resolve each other by name or alias. If needed, you can assign a specific IP address to a container (if the address is already used, you will get an error).

# docker network create --subnet 172.20.0.0/16 --ip-range 172.20.240.0/20 zabbix-net

Docker run

In this section, we have an example of docker run commands for two Zabbix components: Zabbix proxy and Java gateway. When using custom, user-defined networks, you can use container names for communication between containers instead of using IP addresses. Here, instead of defining the IP address for Zabbix Java gateway, the container name is used. You can set a static IP address for your container or let docker do it for you, but confirm if the change of the IP address will not cause issues in case your container gets a different IP address. This can become an issue if you use an IP address in some configuration fields instead of a container name.

A lot of parameters are specified using environment variables with the option -e. Also, 3 different ports are exposed on your host machine. To keep the SQLite3 database file upon container deletion, the container directory containing database file is mounted to host directory (the proxy DB is usually used as a buffer storage before sending data to Zabbix server and usually is not used to store data beyond the moment when the data is sent).

docker run --name zabbix-proxy-active-01 \
-e ZBX_HOSTNAME="Zabbix-proxy-active-01" \
-e ZBX_SERVER_HOST=46.101.140.98 \
-e ZBX_PROXYMODE="0" \
-e ZBX_JAVAGATEWAY_ENABLE=true \
-e ZBX_JAVAGATEWAY=zabbix-java-gateway-proxy \
-e ZBX_JAVAGATEWAYPORT=10052 \
-e ZBX_STARTJAVAPOLLERS=5 \
--network=zabbix-net \
-e ZBX_LISTENPORT=10101  \
-p 10101:10101 \
-p 10050:10050 \
-p 10051:10051 \
-v /var/lib/zabbix/db_data:/var/lib/zabbix/db_data \
--restart unless-stopped \
--init -d zabbix/zabbix-proxy-sqlite3:alpine-7.2.4
docker run --name zabbix-java-gateway-proxy \
--network=zabbix-net \
--restart unless-stopped \
-d zabbix/zabbix-java-gateway:alpine-7.2.4

You can start each of these Zabbix components using the docker run command, however, any change to the container configuration will require you to stop the container, delete it, and execute the docker run command again. You also have another option – you could create a docker compose file and write the necessary configuration in yaml format. When you need to add some changes to the container configuration, run the docker compose down command to remove containers, edit the docker compose file, and run docker compose up command to start them up again with the new configuration:

  • docker compose -f ./docker_compose_v3_proxy.yaml down
  • docker compose -f ./docker_compose_v3_proxy.yaml up -d

If you have not mounted volume or directory to container for the data you want to keep, you can copy the data from the container to your host. Otherwise, that data will be gone if you delete the container or use the docker compose down command. So, it is important to set up the persistent storage/volume for the data that needs retaining, so you don’t lose important data from the container when container configuration is changed. You also need to expose the ports for the necessary services for the appropriate components (if they are set up on on separate hosts): zabbix-server, zabbix-proxy, zabbix-agent/zabbix-agent2 (default ports: 10050 for Zabbix agent passive mode, 10051 for Zabbix-agent active mode, some different port for proxy, 10052 for Java gateway).

Here we have the same docker run options written to docker compose file, including the environment variables, mounted directories and exposed ports. You can specify as many services as needed and start them just with docker compose command.

docker_compose_v3_proxy.yaml

services:
  zabbix-proxy-active-01:
    image: "${PROXY_SQLITE3_IMAGE}:${ALPINE_IMAGE_TAG}"
    environment:
      ZBX_HOSTNAME: Zabbix-proxy-active-01
      ZBX_SERVER_HOST: ${ZBX_SERVER_HOST}
      ZBX_PROXYMODE: 0
      ZBX_LISTENPORT: 10101
      ZBX_JAVAGATEWAY_ENABLE: true
      ZBX_JAVAGATEWAY: zabbix-java-gateway-proxy
      ZBX_JAVAGATEWAYPORT: 10052
      ZBX_STARTJAVAPOLLERS: 5
    volumes:
      - /var/lib/zabbix/db_data:/var/lib/zabbix/db_data:rw
    networks:
      - backend
    ports:
      - 10101:10101
      - 10050:10050
      - 10051:10051
    restart: unless-stopped

  zabbix-java-gateway-proxy:
    image: "${JAVA_GW_IMAGE}:${ALPINE_IMAGE_TAG}"
    networks:
      - backend
    restart: unless-stopped

networks:
  backend:
    name: zabbix-net
    external: true

.env

PROXY_SQLITE3_IMAGE=zabbix/zabbix-proxy-sqlite3
JAVA_GW_IMAGE = zabbix/zabbix-java-gateway
ALPINE_IMAGE_TAG=alpine-7.2.4
ZBX_SERVER_HOST=46.101.140.98

You can also use official Zabbix-supplied docker compose files, try them out, and modify them as needed.

You can read more about the official docker compose files here.

Containerized Zabbix components allow us to use test different scenarios within the docker:

  • Creating HA Zabbix-server nodes
  • Creating multiple proxies
  • Creating multiple agents
  • Adding more Java gateways
  • Creating multiple frontends
  • Easily configure Browser monitoring
  • Configure SNMP traps
  • Easily make scheduled reports

Deploying multiple redundant Zabbix servers

To enable HA Zabbix server mode, modify both the Zabbix-server container and Zabbix-frontend container configuration environment variables.

For the HA Zabbix server mode, add 2 environment variables:

  • ZBX_HANODENAME
  • ZBX_NODEADDRESS

All of the containers are set with the user-defined network, therefore I will use the container name in the ZBX_HANODENAME option instead of the static address, as it will be resolved by docker. If you need to use a different listen port for the trapper, you need to define it using the environment variable ZBX_LISTENPORT. You can omit the port in variable ZBX_HANODENAME, as the ZBX_LISTENPORT (default is 10051) will be applied automatically.

Here is the docker run example for the Zabbix-server HA mode.

docker run --name zabbix-server-mysql-ha1 -t \
-e DB_SERVER_HOST="mysql-server" \
-e MYSQL_DATABASE="zabbix" \
-e MYSQL_USER="zabbix" \
-e MYSQL_PASSWORD="zabbix_pwd" \
-e MYSQL_ROOT_PASSWORD="root_pwd" \
-e ZBX_HANODENAME="zabbix-server-HA1" \
-e ZBX_NODEADDRESS="zabbix-server-mysql-ha1" \
--network=zabbix-net \
-p 10151:10051 \
--restart unless-stopped \
-d zabbix/zabbix-server-mysql:alpine-7.2.4
docker run --name zabbix-server-mysql-ha2 -t \
-e DB_SERVER_HOST="mysql-server" \
-e MYSQL_DATABASE="zabbix" \
-e MYSQL_USER="zabbix" \
-e MYSQL_PASSWORD="zabbix_pwd" \
-e MYSQL_ROOT_PASSWORD="root_pwd" \
-e ZBX_HANODENAME="zabbix-server-HA2" \
-e ZBX_NODEADDRESS="zabbix-server-mysql-ha2" \
--network=zabbix-net \
-p 10251:10051 \
--restart unless-stopped \
-d zabbix/zabbix-server-mysql:alpine-7.2.4

From the frontend container, remove these two environment variables:

  • ZBX_SERVER_HOST
  • ZBX_SERVER_PORT
docker run --name zabbix-web-nginx-mysql -t \
-e ZBX_SERVER_HOST="zabbix-server-mysql" \
-e ZBX_SERVER_PORT=10051
-e DB_SERVER_HOST="mysql-server" \
-e MYSQL_DATABASE="zabbix" \
-e MYSQL_USER="zabbix" \
-e MYSQL_PASSWORD="zabbix_pwd" \
-e MYSQL_ROOT_PASSWORD="root_pwd" \
--network=zabbix-net \
-p 80:8080 \
--restart unless-stopped \
-d zabbix/zabbix-web-nginx-mysql:alpine-7.2.4

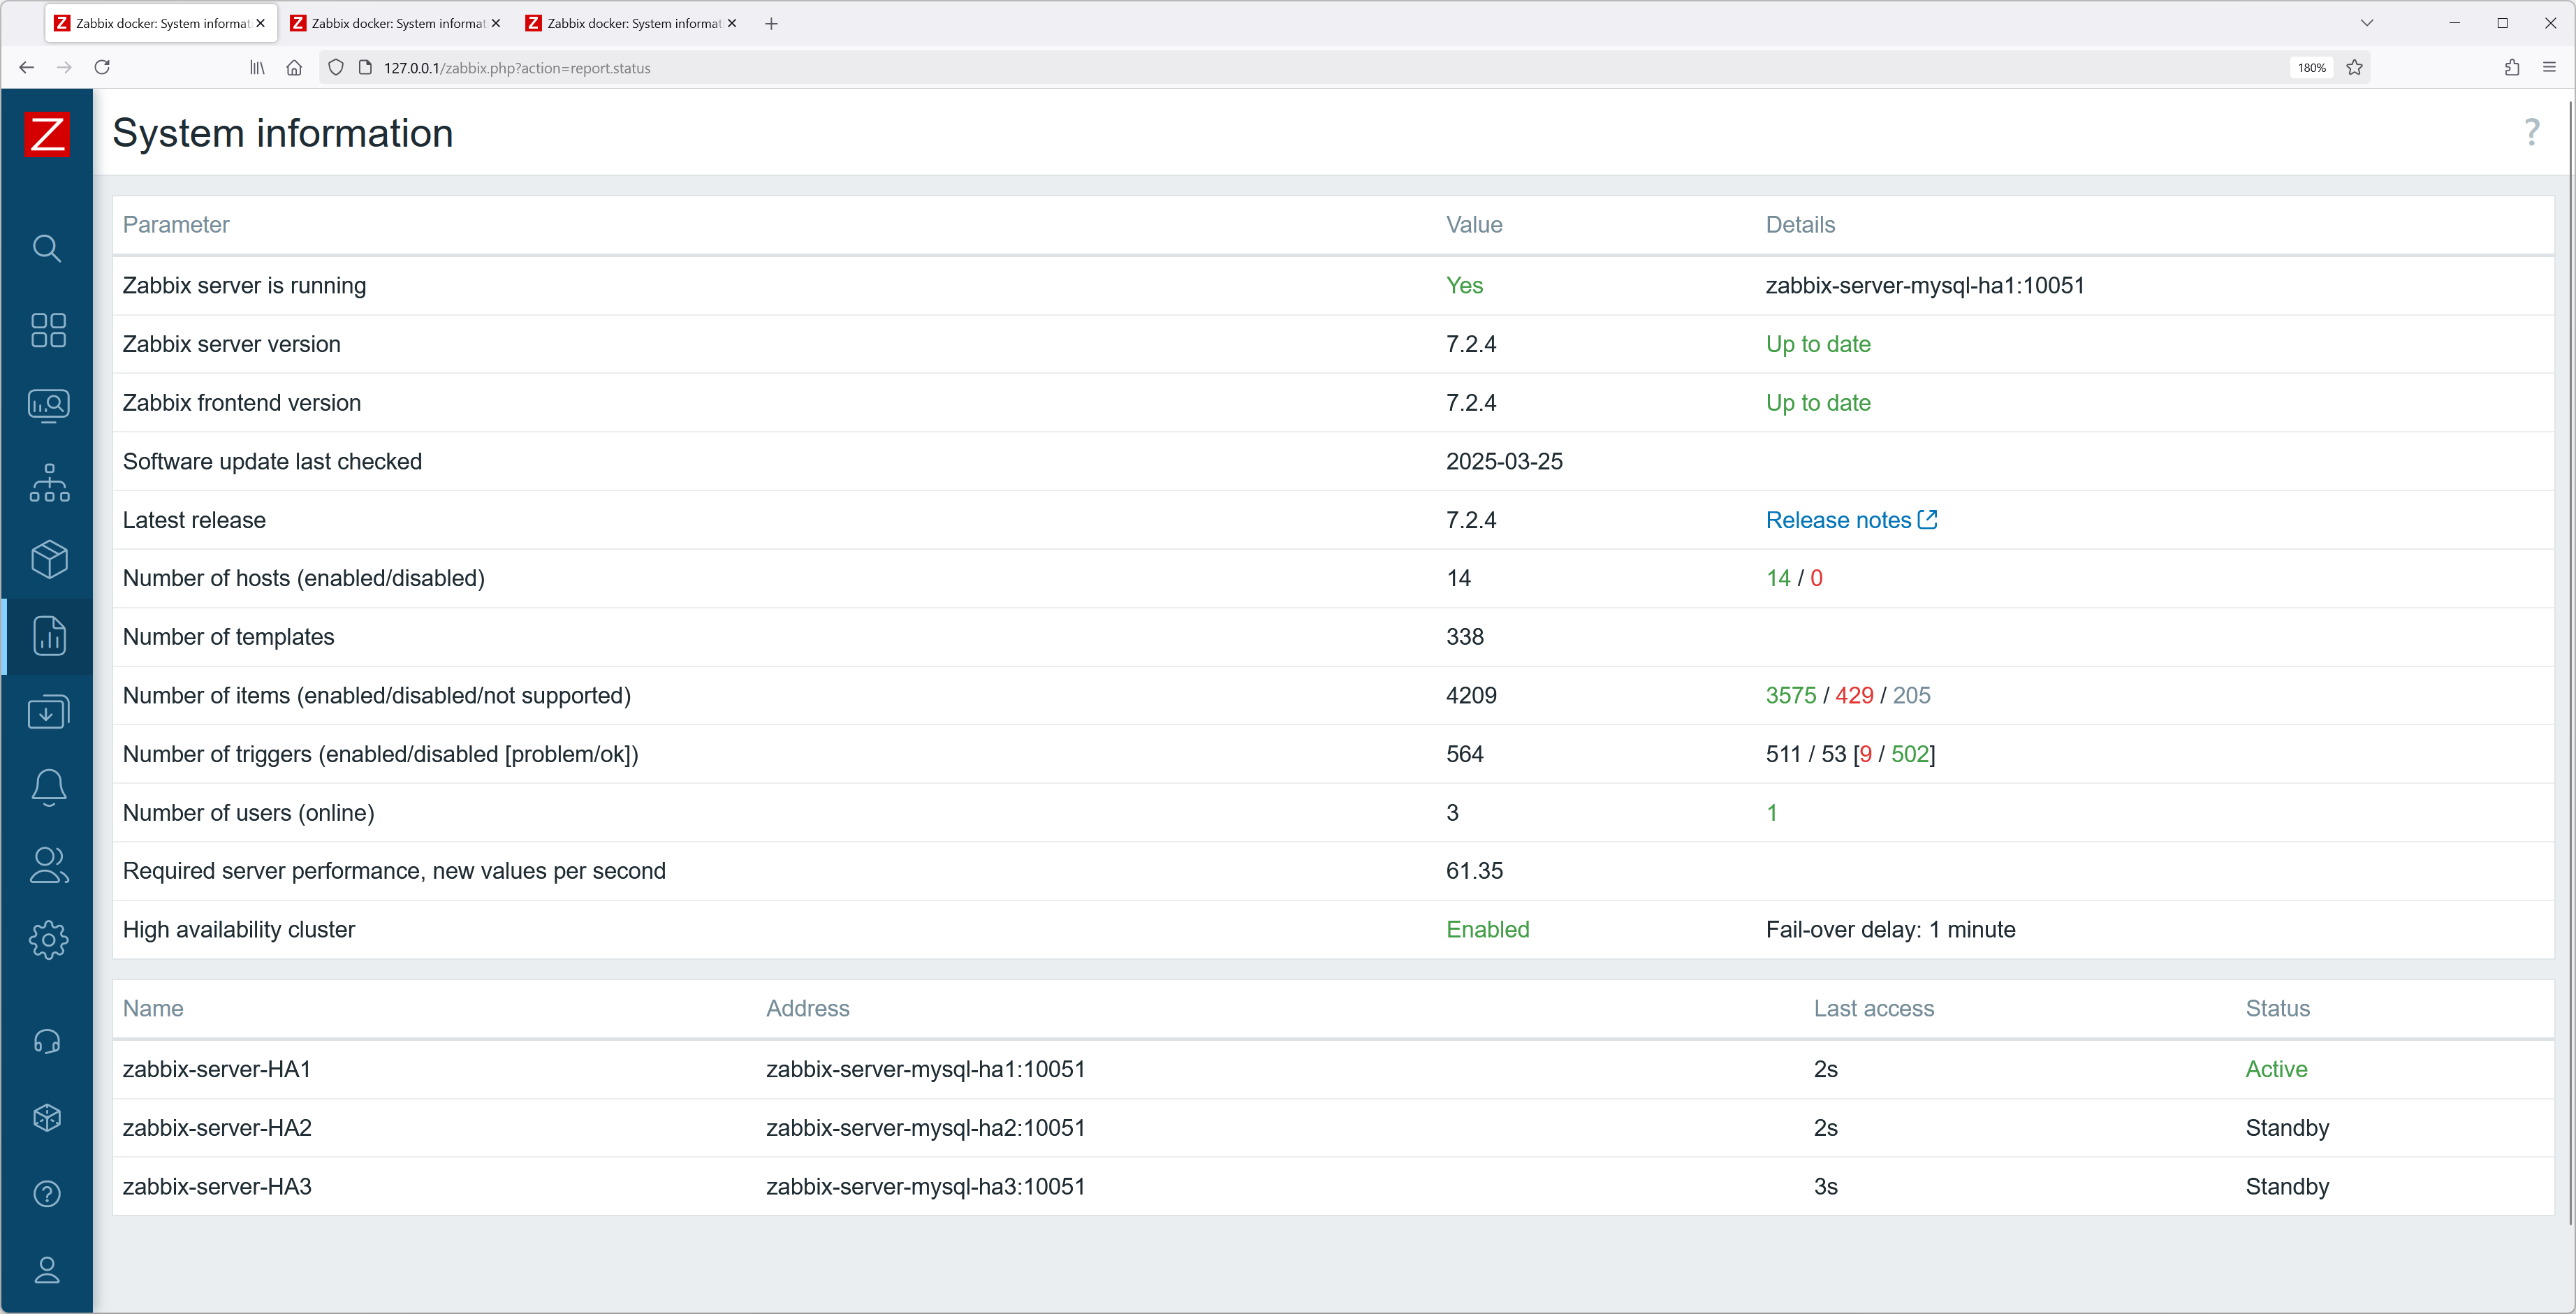
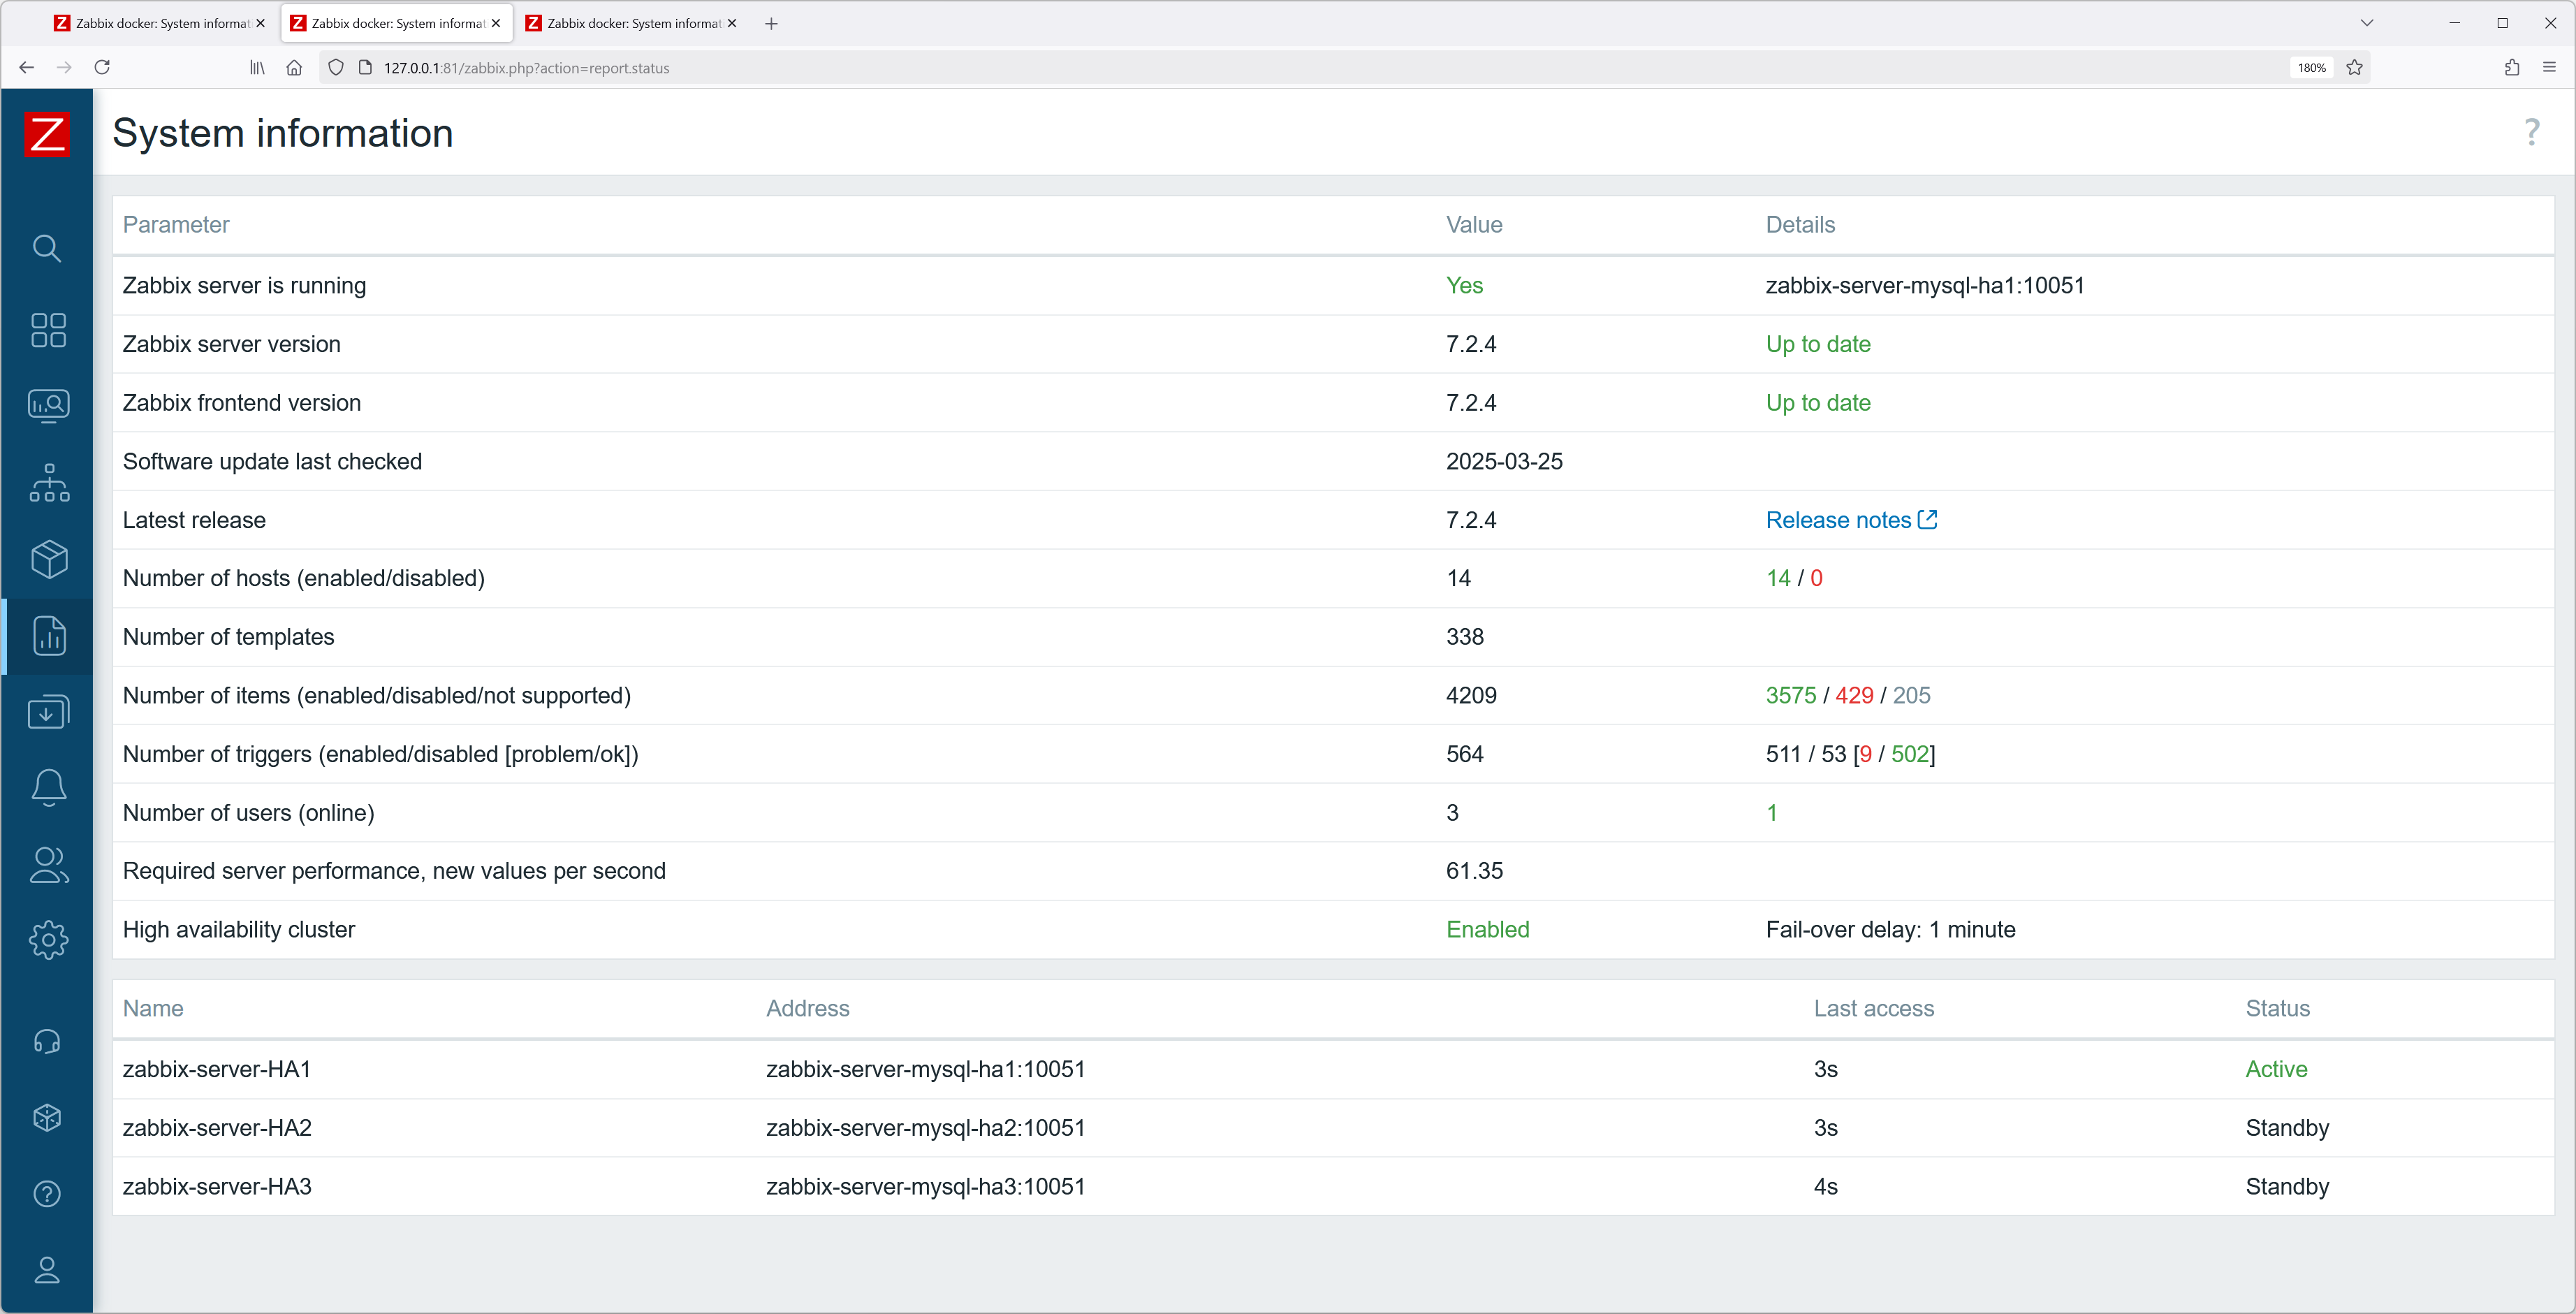
Once both container configurations are modified, you should be able to see the currently added HA server nodes and their states without issues.

Fig. 1. Containers of HA Zabbix server containers

Fig. 2. Dashboard – system information

You can also execute commands on the container:

# docker exec -it container_name_or_id sh -c "zabbix_server -R ha_status"

Fig. 3. Executing command on container

Containers of HA Zabbix server containers

I’t’s possible to allocate an interactive pseudo-TTY shell, by adding option -ti and specifying shell after the container name or id.

# docker exec -ti container_name_or_id /bin/bash

Fig. 4. Executing command from within container

You can also start multiple proxies at once in docker. This can help to offload preprocessing to the proxy, gather data from the targets behind the firewall, and send collected data back to the Zabbix server, only requiring one port.

Fig. 5.Overall block diagram of Zabbix monitoring opportunities

Deploying multiple Zabbix proxies

First, you must choose the proxy mode and set the environment variable ZBX_PROXYMODE.

For active mode proxy, please define the server host address for a single server or addresses separated by a semicolon in the case of HA Zabbix server configuration (example shown below).

docker run --name zabbix-proxy-active-01 \
-e ZBX_HOSTNAME="Zabbix-proxy-active-01" \
-e ZBX_SERVER_HOST="zabbix-server-mysql-ha1;zabbix-server-mysql-ha2;zabbix-server-mysql-ha3" \
-e ZBX_PROXYMODE="0" \
--network=zabbix-net \
-e ZBX_LISTENPORT=10101  \
-p 10101:10101 \
-v /var/lib/zabbix/db_data:/var/lib/zabbix/db_data \
--restart unless-stopped \
--init -d zabbix/zabbix-proxy-sqlite3:alpine-7.2.4

For passive mode proxy, define the server host address for a single server or addresses separated by a comma in the case of HA Zabbix server configuration (example shown below).

docker run --name zabbix-proxy-passive-01 \
-e ZBX_HOSTNAME="Zabbix-proxy-passive-01" \
-e ZBX_SERVER_HOST="zabbix-server-mysql-ha1,zabbix-server-mysql-ha2,zabbix-server-mysql-ha3" \
-e ZBX_PROXYMODE="1" \
--network=zabbix-net \
-e ZBX_LISTENPORT=10102 \
-p 10102:10102 \
-v /var/lib/zabbix/db_data:/var/lib/zabbix/db_data \
--restart unless-stopped \
--init -d zabbix/zabbix-proxy-sqlite3:alpine-7.2.4

docker_compose_v3_proxies.yaml

services:
  zabbix-proxy-active-01:
    image: "${PROXY_SQLITE3_IMAGE}:${ALPINE_IMAGE_TAG}"
    environment:
      ZBX_HOSTNAME: zabbix-proxy-active-01
      ZBX_SERVER_HOST: zabbix-server-mysql-ha1;zabbix-server-mysql-ha2;zabbix-server-mysql-ha3
      ZBX_PROXYMODE: 0
      ZBX_LISTENPORT: 10101
    volumes:
      - /var/lib/zabbix/db_data:/var/lib/zabbix/db_data:rw
    networks:
      - backend
    ports:
      - 10101:10101
    restart: unless-stopped

  zabbix-proxy-passive-01:
    image: "${PROXY_SQLITE3_IMAGE}:${ALPINE_IMAGE_TAG}"
    environment:
      ZBX_HOSTNAME: zabbix-proxy-passive-01
      ZBX_SERVER_HOST: zabbix-server-mysql-ha1,zabbix-server-mysql-ha2,zabbix-server-mysql-ha3
      ZBX_PROXYMODE: 1
      ZBX_LISTENPORT: 10102
    volumes:
      - /var/lib/zabbix/db_data:/var/lib/zabbix/db_data:rw
    networks:
      - backend
    ports:
      - 10102:10102
    restart: unless-stopped
networks:
  backend:
    name: zabbix-net
    external: true

.env

PROXY_SQLITE3_IMAGE=zabbix/zabbix-proxy-sqlite3
JAVA_GW_IMAGE = zabbix/zabbix-java-gateway
ALPINE_IMAGE_TAG=alpine-7.2.4
ZBX_SERVER_HOST=46.101.140.98

The proxy name in the frontend must be the same as the value set in proxy environment variable ZBX_HOSTNAME! Also, in frontend for active proxies, you don’t need to add the proxy address.

Next, you can set hosts to be monitored by Zabbix-proxies, but make sure to update the agent configuration, so agents accept connections from proxy.

Fig. 6. Hosts monitored by proxy

Fig. 7.List of proxies and hosts monitored by them

Configuring Proxy groups

You can create as many proxy containers as necessary in Docker, and you can also create proxy groups for load balancing (it is based on the number of hosts per proxy).

First, create a proxy group in the frontend:

  • Set proxy group name
  • Select failover period
  • Minimum number of proxies

Fig. 8.Creating a new proxy group

Next, add proxies to the proxy group, and specify the address for active agents and port for the active agents.

Fig. 9. Adding proxy to proxy group

Do not forget to change Zabbix agent configuration for hosts now monitored through the proxy group (add proxy groups IPs/DNS to Server and ServerActive options).

Fig. 10. Creating a new host and monitoring it through proxy group

You can see additional information regarding the proxies in the Frontend section: Administration/ Proxies.

Fig. 11. List of all configured proxies and those belonging to proxy group

Adding more Java gateways

Zabbix server or proxy can communicate with only one Zabbix java gateway, however, you are not limited tin how many Zabbix proxies you create together with Zabbix Java Gateway. You can make an unlimited number of pairs, consisting of Zabbix proxy with Zabbix Java Gateway.

For the containerized Zabbix server, you will need to add these 4 environment variables:

ZBX_JAVAGATEWAY_ENABLE=true
ZBX_JAVAGATEWAY=zabbix-java-gateway-server
ZBX_JAVAGATEWAYPORT=10052
ZBX_STARTJAVAPOLLERS=5

And start the Java gateway for the zabbix-server in docker:

docker run --name zabbix-java-gateway-server -t \
--network=zabbix-net \
--restart unless-stopped \
-d zabbix/zabbix-java-gateway:alpine-7.2.4

Or if you want to add java gateway to the Zabbix proxy, then add these 4 environment variables to Zabbix proxy in docker:

ZBX_JAVAGATEWAY_ENABLE=true
ZBX_JAVAGATEWAY=zabbix-java-gateway-proxy
ZBX_JAVAGATEWAYPORT=10052
ZBX_STARTJAVAPOLLERS=5

And start the java gateway as a container:

docker run --name zabbix-java-gateway-proxy -t \
--network=zabbix-net \
--restart unless-stopped \
-d zabbix/zabbix-java-gateway:alpine-7.2.4

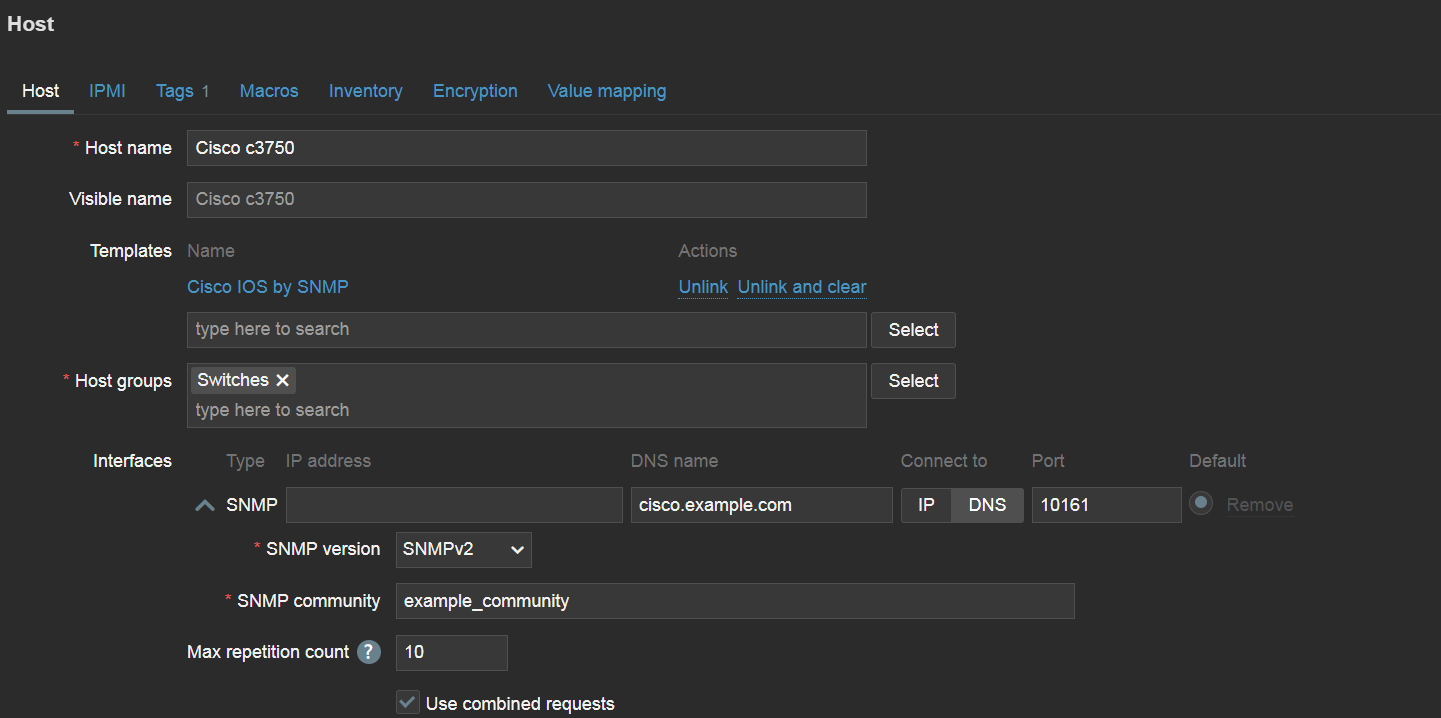
And here we have a host, monitored by zabbix-agent2 through zabbix-proxy-active-02

Fig. 12. Host monitored by proxy with configured Java gateway

Upgrading docker proxies with SQLite3 database

If you have older Zabbix components already running in docker and you have upgraded the server, you will also need to upgrade the proxies.

If you have a container created from the proxy zabbix-proxy-sqlite3 image and want to upgrade it, you will lose the existing data stored in the SQLite3 database. For most users, the database functions as a buffer to temporarily keep the data until it’s sent to Zabbix server and the loss of the proxy database file data is of no consequence.

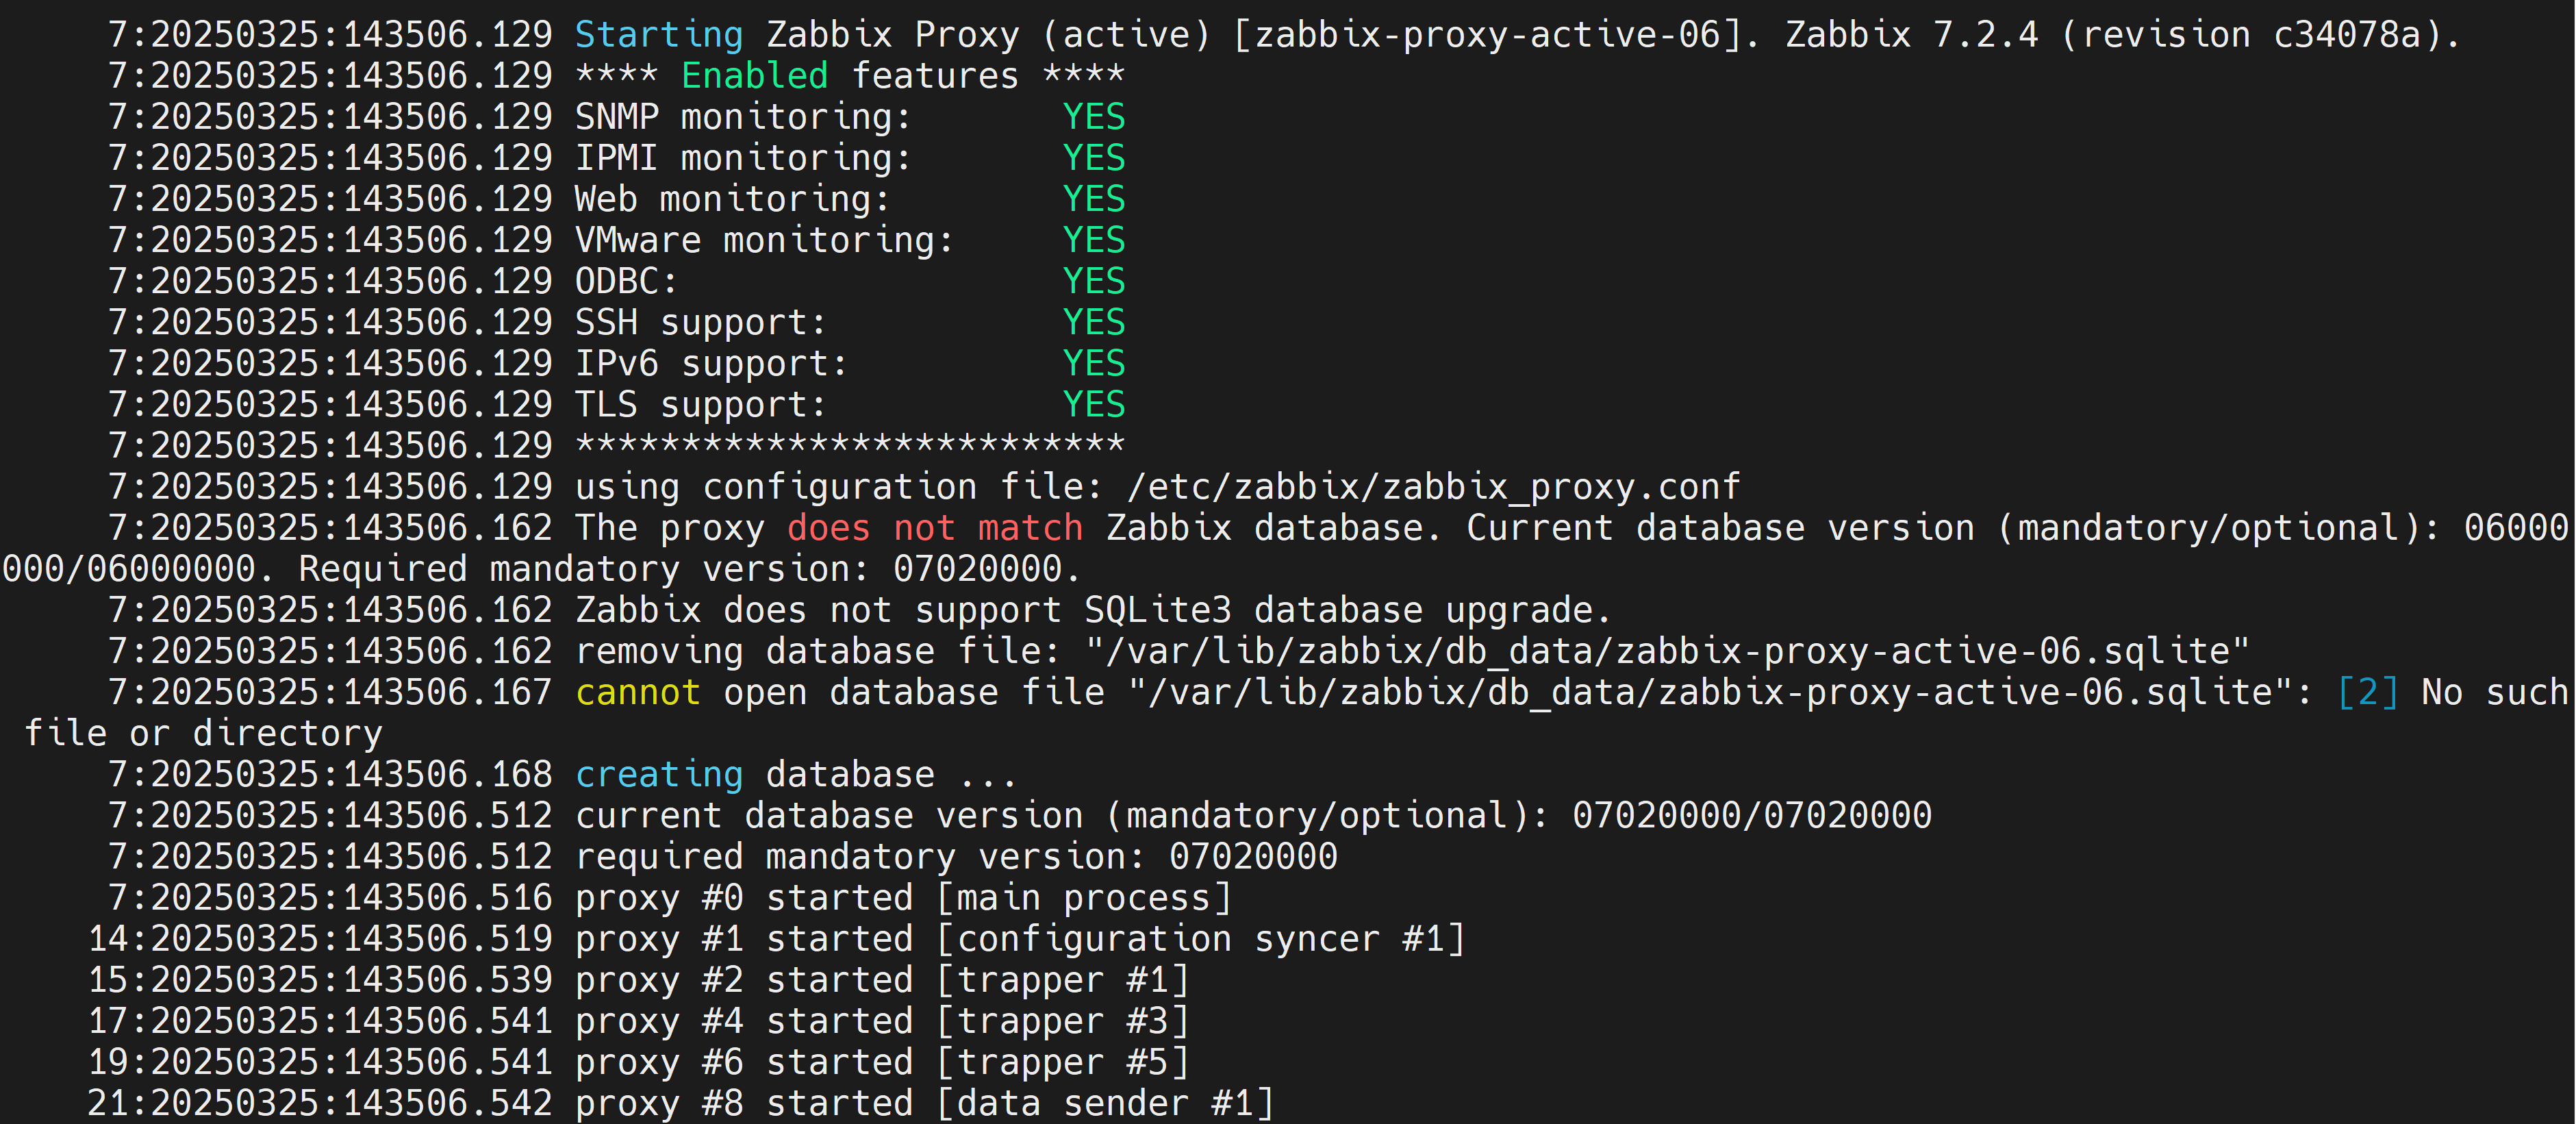
Once you have updated the image for the container, the proxy will detect the existing old database version on startup. If the directory is mounted to database file, it will delete the database file and create a new one. This will impact those who keep data after sending it to Zabbix server and use the data from the proxy database for other purposes.

Fig. 13. Database upgrade for proxy container with SQLite3 database

Upgrading docker proxies with MySQL database

To upgrade the MySQL database for proxy, log in in the MySQL database, set the log_bin_trust_function_creators flag to 1. Change the proxy image version to a newer one and start the container.

mysql> set global log_bin_trust_function_creators = 1;

If you have not set the flag, you will receive an error of database upgrade.

Fig. 14. Failed database upgrade for proxy with MySQL database

Replace the previous version of the proxy image with the new one, check the log file, and check the docker logs to see when the database schema upgrade has finished. After the upgrade, set the flag back to 0.

mysql> set global log_bin_trust_function_creators = 0;

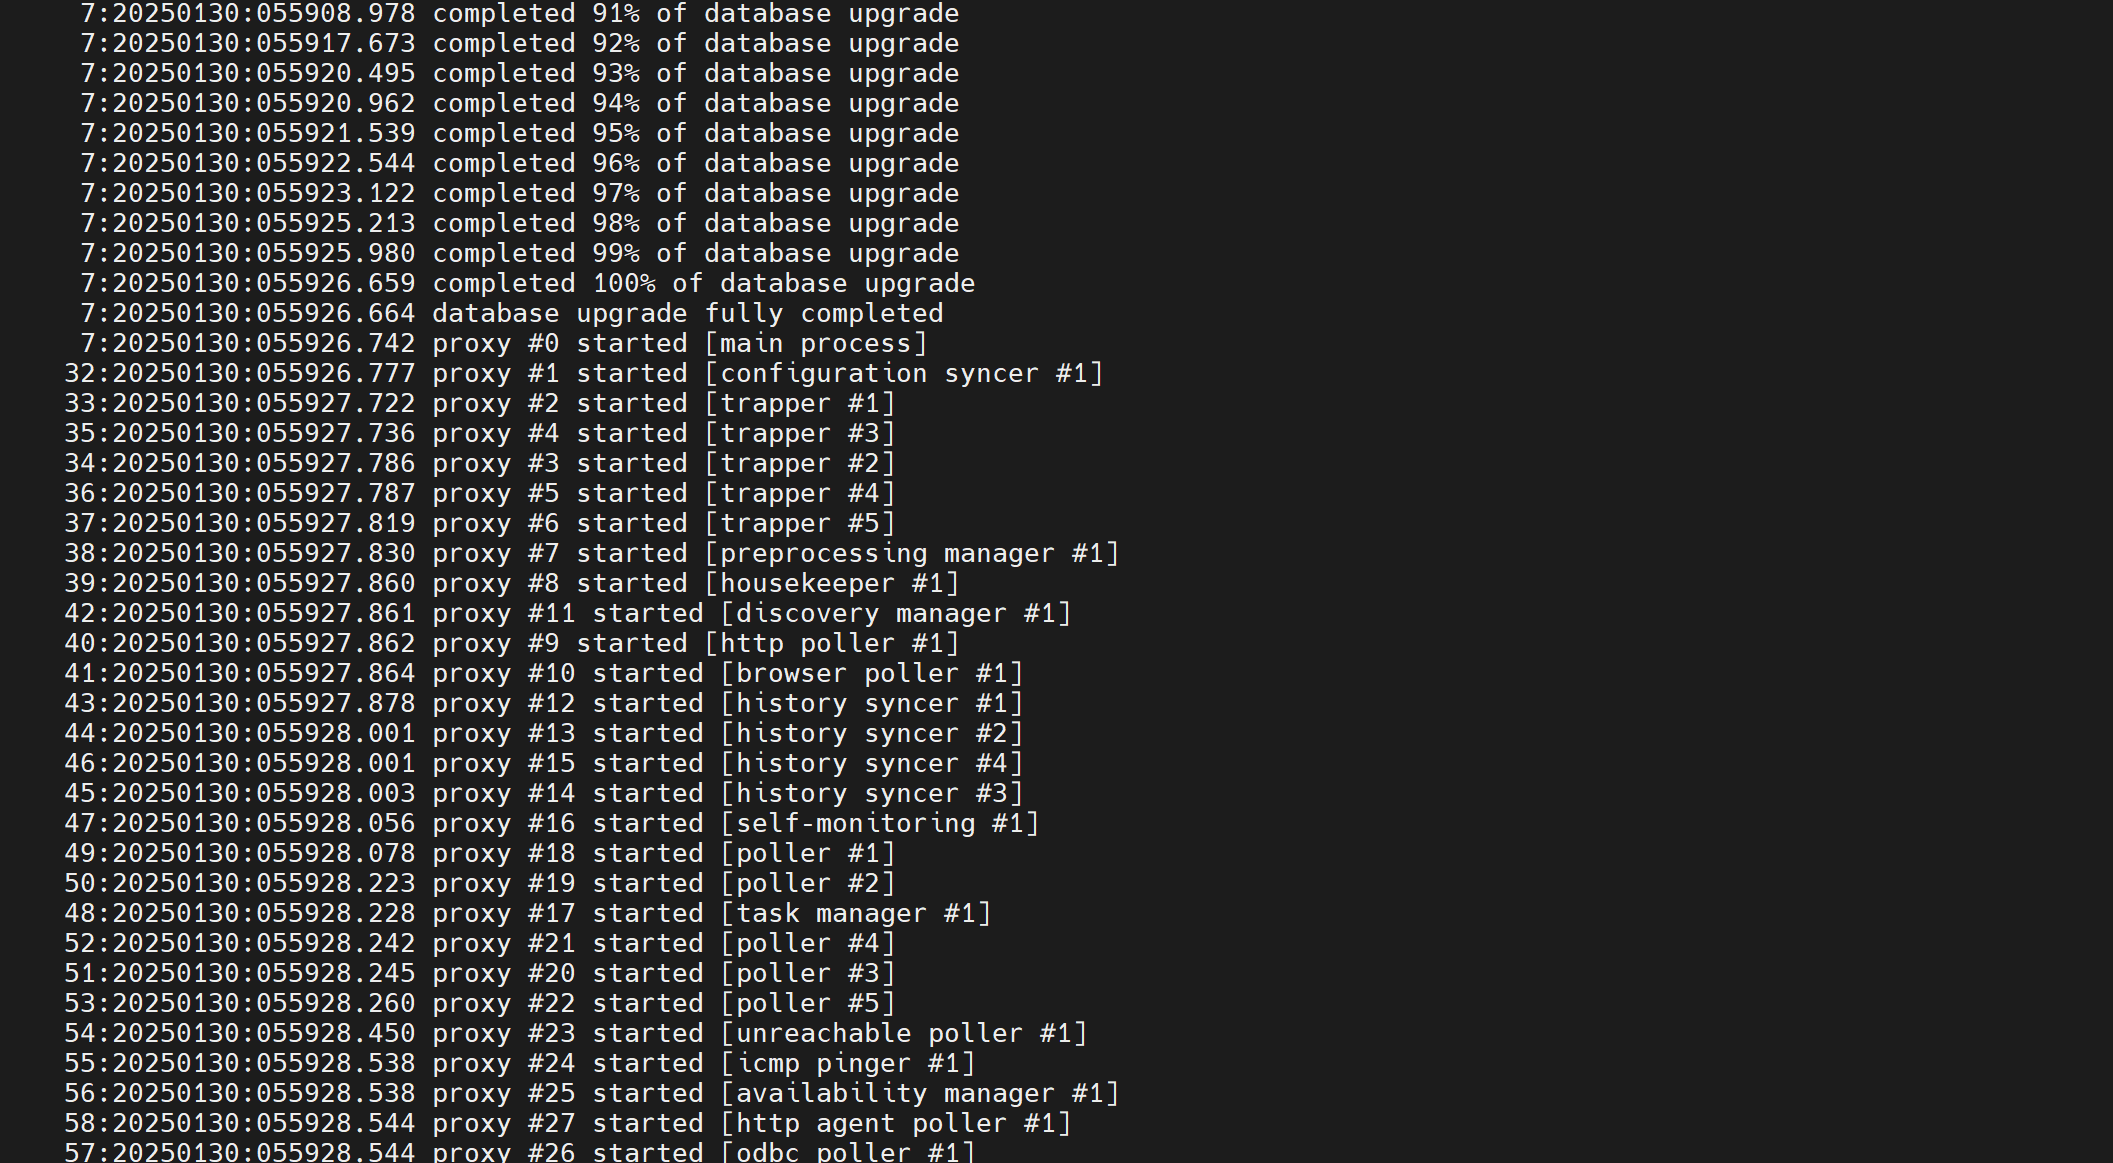
The upgrade has been successful, and the proxy service has started after that.

Fig. 15. Successful database upgrade for proxy with MySQL database

An official docker image for the proxy with Postgresql database support is not available due to the extensive number of existing images and different versions.

Deploying multiple frontends

You can launch as many frontends as you need if you are experiencing a sudden surge in Zabbix users. Just specify which port to assign for it and you are good to go (don’t forget to also open the port in the firewall).

docker run --name zabbix-web-nginx-mysql1 -t \
-e DB_SERVER_HOST="mysql-server" \
-e MYSQL_DATABASE="zabbix" \
-e MYSQL_USER="zabbix" \
-e MYSQL_PASSWORD="zabbix_pwd" \
-e MYSQL_ROOT_PASSWORD="root_pwd" \
--network=zabbix-net \
-p 80:8080 \
--restart unless-stopped \
-d zabbix/zabbix-web-nginx-mysql:alpine-7.2.4

Fig. 16. One started Zabbix frontend container in docker

docker run --name zabbix-web-nginx-mysql2 -t \
-e DB_SERVER_HOST="mysql-server" \
-e MYSQL_DATABASE="zabbix" \
-e MYSQL_USER="zabbix" \
-e MYSQL_PASSWORD="zabbix_pwd" \
-e MYSQL_ROOT_PASSWORD="root_pwd" \
--network=zabbix-net \
-p 81:8080 \
--restart unless-stopped \
-d zabbix/zabbix-web-nginx-mysql:alpine-7.2.4

Fig. 17. Two started Zabbix frontend containers in docker

docker run --name zabbix-web-nginx-mysql3 -t \
-e DB_SERVER_HOST="mysql-server" \
-e MYSQL_DATABASE="zabbix" \
-e MYSQL_USER="zabbix" \
-e MYSQL_PASSWORD="zabbix_pwd" \
-e MYSQL_ROOT_PASSWORD="root_pwd" \
--network=zabbix-net \
-p 82:8080 \
--restart unless-stopped \
-d zabbix/zabbix-web-nginx-mysql:alpine-7.2.4

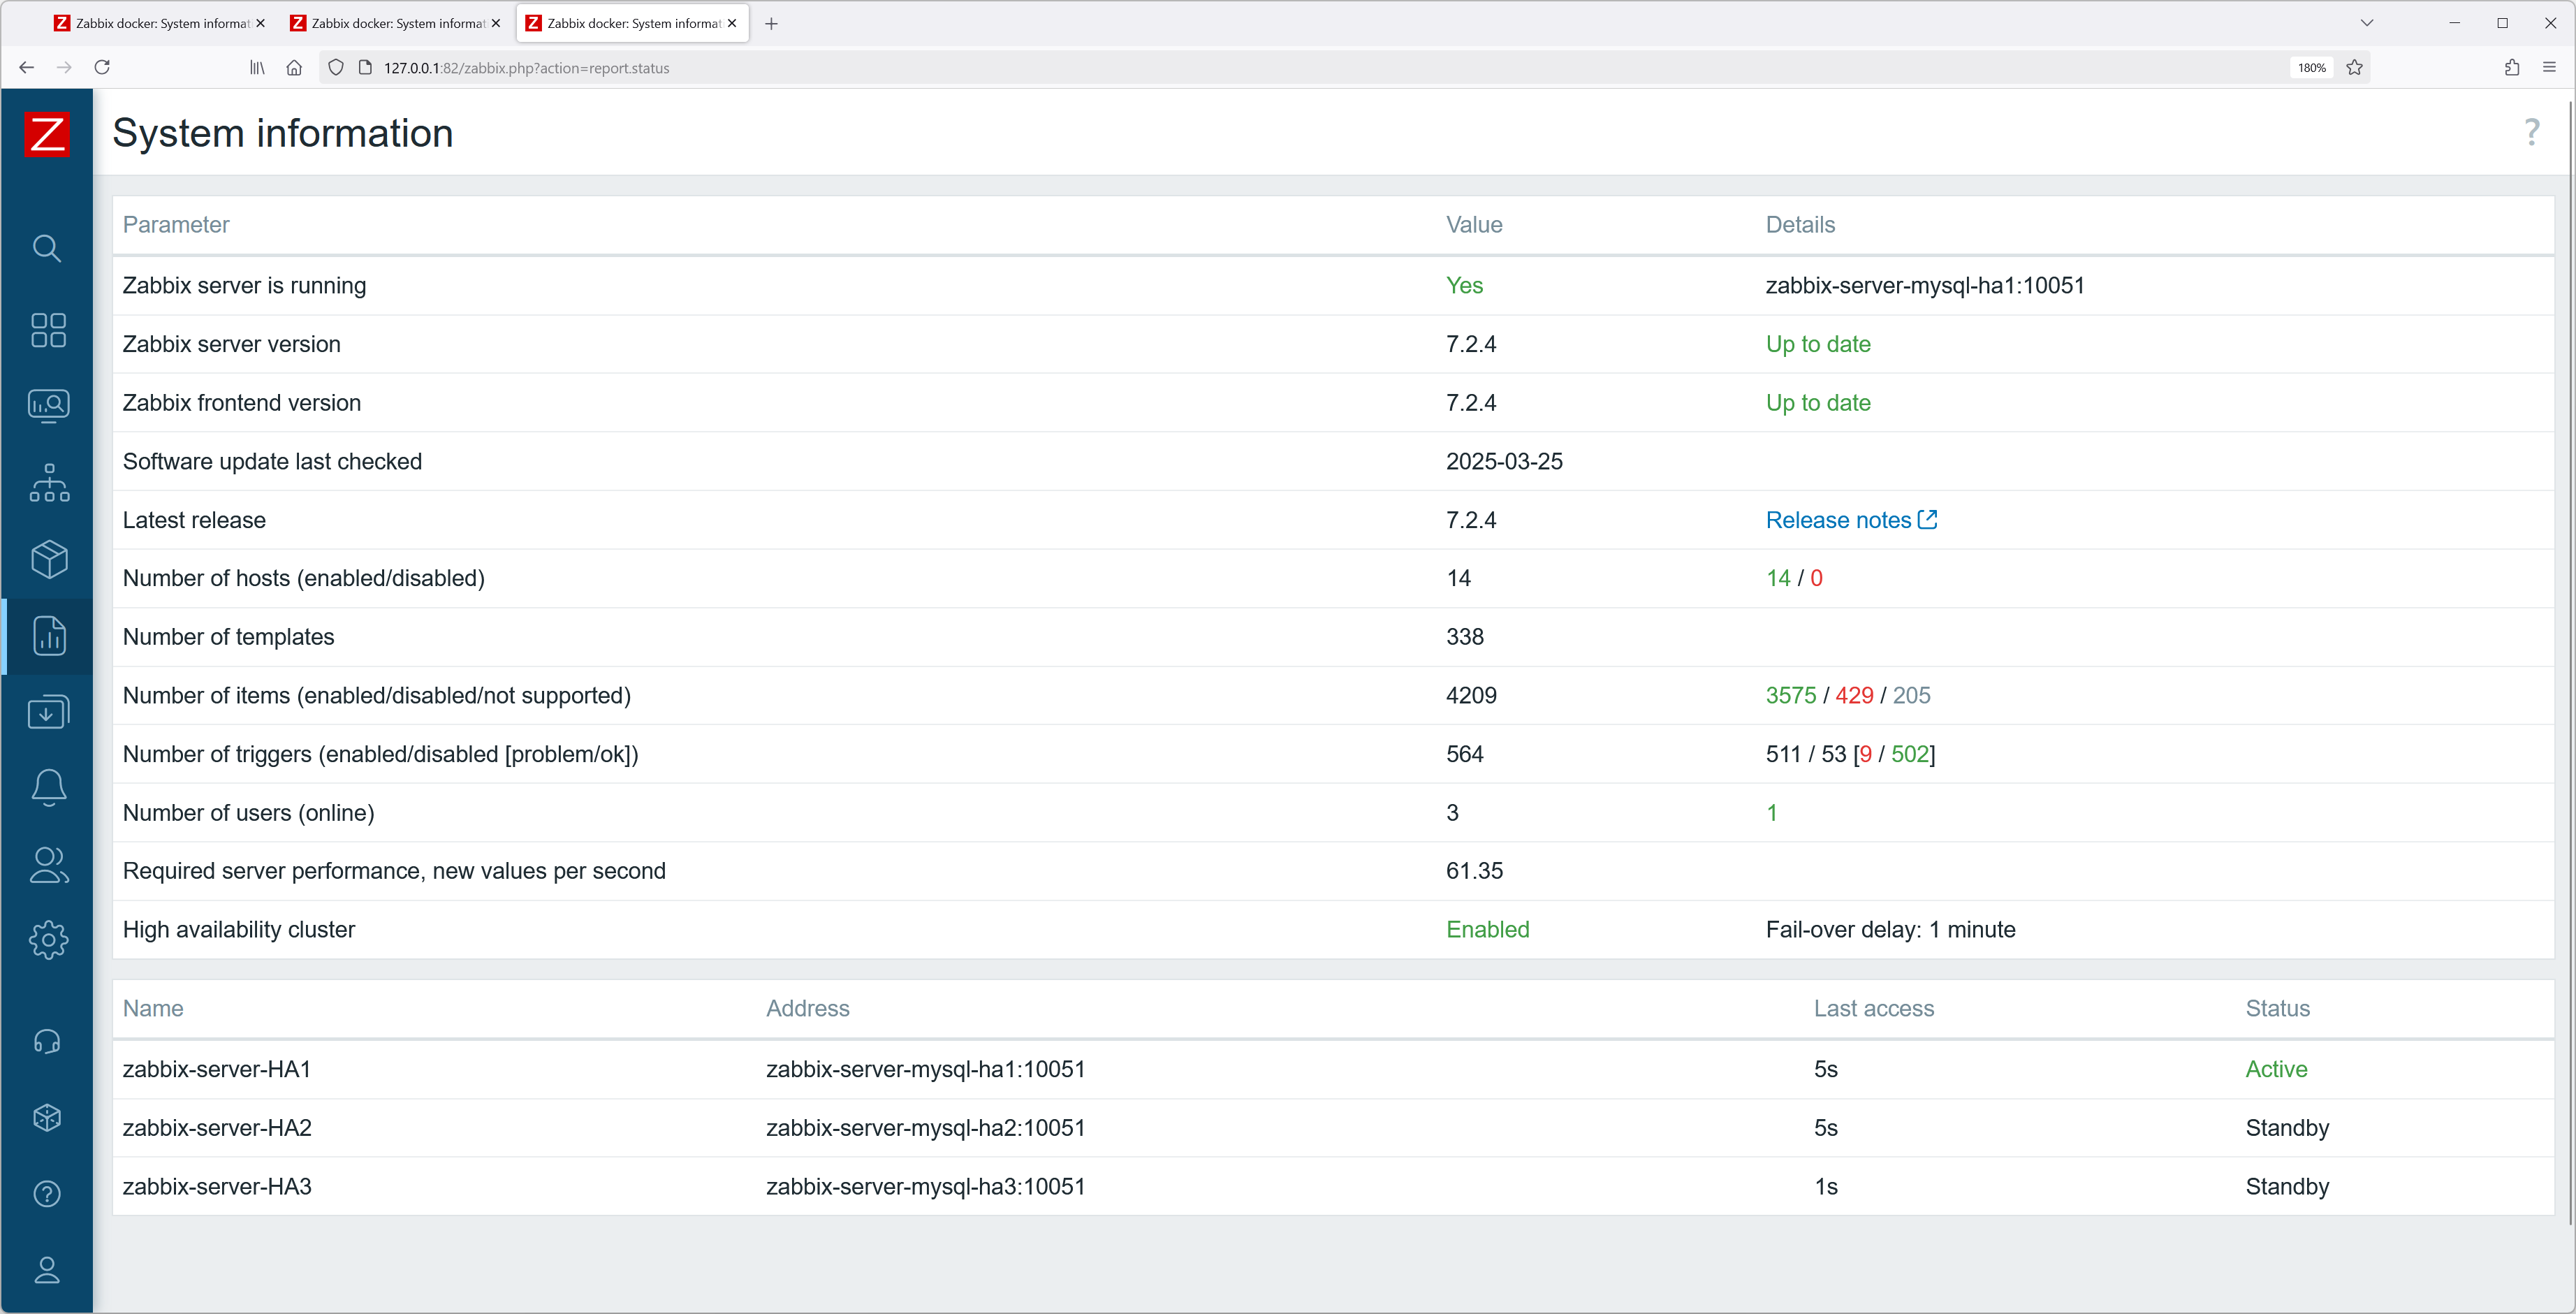
Fig. 18. Three started Zabbix frontend containers in docker

Fig. 19. Multiple frontends accessed through different ports

Browser monitoring

Browser monitoring setup has never been easier! Just add two parameters to zabbix-server container config:

ZBX_WEBDRIVERURL=selenium:4444
ZBX_STARTBROWSERPOLLERS=2

And start the web driver in the docker (with a standalone chrome browser):

docker run --name selenium -t\
--network=zabbix-net \
--restart unless-stopped \
-p 4444:4444 \
--shm-size="1g" \
-d selenium/standalone-chrome:latest

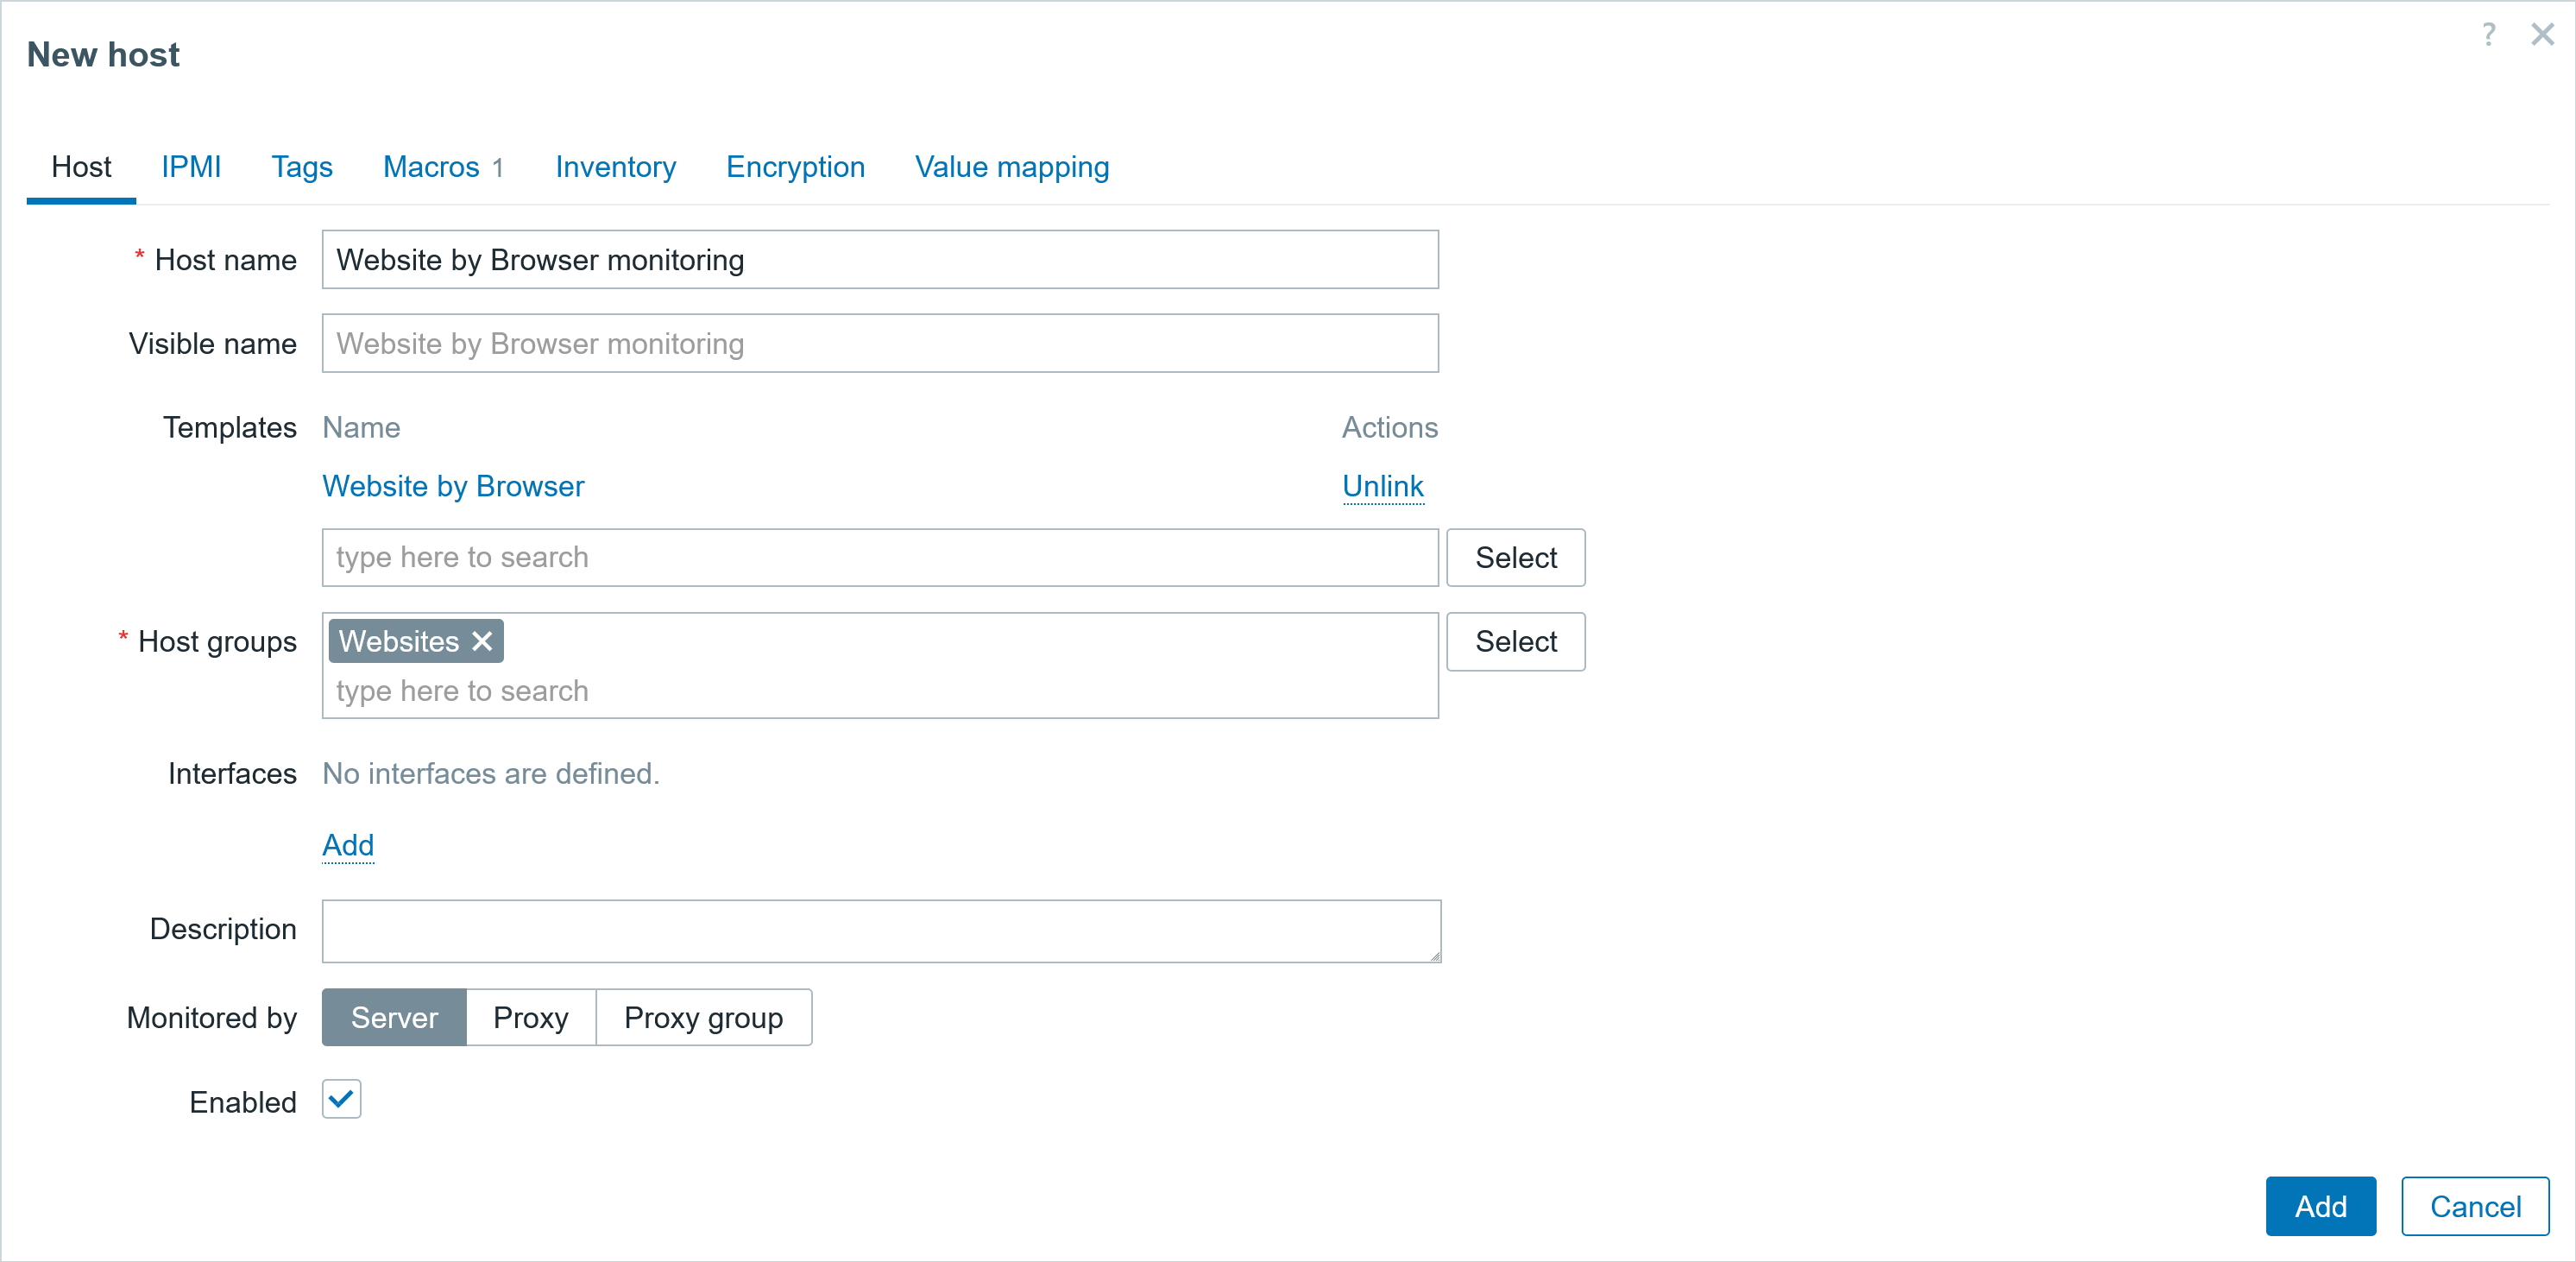
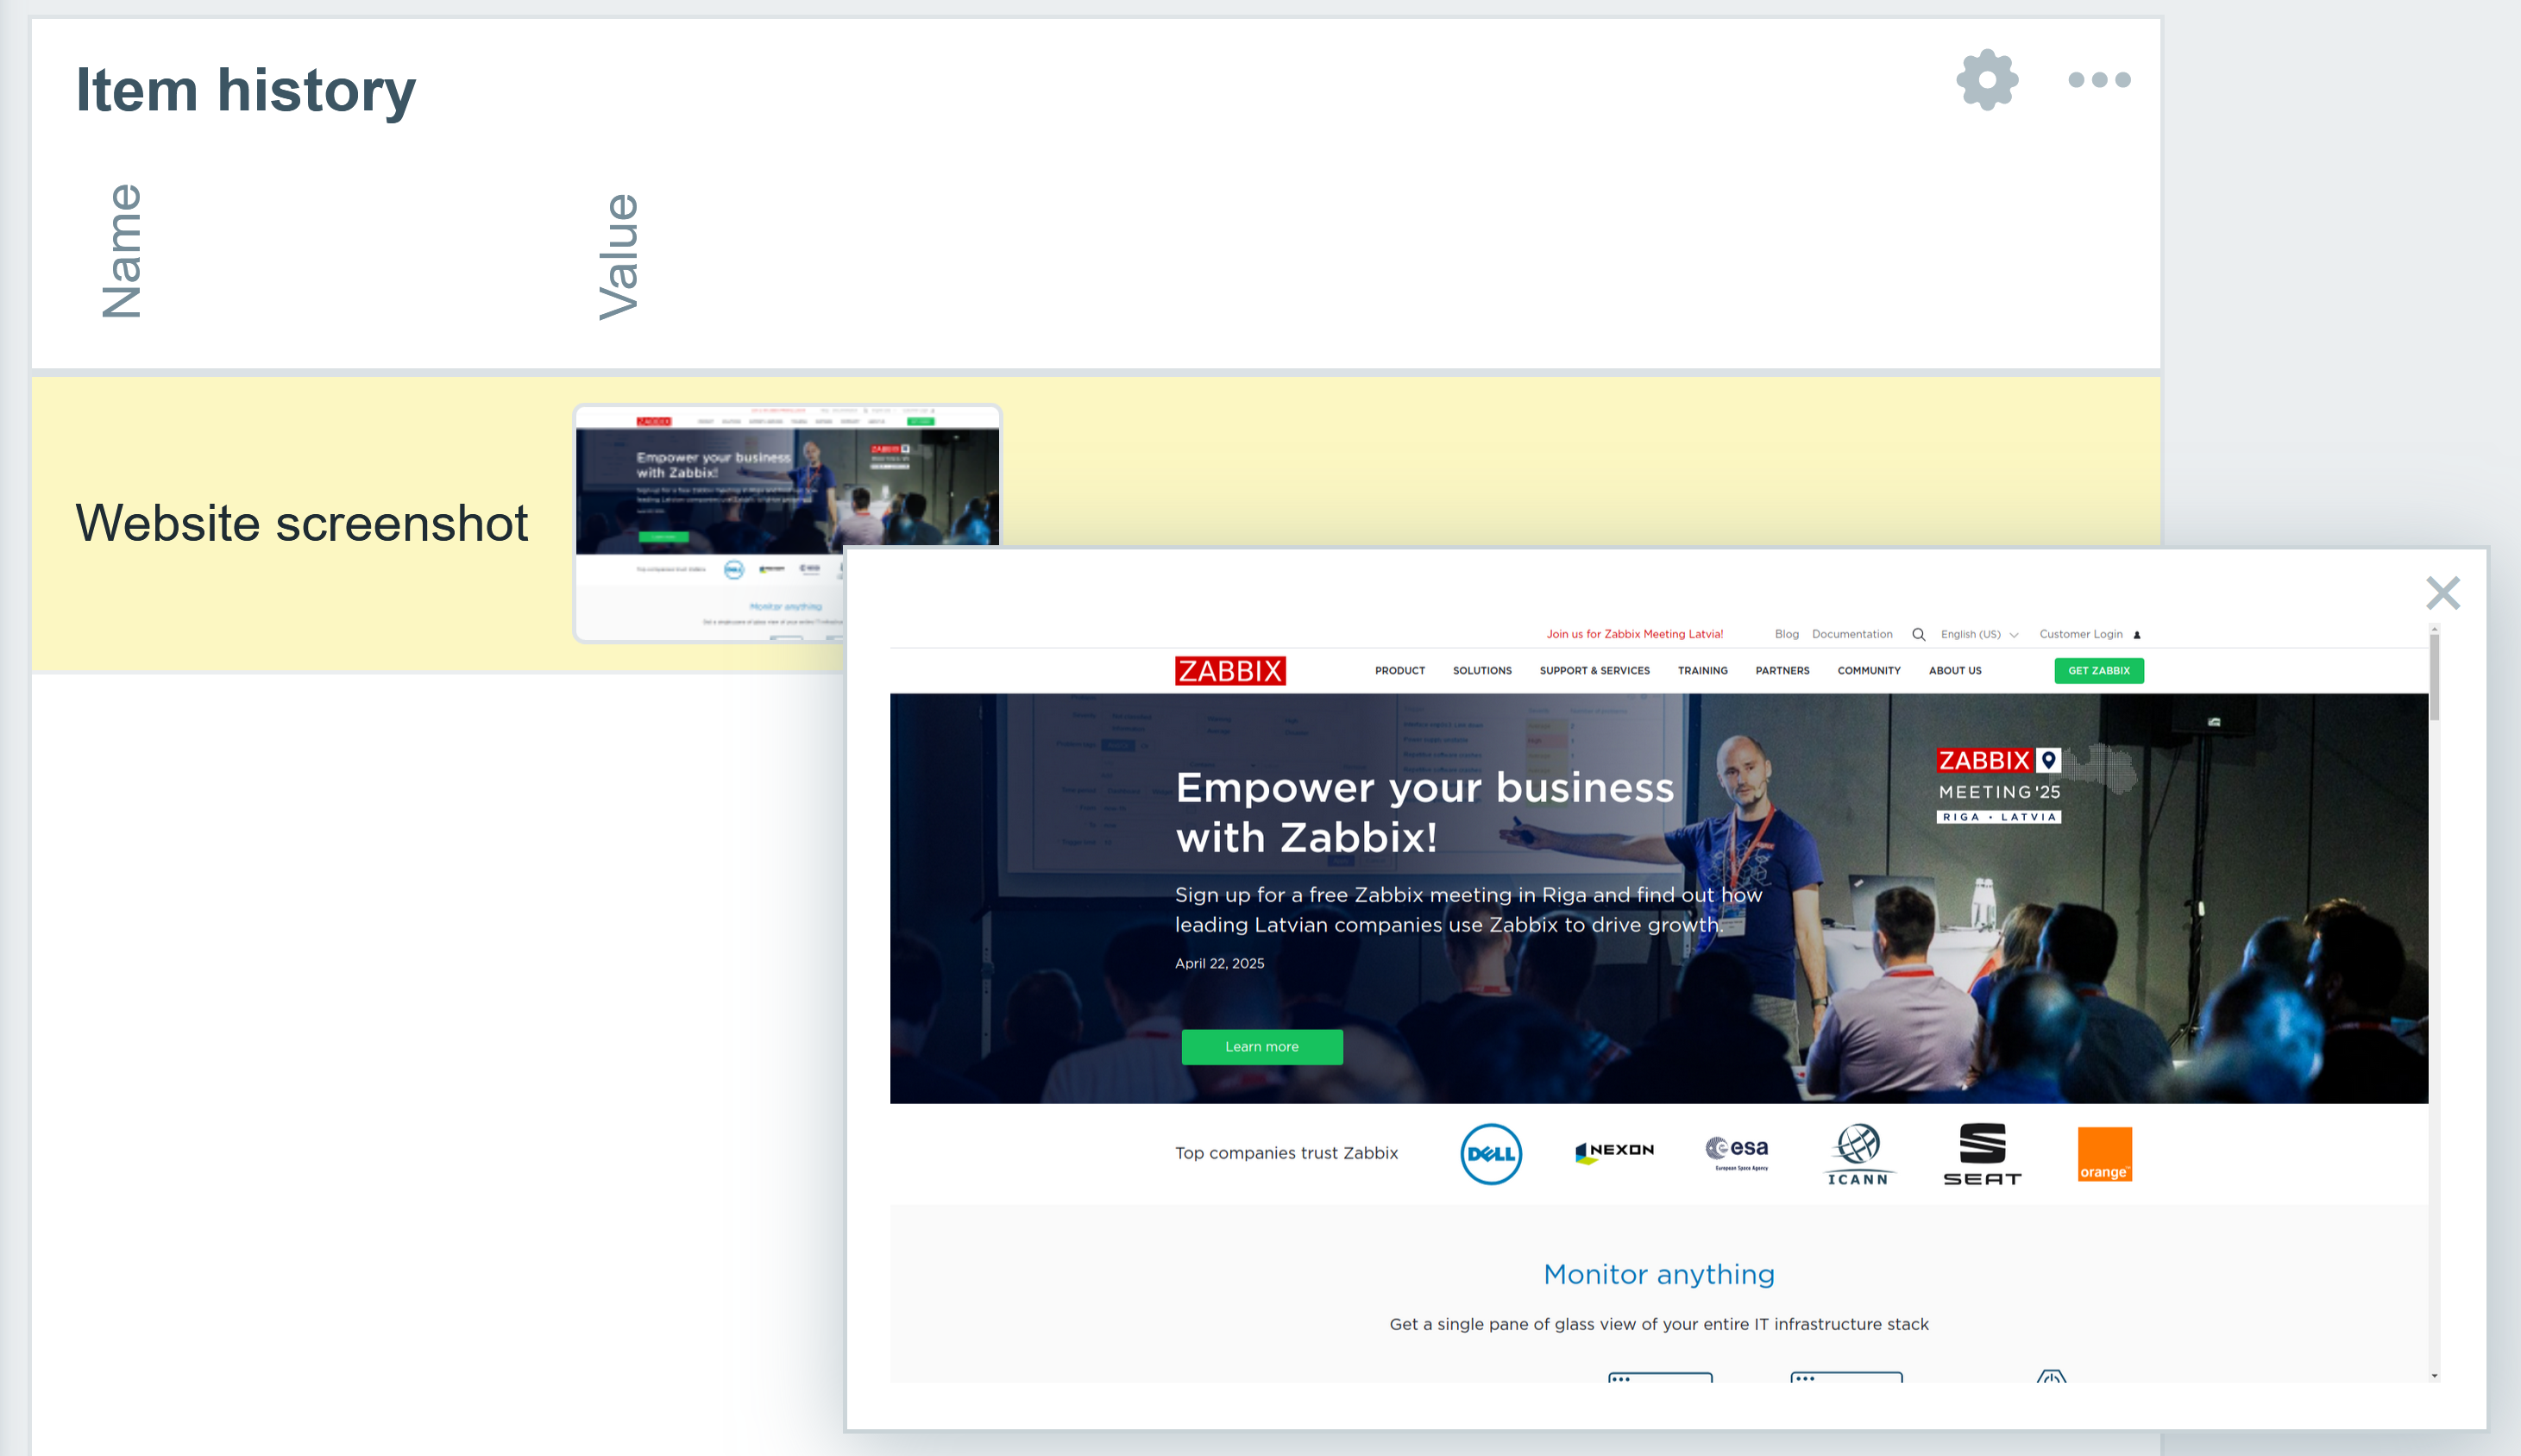
Next step: create a new host, add the template, specify which page to monitor with Macro values, and it’s DONE!!!!

Fig. 20. Creating host for monitoring website

Fig. 21. Screenshot of the monitored website

SNMP traps

For the snmptraps to work, the same directory must be shared among the zabbix-server and zabbix-snmptrap container. On the Zabbix-server side, you need to explicitly set snmp environment variable ZBX_ENABLE_SNMP_TRAPS to true and mount directory /var/lib/zabbix/snmptraps.

You also need to add the same volume to the snmptrap container.

And run the snmptraps container (make sure there is no permission issue for the directory)

docker run --name zabbix-snmptraps -t \
-v /var/lib/zabbix/snmptraps:/var/lib/zabbix/snmptraps:rw \
--network=zabbix-net \
-p 162:1162/udp \
--restart unless-stopped \
-d zabbix/zabbix-snmptraps:alpine-7.2-latest

Fig. 22. Received SNMP trap message

Scheduled reports

You can also easily configure scheduled reports by adding 2 additional environment variables to the Zabbix-server. In my case, both of these containers are in the same custom user network, therefore I will use the container name zabbix-web-service in the ZBX_WEBSERVICEURL option.

ZBX_STARTREPORTWRITERS=5
ZBX_WEBSERVICEURL=http://zabbix-web-service:10053/report

Start the Zabbix-web service, specify also these 2 parameters (you can skip those if defaults are used). You can also allow any incoming connections by setting ZBX_ALLOWEDIP=0.0.0.0/0. We discourage this, however.

ZBX_ALLOWEDIP=zabbix-server-mysql
ZBX_LISTENPORT=10053

Before testing scheduled reports, make sure you have enabled and configured the email media type.

Fig. 23. Configured and enabled media type

It is also encouraged to test it and check that you have received the test email.

Fig. 24. Successful media type test response

Fig. 25. Received test response on the selected media type.

Next, configure the user media where the scheduled report will be sent.

Fig. 26.Media type defined for the user

Last, but not least, set the frontend URL in the section Administration/General/Other section. In my case, I set the container name of the frontend and specify the port.

for Apache: http://<server_ip_or_name>/zabbix
for Nginx: http://<server_ip_or_name>

Fig. 27. Configured frontend address for the Frontend URL option

Next, create a scheduled report based on the dashboard of your choice.

Fig. 28.Configuring scheduled report

Check that you have received the test report in your mail.

Fig. 29.Successful scheduled report test.

Fig. 30. Received scheduled report test in the email

Now you know how to set up scheduled reports!

Docker container monitoring

You can also monitor Docker containers with a containerized Zabbix instance*

* Disclaimer: If docker service is not running, Zabbix monitoring will also not function and you will not receive notifications and alerts.

You can also monitor your docker instance with the Zabbix agent 2, however, you will be required to install Zabbix-agent 2 on the host either as a package or build it from the source.

You will also need to give user zabbix access to the docker.sock file. Just add user zabbix to group docker:

# usermod -aG docker zabbix

Otherwise, you will get an error message in items:

Cannot fetch data: Get "http://1.28/info": dial unix /var/run/docker.sock: connect: permission denied.

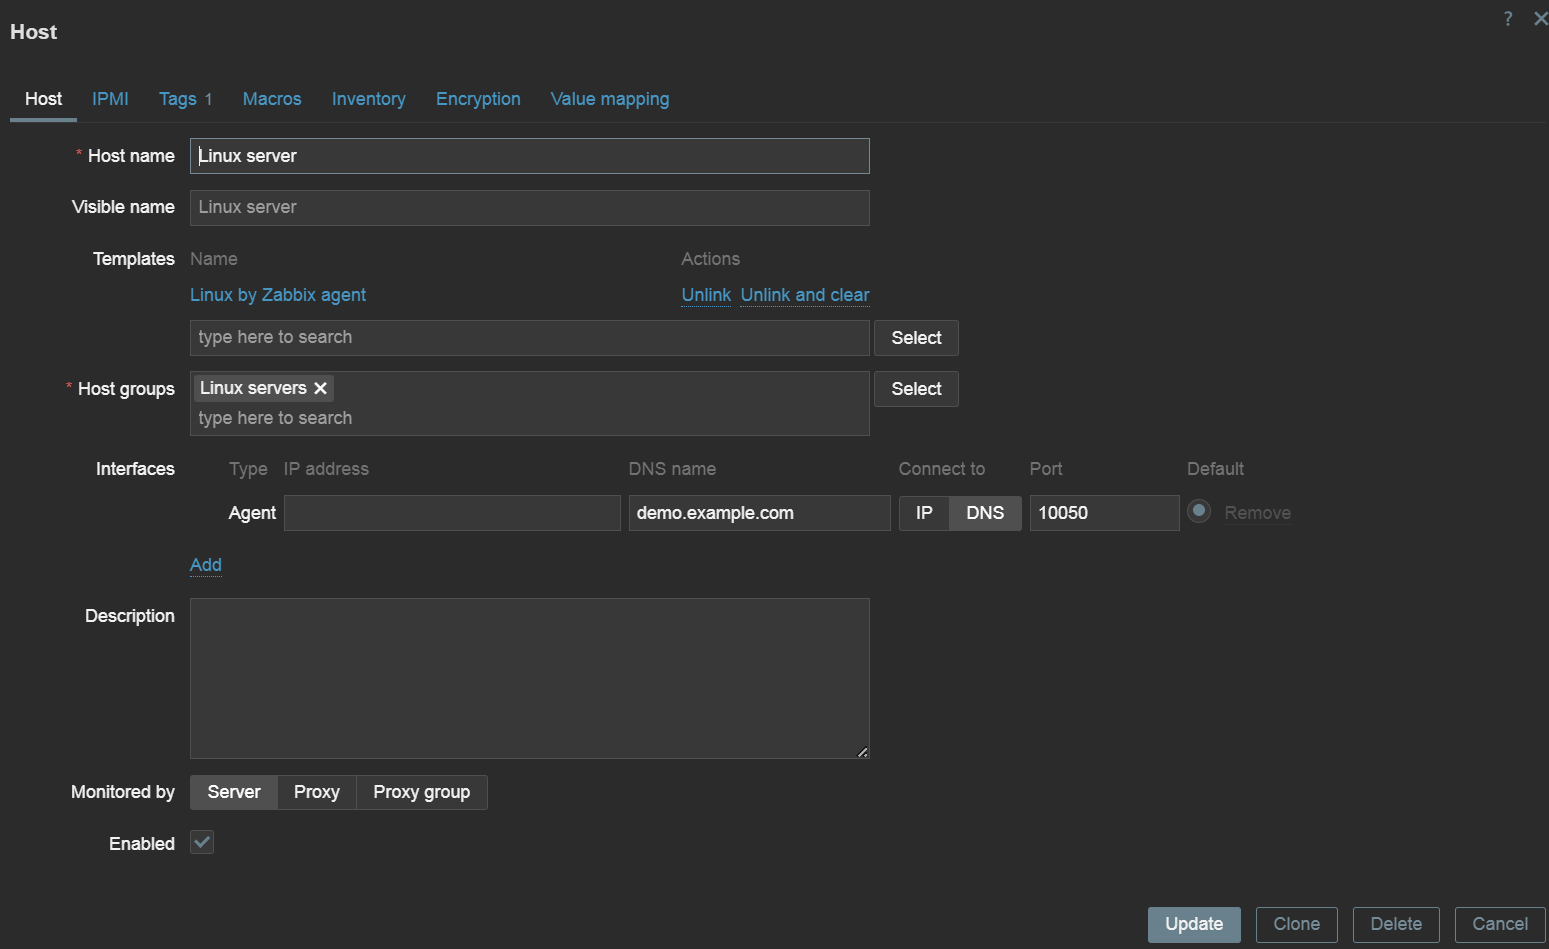
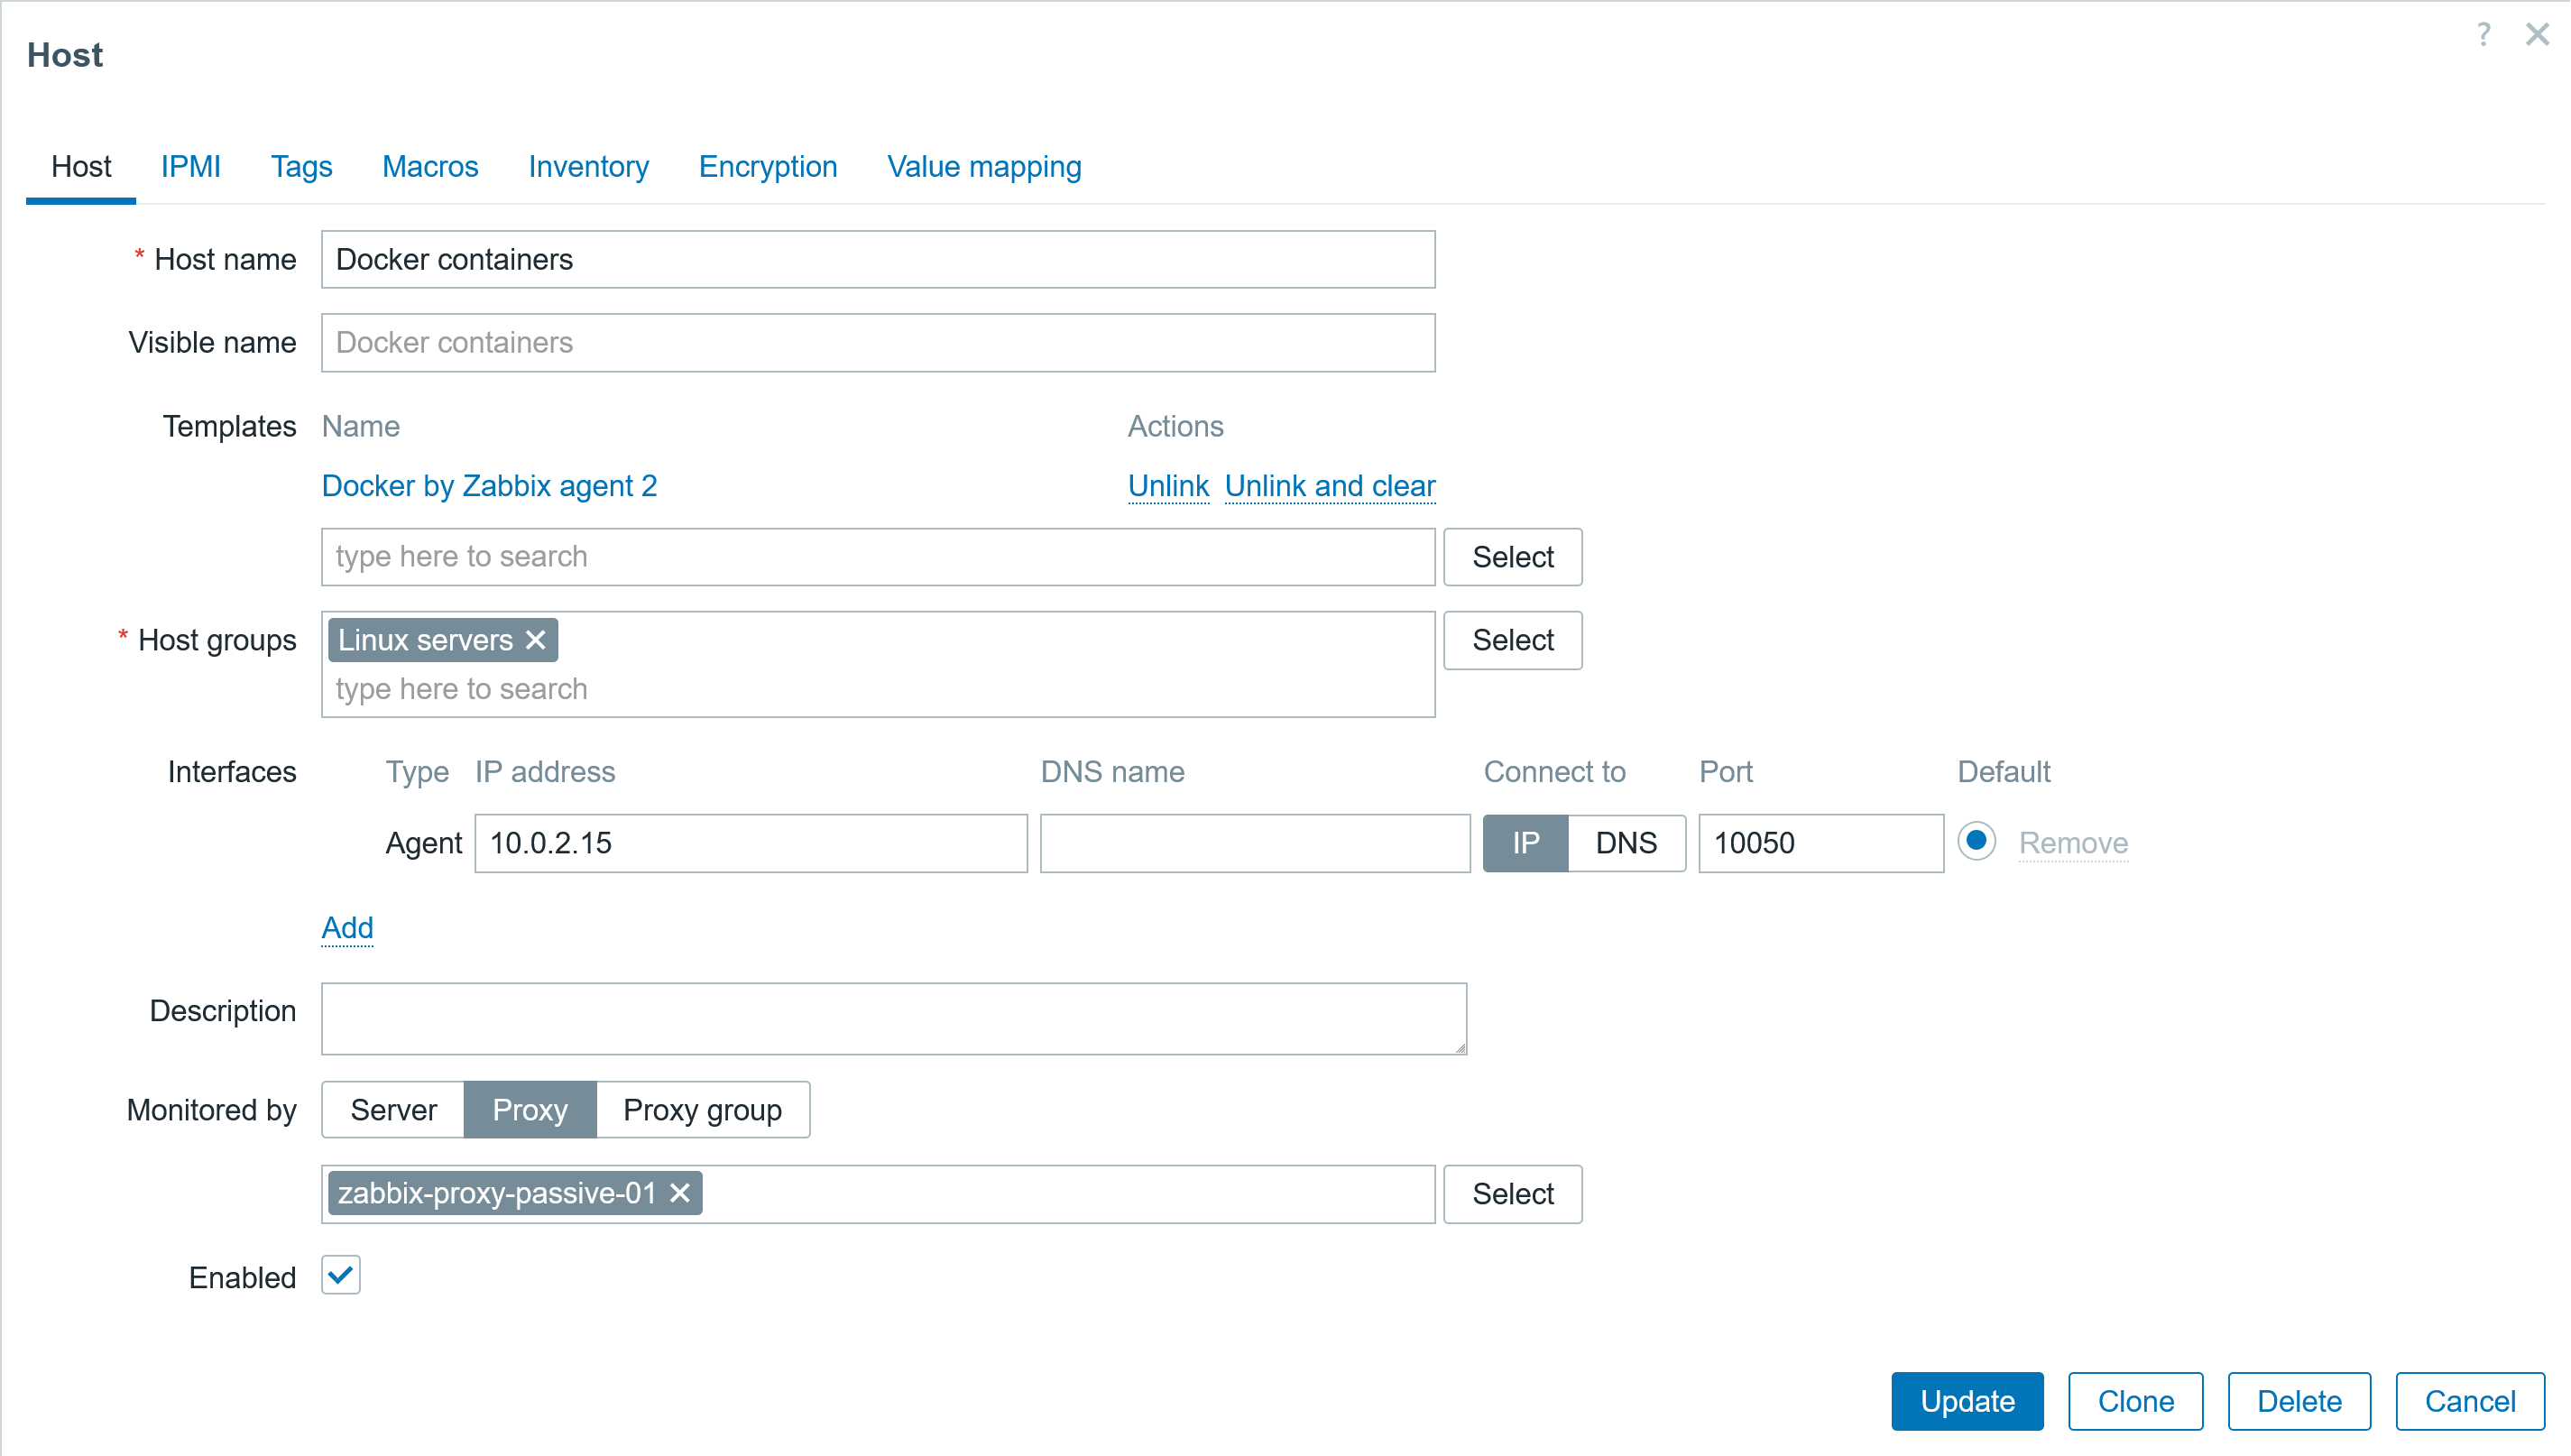
Go back to the frontend and create a Host for monitoring the docker containers:

  • Link template: Docker by Zabbix agent 2
  • Add host to host group
  • Specify host address or dns name, set the correct connect to option, and specify the agent port (if a default port is used, then set 10050).

Fig. 31. Configuring the host for monitoring the docker container

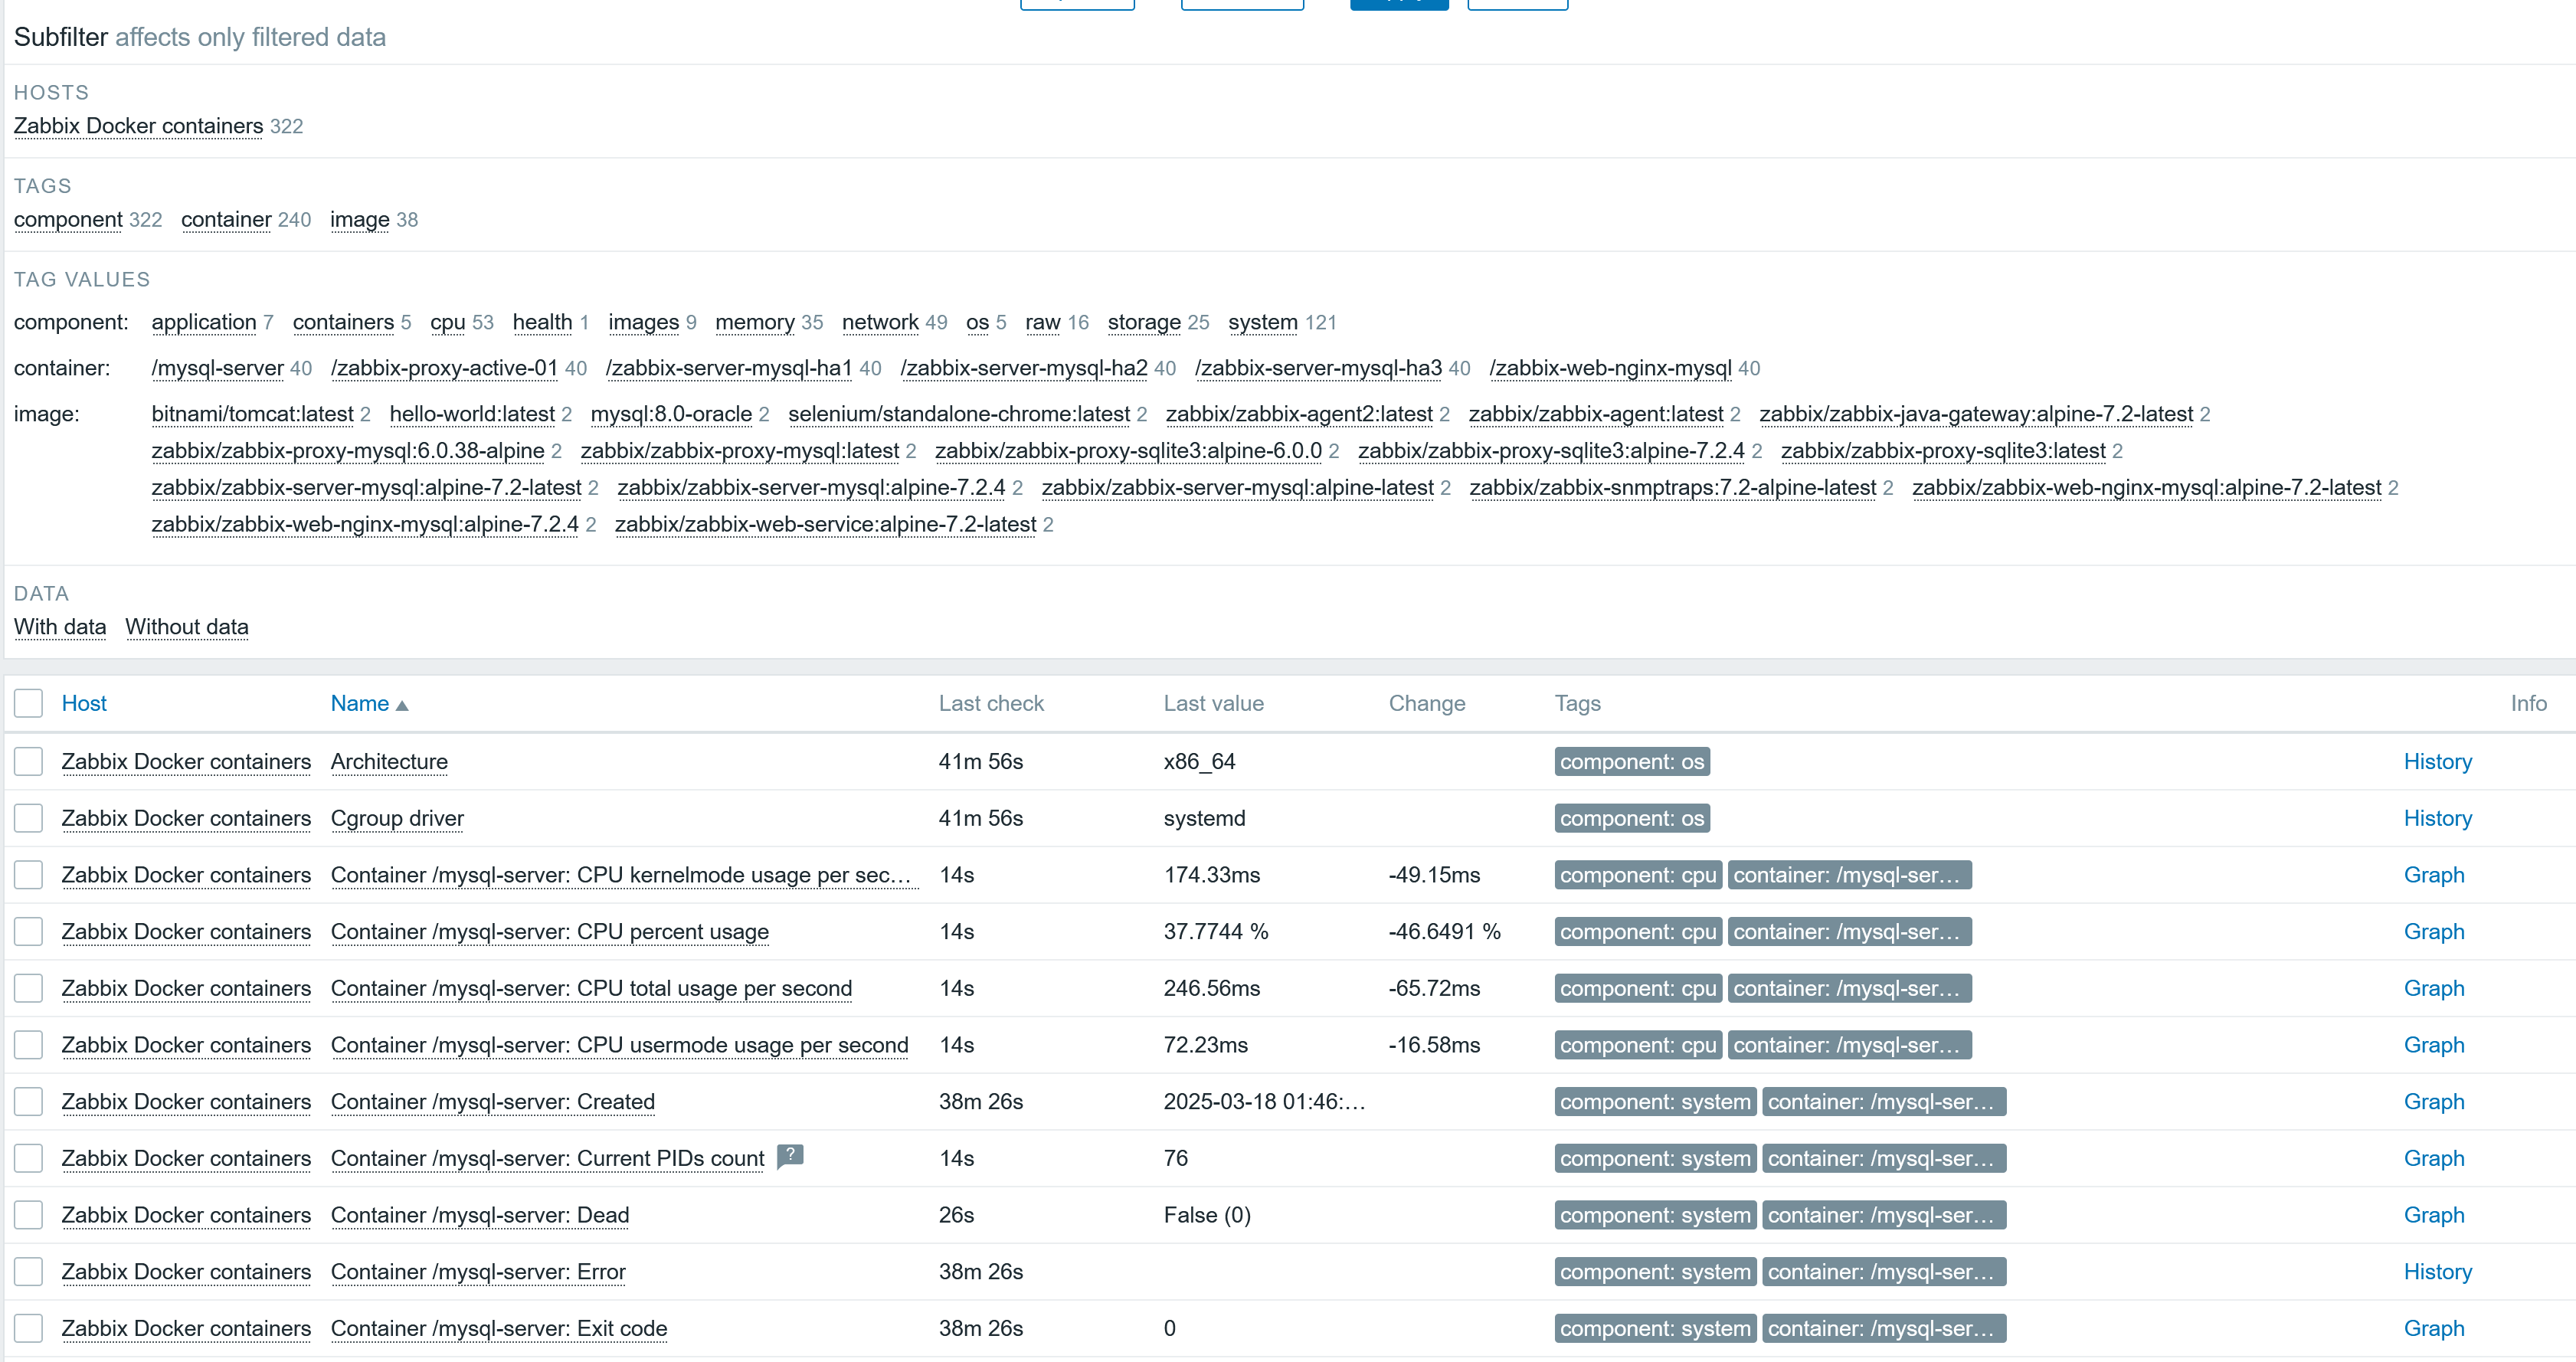
Now, if some issue happens to other containers, Zabbix will monitor them. But to be notified of an issue, don’t forget to enable and configure the media, user media, media templates, and trigger actions, so that you receive alerts.

Fig. 32.Latest data for the docker host

Thank you for reading – I hope you’ve found this article helpful and informative!


The post Deploying Zabbix Components with Docker and Docker Compose appeared first on Zabbix Blog.

Installing and Configuring Zabbix Server and Agent on Windows

Post Syndicated from Zabbix LatAm original https://blog.zabbix.com/installing-and-configuring-zabbix-server-and-agent-on-windows/29945/

Monitoring a Windows server helps verify and keep track of reboots, disk space, memory, CPU, communication loss, and high bandwidth consumption within the server – in fact, anything unusual that may require attention. In this post, we’ll see how to install and configure the Zabbix server and Zabbix agent on Windows, highlighting the key points that will keep your system running smoothly.

Check Zabbix server version

First, check which version of Zabbix server you’re using. This can be verified from the frontend in Reports > System information. In this example, we use version 7.0.9.

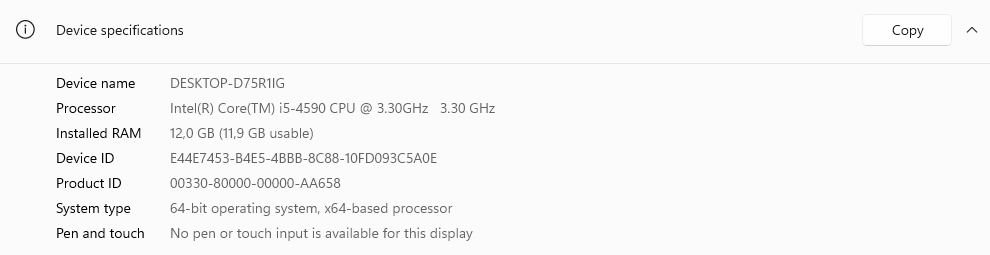
Before you begin, head over to your Windows server and verify the name and type of architecture.

This is critical to selecting the right agent during deployment.

Download the Zabbix agent

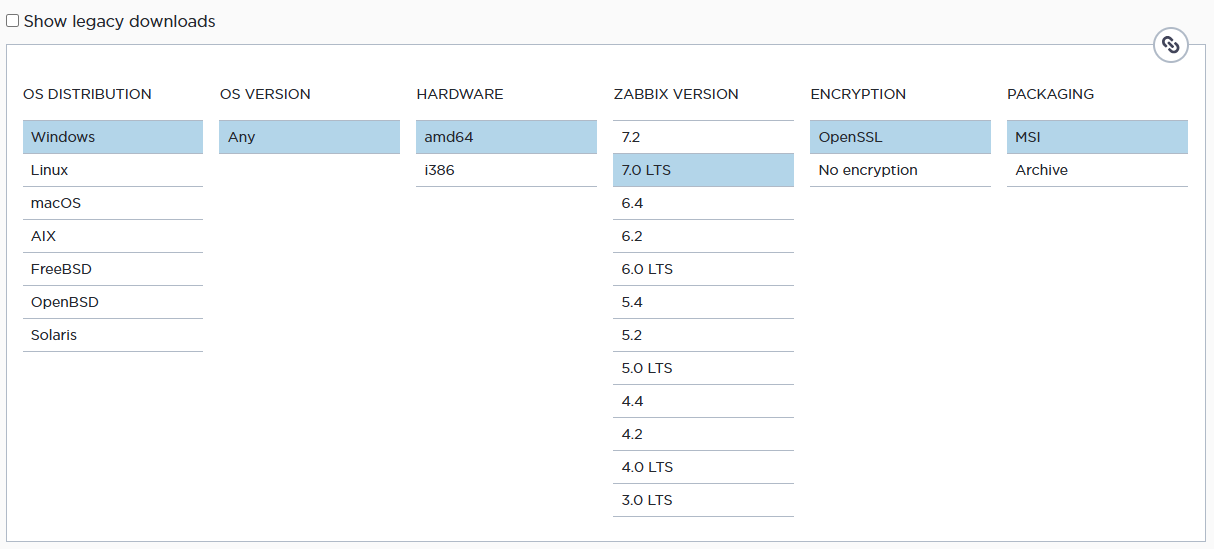
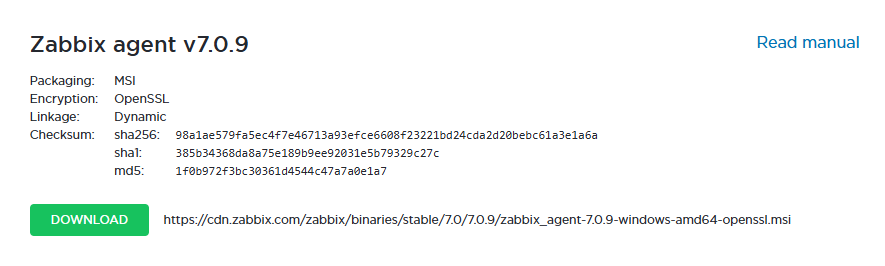
From the official Zabbix website, download the corresponding agent, taking into account the operating system (in this case, Windows), the hardware architecture (64 bits), the version of Zabbix server (ensuring compatibility with the version used), encryption (using OpenSSL as an encryption method), and the installation format (selecting the MSI file).

Select the current version of the release and download.

Install the Zabbix agent

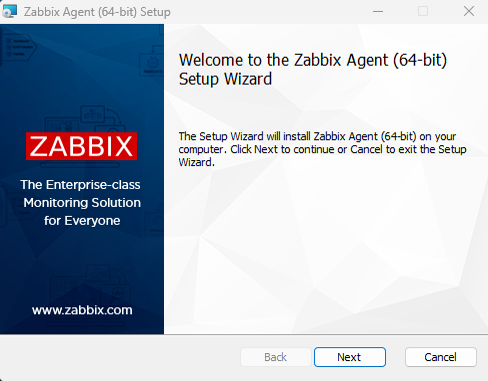
Start installing the Zabbix Agent on the Windows server.

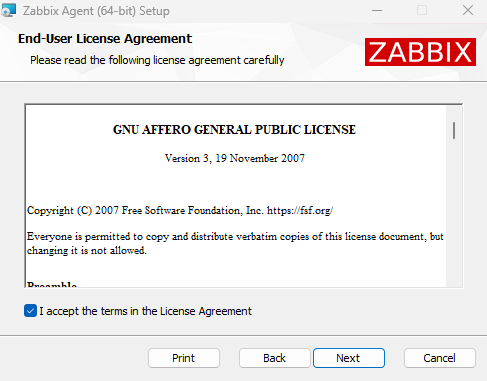
Accept the terms and conditions.

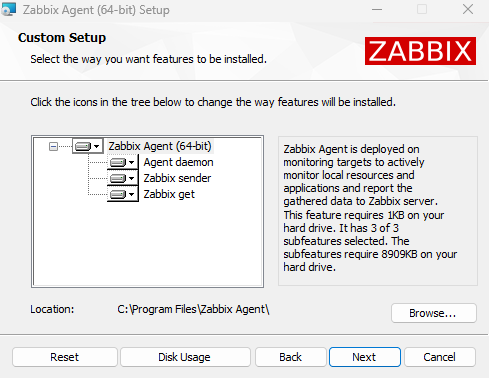
Check the components to be installed. You’ll need at least 8.70 MB of disk space.
The default installation path is C:\Program Files\Zabbix Agent\.

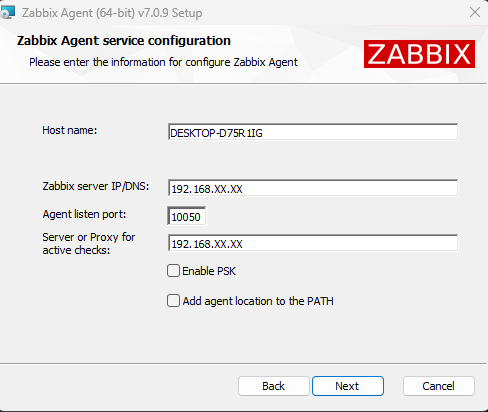
By default, the installer detects the name of the server. Enter the IP of your Zabbix Server. You can also use pre-shared keys.

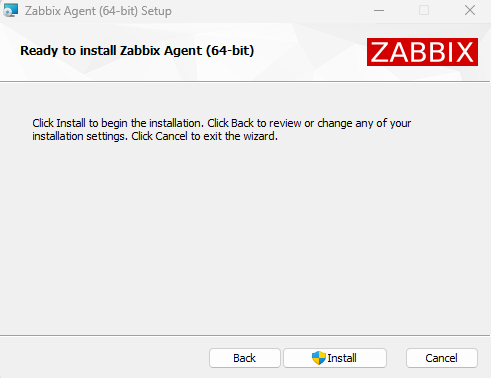
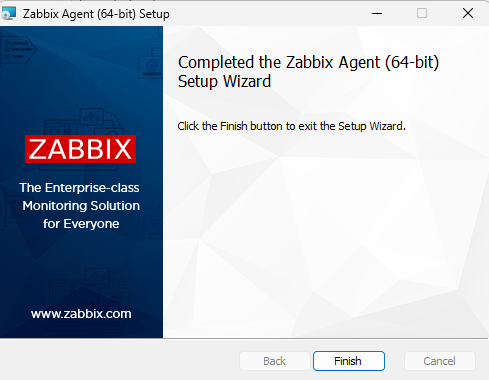
Start the installation and wait for it to finish.

Configure host in Zabbix Server

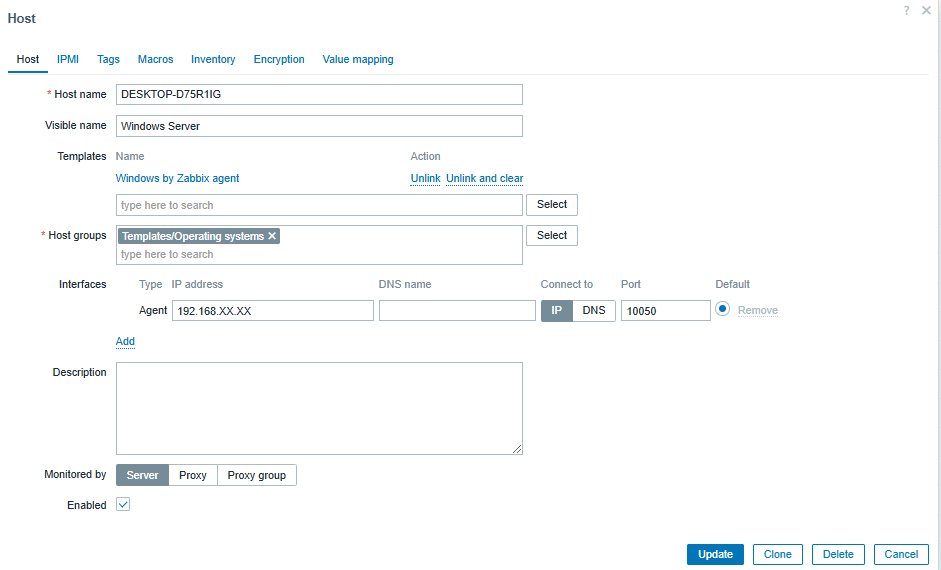
To set up a host on Zabbix Server, go to the Zabbix frontend and go to Data collection > Hosts.

Then, click Create host (located in the top right) and configure the following details:

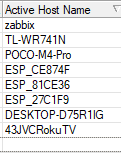
• The hostname (DESKTOP-D75R1IG)
• An identifying display name (such as ‘Windows Server’)
• The template (select ‘Windows by Zabbix Agent’)
• The group (assigns the server to an appropriate group)
• The interface (choose the agent monitoring option and enter the IP of the server)

Monitoring and visualization

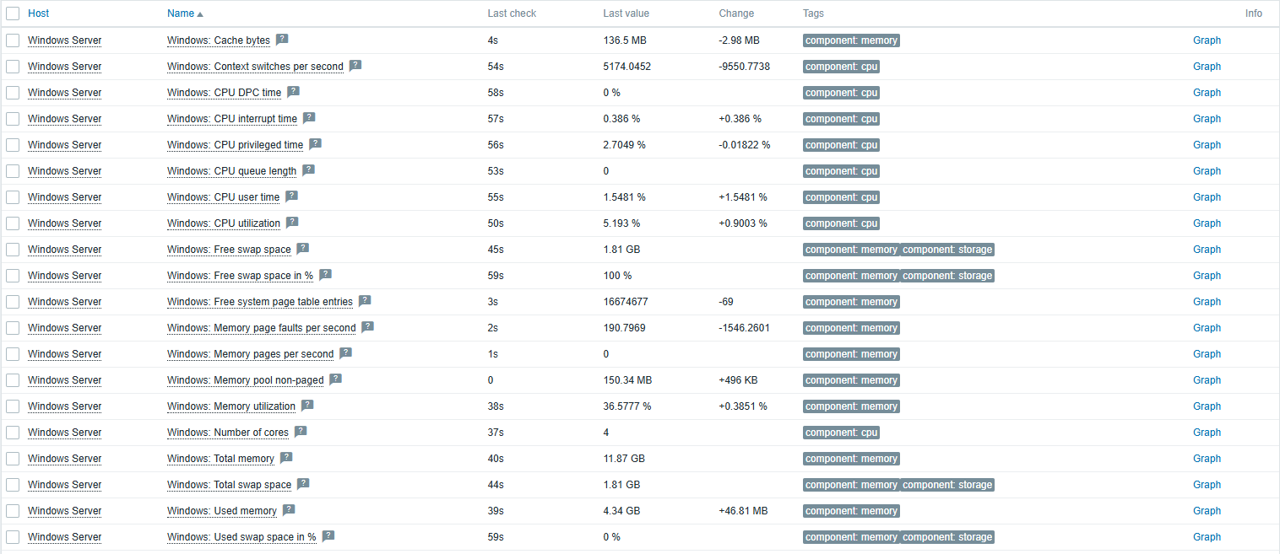
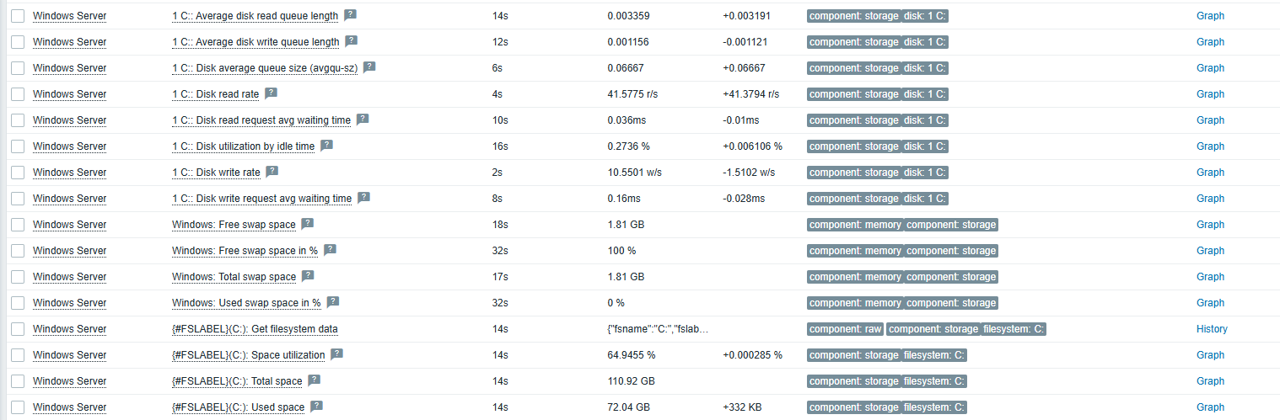
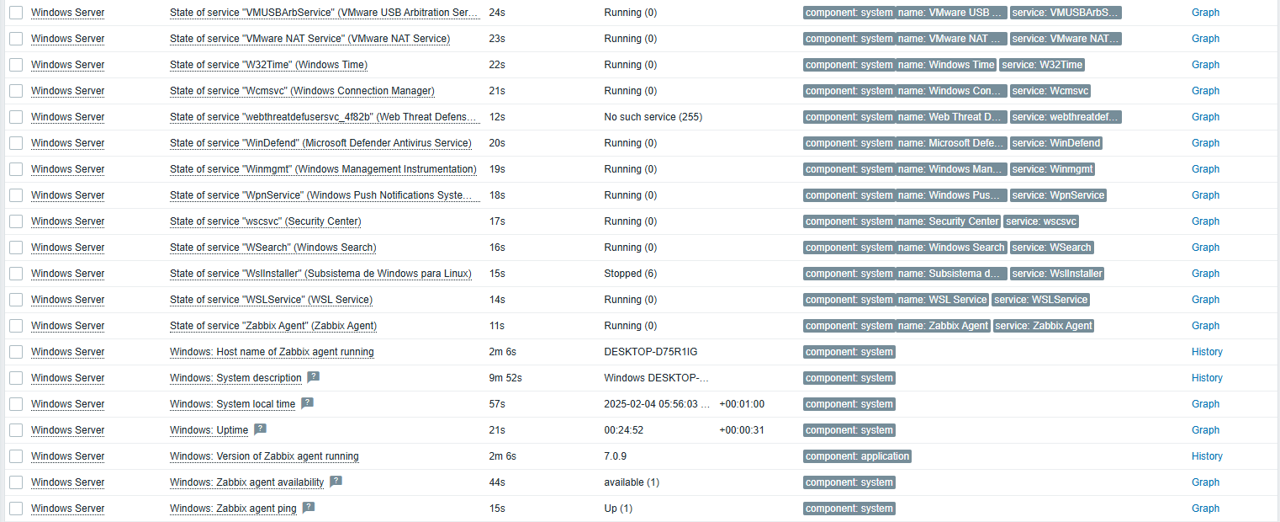
Once the host is configured, you will start receiving data from the server in Zabbix, including:

• Overall performance: CPU, memory, and disk status.

• Windows services and detailed host information.

• Bandwidth consumption

Conclusion

Zabbix provides an ideal template for a productive environments on Windows, making it a key tool for global monitoring of your servers.

In addition, you can extend and adapt the monitoring according to your needs, such as monitoring logs, ports, or specific events, while also checking for login failures or other critical issues in your systems.


The post Installing and Configuring Zabbix Server and Agent on Windows appeared first on Zabbix Blog.
Monitor Your Wi-Fi Signal Strength with Zabbix

Post Syndicated from Janne Pikkarainen original https://blog.zabbix.com/monitor-your-wi-fi-signal-strength-with-zabbix/29835/

Can you monitor the signal strength of different Wi-Fi devices that are connected to your (home) router with Zabbix? Of course you can! This is a really quick post that also shows how ChatGPT or any LLM can boost your productivity when doing this kind of thing.

I have an ASUS RT-AX68U router running on Asuswrt-Merlin firmware. On its web interface, it can show you all kinds of details about your network and the devices on it. This is nice, but it would be even nicer to add some of that to Zabbix. One interesting idea for me would be to monitor the signal strength of my Wi-FI devices around the house, so let’s do that and start monitoring RSSI!

What’s RSSI?

Here’s a reply by ChatGPT:

In Wi-Fi (and RF in general), RSSI (Received Signal Strength Indicator) is typically measured in negative dBm values:

• The closer the value is to 0 dBm, the stronger (better) the signal.

• The more negative the value, the weaker the signal.

Broadly speaking, here is a rough guideline:

• -30 dBm: Extremely strong signal (almost too strong – rare in normal conditions).

• -50 dBm: Excellent signal.

• -60 dBm: Very good signal, plenty strong for most uses.

• -70 dBm: Adequate; connectivity is usually reliable but might slow at times.

• -80 dBm: Marginal; still connected but performance may degrade.

• -90 dBm or lower: Very weak; likely to drop connection or have very poor speeds.

Monitoring implementation

If you are a regular reader, you should know by now that I’m not a fan of letting Zabbix agent or any other agent run commands directly for gathering metrics unless I really need the metrics that second. Rather, I’ll use cron jobs or any other background way of creating text files which then will be parsed by Zabbix.

That said, my ASUS now runs a shell script every minute, which then writes a text file /tmp/rssi.txt, which is read by Zabbix agent.

The shell script

Thank you ChatGPT for the following: The script uses wl -i assoclist command to list the connected devices with their MAC addresses and signal strength, and converts those MAC addresses to hostnames to be human-readable.

#!/bin/sh

# Interfaces for 2.4 and 5 GHz (adjust if your router uses different names)
IFACES="eth5 eth6"

LEASES_FILE="/var/lib/misc/dnsmasq.leases"
rm -f /tmp/rssi.txt

echo "Hostname:RSSI" >/tmp/rssi.txt
for iface in $IFACES
do
# List all MACs associated on this interface
for MAC in $(wl -i "$iface" assoclist 2>/dev/null | awk '{print $2}')
do
# Get RSSI
RSSI=$(wl -i "$iface" rssi "$MAC" 2>/dev/null)

# Look up IP and hostname in dnsmasq leases (if present)
# The leases file format is: <epoch> <MAC> <IP> <hostname> <clientid>
IP=$(grep -i "$MAC" "$LEASES_FILE" | awk '{print $3}')
HOSTNAME=$(grep -i "$MAC" "$LEASES_FILE" | awk '{print $4}')

# If the device is static or not found in dnsmasq leases, IP/HOSTNAME might be empty
# so handle that gracefully
[ -z "$IP" ] && IP="Unknown"
[ -z "$HOSTNAME" ] && HOSTNAME="Unknown"

#echo "MAC $MAC:"
#echo " RSSI: $RSSI dBm"
#echo " IP: $IP"
#echo " Hostname: $HOSTNAME"
echo "$HOSTNAME:$RSSI" >>/tmp/rssi.txt
done
done

It outputs this, with self-explanatory results.

Hostname:RSSI
Watch:-43
058743599:-66
Samsung:-62
SonosZP:-45
BroadLink_OEM-T1-89-d3-bb:-57
Kitchen:-52
Mac:-39
iPhone:-40
*:-60
MacBookPro:-43

Adding it to Zabbix

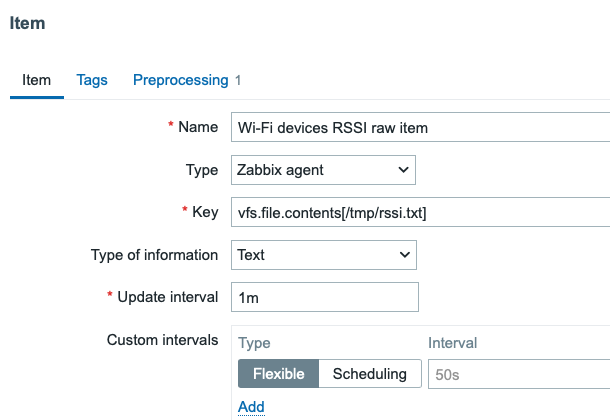
First, I added a new template, for which I then added a new master item reading the /tmp/rssi.txt file.

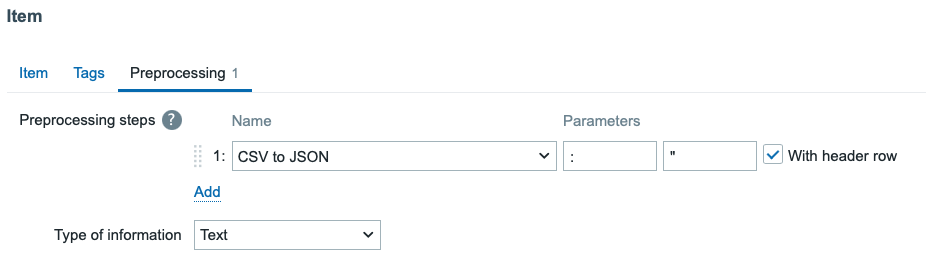
Because ChatGPT script did make the output in CSV format with : as delimiter, we can use Zabbix item preprocessing to convert that CSV to JSON. The JSON output looks like this.

[{"Hostname":"Watch","RSSI":"-45"},{"Hostname":"058743599","RSSI":"-70"},{"Hostname":"Samsung","RSSI":"-60"},{"Hostname":"SonosZP","RSSI":"-44"},{"Hostname":"BroadLink_OEM-T1-89-d3-bb","RSSI":"-61"},{"Hostname":"Kitchen","RSSI":"-53"},{"Hostname":"Mac","RSSI":"-37"},{"Hostname":"iPhone","RSSI":"-39"},{"Hostname":"*","RSSI":"-56"},{"Hostname":"MacBookPro","RSSI":"-41"}]

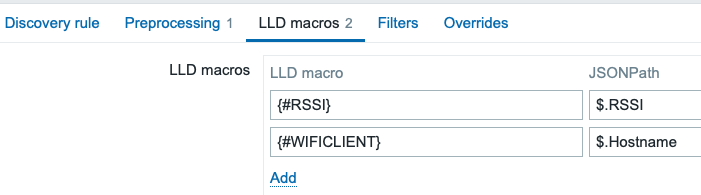
With this, we can then use Zabbix low-level discovery to automatically create the items.

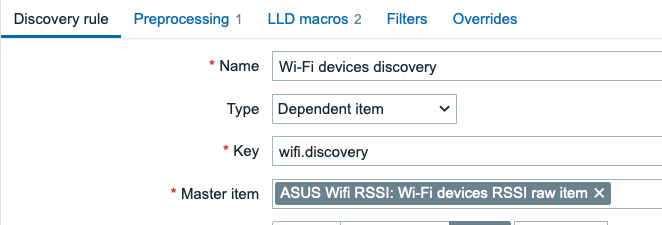
Discovery rule

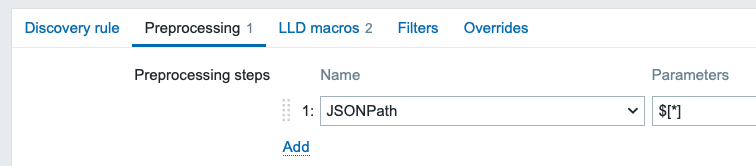
Now that we have our master item, let’s add the discovery rule, which can go through the JSON. The discovery rule uses my previous item as a dependent item, from which it can parse everything in one go.

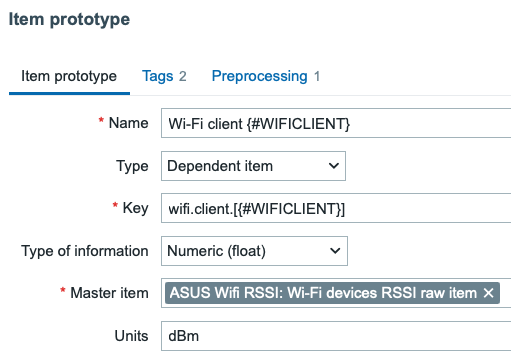
Discovery item prototype

In item prototype, let’s make it again use the raw list as a dependent item and go from there.

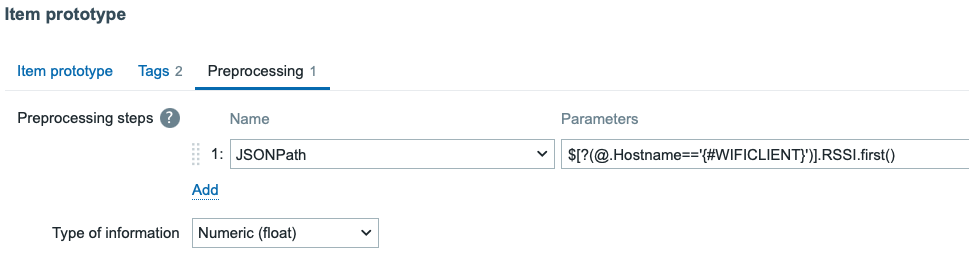
Then in preprocessing, it picks the RSSI value for whatever device LLD was going through by using a JSONPath query…

…or as text:

$[?(@.Hostname=='{#WIFICLIENT}’)].RSSI.first()

That’s pretty much it!

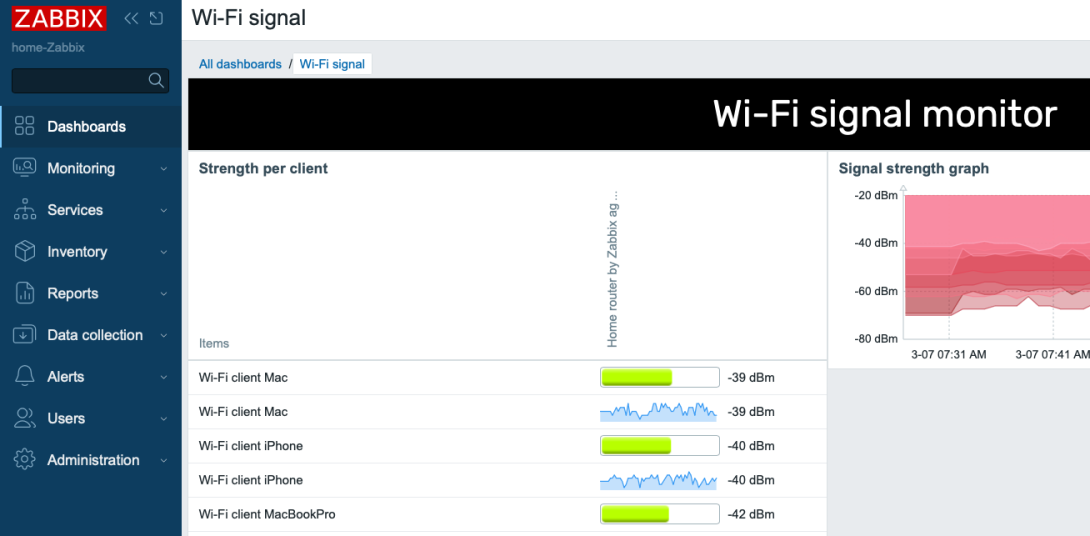
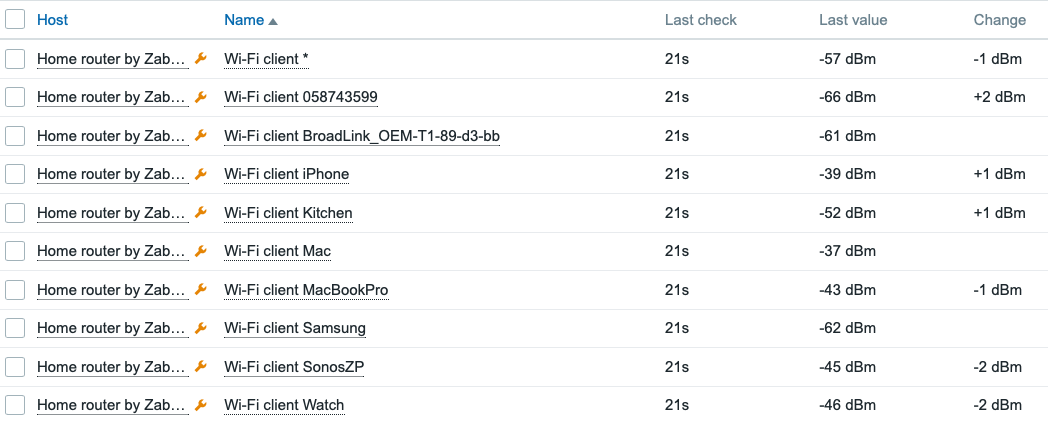
We now have the data coming in once per minute:

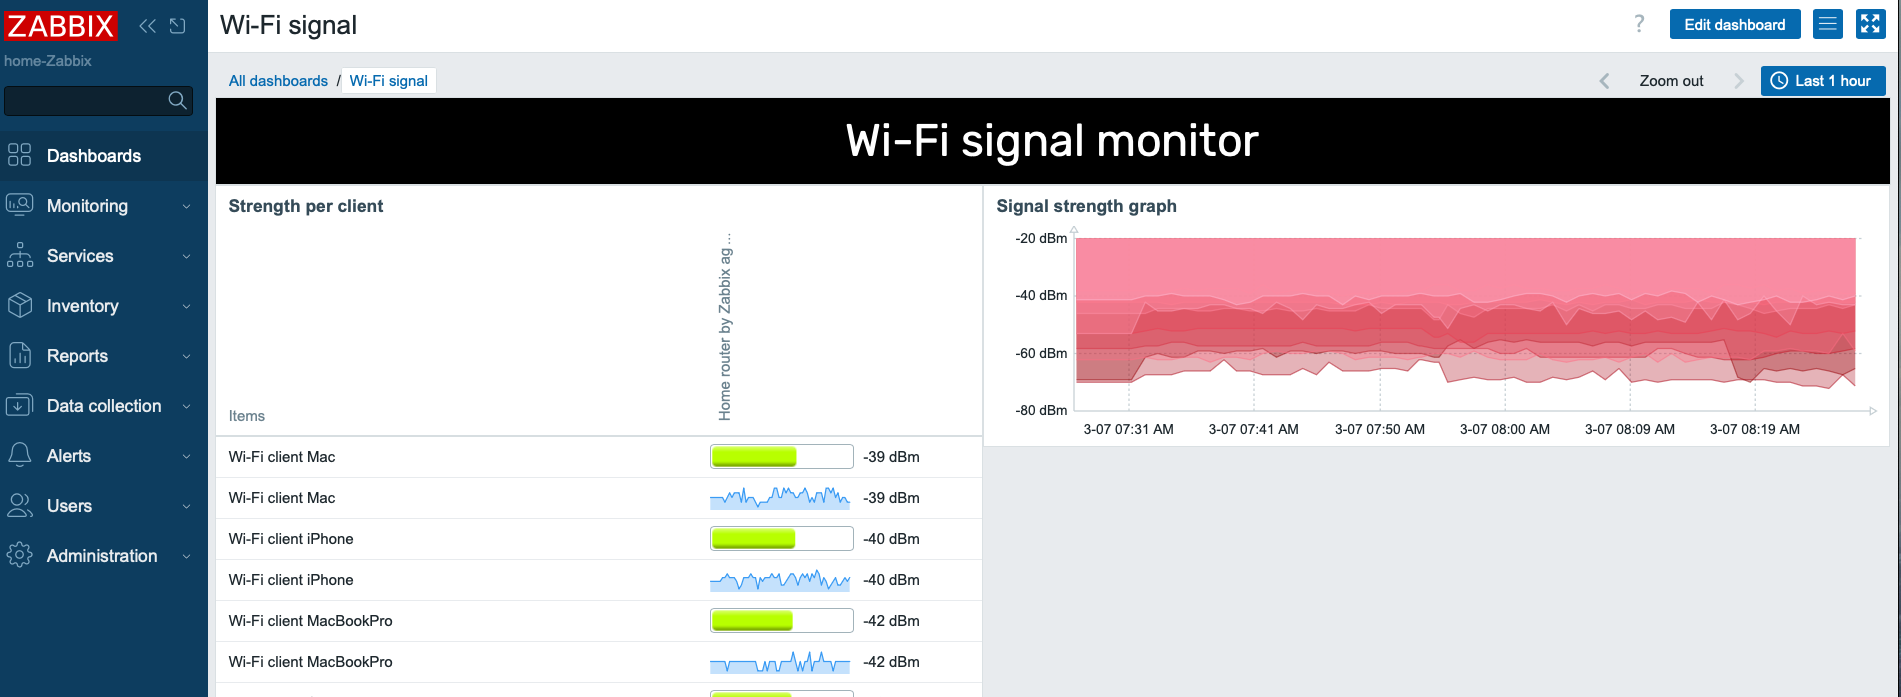
Here’s a little dashboard, too. It shows you the traditional bar that’s available on the Top hosts/items widget, and also the new Sparkline that’s on Zabbix 7.2.

Bonus: Location estimation

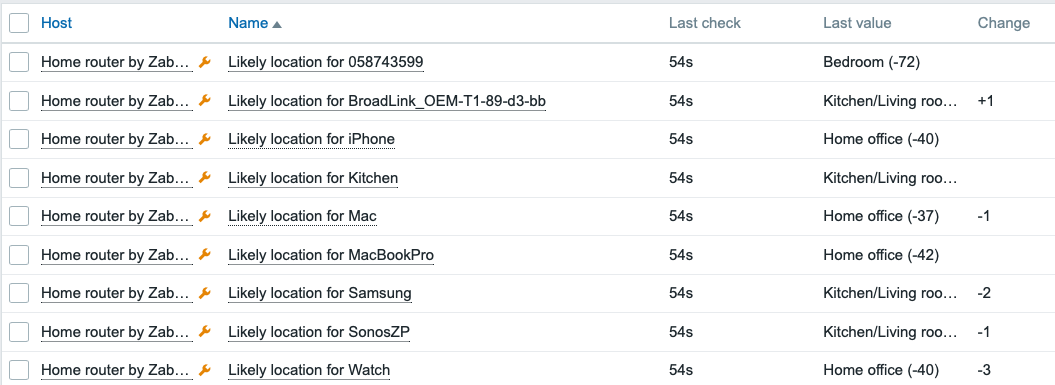
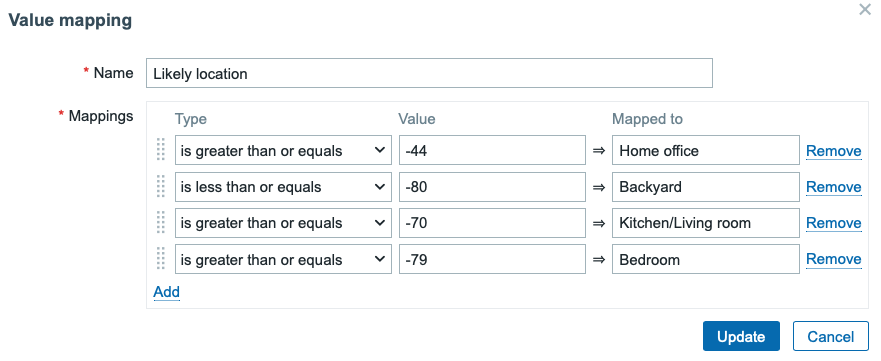
After a little bit of walking around and observing the devices, I added some value mapping to make Zabbix estimate where the devices would be located. It’s not so useful for static objects, but when I move around with my Apple Watch and iPhone, I could make an attempt to monitor my location at home, too.

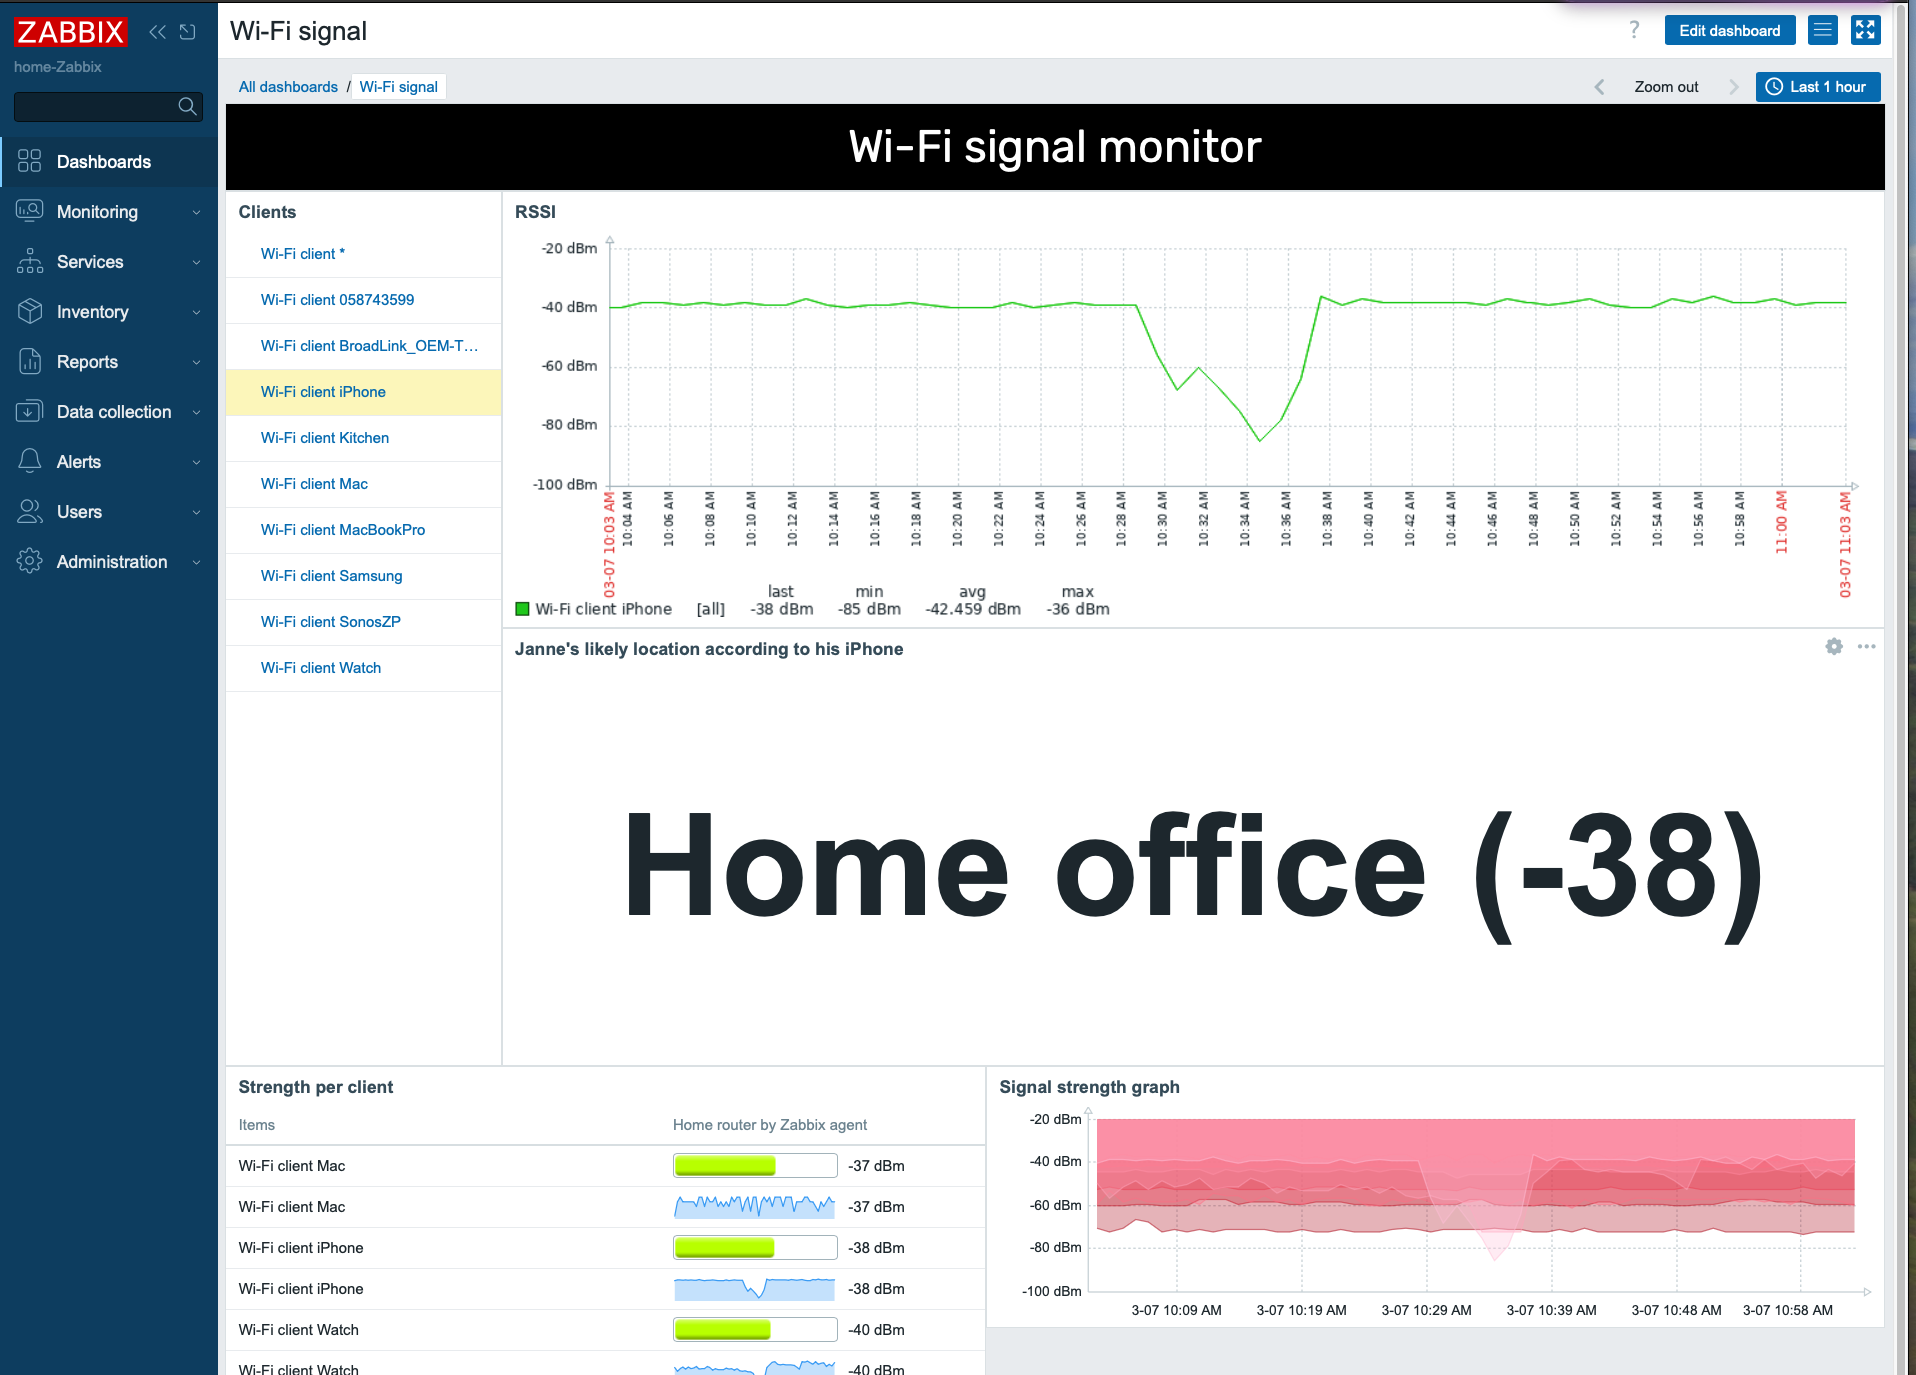
After this fine-tuning, my dashboard now looks like this:

Thanks for reading, and have fun conducting your own experiments!

The post Monitor Your Wi-Fi Signal Strength with Zabbix appeared first on Zabbix Blog.
Monitoring Pure Storage FlashArray with Zabbix

Post Syndicated from Aleksandr Iantsen original https://blog.zabbix.com/monitoring-pure-storage-flasharray-with-zabbix/29752/

Monitoring data storage systems is the key to keeping modern IT systems running smoothly. With the rapid growth of data and the need for instant access, using high-performance solutions like Pure Storage FlashArray is not just an advantage – it’s a necessity. However, even the most advanced systems require careful oversight regarding their performance and health. Good monitoring helps find problems early and makes it possible to use resources more efficiently. In this article, we will explore how to set up monitoring for the Pure Storage FlashArray storage system with Zabbix using our new templates.

Pure Storage FlashArray offers two API versions: REST API 1.X and REST API 2.X. To ensure compatibility and comprehensive coverage for the maximum number of devices, two templates have been developed for these API versions. This allows users to effectively monitor their Pure Storage FlashArray storage systems regardless of which API version they are utilizing, making sure that they can take full advantage of the monitoring capabilities and performance metrics provided by each version. By accommodating both API versions, organizations can achieve a more flexible and comprehensive monitoring setup tailored to meet their specific infrastructure needs.

Preparing Pure Storage FlashArray for monitoring with Zabbix

In all of these examples, the Purity for FlashArray (Purity//FA) graphical user interface (GUI) will be used, so keep in mind that some of the UI elements or navigation menus can potentially change in the future.

User creation

First of all, you need to set up a user in GUI that Zabbix will use to access the REST API and gather data. To do so, navigate to 'Settings' -> 'Users and Policies' -> 'Users' from the left-side menu. On this page, pay attention to the ‘Users’ block. In the upper right corner of this block, you will see three dots. Click on them to open a context menu. In this menu, select the 'Create User...' option. Here, create a new user by filling in the fields.


API Key creation

Unlike Pure Storage FlashArray v2 by HTTP, Pure Storage FlashArray v1 by HTTP supports authentication using a username and password instead of a token. This feature is left for backward compatibility with older versions of devices and firmware. However, it is strongly recommended to use token authentication if there are no technical limitations.

If you do plan to use username and password authentication in the Pure Storage FlashArray v1 by HTTP template, you can skip this step and move on to the next one.

Once you have created the user, the next step is to generate an API token. To do this, find the newly created user in the 'Users' block on the 'Settings' -> 'Users and Policies' page. On the right side of the user’s entry, locate the three dots and click on them to open the menu. From this menu, select 'Create API Token...'. Follow the prompts to generate the API token, which Zabbix will use to authenticate requests. The 'Expires In' field can be left empty.


After clicking the Create button,  the GUI will show you details about the API key. Save this information somewhere safe for now, as we will need to use this data later in Zabbix. After saving, you can close this pop-up.

Preparing Zabbix

Create a host

Open your Zabbix web interface, then navigate to the ‘Configuration' -> 'Hosts‘ page and create a new host. In this step, you need to specify a host name of your choice, so choose one of the Pure Storage FlashArray v1 by HTTP or Pure Storage FlashArray v2 by HTTP templates and assign the host to a group. The choice of template depends on the version of the Pure Storage FlashArray RESTful API that is supported by your devices.


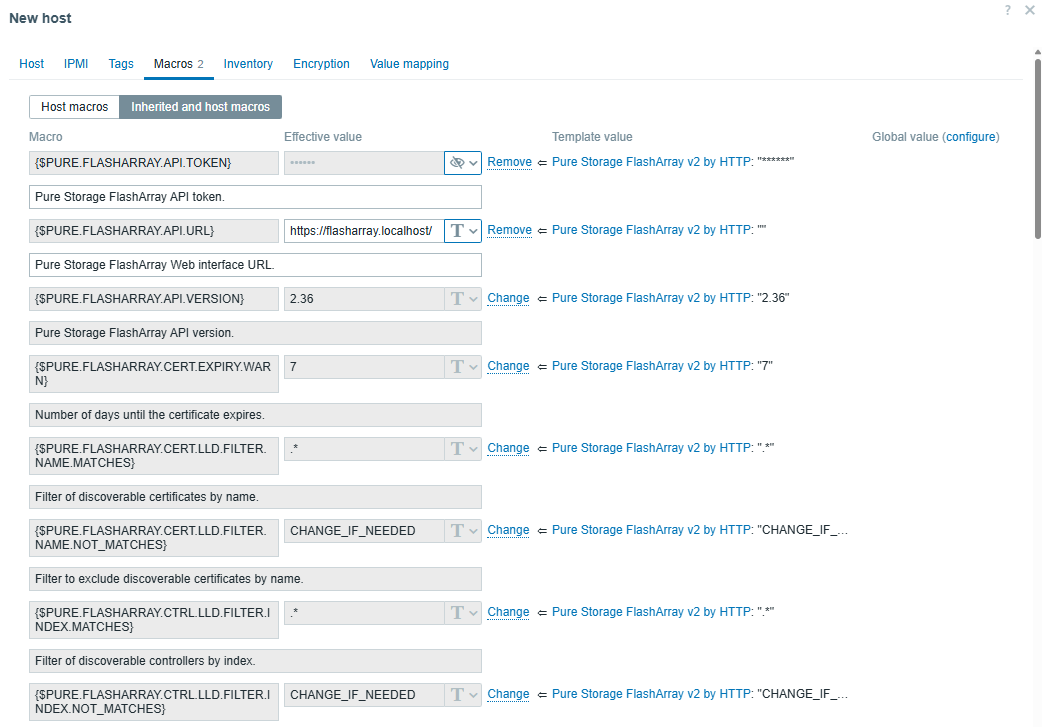
Before clicking the Add button, you need to configure macros. Open the Macros tab and choose both Inherited and host macros. You’ll find a lot of macros there, but only a few of them need to be changed to start using the template. Let’s take a look at these macros.

Macro list in the Pure Storage FlashArray v1 by HTTP template:

Macro Default value Description
{$PURE.FLASHARRAY.API.URL} Web interface URL.
{$PURE.FLASHARRAY.API.TOKEN} API token.
{$PURE.FLASHARRAY.API.USERNAME} Web interface username.
{$PURE.FLASHARRAY.API.PASSWORD} Web interface password.
{$PURE.FLASHARRAY.API.VERSION} 1.19 API version.

For the Pure Storage FlashArray v1 by HTTP template, it is mandatory to specify the {$PURE.FLASHARRAY.API.URL} macro, as well as either the {$PURE.FLASHARRAY.API.TOKEN} or {$PURE.FLASHARRAY.API.USERNAME} and {$PURE.FLASHARRAY.API.PASSWORD}. It is highly recommended to use a token for authentication.

Macro list in the Pure Storage FlashArray v2 by HTTP template:

Macro Default value Description
{$PURE.FLASHARRAY.API.URL} Web interface URL.
{$PURE.FLASHARRAY.API.TOKEN} API token.
{$PURE.FLASHARRAY.API.VERSION} 2.36 API version.

For the Pure Storage FlashArray v2 by HTTP template, it is mandatory to specify just the {$PURE.FLASHARRAY.API.URL} and {$PURE.FLASHARRAY.API.TOKEN} macros to start using the template.

You can change the value for the {$PURE.FLASHARRAY.API.VERSION} macro if your device does not support this version of the API.

After specifying at least the mandatory macro values, your Macros tab should look something like this:


After clicking the Add button, this host will be added to Zabbix.

Data collection

After following the above steps, you should notice the newly created triggers and items after a short time if the macro values are correct.

In case there are any problems with the template’s data collection, you will find errors in the last history data of items with a name ending with item errors. Also, the corresponding triggers should be fired if there are any problems with the collection of any data.

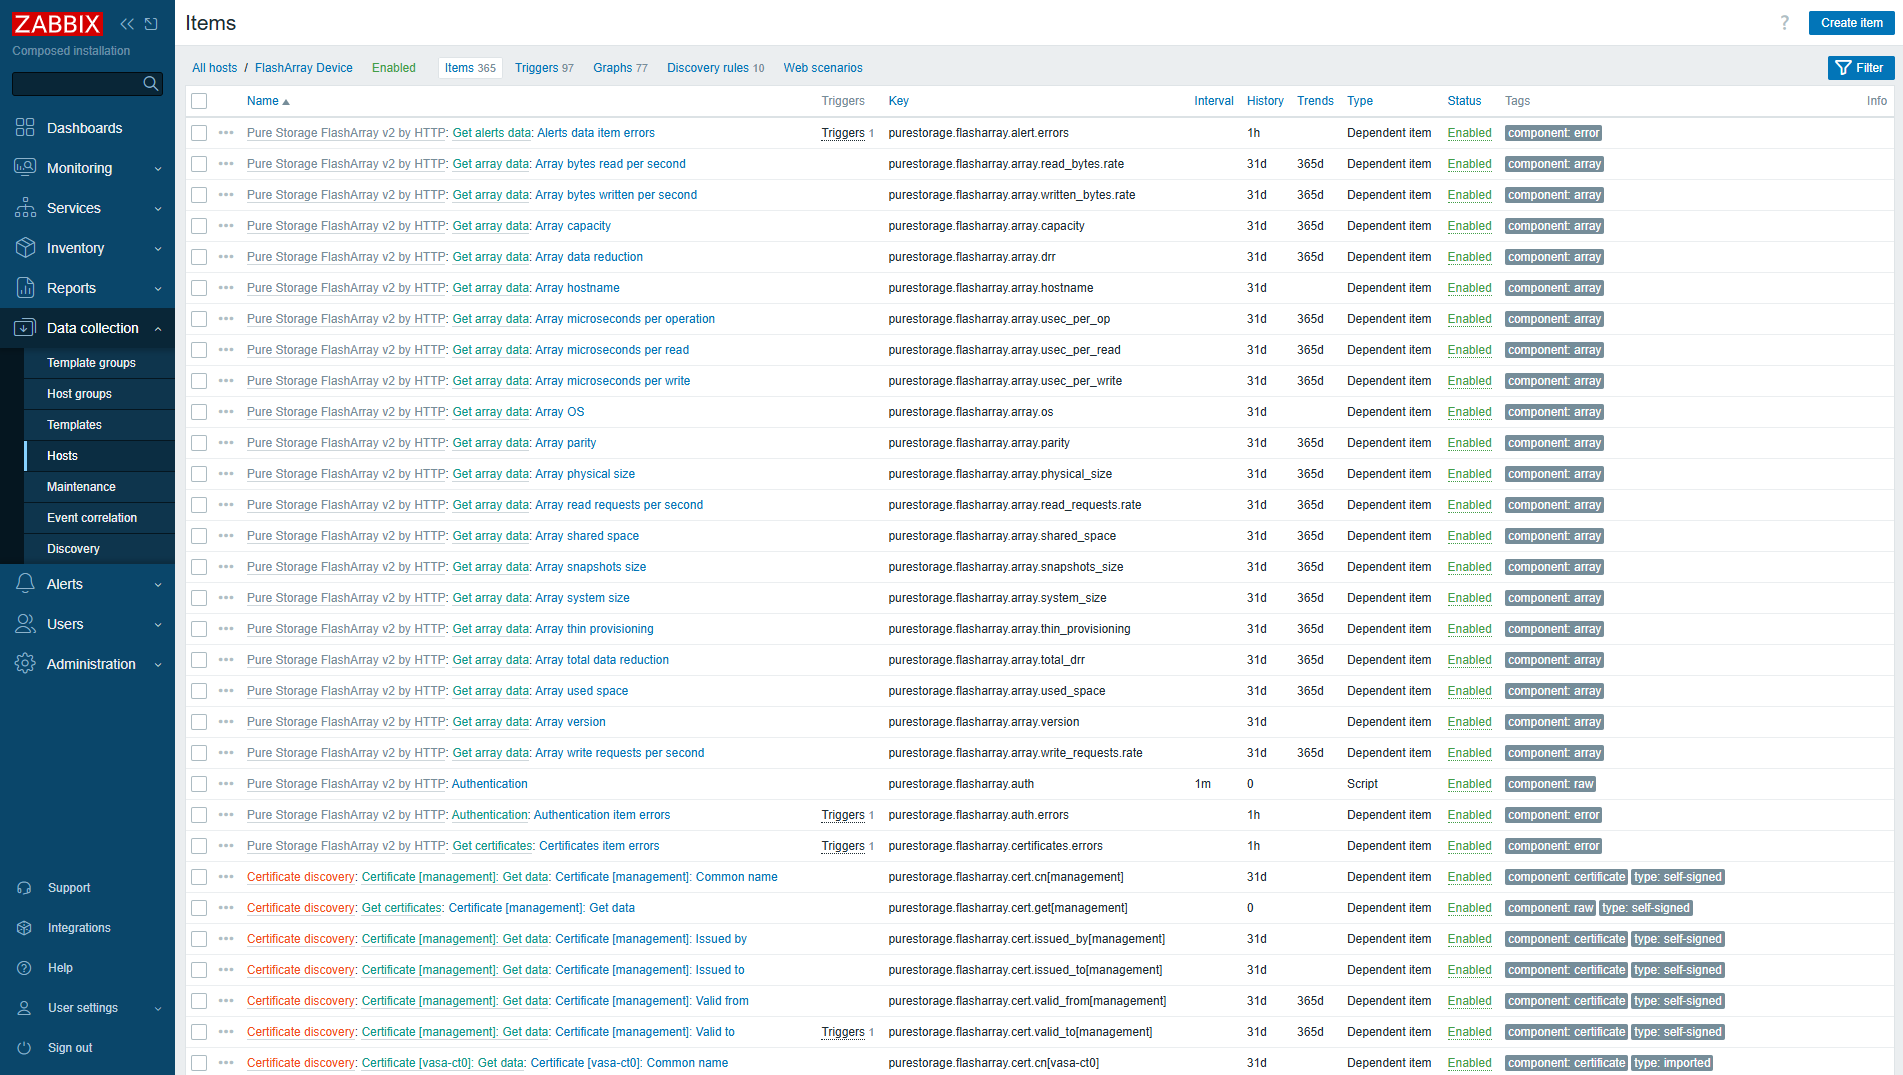
After that, you should see newly discovered items in the Items view (for example).


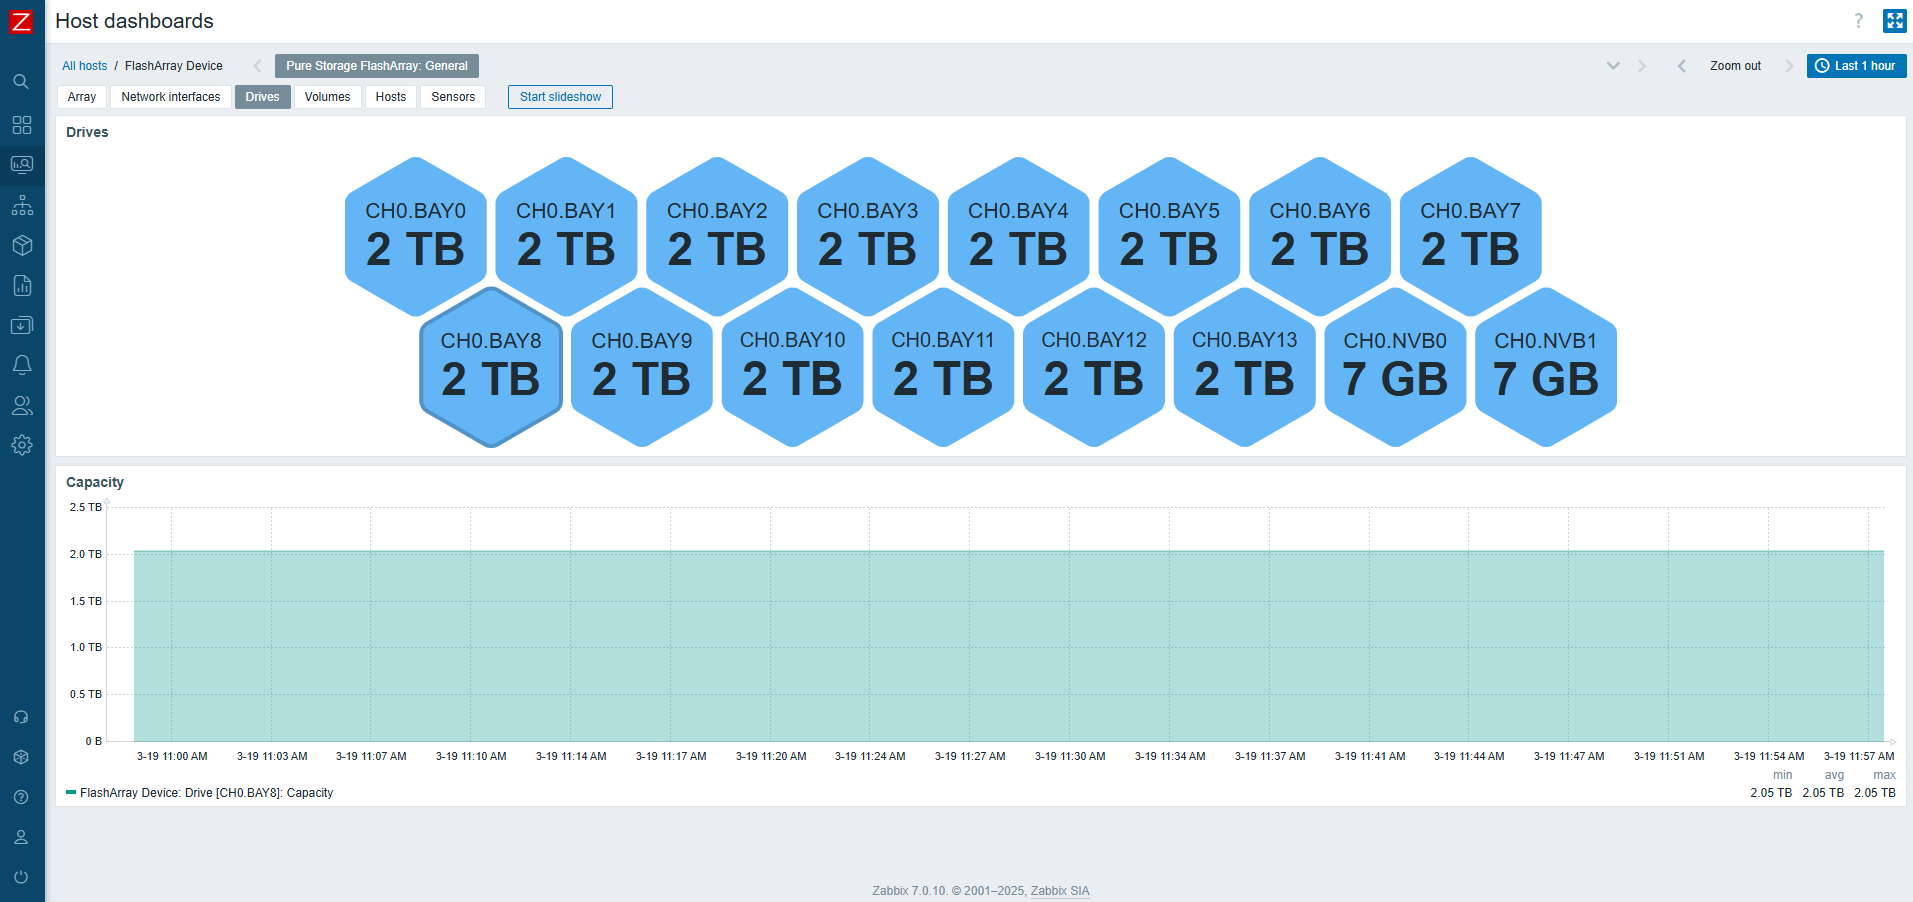
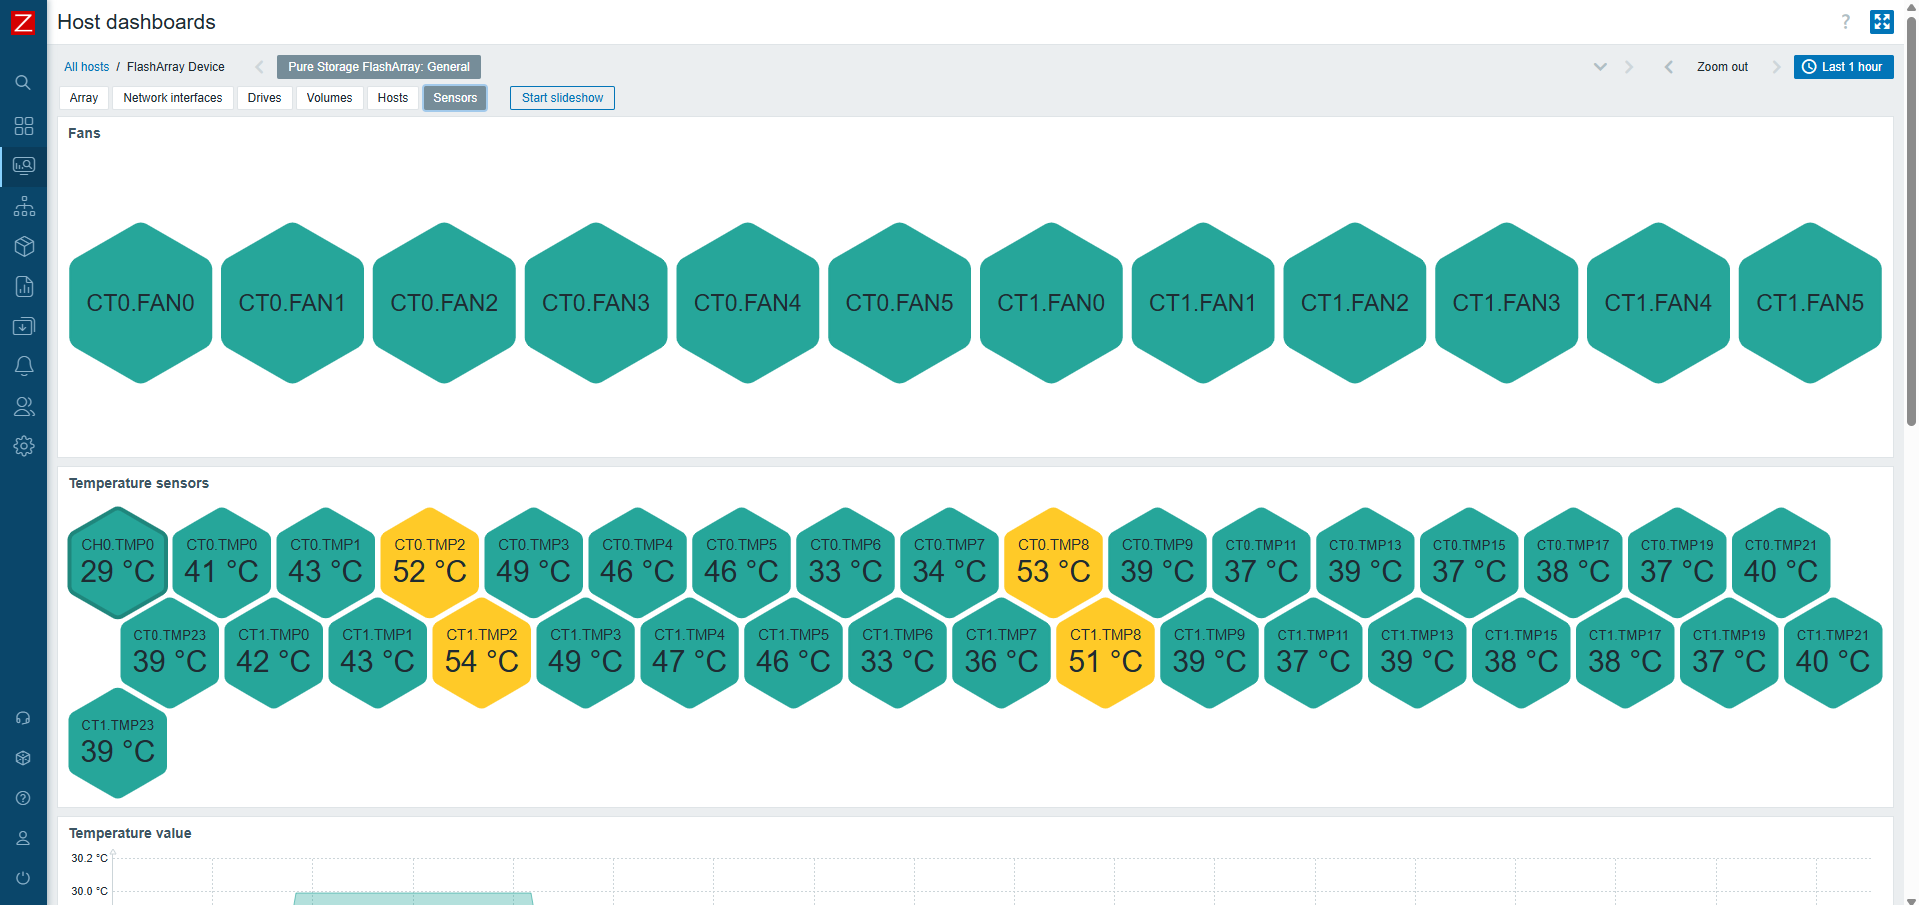
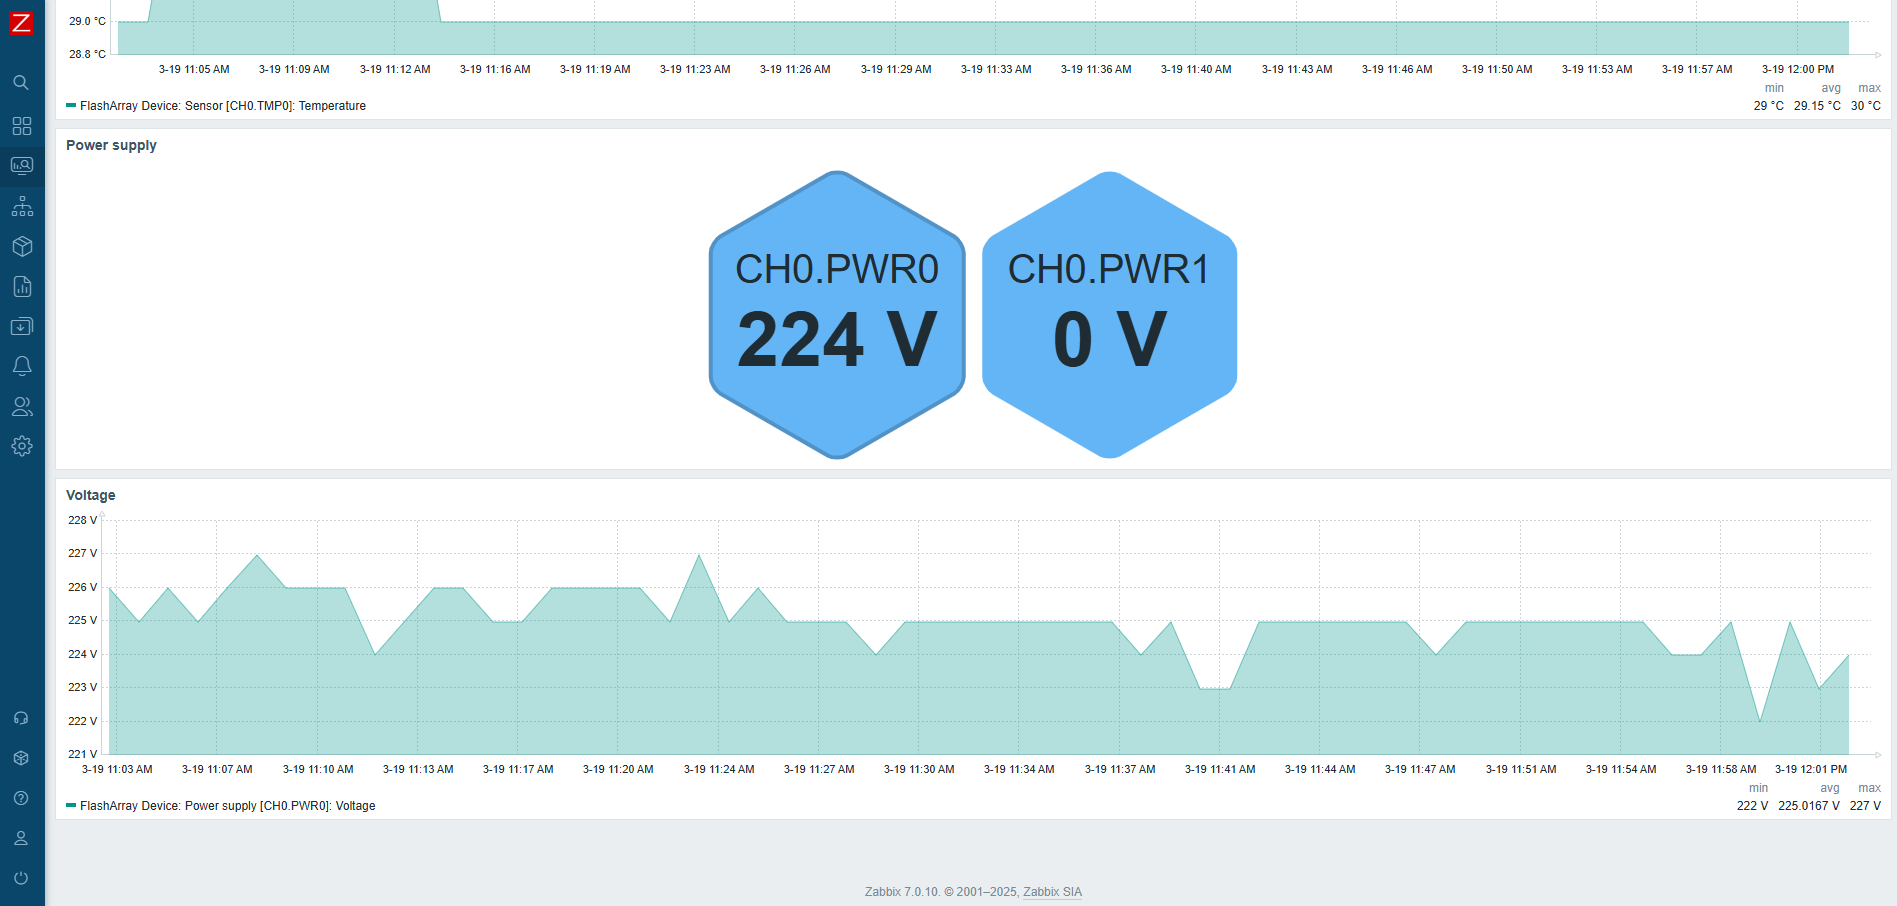
On top of that, each host will have its own dashboard created automatically that will provide you with a good overview of resource utilization.


Use macros for low-level discovery filtering

In official Zabbix templates, you might find macros that end with MATCHES and NOT_MATCHES. These are used for low-level discovery rules (LLDs), to help you filter resources that should or should not be discovered. These values use regular expressions. Therefore, you can use wildcard symbols for pattern matching.

Usage of these macros can be found in the Filters tab, under discovery rules.

The typical default value for MATCHES is .* and for NOT_MATCHES – CHANGE_IF_NEEDED. This means that any kind of value will be discovered if it is not equal to CHANGE_IF_NEEDED. For example, in Network interface discovery, filters are used to check the interface name:

  • Macro {$PURE.FLASHARRAY.NETIF.LLD.FILTER.NAME.MATCHES} has a value of .*;
  • Macro {$PURE.FLASHARRAY.NETIF.LLD.FILTER.NAME.NOT_MATCHES} has a value of CHANGE_IF_NEEDED.

You can set the value of macro {$PURE.FLASHARRAY.NETIF.LLD.FILTER.NAME.NOT_MATCHES} to filevip, which will cause an interface named filevip to not be discovered.

Now that you have an idea how these filters work, you can adjust them based on your requirements.

HTTP proxy usage

If needed, you can specify an HTTP proxy for the template to use by changing the value of the{$PURE.FLASHARRAY.HTTP_PROXY} user macro. Every request will use this proxy.

Afterword

To wrap things up, setting up monitoring for Pure Storage FlashArray devices in Zabbix is an important step that guarantees the smooth operation of your infrastructure. I hope that our new templates will help you manage and monitor your devices more effectively.

This short article has been created to provide you with the necessary knowledge and tools to set up a monitoring system that meets your specific needs. By enabling efficient monitoring, you will be better equipped to respond to changes in system performance and maintain optimal operation. I believe this material will be valuable in helping you achieve these goals! 

The post Monitoring Pure Storage FlashArray with Zabbix appeared first on Zabbix Blog.
The First Steps Toward Monitoring with Zabbix and SNMP

Post Syndicated from Zabbix LatAm original https://blog.zabbix.com/the-first-steps-toward-monitoring-with-zabbix-and-snmp/29784/

In this article, we’ll explore how to use Zabbix to monitor a MikroTik device via SNMP, using specific templates that allow you to visualize the status of interfaces and their performance. Read on to understand how to use network monitoring to ensure the correct operation and performance of devices in an infrastructure employing the SNMP protocol.

Verifying SNMP communication

Before you begin, make sure that SNMP communication is configured correctly on your MikroTik device. Also, set up an appropriate SNMP community for your equipment.

Create a host in Zabbix

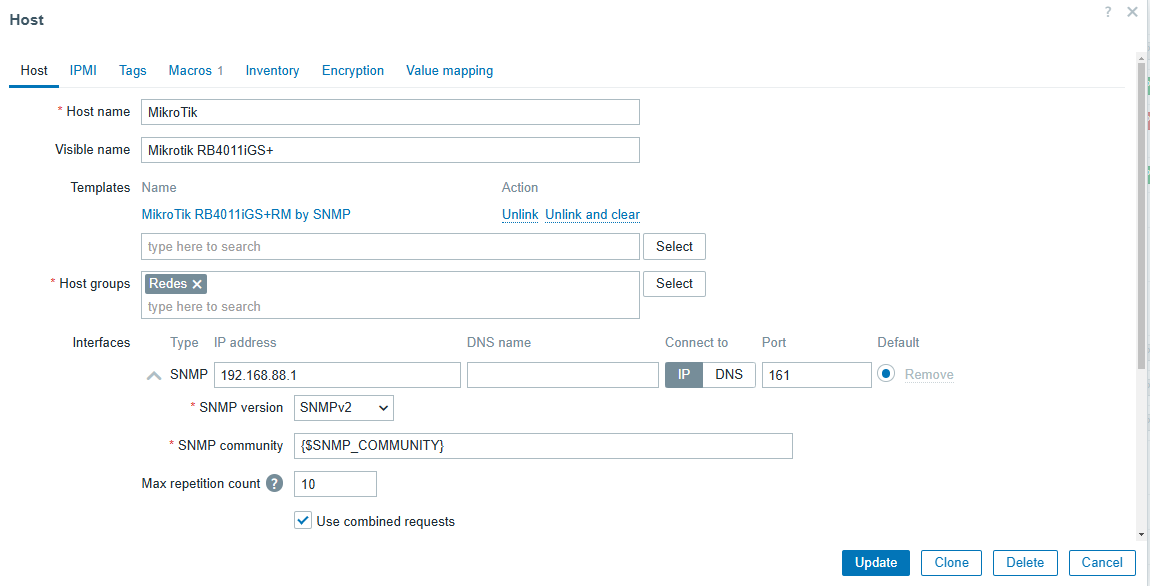
Once SNMP is configured, go to Data Collection > Hosts > Create Host.

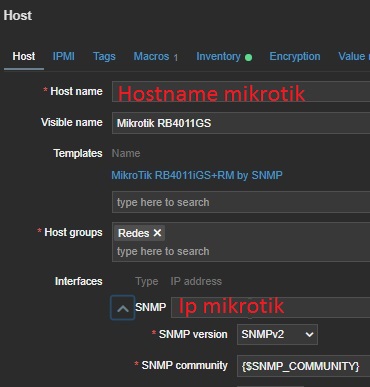
Here you will need to enter the basic details of the device, such as the name, IP, and the group it belongs to. If you are working with multiple MikroTik devices, organize the hosts into groups according to their characteristics.

Apply a template

Zabbix offers a wide variety of default templates that fit different device models. By selecting the appropriate template for your MikroTik device, you will be able to view all its resources efficiently.

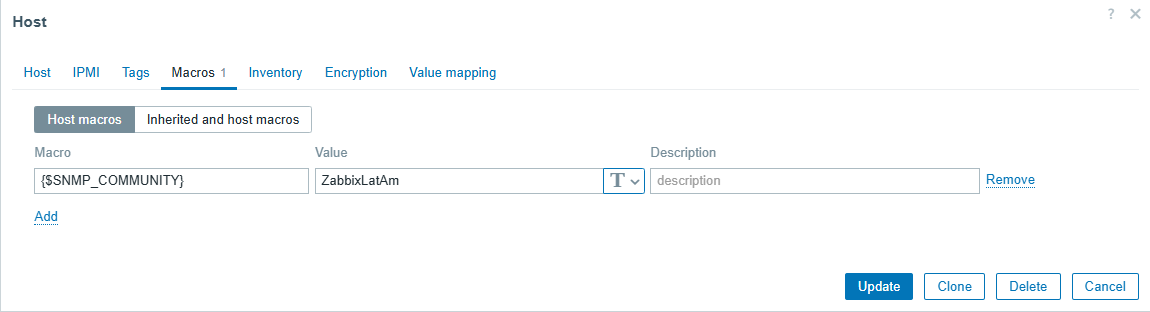
Configure SNMP macros

In the Macros section, specify the SNMP community you previously configured on your MikroTik.

Then, click “Update” to save the changes. This configuration will allow Zabbix to access the device data.

If you are monitoring multiple devices using the same SNMP community, it is best to configure a global macro in the path Administration > Macros.

This will allow you to efficiently manage a network of devices without having to configure them individually.


Visualization and monitoring

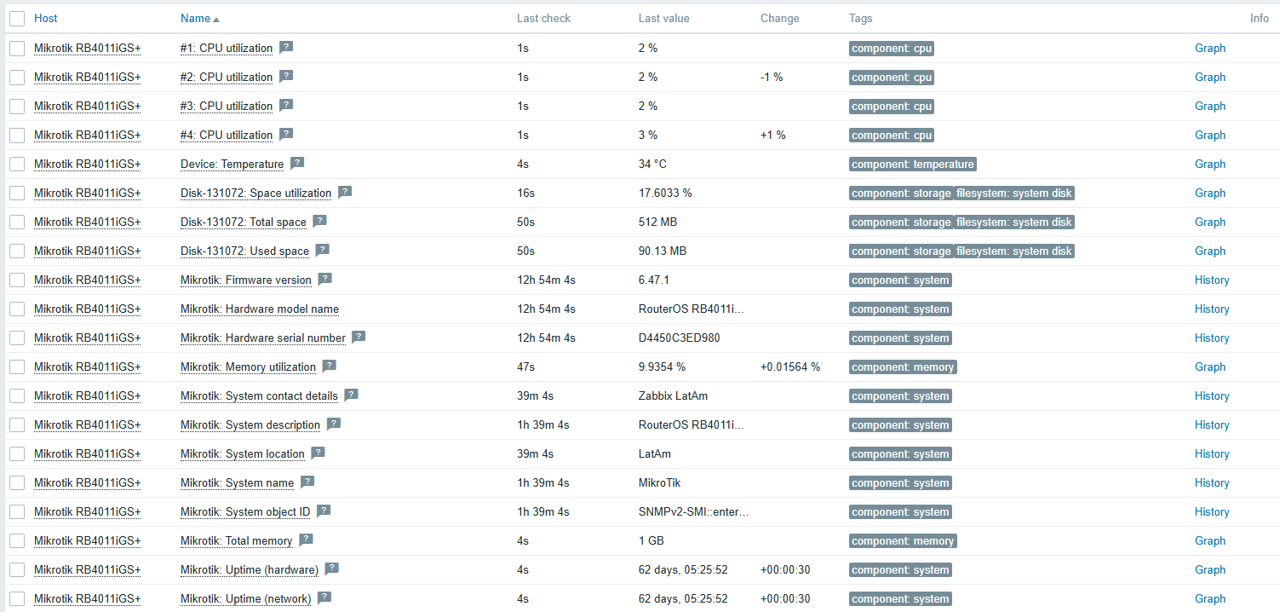
After completing the above steps, you will be able to start viewing device information directly in Zabbix, including:

Overall device performance:

Connected interfaces:

Items

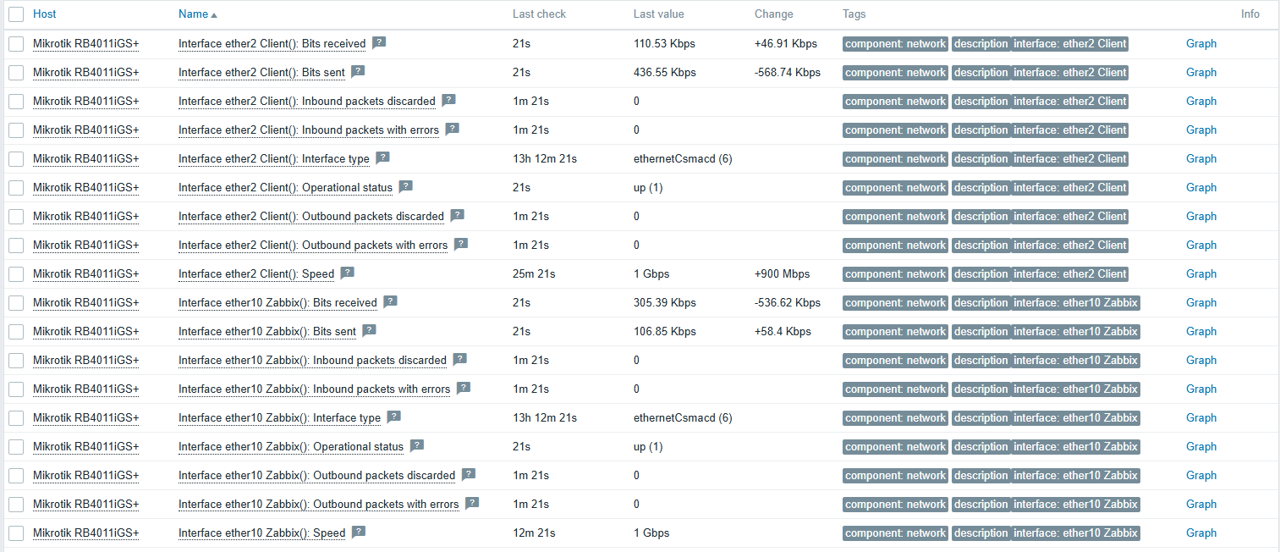
Zabbix can capture a new interface automatically at defined intervals. This makes it easy to monitor a new interface without the need to include it manually, thanks to the Network Interfaces Discovery functionality.

To analyze the status, we can go to Data Collection > Hosts, find our MikroTik device, and select Items.

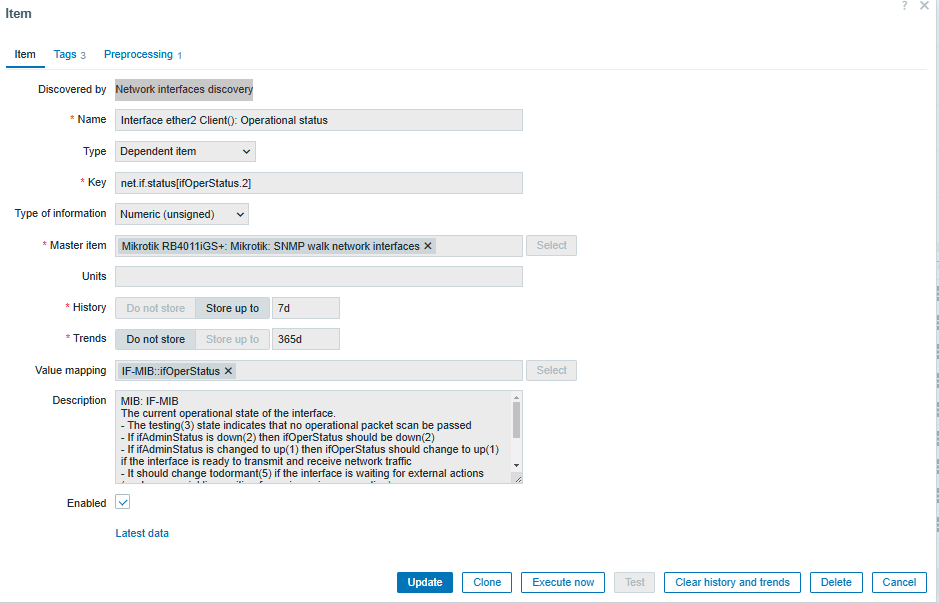
In this section, we can observe interface 2 of our client, which appears as a dependent item. This means that there is a master item that collects data through MIBs, which are network information databases. These items in the description section provide much more detailed and technical information about their functionality.

Configuration of specific items for interfaces

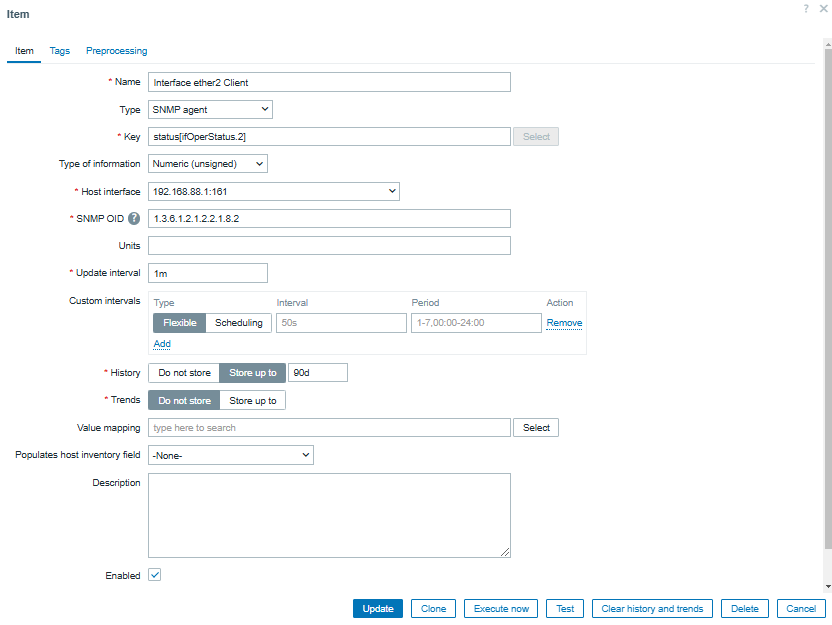
If we want to create a specific item, we must access Data Collection > Hosts > Create Item.

We must also assign a name that identifies SNMP Agent, specify the key that identifies the parameter to be monitored, analyze the corresponding MIB to capture the OID, and define the metrics capture interval according to our monitoring needs.

To validate the OID using snmpwalk, it returns the information of the MIB IF-MIB::ifOperStatus.2, which represents the interface status.

Configuration of custom triggers

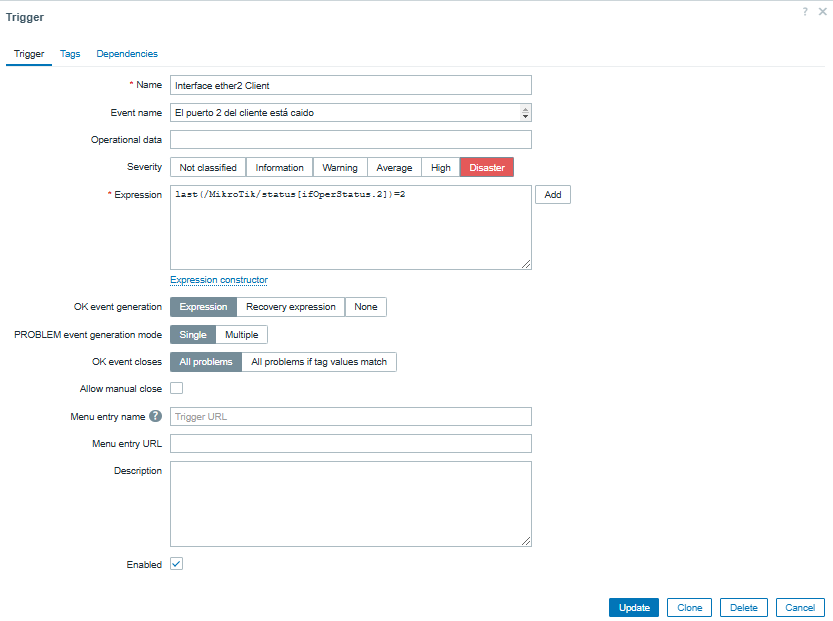
To configure a trigger to alert us about the status of the interface, we go to Data Collection > Hosts > Triggers > Create Trigger.

Then, we assign a descriptive name to the trigger (either manually or by using macros), define the event that will trigger the alert, set the appropriate severity, and create a logical expression that determines the status.

State 2 → The interface is down.

Status 1 → The interface is operational.

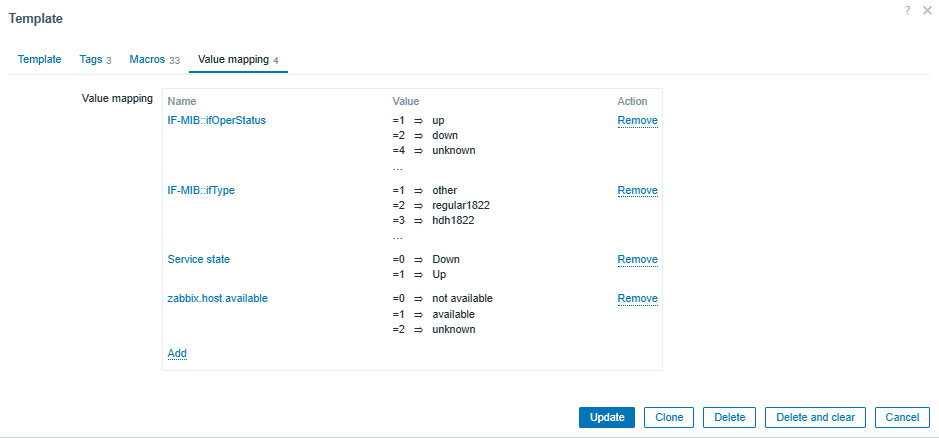
To correctly interpret SNMP values in Zabbix, we go to Data Collection > Templates > MikroTik RB4011iGS+RM by SNMP > Value Mapping.

From here, we can observe the values returned by SNMP and configure our triggers based on them.

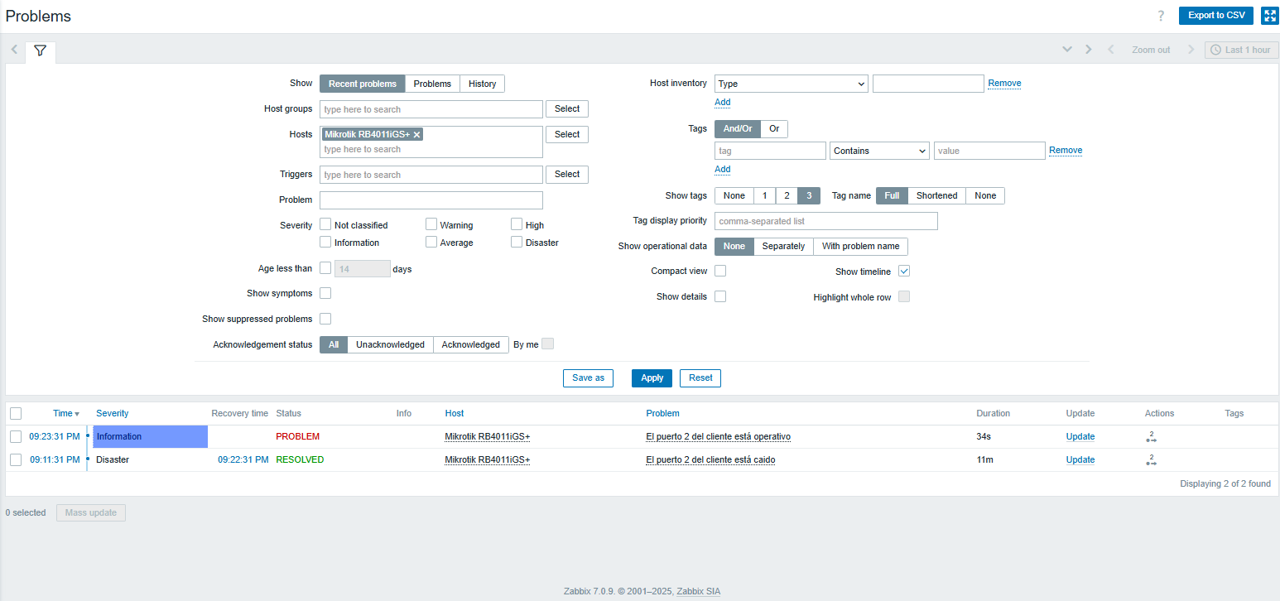
Finally, we can test our configuration in Monitoring > Problems, where we can see the triggers running.

Advantages of using SNMP with Zabbix

Using Zabbix as a monitoring tool not only facilitates network management, but also allows you to monitor third-party applications that use the SNMP protocol.

Its flexibility, together with the wide range of templates and configurations, make it the best choice for optimizing resources and ensuring stable performance in your infrastructure.


The post The First Steps Toward Monitoring with Zabbix and SNMP appeared first on Zabbix Blog.
Monitoring VMware vSphere with Zabbix

Post Syndicated from Mateusz Romaniuk original https://blog.zabbix.com/monitoring-vmware-vsphere-with-zabbix/29193/

Zabbix is an open-source monitoring tool designed to oversee multiple IT infrastructure components, including networks, servers, virtual machines, and cloud services. It operates using both agent-based and agentless monitoring methods. Agents can be installed on monitored devices to collect performance data and report back to a centralized Zabbix server.

Zabbix provides comprehensive integration capabilities for monitoring VMware environments, including ESXi hypervisors, vCenter servers, and virtual machines (VMs). This integration allows administrators to effectively track performance metrics and resource usage across their VMware infrastructure.

In this post, I will show you how to set up Zabbix monitoring with a VMware vSphere infrastructure.

Requirements:

  • Zabbix server
  • Access to the VMware vCenter Server

Step one: Create a Zabbix service user in the vCenter

First things first, let’s create a service user on the vCenter that will be used by the Zabbix server to collect data. To make life easier, in my lab setup the user [email protected] will have full Administrator privileges. Read-only permissions should be enough, however.

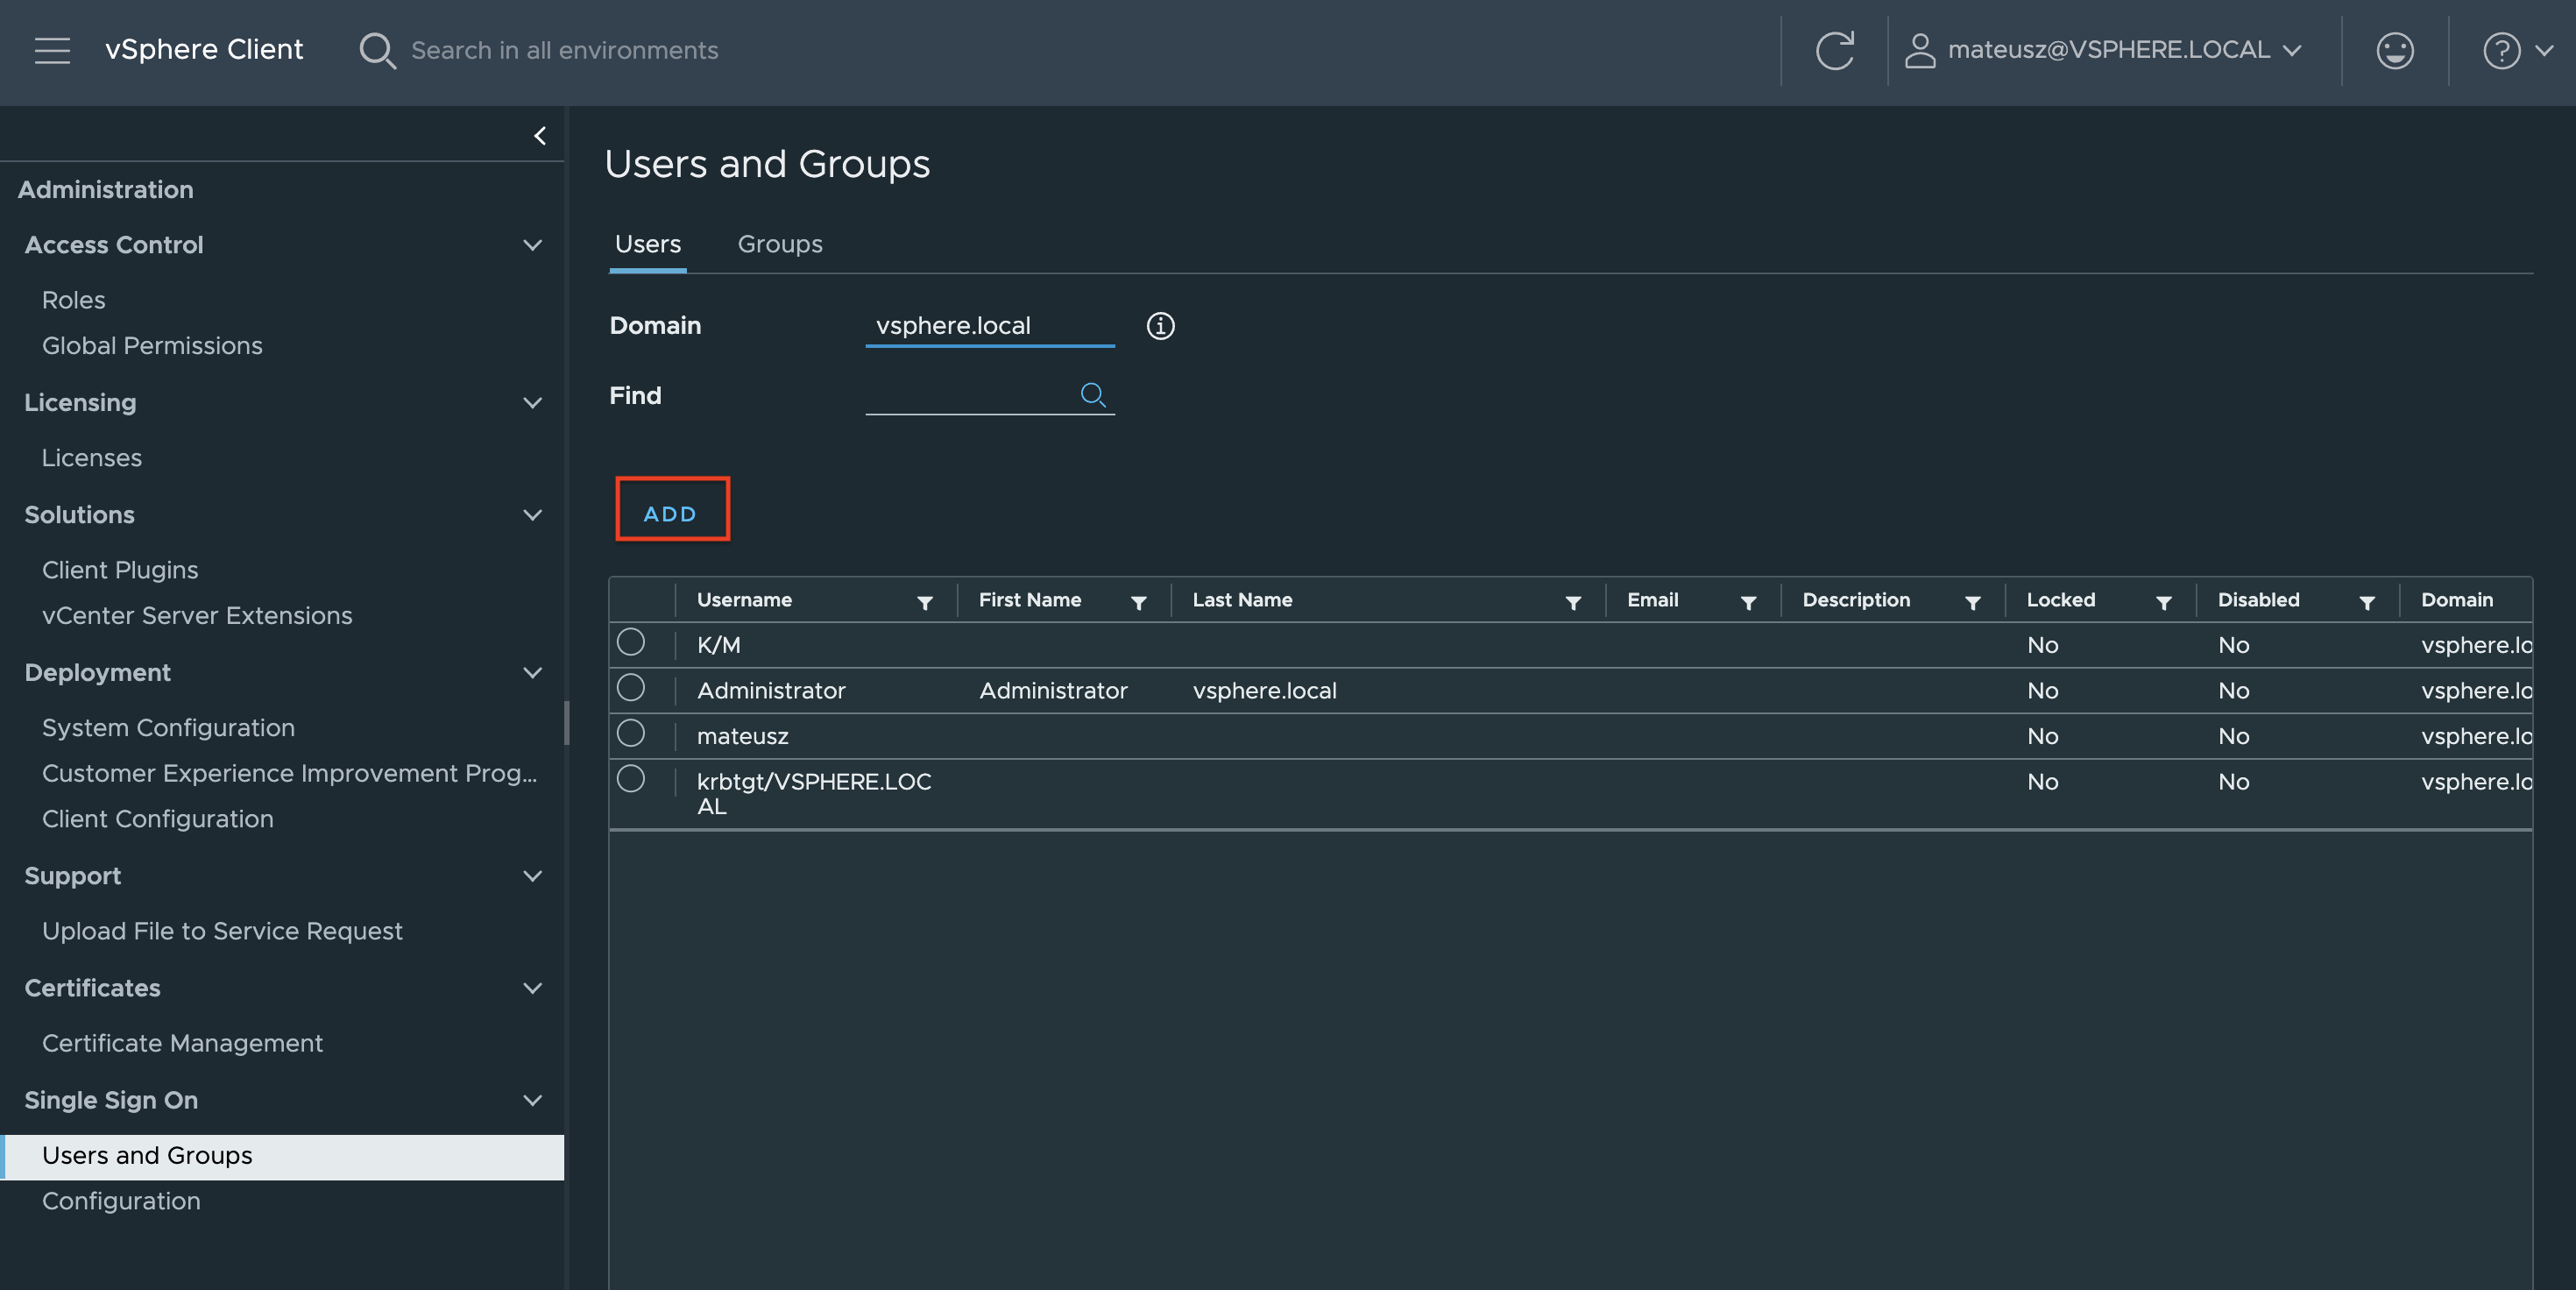
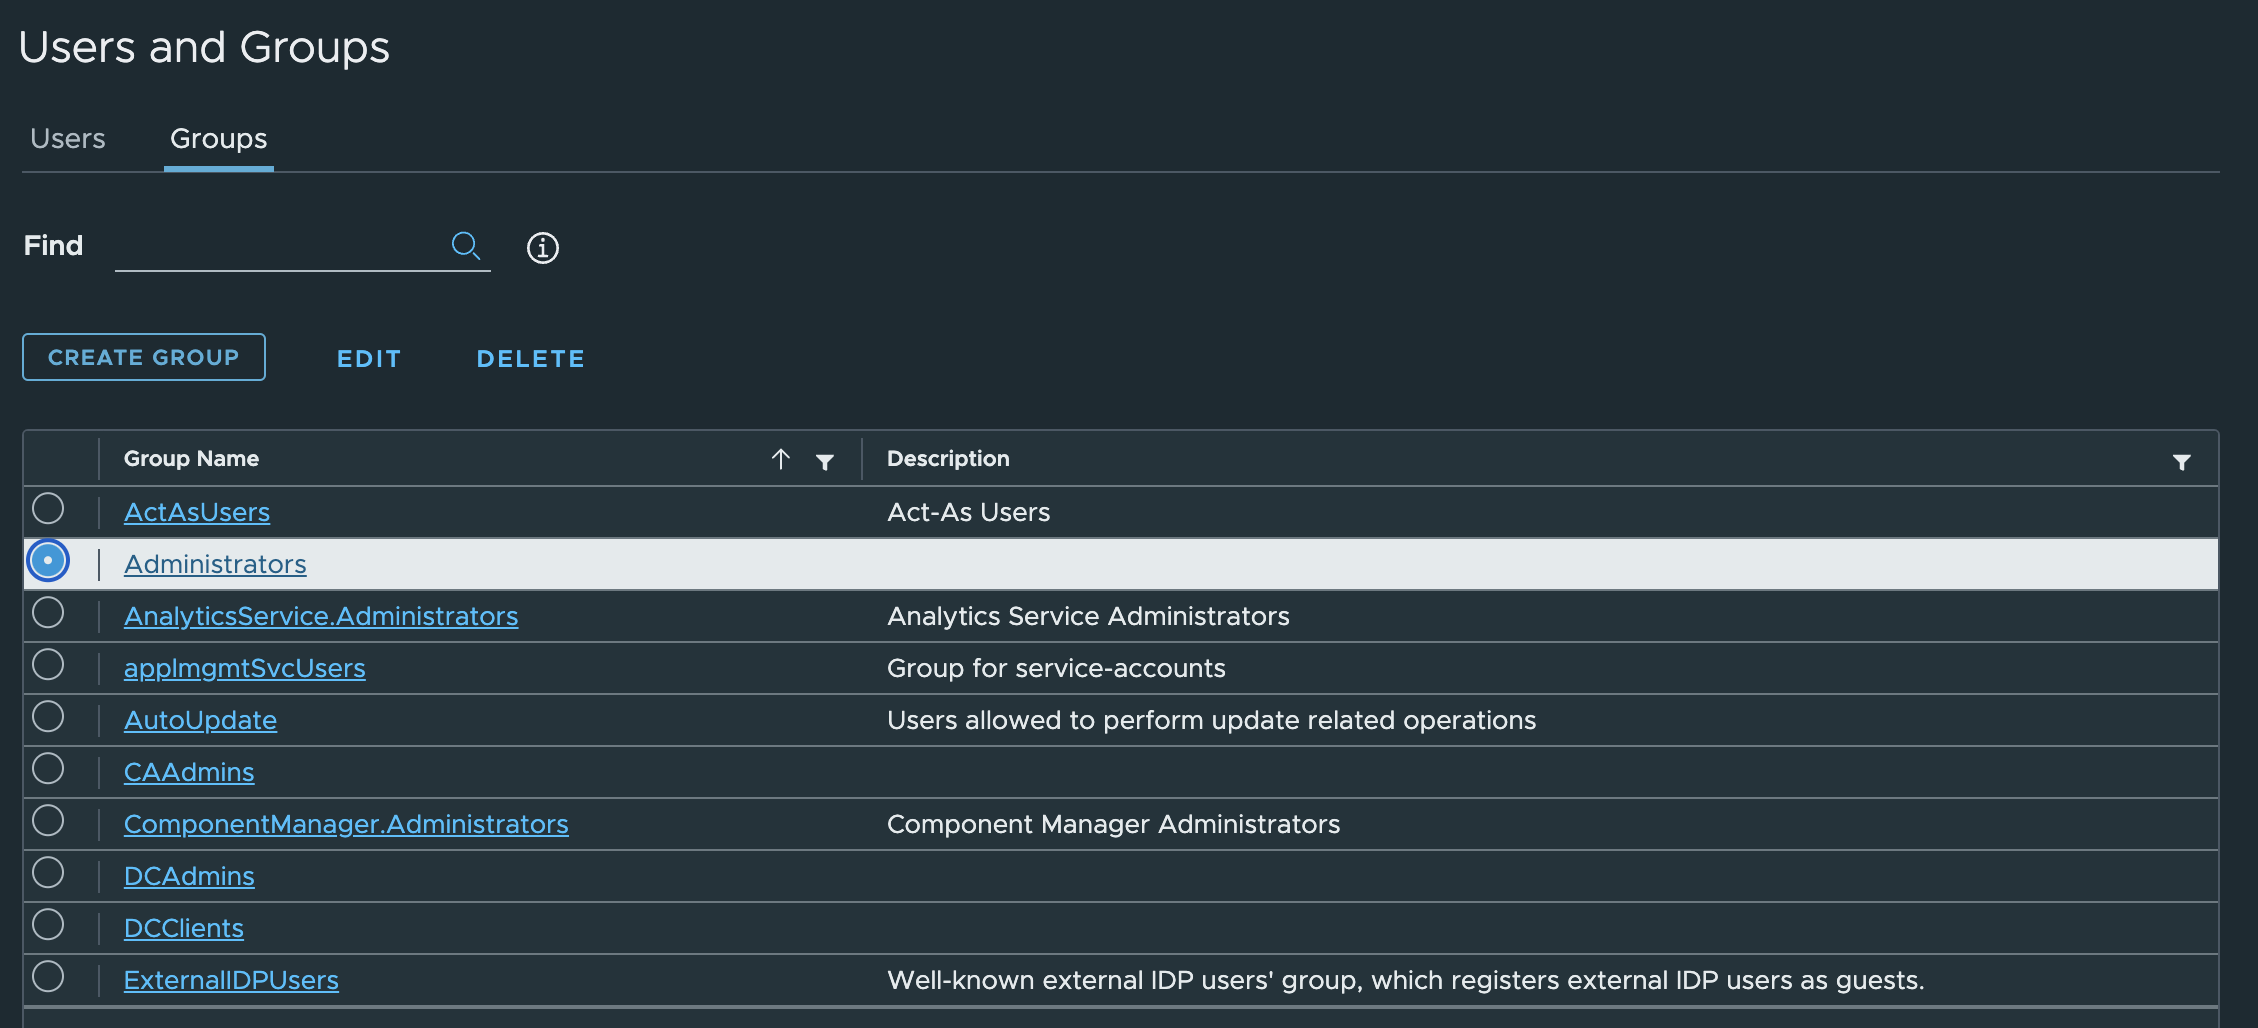
1. In the vSphere Client, choose Menu -> Administration -> Users and Groups. From the Users tab, select Domain vsphere.local, and click the ADD button to add a new user.

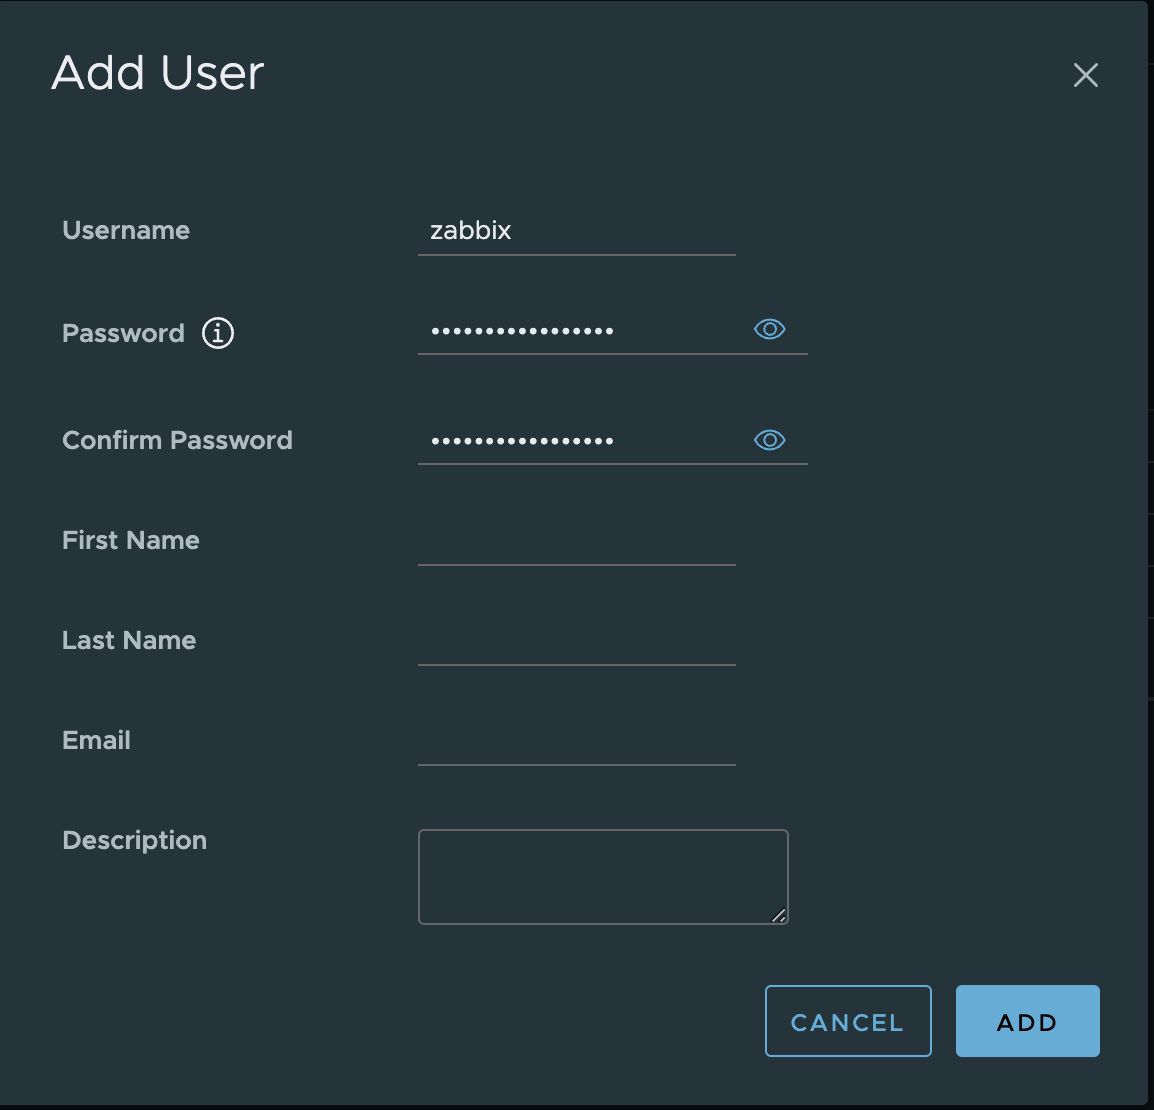
2. Type a username and password. Click ADD to create a new user.

3. Change the tab to Groups and select the Administrators group.

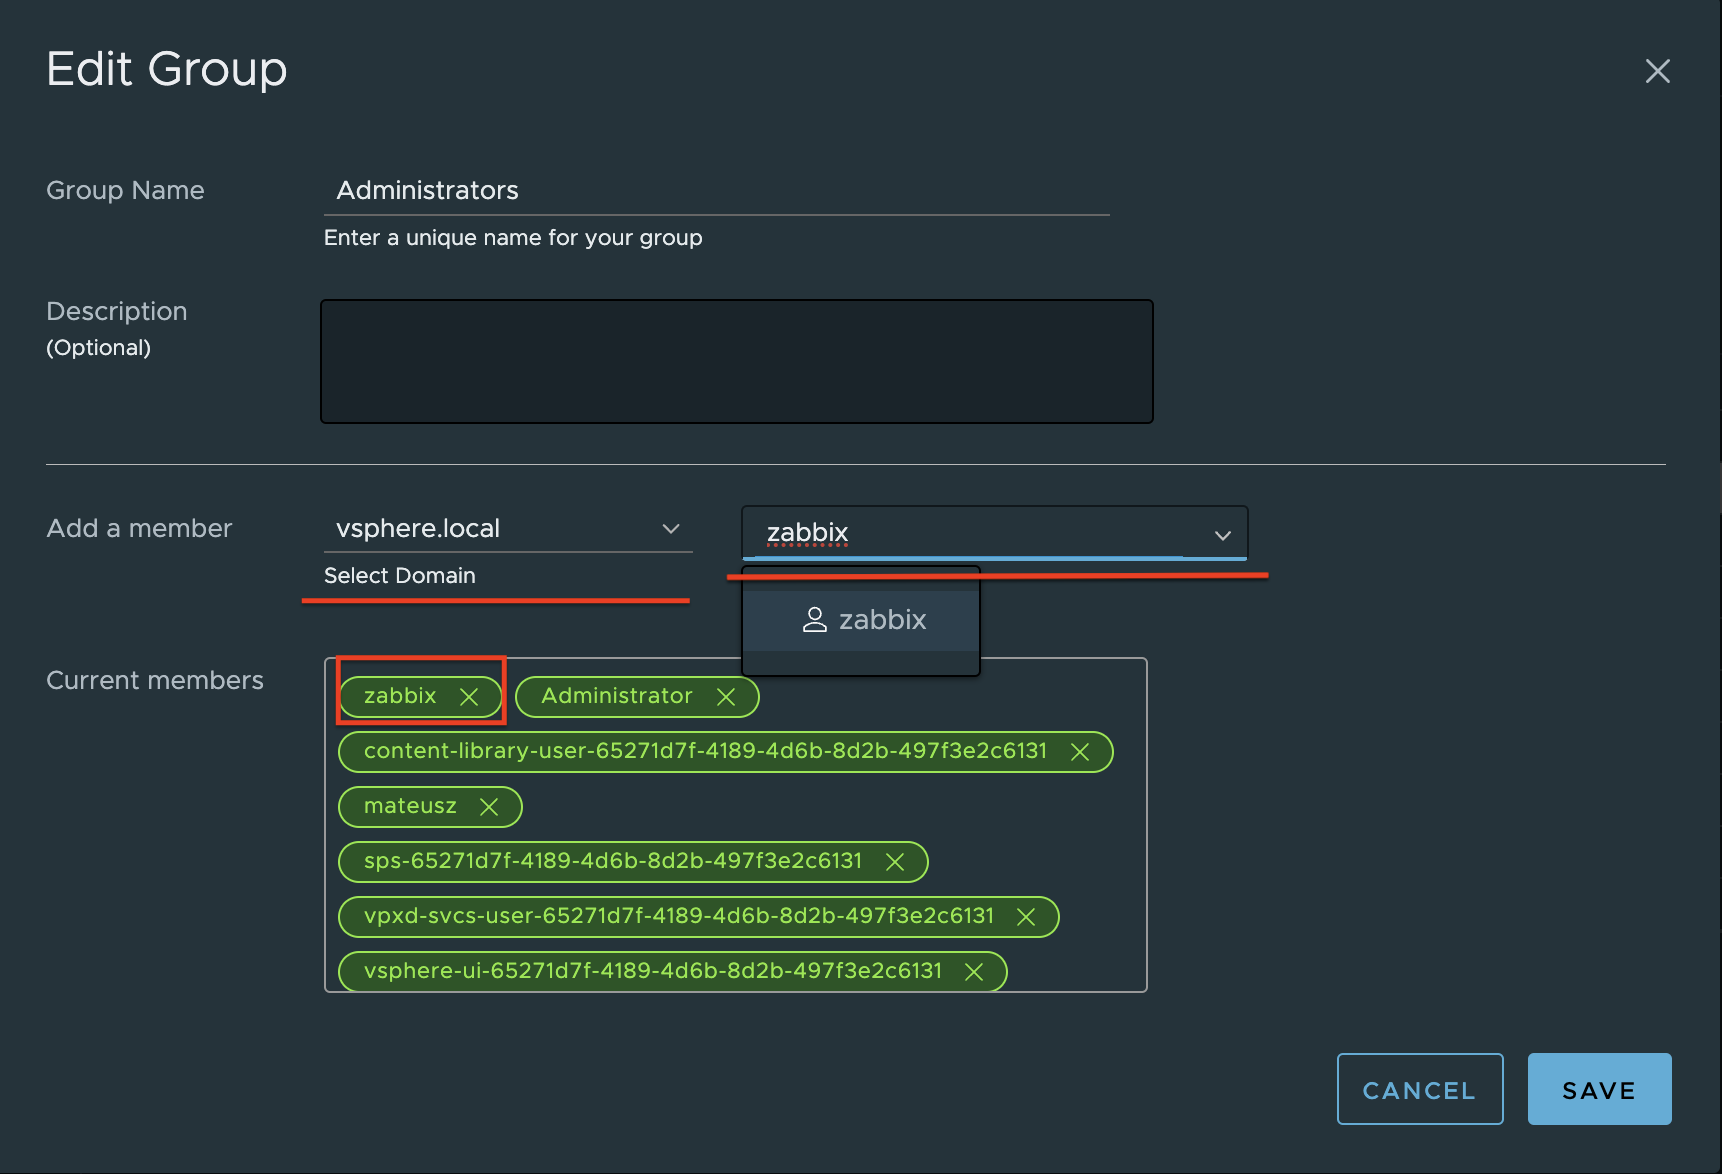
4. Find a new user zabbix, click on it and save. The user is added to the Administrators group.

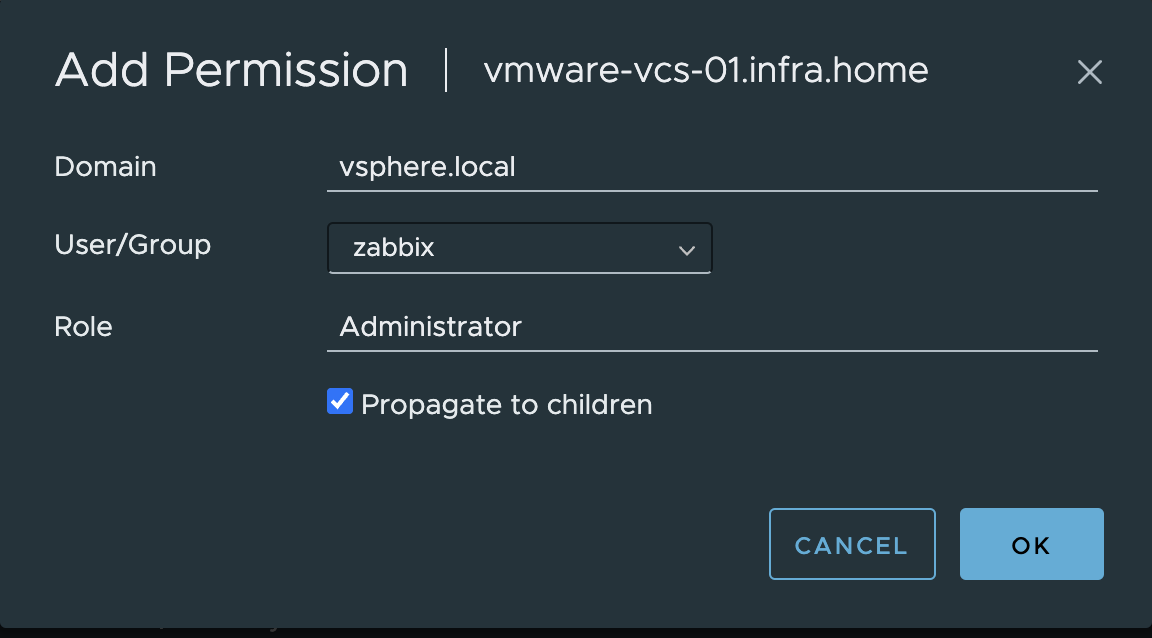
5. From the Host and Clusters view, choose vCenter name and go to the Permissions tab. Click the Add button.

6. Choose a proper domain (vsphere.local), find the user zabbix, set the role to Administrator, and check Propagate to children. Click OK to give those permissions.

Step two: Make changes on the Zabbix server

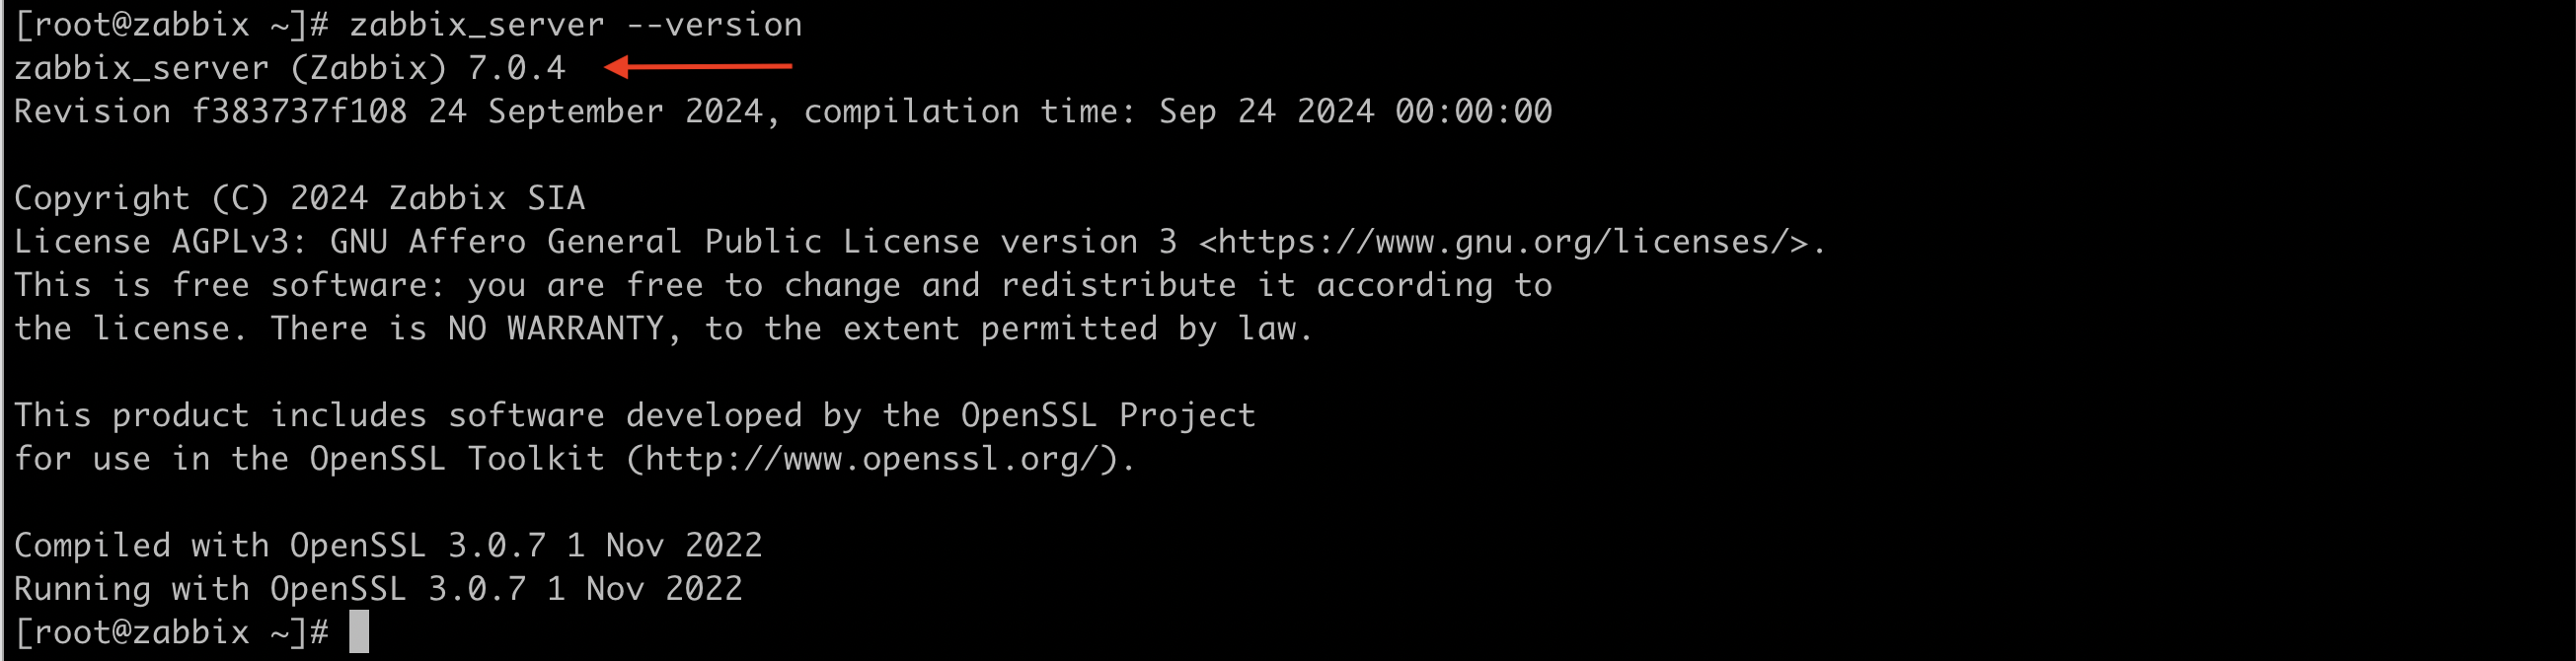
Next, we need to edit zabbix_server.conf. In this file we need to enable the vmware collector process. It’s necessary to start VMware monitoring. FYI, I have installed Zabbix server in version 7.0.4.

1. Edit a configuration file zabbix_server.conf

vim /etc/zabbix/zabbix_server.conf

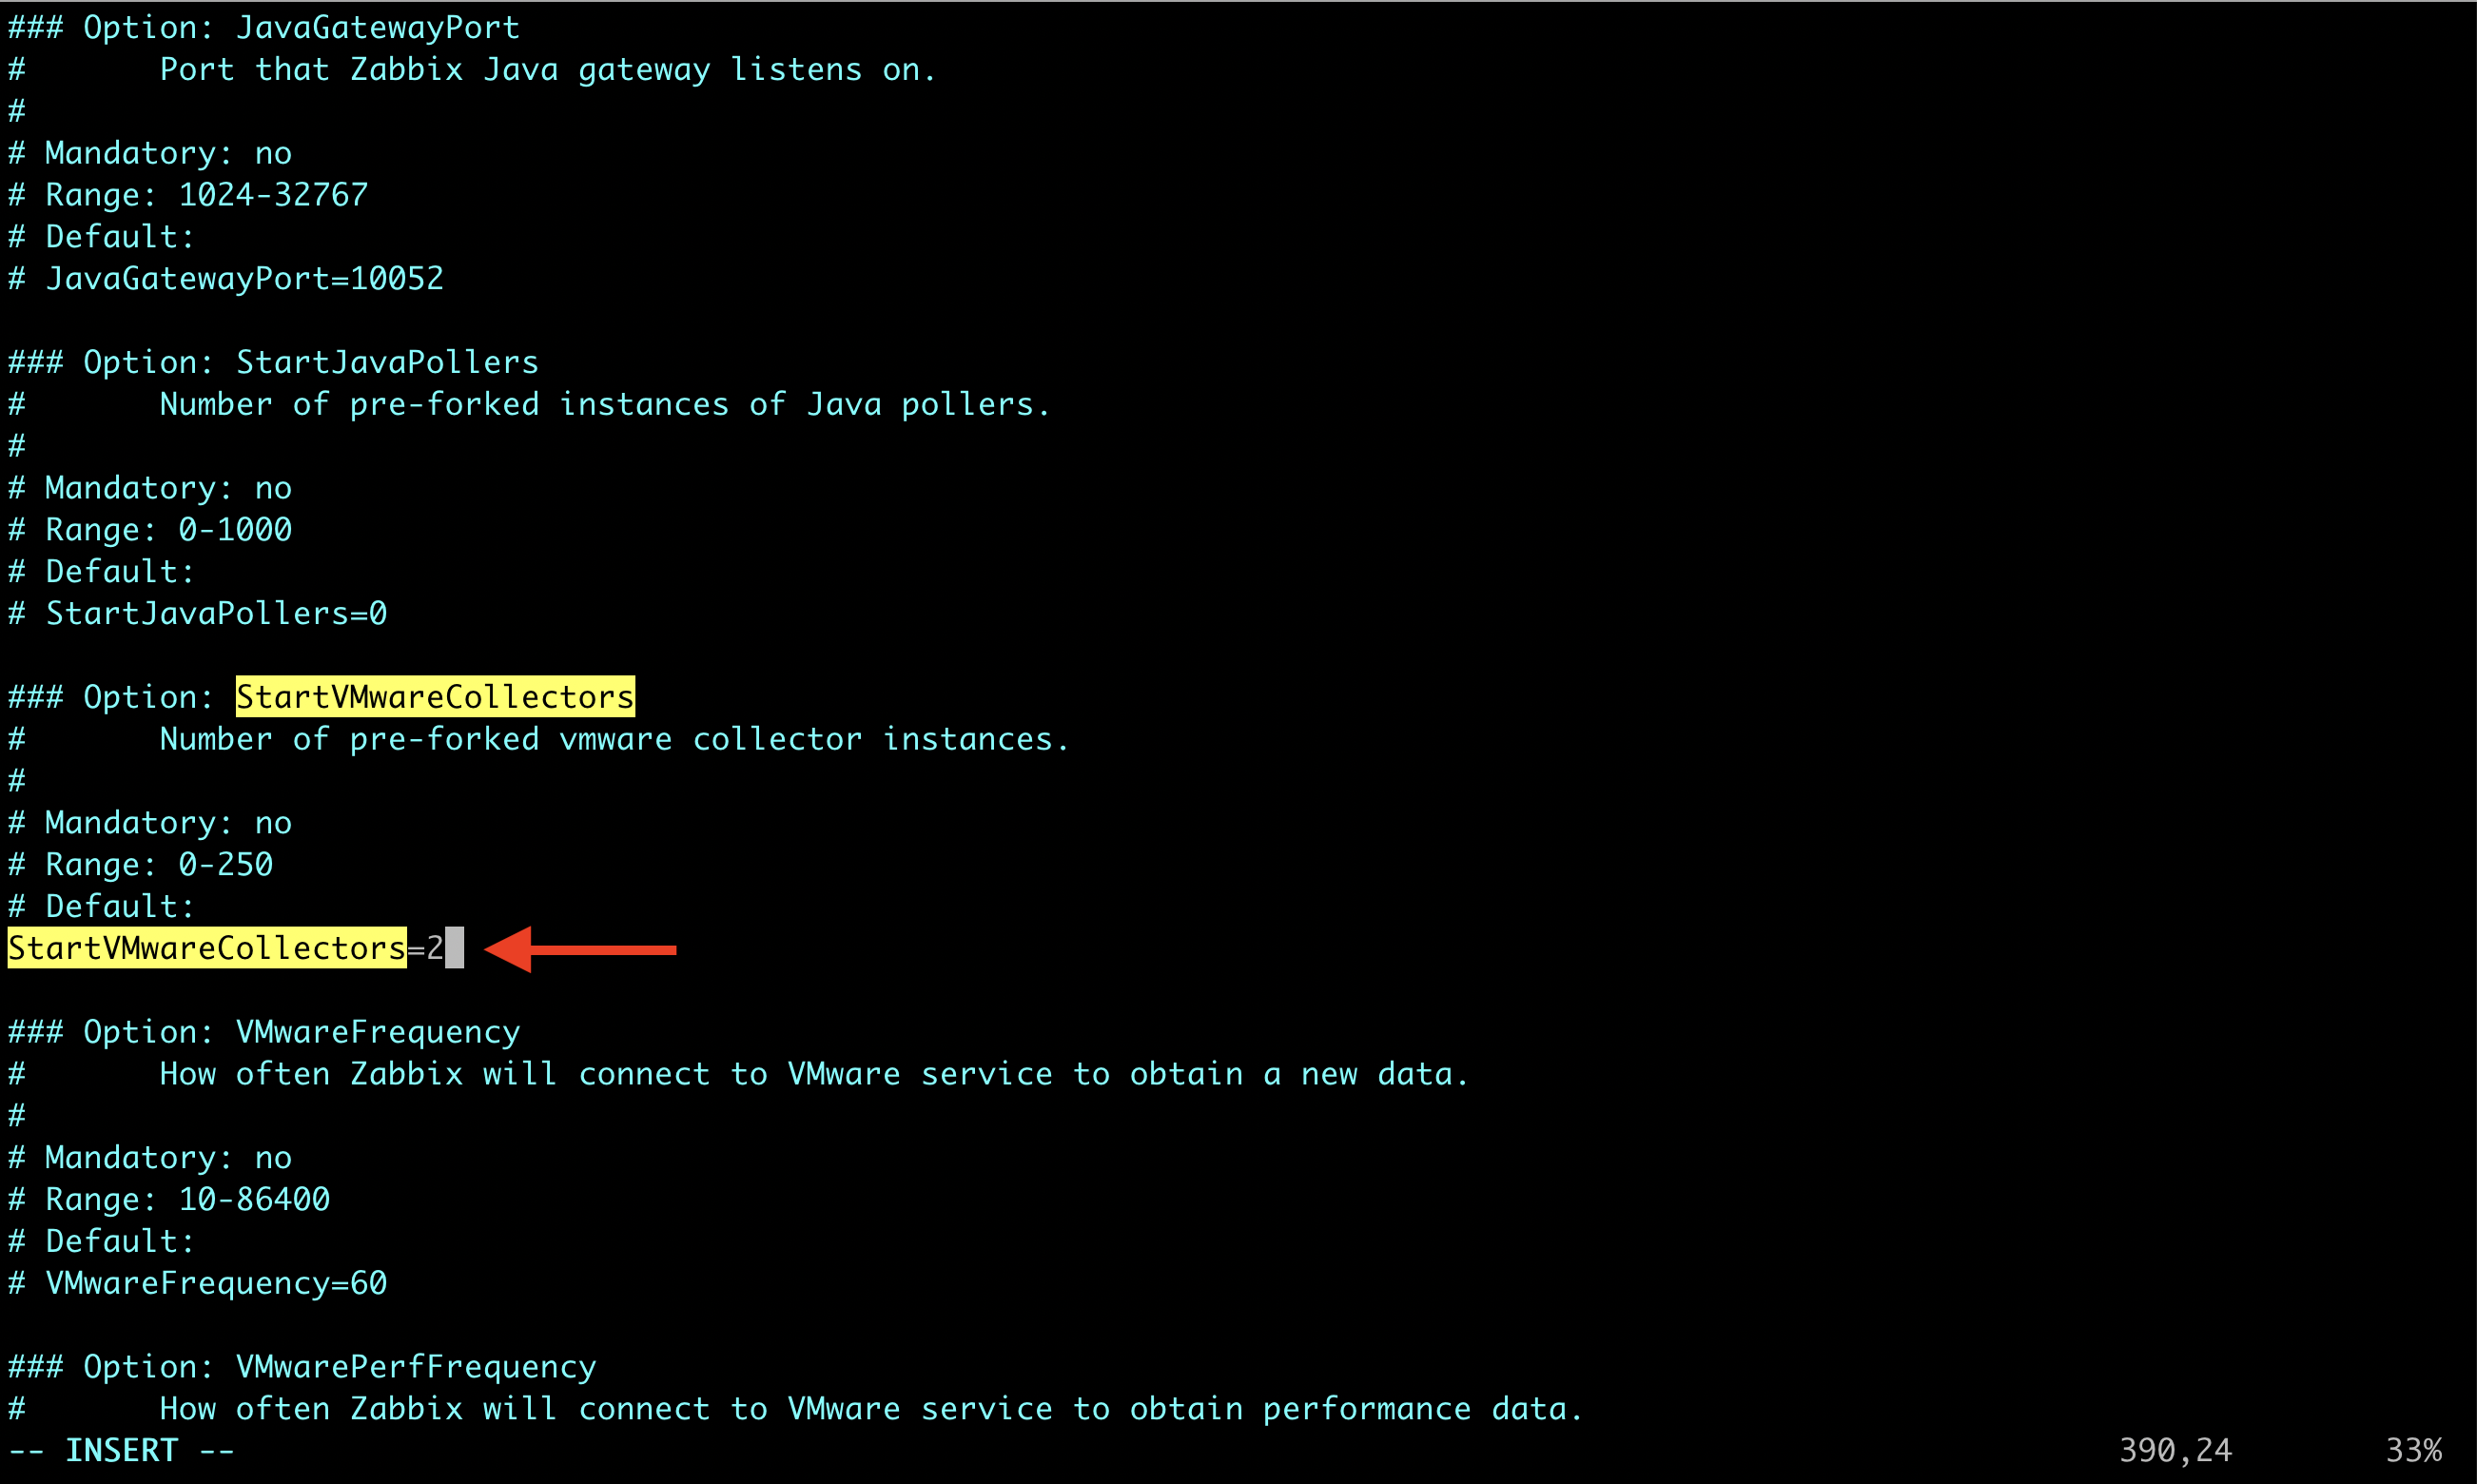
2. Find the StartVMwareCollectors parameter, delete “#” before it and change the value from 0 to at least 2. Save the file and exit.

Except for StartVMwareCollectors which is mandatory, it’s possible to enable and modify additional VMware parameters. You can find more details about them HERE.
VMwareCacheSize
VMwareFrequency
VMwarePerfFrequency
VMwareTimeout

3. Restart the zabbix-server service.

systemctl restart zabbix-server

Step three: Configure the VMware template on Zabbix

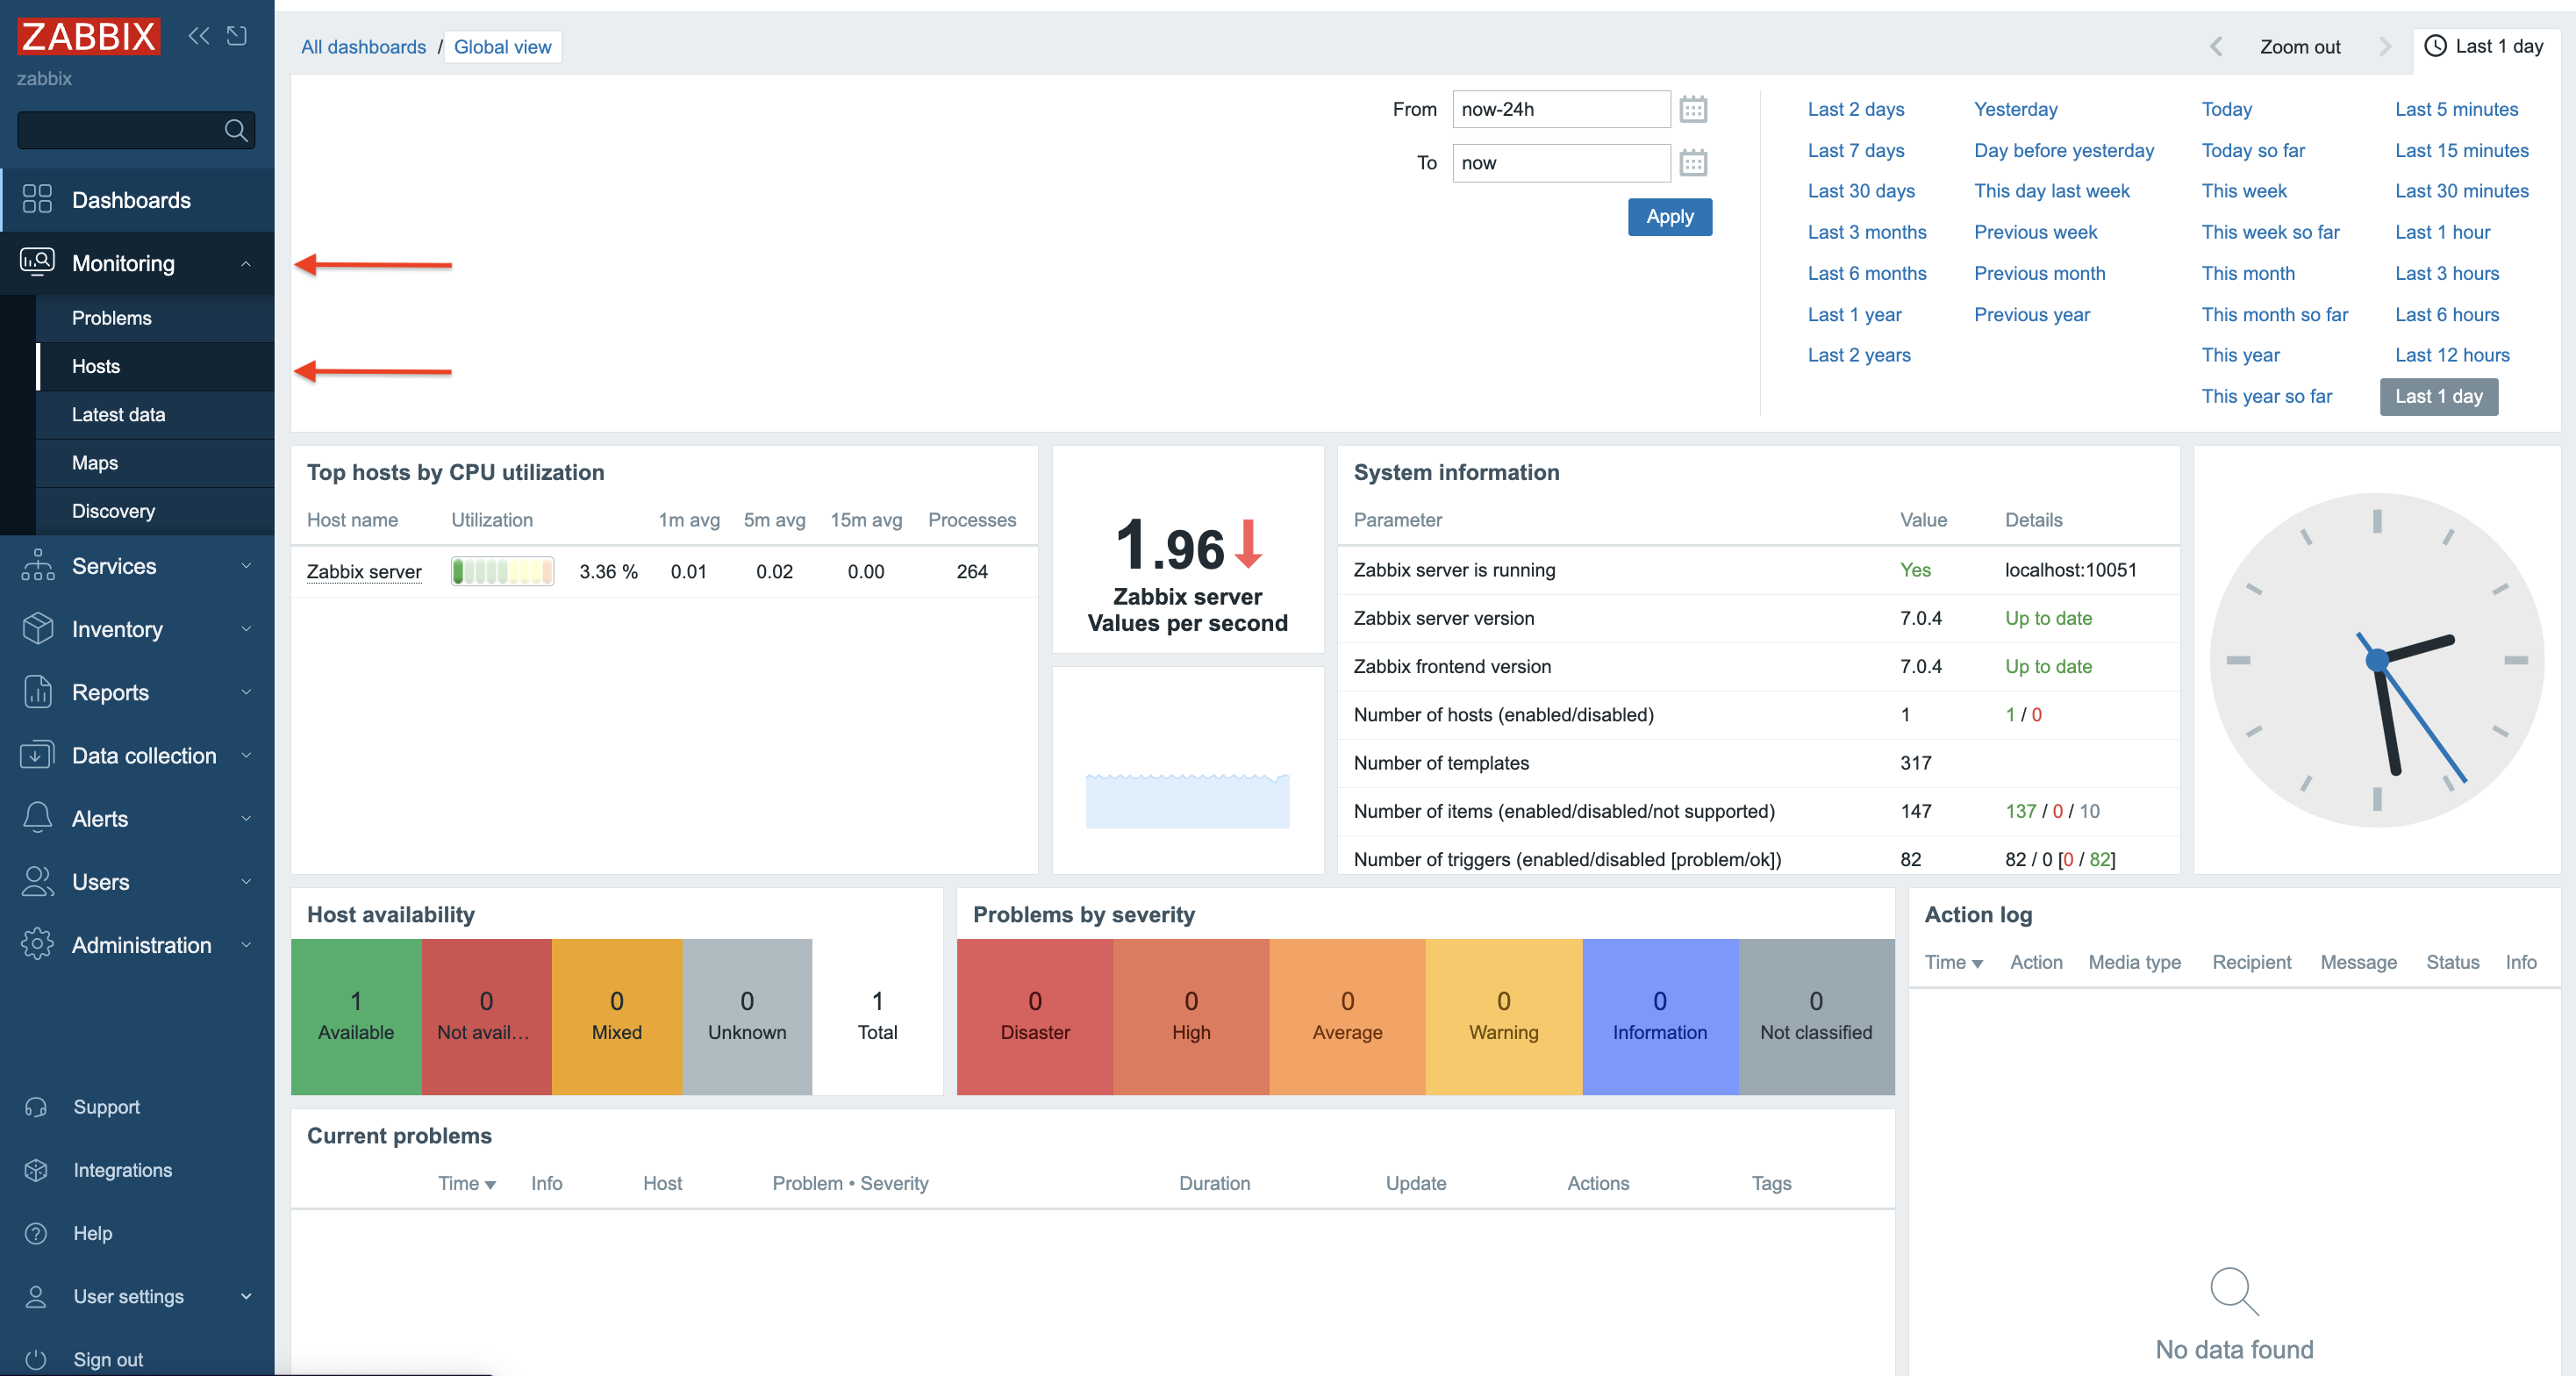
1.Log in to the Zabbix server via GUI – http://zabbix_server/zabbix. Go to the Hosts section under the Monitoring tab.

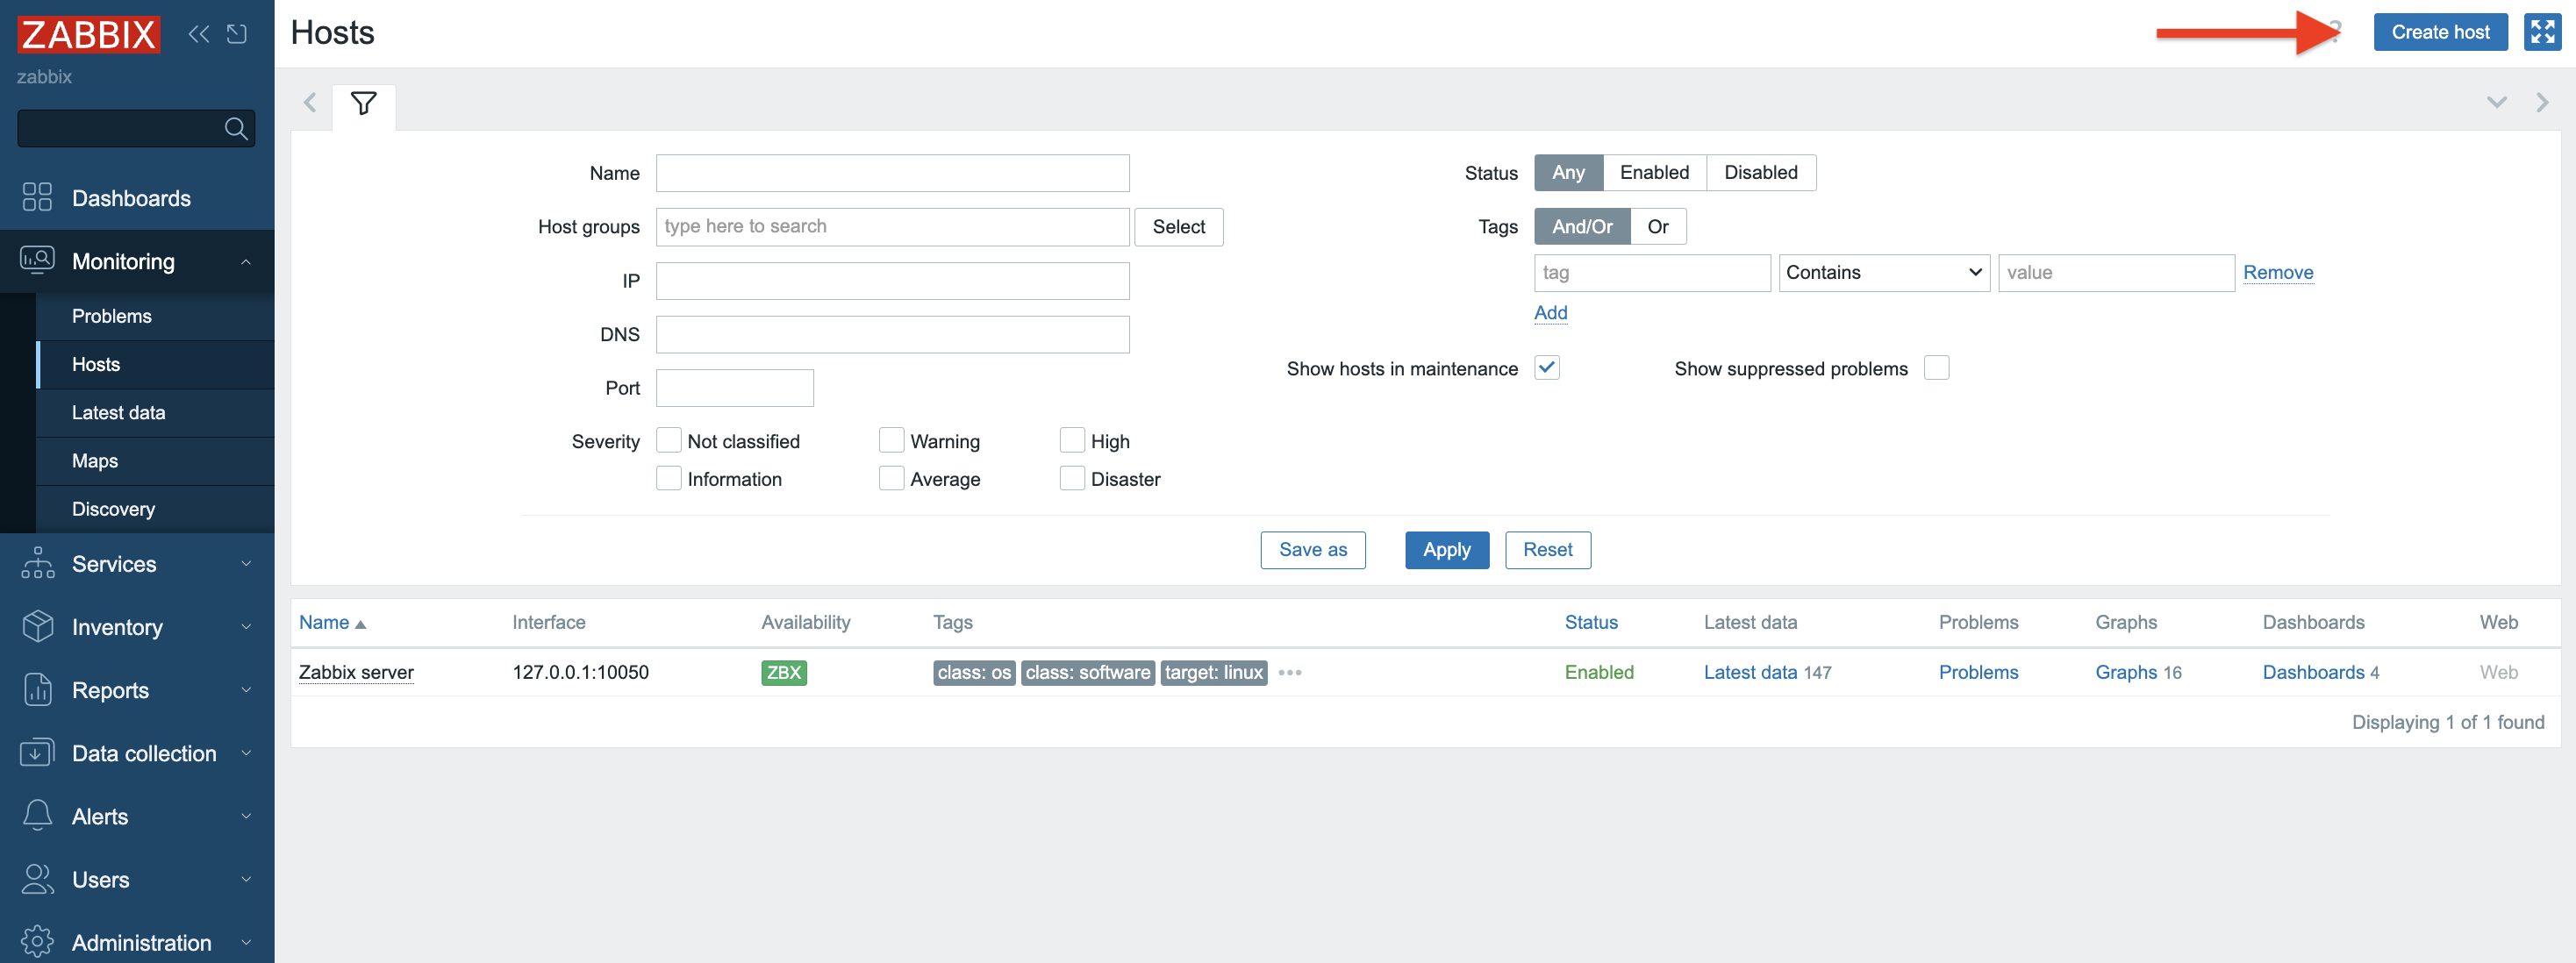
2. Create a new “Host.” Click Create Host in the right upper corner.

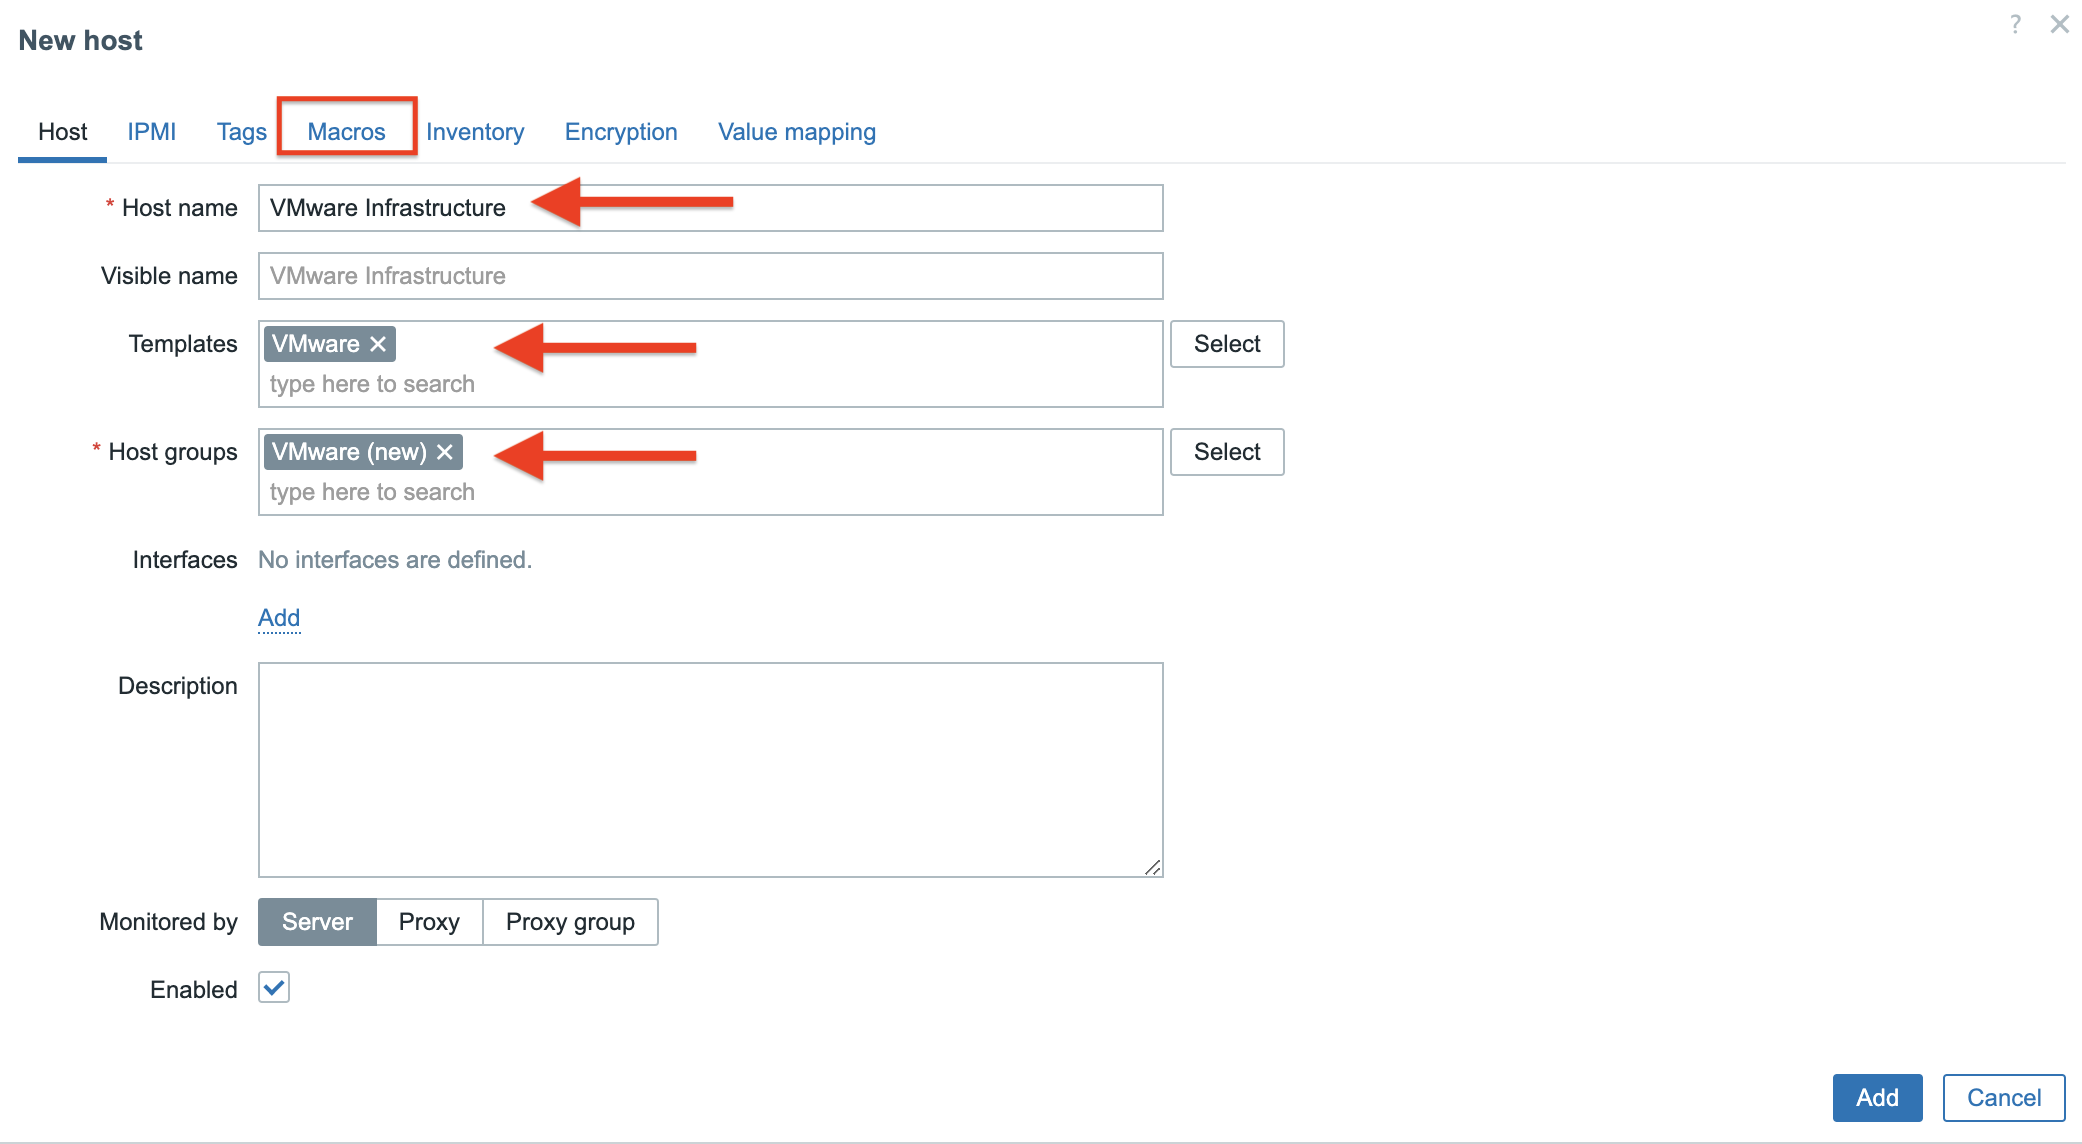
3. In the Host tab provide the following details:

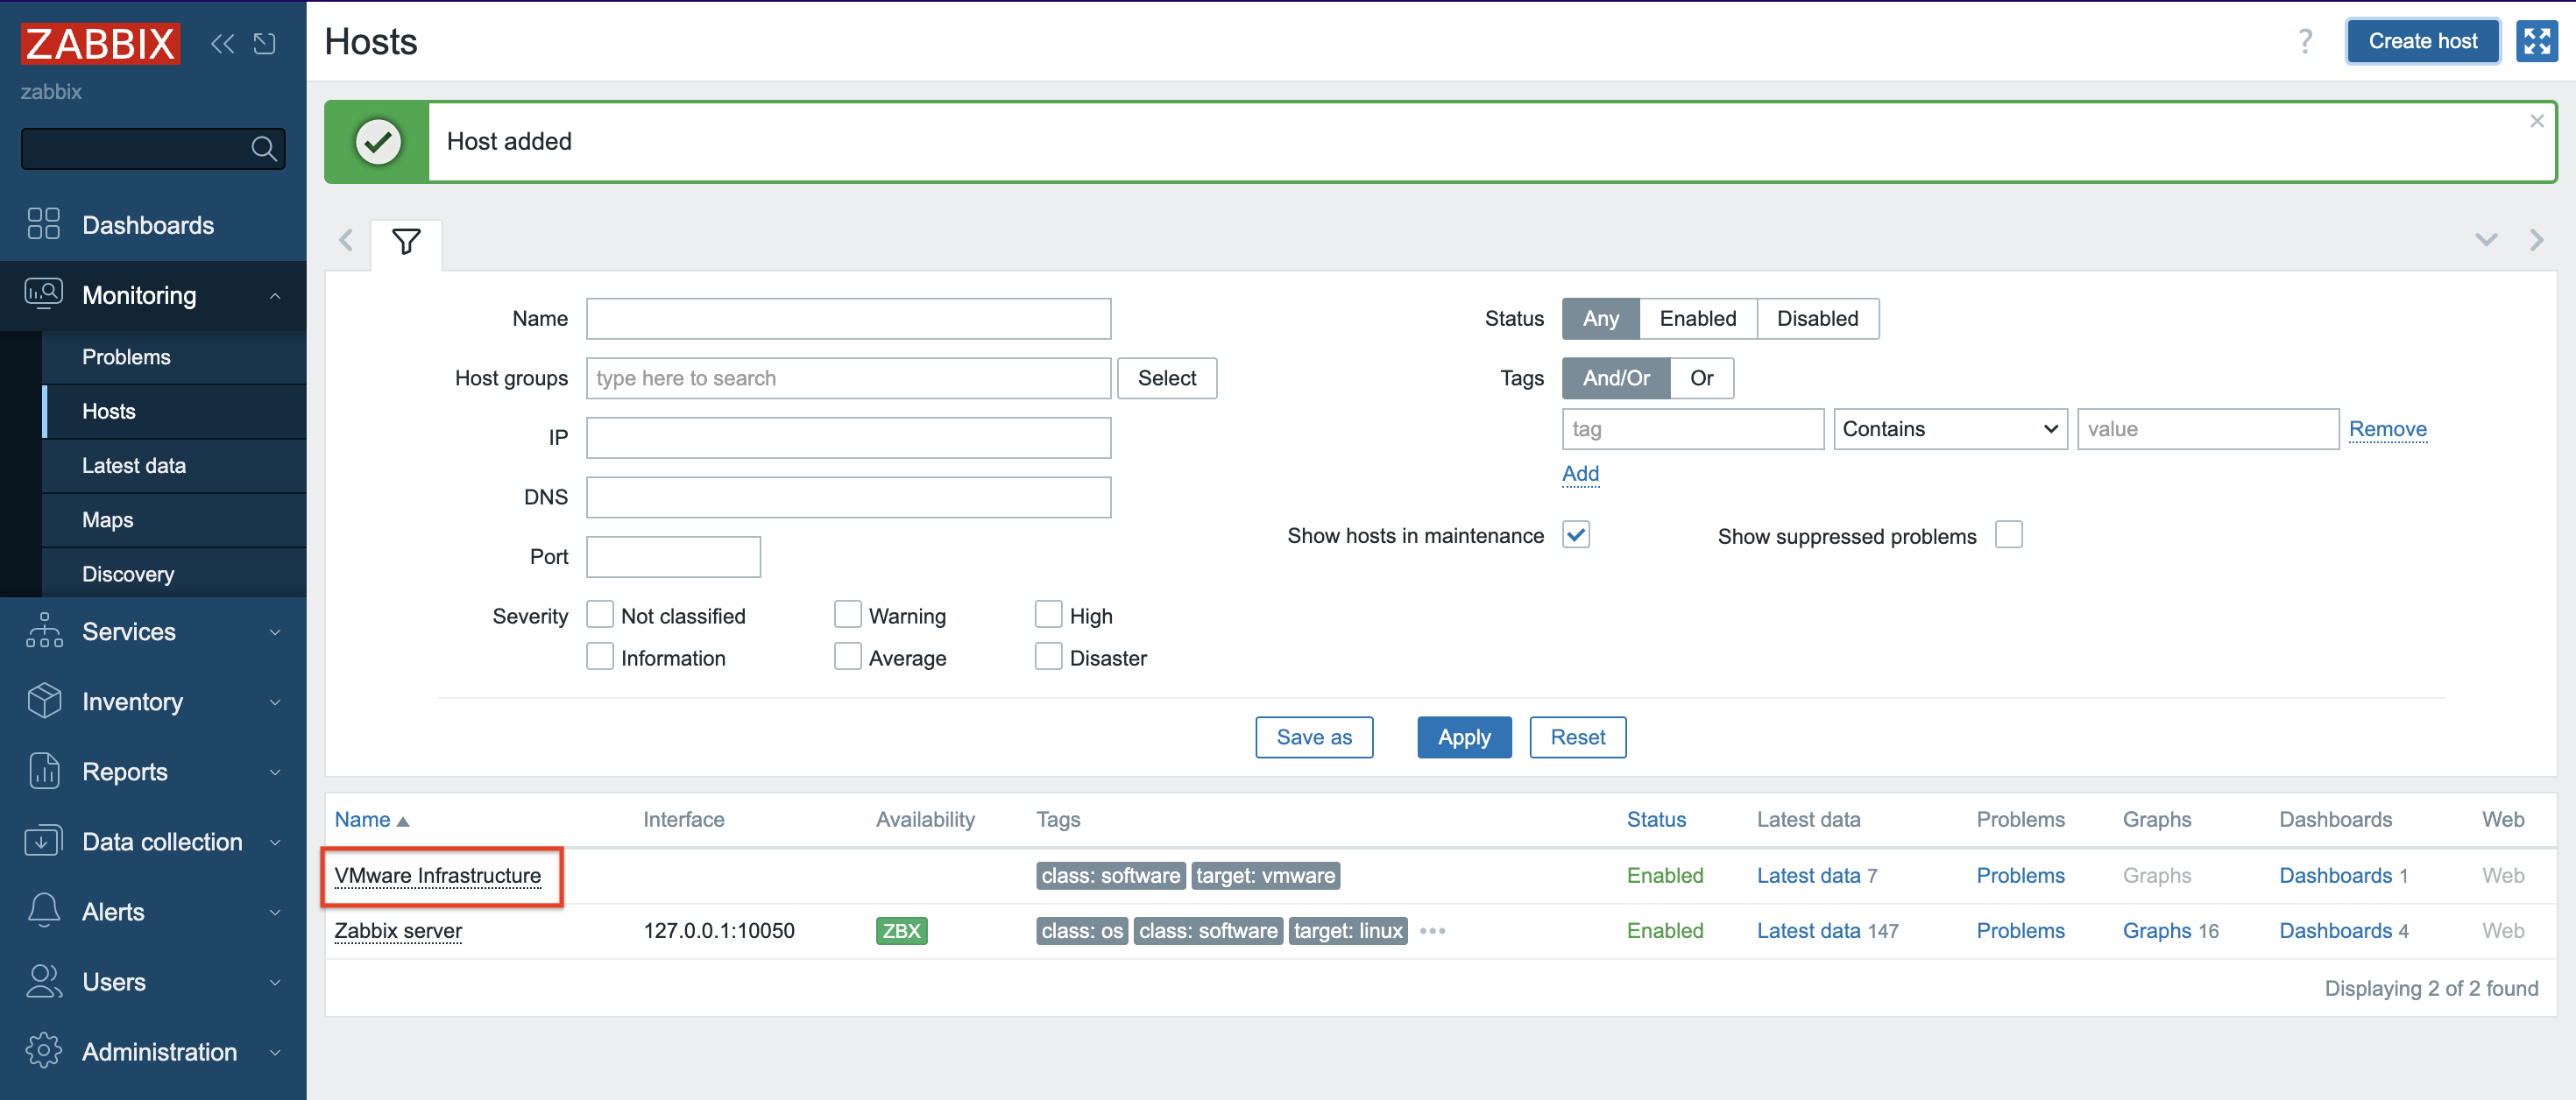
Host name – type the name of the system that we want to monitor – here it is VMware Infrastructure.
Templates – type/find template name “VMware”, more info about VMware template you can find HERE.
Host groups – find/type “VMware(new)” host group.

At this point,  go to the Macros tab.

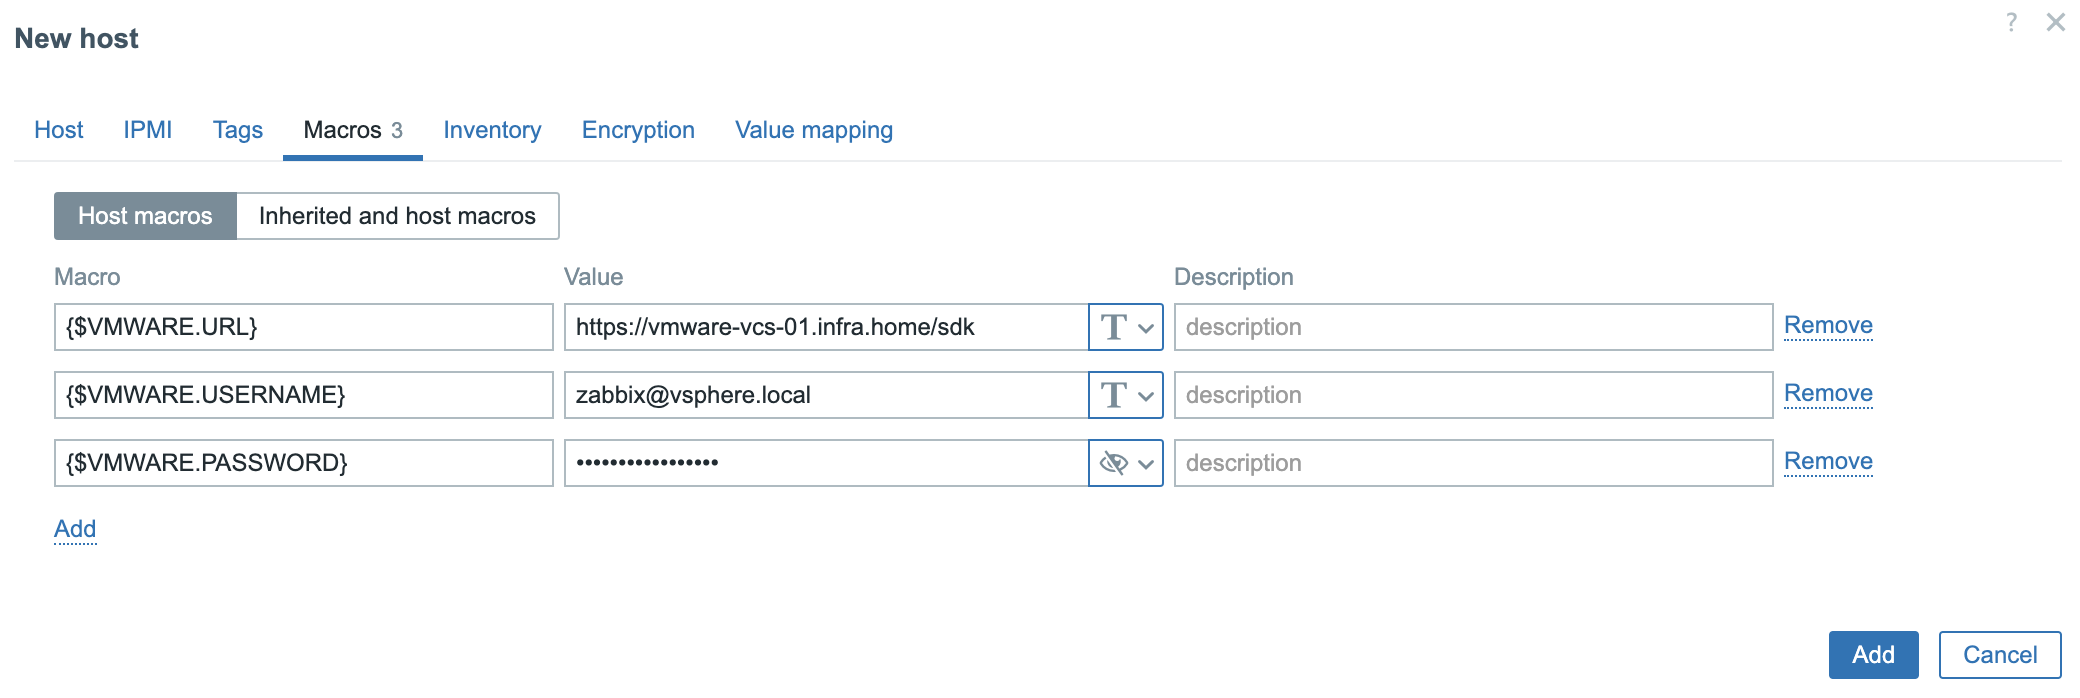
4. In the Macros tab you need to provide 3 values/macros. These macros describes data that is needed to connect Zabbix to the VMware vCenter:

{$VMWARE.URL} – VMware service (vCenter or ESXi hypervisor) SDK URL (https://servername/sdk) that we want to connect.
{$VMWARE.USERNAME} – VMware service username created in the 1 section.
{$VMWARE.PASSWORD} – VMware service user password created in the 1 section.

Click the Add button.

5. A new Host was created and data collection is in progress.

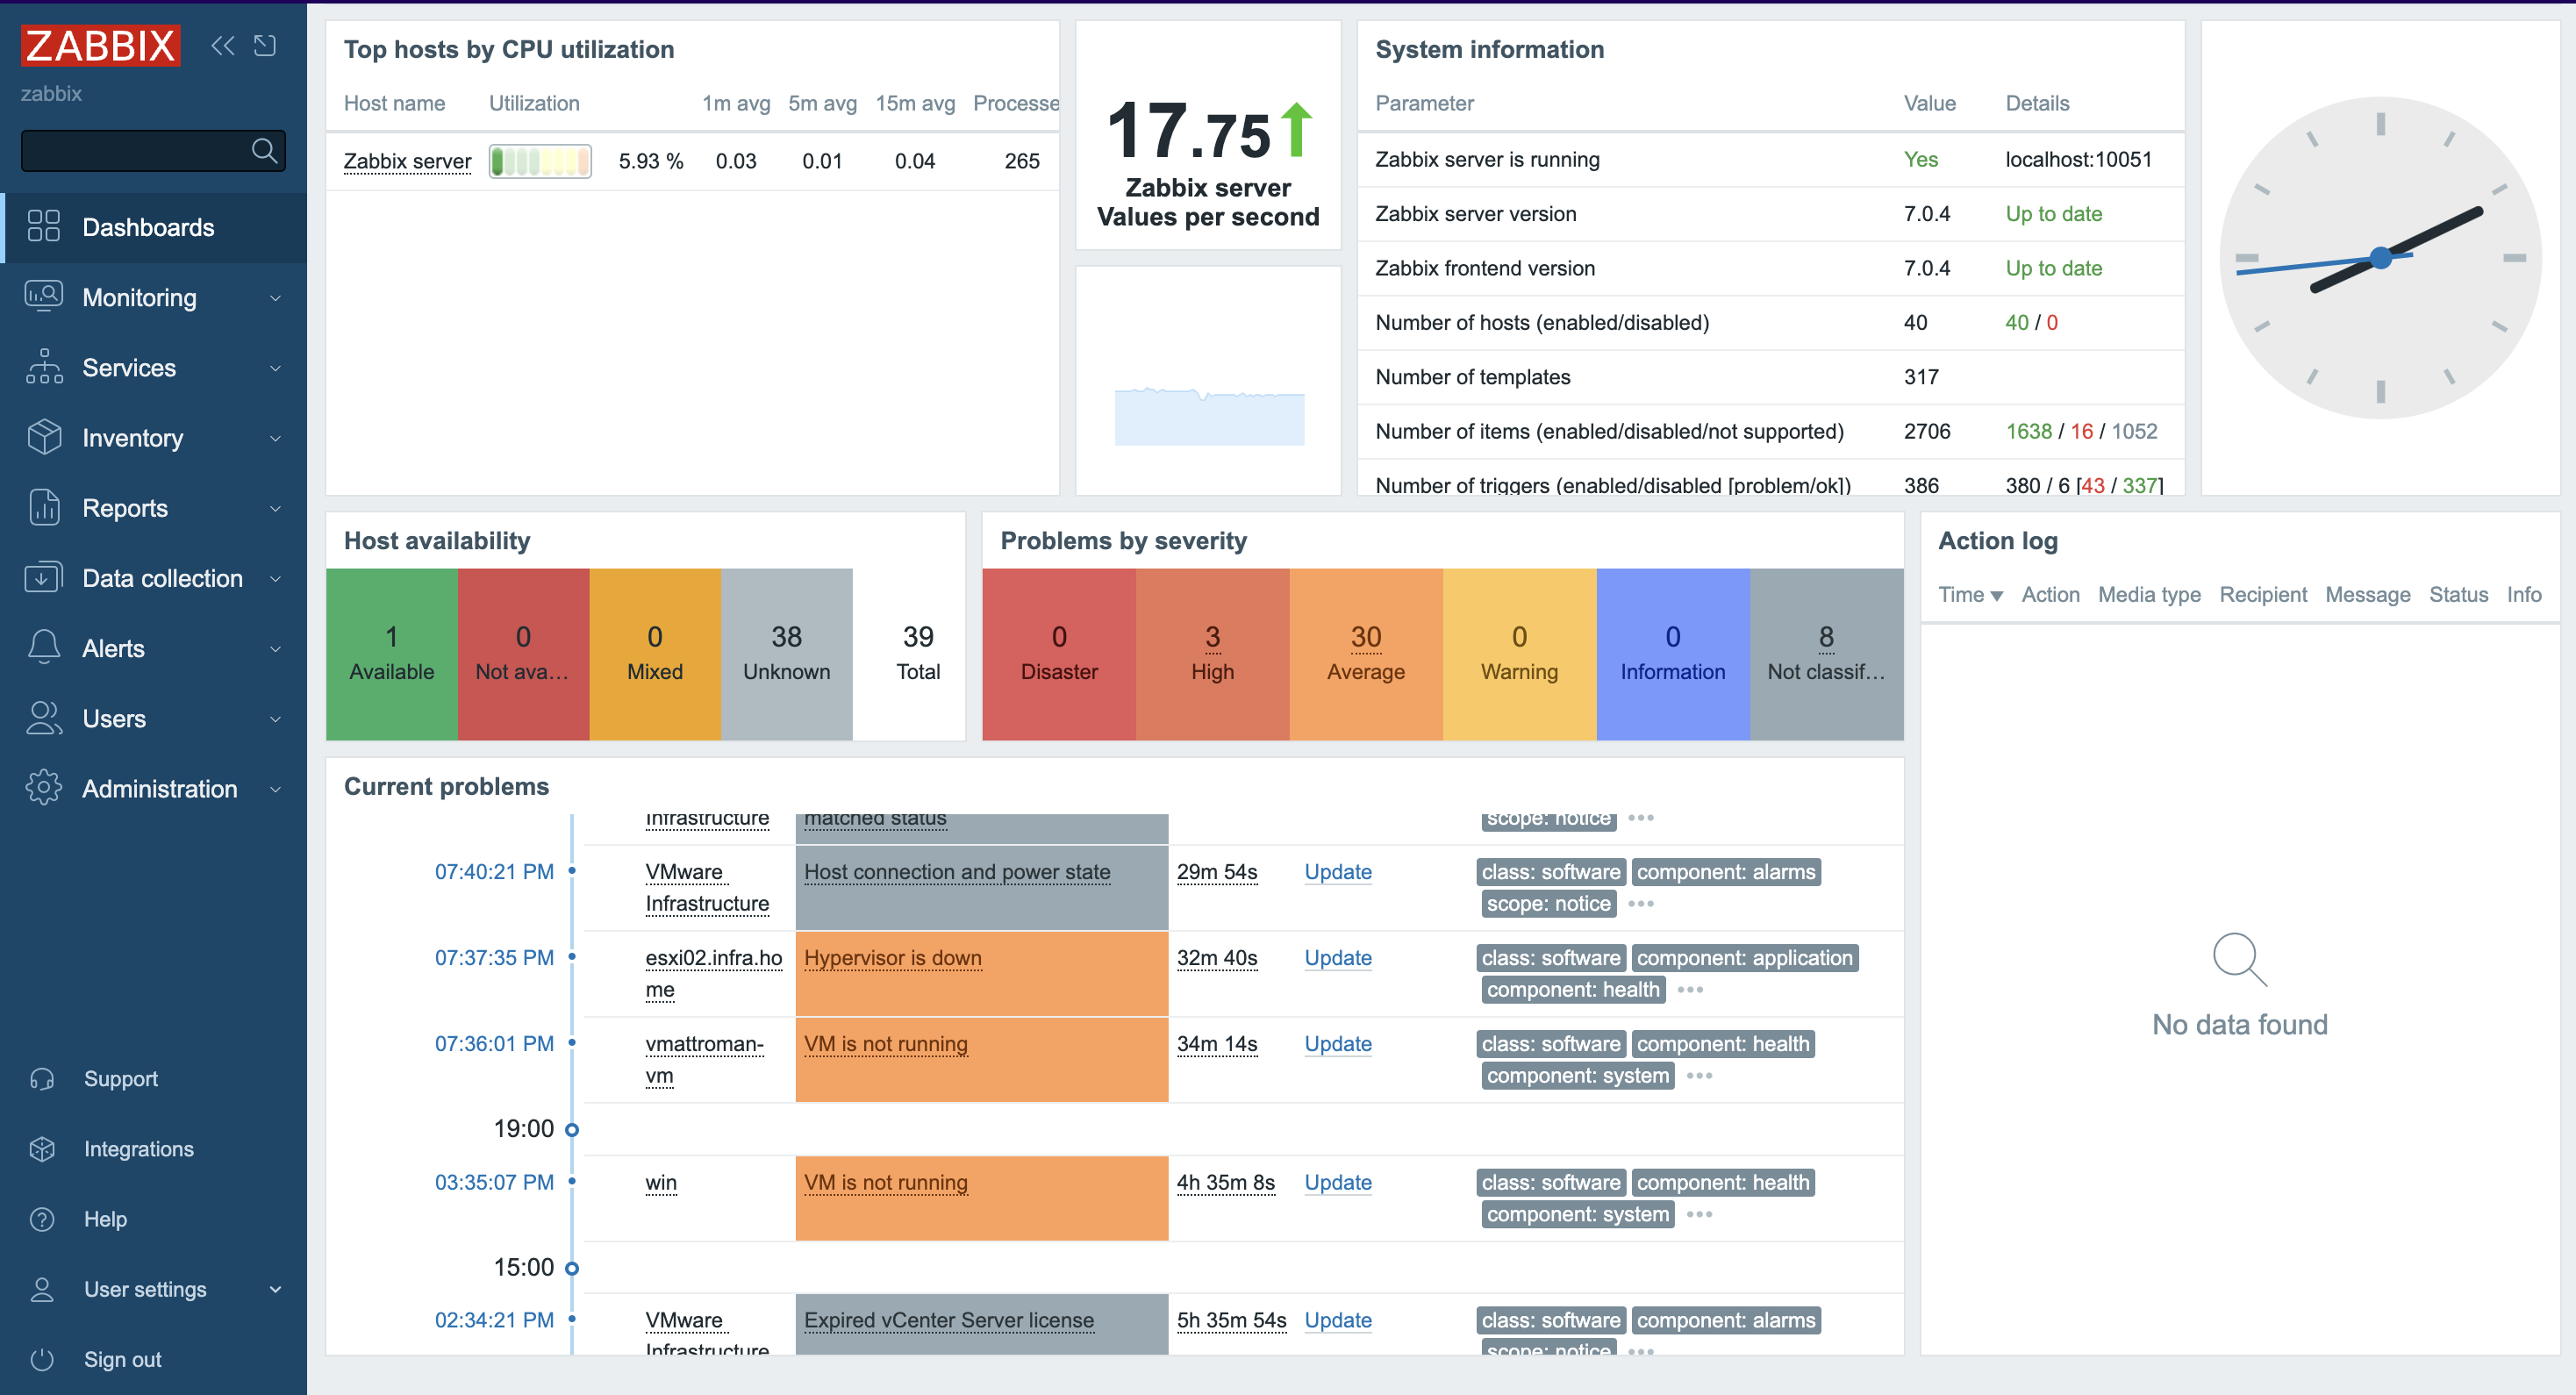
6. Depending on the size of the infrastructure, data collection takes different amounts of time. Once configured, Zabbix will automatically discover VMs and begin collecting performance data. You can find an overview of the latest data in the Dashboard screen.

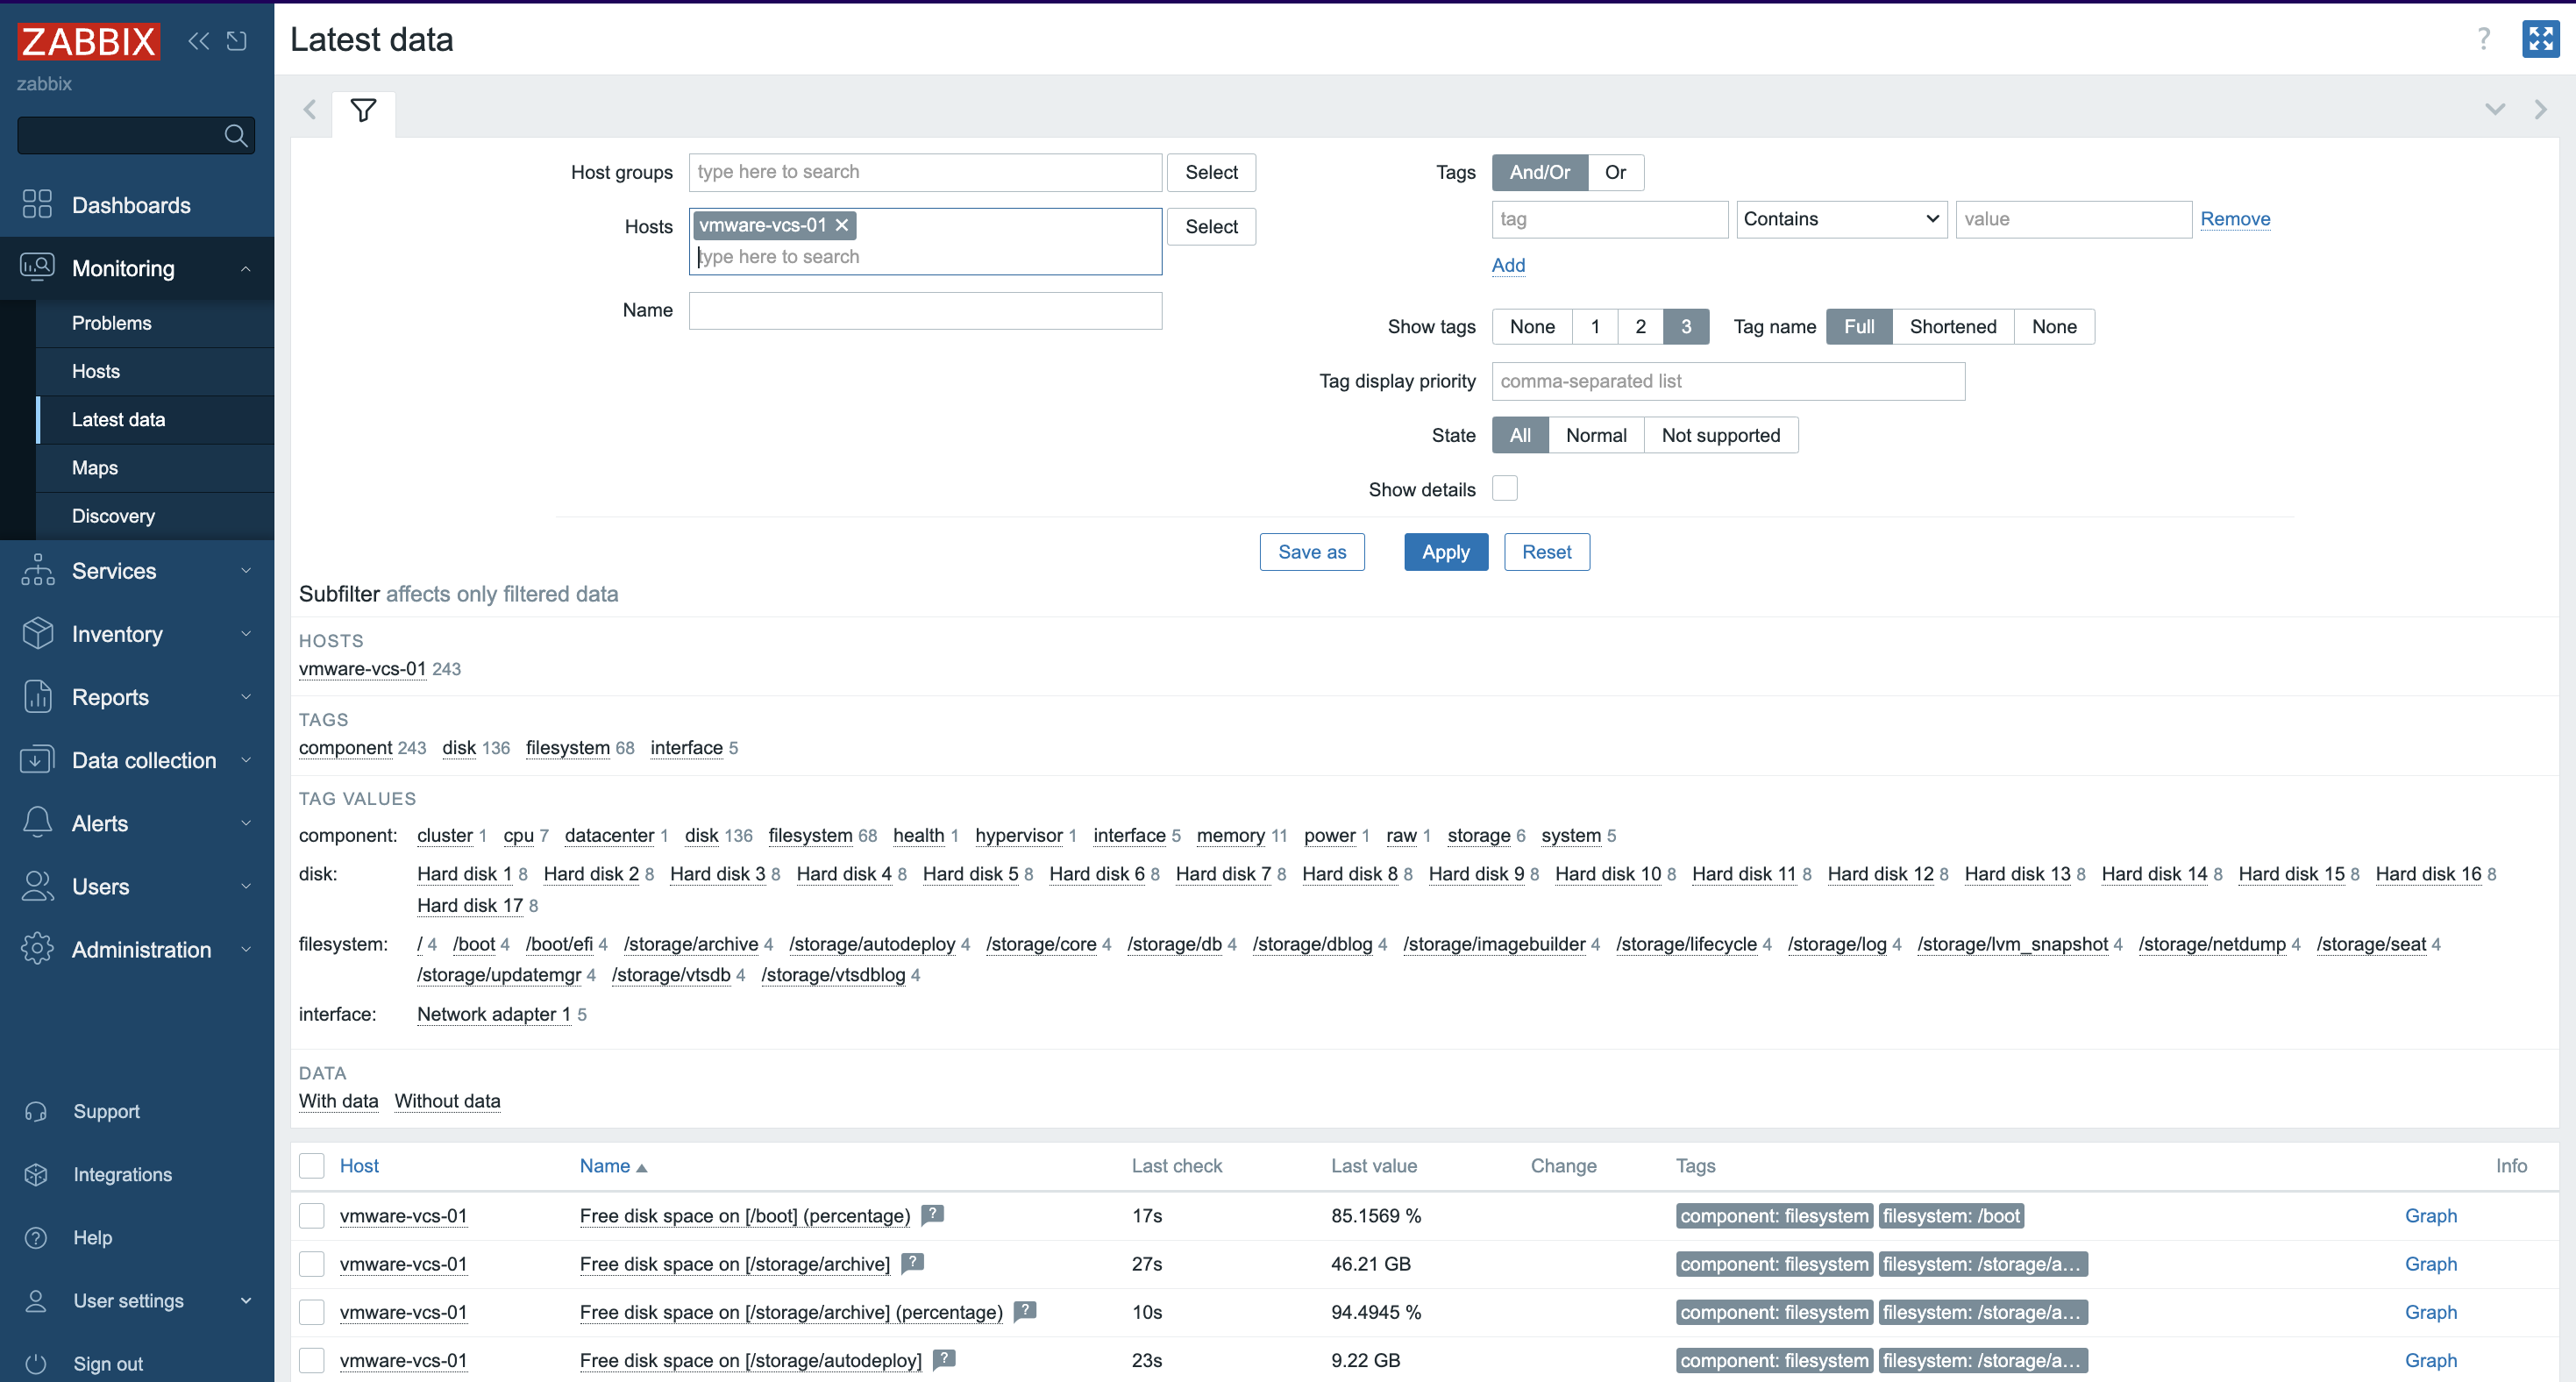
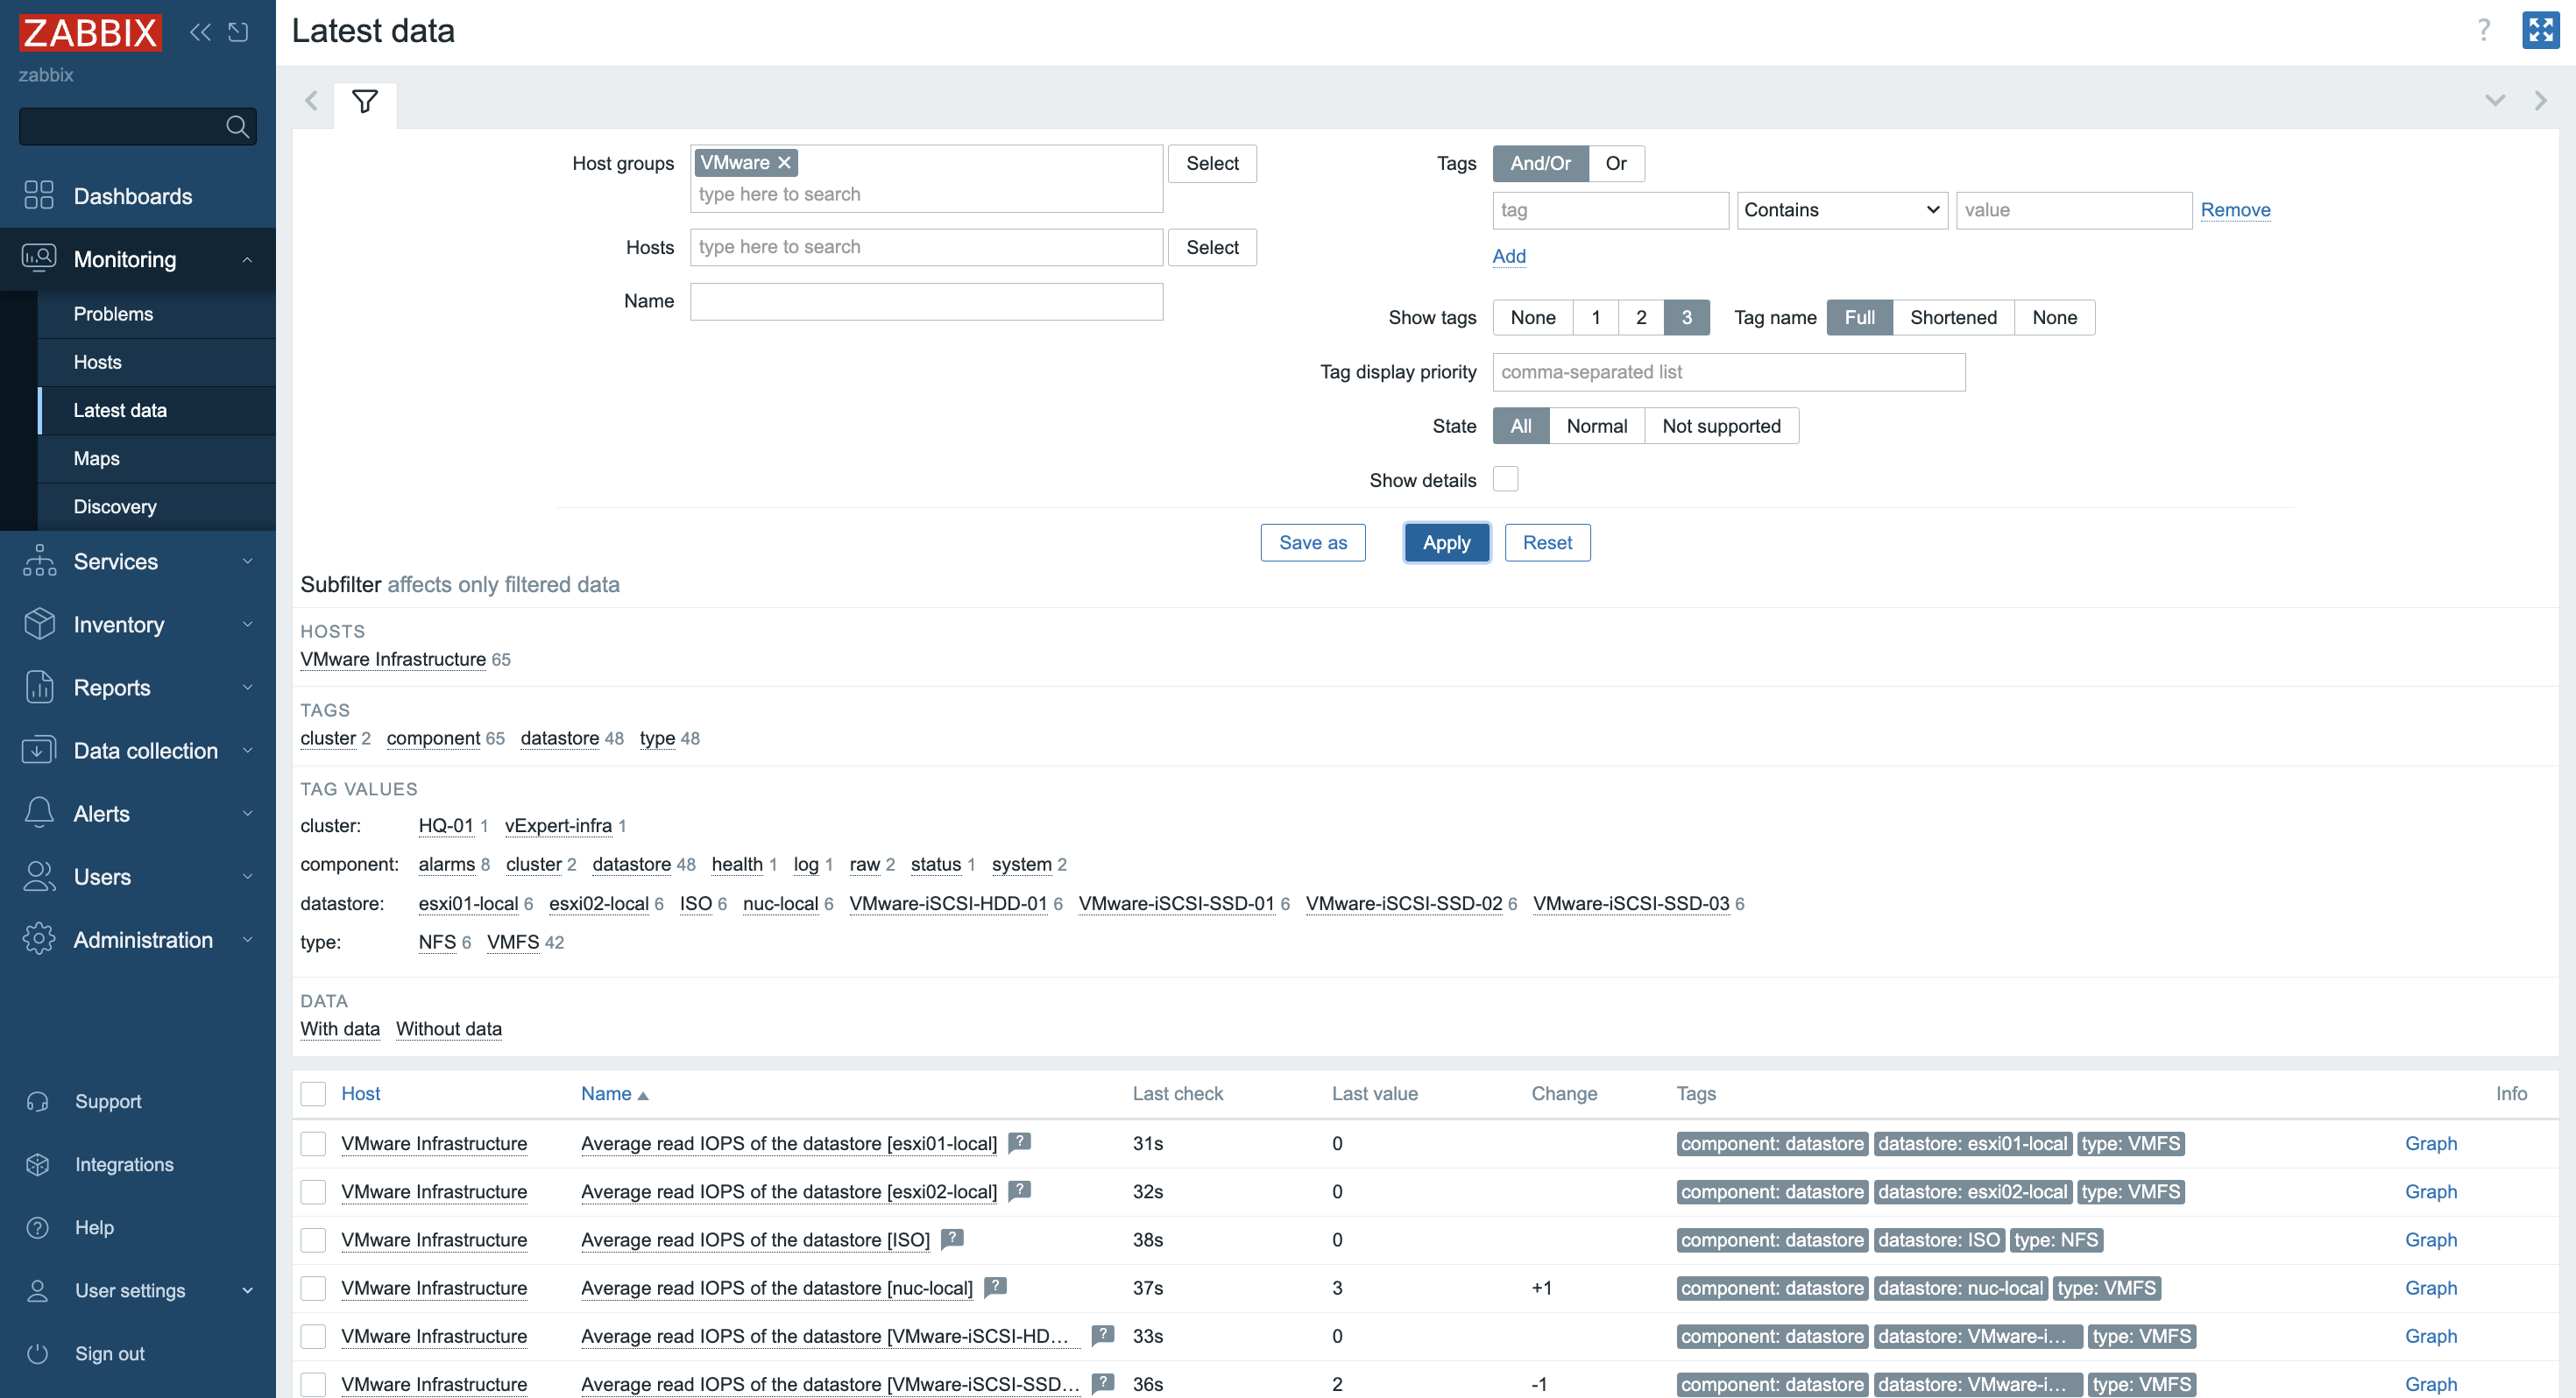
7. More specific and detailed data can be found in Latest data under the Monitoring tab.

In Host groups or Hosts choose the name of the item you are looking for (you can also click the “Select” button). Select the name of the ESXi host, the virtual machine, the vCenter name, the datastore, or all VMware information.

Zabbix can collect multiple metrics from VMware using its built-in templates. These metrics include:

– CPU usage
– Memory consumption
– Disk I/O statistics
– Network traffic
– Datastore capacity

In conclusion

Integrating Zabbix with VMware provides a robust solution for monitoring virtualized environments and enhancing visibility into system performance and resource utilization, while enabling timely alerts and responses to operational issues.

The post Monitoring VMware vSphere with Zabbix appeared first on Zabbix Blog.
Maximizing TCO and ROI with Open-Source Solutions

Post Syndicated from Luciano Alves original https://blog.zabbix.com/maximizing-tco-and-roi-with-open-source-solutions/29019/

In recent years, the debate around total cost of ownership (TCO) and return on investment (ROI) for open-source solutions has intensified, particularly within the scope of technology operations. With increasingly complex IT infrastructures and pressure to optimize costs, the choice between open-source and proprietary solutions has become a crucial strategic decision. By using a platform like Zabbix, which is both open-source and low-maintenance, multiple operational needs can be met, increasing returns.

The use of open-source tools by area of operation

Let’s explore how different areas (disciplines or approaches) related to information technology can benefit from adopting Zabbix.

IT Operations (ITOps)

ITOps is the foundation of daily IT operations, responsible for maintaining and monitoring an organization’s technological infrastructure. Using a platform like Zabbix allows ITOps teams to continuously monitor the entire IT infrastructure, identifying and solving problems before they impact the business. Zabbix stands out as a cost-effective alternative by eliminating the need for expensive licenses while supporting the fulfillment of SLAs and improving operational efficiency.

Operational Technology (OT)

In the context of Operational Technology, which encompasses the supervision and control of industrial processes, Zabbix excels in its ability to monitor critical equipment and systems in real-time. Zabbix’s ability to integrate with a wide variety of devices and protocols makes it ideal for complex industrial environments where reliability and operational continuity are crucial. Moreover, Zabbix can be configured to send personalized alerts and reports, ensuring that all stakeholders are informed about the monitored environment.

IT Infrastructure Management

Managing physical or virtual IT infrastructure involves overseeing all components that keep the IT environment running, from servers and network equipment to cloud applications and services. Zabbix, with its ability to monitor both on-premise and cloud environments, offers a unified solution for managing and optimizing the entire technology infrastructure. Zabbix’s scalability also ensures that it can grow along with the company’s needs, but without the additional costs that often come with proprietary solutions.

IT Service Management (ITSM)

In ITSM disciplines, the focus is on efficiently delivering IT services that meet business needs. Zabbix integrates well with ITSM frameworks and tools, offering valuable data and insights that can be used to improve incident, problem, and change management. Zabbix’s ability to provide real-time monitoring and trend analysis can also directly contribute to the continuous improvement of IT services, resulting in a higher ROI.

Technology Operations

A broader term that encompasses both ITOps and OT, technology operations benefit from Zabbix through its versatility in monitoring a wide range of systems and devices. Whether supporting infrastructure evolution or managing critical configurations, Zabbix offers integrations with tools used to ensure that technology aligns with business goals, minimizing risks and maximizing operational efficiency.

Why going open-source is a winning strategy

Going open-source is a winning strategy for monitoring and operating critical environments because it offers transparency, security, flexibility, and rapid innovation through collaboration with a wide developer community. Let’s explore the details of each benefit.

Licensing Costs

One of the greatest advantages of open source solutions is the absence of licensing costs. Unlike proprietary solutions, which require significant initial and recurring investments, open source platforms allow companies to redirect those resources to other critical areas, such as infrastructure improvement and internal skills development.

Flexibility and Customization

In today’s dynamic environments, the ability to customize and adapt tools to specific business needs is a competitive differentiator. Open source solutions like Zabbix, for example, offer flexibility that is often lacking in proprietary alternatives.This customization not only meets operational demands but also avoids vendor lock-in, a common concern with closed solutions.

Support and Documentation

While both proprietary and open source solutions, like Zabbix, offer professional support and services to clients, open source communities have proven increasingly effective in creating content that shares knowledge and use cases for tools. IDC studies confirm that organizations adopting open source can achieve a positive ROI in less time, especially when they have or develop the necessary skills to manage these solutions internally. In the case of Zabbix, there is a career path with courses and certifications for interested professionals.

Integration and Scalability

Integrating open source tools into mission-critical environments can be more seamless and less costly in terms of both time and money, especially when organizations possess the necessary internal technical skills. Zabbix is also scalable, allowing growth without significant additional costs, in contrast to proprietary solutions that often require paid upgrades.

TCO and ROI: The Zabbix case

A recent comparative study by Gartner highlighted that open source solutions (such as Zabbix) often outperform proprietary alternatives in terms of TCO, particularly in long-term implementations. Furthermore, IDC reinforces that the ROI of open source solutions can be maximized when companies invest in training teams to effectively use and explore these tools.

Internal data shows that 80% of Zabbix users (non-clients) do not use more than 15% of the platform’s existing features. This same data also demonstrates that team training and the hiring of official services increase operational efficiency by over 35%. The discussion about TCO and ROI of open source solutions in technology operations is not just a trend but a reality that more and more organizations are exploring to maximize resources and increase competitiveness.

The post Maximizing TCO and ROI with Open-Source Solutions appeared first on Zabbix Blog.
Monitoring My Home Network with Zabbix

Post Syndicated from Cesar Caceres original https://blog.zabbix.com/monitoring-my-home-network-with-zabbix/28921/

Recently, we reached out to the members of our global community with an invitation to share their dashboards and give us a quick tour of what they do with our product. The response was so incredible that we have decided to highlight a few of the most interesting submissions here on our blog.

First up is Cesar Caceres, an independent IT consultant with nearly 10 years of experience in critical system monitoring within the banking sector. Cesar enjoys being alerted to changes within his home network so much that he composed a custom song to let him know when a new alert arrives!

My environment

My environment includes ping monitoring for multiple devices (Google Nest, Smart LEDs, Smart Lights, and TV). I also track home network devices: one personal MikroTik router and two belonging to my colleague Alejandro Velasquez, along with the temperature of these devices. Additionally, I monitor WAN consumption from my internet provider, as well as the bandwidth consumption of a connected client, my colleague, and the VPN.

I have a MikroTik and TP-Link router. When I connect the TP-Link to a port on the MikroTik, I can capture information about any devices connected to my home network. Using SNMP v2, I can then retrieve detailed information from these devices. From the WinBox console of the MikroTik router, I can navigate to IP > DHCP Server to locate the active hostnames to monitor.

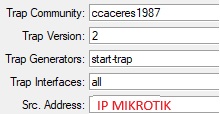
In WinBox, I navigate to IP > SNMP Settings. Here, assign a community name for identification, select SNMP version 2, and enter the IP address of the MikroTik device.

Once configured, I verify from the Zabbix server that communication has been successfully established through the SNMP v2 protocol.

On the Zabbix server, I verify the host name of the device to make sure it’s visible. Since version 6.0, Zabbix includes a template specifically for the RB4011GS device, which simplifies the monitoring process.

Temperature monitoring for my location (Maracaibo, Venezuela) is integrated with OpenWeatherMap. I also monitor my phone using an agent from the Android Play Store. The template for this is available on this GitHub repository, but customization will always depend on individual needs.

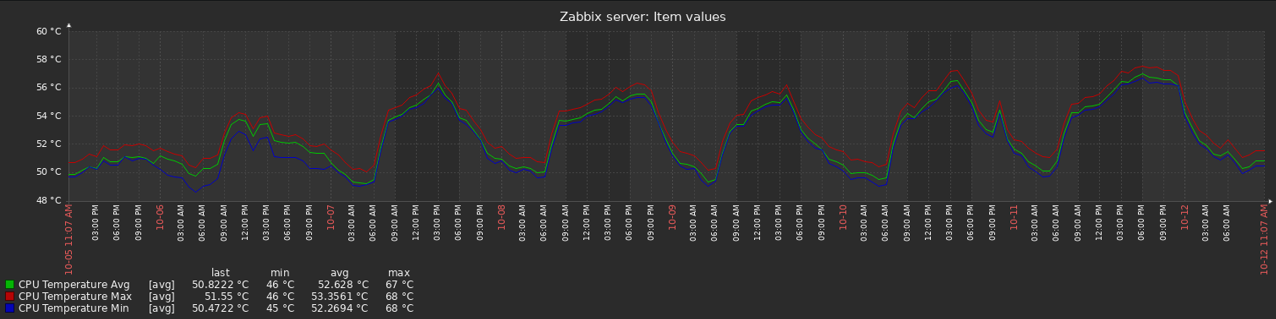
The temperature of my Zabbix Server is monitored using a repository available on GitHub. It’s important to know the operating temperature of the Zabbix server.

If possible, I adjust the default parameters to suit the specific environment.

I also monitor the performance of our Zabbix server and database using the MySQL integration with the Zabbix agent, focusing on key elements like buffer usage.

I track the behavior of my portfolio (ccaceresoln.com) with web scenarios , including certificate monitoring. When querying SSL for my portfolio, I make a folder in the Zabbix server and create a script called checkssl.sh inside it. Then, I grant execution permissions chmod +x to the checkssl.sh script.

In the configuration of these items, the call will be made to the URL. Each hosting provider may automatically generate a new SSL certificate periodically. In my case, I don’t use a trigger for certificate renewal.

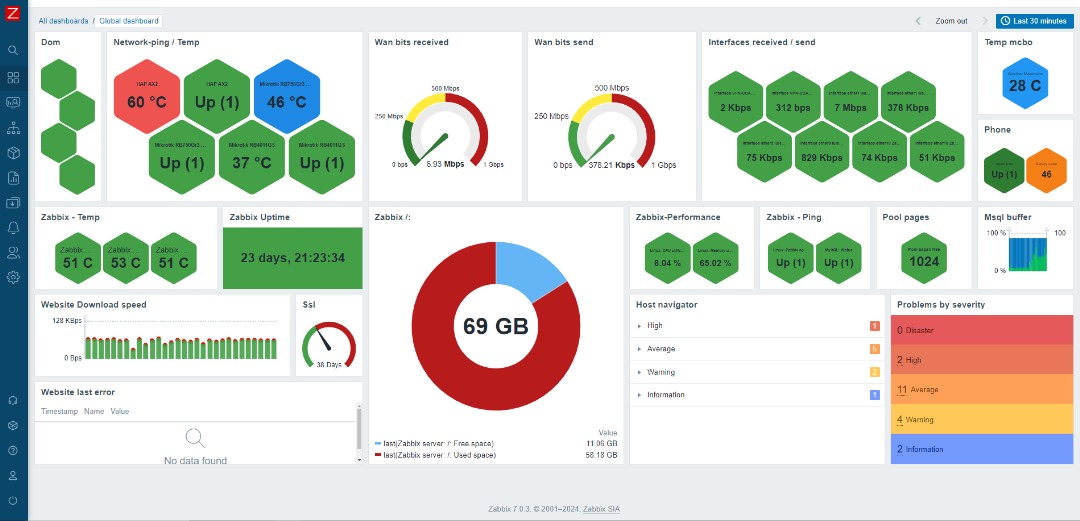
On the right side, there is a new widget for navigating based on alerts, which allows me to view more details about these issues.

Alerts

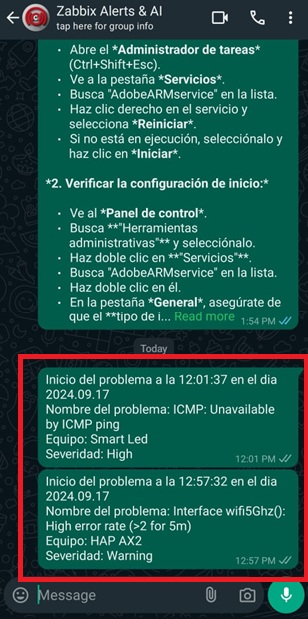
Alerts are delivered through WhatsApp, using a repository available on GitHub. This repository is based on the WhatsApp Web + Multi-Device API library. It’s important to ensure that the Mudslide libraries are up-to-date. Step-by-step instructions can be found in the Zabbix forums.

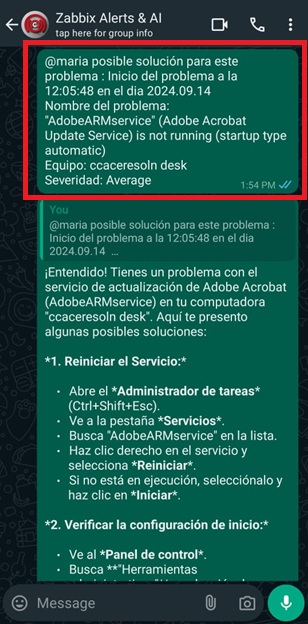
The assistant is based on a custom GitHub repository, customizing the language model using the Gemini 1.5 API. I chose this because it’s free to use and doesn’t require installation on the server. With the emergence of artificial intelligence, I’m hopeful that this could act as a proof of concept and an idea to help people understand how to resolve such alerts and learn from them. It’s more than just having everything in one place! Why MARIA? MARIA stands for:
M: Machine
A: Assistant
R: Reasoning
I: Intelligence
A: Artificial

Additional features

I had the idea to create a Zabbix song in order to have a sound that greets me every morning. Just a reminder that it’s a new day and Zabbix is here for alerts.
Song with sunoai:

Conclusion

Having a home network monitoring environment offers advantages such as receiving alerts about device status or specific equipment behavior even when you’re away from home. This allows for continuous supervision and proactive issue resolution.

The post Monitoring My Home Network with Zabbix appeared first on Zabbix Blog.

My Zabbix is down, now what? Restoring Zabbix functionality

Post Syndicated from Aurea Araujo original https://blog.zabbix.com/my-zabbix-is-down-now-what/28776/

We’ve all been in a situation in which Zabbix was somehow unavailable. It can happen for a variety of reasons, and our goal is always to help you get everything back up and running as quickly as possible. In this blog post, we’ll show you what to do in the event of a Zabbix failure, and we’ll also go into detail about how to work with the Zabbix technical support team to resolve more complex issues.

Step by step: Understanding why Zabbix is unavailable

When Zabbix becomes unavailable, it’s important to follow a few key steps to try to resolve the problem as quickly as possible.

  1. Check the service status. First, verify if your Zabbix service is truly inactive. You can do this by accessing the machine where Zabbix is installed and checking the service status using a command like systemctl status zabbix-serveron Linux.
  2. Analyze the Zabbix logs. Check the Zabbix logs for any error messages or clues about what may have caused the failure.
  3. Restart the service. If the Zabbix service has stopped, try restarting it using the appropriate command for your operating system. For example, on Linux, you can use sudo systemctl restart zabbix-server.
  4. Check the database connectivity. Zabbix uses a database to store data and Zabbix server configurations. Make sure that the database is accessible and functioning properly. You can test database connectivity using tools like ping or telnet.
  5. Check your available disk space. Verify that there is available disk space on the machine where Zabbix is installed. A lack of disk space is a common cause of system failures.
  6. Evaluate dependencies. Make sure all Zabbix dependencies are installed and working correctly. This includes libraries, services, and any other software required for Zabbix to function.

If the problem persists after carrying out these steps, it may be necessary to refer to the official Zabbix documentation, seek help from the official Zabbix forum, or contact the Zabbix technical support team, depending on the severity and urgency of the situation.

Making the most of a Zabbix technical support contract

If you or your company have a Zabbix technical support contract, access to our global team of technical experts is guaranteed. This is an ideal option for resolving more complex or urgent issues. Here are a few steps you can follow when contacting the Zabbix technical support team:

  1. Gather all important information. Before contacting the Zabbix technical support team, gather all relevant information about the issue you’re facing. This can include error messages, logs, screenshots, and any steps you’ve already taken to try to resolve the issue.
  2. Open a ticket with the Zabbix technical support team. Contact Zabbix technical support by opening a ticket on the Zabbix Support System. Provide all the information gathered in the previous step to help the technicians understand the problem and find a solution as quickly as possible.
  3. Explain exactly how Zabbix crashed. When describing the problem, be as precise and detailed as possible. Include information such as the Zabbix version you are using, your operating system, your network configuration, and any other relevant details that might help our team diagnose the issue.
  4. Be available to follow up on the ticket. Once you’ve opened a ticket, be available to provide additional information or clarify any questions the support technicians may have. This will help speed up the problem resolution process.
  5. Follow the Zabbix technical support team’s recommendations. After receiving recommendations, follow them carefully and test to see whether they resolve the issue. If the problem persists or if new issues arise, inform the Zabbix technical support team immediately so they can continue assisting you.

A Zabbix technical support subscription gives you access to a team of Zabbix experts who can help you configure and troubleshoot your Zabbix environment. Check out the benefits of each type of subscription on the Zabbix website and make sure you have all the support you need to keep your monitoring fully operational.


The post My Zabbix is down, now what? Restoring Zabbix functionality appeared first on Zabbix Blog.

Migrating from Datadog to Zabbix with Custom Metric Submission

Post Syndicated from Chris Board original https://blog.zabbix.com/migrating-from-datadog-to-zabbix-with-custom-metric-submission/28620/

For a few years, I’ve been monitoring 3 Digital Ocean servers with Datadog and using Datadog DogStatsD to submit custom metrics to Datadog. I am a big fan of Datadog and will continue recommending them. However, it became a bit too expensive for my needs, so I started looking for alternative options.

I decided to go down the self-hosted route as that was the least expensive option. I decided to go with Zabbix.

If you don’t know, Zabbix is a completely free, open source, and enterprise-ready monitoring service with a vast range of integrations for all of your monitoring needs. You can choose to install it on-premises or in the cloud.

I went with a $24 Basic Droplet in Digital Ocean with Regular SSD, which is actually below the minimum requirements that Zabbix specifies. It has been working fine and resource usage is minimal (around 40% RAM and 4% CPU use).

When you create a host to monitor, you assign templates. The templates are integrations you want to monitor, such as Apache, MySQL, and general Zabbix agent metrics like server performance (CPU, RAM, IO, etc.).

There were some things I had to create manually (including process monitoring) as I couldn’t find a built-in way of doing it. Datadog, had live process monitoring, so you could create a monitor which looks for a particular process, and then alert if that process wasn’t running.

Zabbix didn’t seem to have anything like this (that I could find) so I created custom templates and a custom shell script to look for the process name using the ps command (on Linux).

Another important function I needed was custom metric submission. This was originally done via the Datadog DogStatsD libraries available in pretty much any language, either as official libraries or via community versions. This would submit UDP data to the agent running locally on the server, and the agent would submit it to your Datadog account.

I didn’t want to rewrite all my apps to be able to send data to Zabbix, so I built a conversion tool. Its a small app I built in C# that listens on the same UDP socket as the Datadog agent (obviously, you’ll need to have the Datadog agent turned off). It receives the data from the Datadog DogStatsD libraries as normal, and the C# app converts the Datadog UDP data and submits an HTTP request to the Zabbix server via its API.

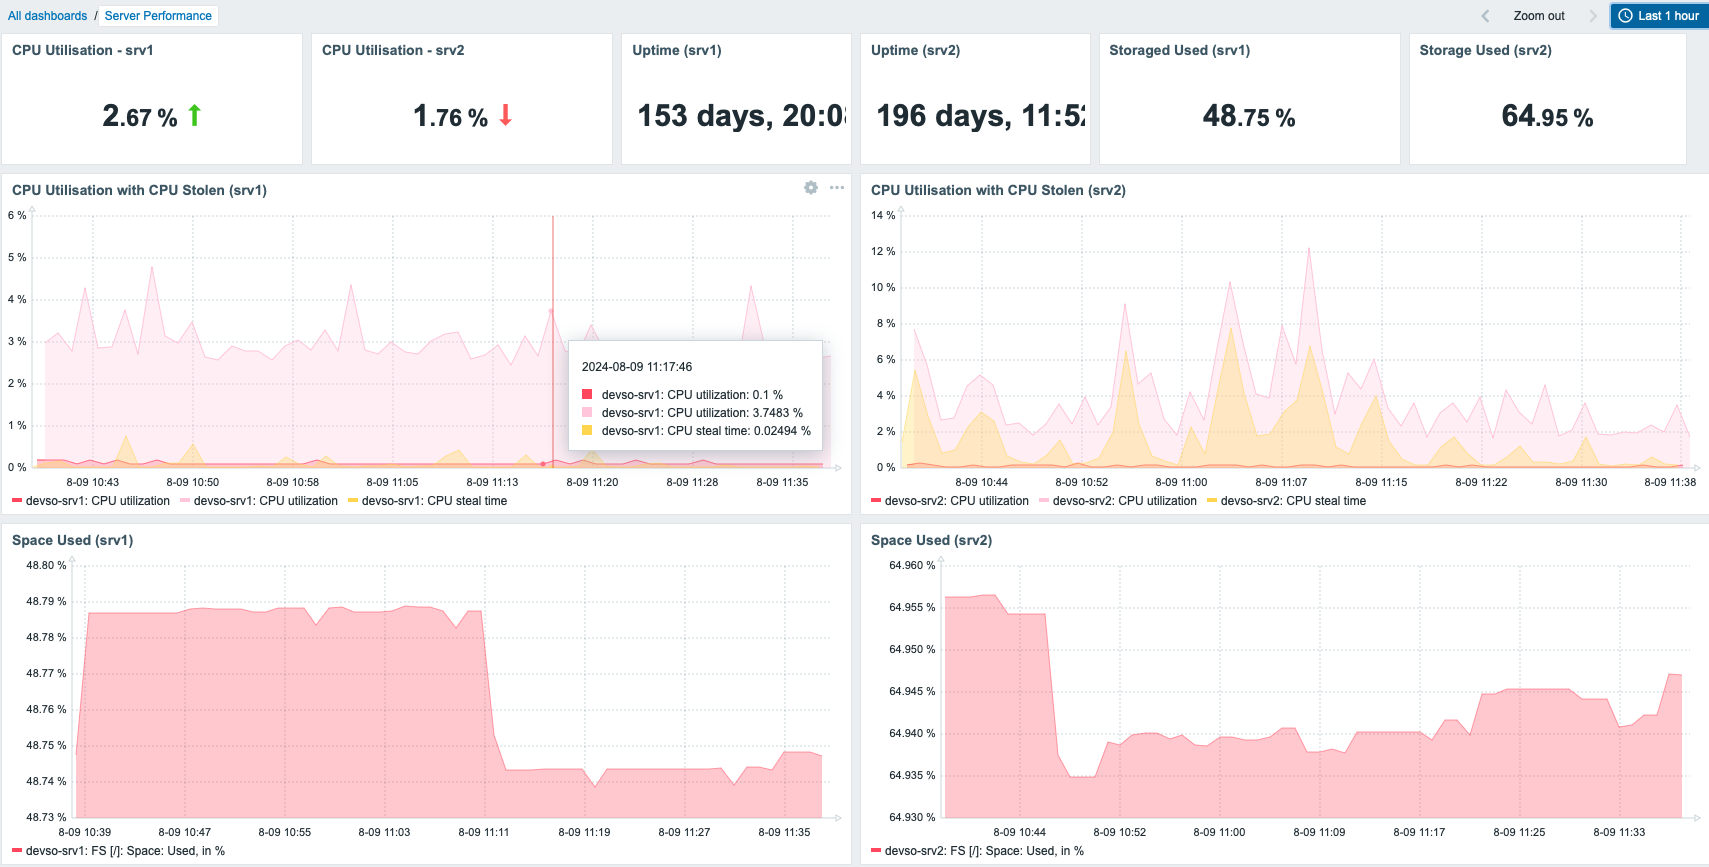
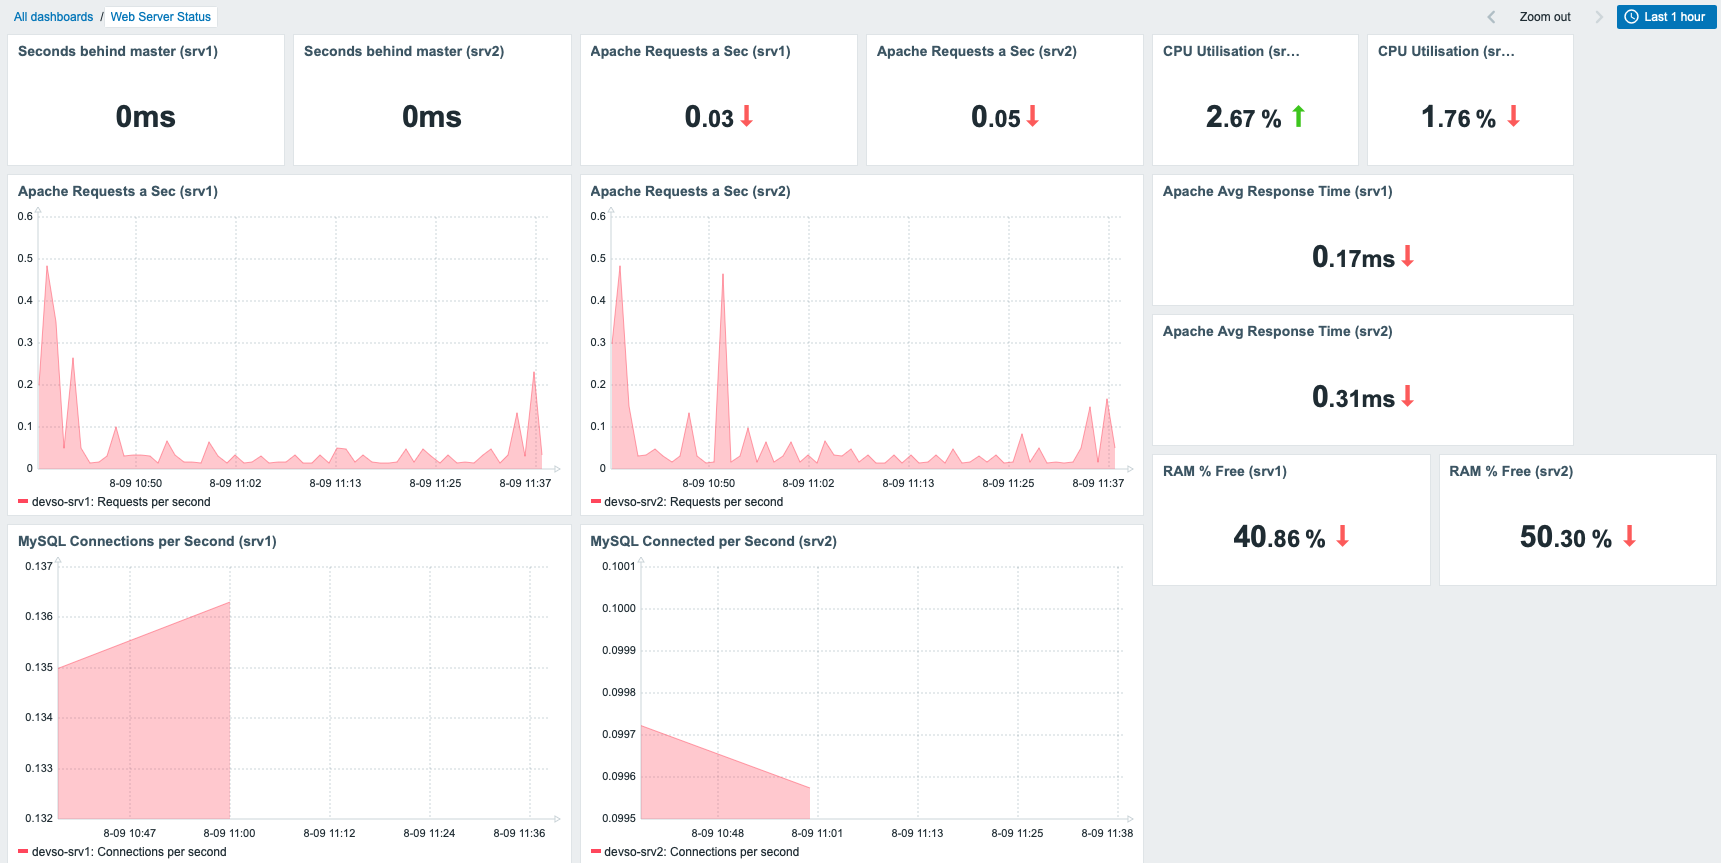
After everything was installed, I then re-created the various dashboards that I had from Datadog in Zabbix. A couple of examples are below:

In terms of access and configuration, all of the metrics are sent over the private interfaces of each droplet. Nothing is available via the public interface.

Logging into the Zabbix web portal is done via a Cloudflare Tunnel that allows me to connect to the web portal over the private interface via the Cloudflare tunnels running on each of the servers for fault tolerance. This provides multiple levels of authentication, as you have to authenticate to Cloudflare and authenticate with Zabbix.

This post was designed as an overview to show that it is possible to migrate from Datadog to Zabbix fairly easily, with a small amount of development involved to convert Datadog custom metrics to Zabbix via the C# app.

The C# app isn’t publicly available, but if there is some demand for it I can look at open sourcing it. If you want a full rundown of how I migrated and set up the Zabbix server and the servers being monitored, please let me know and I can do a more in-depth blog post!


The post Migrating from Datadog to Zabbix with Custom Metric Submission appeared first on Zabbix Blog.

Securing the Zabbix Frontend

Post Syndicated from Patrik Uytterhoeven original https://blog.zabbix.com/securing-the-zabbix-frontend/27700/

The frontend is what we use to login into our system. The Zabbix frontend will connect to our Zabbix server and our database. But we also send information from our laptop to the frontend. It’s important that when we enter our credentials that we can do this in a safe way. So it makes sense to make use of certificates and one way to do this is by making use of self-signed certificates.

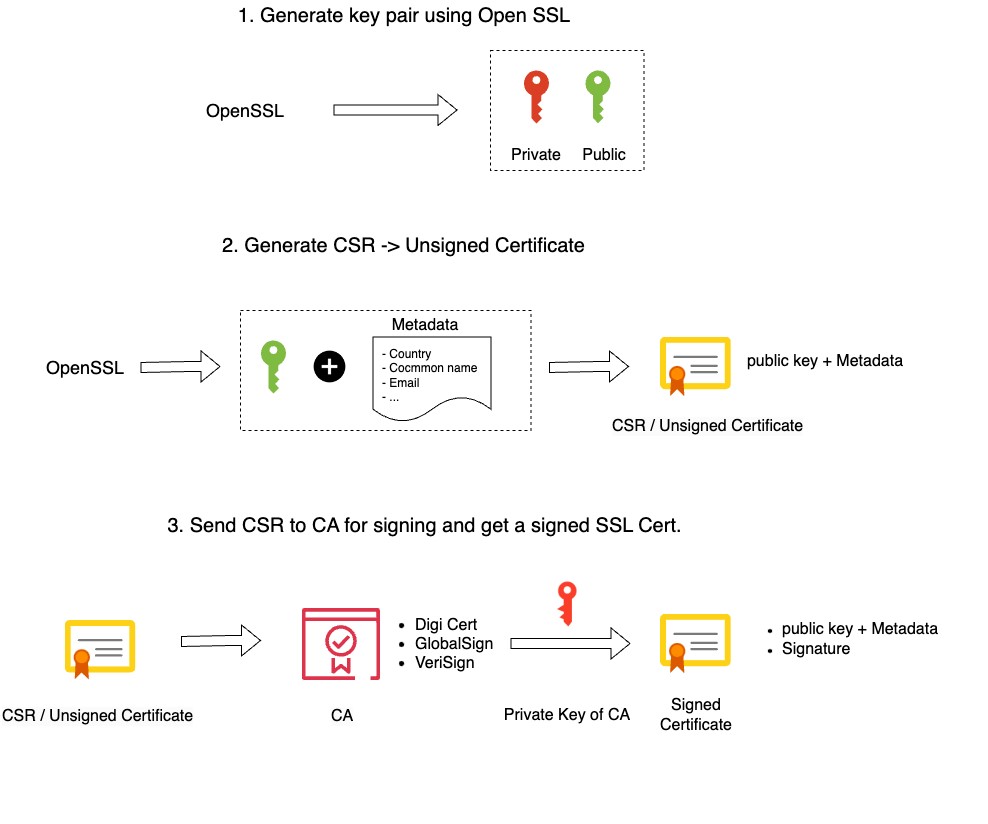
To give you a better understanding of why your browser will warn you when using self-signed certificates, we have to know that when we request an SSL certificate from an official Certificate Authority (CA) that you submit a Certificate Signing Request (CSR) to them. They in return provide you with a Signed SSL certificate. For this, they make use of their root certificate and private key.

Our browser comes with a copy of the root certificate (CA) from various authorities, or it can access it from the OS. This is why our self-signed certificates are not trusted by our browser – we don’t have any CA validation. Our only workaround is to create our own root certificate and private key.

Understanding the concepts

How to create an SSL certificate:

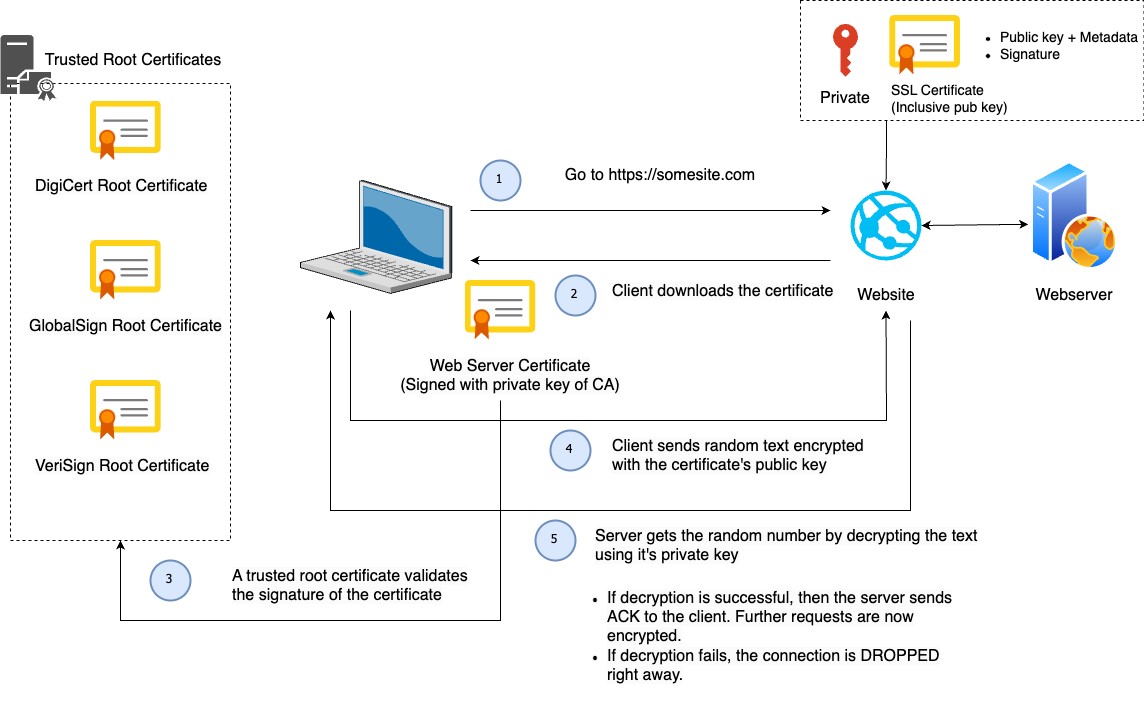
How SSL works – Client – Server flow:

NOTE: I have borrowed the designs from this video, which does a good job of explaining how SSL works.

Securing the Frontend with self signed SSL on Nginx

In order to configure this, there are a few steps that we need to follow:

  • Generate a private key for the CA ( Certificate Authority )
  • Generate a root certificate
  • Generate CA-Authenticated Certificates
  • Generate a Certificate Signing Request (CSR)
  • Generate an X509 V3 certificate extension configuration file
  • Generate the certificate using our CSR, the CA private key, the CA certificate, and the config file
  • Copy the SSL certificates to your Virtual Host
  • Adapt your Nginx Zabbix config

Generate a private key for the CA

The first step is to make a folder named “SSL” so we can create our certificates and save them:

>- mkdir ~/ssl
>- cd ~/ssl
>- openssl ecparam -out myCA.key -name prime256v1 -genkey

Let’s explain all the options:

  • openssl : The tool to use the OpenSSL library, which provides us with cryptographic functions and utilities
  • out myCA.key : This part of the command specifies the output file name for the generated private key
  • name prime256v1: The name of the elliptic curve; X9.62/SECG curve over a 256 bit prime field
  • ecparam: This command is used to manipulate or generate EC parameter files
  • genkey: This option will generate an EC private key using the specified parameters

Generate a Root Certificate

openssl req -x509 -new -nodes -key myCA.key -sha256 -days 1825 -out myCA.pema

Let’s explain all the options:

  • openssl: The command-line tool for OpenSSL
  • req: This command is used for X.509 certificate signing request (CSR) management
  • x509: This option specifies that a self-signed certificate should be created
  • new: This option is used to generate a new certificate
  • nodes: This option indicates that the private key should not be encrypted. It will generates a private key without a passphrase, making it more
    convenient but potentially less secure
  • key myCA.key: This specifies the private key file (myCA.key) to be used in generating the certificate
  • sha256: This option specifies the hash algorithm to be used for the certificate. In this case, SHA-256 is chosen for stronger security
  • days 1825: This sets the validity period of the certificate in days. Here, it’s set to 1825 days (5 years)
  • out myCA.pem: This specifies the output file name for the generated certificate. In this case, “myCA.pem”

The information you enter is not so important, but it’s best to fill it in as comprehensively as possible. Just make sure you enter for CN your IP or DNS.

You are about to be asked to enter information that will be incorporated
into your certificate request.
What you are about to enter is what is called a Distinguished Name or a DN.
There are quite a few fields but you can leave some blank
For some fields there will be a default value,
If you enter '.', the field will be left blank.
-----
Country Name (2 letter code) [XX]:BE
State or Province Name (full name) []:vlaams-brabant
Locality Name (eg, city) [Default City]:leuven
Organization Name (eg, company) [Default Company Ltd]:
Organizational Unit Name (eg, section) []:
Common Name (eg, your name or your server's hostname) []:192.168.0.134
Email Address []:

Generate CA-Authenticated Certificates

It’s probably good practice to use the dns name of your webiste in the name for the private key. As we use in this case an IP address rather than a dns, I will use the fictive dns zabbix.mycompany.internal.

openssl genrsa -out zabbix.mycompany.internal.key 2048

Generate a Certificate Signing Request (CSR)

openssl req -new -key zabbix.mycompany.internal.key -out zabbix.mycompany.internal.csr

You will be asked the same set of questions as above. Once again, your answers hold minimal significance and in our case no one will inspect the certificate, so they matter even less.

You are about to be asked to enter information that will be incorporated
into your certificate request.
What you are about to enter is what is called a Distinguished Name or a DN.
There are quite a few fields but you can leave some blank
For some fields there will be a default value,
If you enter '.', the field will be left blank.
-----
Country Name (2 letter code) [XX]:BE
State or Province Name (full name) []:vlaams-brabant
Locality Name (eg, city) [Default City]:leuven
Organization Name (eg, company) [Default Company Ltd]:
Organizational Unit Name (eg, section) []:
Common Name (eg, your name or your server's hostname) []:192.168.0.134
Email Address []:

Please enter the following 'extra' attributes
to be sent with your certificate request
A challenge password []:
An optional company name []:

Generate an X509 V3 certificate extension configuration file

# vi zabbix.mycompany.internal.ext

Add the following lines in your certificate extension file. Replace IP or DNS with your own values.

authorityKeyIdentifier=keyid,issuer
basicConstraints=CA:FALSE
keyUsage = digitalSignature, nonRepudiation, keyEncipherment, dataEncipherment
subjectAltName = @alt_names

[alt_names]
IP.1 = 192.168.0.133
#DNS.1 = MYDNS (You can use DNS if you have a dns name if you use IP then use the above line)

Generate the certificate using our CSR, the CA private key, the CA certificate, and the config file

openssl x509 -req -in zabbix.mycompany.internal.csr -CA myCA.pem -CAkey myCA.key \
-CAcreateserial -out zabbix.mycompany.internal.crt -days 825 -sha256 -extfile zabbix.mycompany.internal.ext

Copy the SSL certificates to our Virtual Host

cp zabbix.mycompany.internal.crt /etc/pki/tls/certs/.
cp zabbix.mycompany.internal.key /etc/pki/tls/private/.

Import the CA in Linux (RHEL)

We need to update the CA certificates, so run the below command to update the CA certs.

cp myCA.pem /etc/pki/ca-trust/source/anchors/myCA.crt
update-ca-trust extract

Import the CA in OSX

  • Open the macOS Keychain app
  • Navigate to File > Import Items
  • Choose your private key file (i.e., myCA.pem)
  • Search for the “Common Name” you provided earlier
  • Double-click on your root certificate in the list
  • Expand the Trust section
  • Modify the “When using this certificate:” dropdown to “Always Trust”
  • Close the certificate window

Import the CA in Windows

  • Open the “Microsoft Management Console” by pressing Windows + R, typing mmc, and clicking Open
  • Navigate to File > Add/Remove Snap-in
  • Select Certificates and click Add
  • Choose Computer Account and proceed by clicking Next
  • Select Local Computer and click Finish
  • Click OK to return to the MMC window
  • Expand the view by double-clicking Certificates (local computer)
  • Right-click on Certificates under “Object Type” in the middle column, select All Tasks, and then Import
  • Click Next, followed by Browse. Change the certificate extension dropdown next to the filename field to All Files (.) and locate the myCA.pem file
  • Click Open, then Next
  • Choose “Place all certificates in the following store.” with “Trusted Root Certification Authorities store” as the default. Proceed by clicking Next, then Finish, to finalize the wizard
  • If all went well you should find your certificate under Trusted Root Certification Authorities > Certificates

Warning! You also need to import the myCA.crt file in your OS. We are not an official CA, so we have to import it in our OS and tell it to trust this Certificate. This action depends on the OS you use.

As you are using OpenSSL, you should also create a strong Diffie-Hellman group, which is used in negotiating Perfect Forward Secrecy with clients. You can do this by typing:

openssl dhparam -out /etc/ssl/certs/dhparam.pem 2048

Adapt your Nginx Zabbix config

Add the following lines to your Nginx configuration, modifying the file paths as needed. Replace the existing lines with port 80 with this configuration. This will enable SSL and HTTP2.

# vi /etc/nginx/conf.d/zabbix.conf
server {
listen 443 http2 ssl;
listen [::]:443 http2 ssl;
server_name <ip qddress>;
ssl_certificate /etc/ssl/certs/zabbix.mycompany.internal.crt;
ssl_certificate_key /etc/pki/tls/private/zabbix.mycompany.internal.key;
ssl_dhparam /etc/ssl/certs/dhparam.pem;

To redirect traffic from port 80 to 443 we can add the following lines above our https block:

server {
listen 80;
server_name _; #dns or ip is also possible
return 301 https://$host$request_uri;
}

Restart all services and allow https traffic

systemctl restart php-fpm.service
systemctl restart nginx

firewall-cmd --add-service=https --permanent
firewall-cmd —reload

When we go to our url http://<IP or DNS>/ we get redirected to our https:// page and when we check we can see that our site is secure:

You can check out this article in its original form (and keep an eye out for more of Patrik’s helpful tips) at https://trikke76.github.io/Zabbix-Book/security/securing-zabbix/.

The post Securing the Zabbix Frontend appeared first on Zabbix Blog.

Handy Tips #40: Simplify metric pattern matching by creating global regular expressions

Post Syndicated from Arturs Lontons original https://blog.zabbix.com/simplify-metric-pattern-matching-by-creating-global-regular-expressions/24225/

Streamline your data collection, problem detection and low-level discovery by defining global regular expressions. 

Pattern matching within unstructured data is mostly done by using regular expressions. Defining a regular expression can be a lengthy task, that can be simplified by predefining a set of regular expressions which can be quickly referenced down the line.  

Simplify pattern matching by defining global regular expressions:

  • Reference global regular expressions in log monitoring and snmp trap items
  • Simplify pattern matching in trigger functions and calculated items
  • Global regular expressions can be referenced in low-level discovery filters
  •  Combine multiple subexpressions into a single global regular expression
Check out the video to learn how to define and use global regular expressions.
Define and use global regular expressions: 
  1. Navigate to Administration General Regular expressions
  2. Type in your global regular expression name
  3. Select the regular expression type and provide subexpressions
  4. Press Add and provide multiple subexpressions
  5. Navigate to the Test tab and enter the test string
  6. Click on Test expressions and observe the result
  7. Press Add to save and add the global regular expression
  8. Navigate to Configuration Hosts
  9. Find the host on which you will test the global regular expression
  10. Click on either the Items, Triggers or Discovery button to open the corresponding section
  11. Find your item, trigger or LLD rule and open it
  12. Insert the global regular expression
  13. Use the @ symbol to reference a global regular expression by its name
  14. Update the element to save the changes
Tips and best practices
  • Each subexpressions and the total combined result can be tested in Zabbix frontend 
  • Zabbix uses AND logic if several subexpressions are defined 
  • Global regular expressions can be referenced by referring to their name, prefixed with the @ symbol 
  • Zabbix documentation contains the list of locations supporting the usage of global regular expression. 

Sign up for the official Zabbix Certified Specialist course and learn how to optimize your data collection, enrich your alerts with useful information, and minimize the amount of noise and false alarms. During the course, you will perform a variety of practical tasks under the guidance of a Zabbix certified trainer, where you will get the chance to discuss how the current use cases apply to your own unique infrastructure. 

The post Handy Tips #40: Simplify metric pattern matching by creating global regular expressions appeared first on Zabbix Blog.
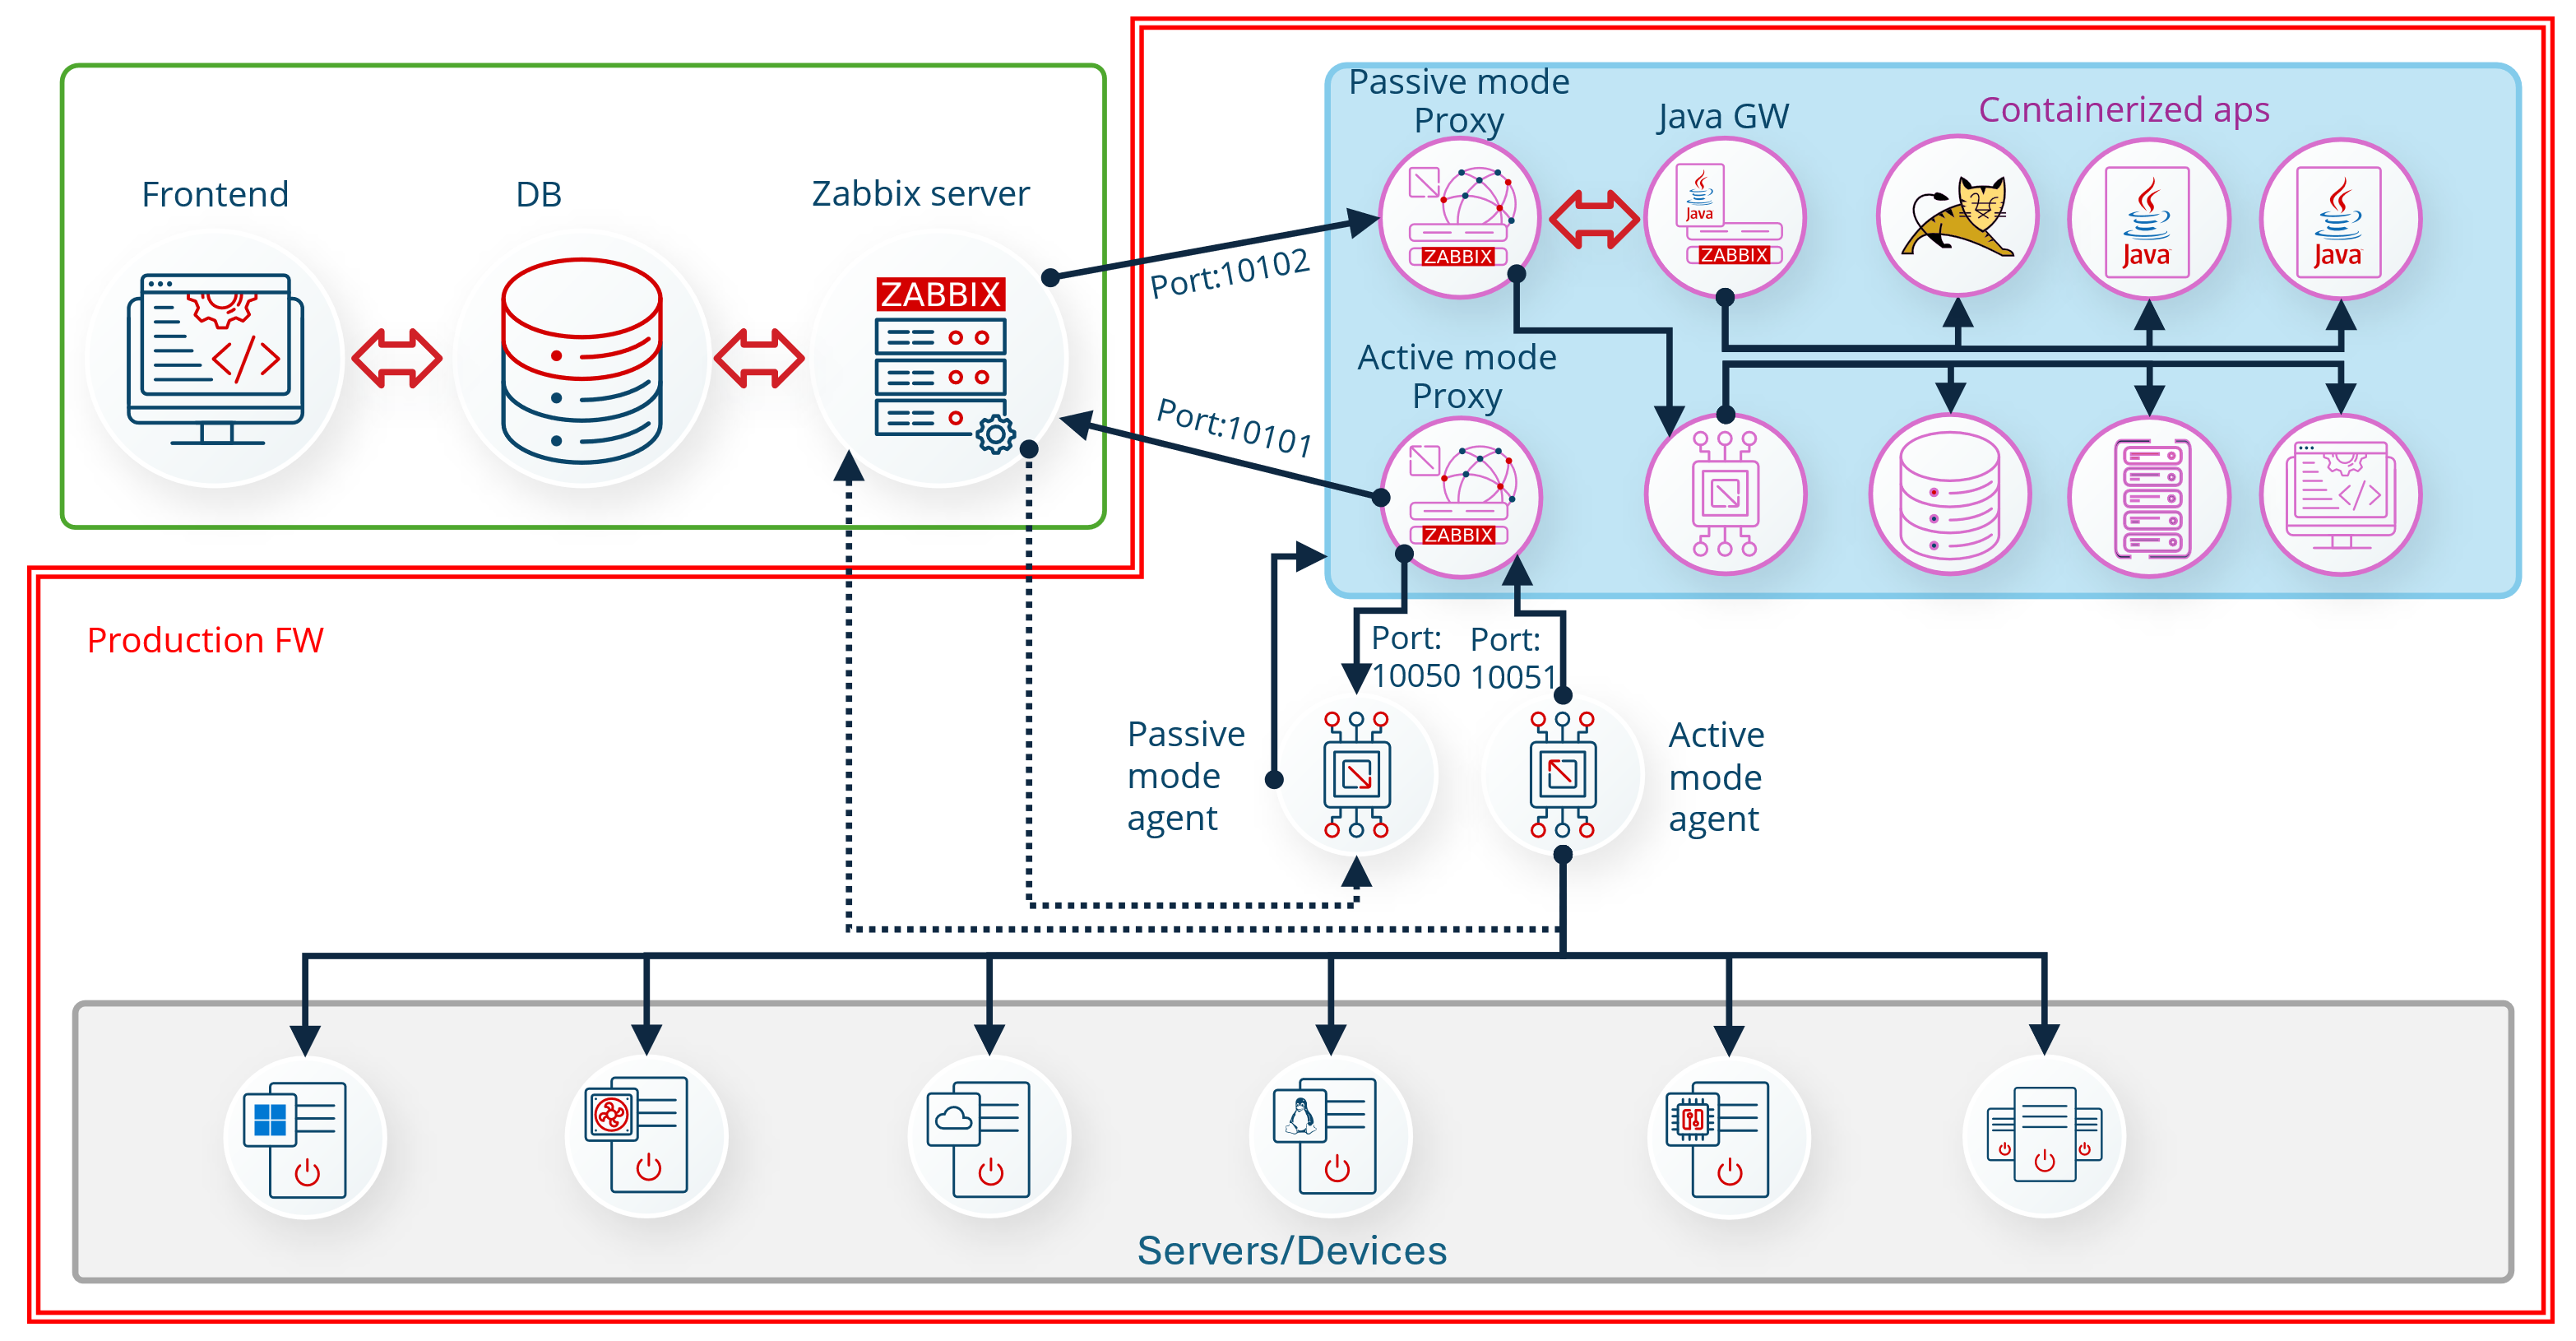
Handy Tips #39: Extracting metrics from structured data with Zabbix preprocessing

Post Syndicated from Arturs Lontons original https://blog.zabbix.com/handy-tips-39-extracting-metrics-from-structured-data/24163/

Collect structured data in bulk and use Zabbix preprocessing to extract and transform the necessary metrics. 

Collecting data from custom monitoring endpoints such as web applications or custom in-house software can result in the collected data requiring further extraction or transformation to fit our requirements. 

Use Zabbix preprocessing to extract metrics from structured data: 

  • Extract data with JSONPath and XPath expressions
  • Transform XML and CSV data to JSON structures

  • Check for error messages in JSON and XML structures
  • Extract and transform metrics from Prometheus exporter endpoints

Check out the video to learn how to use Zabbix preprocessing to extract metrics from structured data.

Extract metrics from structured data with Zabbix preprocessing: 

  1. Navigate to Configuration → Hosts
  2. Find the host where structured data is collected
  3. Click on the Items button next to the host
  4. Create or open an item collecting structured data
  5. For this example, we will transform CSV to JSON
  6. Open the Preprocessing tab
  7. Select a structured data preprocessing rule
  8. If required, provide the necessary parameters
  9. Optionally, select a validation preprocessing step
  10. For this example, we will check for errors in JSON
  11. Extract a value by using JSONPath or XML XPath preprocessing steps
  12. Press Test to open the test window
  13. Press Get value and test to test the item
  14. Close the test window and press Add or Update to add or update the item
  15. Optionally, create dependent items to extract values from this item

Tips and best practices
  • You check the Handy Tips #37 to learn how to collect structured data from HTTP end-points 

  • For CSV to JSON preprocessing the first parameter allows you specify a CSV delimiter, while the second parameter specifies the quotation symbol 

  • For CSV to JSON preprocessing If the With header row checkbox is marked, the header line values will be interpreted as column names 

  • For details on XML to JSON preprocessing, refer to our serialization rules for more details. 

Learn how to leverage the many types of data collection provided by Zabbix and empower your data collection and processing. Sign up for our Zabbix Certified Specialist course, where under the guidance of a Zabbix certified trainer you will learn more about different types and technologies of monitoring and learn how to get the most out of your Zabbix instance. 

The post Handy Tips #39: Extracting metrics from structured data with Zabbix preprocessing appeared first on Zabbix Blog.

Handy Tips #38: Automating SNMP item creation with low-level discovery

Post Syndicated from Arturs Lontons original https://blog.zabbix.com/handy-tips-38-automating-snmp-item-creation-with-low-level-discovery/23521/

Let Zabbix automatically discover and start monitoring your SNMP data points.

Creating items manually for each network interface, fan, temperature sensor, and other SNMP data points can be a very time-consuming task. To save time, Zabbix administrators need to automate item, trigger, and graph creation as much as possible.

Automate item, trigger and graph creation with SNMP low-level discovery rules:

  • An entity will be created for each of the discovered indexes
  • Specify multiple OIDs to discover additional information about an entity

  • Filter entities based on any of the discovered OID values
  • Low-level discovery can be used with SNMP v1, v2c and v3

Check out the video to learn how to use Zabbix low-level discovery to discover SNMP entities.

How to use Zabbix low-level discovery to discover SNMP entities:

  1. Navigate to ConfigurationHosts and find your SNMP host
  2. Open the Discovery section and create a discovery rule
  3. Provide a name, a key, and select the Type – SNMP agent
  4. Populate the SNMP OID field with the following LLD syntax
  5. discovery[{#LLD.MACRO1},<OID1>,{#LLD.MACRO2},<OID2>]
  6. Navigate to the Filters section and provide the LLD filters
  7. Press Add to create the LLD rule
  8. Open the Item prototypes section and create an item prototype
  9. Provide the Item prototype name and key
  10. Populate the OID field ending it with the {#SNMPINDEX} LLD macro
  11. Configure the required tags and preprocessing rules
  12. Press Add to create the item prototype
  13. Wait for the LLD rule to execute and observe the discovered items

Tips and best practices
  • snmpwalk tool can be used to list the OIDs provided by the monitored device
  • If a particular entity does not have the specified OID, the corresponding macro will be omitted for it
  • OIDs can be added to your LLD rule for usage in filters and tags
  • The {#SNMPINDEX} LLD macro is discovered automatically based on the indexes listed for each OID in the LLD rule

Learn how Zabbix low-level discovery rules can be used to automate the creation of your Zabbix entities by attending our Zabbix Certified Professional course. During the course, you will learn the many use cases of low-level discovery by performing a variety of practical tasks under the guidance of a Zabbix certified trainer.

The post Handy Tips #38: Automating SNMP item creation with low-level discovery appeared first on Zabbix Blog.

Handy Tips #37: Collecting metrics from HTTP endpoints with HTTP agent items

Post Syndicated from Arturs Lontons original https://blog.zabbix.com/handy-tips-37-collecting-metrics-from-http-endpoints-with-http-agent-items/23160/

Collect metrics from HTTP endpoints such as web application APIs by defining HTTP agent items.

Collecting metrics from web services and applications is a complex affair usually done by scripting around CLIs and APIs. Organizations require an efficient way to monitor such and endpoints and react to collected data.

Collect and react to data from web services and applications with Zabbix HTTP agent items:

  • Collect metrics agentlessly using HTTP/HTTPS protocols
  • Collect metrics in bulk to reduce the number of outgoing requests

  • Zabbix preprocessing can be utilized to extract the required metrics from the response
  • Select from multiple HTTP authentication types

Check out the video to learn how to define HTTP items and collect metrics from HTTP endpoints.

Define HTTP items and collect metrics from HTTP endpoints:

  1. Navigate to ConfigurationHosts and find your host
  2. Open the Items section and press the Create item button
  3. Select TypeHTTP agent
  4. Provide the item key, name and URL
  5. For now, set the Type of information to Text
  6. Optionally, provide the request body and required status codes
  7. Press the Test button and then press Get value and test
  8. Save the resulting value to help you define the preprocessing steps
  9. Navigate to the Preprocessing tab
  10. Define a JSONPath preprocessing step to extract a value from the previous test result
  11. Navigate to the Item section
  12. Change the Type of information to Numeric (float)
  13. Perform the item test one more time
  14. Press Add to add the item

Tips and best practices
  • HTTP item check is executed by Zabbix server or Zabbix proxy
  • Zabbix will follow redirects if the Follow redirects option is checked
  • HTTP items have their own Timeout parameter defined in the item configuration
  • Receiving a status code not listed in the Required status codes field will result in the item becoming unsupported

Learn how to automate your Zabbix configuration workflows and integrate Zabbix with external systems by signing up for the Automation and Integration with Zabbix API course. During the course, students will learn how to use the Zabbix API by implementing different use cases under the guidance of a Zabbix certified trainer.

The post Handy Tips #37: Collecting metrics from HTTP endpoints with HTTP agent items appeared first on Zabbix Blog.

Handy Tips #36: Collecting custom metrics with Zabbix agent user parameters

Post Syndicated from Arturs Lontons original https://blog.zabbix.com/handy-tips-36-collecting-custom-metrics-with-zabbix-agent-user-parameters/22850/

Define custom agent keys to collect custom metrics by executing scripts or commands with Zabbix user parameters.

Having a simple way to extend the metric collection functionality of a monitoring tool can be vital if we wish to monitor custom in-house software or simply collect metrics not available out of the box.

Collect custom metrics with Zabbix agent by defining user parameters:

  • Define an unlimited number of user parameters for your Zabbix agents
  • Parameters such as usernames and passwords can be passed to flexible user parameters

  • User parameters support Zabbix agent data collection in active and passive modes
  • User parameters can collect bulk data for further processing by dependent items

Check out the video to learn how to define user parameters for Zabbix agents.

Define user parameters for Zabbix agents:

  1. Test your custom command on the host on which you will create the user parameter
  2. Open the Zabbix agent configuration file in a text editor
  3. A simple user parameter can be defined by adding the line: UserParameter=key,command
  4. A flexible user parameter can be defined by adding the line: UserParameter=key[*],command
  5. For flexible user parameters, use $1…$9 positional references to reference your custom key parameters
  6. Save the changes
  7. Reload user parameters by using the command zabbix_agentd -R userparameter_reload
  8. Open the Zabbix frontend and navigate to ConfigurationHosts
  9. Find your host and click on the Items button next to the host
  10. Press the Create item button
  11. Give your item a name and select the item type – Zabbix agent or Zabbix agent (active)
  12. Provide the key that you defined as your user parameter key
  13. For flexible user parameters, provide the key parameters
  14. Press the Test button and then press Get value and test to test your user parameter
  15. Press the Add button to add the item

Tips and best practices
  • User parameter commands need to be executed within the Zabbix agent Timeout parameter value
  • User parameters can be reloaded by executing the zabbix_agentd -R userparameter_reload command
  • User parameters can be defined in the Zabbix agent configuration file, or the files specified by the Include parameter
  • By default, certain symbols are not permitted to be used in user parameters
  • The usage of restricted characters can be permitted by setting the value of UnsafeUserParameters parameter to 1

Learn how to leverage the many types of data collection provided by Zabbix and empower your data collection and processing. Sign up for our Zabbix Certified Specialist course, where under the guidance of a Zabbix certified trainer you will learn more about different types and technologies of monitoring and learn how to get the most out of your Zabbix instance.

The post Handy Tips #36: Collecting custom metrics with Zabbix agent user parameters appeared first on Zabbix Blog.
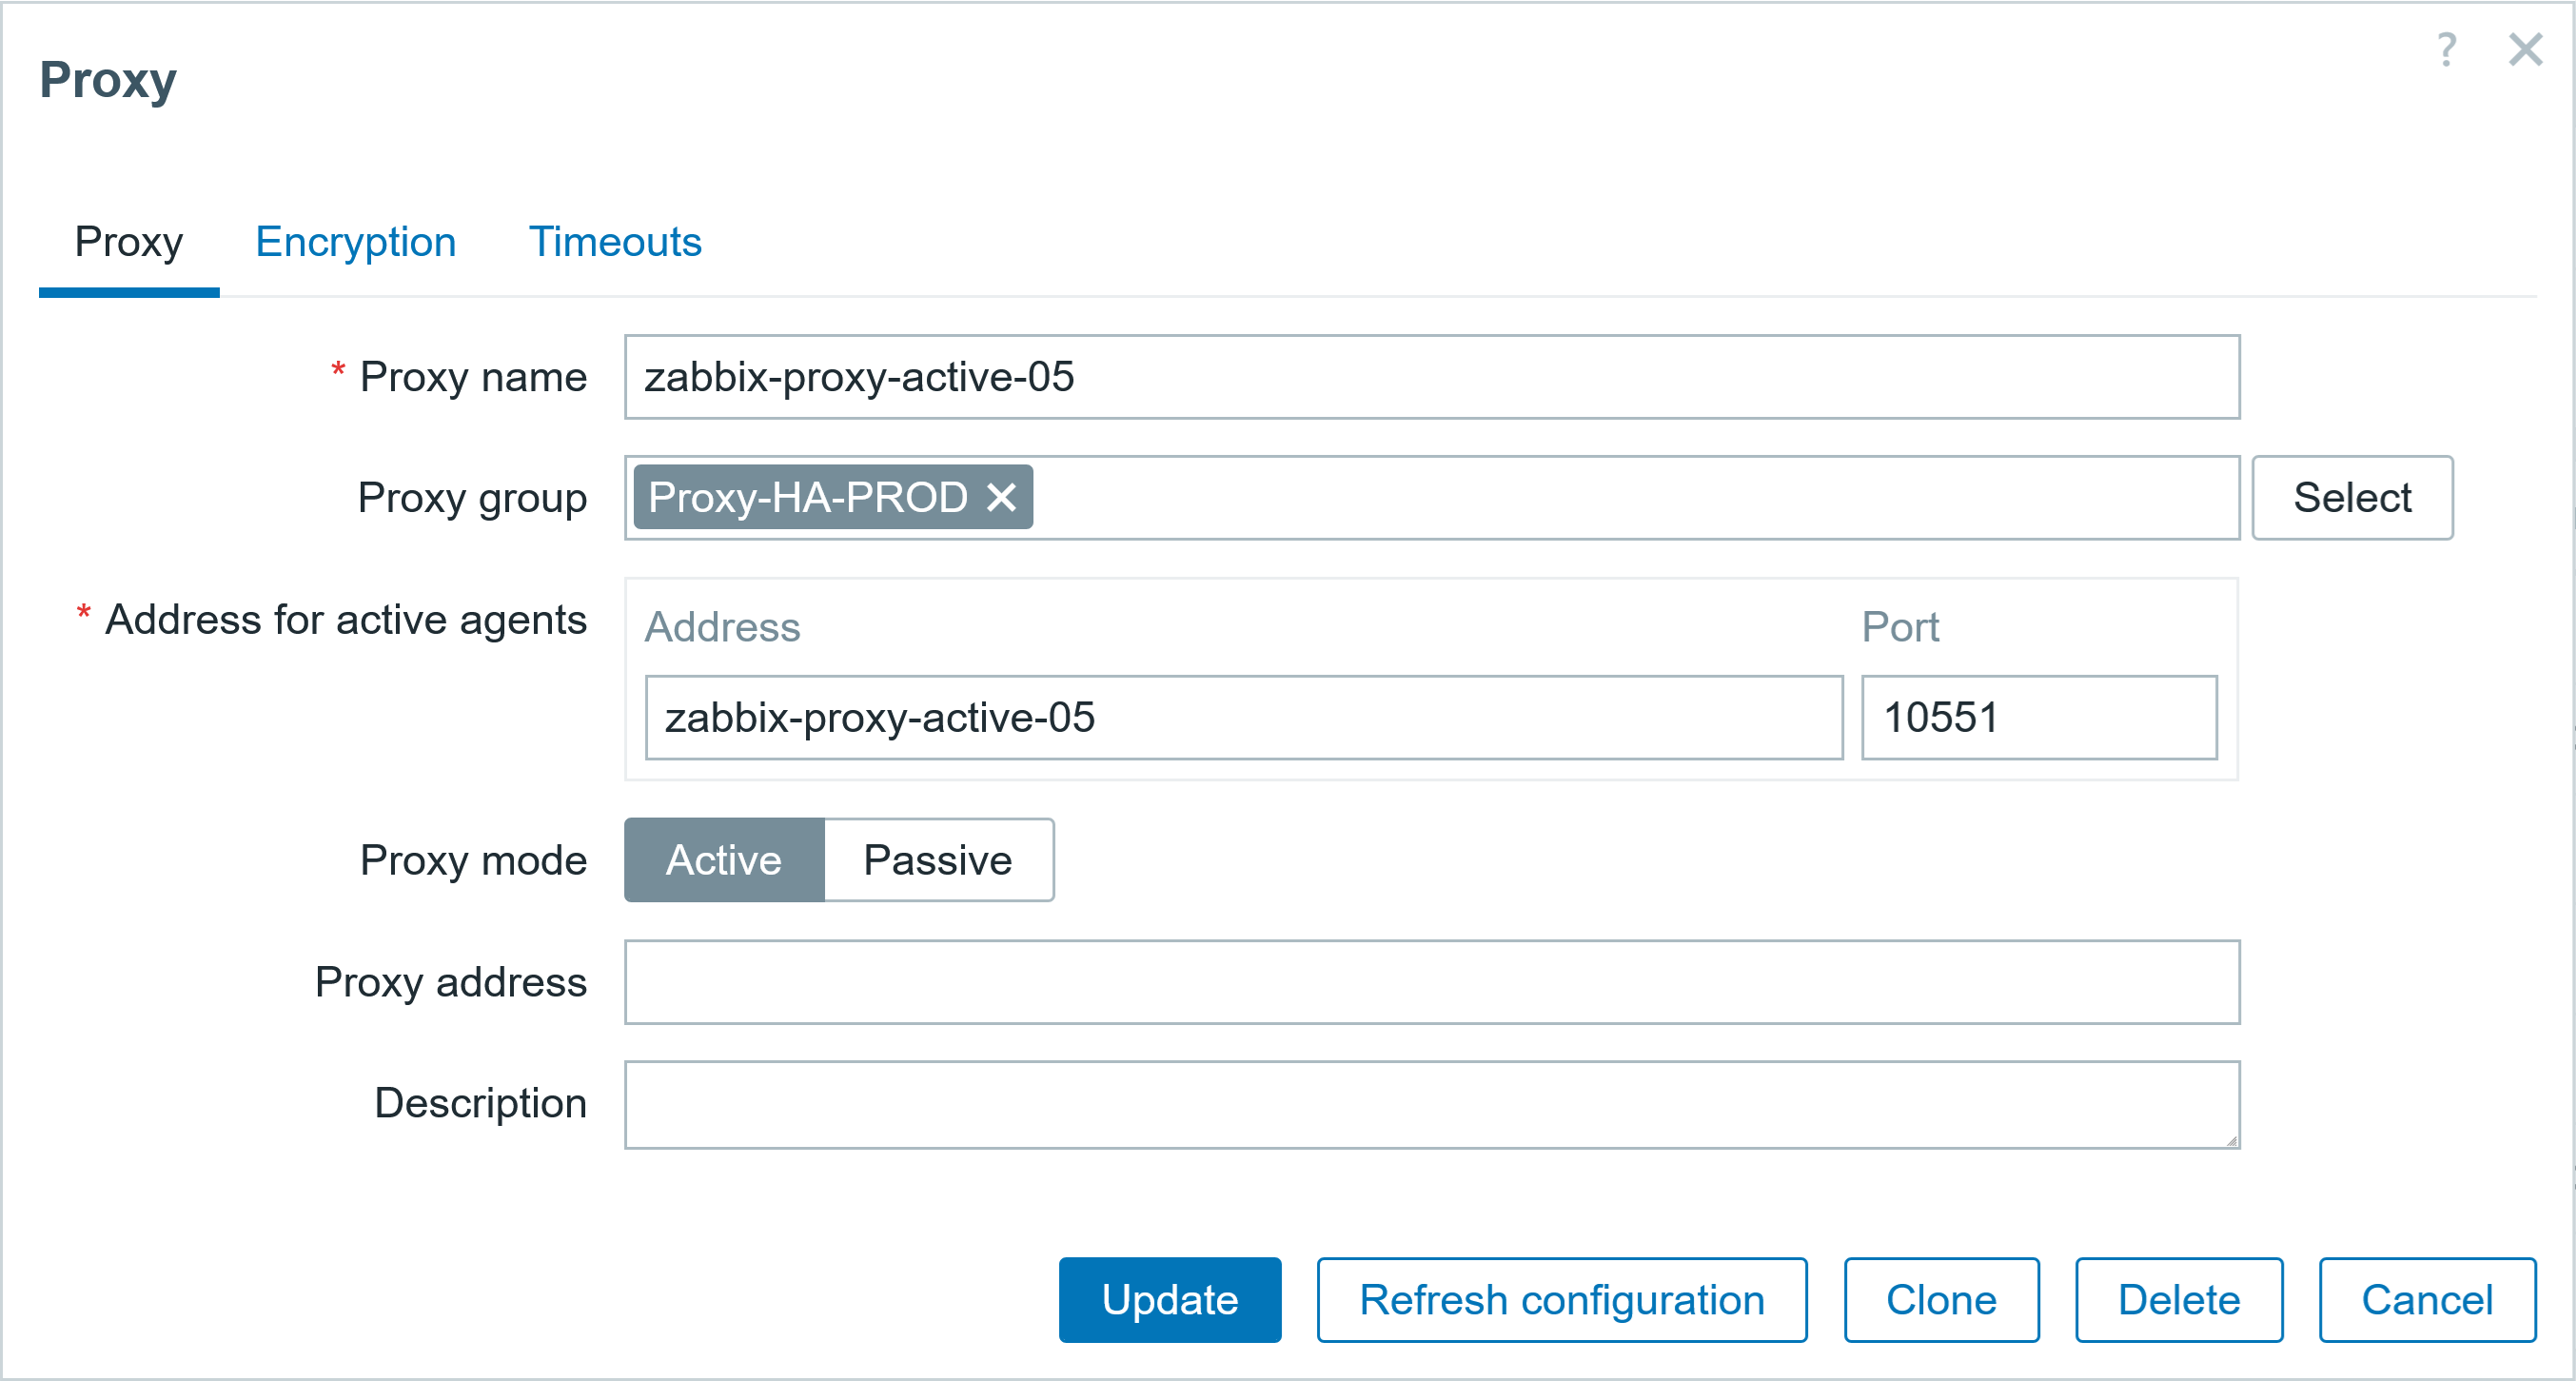
Handy Tips #35: Monitoring log file entries with Zabbix agent

Post Syndicated from Arturs Lontons original https://blog.zabbix.com/handy-tips-35-monitoring-log-file-entries-with-zabbix-agent/22607/

Collect and react on entries in your Windows or Linux logs with Zabbix log monitoring.

Log file entries can contain OS or application-level information that can help you react proactively to potential issues or track the root cause of a problem after it has occurred.  For this reason, keeping a constant lookout for issues in mission-critical log files is vital.

Collect log file entries with Zabbix agent and react on them:

  • Zabbix agent can monitor log files on Windows and Unix-like operating systems
  • Decide between collecting every log entry or only entries matching your criteria

  • Monitor Windows event logs and collect entries matching specific severity, source or eventid
  • Choose between returning the whole log line or simply count the number of matched lines

Check out the video to learn how to collect and match log file entries.

How to match and collect log file entries:

  1. Navigate to ConfigurationHosts
  2. Find your Host
  3. Click on the Items button next to the host
  4. Click the Create item button
  5. Select the item type – Zabbix agent (active)
  6. Make sure that the Type of information is selected as Log
  7. Provide the item name and key
  8. Select the log item key
  9. Use the log file as the first parameter of the key
  10. The second parameter should contain a regular expression used to match the log lines
  11. Optionally, provide the log time format to collect the local log timestamp
  12. Set the Update interval to 1s
  13. Press the Add button
  14. Generate new log line entries
  15. Navigate to MonitoringLatest data
  16. Confirm that the matching log entries are being collected

Tips and best practices
  • Log monitoring is supported only by active Zabbix agent
  • If restarted, Zabbix agent will continue monitoring the log file from where it left off
  • The mode log item parameter can be used to specify should the monitoring begin from the start of the file or its latest entry
  • The logrt item can be used to monitor log files that are being rotated
  • The output parameter can be used to output specific regexp capture groups

Learn how to configure and optimize your log monitoring by attending our Zabbix Certified Specialist course, where under the guidance of a Zabbix certified trainer you will obtain hands-on experience with different log file monitoring items and learn how to create trigger expressions to detect problems based on the collected log lines.

The post Handy Tips #35: Monitoring log file entries with Zabbix agent appeared first on Zabbix Blog.

Handy Tips #34: Creating context-sensitive problem thresholds with Zabbix user macros

Post Syndicated from Arturs Lontons original https://blog.zabbix.com/handy-tips-34-creating-context-sensitive-problem-thresholds-with-zabbix-user-macros/22281/

Provide context and define custom problem thresholds by using Zabbix user macros.

Problem thresholds can vary for the same metric on different monitoring endpoints. We can have a server where having 10% of free space is perfectly fine, and a server where anything below 20% is a cause for concern.

Define Zabbix user macros with context:

  • Override the default macro value with a context-specific value
  • Add flexibility by using context macros as problem thresholds

  • Define a default value that will be used if a matching context is not found
  • Any low-level discovery macro value can be used as the context

Check out the video to learn how to define and use user macros with context:

How to define macros with context:

  1. Navigate to ConfigurationHosts
  2. Click on the Discovery button next to your host
  3. Press the Create discovery rule button
  4. We will use the net.if.discovery key to discover network interfaces
  5. Add the discovery rule
  6. Press the Item prototypes button
  7. Press the Create item prototype button
  8. We will use the net.if.in[“{#IFNAME}”] item key
  9. Add the Change per second and Custom multiplier:8 preprocessing steps
  10. Add the item prototype
  11. Press the trigger prototypes button
  12. Press the Create trigger prototype button
  13. Create a trigger prototype: avg(/Linux server/net.if.in[“{#IFNAME}”],1m)>{$IF.BAND.MAX:”{#IFNAME}”}
  14. Add the trigger prototype
  15. Click on the host and navigate to the Macros section
  16. Create macros with context
  17. Provide context for interface names: {$IF.BAND.MAX:”enp0s3″}
  18. Press the Update button
  19. Simulate a problem and check if context is taken into account

Tips and best practices
  • Macro context can be matched with static text or a regular expression
  • Only low-level discovery macros are supported in the context
  • Simple context macros are matched before matching context macros that contain regular expressions
  • Macro context must be quoted with ” if the context contains a } character or starts with a ” character

Learn how to get the most out of your low-level discovery rules to create smart and flexible items, triggers, and hosts by registering for the Zabbix Certified Professional course. During the course, you will learn how to enhance your low-level discovery workflows by using overrides, filters, macro context, and receive hands-on practical experience in creating fully custom low-level discovery rules from scratch.

The post Handy Tips #34: Creating context-sensitive problem thresholds with Zabbix user macros appeared first on Zabbix Blog.

Handy Tips #33: Pause unwanted alarms by suppressing your problems

Post Syndicated from Arturs Lontons original https://blog.zabbix.com/handy-tips-33-pause-unwanted-alarms-by-suppressing-your-problems/21981/

Suppress problems indefinitely or until a specific point in time with the problem suppression feature.

There are plenty of use cases when detected infrastructure or business problems need to be temporarily suppressed, and the alerting workflows have to be paused. This applies to scenarios such as emergency maintenance, unexpected load on your systems, migrations to new environments, and many others.

Use Zabbix problem suppression feature to suppress unwanted problems and pause your alerts:

  • Suppress problems indefinitely or until a specific point in time
  • Suppress a single problem or together with all of the related problems

  • Pause your actions until the problem suppression is over
  • Use relative or absolute time syntax to suppress problems until a specific point in time

Check out the video to learn how to use the problem suppression feature:

How to suppress unwanted problems:

  1. Open the MonitoringProblems page or a Problems widget
  2. Find the problem that you wish to suppress
  3. Press the No button under the Ack column
  4. Select the suppression scope
  5. Mark the Suppress checkbox
  6. Select the suppression method
  7. If you have selected Until provide the date or suppression interval
  8. Optionally, provide a message that will be visible to others
  9. Press the Update button
  10. Once the window has been refreshed, the problem will be hidden
  11. Open the Problems widget or the Problems page configuration
  12. Mark the Show suppressed problems checkbox
  13. Inspect the suppressed problem

Tips and best practices
  • Once suppressed the problem is marked by a blinking suppression icon in the Info column, before being hidden
  • A suppressed problem may be hidden or shown, depending on the problem filter/widget settings
  • Suppression details are displayed in a popup when positioning the mouse on the suppression icon in the Actions column
  • The event.acknowledge API method can be used to suppress/unsuppress a problem via Zabbix API

Do you wish to learn how to automatically detect and resolve complex problems in your infrastructure by creating smart problem thresholds?
Check out the Advanced Problem and Anomaly Detection with Zabbix training course, where under the guidance of a Zabbix certified trainer you will learn how to get the most out of Zabbix problem detection.

The post Handy Tips #33: Pause unwanted alarms by suppressing your problems appeared first on Zabbix Blog.

Handy Tips #32: Deploying Zabbix in the Azure cloud platform

Post Syndicated from Arturs Lontons original https://blog.zabbix.com/handy-tips-32-deploying-zabbix-in-the-azure-cloud-platform/21355/

Deploy your Zabbix servers and proxies in the Azure cloud.

There are many use cases where deploying your Zabbix server or Zabbix proxies in the cloud can reduce costs, provide an additional layer of security and redundancy, and improve the available management toolset.
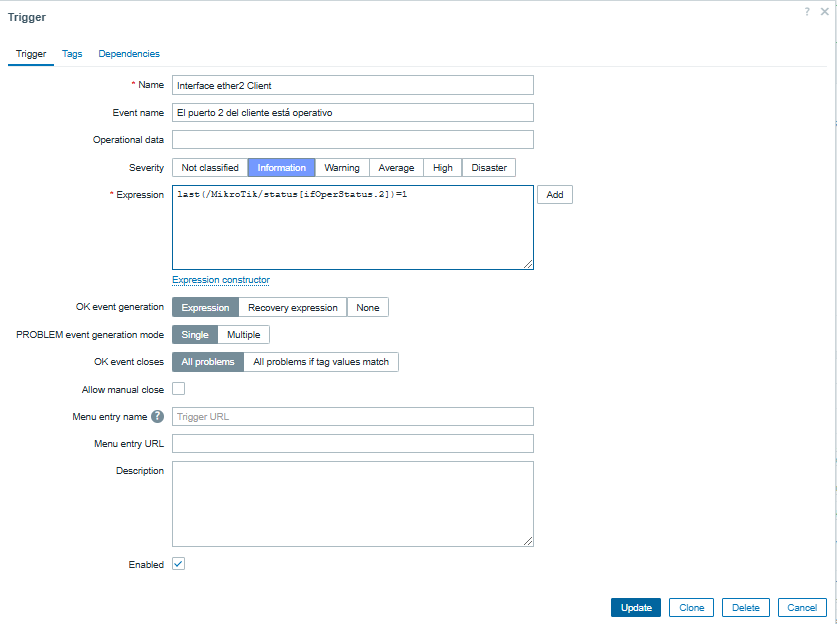
Deploy your Zabbix instance in the Azure cloud with the official Zabbix cloud images:

  • Cloud images are available for the latest Zabbix server and proxy versions
  • Deploy a fresh Zabbix instance in 5 minutes

  • Dynamically scale the cloud resources
  • Select the deployment options based on your budget

Check out the video to learn how to deploy Zabbix in the Microsoft Azure cloud platform:

How to deploy Zabbix in the Azure cloud platform:

  1. Navigate to the Zabbix Cloud Images page
  2. Select the Microsoft Azure vendor and Zabbix server cloud image
  3. Press the Get it now button and press Continue in the next window
  4. On the deployment page press the Create button
  5. Provide the virtual machine name, resource group, region
  6. Specify the administrator account settings
  7. Provide the disk, network, tag, and advanced settings
  8. Verify the provided settings
  9. Press Create to begin deploying the virtual machine
  10. For public key authentication: download and store the private key
  11. Once the deployment is complete, press the Go to resource button
  12. Save your public IP address and connect to it via SSH
  13. Save the initial frontend username and password
  14. Use the public IP address to connect to your Zabbix frontend
  15. Log in with the saved username and password obtained

Tips and best practices
  • The default SSH user is called azureuser
  • Remember to store your SSH private key in a secure location
  • You can access the Zabbix database by using the root user
  • The password for the MySQL database root user is stored in /root/.my.cnf configuration file

Feeling overwhelmed with deploying and managing your Zabbix instance?
Check out the Zabbix certified specialist courses, where under the guidance of a Zabbix certified trainer, you will learn how to deploy, configure and manage your Zabbix instance.

The post Handy Tips #32: Deploying Zabbix in the Azure cloud platform appeared first on Zabbix Blog.