Post Syndicated from Danilo Poccia original https://aws.amazon.com/blogs/aws/introducing-amazon-braket-hybrid-jobs-set-up-monitor-and-efficiently-run-hybrid-quantum-classical-workloads/
I find quantum computing fascinating! At its simplest level, it extends the concept of bits, that have 0 or 1 values, with quantum bits, or qubits, that can have a combination of two different (quantum) states.
Two characteristics make qubits really interesting:
- When you look at the value of a qubit, you get only one of the two possible states with a probability that depends on how its own states are combined.
- Multiple qubits can be “connected” together (this is called quantum entanglement) so that by changing the state of one, even just by reading its value, you alter the states of the others.
These characteristics come from low-level properties described by quantum mechanics, a fundamental theory in physics that provides a description of the physical properties of nature at atomic and subatomic scales. Luckily, we don’t need a degree in quantum mechanics to use quantum computing in the same way we don’t need to be expert in semiconductors to use an ordinary computer.
Using qubits, researchers are designing new algorithms that have the potential to be much faster than what classical computers can achieve. To help speed up scientific research and software development for quantum computing, we introduced Amazon Braket at re:Invent 2019. A fully managed quantum computing service, Amazon Braket allows you to build, test, and run quantum algorithms on simulators and quantum computers.
Hybrid Algorithms and Quantum Processing Units (QPUs)
Quantum algorithms, which would be transformational in many different areas, require the execution of hundreds of thousands to millions of quantum gates. Unfortunately, the current generation of QPUs suffer from noise, creating errors that limit operations to only a few hundreds or thousands of gates before the errors take over.
To help solve this, we can take inspiration from machine learning: instead of using fixed quantum circuits, the logic that implements the algorithm, we let the algorithm “learn” by adjusting the parameters that tune the circuit to have a better chance of solving a given problem by adapting to the noise in a particular device (think of them as “self-learning quantum algorithms”).
This is similar to computer vision: instead of hand-crafting the features to distinguish a dog from a cat (which is notoriously difficult for a computer), machine learning algorithms “learn” the right features by iteratively adjusting parameters of a neural network.
A rapidly emerging area of research in quantum computing uses QPUs, the processors used by quantum computers, in the same way as GPUs are used in machine learning: Quantum circuits are parameterized, initialized with some values, and then run on the QPU. Like the weights in a neural network, these parameters are then iteratively adjusted based on the results of the computation. These so-called hybrid algorithms rely on rapid, iterative computations between classical computers and QPUs.

To run hybrid algorithms, you need to manually set up a classical infrastructure, install the required software, and manage the interaction between your quantum and classical compute processes for the duration of your hybrid algorithm. You then need to build custom monitoring solutions to visualize the progress of your algorithm to make sure it converges to the solution as expected or intervene if necessary to adjust the parameters of the algorithm.
Another big challenge is that QPUs are shared, inelastic resources, and you compete with others for access. This can slow down the execution of your algorithm. A single large workload from another customer can bring the algorithm to a halt, potentially extending your total runtime for hours. This is not only inconvenient but also impacts the quality of the results because today’s QPUs need periodic re-calibration, which can invalidate the progress of a hybrid algorithm. In the worst case, the algorithm fails, wasting budget and time.
Introducing Amazon Braket Hybrid Jobs
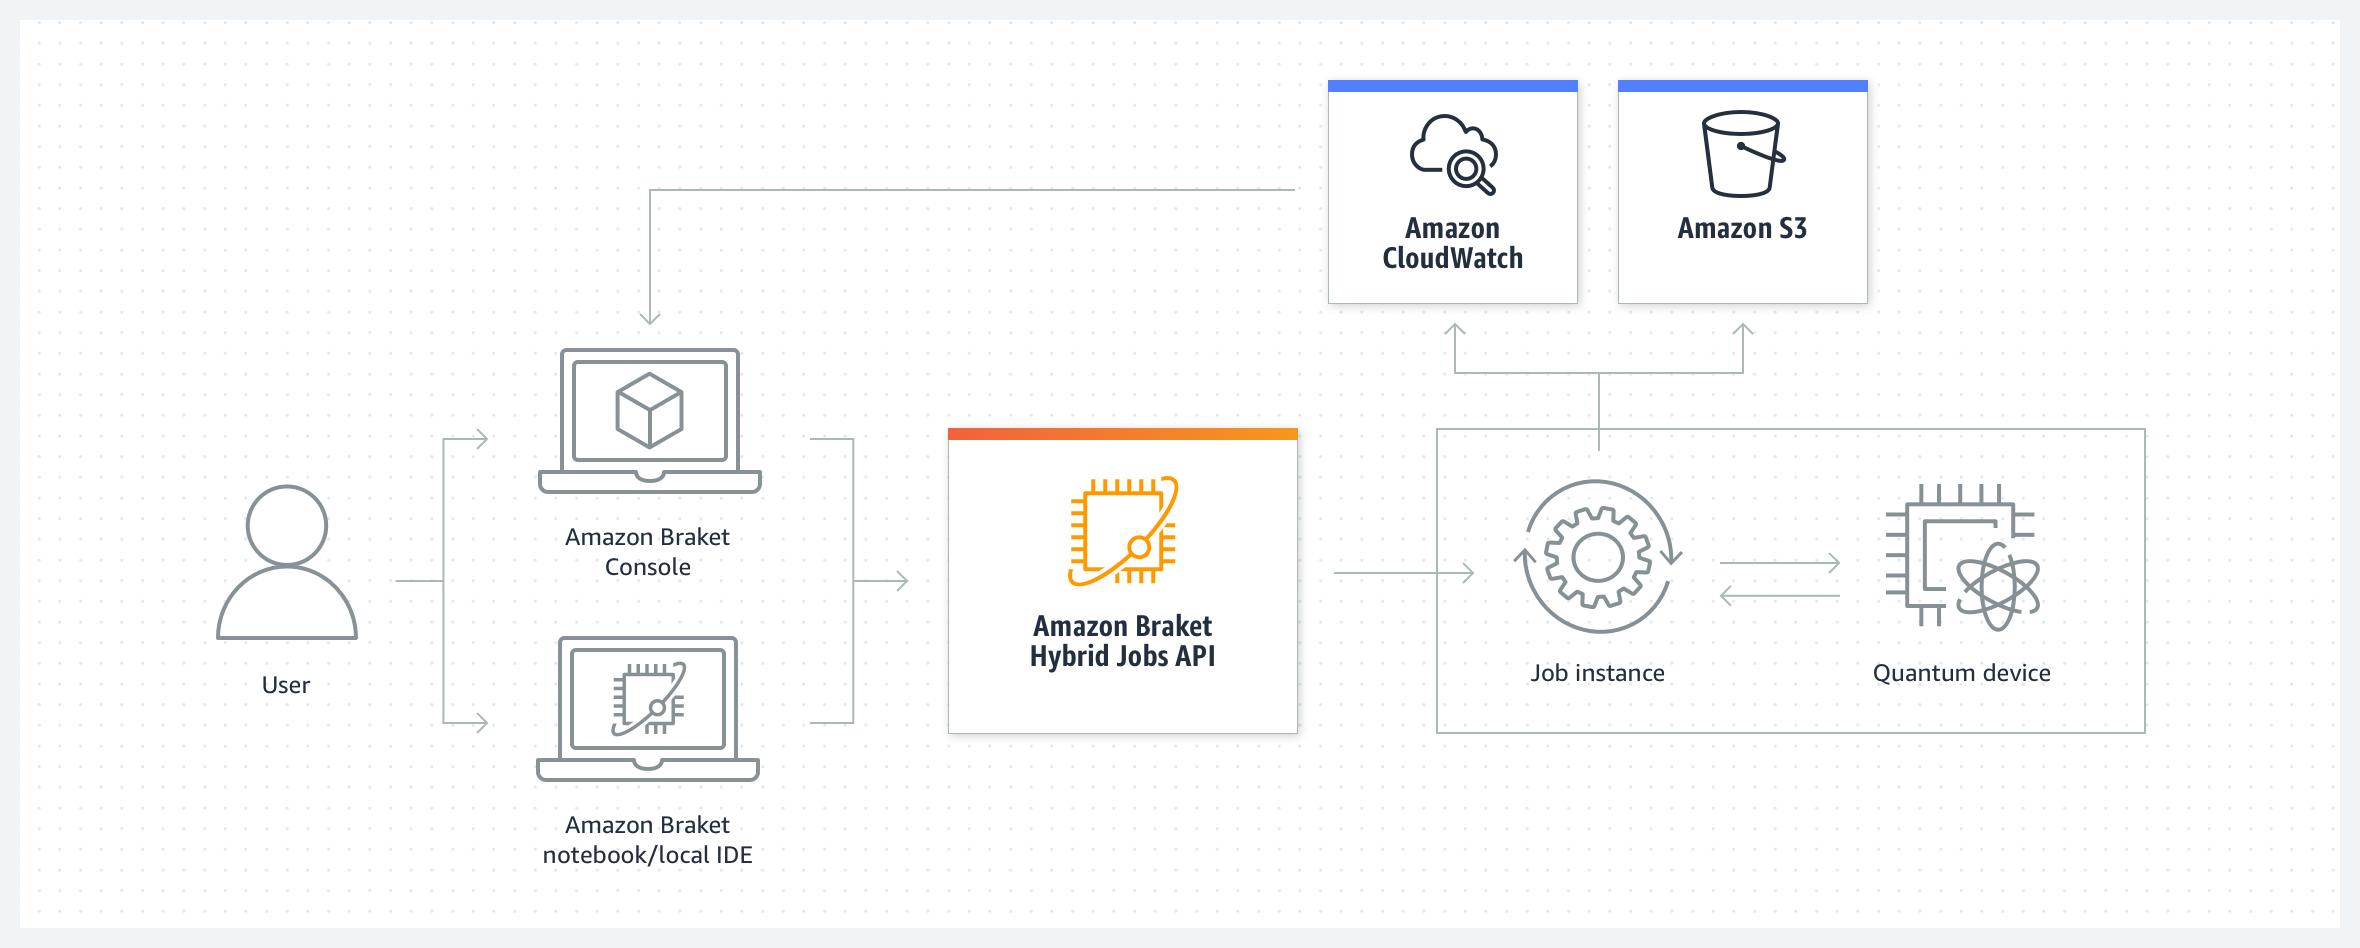
Today, I am happy to introduce Amazon Braket Hybrid Jobs, a new capability of Amazon Braket that simplifies the process of setting up, monitoring, and efficiently executing hybrid quantum-classical algorithms. Jobs are fully managed so you can avoid extensive infrastructure and software management and confidently execute your algorithms quickly and predictably, with on-demand priority access to QPUs.
When you create a job, Amazon Braket spins up the job instance (providing a CPU environment based on an Amazon Elastic Compute Cloud (Amazon EC2) instance), executes the algorithm (using quantum hardware or simulators), and releases the resources once the job is completed so that you only pay for what you use. You can also define custom metrics for algorithms, which are automatically logged by Amazon CloudWatch and displayed in near real-time in the Amazon Braket console as the algorithm runs. This provides you with live insights into how your algorithm is progressing, creating the opportunity to adjust your algorithm as necessary and innovate more quickly.

To run hybrid algorithms as jobs, you can define your algorithm using the Amazon Braket SDK or with PennyLane, an open-source library for hybrid quantum computing. Let’s see how that works in practice with a couple of examples.
Using Amazon Braket Hybrid Jobs
Before building a trainable quantum algorithm, let’s get started by running a series of fixed quantum operations, what we’ll refer to as quantum tasks. I use Python and the Amazon Braket SDK to define a circuit that constructs what is called a bell state, a state which has a fifty-fifty chance of resolving to each of two states. It’s the quantum computing equivalent of tossing a coin.
Here’s the content of the algorithm_script.py file:
import os

from braket.aws import AwsDevice
from braket.circuits import Circuit
from braket.jobs import save_job_result


def start_here():

    print("Test job started!")

    device = AwsDevice(os.environ["AMZN_BRAKET_DEVICE_ARN"])

    results = []

    bell = Circuit().h(0).cnot(0, 1)
    for count in range(5):
        task = device.run(bell, shots=100)
        print(task.result().measurement_counts)
        results.append(task.result().measurement_counts)

    save_job_result({ "measurement_counts": results })

    print("Test job completed!")
This script uses the environment variable AMZN_BRAKET_DEVICE_ARN to instantiate the device that I select when creating the job.
Quantum computing is probabilistic. For this reason, circuits need to be evaluated multiple times to get accurate results. A single run is called a shot. The higher the number of shots, the better the accuracy of the result. In this case, the circuit is run for 100 shots.
I use the save_job_result function to store the results of my job so that I can analyze them at the end.
In the Amazon Braket console, I choose Jobs on the left panel and then Create job. To start, I give the job a name.

Then, I pass the file with the algorithm. The CPU component of the hybrid algorithm runs in a container, and I can choose which container image to use. For example, I can use a pre-built container image that includes software my algorithm depends on, such as PennyLane, TensorFlow, or PyTorch, or bring my own custom image. I select the Base container image because I don’t have external dependencies.

I leave all other settings to their default value. In this way, I use the SV1 simulator, rather than quantum hardware, to run the quantum tasks.

After some time, the job has completed, and I follow the link to the Amazon Simple Storage Service (Amazon S3) console to download the result. As expected, for each of the five tasks, the results show that the proportion of the 00 and 11 states is roughly 50:50. The proportions vary slightly because of the probabilistic nature of quantum computing.
{
    "braketSchemaHeader": {
        "name": "braket.jobs_data.persisted_job_data",
        "version": "1"
    },
    "dataDictionary": {
        "measurement_counts": [
            {
                "00": 51,
                "11": 49
            },
            {
                "00": 44,
                "11": 56
            },
            {
                "11": 51,
                "00": 49
            },
            {
                "00": 56,
                "11": 44
            },
            {
                "00": 49,
                "11": 51
            }
        ]
    },
    "dataFormat": "plaintext"
}
This example is quite basic because I am not running any classical logic other than initiating tasks. To see the real value, let’s see how it works with a hybrid algorithm where we tweak the parameters of the quantum circuit iteratively from task to task.
Using Amazon Braket Hybrid Jobs with Hybrid Algorithms
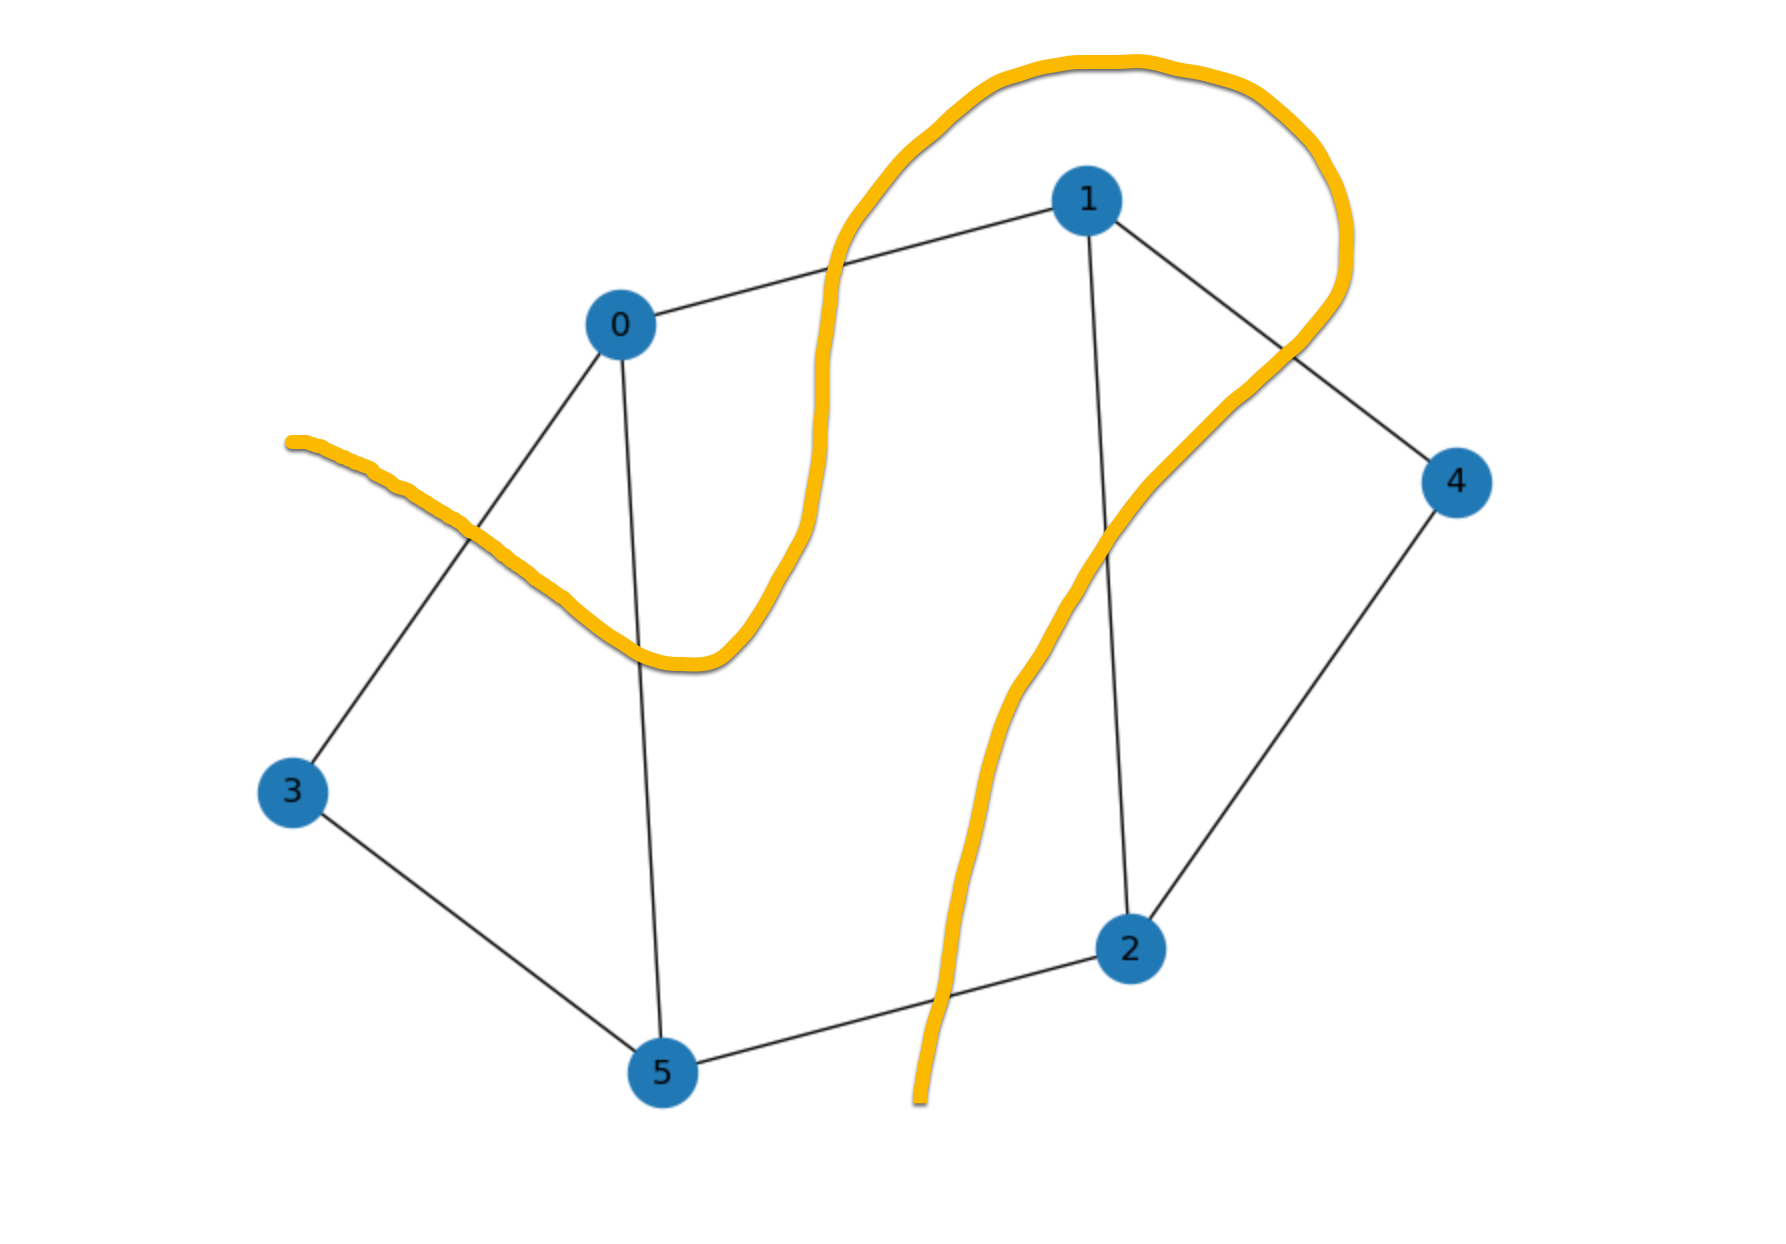
For a more advanced example, I use a well-known example of an actual hybrid algorithm, called the quantum approximate optimization algorithm (QAOA), included in the examples provided by Amazon Braket when creating a notebook from the Braket console. QAOA is a quantum algorithm that produces approximate solutions for combinatorial optimization problems. You can also find the example in this GitHub repo.
In this case, I am using QAOA to solve the Max-Cut problem: when partitioning nodes of a graph in two, what is the maximum number of edges connecting nodes between the two parts? For example, in the figure below, there are six nodes connected by eight edges. The thick yellow line partitions the nodes into two sets by crossing six edges.

In the QAOA example, the tuning of parameters that are used to run the successive rounds of quantum tasks is optimized in a classical computing environment (such as an EC2 instance) using tools like TensorFlow or PyTorch. In one of the notebook cells, I can choose which interface to use to tune the parameters as well as the other hyperparameters in a similar way to what I’d do for machine learning training.
Braket jobs then coordinates running the classical and quantum computing parts of the algorithm and the exchange of parameters and results between them. I can just sit back and relax as I watch my algorithm converge, ready to retrieve my results from S3, as before, for deeper analysis.
Running Hybrid Algorithms in Local Mode
To test and debug hybrid algorithms quickly, the Amazon Braket SDK can run jobs in local mode. With local mode, Braket jobs are run locally on your machine (for example, your laptop). In this way, you can get fast feedback and iterate quickly during the development of your algorithms.
To run a job in local mode, you just need to replace AwsQuantumJob with LocalQuantumJob. Note that AwsQuantumJob is imported from braket.aws , while LocalQuantumJob is imported from braket.jobs.local.
Availability and Pricing
Amazon Braket Hybrid Jobs are available today in all AWS Regions where Amazon Braket is available. For more information, see the AWS Regional Services List.
With Amazon Braket Hybrid Jobs, you only pay for the resources you use. There is no need to deploy, configure, and manage classical infrastructure, making it easy to experiment and improve algorithms iteratively. For more information, see the Amazon Braket pricing page.
Instead of relying on theoretical studies, you can start to use quantum computers as the primary tool to understand and improve hybrid algorithms and test their applicability for industry and research use cases. In this way, you can focus on your research and not deal with setting up and coordinating these different compute resources for your experiments.
During the development of this new capability, we talked with customers and partners to understand their needs. “As application developers, Braket Hybrid Jobs gives us the opportunity to explore the potential of hybrid variational algorithms with our customers,” says Vic Putz head of engineering at QCWare. “We are excited to extend our integration with Amazon Braket and the ability to run our own proprietary algorithms libraries in custom containers means we can innovate quickly in a secure environment. The operational maturity of Amazon Braket and the convenience of priority access to different types of quantum hardware means we can build this new capability into our stack with confidence.”
Simplify running hybrid quantum-classical workloads with Amazon Braket Hybrid Jobs.
— Danilo


 Then I define a pattern that matches the bucket and the events of interest:
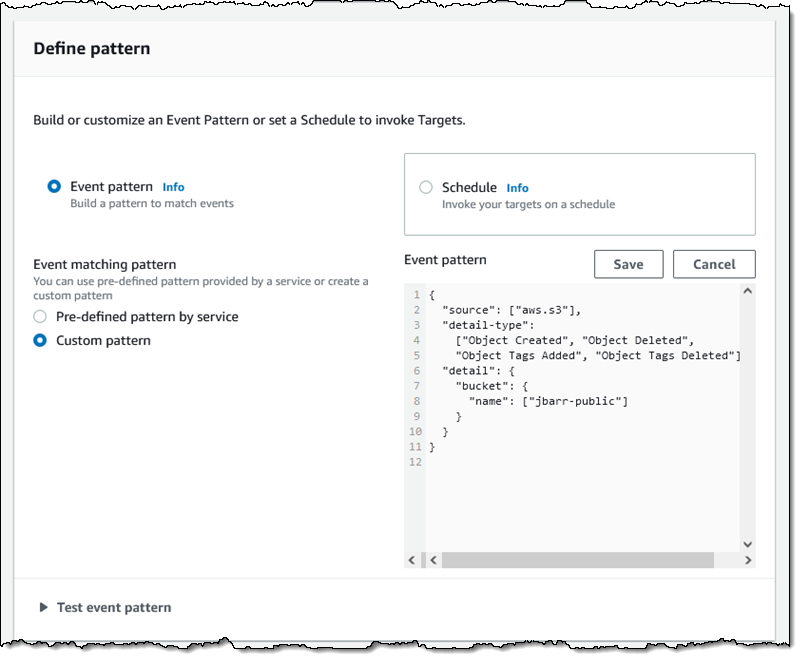 One pattern can match one or more buckets and one or more events; the following events are supported:
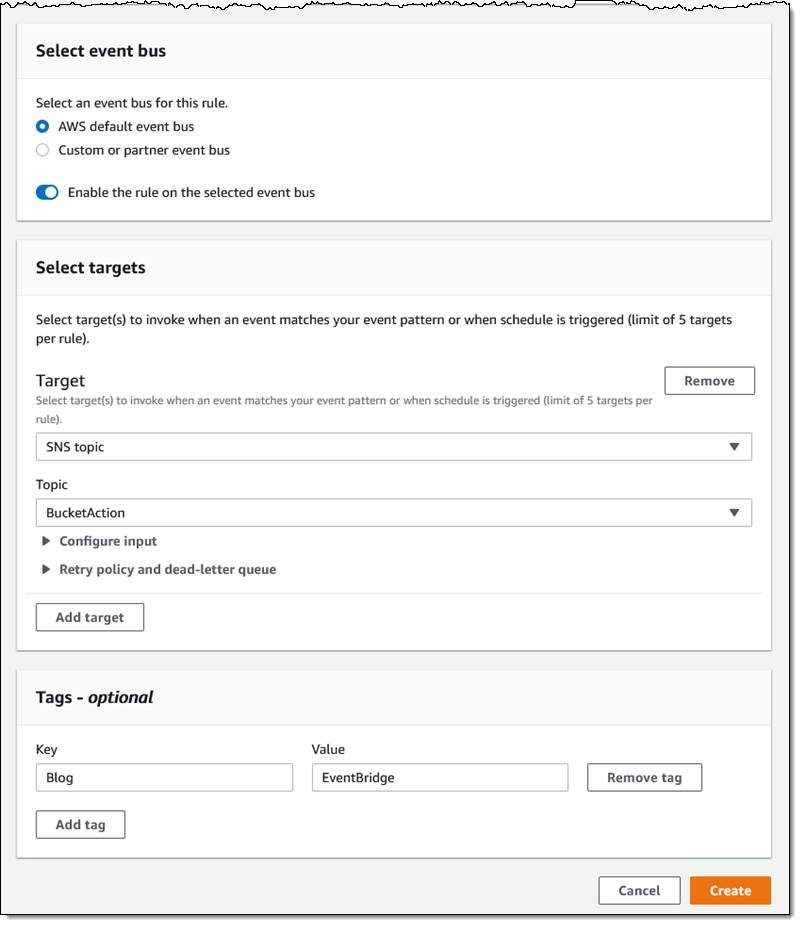


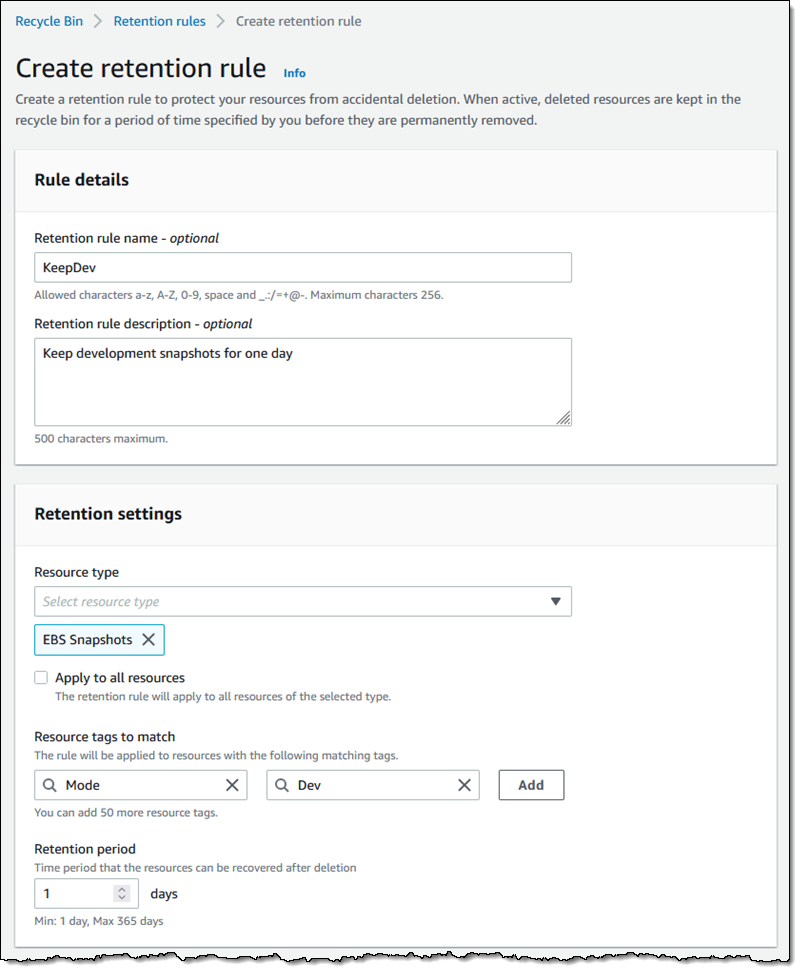
 I add a tag (User) to the rule, and click Create retention rule:
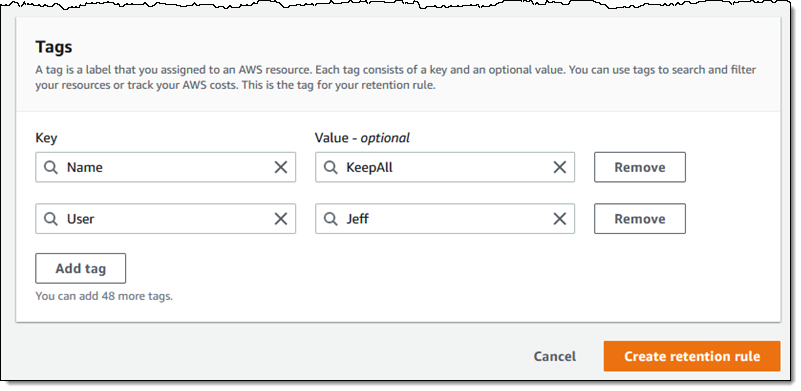


 processors in 2018 such as