Today, Amazon Web Services (AWS) announced the release of workspace context awareness in Amazon Q Developer chat. By including @workspace in your prompt, Amazon Q Developer will automatically ingest and index all code files, configurations, and project structure, giving the chat comprehensive context across your entire application within the integrated development environment (IDE).
Throughout the software development lifecycle, developers, and IT professionals face challenges in understanding, creating, troubleshooting, and modernizing complex applications. Amazon Q Developer’s workspace context enhances its ability to address these issues by providing a comprehensive understanding of the entire codebase. During the planning phase, it enables gaining insights into the overall architecture, dependencies, and coding patterns, facilitating more complete and accurate responses and descriptions. When writing code, workspace awareness allows Amazon Q Developer to suggest code and solutions that require context from different areas without constant file switching. For troubleshooting, deeper contextual understanding aids in comprehending how various components interact, accelerating root cause analysis. By learning about the collection of files and folders in your workspace, Amazon Q Developer delivers accurate and relevant responses, tailored to the specific codebase, streamlining development efforts across the entire software lifecycle.
In this post, we’ll explore:
How @workspace works
How to use @workspace to:
Understand your projects and code
Navigate your project using natural language descriptions
Generate code and solutions that demonstrate workspace awareness
How to get started
Our goal is for you to gain a comprehensive understanding of how the @workspace context will increase developer productivity and accuracy of Amazon Q Developer responses.
How @workspace works
Amazon Q Developer chat now utilizes advanced machine learning in the client to provide a comprehensive understanding of your codebase within the integrated development environment (IDE).
The key processes are:
Local Workspace Indexing: When enabled, Amazon Q Developer will index programming files or configuration files in your project upon triggering with @workspace for the first time. Non-essential files like binaries and those specified in .gitignore are intelligently filtered out during this process, focusing only on relevant code assets. This indexing takes approximately 5–20 minutes for workspace sizes up to 200 MB.
Persisted and Auto-Refreshed Index: The created index is persisted to disk, allowing fast loading on subsequent openings of the same workspace. If the index is over 24 hours old, it is automatically refreshed by re-indexing all files.
Memory-Aware Indexing: To prevent resource overhead, indexing stops at either a hard limit on size or when available system memory reaches a minimum threshold.
Continuous Updates: After initial indexing, the index is incrementally updated whenever you finish editing files in the IDE by closing the file or moving to another tab.
By creating and maintaining a comprehensive index of your codebase, Amazon Q Developer is empowered with workspace context awareness, enabling rich, project-wide assistance tailored to your development needs. When responding to chat requests, instructions, and questions, Amazon Q Developer can now use its knowledge of the rest of the workspace to augment the context of the currently open files.
Let’s see how @workspace can help!
Customer Use-Cases
Onboarding and Knowledge Sharing
You can quickly get up to speed on implementation details by asking questions like What are the key classes with application logic in this @workspace?
You can ask other discovery questions about how code works: Does this application authenticate players prior to starting a game? @workspace
You can then follow up with documentation requests: Can you document, using markdown, the workflow in this @workspace to start a game?
Project-Wide Code Discovery and Understanding
You can understand how a function or class is used across the workspace by asking: How does this application validate the guessed word’s correctness? @workspace
You can then ask about how this is communicated to the player: @workspace How are the results of this validation rendered to the web page?
Code Generation with Multi-File Context
You can also generate tests, new features, or extend functionality while leveraging context from other project files with prompts like @workspace Find the class that generates the random words and create a unit test for it.
Project-Wide Analysis and Remediation
Create data flow diagrams that require application workflow knowledge with @workspace Can you provide a UML diagram of the data flow between the front-end and the back-end? Using your built-in UML Previewer you can view the resulting diagram.
With @workspace, Amazon Q Developer chat becomes deeply aware of workspace’s unique code, enabling efficient development, maintenance, and knowledge sharing.
Getting Started
Enabling the powerful workspace context capability in Amazon Q Developer chat is straightforward. Here’s how to get started:
Open Your Project in the IDE: Launch your integrated development environment (IDE) and open the workspace or project you want the Amazon Q to understand.
Start a New Chat Session: Start a new chat session within the Amazon Q Developer chat panel if not already open.
“Enable” Workspace Context :To activate the project-wide context, simply include @workspace in the prompt. For example: How does the authentication flow work in this @workspace? When enabled, the first time Amazon Q Developer sees the @workspace keyword for the current workspace, Amazon Q Developer will ingest and analyze the code, configuration, and structure of the project.
If not already enabled, Amazon Q Developer will instruct you to do so.
Select the check the box for Amazon Q: Local Workspace Index
Try Different Query Types: With @workspace context, you can ask a wide range of questions and provide instructions that leverage the full project context:
Where is the business logic to handle users in this @workspace?
@workspace Explain the data flow between the frontend and backend.
Add new API tests using the existing test utilities found in the @workspace.
Iterate and Refine: Try rephrasing your query or explicitly including more context by selecting code or mentioning specific files when the response doesn’t meet your expectations. The more relevant information you provide, the better Amazon Q Developer can understand your intent. For optimal results using workspace context, it’s recommended to use specific terminology present in your codebase, avoid overly broad queries, and leverage available examples, references, and code snippets to steer Amazon Q Developer effectively.
Conclusion
In this post we introduced Amazon Q Developer’s workspace awareness in chat via the @workspace keyword, highlighting the benefits of using workspace when understanding code, responding to questions, and generating new code. By allowing Amazon Q Developer to analyze and understand your project structure, workspace context unlocks new possibilities for development productivity gains.
If you are new to Amazon Q Developer, I highly recommend you check out Amazon Q Developer documentation and the Q-Words workshop.
The traditional way customers had to interact with AWS account resources was through the AWS Management Console, SDKs, or command line interface (CLI) calls. However, these methods do not provide a quick way to gather information about AWS resources without writing scripts or navigating thought the AWS Management Console. The ability to use natural language with the Amazon Q Developer chat capability to list resources in your AWS account, get specific resource details, and ask about related resources, powered by Large Language Models (LLMs) and launched in preview on April 30, 2024, revolutionizes the way users interact with their AWS cloud infrastructure.
The ability to chat with Amazon Q Developer about your AWS account resources is now generally available. This powerful new feature allows you to easily query and explore your AWS infrastructure directly from the AWS Management Console. Using natural language prompts to interact with your AWS account, you can get specific resource details and ask about relationships between resources.
From the Amazon Q Developer chat panel in the AWS Manage Management Console, you can ask Q to “list my S3 buckets” or “show my running EC2 instances in us-east-1” and Amazon Q returns a list of resource details, along with a summary. Ask “what related resources does my ec2 instance i-02e05fa88a9782540 have?” and Amazon Q Developer will show attached Amazon Elastic Block Store (Amazon EBS), configured Amazon Virtual Private Cloud (Amazon VPC), and AWS IAM roles for Amazon EC2 instances automatically. Amazon Q Developer will continuously expand the range of services it interacts with, including relationships between them.
Now, let me show you how to chat about your resources using natural language with Amazon Q Developer.
Cross-region consent to call resources
In order to start using Amazon Q Developer, customers need to provide consent to querying cross-region resources. This is the case even for same region queries, and it is a pre-requisite for using the tool.
To get started, you can navigate to the AWS Management Console and select the Amazon Q Developer icon. Shown in the screenshot (figure 1) below:
Figure 1
The AWS Management Console main page displays an arrow pointing to the Amazon Chime Developer icon, and the Amazon Chime chat is opened, prompting you to confirm the cross-reference option. When you access Amazon Q chat for the first time, it will prompt you to update your cross-region preference by clicking in Continue.
Alternatively, you can choose the settings icon in the top right corner of the chat panel which should show an option to enable or disable cross-region consent.
Querying about your AWS Resources
I can ask Amazon Q Developer about my AWS resources. For example, if I ask Amazon Q Developer about my Amazon Elastic Compute Cloud (Amazon EC2) resources by asking: “Do I have any EC2 instances” (figure 2), Amazon Q Developer returns a summary with instance types and states, along with a list of the Amazon EC2 instances IDs.
Figure 2
To demonstrate how Amazon Q Developer can assist you with your daily operations, let’s ask what resources are associated with a specific Amazon Elastic Compute Cloud (EC2) instance (figure 3). The response will provide comprehensive information about the instance’s networking, storage, and AWS Identity and Access Management (IAM) configurations. Additionally, under the “Related Resources” section at the end, you can expand the listed resources to obtain further details about them.
Figure 3
In a scenario where I need to list all my Amazon EC2 instances that are members of an Amazon EC2 Auto Scaling. This can be easily accomplished by prompting “list all my instances from the MobileASG” (figure 4). The result shows the instance IDs associated with the Auto Scaling Group “MobileASG” and the Auto Scaling configuration details. Note, that I did not explicitly mention that “MobileASG” is an Amazon EC2 Auto Scaling group in my prompt, Amazon Q Developer was able to infer it based on the instances’ meta-information.
Figure 4
In another example, let’s imagine that my infrastructure team created numerous Amazon Virtual Private Cloud (Amazon VPC), and I now need to identify if I have any infrastructure using the Amazon VPCs they have created so that I can perform some clean-up. I can ask Amazon Q Developer to list all the Amazon EC2 instances that belong to those Amazon VPCs (figure 5).
Figure 5
To update your AWS Lambda from Python 3.9 to Python 3.12 and identify them quickly, you can use the following command: “list all Lambdas with python3.9 runtime” (figure 6). This command will provide you with the AWS Lambda names and their relevant details, allowing you to easily identify the functions that need to be updated.
Figure 6
Prompts to try
I invite you to test Amazon Q Developer in the AWS Management Console, to ask question about your AWS account resources. Follow some prompts you can try:
“What resources are related to instance <<INSTANCE ID>>?”
“Which VPC does the instance <<INSTANCE ID>> run it? also what role is it using?”
“What s3 bucket is associated with the <<ALARM NAME>> cloudwatch alarm?”
“List all s3 buckets connected with cloudfront.”
Conclusion
In this post, we introduced Amazon Q Developer’s capability to chat about your AWS account resources. This capability enables you to interact with your AWS account using natural language to easily obtain information without writing scripts or navigating throughout AWS Management console pages. The evolution of Amazon Q Developer will continue to enable even more capabilities and new integrations with AWS account resources in the near future. It is an exciting time to be a cloud operations professional, DevOps engineer and developer.
National team sports unite countries, and football (known as “soccer” in the US) is the world’s most popular sport, boasting approximately 3.5 billion fans globally. The UEFA Euro 2024, running from June 14 to July 14, 2024, significantly impacts Internet traffic across participating European nations. This blog post focuses on the two finalists, Spain and England, and comes after an initial post we published during the first week of the tournament.
Analyzing traffic patterns reveals distinct high-level trends. Spain saw the most significant drops in Internet traffic during games against major teams and former champions such as Italy (the defending champion), Germany, and France. In contrast, England’s games had crucial moments towards the end, leading to the largest traffic reductions in the UK, especially during the knockout stages.
For context, as previously mentioned, football games like the Super Bowl, differ from other events such as elections. When major teams or national squads play, especially in matches that captivate many viewers, Internet traffic often drops. This is particularly true if the game is broadcast on a national TV channel. During such broadcasts, people tend to focus more on their TV sets, relying on the traditional broadcast signal rather than online streaming, especially for games that aren’t behind a paywall. This is a typical scenario when national teams play in Europe.
Semifinals: differences between four countries
Let’s first analyze the impact of the semifinals on the four countries with national teams playing, using UK-related data for England. The following table displays the traffic drop percentages and the times of the largest declines during the Spain vs. France and Netherlands vs. England matches. Note that England is the only one not on Central European Time.
In both Spain and the UK, traffic decreased the most at the end of the game, details of which are provided below. In France and the Netherlands, significant drops of 16% and 27% respectively occurred primarily in the first half.
Country
Drop on traffic
Date / time of biggest drop (local time)
Spain
-19%
Jul 9, 22:45
France
-16%
Jul 9, 21:00
Netherlands
-27%
Jul 10, 21:15
England (UK)
-11%
July 10, 21:45
(Source: Cloudflare; created with Datawrapper)
Traffic in the UK: England’s late goal impact
England’s matches frequently saw crucial moments near the end, leading to the largest dips in UK Internet traffic. This trend was especially pronounced during the knockout phases and after Scotland’s exit from the tournament. England’s tournament opener, a win against Serbia on June 16, experienced the most significant traffic drop at the game’s start – an 8% decrease from the previous week.
UK election debate vs England’s game
The second game, on June 20, against Denmark, ended in a draw and saw a bigger drop in traffic. During the game, traffic in the UK initially dropped 8% compared to the previous week, then fell even further in the second half, by as much as 13%. Following the game, the BBC broadcast a significant live event – the debate between the country’s four major political parties. It started at 20:00 local time, and 15 minutes later, traffic experienced its largest drop of the day: 15%.
The third and final group stage game for England, a draw against Slovenia, saw a 5% drop in Internet traffic during the second half and a 4% drop in the first half. In the round of 16 game against Slovakia on June 30, traffic dipped 9% in the UK towards the end of the second half as Jude Bellingham scored a crucial late goal. During extra time, when Harry Kane scored, traffic decreased further to 10% below the previous week’s level.
Next, during the July 6 quarter-final against Switzerland, traffic in the UK dipped 3% during the game, mostly towards the end of regular time. However, it decreased further by 11% towards the end of extra time and during the penalty shootouts.
The semi-final between England and the Netherlands on July 10, 2024, experienced a noticeable drop in UK traffic – 5% at 20:15, when the first two goals were scored. Traffic decreased further, to 11% below the previous week, at the end of the game as Ollie Watkins scored the winning goal, securing England’s spot in the final.
Spain’s big game traffic impact
Spain was the only team to win all its matches without going to penalties throughout the tournament. The most significant drops in Internet traffic occurred during games against other major teams and previous titleholders like Italy, Germany, and France.
Spain’s first game in the tournament against Croatia on June 15, during dinner time in the country, ended in a decisive 3-0 win. It was accompanied by a significant drop in traffic – 7% in the first half and 9% in the second.
The June 20 match against Italy, featuring two teams with rich histories of European and World titles – and Italy as the defending champion – captured significant attention. Also broadcast on national TV, as the other games were, it led to substantial drops in traffic: a 16% decrease early in the first half, and a 15% drop in the second half, right after halftime, aligning with Calafiori’s goal that secured Spain’s win.
The final group stage game for Spain against Albania on June 24, which was non-decisive with Spain’s advancement already secured, saw a traffic decrease of 6%. Then came the knockout phase. It began with a round of 16 match against Georgia on June 30, where traffic fell by up to 8%, with a more pronounced drop in the first half coinciding with Spain equalizing the game.
The July 5 quarterfinals against host Germany was also a game that matched two football giants, in terms of national team international football titles. The game began with an initial 10% decline in traffic, followed by a 7% drop in the second half, and an 8% drop at the end of extra time, around the time Merino scored the winning goal.
Spain’s semi-final on July 9 saw early goals and a swift turnaround after France’s initial goal. The game started with a 17% drop in traffic compared to the previous week, persisting through the first half. By the end of the second half, as France aggressively sought to score and Spain defended vigorously to avoid extra time, traffic dipped further to a 19% drop. Ultimately, the Spanish squad secured a spot in the final.
Conclusion
The UEFA Euro 2024 has significantly impacted Internet traffic across participating European countries from Cloudflare’s perspective. Games broadcast on national TV drew fans’ attention away from the Internet. Critical moments such as last-minute goals, extra time, or penalty shootouts also led to larger drops in traffic as fans focused more on the game.
Also, distinct patterns have emerged in the finalist countries, Spain and England. For Spain, matches against traditional football powerhouses resulted in noticeable drops in traffic, indicating high viewer engagement during key matches. England’s games also saw significant traffic reductions at critical moments, particularly during the knockout stages.
Since the
disagreements that led to Eelco Dolstra
stepping down from the NixOS
Foundation board, there have been a number of projects forked from or inspired
by
Nix that have stepped up to compete with it. Two months on, some of these
projects are now well-established enough to look at what they have to offer and
how they compare to each other. Overall, users have a number of good options to
choose from, whether they’re seeking a compatible replacement for Nix (the
configuration language and package manager) or NixOS (the Linux distribution),
or something that takes the same ideas in a different direction.
A protein is a sequence of amino acids that, when chained together, creates a 3D structure. This 3D structure allows the protein to bind to other structures within the body and initiate changes. This binding is core to the working of many drugs.
A common workflow within drug discovery is searching for similar proteins, because similar proteins likely have similar properties. Given an initial protein, researchers often look for variations that exhibit stronger binding, better solubility, or reduced toxicity. Despite advances in protein structure prediction, it’s still sometimes necessary to predict protein properties based on sequence alone. Thus, there is a need to quickly and at-scale get similar sequences based on an input sequence. In this blog post, we propose a solution based on Amazon OpenSearch Service for similarity search and the pretrained model ProtT5-XL-UniRef50, which we will use to generate embeddings. A repository providing such solution is available here. ProtT5-XL-UniRef50 is based on the t5-3b model and was pretrained on a large corpus of protein sequences in a self-supervised fashion.
Before diving into our solution, it’s important to understand what embeddings are and why they’re crucial for our task. Embeddings are dense vector representations of objects—proteins in our case—that capture the essence of their properties in a continuous vector space. An embedding is essentially a compact vector representation that encapsulates the significant features of an object, making it easier to process and analyze. Embeddings play an important role in understanding and processing complex data. They not only reduce dimensionality but also capture and encode intrinsic properties. This means that objects (such as words or proteins) with similar characteristics result in embeddings that are closer in the vector space. This proximity allows us to perform similarity searches efficiently, making embeddings invaluable for identifying relationships and patterns in large datasets.
Consider the analogy of fruits and their properties. In an embedding space, fruits such as mandarins and oranges would be close to each other because they share some characteristics, such as being round, color, and having similar nutritional properties. Similarly, bananas would be close to plantains, reflecting their shared properties. Through embeddings, we can understand and explore these relationships intuitively.
ProtT5-XL-UniRef50 is a machine learning (ML) model specifically designed to understand the language of proteins by converting protein sequences into multidimensional embeddings. These embeddings capture biological properties, allowing us to identify proteins with similar functions or structures in a multi-dimensional space because similar proteins will be encoded close together. This direct encoding of proteins into embeddings is crucial for our similarity search, providing a robust foundation for identifying potential drug targets or understanding protein functions.
Embeddings for the UniProtKB/Swiss-Prot protein database, which we use for this post, have been pre-computed and are available for download. If you have your own novel proteins, you can compute embeddings using ProtT5-XL-UniRef50, and then use these pre-computed embeddings to find known proteins with similar properties
In this post, we outline the broad functionalities of the solution and its components. Following this, we provide a brief explanation of what embeddings are, discussing the specific model used in our example. We then show how you can run this model on Amazon SageMaker. In addition, we dive into how to use the OpenSearch Service as a vector database. Finally, we demonstrate some practical examples of running similarity searches on protein sequences.
Solution overview
Let’s walk through the solution and all its components. Code for this solution is available on GitHub.
We use OpenSearch Service vector database (DB) capabilities to store a sample of 20 thousand pre-calculated embeddings. These will be used to demonstrate similarity search. OpenSearch Service has advanced vector DB capabilities supporting multiple popular vector DB algorithms. For an overview of such capabilities see Amazon OpenSearch Service’s vector database capabilities explained.
The model is deployed and the solution is ready to calculate embeddings on any input protein sequence and perform similarity search against the protein embeddings we have preloaded on OpenSearch Service.
We use a SageMaker Studio notebook to show how to deploy the model on SageMaker and then use an endpoint to extract protein features in the form of embeddings.
After we have generated the embeddings in real time from the SageMaker endpoint, we run a query on OpenSearch Service to determine the five most similar proteins currently stored on OpenSearch Service index.
Finally, the user can see the result directly from the SageMaker Studio notebook.
To understand if the similarity search works well, we choose the Immunoglobulin Heavy Diversity 2/OR15-2A protein and we calculate its embeddings. The embeddings returned by the model are pre-residue, which is a detailed level of analysis where each individual residue (amino acid) in the protein is considered. In our case, we want to focus on the overall structure, function, and properties of the protein, so we calculate the per-protein embeddings. We achieve that by doing dimensionality reduction, calculating the mean overall per-residue features. Finally, we use the resulting embeddings to perform a similarity search and the first five proteins ordered by similarity are:
Immunoglobulin Heavy Diversity 3/OR15-3A
T Cell Receptor Gamma Joining 2
T Cell Receptor Alpha Joining 1
T Cell Receptor Alpha Joining 11
T Cell Receptor Alpha Joining 50
These are all immune cells with T cell receptors being a subtype of immunoglobulin. The similarity surfaced proteins that are all bio-functionally similar.
Costs and clean up
The solution we just walked through creates an OpenSearch Service domain which is billed according to number and instance type selected during creation time, see the OpenSearch Service Pricing page for the rate of those. You will also be charged for the SageMaker endpoint created by the deploy-and-similarity-search notebook, which is currently using a ml.g4dn.8xlarge instance type. See SageMaker pricing for details.
Finally, you are charged for the SageMaker Studio Notebooks according to the instance type you are using as detailed on the pricing page.
To clean up the resources created by this solution:
In this blog post we described a solution capable of calculating protein embeddings and performing similarity searches to find similar proteins. The solution uses the open source ProtT5-XL-UniRef50 model to calculate the embeddings and it deploys it on SageMaker Inference. We used OpenSearch Service as the vector DB. OpenSearch Service is pre-populated with 20 thousand human proteins from UniProt. Finally, the solution was validated by performing a similarity search on the Immunoglobulin Heavy Diversity 2/OR15-2A protein. We successfully evaluated that the proteins returned from OpenSearch Service are all in the immunoglobulin family and are bio-functionally similar. Code for this solution is available in GitHub.
The solution can be further tuned by testing different supported OpenSearch Service KNN algorithms and scaled by importing additional protein embeddings into OpenSearch Service indexes.
Resources:
Elnaggar A, et al. “ProtTrans: Toward Understanding the Language of Life Through Self-Supervised Learning”. IEEE Trans Pattern Anal Mach Intell. 2020.
Mikolov, T.; Yih, W.; Zweig, G. “Linguistic Regularities in Continuous Space Word Representations”. HLT-Naacl: 746–751. 2013.
About the Authors
Camillo Anania is a Senior Solutions Architect at AWS. He is a tech enthusiast who loves helping healthcare and life science startups get the most out of the cloud. With a knack for cloud technologies, he’s all about making sure these startups can thrive and grow by leveraging the best cloud solutions. He is excited about the new wave of use cases and possibilities unlocked by GenAI and does not miss a chance to dive into them.
Adam McCarthy is the EMEA Tech Leader for Healthcare and Life Sciences Startups at AWS. He has over 15 years’ experience researching and implementing machine learning, HPC, and scientific computing environments, especially in academia, hospitals, and drug discovery.
The use of containers for software deployment has emerged as a powerful method for packaging applications and their dependencies into single, portable units. Containers enable developers to create, deploy, and run applications consistently across various environments. However, as containerized applications grow in scale and complexity, efficiently deploying, managing, and terminating containers can become a challenging task.
The growing need for streamlined container management has led to the rise of container orchestration—an automated approach to deploying, scaling, and managing containerized applications. Because it simplifies the management of large-scale, dynamic container environments, container orchestration has become a crucial component in modern application development and deployment.
In this blog post, we’ll explore what container orchestration is, how it works, its benefits, and the leading tools that make it possible. Whether you are new to using containers or looking to optimize your existing strategy, this guide will provide insights that you can leverage for more efficient and scalable application deployment.
What are containers?
Before containers, developers often faced the “it works on my machine” problem, where an application would run perfectly on a developer’s computer but fail in other environments due to differences in operating systems (OS), dependencies, or configuration.
Containers solve this problem by packaging applications with all their dependencies into single, portable units, improving consistency across different environments. This greatly reduces the compatibility issues and simplifies the deployment process.
As a lightweight software package, containers include everything needed to run an application such as code, runtime environment, system tools, libraries, binaries, settings, and so on. They run on top of the host OS, sharing the same OS kernel, and can run anywhere—on a laptop, server, in the cloud, etc. On top of that, containers remain isolated from each other, making them more lightweight and efficient than virtual machines (VMs), which require a full OS for each instance. Check out our article to learn more about the difference between containers and VMs here.
Containers provide consistent environments, higher resource efficiency, faster startup times, and portability. They differ from VMs in that they share the host OS kernel. While VMs virtualize hardware for strong isolation, containers isolate at the process level. By solving the longstanding issues of environment consistency and resource efficiency, containers have become an essential tool in modern application development.
What is container orchestration?
As container adoption has grown, developers have encountered new challenges that highlight the need for container orchestration. While containers simplify application deployment by ensuring consistency across environments, managing containers at scale introduces complexities that manual processes can’t handle efficiently, such as:
Scalability: In a production environment, applications often require hundreds or thousands of containers running simultaneously. Manually managing such a large number of containers becomes impractical and error-prone.
Resource management: Efficiently utilizing resources across multiple containers is critical. Manual resource allocation leads to underutilization or overloading of hardware, negatively impacting performance and cost-effectiveness.
Container failure management: In dynamic environments, containers can fail or become unresponsive. Developers need a way to create a self-healing environment, in which failed containers are automatically detected, then recover without manual intervention to ensure high availability and reliability.
Rolling updates: Deploying updates to applications without downtime and the ability to quickly roll back in case of issues are crucial for maintaining service continuity. Manual updates can be risky and cumbersome.
Container orchestration automates the deployment, scaling, and management of containers, addressing the complexities that arise in large-scale, dynamic application environments. It ensures that applications run smoothly and efficiently, enabling developers to focus on building features rather than managing infrastructure. Container orchestration tools provide various features such as automated scheduling, self-healing, load balancing, and resource optimization to deploy and manage applications more effectively to ensure reliability, performance, and scalability.
What are the benefits of container orchestration?
Container orchestration offers many different advantages that streamline the deployment and management of containerized applications. We’ve touched on a few of them, but here’s a concise list:
Enhanced scalability: Easily scale applications up or down to meet changing demands.
Increased reliability: Automatic health checks and container replacement ensure high availability.
Simplified management: Centralized control and automation reduce the complexity of managing large-scale containerized applications.
Faster deployments: Orchestrators enable rapid and consistent deployments across different environments.
Cost efficiency: Better resource utilization and automation, leading to cost savings.
How does container orchestration work?
Now that we understand what container orchestration is, let’s take a look at how container orchestration works using the example of Kubernetes, one of the most popular container orchestration platforms.
In the above diagram, we see an example of container orchestration in action. The system is divided into two main sections: the control plane and the worker nodes.
Control plane
The control plane is the brain of the container orchestration system. It manages the entire system, ensuring that the desired state of the applications is maintained. Key components of the control plane include:
Configuration store (etcd): A distributed key-value store that holds all the cluster data, such as the configuration and state information. Think of it as a central database for the cluster.
API server: The front-end of the control plane, exposing the orchestration API. It handles all the communication within the cluster and with external clients.
Scheduler: Assigns workloads to nodes based on resource availability and scheduling policies, ensuring efficient resource utilization.
Controller manager: Runs various controllers that handle routine tasks to maintain the cluster’s desired state.
Cloud control manager: Interacts with cloud provider APIs to manage cloud specific resources, integrating the cluster with cloud infrastructure.
Worker nodes
Worker nodes, virtual machines, and bare metal servers are all common options for where to run application workloads. Each worker node has the following components:
Node agent (kubelet): An agent that ensures the containers are running as expected. It communicates with the control plane to receive instructions and report back on the status of the nodes.
Network proxy (kube-proxy): Maintains network rules on each node, facilitating communication between containers and services within the cluster.
Within the worker nodes, pods are the smallest deployable units. Each pod can contain one or more containers that run the application and its dependencies. The diagram shows multiple pods within the worker nodes, indicating how applications are deployed and managed.
The cloud provider API directs how the orchestration system dynamically interacts with cloud infrastructure to provision resources as needed, making it a flexible and powerful tool for managing containerized applications across various environments.
Popular container orchestration tools
Several container orchestration tools have emerged as the leaders in the industry, each offering unique features and capabilities. Here are some of the most popular tools:
Kubernetes
Kubernetes, often referred to as K8s, is an open-source container orchestration platform initially developed by Google. It has become the industry standard for managing containerized applications at scale. K8s is ideal for handling complex, multi-container applications, making it suitable for large-scale microservices architectures and multi-cloud deployments. Its strong community support and flexibility with various container runtimes contribute to its widespread adoption.
Docker Swarm
Docker Swarm is Docker’s native container orchestration tool, providing a simpler alternative to Kubernetes. It integrates seamlessly with Docker containers, making it a natural choice for teams already using Docker. Known for its ease of setup and use, Docker Swarm allows quick scaling of services with straightforward commands, making it ideal for small to medium-sized applications and rapid development cycles.
Amazon Elastic Container Service (ECS)
Amazon ECS (Elastic Container Service) is a fully managed container orchestration service provided by AWS, designed to simplify running containerized applications. ECS integrates deeply with AWS services for networking, security, and monitoring. ECS leverages the extensive range of AWS services, making it a straightforward orchestration solution for enterprises using AWS infrastructure.
Red Hat OpenShift
Red Hat OpenShift is an enterprise-grade Kubernetes container orchestration platform that extends Kubernetes with additional tools for developers and operations, integrated security, and lifecycle management. OpenShift supports multiple cloud and on-premise environments, providing a consistent foundation for building and scaling containerized applications.
Google Kubernetes Engine (GKE)
Google Kubernetes Engine (GKE) is a managed Kubernetes service offered by Google Cloud Platform (GCP). It provides a scalable environment for deploying, managing, and scaling containerized applications using Kubernetes. GKE simplifies cluster management with automated upgrades, monitoring, and scalability features. Its deep integration with GCP services and Google’s expertise in running Kubernetes at scale make GKE an attractive option for complex application architectures.
Embracing the future of application deployment
Container orchestration has undoubtedly revolutionized the way we deploy, manage, and scale applications in today’s complex and dynamic software environments. By automating critical tasks such as scheduling, scaling, load balancing, and health monitoring, container orchestration enables organizations to achieve greater efficiency, reliability, and scalability in their application deployments.
The choice of orchestration platform should be carefully considered based on your specific needs, team expertise and long term goals. It is not just a technical solution but a strategic enabler, providing you with significant advantages in your development and operational workflows.
Amazon OpenSearch Service introduced the OpenSearch Optimized Instances (OR1), deliver price-performance improvement over existing instances. The newly introduced OR1 instances are ideally tailored for heavy indexing use cases like log analytics and observability workloads.
In this post, we conduct experiments using OpenSearch Benchmark to demonstrate how the OR1 instance family improves indexing throughput and overall domain performance.
Getting started with OpenSearch Benchmark
OpenSearch Benchmark, a tool provided by the OpenSearch Project, comprehensively gathers performance metrics from OpenSearch clusters, including indexing throughput and search latency. Whether you’re tracking overall cluster performance, informing upgrade decisions, or assessing the impact of workflow changes, this utility proves invaluable.
In this post, we compare the performance of two clusters: one powered by memory-optimized instances and the other by OR1 instances. The dataset comprises HTTP server logs from the 1998 World Cup website. With the OpenSearch Benchmark tool, we conduct experiments to assess various performance metrics, such as indexing throughput, search latency, and overall cluster efficiency. Our aim is to determine the most suitable configuration for our specific workload requirements.
OpenSearch Benchmark includes a set of workloads that you can use to benchmark your cluster performance. Workloads contain descriptions of one or more benchmarking scenarios that use a specific document corpus to perform a benchmark against your cluster. The document corpus contains indexes, data files, and operations invoked when the workflow runs.
When assessing your cluster’s performance, it is recommended to use a workload similar to your cluster’s use cases, which can save you time and effort. Consider the following criteria to determine the best workload for benchmarking your cluster:
Use case – Selecting a workload that mirrors your cluster’s real-world use case is essential for accurate benchmarking. By simulating heavy search or indexing tasks typical for your cluster, you can pinpoint performance issues and optimize settings effectively. This approach makes sure benchmarking results closely match actual performance expectations, leading to more reliable optimization decisions tailored to your specific workload needs.
Data – Use a data structure similar to that of your production workloads. OpenSearch Benchmark provides examples of documents within each workload to understand the mapping and compare with your own data mapping and structure. Every benchmark workload is composed of the following directories and files for you to compare data types and index mappings.
Query types – Understanding your query pattern is crucial for detecting the most frequent search query types within your cluster. Employing a similar query pattern for your benchmarking experiments is essential.
Solution overview
The following diagram explains how OpenSearch Benchmark connects to your OpenSearch domain to run workload benchmarks.
The workflow comprises the following steps:
The first step involves running OpenSearch Benchmark using a specific workload from the workloads repository. The invoke operation collects data about the performance of your OpenSearch cluster according to the selected workload.
OpenSearch Benchmark ingests the workload dataset into your OpenSearch Service domain.
OpenSearch Benchmark runs a set of predefined test procedures to capture OpenSearch Service performance metrics.
When the workload is complete, OpenSearch Benchmark outputs all related metrics to measure the workload performance. Metric records are by default stored in memory, or you can set up an OpenSearch Service domain to store the generated metrics and compare multiple workload executions.
In this post, we used the http_logs workload to conduct performance benchmarking. The dataset comprises 247 million documents designed for ingestion and offers a set of sample queries for benchmarking. Follow the steps outlined in the OpenSearch Benchmark User Guide to deploy OpenSearch Benchmark and run the http_logs workload.
Prerequisites
You should have the following prerequisites:
Minimum knowledge of the Python programming language.
A Python client set up to deploy OpenSearch Benchmark and interact with the OpenSearch Service domain.
In this post, we deployed OpenSearch Benchmark in an AWS Cloud9 host using an Amazon Linux 2 instance type m6i.2xlarge with a capacity of 8 vCPUs, 32 GiB memory, and 512 TiB storage.
Performance analysis using the OR1 instance type in OpenSearch Service
In this post, we conducted a performance comparison between two different configurations of OpenSearch Service:
Configuration 1 – Cluster manager nodes and three data nodes of memory-optimized r6g.large instances
Configuration 2 – Cluster manager nodes and three data nodes of or1.larges instances
In both configurations, we use the same number and type of cluster manager nodes: three c6g.xlarge.
The following table summarizes our OpenSearch Service configuration details.
Configuration 1
Configuration 2
Number of cluster manager nodes
3
3
Type of cluster manager nodes
c6g.xlarge
c6g.xlarge
Number of data nodes
3
3
Type of data node
r6g.large
or1.large
Data node: EBS volume size (GP3)
200 GB
200 GB
Multi-AZ with standby enabled
Yes
Yes
Now let’s examine the performance details between the two configurations.
Performance benchmark comparison
The http_logs dataset contains HTTP server logs from the 1998 World Cup website between April 30, 1998 and July 26, 1998. Each request consists of a timestamp field, client ID, object ID, size of the request, method, status, and more. The uncompressed size of the dataset is 31.1 GB with 247 million JSON documents. The amount of load sent to both domain configurations is identical. The following table displays the amount of time taken to run various aspects of an OpenSearch workload on our two configurations.
Category
Metric Name
Configuration 1
(3* r6g.large data nodes)
Runtimes
Configuration 2
(3* or1.large data nodes)
Runtimes
Performance Difference
Indexing
Cumulative indexing time of primary shards
207.93 min
142.50 min
31%
Indexing
Cumulative flush time of primary shards
21.17 min
2.31 min
89%
Garbage Collection
Total Young Gen GC time
43.14 sec
24.57 sec
43%
bulk-index-append
p99 latency
10857.2 ms
2455.12 ms
77%
query-Mean Throughput
29.76 ops/sec
36.24 ops/sec
22%
query-match_all(default)
p99 latency
40.75 ms
32.99 ms
19%
query-term
p99 latency
7675.54 ms
4183.19 ms
45%
query-range
p99 latency
59.5316 ms
51.2864 ms
14%
query-hourly_aggregation
p99 latency
5308.46 ms
2985.18 ms
44%
query-multi_term_aggregation
p99 latency
8506.4 ms
4264.44 ms
50%
The benchmarks show a notable enhancement across various performance metrics. Specifically, OR1.large data nodes demonstrate a 31% reduction in indexing time for primary shards compared to r6g.large data nodes. OR1.large data nodes also exhibit a 43% improvement in garbage collection efficiency and significant enhancements in query performance, including term, range, and aggregation queries.
The extent of improvement depends on the workload. Therefore, make sure to run custom workloads as expected in your production environments in terms of indexing throughput, type of search queries, and concurrent requests.
Migration journey to OR1
The OR1 instance family is available in OpenSearch Service 2.11 or higher. Usually, if you’re using OpenSearch Service and you want to benefit from new released features in a specific version, you would follow the supported upgrade paths to upgrade your domain.
However, to use the OR1 instance type, you need to create a new domain with OR1 instances and then migrate your existing domain to the new domain. The migration journey to OpenSearch Service domain using an OR1 instance is similar to a typical OpenSearch Service migration scenario. Critical aspects involve determining the appropriate size for the target environment, selecting suitable data migration methods, and devising a seamless cutover strategy. These elements provide optimal performance, smooth data transition, and minimal disruption throughout the migration process.
To avoid incurring continued AWS usage charges, make sure you delete all the resources you created as part of this post, including your OpenSearch Service domain.
Conclusion
In this post, we ran a benchmark to review the performance of the OR1 instance family compared to the memory-optimized r6g instance. We used OpenSearch Benchmark, a comprehensive tool for gathering performance metrics from OpenSearch clusters.
Learn more about how OR1 instances work and experiment with OpenSearch Benchmark to make sure your OpenSearch Service configuration matches your workload demand.
About the Authors
Jatinder Singh is a Senior Technical Account Manager at AWS and finds satisfaction in aiding customers in their cloud migration and innovation endeavors. Beyond his professional life, he relishes spending moments with his family and indulging in hobbies such as reading, culinary pursuits, and playing chess.
Hajer Bouafif is an Analytics Specialist Solutions Architect at Amazon Web Services. She focuses on Amazon OpenSearch Service and helps customers design and build well-architected analytics workloads in diverse industries. Hajer enjoys spending time outdoors and discovering new cultures.
Puneetha Kumara is a Senior Technical Account Manager at AWS, with over 15 years of industry experience, including roles in cloud architecture, systems engineering, and container orchestration.
Manpreet Kour is a Senior Technical Account Manager at AWS and is dedicated to ensuring customer satisfaction. Her approach involves a deep understanding of customer objectives, aligning them with software capabilities, and effectively driving customer success. Outside of her professional endeavors, she enjoys traveling and spending quality time with her family.
Apple has issued a new round of threat notifications to iPhone users across 98 countries, warning them of potential mercenary spyware attacks. It’s the second such alert campaign from the company this year, following a similar notification sent to users in 92 nations in April.
Security updates have been issued by AlmaLinux (dotnet6.0, dotnet8.0, fence-agents, and virt:rhel and virt-devel:rhel), Debian (exim4 and firefox-esr), Fedora (dotnet8.0, firefox, onnx, qt6-qtbase, squid, and wordpress), Mageia (golang, netatalk, php, and poppler), Red Hat (ghostscript, httpd, openssh, python3, and ruby), Slackware (mozilla), SUSE (kernel and openssh), and Ubuntu (linux-aws-5.4, linux-azure, linux-ibm-5.15, and python3.5, python3.6, python3.7, python3.8, python3.9, python3.10,
python3.11, python3.12).
The research value of this
USENIX paper by Hongyu Li et al. is not entirely clear, but it does
show that the Rust-for-Linux project is gaining wider attention.
Despite more novice developers being attracted by Rust to the
kernel community, we have found their commits are mainly for
constructing Rust-relevant toolchains as well as Rust crates alone;
they do not, however, take part in kernel code development. By
contrast, 5 out of 6 investigated drivers (as seen in Table 5) are
mainly contributed by authors from the Linux community. This
implies a disconnection be- tween the young and the seasoned
developers, and that the bar of kernel programming is not lowered
by Rust language.
As a bonus, it includes a ChatGPT analysis of LWN and Hacker News comments.
Over the last twelve months, the Internet security landscape has changed dramatically. Geopolitical uncertainty, coupled with an active 2024 voting season in many countries across the world, has led to a substantial increase in malicious traffic activity across the Internet. In this report, we take a look at Cloudflare’s perspective on Internet application security.
This report is the fourth edition of our Application Security Report and is an official update to our Q2 2023 report. New in this report is a section focused on client-side security within the context of web applications.
Throughout the report we discuss various insights. From a global standpoint, mitigated traffic across the whole network now averages 7%, and WAF and Bot mitigations are the source of over half of that. While DDoS attacks remain the number one attack vector used against web applications, targeted CVE attacks are also worth keeping an eye on, as we have seen exploits as fast as 22 minutes after a proof of concept was released.
Focusing on bots, about a third of all traffic we observe is automated, and of that, the vast majority (93%) is not generated by bots in Cloudflare’s verified list and is potentially malicious.
API traffic is also still growing, now accounting for 60% of all traffic, and maybe more concerning, is that organizations have up to a quarter of their API endpoints not accounted for.
We also touch on client side security and the proliferation of third-party integrations in web applications. On average, enterprise sites integrate 47 third-party endpoints according to Page Shield data.
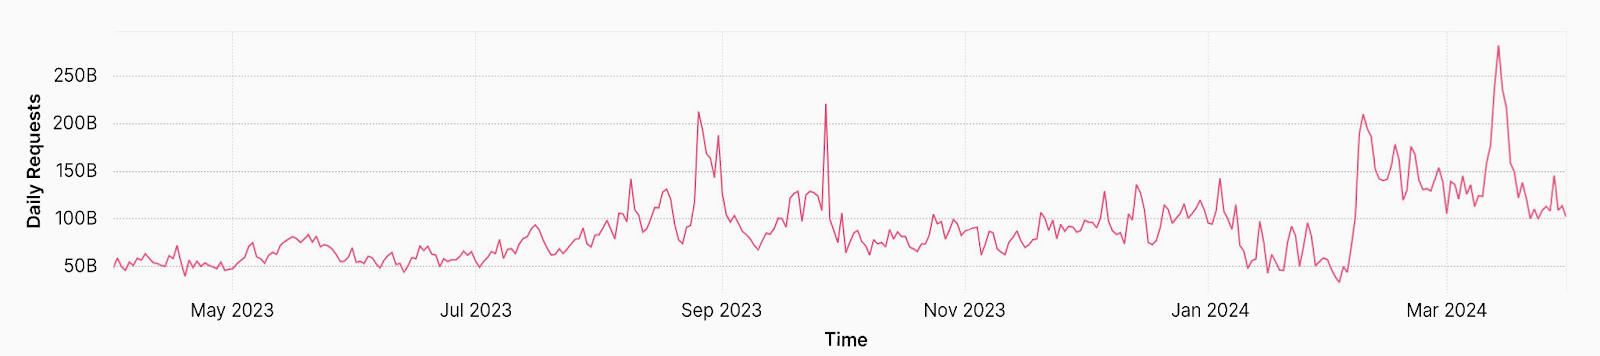
It is also worth mentioning that since the last report, our network, from which we gather the data and insights, is bigger and faster: we are now processing an average of 57 million HTTP requests/second (+23.9% YoY) and 77 million at peak (+22.2% YoY). From a DNS perspective, we are handling 35 million DNS queries per second (+40% YoY). This is the sum of authoritative and resolver requests served by our infrastructure.
Maybe even more noteworthy, is that, focusing on HTTP requests only, in Q1 2024 Cloudflare blocked an average of 209 billion cyber threats each day (+86.6% YoY). That is a substantial increase in relative terms compared to the same time last year.
As usual, before we dive in, we need to define our terms.
Definitions
Throughout this report, we will refer to the following terms:
Mitigated traffic: any eyeball HTTP* request that had a “terminating” action applied to it by the Cloudflare platform. These include the following actions: BLOCK, CHALLENGE, JS_CHALLENGE and MANAGED_CHALLENGE. This does not include requests that had the following actions applied: LOG, SKIP, ALLOW. They also accounted for a relatively small percentage of requests. Additionally, we improved our calculation regarding the CHALLENGE type actions to ensure that only unsolved challenges are counted as mitigated. A detailed description of actions can be found in our developer documentation. This has not changed from last year’s report.
Bot traffic/automated traffic: any HTTP* request identified by Cloudflare’s Bot Management system as being generated by a bot. This includes requests with a bot score between 1 and 29 inclusive. This has not changed from last year’s report.
API traffic: any HTTP* request with a response content type of XML or JSON. Where the response content type is not available, such as for mitigated requests, the equivalent Accept content type (specified by the user agent) is used instead. In this latter case, API traffic won’t be fully accounted for, but it still provides a good representation for the purposes of gaining insights. This has not changed from last year’s report.
Unless otherwise stated, the time frame evaluated in this post is the period from April 1, 2023, through March 31, 2024, inclusive.
Finally, please note that the data is calculated based only on traffic observed across the Cloudflare network and does not necessarily represent overall HTTP traffic patterns across the Internet.
*When referring to HTTP traffic we mean both HTTP and HTTPS.
Global traffic insights
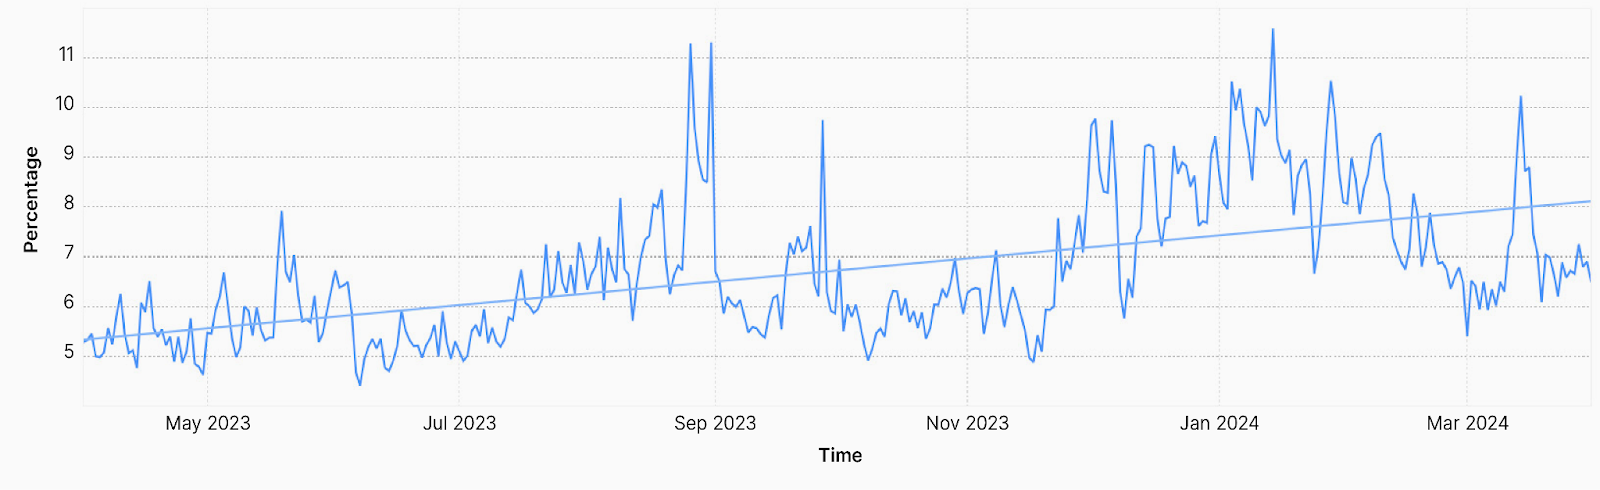
Average mitigated daily traffic increases to nearly 7%
Compared to the prior 12-month period, Cloudflare mitigated a higher percentage of application layer traffic and layer 7 (L7) DDoS attacks between Q2 2023 and Q1 2024, growing from 6% to 6.8%.
Figure 1: Percent of mitigated HTTP traffic increasing over the last 12 months
During large global attack events, we can observe spikes of mitigated traffic approaching 12% of all HTTP traffic. These are much larger spikes than we have ever observed across our entire network.
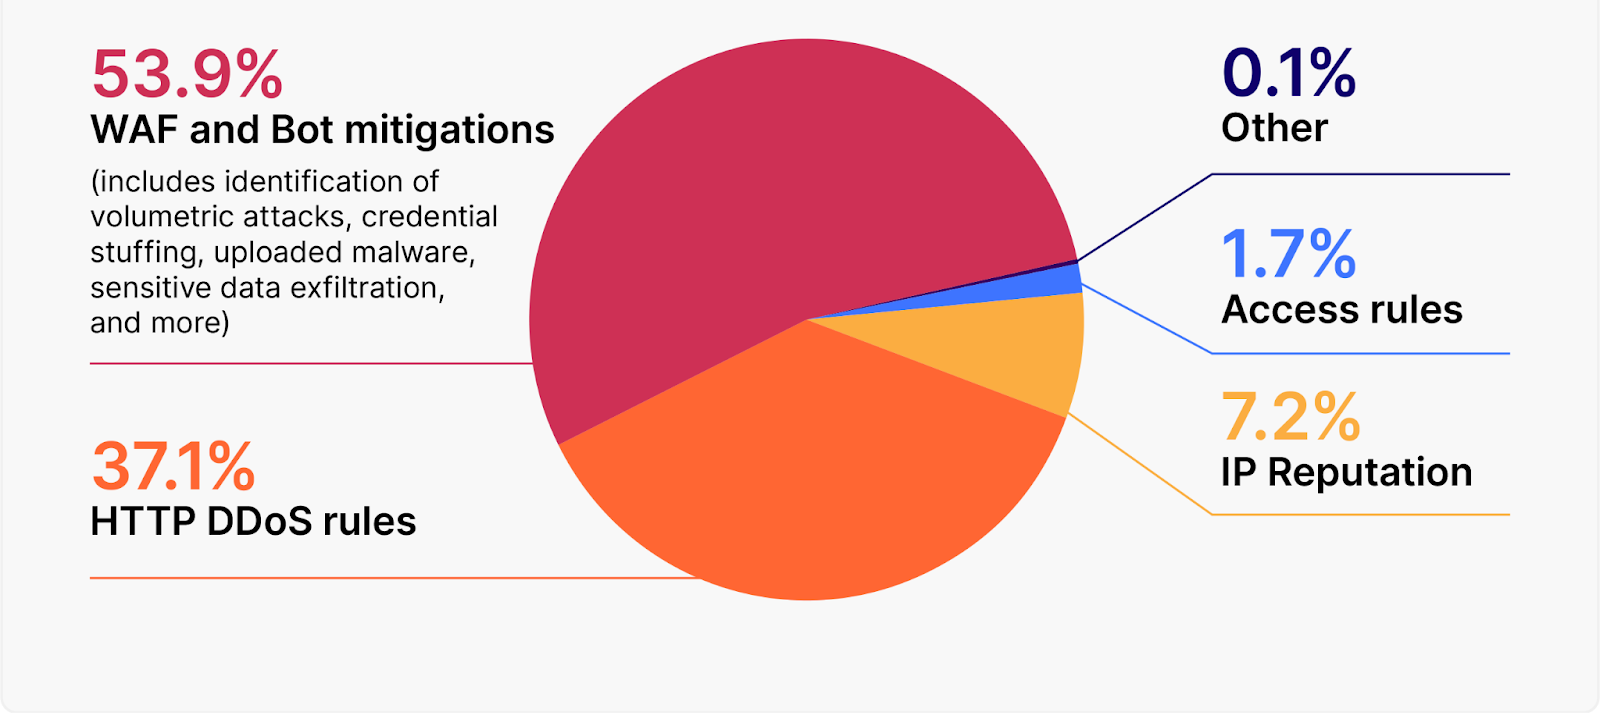
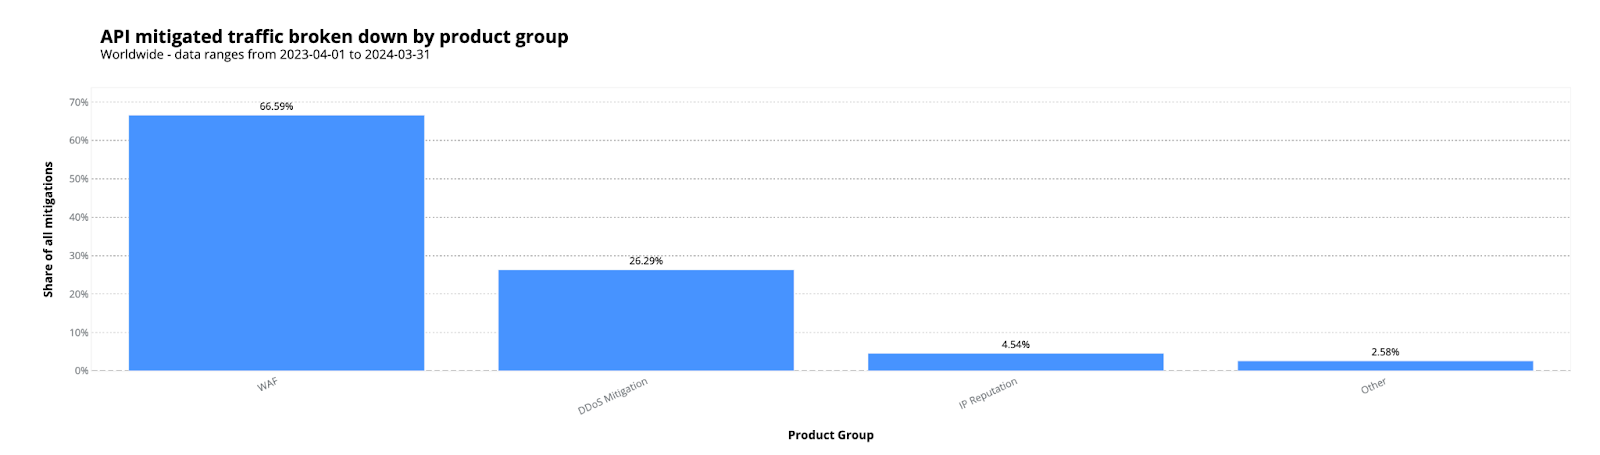
WAF and Bot mitigations accounted for 53.9% of all mitigated traffic
As the Cloudflare platform continues to expose additional signals to identify potentially malicious traffic, customers have been actively using these signals in WAF Custom Rules to improve their security posture. Example signals include our WAF Attack Score, which identifies malicious payloads, and our Bot Score, which identifies automated traffic.
After WAF and Bot mitigations, HTTP DDoS rules are the second-largest contributor to mitigated traffic. IP reputation, that uses our IP threat score to block traffic, and access rules, which are simply IP and country blocks, follow in third and fourth place.
Figure 2: Mitigated traffic by Cloudflare product group
CVEs exploited as fast as 22 minutes after proof-of-concept published
Zero-day exploits (also called zero-day threats) are increasing, as is the speed of weaponization of disclosed CVEs. In 2023, 97 zero-days were exploited in the wild, and that’s along with a 15% increase of disclosed CVEs between 2022 and 2023.
Looking at CVE exploitation attempts against customers, Cloudflare mostly observed scanning activity, followed by command injections, and some exploitation attempts of vulnerabilities that had PoCs available online, including Apache CVE-2023-50164 and CVE-2022-33891, Coldfusion CVE-2023-29298CVE-2023-38203 and CVE-2023-26360, and MobileIron CVE-2023-35082.
This trend in CVE exploitation attempt activity indicates that attackers are going for the easiest targets first, and likely having success in some instances given the continued activity around old vulnerabilities.
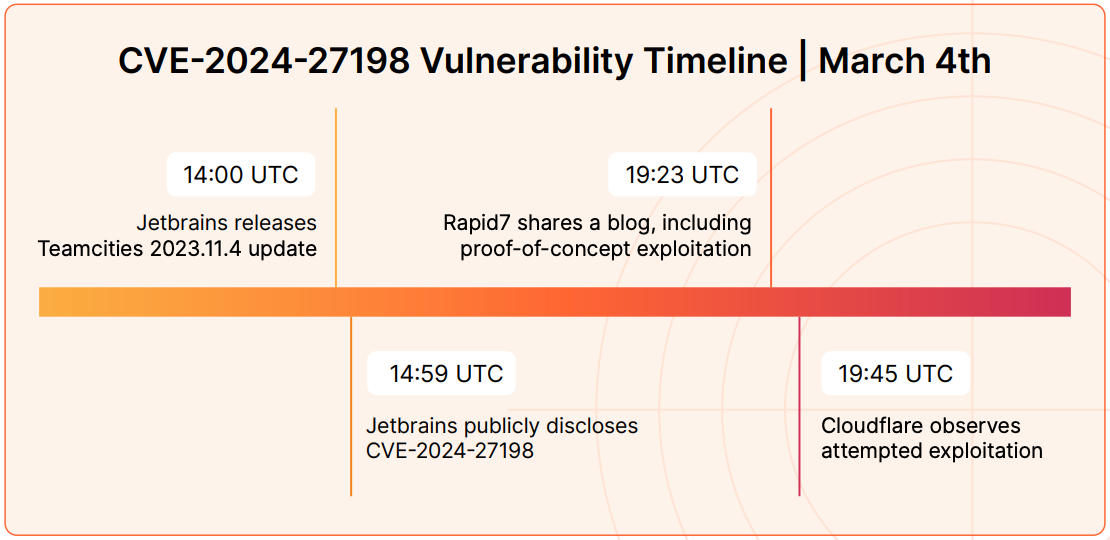
As just one example, Cloudflare observed exploitation attempts of CVE-2024-27198 (JetBrains TeamCity authentication bypass) at 19:45 UTC on March 4, just 22 minutes after proof-of-concept code was published.
The speed of exploitation of disclosed CVEs is often quicker than the speed at which humans can create WAF rules or create and deploy patches to mitigate attacks. This also applies to our own internal security analyst team that maintains the WAF Managed Ruleset, which has led us to combine the human written signatures with an ML-based approach to achieve the best balance between low false positives and speed of response.
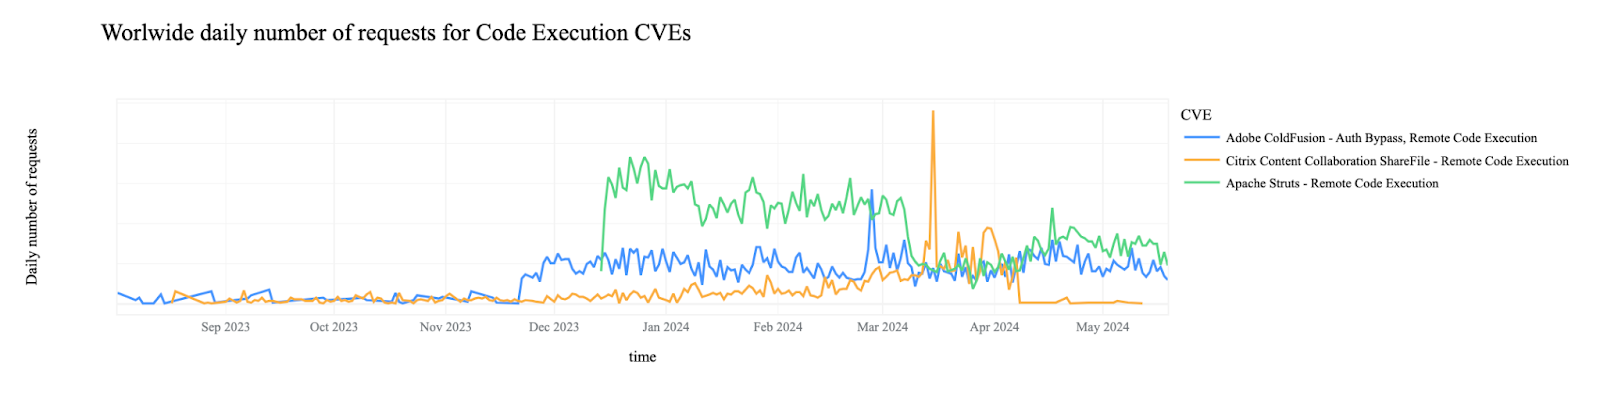
CVE exploitation campaigns from specific threat actors are clearly visible when we focus on a subset of CVE categories. For example, if we filter on CVEs that result in remote code execution (RCE), we see clear attempts to exploit Apache and Adobe installations towards the end of 2023 and start of 2024 along with a notable campaign targeting Citrix in May of this year.
Figure 4: Worldwide daily number of requests for Code Execution CVEs
Similar views become clearly visible when focusing on other CVEs or specific attack categories.
DDoS attacks remain the most common attack against web applications
DDoS attacks remain the most common attack type against web applications, with DDoS comprising 37.1% of all mitigated application traffic over the time period considered.
Figure 5: Volume of HTTP DDoS attacks over time
We saw a large increase in volumetric attacks in February and March 2024. This was partly the result of improved detections deployed by our teams, in addition to increased attack activity. In the first quarter of 2024 alone, Cloudflare’s automated defenses mitigated 4.5 million unique DDoS attacks, an amount equivalent to 32% of all the DDoS attacks Cloudflare mitigated in 2023. Specifically, application layer HTTP DDoS attacks increased by 93% YoY and 51% quarter-over-quarter (QoQ).
Cloudflare correlates DDoS attack traffic and defines unique attacks by looking at event start and end times along with target destination.
Motives for launching DDoS attacks range from targeting specific organizations for financial gains (ransom), to testing the capacity of botnets, to targeting institutions and countries for political reasons. As an example, Cloudflare observed a 466% increase in DDoS attacks on Sweden after its acceptance to the NATO alliance on March 7, 2024. This mirrored the DDoS pattern observed during Finland’s NATO acceptance in 2023. The size of DDoS attacks themselves are also increasing.
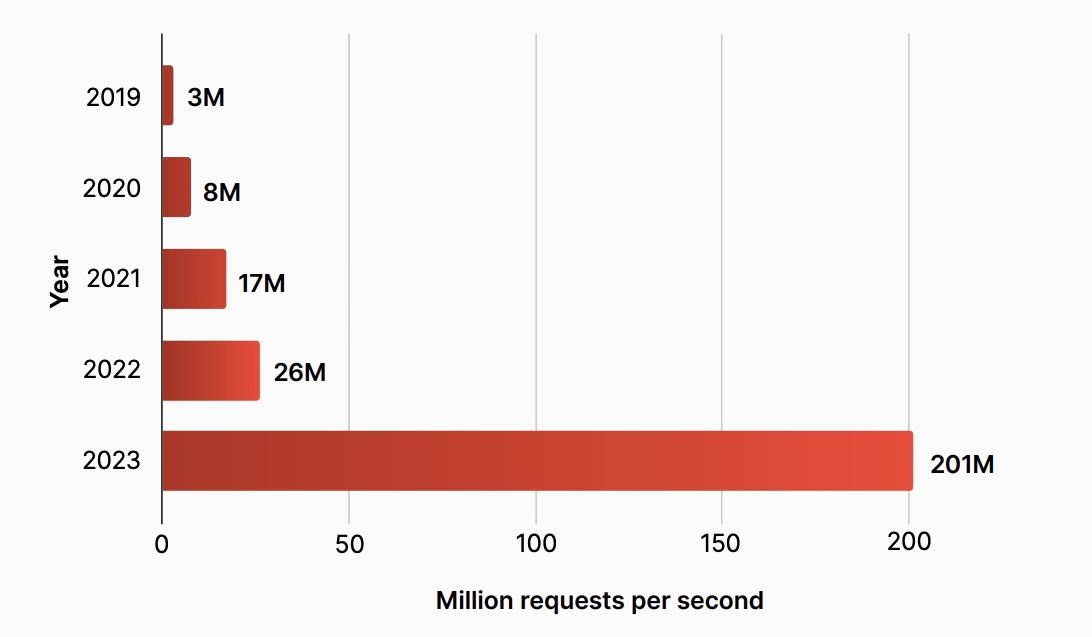
In August 2023, Cloudflare mitigated a hyper-volumetric HTTP/2 Rapid Reset DDoS attack that peaked at 201 million requests per second (rps) – three times larger than any previously observed attack. In the attack, threat actors exploited a zero-day vulnerability in the HTTP/2 protocol that had the potential to incapacitate nearly any server or application supporting HTTP/2. This underscores how menacing DDoS vulnerabilities are for unprotected organizations.
Gaming and gambling became the most targeted sector by DDoS attacks, followed by Internet technology companies and cryptomining.
Figure 6: Largest HTTP DDoS attacks as seen by Cloudflare, by year
Bot traffic insights
Cloudflare has continued to invest heavily in our bot detection systems. In early July, we declared AIndependence to help preserve a safe Internet for content creators, offering a brand new “easy button” to block all AI bots. It’s available for all customers, including those on our free tier.
Major progress has also been made in other complementary systems such as our Turnstile offering, a user-friendly, privacy-preserving alternative to CAPTCHA.
All these systems and technologies help us better identify and differentiate human traffic from automated bot traffic.
On average, bots comprise one-third of all application traffic
31.2% of all application traffic processed by Cloudflare is bot traffic. This percentage has stayed relatively consistent (hovering at about 30%) over the past three years.
The term bot traffic may carry a negative connotation, but in reality bot traffic is not necessarily good or bad; it all depends on the purpose of the bots. Some are “good” and perform a needed service, such as customer service chatbots and authorized search engine crawlers. But some bots misuse an online product or service and need to be blocked.
Different application owners may have different criteria for what they deem a “bad” bot. For example, some organizations may want to block a content scraping bot that is being deployed by a competitor to undercut on prices, whereas an organization that does not sell products or services may not be as concerned with content scraping. Known, good bots are classified by Cloudflare as “verified bots.”
93% of bots we identified were unverified bots, and potentially malicious
Unverified bots are often created for disruptive and harmful purposes, such as hoarding inventory, launching DDoS attacks, or attempting to take over an account via brute force or credential stuffing. Verified bots are those that are known to be safe, such as search engine crawlers, and Cloudflare aims to verify all major legitimate bot operators. A list of all verified bots can be found in our documentation.
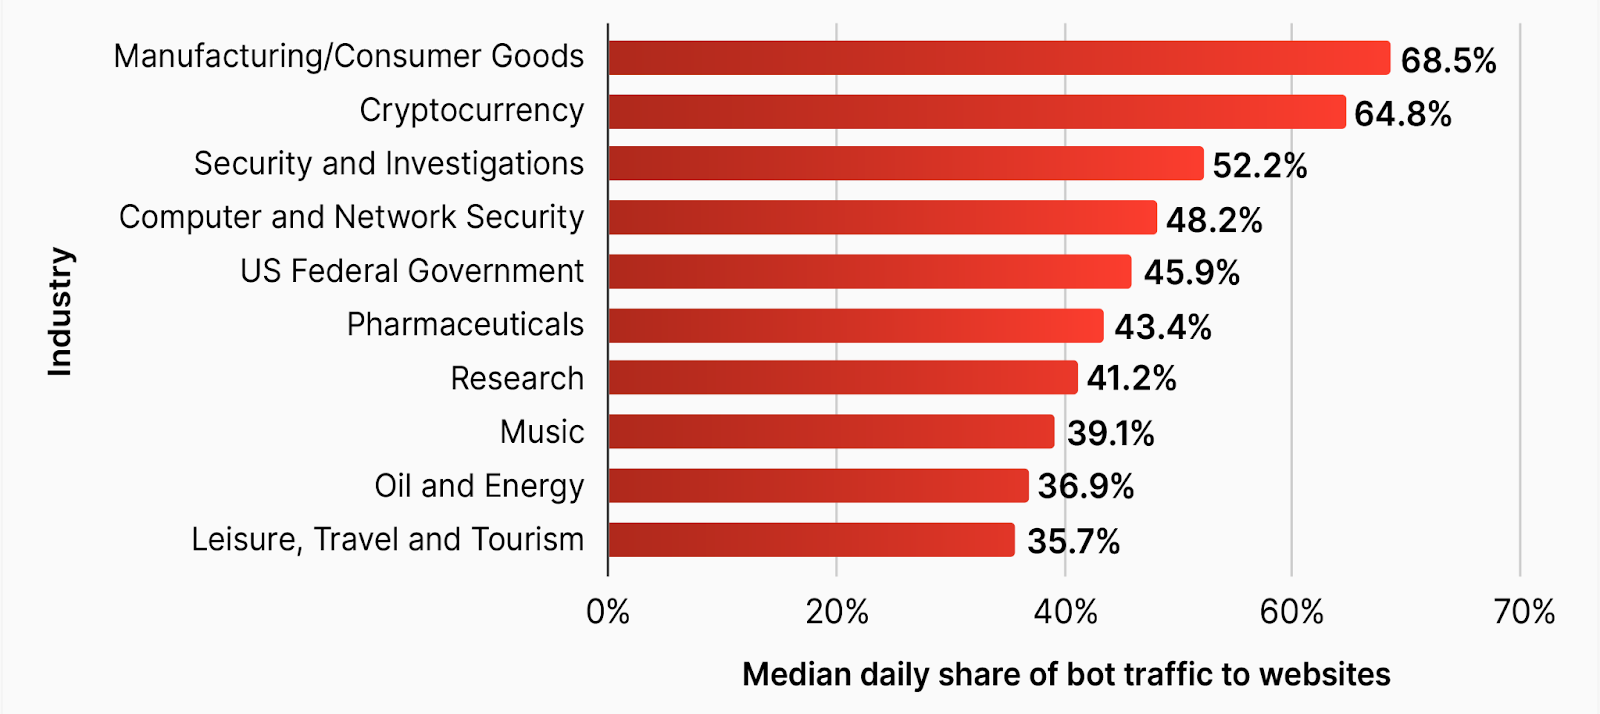
Attackers leveraging bots focus most on industries that could bring them large financial gains. For example, consumer goods websites are often the target of inventory hoarding, price scraping run by competition or automated applications aimed at exploiting some sort of arbitrage (for example, sneaker bots). This type of abuse can have a significant financial impact on the target organization.
Figure 8: Industries with the highest median daily share of bot traffic
API traffic insights
Consumers and end users expect dynamic web and mobile experiences powered by APIs. For businesses, APIs fuel competitive advantages, greater business intelligence, faster cloud deployments, integration of new AI capabilities, and more.
However, APIs introduce new risks by providing outside parties additional attack surfaces with which to access applications and databases which also need to be secured. As a consequence, numerous attacks we observe are not targeting API endpoints first rather than the traditional web interfaces.
The additional security concerns are of course not slowing down adoption of API first applications.
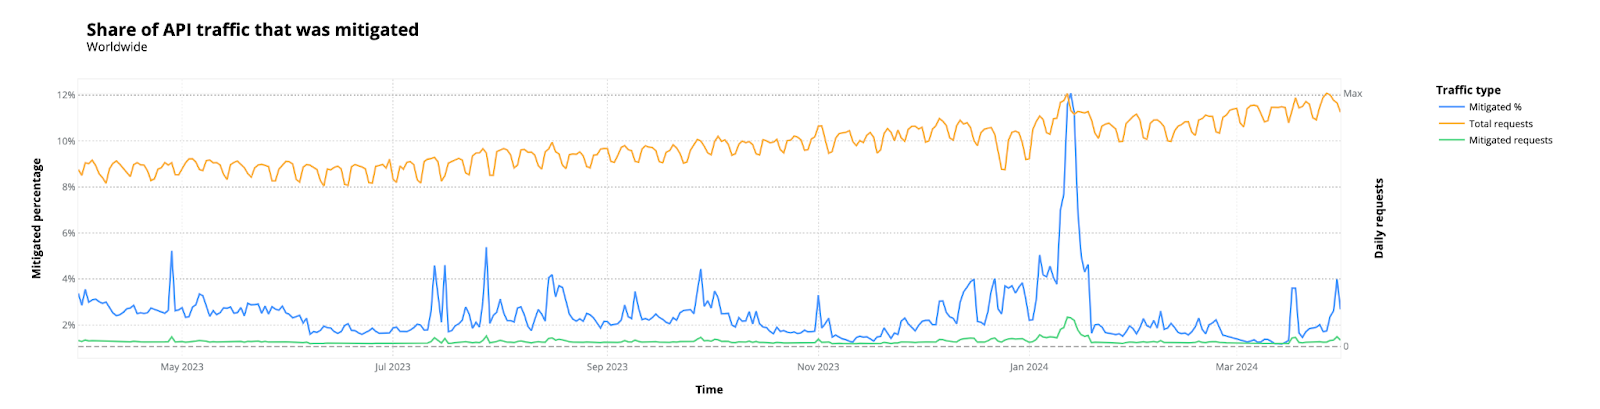
60% of dynamic (non cacheable) traffic is API-related
This is a two percentage point increase compared to last year’s report. Of this 60%, about 4% on average is mitigated by our security systems.
Figure 9: Share of mitigated API traffic
A substantial spike is visible around January 11-17 that accounts for almost a 10% increase in traffic share alone for that period. This was due to a specific customer zone receiving attack traffic that was mitigated by a WAF Custom Rule.
Digging into mitigation sources for API traffic, we see the WAF being the largest contributor, as standard malicious payloads are commonly applicable to both API endpoints and standard web applications.
Figure 10: API mitigated traffic broken down by product group
A quarter of APIs are “shadow APIs”
You cannot protect what you cannot see. And, many organizations lack accurate API inventories, even when they believe they can correctly identify API traffic.
Using our proprietary machine learning model that scans not just known API calls, but all HTTP requests (identifying API traffic that may be going unaccounted for), we found that organizations had 33% more public-facing API endpoints than they knew about. This number was the median, and it was calculated by comparing the number of API endpoints detected through machine learning based discovery vs. customer-provided session identifiers.
This suggests that nearly a quarter of APIs are “shadow APIs” and may not be properly inventoried and secured.
Client-side risks
Most organizations’ web apps rely on separate programs or pieces of code from third-party providers (usually coded in JavaScript). The use of third-party scripts accelerates modern web app development and allows organizations to ship features to market faster, without having to build all new app features in-house.
Using Cloudflare’s client side security product, Page Shield, we can get a view on the popularity of third party libraries used on the Internet and the risk they pose to organizations. This has become very relevant recently due to the Polyfill.io incident that affected more than one hundred thousand sites.
Enterprise applications use 47 third-party scripts on average
Cloudflare’s typical enterprise customer uses an average of 47 third-party scripts, and a median of 20 third-party scripts. The average is much higher than the median due to SaaS providers, who often have thousands of subdomains which may all use third-party scripts. Here are some of the top third-party script providers Cloudflare customers commonly use:
Google (Tag Manager, Analytics, Ads, Translate, reCAPTCHA, YouTube)
Meta (Facebook Pixel, Instagram)
Cloudflare (Web Analytics)
jsDelivr
New Relic
Appcues
Microsoft (Clarity, Bing, LinkedIn)
jQuery
WordPress (Web Analytics, hosted plugins)
Pinterest
UNPKG
TikTok
Hotjar
While useful, third-party software dependencies are often loaded directly by the end-user’s browser (i.e. they are loaded client-side) placing organizations and their customers at risk given that organizations have no direct control over third-party security measures. For example, in the retail sector, 18% of all data breaches originate from Magecart style attacks, according to Verizon’s 2024 Data Breach Investigations Report.
Enterprise applications connect to nearly 50 third-parties on average
Loading a third-party script into your website poses risks, even more so when that script “calls home” to submit data to perform the intended function. A typical example here is Google Analytics: whenever a user performs an action, the Google Analytics script will submit data back to the Google servers. We identify these as connections.
On average, each enterprise website connects to 50 separate third-party destinations, with a median of 15. Each of these connections also poses a potential client-side security risk as attackers will often use them to exfiltrate additional data going unnoticed.
Here are some of the top third-party connections Cloudflare customers commonly use:
Google (Analytics, Ads)
Microsoft (Clarity, Bing, LinkedIn)
Meta (Facebook Pixel)
Hotjar
Kaspersky
Sentry
Criteo
tawk.to
OneTrust
New Relic
PayPal
Looking forward
This application security report is also available in PDF format with additional recommendations on how to address many of the concerns raised, along with additional insights.
We also publish many of our reports with dynamic charts on Cloudflare Radar, making it an excellent resource to keep up to date with the state of the Internet.
This quarter we continued to make investments that provide security professionals with a holistic, actionable view of their entire attack surface. In Q2, we focused on enhancing visualization, prioritization, and integration capabilities across our key products and services. Below we’ve highlighted key releases and updates from the quarter across Rapid7 products and services—including InsightCloudSec, InsightVM, InsightIDR, Managed Detection and Response, and Rapid7 Labs.
Rapid7 acquires Noble to deliver comprehensive visibility and command of your attack surface
Rapid7 has acquired Noble, a leading provider of continuous cyber asset inventory, visibility, and management. This acquisition further enhances our ability to provide customers with the necessary control to monitor and manage exposures across their entire attack surface – from endpoint to cloud – with confidence. Visit our announcement overview page to learn more and stay tuned for additional details coming this summer.
Anticipate imminent threats from endpoint to cloud
Uncover multiple paths to risky compromised resources across cloud environments
We continue to enhance Attack Path Analysis in InsightCloudSec, most recently adding a new visualization that shows all of the various paths to a potentially compromised resource, providing a better understanding of the potential blast radius of an attack. We’ve also added the ability to export Attack Path graphs as a PDF, JPG, PNG, or SVG for easy sharing with additional stakeholders.
Automatically prioritize the most at-risk resources based on Layered Context
Layered Context provides insight into the riskiest resources running across cloud environments by taking into account a variety of risk signals from vulnerabilities to identity-related risk and public accessibility. This context makes it easier for security teams to effectively and efficiently prioritize cloud risk remediation efforts.
We recently released the following updates to Layered context:
Automatic prioritization of riskiest resources by taking into account the presence of toxic combinations to assign a relative risk score to all cloud resources.
A new risk tab, located on the Resource Details panel, that details all the risks impacting a resource in one view, transparently and efficiently diagnosing what is risky and why.
Access agent-based policy assessment results with InsightVM’s Bulk Export API.
Agent-based policy assessment is used to conduct configuration assessments of IT assets against widely used industry benchmarks or custom internal policies. Now customers can use the new Bulk Export API to export the policy assessment results data to their business intelligence tools and build custom visualizations and workflows that meet their reporting needs. Additionally, this API allows for efficient request and download of large data sets directly from the Insight Platform, avoiding unnecessary load on the Security Console and giving greater flexibility in handling the high volume of data that policy assessments produce.
Insight Agent support for ARM-based Windows 11 devices in InsightVM
Take advantage of the ARM processor chip’s great performance and low power requirements while maintaining agent-based visibility and assessment of remote assets within InsightVM. We also released enhanced vulnerability coverage for Windows 11 to provide customers with even higher quality, accurate vulnerability content.
Pinpoint critical signals of an attack and act confidently against threats
Rapid7 AI Engine extended to include Generative AI, driving improved MDR efficiency
Enhancements to the Rapid7 AI Engine have brought new Generative AI capabilities to the Rapid7 SOC, improving the efficacy and efficiency of our MDR services. These new additions include:
The new SOC Assistant that guides our internal SOC and MDR analysts through complex investigations and streamlines response workflows by querying sources like the Rapid7 MDR Handbook, keeping our analysts a step ahead.
The ability to automatically generate incident reports once investigations are closed out, streamlining a typically manual and time-intensive process. Every report that is generated by the Rapid7 AI Engine is reviewed and enhanced as needed by our SOC teams, making certain every data point is accurate and actionable.
Stop attacks before they begin with Rapid7’s patented Ransomware Prevention
Rapid7’s patented, preemptive Ransomware Prevention technology focuses on disrupting the evasive behaviors that ransomware and other forms of malware leverage, preventing both known and unknown (zero-day) attacks before they start. Coexisting alongside NGAV, EDR, and EPP solutions, Ransomware Prevention:
Provides anadditional layer of protection on the endpoint focused on mitigating the risk associated with ransomware by using proprietary Data Encryption detection and response technology.
Focuses on the inner techniques that malicious and evasive attacks employ and embed in processes (instead of passively looking for patterns and analyzing processes and behaviors on runtime or post-execution), manipulating their logic so that they refrain from execution.
Monitor Crowdstrike Falcon EDR alerts within InsightIDR for streamlined alert triage
Simplify operations and optimize resource allocation by further integrating third party endpoint detection and response solutions with Rapid7. Managed Detection and Response customers can integrate CrowdStrike Falcon Endpoint with InsightIDR and leverage Rapid7’s highly skilled and experienced MDR SOC to help triage incoming alerts.
A growing library of actionable detections in InsightIDR
In Q2 2024 we added over 750 new detection rules. See them in-product or visit the Detection Library for descriptions and recommendations.
The latest in cybersecurity trends and research
New research from Rapid7 Labs: The 2024 Attack Intelligence Report
Since 2020, Rapid7 has tracked huge increases in zero-day exploits, ransomware attacks, mass compromise incidents, and evolutions in attacker behavior. In our 2024 Attack Intelligence Report, Rapid7 Labs analyzed 14 months of attacker behavior and marquee vulnerabilities and provides expert analysis and practical guidance for security professionals.
Dive into key findings—like how 36% of the widely exploited vulnerabilities Rapid7 tracked involved network edge technology—in the report here.
Take Command: Global security leaders, hands-on practitioners, and top researchers weigh in on the latest cybersecurity trends
In May we partnered with AWS for our Take Command 2024 Cybersecurity Summit, where we took a deep dive into new attack intelligence technologies like AI that are disrupting the threat landscape, macro influences on SOC teams, MDR services to build cyber resilience, and more. The sessions deliver clear guidance to zero in on threats and proactively prevent breaches—check them out on demand here.
Stay tuned for more!
As always, we’re continuing to work on exciting product enhancements and releases throughout the year. Keep an eye on our blog and release notes as we continue to highlight the latest in product and service investments at Rapid7.
We love hearing from members of the community and sharing the stories of amazing young people, volunteers, and educators who are using their passion for technology to create positive change in the world around them.
In our latest story, we’re heading to London to meet Yang, a Manager in Technology Consulting at EY specialising in Microsoft Business Applications, whose commitment to CoderDojo is truly inspiring. Yang’s passion for volunteering has grown since she first volunteered at a CoderDojo club at a local museum. In recent years, she has actively searched for ways to bring the CoderDojo movement to more children, and encouraged her colleagues to come along on the journey too.
Introducing Yang
When Yang was growing up, both of her parents worked in STEM, but her own journey into a career in technology took a varied route. After initially studying journalism in China, her path shifted when she pursued a Master’s in Digital Humanities at UCL, London, broadening her digital skills and paving the way for her current role.
On a weekend visit to a museum, Yang found the opportunity to volunteer at their CoderDojo. This experience sparked an enthusiasm to create more opportunities for young people to explore the world of computing, and this soon evolved into a plan to implement clubs at the EY offices.
Building a community of mentors
With support from the EY Corporate Responsibility team, and fellow colleagues, Yang started to deliver Dojo sessions at the EY office in London. From the very first session, Yang was blown away by the level of enthusiasm among her colleagues, and their willingness to volunteer their time to support the club. She soon realised it was possible to roll this initiative out to other offices around the country, expanding the volunteer network and increasing their impact.
Clubs have now been run in four EY offices across the UK, and the team has even seen the first international club take place, at the EY office in Baku, Azerbaijan. In total, EY clubs have seen around 350 young people attend and give coding a go.
Championing diversity in tech
As a woman in tech, Yang is all too aware of the gender imbalance in the industry, and this is something she wanted the clubs at the EY offices to address.
“If there are some female role models, I think for a little girl grow up that means so much. Because if they can see somebody thrive in this industry, they will see themselves there one day. And that’s the inspiration.” – Yang
Yang actively encourages female participation in Dojo sessions, for example through holding sessions with a focus on engaging girls to mark International Women’s Day and Ada Lovelace Day. Through her leadership, she creates an inclusive environment where girls can envision themselves as future leaders.
Yang’s motivation doesn’t only inspire the young people attending her clubs, but also resonates with those who work with her on a daily basis, including colleagues like Iman and Elizabeth, who shared how much they admire Yang’s dedication and energy.
“I would love to have had a role model like [Yang] when I was younger. She’s just so inspiring. She’s so full of energy. I mean, from my personal experience, when I was younger, we didn’t have anything to do with coding.
There were situations where I was vaguely interested [in computing] but was told that it wasn’t for girls. And now with Yang running these events, seeing the girls come here and being so interested and wanting to learn, it really opens up so many more doors for them that they don’t even realise.” – Elizabeth, colleague and CoderDojo volunteer
Seeing the impact of her mentorship and the enthusiasm of young participants has fueled Yang’s passion even further.
“This has been a great opportunity to set up CoderDojo sessions for young people. I’ve had a lot of support from colleagues and other volunteers who have helped to run the sessions […] I feel super proud of what we’ve achieved so far.” – Yang
For Yang, mentorship isn’t just about teaching technical skills; it’s about helping young people develop confidence and resilience, and letting everyone know there is a place for them in computing should they want one.
Continuing to make a difference in her community and beyond, Yang recently participated in the 68th annual UN Women’s Commission on the Status of Women, which is the UN’s largest annual gathering on gender equality and women’s empowerment.
We’re delighted to be part of Yang’s journey, and can’t wait to see what she contributes to the world of tech next.
Help us celebrate Yang and her inspiring journey by sharing her story on X, LinkedIn, and Facebook.
Чрез камерата си надничам зад слънчевите усмивки на тези деца и се чувствам като страничен наблюдател на един капсулиран свят. Ще разкажа за своите впечатления такива, каквито ми се стовариха при първата обиколка на квартал „Надежда“ в град Сливен, за
историите, скрити зад усмивките на децата.
Темата за ромските малцинства може би създава дискомфорт у мнозина по разнообразни причини – без значение дали сме леви, или десни. Иска ми се още в началото откровено да заявя, че аз самата съм генерално невежа по отношениe на ромската култура. Макар да имам добри намерения, не се срещам ежедневно с тази тема. И именно това се оказа важно за разгръщането на историята. За мен ромите бяха почти невидими, преди да обиколя села, къщи и семейства в Северна и Южна България. Благодарение на тези срещи, си дадох сметка, че
Невидимостта на ромите е следствие от наследствената бедност, която води до категоричното им отчуждаване и заличаване от обществения живот.
През 2022 г. пристигам в Сливен и веднага ме превеждат през „тунела“. Това е една от двете основни връзки на града с квартал, ограден с бетонна стена. Прекосявайки жп подлеза, се озовавам в непозната за сетивата ми среда. Преобладаващата архитектура в самото начало на квартала ми се вижда позната – 2-3-етажни постройки от редени тухли без мазилка. Често собственост на по-заможните в квартала.
Маршрутът ни прекарва през различните класови разделения в това принудително капсулирано общество. Навлизаме по-дълбоко в квартала и всичко ми се струва все по-чуждо. Липсата на дървета и зеленина, изпочупената настилка, постепенно обедняващите къщи. В началото ми е трудно да погледна хората – опитвам се да имам неутрално поведение, но се чувствам видимо непринадлежаща на махалата. Започват да ни следват деца и това успокоява забързаната ми мисъл. Въпреки видимите ни различия проявяваме интерес едни към други. Именно това ще се окаже причината по-късно да напиша този материал.
Улиците се стесняват дотолкова, че едва минава кола. Сблъсквам се с все по-бедна обстановка и се чудя как е възможно цялата среда да деградира на всеки следващ завой –
липсващи настилки, прозорци и врати, електричество, канализация… оскъдни постройки, ако изобщо могат да се окачествят като постройки.
Децата около нас са вече над 15 и ни следват с шумен интерес. Тук-там се спираме и се снимаме, но много възрастни ни гледат особено подозрително. Стигаме до крайната източна част на квартала, където отчаянието ми бележи връхната си точка. Последната улица ни отвежда до голямо сметище, в което сред боклуците разпознавам бебе в ръцете на майка. С нея се поглеждаме за кратък миг. Дори не мога да асимилирам сцената, на която съм свидетел. Вдигам камерата, снимам.
От 2022 г. насам посещавам квартала няколко пъти и участвам в редица мероприятия, организирани специално за децата по покана на Росица Кратункова и Ливиа Отал – съоснователки на Фондация „За Надежда“. Роси и Ливиа ми разкриват смисъла зад поведението на малките (а понякога дори и на възрастните). Още на първото събитие някои от децата ме запомнят – аз тях също. Тъй като имаме значителни културни и социални разлики (аз не знам кои са Фики, Роксана, не слушам популярна музика, говоря със сложни за тях думи, като „предпочитам“ и „пространство“), се опознаваме по един емоционален и интуитивен начин – танцуваме, смеем се, играем, говорим си за съвсем елементарни на пръв поглед неща, тоест обръщаме си внимание.
Да пораснеш в махалата няма нищо общо с начина, по който съм пораснала аз например. При всеки сблъсък с тази действителност си давам сметка, че говорим за една комплексна система от заобикаляща среда, здравеопазване, възпитание, общностно отглеждане, сигурност, култура, отношения и вероятно още много други неща, които пропускам.
Професията, за която момичетата мечтаят, е фризьорка или маникюристка, а момчетата искат да вземат книжка, за да карат кола. За някои от децата постигането на тези неща се оказва особено трудно. Често споделят, че искат да завършат образование, но циничката в мен понякога се пита дали не го казват само защото ние искаме да го чуем.
Управлението почти ги е изоставило (освен ако не броим сметището като „ресурс“ за поминък на най-бедните). В махалата действат собствени правила – има казино на мястото на читалище, което Общината продава през 2017 г., няма аптека, тротоарите са рядкост, зеленината също, първата детска площадка беше открита едва през 2023 г. на гаровия парк до квартала благодарение отново на НПО. Според изследвания на УНИЦЕФ България бедността и занемарената градска среда могат да доведат до недохранване и липса на основни условия за игра и развитие, което има дългосрочни негативни ефекти върху здравето и развитието на децата.
Познавайки контекста, хлапетата се усмихват невинно и в същото време носят в себе си нещо, което не виждаме, не знаем и за което можем само да гадаем. Вече нерядко зад усмивките им се прокрадват онези тъмни истории, които съм научила, откакто ходя там.
Някои от децата никога не са виждали море, не са се качвали на планина, нямат чисти дрехи, дрехи въобще, обувки, да не говорим за редовен достъп до храна или играчки. Някои от тях нямат близост и обич. Не са развили фина моторика. Иначе казано, те нямат детство, възможност за достоен живот, нито равен старт.
Затова пък имат наследствена бедност.
Обречени са от самото си раждане да повтарят модела на своите родители, като с всяко поколение се отдалечават от знанието на предишното. Ниското образование и безработицата са основни фактори, водещи до бедност в България. Безработните с начално или с по-ниско образование са особено уязвими, като рискът от бедност при тях надвишава 80%.
Фактите и числата изглеждат толкова истински в очите и усмивките на тези деца и толкова студени и безразлични, написани с мастило на хартия (или пиксели на екран). Дали ако ги наречем „български деца“, реакцията на гражданите ще е много по-категорична и остра? Реторичен въпрос.
На фестивала на 1 юни 2024 г. се доближавам още повече до живота на децата. Този ден е за тях. Те могат да пеят, да танцуват, играят и лудуват, да се смеят, да мечтаят, а не да гледат по-малките си братя и сестри, да работят заедно с родителите си, да чистят чужди къщи за пари.
По време на едно от посещенията установявам, че дете, което намирам за особено умно и прозорливо, се оказва една от жертвите на сексуално насилие от британския гражданин Даниел Хъл. Няма да забравя небрежния и травмиращ за мен разказ на Ливиа, докато пием кафе, гледайки отдалеч джип с множество деца, струпани около него. Наскоро самите те го нарекоха пред мен „лошия човек“.
Кой е Даниел Хъл?
През 2016 г. британските власти го издирват, тъй като по време на дело за обвинения в сексуална експлоатация на деца и разпространение на детска порнография в интернет е бил освободен под гаранция. По това време се укрива в България, но е екстрадиран, след като е издадена европейска заповед за ареста му. Получава 15-месечна присъда, но е пуснат предсрочно и отново пристига в България, нарушавайки британските закони, които му забраняват да напуска страната. Според тези закони той е трябвало да се регистрира по постоянно местожителство и да се впише в регистъра на сексуалните насилници след излизането си от затвора.
Въпросният насилник насилва толкова отдавна, че някои от жертвите му вече са пораснали и имат свои деца. Фондация „За Надежда“ тропа на вратите на всички институции, за да намери начин 14-те семейства – официални жертви на педофила от второто дело срещу него, да получат справедливост. Звучи обещаващо.
Истината обаче е, че всички съдии в Сливен отказват да поемат делото и да съдят Хъл за посегателство над деца, макар този път да има още по-солидни доказателства. И Даниел продължава да проповядва любов към Бога като самопровъзгласил се пастор, този път от ареста. Но най-вече, подобно на много насилници,
той търси отчаяни хора, чието доверие може да спечели лесно и бързо.
Ситуацията е толкова банална, че чак ми е неудобно. Сякаш несъзнателно отказваме да повярваме, че има жертви на такива схеми. В 90% от случаите насилниците са хора, на които жертвите имат доверие. Насилието се случва както в богати и заможни семейства, така и в бедни, сменят се просто инструментите на действие. Даниел знае от какво да се възползва най-добре – от безнадеждността и бедността на своите жертви. Затова им строи бани, къщи, плаща им животоспасяващи операции, води децата на екскурзии. На 20 юни получавам съобщение от Росица и Ливиа, че поредният съдия е отказал да разгледа делото.
Връщайки се към „наследствената бедност“ – онова, което ме преследва в историите на тези семейства, – бих искала да намеря за себе си отговор на някои въпроси, поставяйки се на мястото на самите хора:
Ще получа ли трудов договор на някое работно място? А как да отида на работа, ако няма кой да ми гледа децата? Ако не виждам надежда и ако съм жертва на физическо и в някои случаи на сексуално насилие? Ако теми като равнопоставеност, зелена сделка, климатични промени и здравеопазване не ме достигат – та аз дори нямам достъп до канализация?! Ако лекари ми отказват консултация как да гледам детето си, а учители не искат да ми преподават? Ако хората по улицата не желаят да ме погледнат, защото предпочитат да се справят с проблема, като си представят, че ме няма?
Как да не допусна тази среда да ме изгради и промени? Как да се измъкна от нея? Как да намеря Надежда?
Помогнете ни да научим какви са читателските ви възприятия и отношението ви към „Тоест“, като попълните нашата анкета.
The Antwerp University Hospital (UZA) is a university center known for top clinical and customer-friendly patient care, high-quality academic training, and groundbreaking scientific research with an important international dimension. The UZA has 593 hospital beds in 26 nursing units, as well as 41 highly specialized medical services where more than 800,000 patients are consulted every year and over 4,000 employees, including 642 doctors. Keep reading to see how Zabbix premium partner Open-Future rises to the challenge of monitoring this massive IT infrastructure.
The challenge
Due to the large amount of users connecting on a daily basis, the UZA’s Zabbix server was set up as a virtual machine with a front-end separate from the Zabbix server and database. Splitting the front-end from the Zabbix server allows them to use dedicated resources for the front-end and the Zabbix server.
Most of the monitoring is done by Zabbix agents on Linux and Windows. In order for the applications to see if everything is working as it should be, the Open-Future team leverages UserParameters and database monitoring with Zabbix Agent 2. For some more specific monitoring cases, we also make use of custom SQL scripts.
Because one server can have multiple teams responsible for just the application or the OS, getting the correct information to the right team proved to be a challenge. A simple solution was the creation of different trigger actions for every team that included only the triggers that were needed. Unfortunately this proved to be very difficult to manage over time and error-prone when changes were needed.
The solution
By making extensive use of tags in Zabbix, our team could add labels to the items and link them back to the correct user groups. This made it easier to send the right information to the correct teams and allowed them to both drastically reduce the number of actions that had to be created and simplify the actions that were created.
The results
Zabbix has proven itself as a powerful and versatile monitoring and management platform that allows our team to gain real-time insight into the performance of the UZA’s IT infrastructure and applications. Zabbix’s ability to collect and visualize various types of data (including network traffic, server load, application performance, and more) makes it easy to identify and resolve issues before they impact operations or patient care.
At present, Open-Future monitors about 1,400 hosts, a mix of Windows, Linux and BareMetal monitored by proxies. This allows us to monitor more then 10.000 metrics with more then 55,000 triggers to notify us in case of any potential issues. We make use of custom templates, plugins, and scripts to gather all needed information.
The impact of Zabbix on our operational efficiency cannot be overstated. Automated alerts and reporting functionality let us respond quickly to incidents and issues, which reduces downtime and maximizes the availability of critical systems. This has direct benefits for the UZA’s patients, as we can make sure that vital systems like electronic medical records are always available and that the quality of care is maintained at the highest level.
To provide the best experiences, we use technologies like cookies to store and/or access device information. Consenting to these technologies will allow us to process data such as browsing behavior or unique IDs on this site. Not consenting or withdrawing consent, may adversely affect certain features and functions.
Functional
Always active
The technical storage or access is strictly necessary for the legitimate purpose of enabling the use of a specific service explicitly requested by the subscriber or user, or for the sole purpose of carrying out the transmission of a communication over an electronic communications network.
Preferences
The technical storage or access is necessary for the legitimate purpose of storing preferences that are not requested by the subscriber or user.
Statistics
The technical storage or access that is used exclusively for statistical purposes.The technical storage or access that is used exclusively for anonymous statistical purposes. Without a subpoena, voluntary compliance on the part of your Internet Service Provider, or additional records from a third party, information stored or retrieved for this purpose alone cannot usually be used to identify you.
Marketing
The technical storage or access is required to create user profiles to send advertising, or to track the user on a website or across several websites for similar marketing purposes.


 in the top right corner of the chat panel which should show an option to enable or disable cross-region consent.

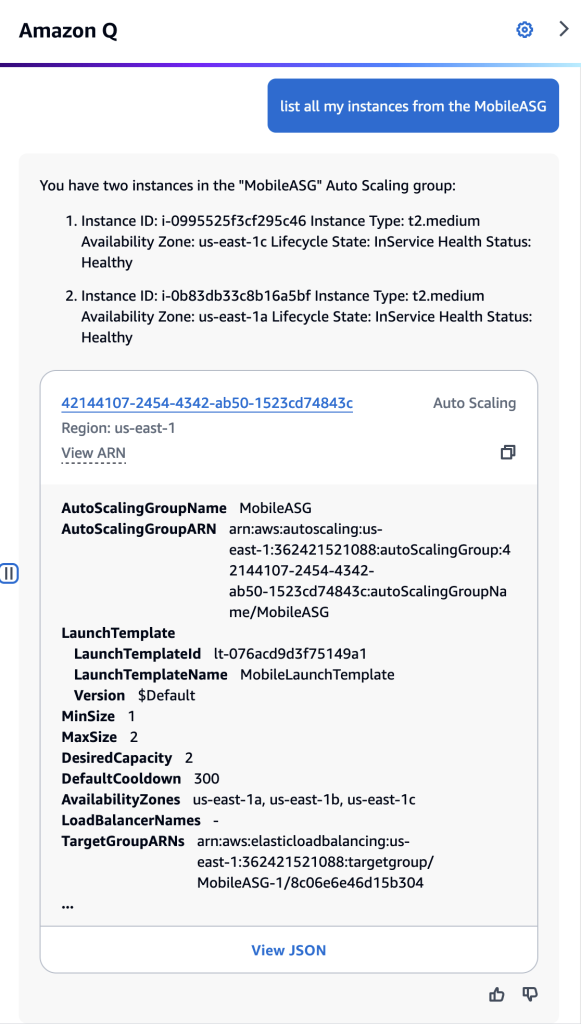


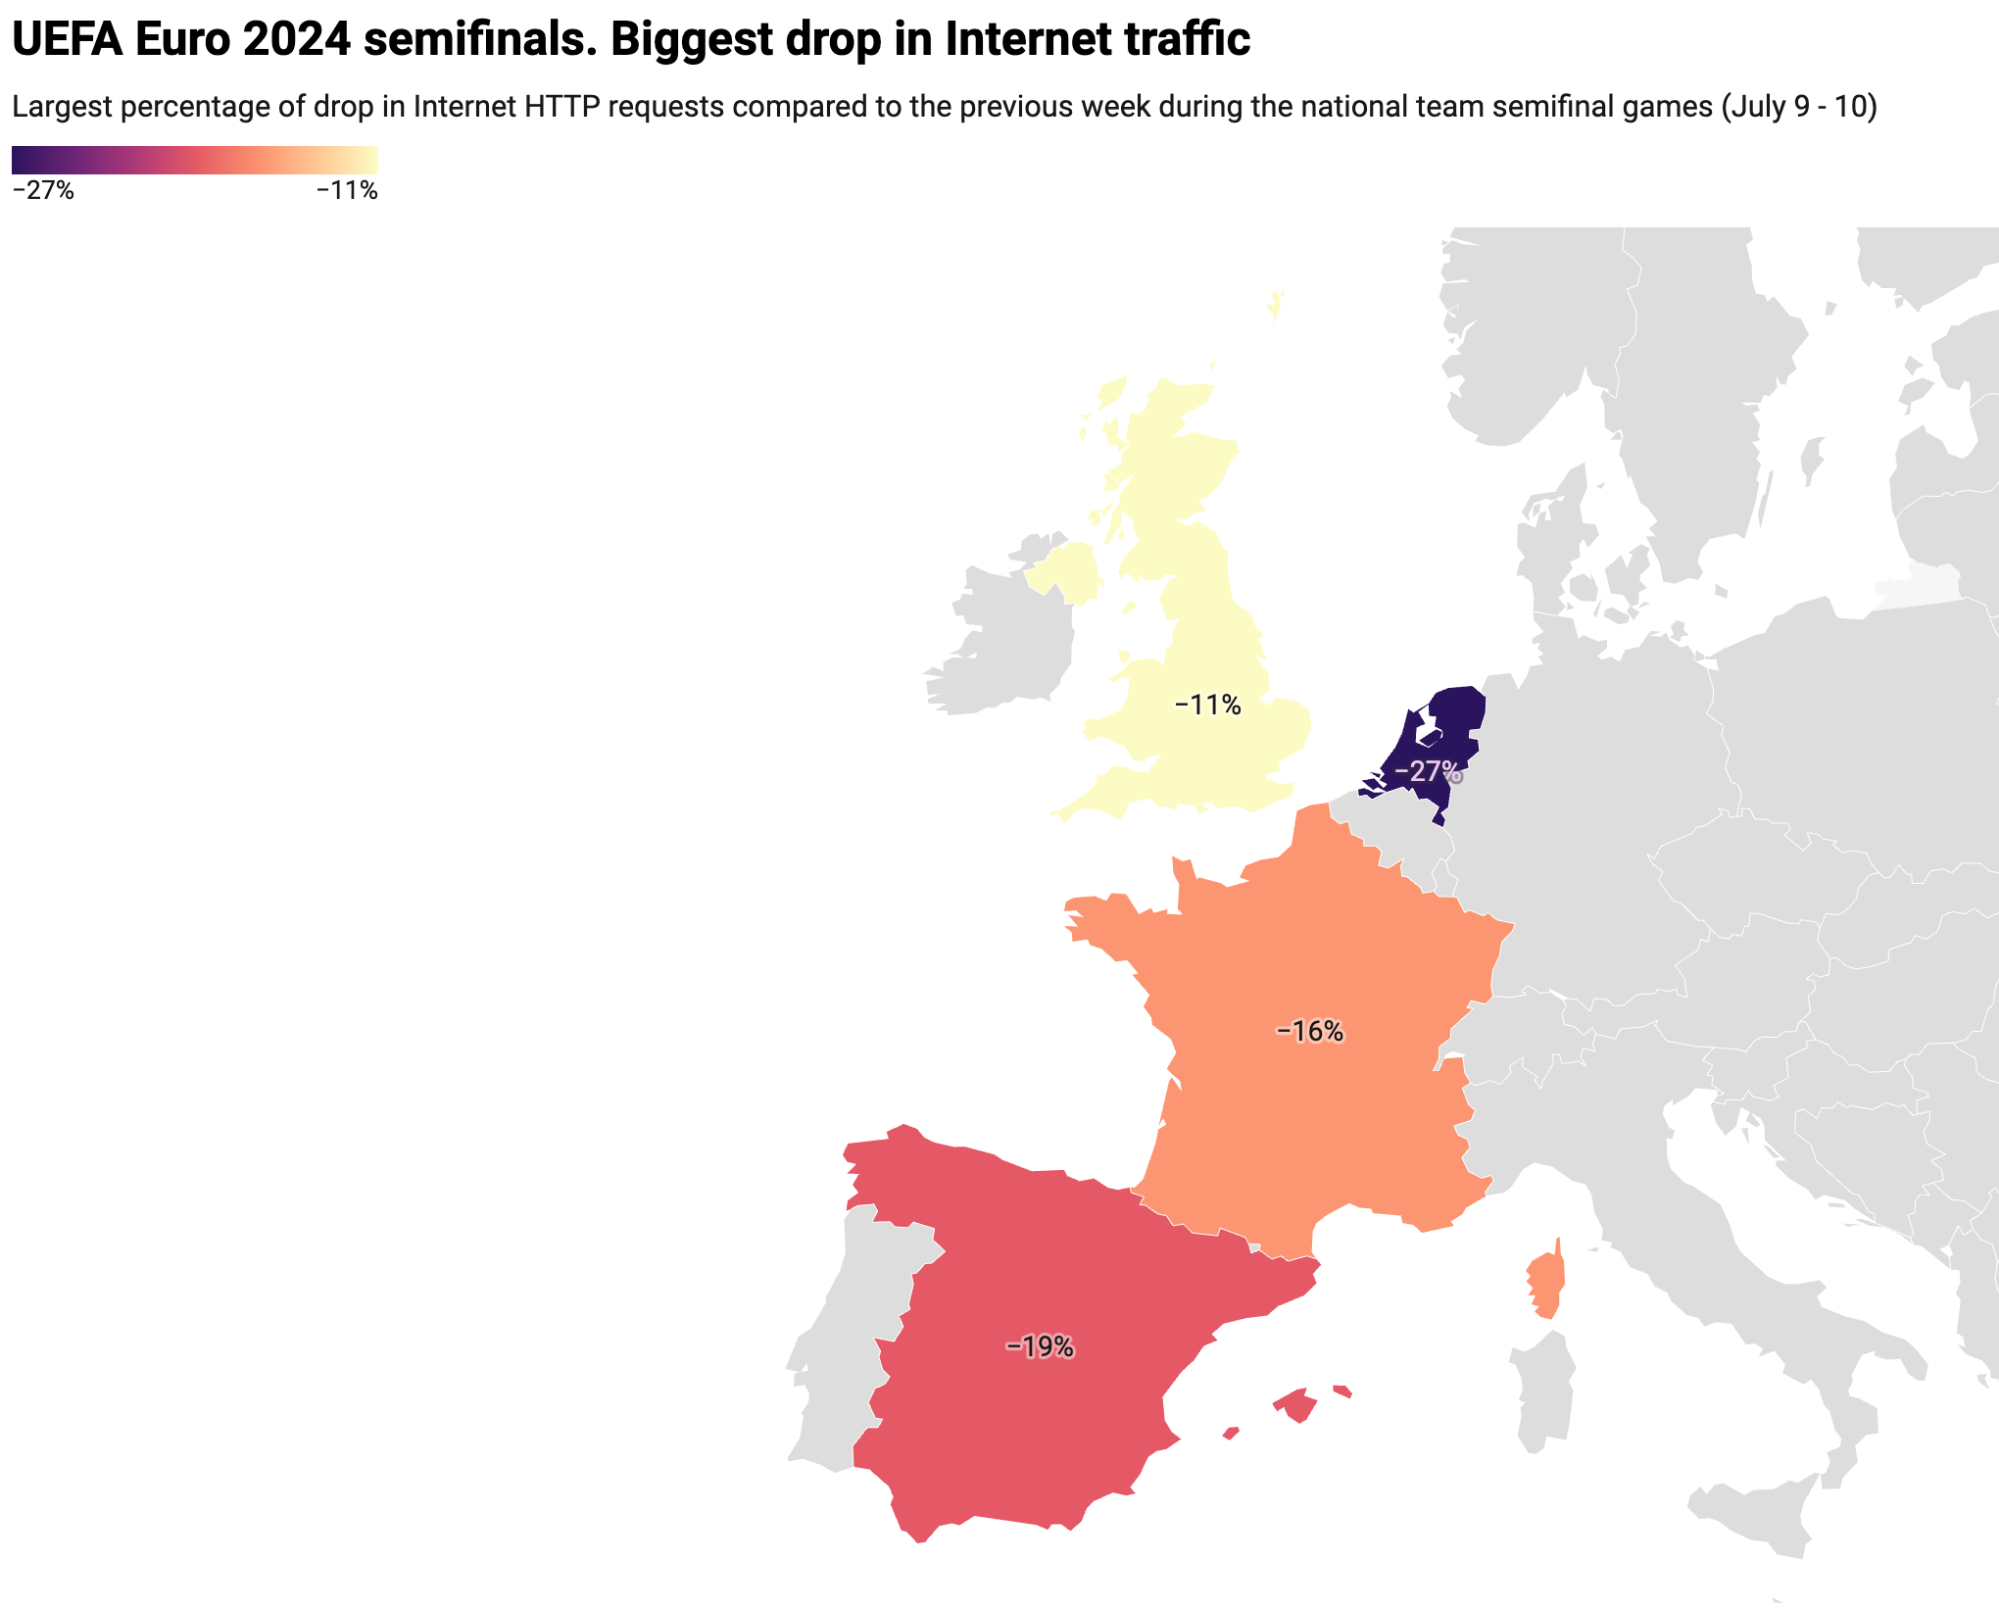
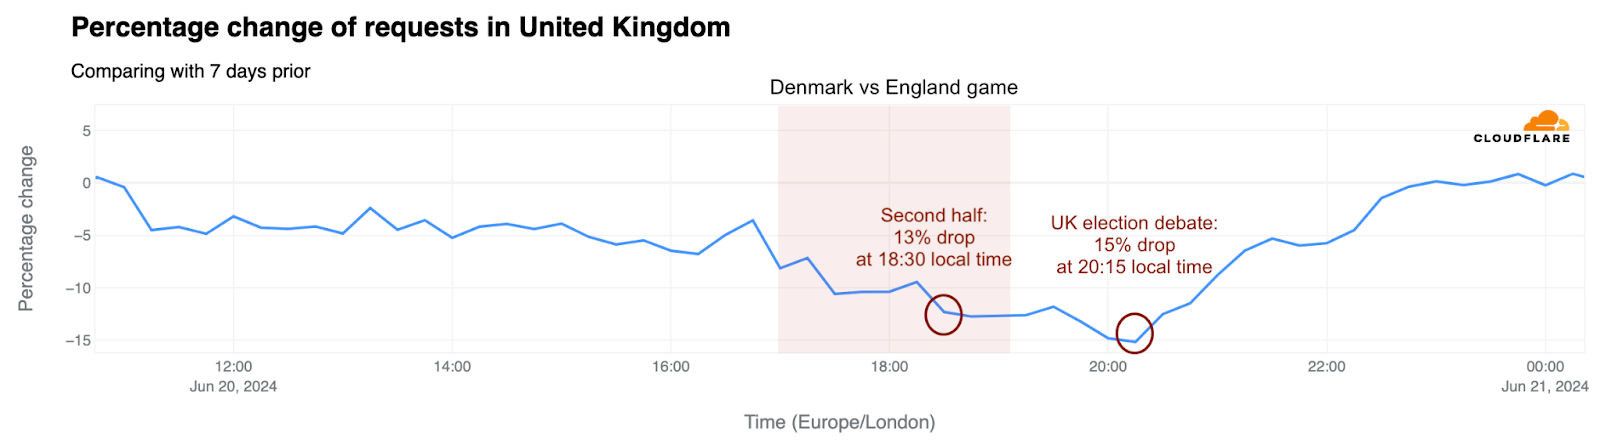
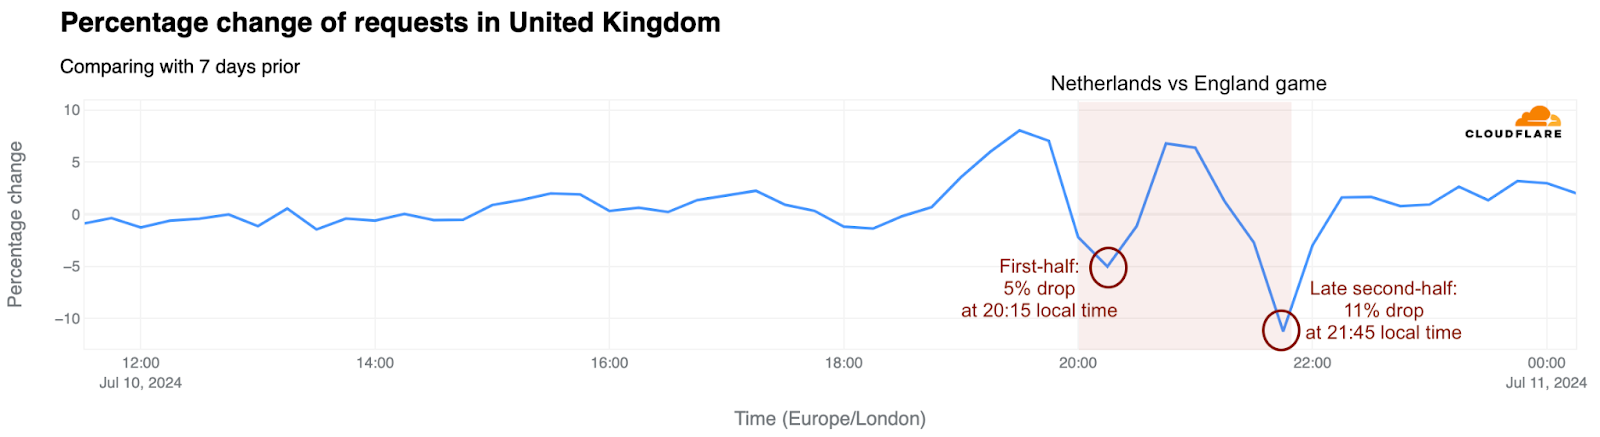
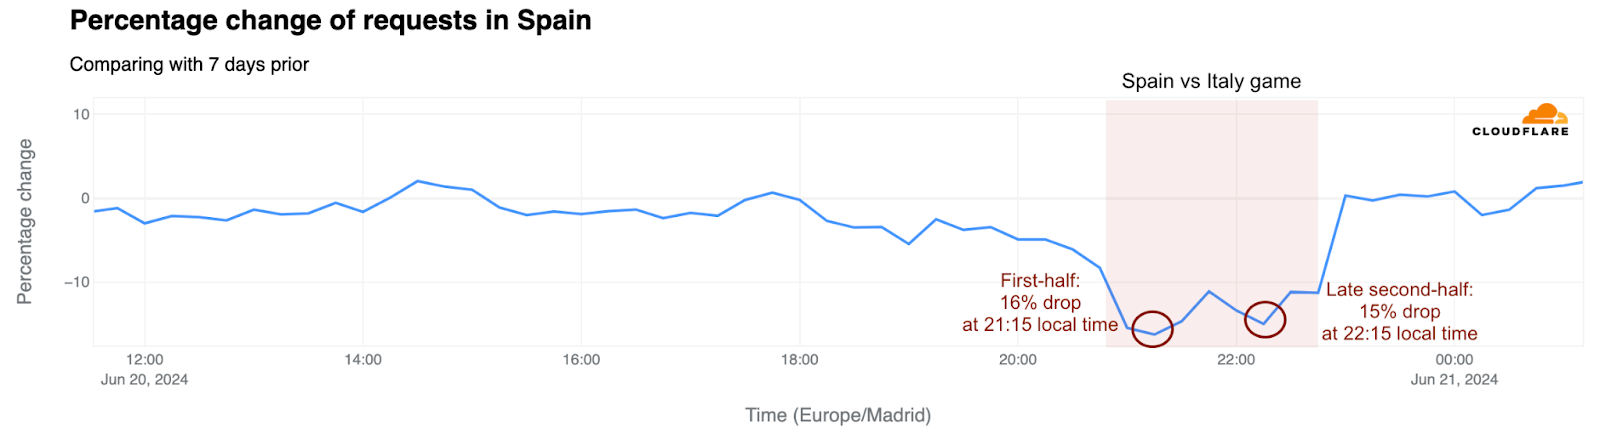
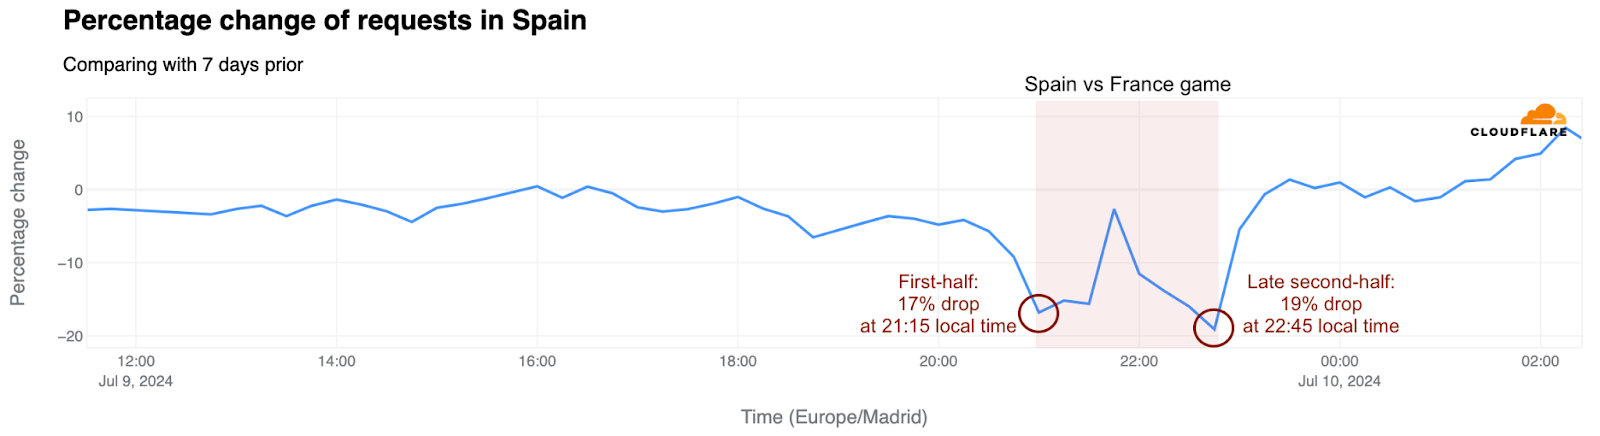


 Adam McCarthy is the EMEA Tech Leader for Healthcare and Life Sciences Startups at AWS. He has over 15 years’ experience researching and implementing machine learning, HPC, and scientific computing environments, especially in academia, hospitals, and drug discovery.


 Jatinder Singh is a Senior Technical Account Manager at AWS and finds satisfaction in aiding customers in their cloud migration and innovation endeavors. Beyond his professional life, he relishes spending moments with his family and indulging in hobbies such as reading, culinary pursuits, and playing chess.
 Hajer Bouafif is an Analytics Specialist Solutions Architect at Amazon Web Services. She focuses on Amazon OpenSearch Service and helps customers design and build well-architected analytics workloads in diverse industries. Hajer enjoys spending time outdoors and discovering new cultures.
 Puneetha Kumara is a Senior Technical Account Manager at AWS, with over 15 years of industry experience, including roles in cloud architecture, systems engineering, and container orchestration.
 Manpreet Kour is a Senior Technical Account Manager at AWS and is dedicated to ensuring customer satisfaction. Her approach involves a deep understanding of customer objectives, aligning them with software capabilities, and effectively driving customer success. Outside of her professional endeavors, she enjoys traveling and spending quality time with her family.