All posts by Donnie Prakoso

AWS Fargate Enables Faster Container Startup using Seekable OCI

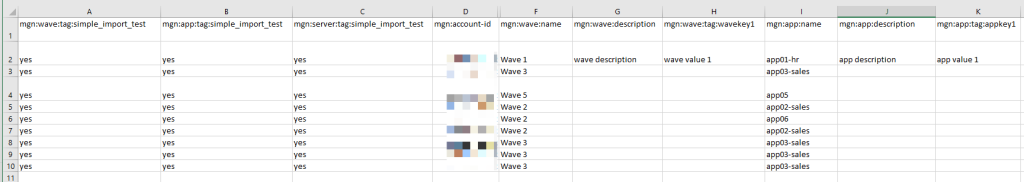
Post Syndicated from Donnie Prakoso original https://aws.amazon.com/blogs/aws/aws-fargate-enables-faster-container-startup-using-seekable-oci/

While developing with containers is becoming an increasingly popular way for deploying and scaling applications, there are still areas where improvements can be made. One of the main issues with scaling containerized applications is the long startup time, especially during scale up when newer instances need to be added. This issue can have a negative impact on the customer experience, for example when a website needs to scale out to serve additional traffic.

A research paper shows that container image downloads account for 76 percent of container startup time, but on average only 6.4 percent of the data is needed for the container to start doing useful work. Starting and scaling out containerized applications requires downloading container images from a remote container registry. This may introduce a non-trivial latency, as the entire image must be downloaded and unpacked before the applications can be started.

One solution to this problem is lazy loading (also known as asynchronous loading) container images. This approach downloads data from the container registry in parallel with the application startup, such as stargz-snapshotter, a project that aims to improve the overall container start time.

Last year, we introduced Seekable OCI (SOCI), a technology open sourced by Amazon Web Services (AWS) that enables container runtimes to implement lazy loading the container image to start applications faster without modifying the container images. As part of that effort, we open sourced SOCI Snapshotter, a snapshotter plugin that enables lazy loading with SOCI in containerd.

AWS Fargate Support for SOCI
Today, I’m excited to share that AWS Fargate now supports Seekable OCI (SOCI), which helps applications deploy and scale out faster by enabling containers to start without waiting to download the entire container image. At launch, this new capability is available for Amazon Elastic Container Service (Amazon ECS) applications running on AWS Fargate.

Here’s a quick look to show how AWS Fargate support for SOCI works:

SOCI works by creating an index (SOCI index) of the files within an existing container image. This index is a key enabler to launching containers faster, providing the capability to extract an individual file from a container image without having to download the entire image. Your applications no longer need to wait to complete pulling and unpacking a container image before your applications start running. This allows you to deploy and scale out applications more quickly and reduce the rollout time for application updates.

A SOCI index is generated and stored separately from the container images. This means that your container images don’t need to be converted to use SOCI, therefore not breaking secure hash algorithm (SHA)-based security, such as container image signing. The index is then stored in the registry alongside the container image. At release, AWS Fargate support for SOCI works with Amazon Elastic Container Registry (Amazon ECR).

When you use Amazon ECS with AWS Fargate to run your SOCI-indexed containerized images, AWS Fargate automatically detects if a SOCI index for the image exists and starts the container without waiting for the entire image to be pulled. This also means that AWS Fargate will still continue to run container images that don’t have SOCI indexes.
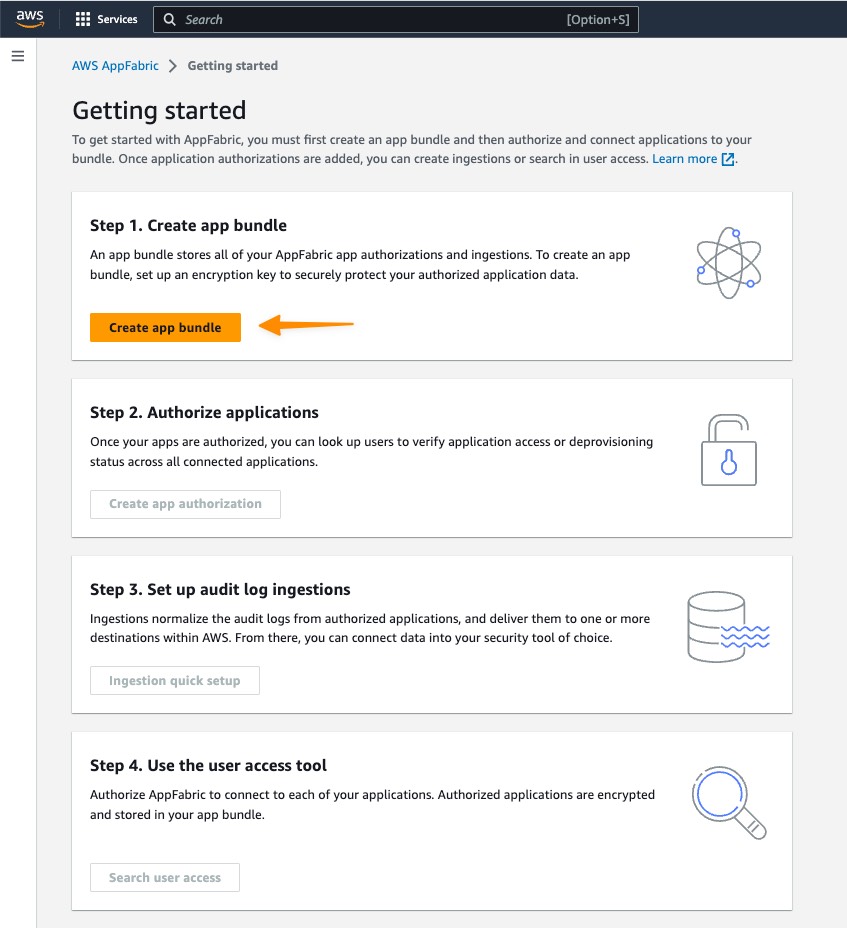
Let’s Get Started
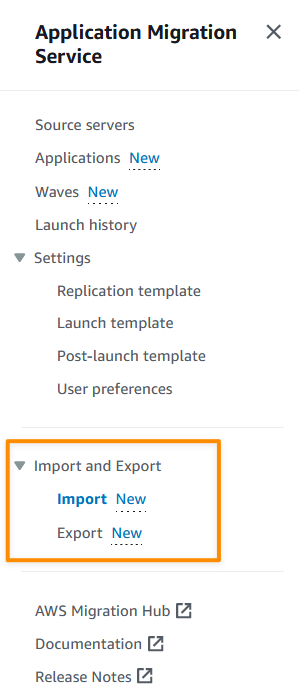
There are two ways to create SOCI indexes for container images.

  • Use AWS SOCI Index BuilderAWS SOCI Index Builder is a serverless solution for indexing container images in the AWS Cloud. This AWS CloudFormation stack deploys an Amazon EventBridge rule to identify Amazon ECR action events and invoke an AWS Lambda function to match the defined filter. Then, another AWS Lambda function generates and pushes SOCI indexes to repositories in the Amazon ECR registry.
  • Create SOCI indexes manually – This approach provides more flexibility on in how the SOCI indexes are created, including for existing container images in Amazon ECR repositories. To create SOCI indexes, you can use the soci CLI provided by the soci-snapshotter project.

The AWS SOCI Index Builder provides you with an automated process to get started and build SOCI indexes for your container images. The sociCLI provides you with more flexibility around index generation and the ability to natively integrate index generation in your CI/CD pipelines.

In this article, I manually generate SOCI indexes using the soci CLI from the soci-snapshotter project.

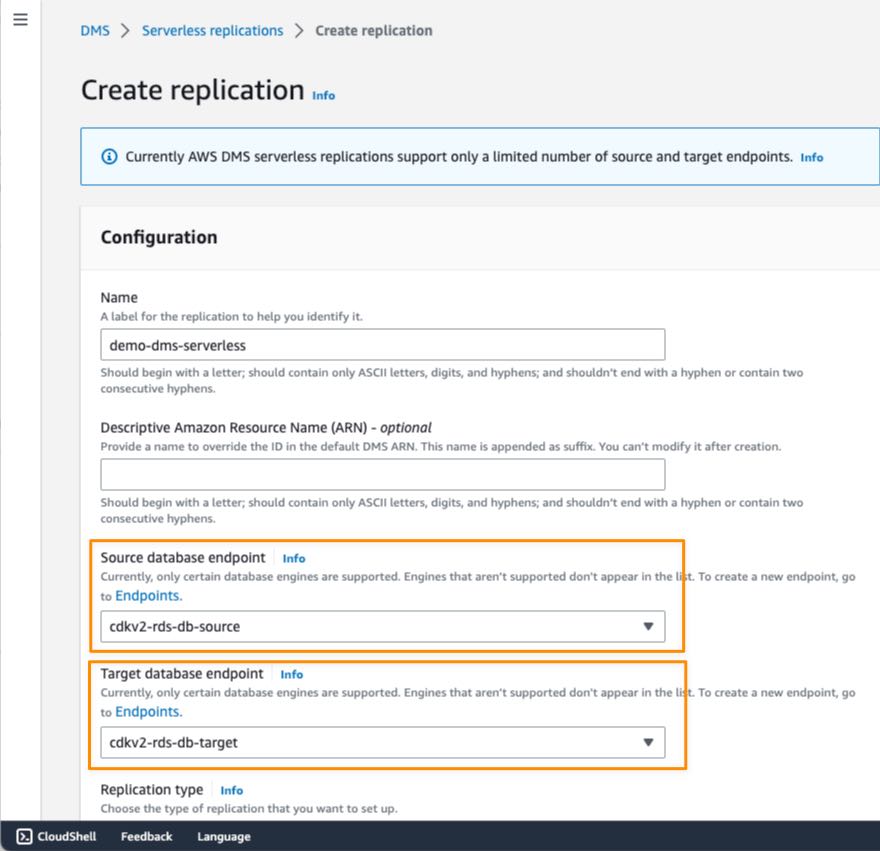
Create a Repository and Push Container Images
First, I create an Amazon ECR repository called pytorch-socifor my container image using AWS CLI.

$ aws ecr create-repository --region us-east-1 --repository-name pytorch-soci

I keep the Amazon ECR URI output and define it as a variable to make it easier for me to refer to the repository in the next step.

$ ECRSOCIURI=xyz.dkr.ecr.us-east-1.amazonaws.com/pytorch-soci:latest

For the sample application, I use a PyTorch training (CPU-based) container image from AWS Deep Learning Containers. I use the nerdctl CLI to pull the container image because, by default, the Docker Engine stores the container image in the Docker Engine image store, not the containerd image store.

$ SAMPLE_IMAGE="763104351884.dkr.ecr.us-east-1.amazonaws.com/pytorch-training:1.5.1-cpu-py36-ubuntu16.04" 
$ aws ecr get-login-password --region us-east-1 | sudo nerdctl login --username AWS --password-stdin xyz.dkr.ecr.ap-southeast-1.amazonaws.com
$ sudo nerdctl pull --platform linux/amd64 $SAMPLE_IMAGE

Then, I tag the container image for the repository that I created in the previous step.

$ sudo nerdctl tag $SAMPLE_IMAGE $ECRSOCIURI

Next, I need to push the container image into the ECR repository.

$ sudo nerdctl push $ECRSOCIURI

At this point, my container image is already in my Amazon ECR repository.

Create SOCI Indexes
Next, I need to create SOCI index.

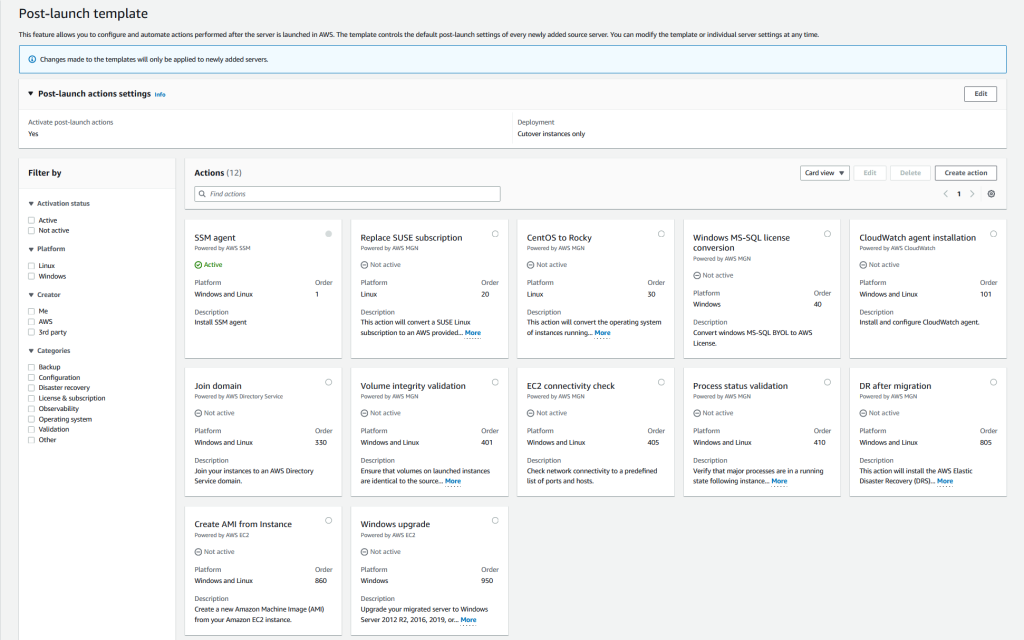
A SOCI index is an artifact that enables lazy loading of container images. A SOCI index consists of 1) a SOCI index manifest and 2) a set of zTOCs. The following image illustrates the components in a SOCI index manifest, and how it refers to a container image manifest.

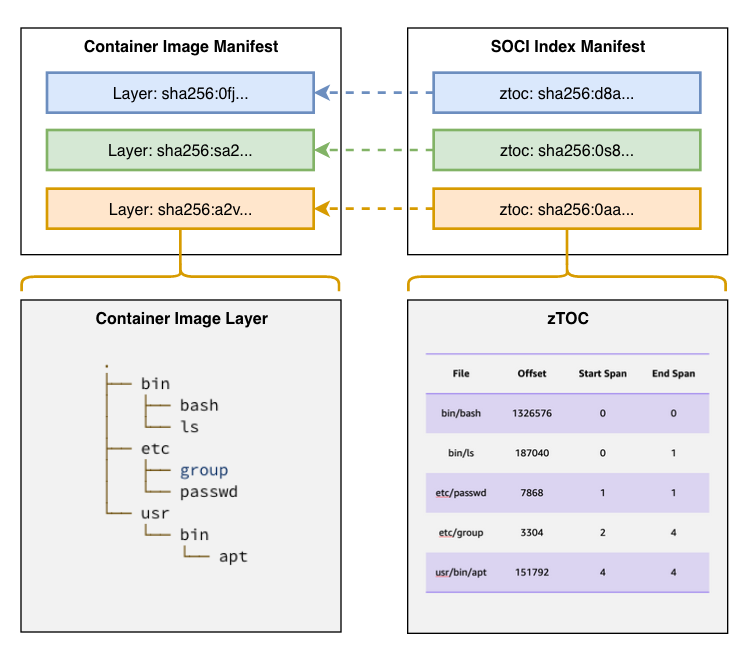
The SOCI index manifest contains the list of zTOCs and a reference to the image for which the manifest was generated. A zTOC, or table of contents for compressed data, consists of two parts:

  1. TOC, a table of contents containing file metadata and the corresponding offset in the decompressed TAR archive.
  2. zInfo, a collection of checkpoints representing the state of the compression engine at various points in the layer.

To learn more about the concept and term, please visit soci-snapshotter Terminology page.

Before I can create SOCI indexes, I need to install the sociCLI. To learn more about how to install the soci, visit Getting Started with soci-snapshotter.

To create SOCI indexes, I use the soci create command.

$ sudo soci create $ECRSOCIURI
layer sha256:4c6ec688ebe374ea7d89ce967576d221a177ebd2c02ca9f053197f954102e30b -> ztoc skipped
layer sha256:ab09082b308205f9bf973c4b887132374f34ec64b923deef7e2f7ea1a34c1dad -> ztoc skipped
layer sha256:cd413555f0d1643e96fe0d4da7f5ed5e8dc9c6004b0731a0a810acab381d8c61 -> ztoc skipped
layer sha256:eee85b8a173b8fde0e319d42ae4adb7990ed2a0ce97ca5563cf85f529879a301 -> ztoc skipped
layer sha256:3a1b659108d7aaa52a58355c7f5704fcd6ab1b348ec9b61da925f3c3affa7efc -> ztoc skipped
layer sha256:d8f520dcac6d926130409c7b3a8f77aea639642ba1347359aaf81a8b43ce1f99 -> ztoc skipped
layer sha256:d75d26599d366ecd2aa1bfa72926948ce821815f89604b6a0a49cfca100570a0 -> ztoc skipped
layer sha256:a429d26ed72a85a6588f4b2af0049ae75761dac1bb8ba8017b8830878fb51124 -> ztoc skipped
layer sha256:5bebf55933a382e053394e285accaecb1dec9e215a5c7da0b9962a2d09a579bc -> ztoc skipped
layer sha256:5dfa26c6b9c9d1ccbcb1eaa65befa376805d9324174ac580ca76fdedc3575f54 -> ztoc skipped
layer sha256:0ba7bf18aa406cb7dc372ac732de222b04d1c824ff1705d8900831c3d1361ff5 -> ztoc skipped
layer sha256:4007a89234b4f56c03e6831dc220550d2e5fba935d9f5f5bcea64857ac4f4888 -> ztoc sha256:0b4d78c856b7e9e3d507ac6ba64e2e2468997639608ef43c088637f379bb47e4
layer sha256:089632f60d8cfe243c5bc355a77401c9a8d2f415d730f00f6f91d44bb96c251b -> ztoc sha256:f6a16d3d07326fe3bddbdb1aab5fbd4e924ec357b4292a6933158cc7cc33605b
layer sha256:f18dd99041c3095ade3d5013a61a00eeab8b878ba9be8545c2eabfbca3f3a7f3 -> ztoc sha256:95d7966c964dabb54cb110a1a8373d7b88cfc479336d473f6ba0f275afa629dd
layer sha256:69e1edcfbd217582677d4636de8be2a25a24775469d677664c8714ed64f557c3 -> ztoc sha256:ac0e18bd39d398917942c4b87ac75b90240df1e5cb13999869158877b400b865

From the above output, I can see that sociCLI created zTOCs for four layers, which and this means only these four layers will be lazily pulled and the other container image layers will be downloaded in full before the container image starts. This is because there is less of a launch time impact in lazy loading very small container image layers. However, you can configure this behavior using the --min-layer-size flag when you run soci create.

Verify and Push SOCI Indexes
The soci CLI also provides several commands that can help you to review the SOCI Indexes that have been generated.

To see a list of all index manifests, I can run the following command.

$ sudo soci index list

DIGEST                                                                     SIZE    IMAGE REF                                                                                   PLATFORM       MEDIA TYPE                                    CREATED
sha256:ea5c3489622d4e97d4ad5e300c8482c3d30b2be44a12c68779776014b15c5822    1931    xyz.dkr.ecr.us-east-1.amazonaws.com/pytorch-soci:latest                                     linux/amd64    application/vnd.oci.image.manifest.v1+json    10m4s ago
sha256:ea5c3489622d4e97d4ad5e300c8482c3d30b2be44a12c68779776014b15c5822    1931    763104351884.dkr.ecr.us-east-1.amazonaws.com/pytorch-training:1.5.1-cpu-py36-ubuntu16.04    linux/amd64    application/vnd.oci.image.manifest.v1+json    10m4s ago

While optional, if I need to see the list of zTOC, I can use the following command.

$ sudo soci ztoc list
DIGEST                                                                     SIZE        LAYER DIGEST
sha256:0b4d78c856b7e9e3d507ac6ba64e2e2468997639608ef43c088637f379bb47e4    2038072     sha256:4007a89234b4f56c03e6831dc220550d2e5fba935d9f5f5bcea64857ac4f4888
sha256:95d7966c964dabb54cb110a1a8373d7b88cfc479336d473f6ba0f275afa629dd    11442416    sha256:f18dd99041c3095ade3d5013a61a00eeab8b878ba9be8545c2eabfbca3f3a7f3
sha256:ac0e18bd39d398917942c4b87ac75b90240df1e5cb13999869158877b400b865    36277264    sha256:69e1edcfbd217582677d4636de8be2a25a24775469d677664c8714ed64f557c3
sha256:f6a16d3d07326fe3bddbdb1aab5fbd4e924ec357b4292a6933158cc7cc33605b    10152696    sha256:089632f60d8cfe243c5bc355a77401c9a8d2f415d730f00f6f91d44bb96c251b

This series of zTOCs contains all of the information that SOCI needs to find a given file in a layer. To review the zTOC for each layer, I can use one of the digest sums from the preceding output and use the following command.

$ sudo soci ztoc info sha256:0b4d78c856b7e9e3d507ac6ba64e2e2468997639608ef43c088637f379bb47e4
{
  "version": "0.9",
  "build_tool": "AWS SOCI CLI v0.1",
  "size": 2038072,
  "span_size": 4194304,
  "num_spans": 33,
  "num_files": 5552,
  "num_multi_span_files": 26,
  "files": [
    {
      "filename": "bin/",
      "offset": 512,
      "size": 0,
      "type": "dir",
      "start_span": 0,
      "end_span": 0
    },
    {
      "filename": "bin/bash",
      "offset": 1024,
      "size": 1037528,
      "type": "reg",
      "start_span": 0,
      "end_span": 0
    }

---Trimmed for brevity---

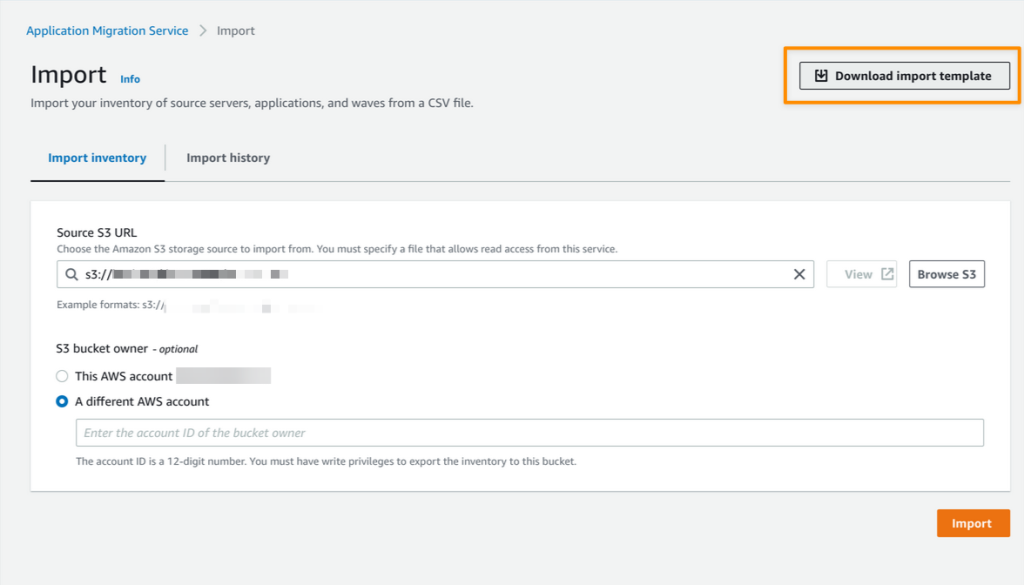
Now, I need to use the following command to push all SOCI-related artifacts into the Amazon ECR.

$ PASSWORD=$(aws ecr get-login-password --region us-east-1)
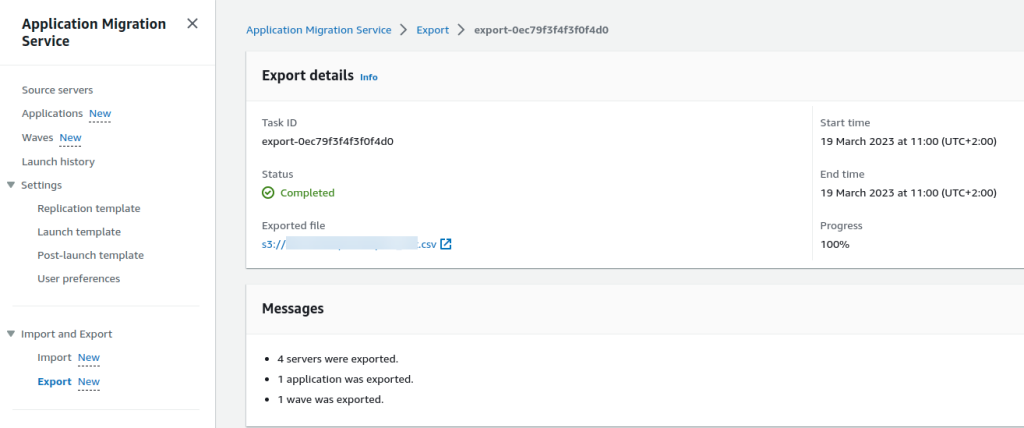
$ sudo soci push --user AWS:$PASSWORD $ECRSOCIURI

If I go to my Amazon ECR repository, I can verify the index is created. Here, I can see that two additional objects are listed alongside my container image: a SOCI Index and an Image index. The image index allows AWS Fargate to look up SOCI indexes associated with my container image.

Understanding SOCI Performance
The main objective of SOCI is to minimize the required time to start containerized applications. To measure the performance of AWS Fargate lazy loading container images using SOCI, I need to understand how long it takes for my container images to start with SOCI and without SOCI.

To understand the duration needed for each container image to start, I can use metrics available from the DescribeTasks API on Amazon ECS. The first metric is createdAt, the timestamp for the time when the task was created and entered the PENDING state. The second metric is startedAt, the time when the task transitioned from the PENDING state to the RUNNING state.

For this, I have created another Amazon ECR repository using the same container image but without generating a SOCI index, called pytorch-without-soci. If I compare these container images, I have two additional objects in pytorch-soci(an image index and a SOCI index) that don’t exist in pytorch-without-soci.

Deploy and Run Applications
To run the applications, I have created an Amazon ECS cluster called demo-pytorch-soci-cluster, a VPC and the required ECS task execution role. If you’re new to Amazon ECS, you can follow Getting started with Amazon ECS to be more familiar with how to deploy and run your containerized applications.

Now, let’s deploy and run both the container images with FARGATE as the launch type. I define five tasks for each pytorch-sociand pytorch-without-soci.

$ aws ecs \ 
    --region us-east-1 \ 
    run-task \ 
    --count 5 \ 
    --launch-type FARGATE \ 
    --task-definition arn:aws:ecs:us-east-1:XYZ:task-definition/pytorch-soci \ 
    --cluster socidemo 

$ aws ecs \ 
    --region us-east-1 \ 
    run-task \ 
    --count 5 \ 
    --launch-type FARGATE \ 
    --task-definition arn:aws:ecs:us-east-1:XYZ:task-definition/pytorch-without-soci \ 
    --cluster socidemo

After a few minutes, there are 10 running tasks on my ECS cluster.

After verifying that all my tasks are running, I run the following script to get two metrics: createdAt and startedAt.

#!/bin/bash
CLUSTER=<CLUSTER_NAME>
TASKDEF=<TASK_DEFINITION>
REGION="us-east-1"
TASKS=$(aws ecs list-tasks \
    --cluster $CLUSTER \
    --family $TASKDEF \
    --region $REGION \
    --query 'taskArns[*]' \
    --output text)

aws ecs describe-tasks \
    --tasks $TASKS \
    --region $REGION \
    --cluster $CLUSTER \
    --query "tasks[] | reverse(sort_by(@, &createdAt)) | [].[{startedAt: startedAt, createdAt: createdAt, taskArn: taskArn}]" \
    --output table

Running the above command for the container image without SOCI indexes — pytorch-without-soci— produces following output:

-------------------------------------------------------------------------------------------------------------------------------------------------------------------------------------
|                                                                                   DescribeTasks                                                                                   |
+----------------------------------+-----------------------------------+------------------------------------------------------------------------------------------------------------+
|             createdAt            |             startedAt             |                                                  taskArn                                                   |
+----------------------------------+-----------------------------------+------------------------------------------------------------------------------------------------------------+
|  2023-07-07T17:43:59.233000+00:00|  2023-07-07T17:46:09.856000+00:00 |  arn:aws:ecs:ap-southeast-1:xyz:task/demo-pytorch-soci-cluster/dcdf19b6e66444aeb3bc607a3114fae0   |
|  2023-07-07T17:43:59.233000+00:00|  2023-07-07T17:46:09.459000+00:00 |  arn:aws:ecs:ap-southeast-1:xyz:task/demo-pytorch-soci-cluster/9178b75c98ee4c4e8d9c681ddb26f2ca   |
|  2023-07-07T17:43:59.233000+00:00|  2023-07-07T17:46:21.645000+00:00 |  arn:aws:ecs:ap-southeast-1:xyz:task/demo-pytorch-soci-cluster/7da51e036c414cbab7690409ce08cc99   |
|  2023-07-07T17:43:59.233000+00:00|  2023-07-07T17:46:00.606000+00:00 |  arn:aws:ecs:ap-southeast-1:xyz:task/demo-pytorch-soci-cluster/5ee8f48194874e6dbba75a5ef753cad2   |
|  2023-07-07T17:43:59.233000+00:00|  2023-07-07T17:46:02.461000+00:00 |  arn:aws:ecs:ap-southeast-1:xyz:task/demo-pytorch-soci-cluster/58531a9e94ed44deb5377fa997caec36   |
+----------------------------------+-----------------------------------+------------------------------------------------------------------------------------------------------------+

From the average aggregated delta time (between startedAt and createdAt) for each task, the pytorch-without-soci (without SOCI indexes) successfully ran after 129 seconds.

Next, I’m running same command but for pytorch-sociwhich comes with SOCI indexes.

-------------------------------------------------------------------------------------------------------------------------------------------------------------------------------------
|                                                                                   DescribeTasks                                                                                   |
+----------------------------------+-----------------------------------+------------------------------------------------------------------------------------------------------------+
|             createdAt            |             startedAt             |                                                  taskArn                                                   |
+----------------------------------+-----------------------------------+------------------------------------------------------------------------------------------------------------+
|  2023-07-07T17:43:53.318000+00:00|  2023-07-07T17:44:51.076000+00:00 |  arn:aws:ecs:ap-southeast-1:xyz:task/demo-pytorch-soci-cluster/c57d8cff6033494b97f6fd0e1b797b8f   |
|  2023-07-07T17:43:53.318000+00:00|  2023-07-07T17:44:52.212000+00:00 |  arn:aws:ecs:ap-southeast-1:xyz:task/demo-pytorch-soci-cluster/6d168f9e99324a59bd6e28de36289456   |
|  2023-07-07T17:43:53.318000+00:00|  2023-07-07T17:45:05.443000+00:00 |  arn:aws:ecs:ap-southeast-1:xyz:task/demo-pytorch-soci-cluster/4bdc43b4c1f84f8d9d40dbd1a41645da   |
|  2023-07-07T17:43:53.318000+00:00|  2023-07-07T17:44:50.618000+00:00 |  arn:aws:ecs:ap-southeast-1:xyz:task/demo-pytorch-soci-cluster/43ea53ea84154d5aa90f8fdd7414c6df   |
|  2023-07-07T17:43:53.318000+00:00|  2023-07-07T17:44:50.777000+00:00 |  arn:aws:ecs:ap-southeast-1:xyz:task/demo-pytorch-soci-cluster/0731bea30d42449e9006a5d8902756d5   |
+----------------------------------+-----------------------------------+------------------------------------------------------------------------------------------------------------+

Here, I see my container image with SOCI-enabled — pytorch-soci — was started 60 seconds after being created.

This means that running my sample application with SOCI indexes on AWS Fargate is approximately 50 percent faster compared to running without SOCI indexes.

It’s recommended to benchmark the startup and scaling-out time of your application with and without SOCI. This helps you to have a better understanding of how your application behaves and if your applications benefit from AWS Fargate support for SOCI.

Customer Voices
During the private preview period, we heard lots of feedback from our customers about AWS Fargate support for SOCI. Here’s what our customers say:

Autodesk provides critical design, make, and operate software solutions across the architecture, engineering, construction, manufacturing, media, and entertainment industries. “SOCI has given us a 50% improvement in startup performance for our time-sensitive simulation workloads running on Amazon ECS with AWS Fargate. This allows our application to scale out faster, enabling us to quickly serve increased user demand and save on costs by reducing idle compute capacity. The AWS Partner Solution for creating the SOCI index is easy to configure and deploy.” – Boaz Brudner, Head of Innovyze SaaS Engineering, AI and Architecture, Autodesk.

Flywire is a global payments enablement and software company, on a mission to deliver the world’s most important and complex payments. “We run multi-step deployment pipelines on Amazon ECS with AWS Fargate which can take several minutes to complete. With SOCI, the total pipeline duration is reduced by over 50% without making any changes to our applications, or the deployment process. This allowed us to drastically reduce the rollout time for our application updates. For some of our larger images of over 750MB, SOCI improved the task startup time by more than 60%.”, Samuel Burgos, Sr. Cloud Security Engineer, Flywire.

Virtuoso is a leading software corporation that makes functional UI and end-to-end testing software. “SOCI has helped us reduce the lag between demand and availability of compute. We have very bursty workloads which our customers expect to start as fast as possible. SOCI helps our ECS tasks spin-up 40% faster, allowing us to quickly scale our application and reduce the pool of idle compute capacity, enabling us to deliver value more efficiently. Setting up SOCI was really easy. We opted to use the quick-start AWS Partner’s solution with which we could leave our build and deployment pipelines untouched.”, Mathew Hall, Head of Site Reliability Engineering, Virtuoso.

Things to Know
Availability — AWS Fargate support for SOCI is available in all AWS Regions where Amazon ECS, AWS Fargate, and Amazon ECR are available.

Pricing — AWS Fargate support for SOCI is available at no additional cost and you will only be charged for storing the SOCI indexes in Amazon ECR.

Get Started — Learn more about benefits and how to get started on the AWS Fargate Support for SOCI page.

Happy building.
Donnie

AWS Week in Review – Generative AI with LLM Hands-on Course, Amazon SageMaker Data Wrangler Updates, and More – July 3, 2023

Post Syndicated from Donnie Prakoso original https://aws.amazon.com/blogs/aws/aws-week-in-review-generative-ai-with-llm-hands-on-course-amazon-sagemaker-data-wrangler-updates-and-more-july-3-2023/

In last week’s AWS Week in Review post, Danilo mentioned that it’s summer in London. Well, I’m based in Singapore, and it’s mostly summer here. But, June is a special month here as it marks the start of durian season.

Starting next week, I’ll be travelling to Thailand, Malaysia, and the Philippines. But before I go, I want to share some interesting updates from last week for you.

Let’s get started.

Last Week’s Launches
Here are some launches that caught my attention:

New Hands-on Course: Generative AI with Large Language Models – Generative AI has been a technology highlight for the past few months. If you are on your journey to learn large language models (LLM), then you can try the new hands-on course Generative AI with LLMs at Coursera. Antje wrote a post to announce this collaboration course between DeepLearning.AI and AWS. This course is designed to prepare data scientists and engineers to become experts in selecting, training, fine-tuning, and deploying LLMs for real-world applications.

Generative AI with large language models

Amazon SageMaker Data Wrangler direct connection to Snowflake – With this announcement, you can now browse databases, tables, schemas, and query data from Snowflake in SageMaker Data Wrangler. This unlocks the possibility for you to join your data with other popular data sources, such as S3, Amazon Athena, Amazon Redshift, Amazon EMR and over 50 SaaS applications to create the right data set for machine learning.

Amazon SageMaker Role Manager now provides CDK library to create fine-grained permissions — The CDK support for Amazon SageMaker Role Manager lets you define permissions with fine-grained access for SageMaker users, jobs, and SageMaker pipelines programmatically. This will reduce manual efforts and consistent permissions management. For example, the following code grants permissions with a set of related machine learning activities specific to a persona.


export class myCDKStack extends cdk.Stack {
  constructor(scope: cdk.App, id: string, props?: cdk.StackProps) {
    super(scope, id, props);

    const persona = new Persona(this, 'example-persona-id', {
        activities: [
            Activity.runStudioAppsV2(this, 'example-id1', {}), 
            Activity.accessS3Buckets(this, 'example-id2', {s3buckets: [s3.S3Bucket.fromBucketName('DOC-EXAMPLE-BUCKET')]}) 
            Activity.accessAwsServices(this, 'example-id3', {})
        ]
    });

    const role = persona.createRole(this, 'example-IAM-role-id', 'example-IAM-role-name');
    
    }
}                                   
                

AWS SDK for SAP ABAP – Great news for SAP ABAP developers! We just recently announced the general availability of the AWS SDK for SAP ABAP. With this, ABAP developers can use simple, secure and configurable connections between ABAP environments and 200+ supported AWS services in all AWS Regions, including AWS GovCloud (US) Regions. This AWS SDK helps ABAP developers to modernize their business processes with AWS services.

Amazon OpenSearch Ingestion now supports ingesting events from Amazon Security Lake – Amazon OpenSearch Ingestion now lets you bring data in the Apache Parquet format. As Amazon Security Lake also uses Open Cybersecurity Schema Framework (OCSF) in Apache Parquet format, it means you can easily ingest data from Amazon Security Lake.

For a full list of AWS announcements, be sure to keep an eye on the What’s New at AWS page.

AWS Open-Source Updates
As always, my colleague Ricardo has curated the latest updates for open-source news at AWS. Here are some of the highlights.

lightsail-miab-installer – This handy command-line tool developed by my colleague Rio Astamal was designed to simplify the process of setting up Mail-in-a-Box on Amazon Lightsail. With lightsail-miab-installer, you can effortlessly streamline the installation and configuration of Mail-in-a-Box, making it even more accessible and user-friendly.

rdsconn – This amazing tool, created by AWS Hero Aidan Steele, simplifies the process of connecting to an AWS RDS instance within a VPC directly from your laptop. Using the recently launched EC2 Instance Connect, rdsconn eliminates the need for cumbersome SSH tunnels.

cdk-appflow – If you’re using AWS CDK to build your applications and Amazon AppFlow to create bidirectional data transfer integrations between various SaaS applications and AWS, then you’re going to love cdk-appflow, a new AWS CDK construct for Amazon AppFlow. It’s currently in technical preview, but you’re more than welcome to try it and provide us with your feedback.

Upcoming AWS Events
There are also upcoming events that you can join to learn. Let’s start with AWS Summit events:

And, let’s learn from our fellow builders and join AWS Community Days:

Open for Registration for AWS re:Invent
Before I end this post, AWS re:Invent registration is now open!

This learning conference hosted by AWS for the global cloud computing community will be held from Nov 27 to Dec 1, 2023 in Las Vegas.

Pro-tip: You can use information on the Justify Your Trip page to prove the value of your trip to AWS re:Invent.

That’s all for this week. Check back next Monday for another Week in Review.

Happy building.
Donnie

This post is part of our Week in Review series. Check back each week for a quick roundup of interesting news and announcements from AWS!

New AWS AppFabric Improves Application Observability for SaaS Applications

Post Syndicated from Donnie Prakoso original https://aws.amazon.com/blogs/aws/new-aws-appfabric-improves-application-observability-for-saas-applications/

In today’s business landscape, companies strive to equip their employees with the most suitable and efficient tools to perform their jobs effectively. To achieve this goal, many companies turn to Software-as-a-Service (SaaS) applications. This approach allows companies to optimize their workflows, enhance employee productivity, and focus their resources on core business activities rather than software development and maintenance.

As the use of SaaS applications expands, there’s an increasing need for solutions that can proactively identify and address potential security threats to maintain uninterrupted business operations. Security teams spend time monitoring application usage data for threats or suspicious behavior, and they’re responsible for maintaining security oversight to meet regulatory and compliance requirements.

Unfortunately, integrating SaaS applications with existing security tools requires many teams to build, manage, and maintain point-to-point (P2P) integrations. These P2P integrations are needed so security teams can monitor event logs to understand user or system activity from each application.

Introducing AWS AppFabric
Today, we’re launching AWS AppFabric, a fully managed service that aggregates and normalizes security data across SaaS applications to improve observability and help reduce operational effort and cost with no integration work necessary.

Here’s an animated GIF that gives you a quick look at how AWS AppFabric works.

With AppFabric, you can easily integrate leading SaaS applications without building and managing custom code or point-to-point integrations. For more information on what’s supported, refer to Supported Applications for AppFabric.

The generative AI features of AppFabric, powered by Amazon Bedrock, will be available in a future release. To learn more, visit the AWS AppFabric website.

When the SaaS applications are authorized and connected, AppFabric ingests the data and normalizes disparate security data such as user activity logs; this is accomplished using the Open Cybersecurity Schema Framework (OCSF), an industry standard schema and open-source project co-founded by AWS. This delivers an extensible framework for developing schemas and a vendor-agnostic core security schema.

The data is then enriched with a user identifier, such as a corporate email address. This reduces security incident response time because you gain full visibility to user information for each incident. You can ingest normalized and enriched data to your preferred security tools, which allows you to set common policies, standardize security alerts, and easily manage user access across multiple applications.

Getting Started with AWS AppFabric
To get started with AppFabric, you need to create an App bundle, a one-time process. This stores all AppFabric app authorizations and ingestions, including the encryption key used. When you create an app bundle, AppFabric creates the required AWS Identity and Access Management (IAM) role in your AWS account, which is required to send metrics to Amazon CloudWatch and to access AWS resources such as Amazon Simple Storage Service (Amazon S3) and Amazon Kinesis Data Firehose.

Creating an App Bundle
First, I select Getting started from the home page or left navigation panel from within the AWS Management Console.

Following the step-by-step instructions to set up AppFabric, I select Create app bundle.

In the Encryption section, I use AWS Key Management Service (AWS KMS) to define an encryption key to securely protect my data in all unauthorized applications. The KMS key encrypts my data within my internal data stores used as my ingestion destinations; for this example, my destination is Amazon S3. My key options include AWS owned and Customer managed. Select Customer managed if you want to use a key you have inside KMS.

Authorizing Applications
Once I have created the app bundle, the next step is Create app authorization. On this page, I can select the supported SaaS application that I want to connect to my app bundle.

Then, I need to enter my application credentials so that AppFabric can connect; one of the advantages of using AppFabric is that it connects directly into SaaS applications without the need for me to write any code.

I can set up multiple app authorizations by repeating this step, as required, for each application. The credentials required for authorization vary by app; see the AppFabric documentation for details.

Setting up Audit Log Ingestions
Now I have created an app authorization in my app bundle. I can proceed with Set up audit log ingestions. This step ingests and normalizes audit logs and delivers them to one or more destinations within AWS, including Amazon S3 or Amazon Kinesis Data Firehose.

Under Select app authorizations, I select the authorized app that I created in the previous step. Here, I can choose more than one authorized application that allows me to consolidate data from various SaaS applications into a single destination. Then, I can select a destination for the audit logs of the selected apps. If I selected multiple app authorizations, the destination is applied to each authorized app. Currently, AppFabric supports the following destinations:

  • Amazon S3 – New Bucket
  • Amazon S3 – Existing Bucket
  • Amazon Kinesis Data Firehose

When I select a destination, additional fields appear. For example, if I select Amazon S3 – New Bucket, I need to fill the details for my Amazon S3 bucket and the optional prefix.

After that, I need to define Schema & Format of the ingested audit log data for my selected applications. Here, I have three options:

  • OCSF – JSON
  • OCSF – Parquet
  • Raw – JSON


AppFabric normalizes the audit log data to the OCSF schema and formats the audit log data into JSON or Parquet format. For OCSF – JSON and OCSF – Parquet options, AppFabric automatically maps the fields and enriches the field with user email as an identifier. As for the Raw – JSON data format, AppFabric simply provides the audit log data in its original JSON form.

To see a detailed view of my ingestion status, on the Ingestions page, I select my existing ingestion.

Here, I see the ingestion status is Enabled and the status for my Amazon S3 bucket is Active.

After my ingestion runs for around 10 minutes, I can see AppFabric stored the audit data logs in my Amazon S3 bucket.

When I open the file, I can see all the audit data logs from the SaaS application.

With audit data logs now in Amazon S3, I can also use AWS services to analyze and extract insights from the log data. For example, from data in Amazon S3, I can use AWS Glue and run a query using Amazon Athena. The following screenshot shows how I run a query for all activities in the audit data logs.

User Access
AWS AppFabric also has a feature called User access to allow security and IT admin teams to quickly see who has access to which applications. Using an employee’s corporate email address, AppFabric searches all authorized applications in the app bundle to return a list of apps that the user has access to. This helps to identify unauthorized user access and accelerate user deprovisioning.

Things to Know
Availability — AWS AppFabric is generally available today in US East (N. Virginia), Europe (Ireland), and Asia Pacific (Tokyo), with availability in additional AWS Regions coming soon.

AWS AppFabric generative AI capabilities – Available in a future release, AWS AppFabric will empower you to automatically perform tasks across applications using generative AI. Powered by Amazon Bedrock, this AI assistant generates answers to natural language queries, automates task management, and surfaces insights across SaaS applications.

Integrations with SaaS applications — AppFabric connects SaaS applications including Asana, Atlassian Jira suite, Dropbox, Miro, Okta, Slack, Smartsheet, Webex by Cisco, Zendesk, and Zoom. Refer to Supported applications for more details.

Integration with Security Tools — Audit data log from AppFabric is compatible with security tools, such as Logz.io, Netskope, NetWitness, Rapid7, and Splunk, or a customer’s proprietary security solution. Refer to Compatible security tools and services for more details on how to set up specific security tools and services.

Learn more
To get started, go to AWS AppFabric for more information and pricing details.

Happy building.
— Donnie

New – AWS DMS Serverless: Automatically Provisions and Scales Capacity for Migration and Data Replication

Post Syndicated from Donnie Prakoso original https://aws.amazon.com/blogs/aws/new-aws-dms-serverless-automatically-provisions-and-scales-capacity-for-migration-and-data-replication/

With the vast amount of data being created today, organizations are moving to the cloud to take advantage of the security, reliability, and performance of fully managed database services. To facilitate database and analytics migrations, you can use AWS Database Migration Service (AWS DMS). First launched in 2016, AWS DMS offers a simple migration process that automates database migration projects, saving time, resources, and money.

Although you can start AWS DMS migration with a few clicks through the console, you still need to do research and planning to determine the required capacity before migrating. It can be challenging to know how to properly scale capacity ahead of time, especially when simultaneously migrating many workloads or continuously replicating data. On top of that, you also need to continually monitor usage and manually scale capacity to ensure optimal performance.

Introducing AWS DMS Serverless
Today, I’m excited to tell you about AWS DMS Serverless, a new serverless option in AWS DMS that automatically sets up, scales, and manages migration resources to make your database migrations easier and more cost-effective.

Here’s a quick preview on how AWS DMS Serverless works:

AWS DMS Serverless removes the guesswork of figuring out required compute resources and handling the operational burden needed to ensure a high-performance, uninterrupted migration. It performs automatic capacity provisioning, scaling, and capacity optimization of migrations, allowing you to quickly begin migrations with minimal oversight.

At launch, AWS DMS Serverless supports Microsoft SQL Server, PostgreSQL, MySQL, and Oracle as data sources. As for data targets, AWS DMS Serverless supports a wide range of databases and analytics services, from Amazon Aurora, Amazon Relational Database Service (Amazon RDS), Amazon Simple Storage Service (Amazon S3), Amazon Redshift, Amazon DynamoDB, and more. AWS DMS Serverless continues to add support for new data sources and targets. Visit Supported Engine Versions to stay updated.

With a variety of sources and targets supported by AWS DMS Serverless, many scenarios become possible. You can use AWS DMS Serverless to migrate databases and help to build modern data strategies by synchronizing ongoing data replications into data lakes (e.g., Amazon S3) or data warehouses (e.g., Amazon Redshift) from multiple, perhaps disparate data sources.

How AWS DMS Serverless Works
Let me show you how you can get started with AWS DMS Serverless. In this post, I migrate my data from a source database running on PostgreSQL to a target MySQL database running on Amazon RDS. The following screenshot shows my source database with dummy data:

As for the target, I’ve set up a MySQL database running in Amazon RDS. The following screenshot shows my target database:

Getting starting with AWS DMS Serverless is similar to how AWS DMS works today. AWS DMS Serverless requires me to complete the setup tasks such as creating a virtual private cloud (VPC) to defining source and target endpoints. If this is your first time working with AWS DMS, you can learn more by visiting Prerequisites for AWS Database Migration Service.

To connect to a data store, AWS DMS needs endpoints for both source and target data stores. An endpoint provides all necessary information including connection, data store type, and location to my data stores. The following image shows an endpoint I’ve created for my target database:

When I have finished setting up the endpoints, I can begin to create a replication by selecting the Create replication button on the Serverless replications page. Replication is a new concept introduced in AWS DMS Serverless to abstract instances and tasks that we normally have in standard AWS DMS. Additionally, the capacity resources are managed independently for each replication.

On the Create replication page, I need to define some configurations. This starts with defining Name, then specifying Source database endpoint and Target database endpoint. If you don’t find your endpoints, make sure you’re selecting database engines supported by AWS DMS Serverless.

After that, I need to specify the Replication type. There are three types of replication available in AWS DMS Serverless:

  • Full load — If I need to migrate all existing data in source database
  • Change data capture (CDC) — If I have to replicate data changes from source to target database.
  • Full load and change data capture (CDC) — If I need to migrate existing data and replicate data changes from source to target database.

In this example, I chose Full load and change data capture (CDC) because I need to migrate existing data and continuously update the target database for ongoing changes on the source database.

In the Settings section, I can also enable logging with Amazon CloudWatch, which makes it easier for me to monitor replication progress over time.

As with standard AWS DMS, in AWS DMS Serverless, I can also configure Selection rules in Table mappings to define filters that I need to replicate from table columns in the source data store.

I can also use Transformation rules if I need to rename a schema or table or add a prefix or suffix to a schema or table.

In the Capacity section, I can set the range for required capacity to perform replication by defining the minimum and maximum DCU (DMS capacity units). The minimum DCU setting is optional because AWS DMS Serverless determines the minimum DCU based on an assessment of the replication workload. During replication process, AWS DMS uses this range to scale up and down based on CPU utilization, connections, and available memory.

Setting the maximum capacity allows you to manage costs by making sure that AWS DMS Serverless never consumes more resources than you have budgeted for. When you define the maximum DCU, make sure that you choose a reasonable capacity so that AWS DMS Serverless can handle large bursts of data transaction volumes. If traffic volume decreases, AWS DMS Serverless scales capacity down again, and you only pay for what you need. For cases in which you want to change the minimum and maximum DCU settings, you have to stop the replication process first, make the changes, and run the replication again.

When I’m finished with configuring replication, I select Create replication.

When my replication is created, I can view more details of my replication and start the process by selecting Start.

After my replication runs for around 40 minutes, I can monitor replication progress in the Monitoring tab. AWS DMS Serverless also has a CloudWatch metric called Capacity utilization, which indicates the use of capacity to run replication according to the range defined as minimum and maximum DCU. The following screenshot shows the capacity scales up in the CloudWatch metrics chart.

When the replication finishes its process, I see the capacity starting to decrease. This indicates that in addition to AWS DMS Serverless successfully scaling up to the required capacity, it can also scale down within the range I have defined.

Finally, all I need to do is verify whether my data has been successfully replicated into the target data store. I need to connect to the target, run a select query, and check if all data has been successfully replicated from the source.

Now Available
AWS DMS Serverless is now available in all commercial regions where standard AWS DMS is available, and you can start using it today. For more information about benefits, use cases, how to get started, and pricing details, refer to AWS DMS Serverless.

Happy migrating!
Donnie

AWS Week in Review – AWS Wickr, Amazon Redshift, Generative AI, and More – May 29, 2023

Post Syndicated from Donnie Prakoso original https://aws.amazon.com/blogs/aws/aws-week-in-review-aws-wickr-amazon-redshift-generative-ai-and-more-may-29-2023/

This edition of Week in Review marks the end of the month of May. In addition, we just finished all of the in-person AWS Summits in Asia-Pacific and Japan starting from AWS Summit Sydney and AWS Summit Tokyo in April to AWS Summit ASEAN, AWS Summit Seoul, and AWS Summit Mumbai in May.

Thank you to everyone who attended our AWS Summits in APJ, especially the AWS Heroes, AWS Community Builders, and AWS User Group leaders, for your collaboration in supporting activities at AWS Summit events.

Last Week’s Launches
Here are some launches that caught my attention last week:

AWS Wickr is now HIPAA eligible — AWS Wickr is an end-to-end encrypted enterprise messaging and collaboration tool that enables one-to-one and group messaging, voice and video calling, file sharing, screen sharing, and location sharing, without increasing organizational risk. With this announcement, you can now use AWS Wickr for workloads that are within the scope of HIPAA. Visit AWS Wickr to get started.

Amazon Redshift announces support for auto-commit statements in stored procedure — If you’re using stored procedures in Amazon Redshift, you now have enhanced transaction controls that enable you to automatically commit the statements inside the procedure. This new NONATOMIC mode can be used to handle exceptions inside a stored procedure. You can also use the new PL/pgSQL statement RAISE to programmatically raise the exception, which helps prevent disruptions in applications due to an error inside a stored procedure. For more information on using this feature, refer to Managing transactions.

AWS Chatbot supports access to Amazon CloudWatch dashboards and logs insights in chat channels — With this launch, you now can receive Amazon CloudWatch alarm notifications for an incident directly in your chat channel, analyze the diagnostic data from the dashboards, and remediate directly from the chat channel without switching context. Visit the AWS Chatbot page to learn more.

For a full list of AWS announcements, be sure to keep an eye on the What’s New at AWS page.

AWS Open Source Updates
As always, my colleague Ricardo has curated the latest updates for open source news at AWS. Here are some of the highlights:

OpenEMR on AWS Fargate — OpenEMR is a popular Electronic Health and Medical Practice management solution. If you’re looking to deploy OpenEMR on AWS, then this repo will help you to get your OpenEMR up and running on AWS Fargate using Amazon ECS.

Cloud-Radar — If you’re working with AWS Cloudformation and looking for performing unit tests, then you might want to try Cloud-Radar. You can also perform functional testing with Cloud-Radar as this tool also acts a wrapper around Taskcat.

Amazon and Generative AI
Using generative AI to improve extreme multilabel classification — In their research on extreme multilabel classification (XMC), Amazon scientists explored a generative approach, in which a model generates a sequence of labels for input sequences of words. The generative models with clustering consistently outperformed them. This demonstrates the effectiveness of incorporating hierarchical clustering in improving XMC performance.

Upcoming AWS Events
Don’t miss upcoming AWS-led events happening soon:

Also, let’s learn from our fellow builders and give them support by attending AWS Community Days:

That’s all for this week. Check back next Monday for another Week in Review!

Happy building
— Donnie

This post is part of our Week in Review series. Check back each week for a quick roundup of interesting news and announcements from AWS!

AWS Application Migration Service Major Updates: Import and Export Feature, Source Server Migration Metrics Dashboard, and Additional Post-Launch Actions

Post Syndicated from Donnie Prakoso original https://aws.amazon.com/blogs/aws/aws-application-migration-service-major-updates-import-and-export-feature-source-server-migration-metrics-dashboard-and-additional-post-launch-actions/

AWS Application Migration Service (AWS MGN) can simplify and expedite your migration to AWS by automatically converting your source servers from physical, virtual, or cloud infrastructure to run natively on AWS. In the post, How to Use the New AWS Application Migration Server for Lift-and-Shift Migrations, Channy introduced us to Application Migration Service and how to get started.

By using Application Migration Service for migration, you can minimize time-intensive, error-prone manual processes by automating replication and conversion of your source servers from physical, virtual, or cloud infrastructure to run natively on AWS. Last year, we introduced major improvements such as new migration servers grouping, an account-level launch template, and a post-launch actions template.

Today, I’m pleased to announce three major updates of Application Migration Service. Here’s the quick summary for each feature release:

  • Import and export – You can now use Application Migration Service to import your source environment inventory list to the service from a CSV file. You can also export your source server inventory for reporting purposes, offline reviews and updates, integration with other tools and AWS services, and performing bulk configuration changes by reimporting the inventory list.
  • Server migration metrics dashboard – This new dashboard can help simplify migration project management by providing an aggregated view of the migration lifecycle status of your source servers
  • Additional post-launch modernization actions – In this update, Application Migration Service added eight additional predefined post-launch actions. These actions are applied to your migrated applications when you launch them on AWS.

Let me share how you can use these features for your migration.

Import and Export
Before we go further into the import and export features, let’s discuss two concepts within Application Migration Service: applications and waves, which you can define when migrating with Application Migration Service. Applications represent a group of servers. By using applications, you can define groups of servers and identify them as an application. Within your application, you can perform various activities with Application Migration Service, such as monitoring, specifying tags, and performing bulk operations, for example, launching test instances. Additionally, you can group your applications into waves, which represent a group of servers that are migrated together, as part of your migration plan.

With the import feature, you can now import your inventory list in CSV form into Application Migration Service. This makes it easy for you to manage large scale-migrations, and ingest your inventory of source servers, applications and waves, including their attributes.

To start using the import feature, I need to identify my servers and application inventory. I can do this manually, or using discovery tools. The next thing I need to do is download the import template which I can access from the console. 

After I downloaded the import template, I can start mapping from my inventory list into this template. While mapping my inventory, I can group related servers into applications and waves. I can also perform configurations, such as defining Amazon Elastic Compute Cloud (Amazon EC2) launch template settings, and specifying tags for each wave.

The following screenshot is an example of the results of my import template:

The next step is to upload my CSV file to an Amazon Simple Storage Service (Amazon S3) bucket. Then, I can start the import process from the Application Migration Service console by referencing the CSV file containing my inventory list that I’ve uploaded to the S3 bucket.

When the import process is complete, I can see the details of the import results.

I can import inventory for servers that don’t have an agent installed, or haven’t yet been discovered by agentless replication. However, to replicate data, I need to use agentless replication, or install the AWS Replication Agent on my source servers.

Now I can view all my inventory inside the Source servers, Applications and Waves pages on the Application Migration Service console. The following is a screenshot for recently imported waves.

In addition, with the export feature, I can export my source servers, applications, and waves along with all configurations that I’ve defined into a CSV file.

This is helpful if you want to do reporting or offline reviews, or for bulk editing before reimporting the CSV file into Application Migration Service.

Server Migration Metrics Dashboard
We previously supported a migration metrics dashboard for applications and waves. In this release, we have specifically added a migration metrics dashboard for servers. Now you can view aggregated overviews of your server’s migration process on the Application Migration Service dashboard. Three topics are available in the migration metrics dashboard:

  • Alerts – Shows associated alerts for respective servers.
  • Data replication status – Shows the replication data overview status for source servers. Here, you get a quick overview of the lifecycle status of the replication data process.
  • Migration lifecycle – Shows an overview of the migration lifecycle from source servers.

Additional Predefined Post-launch Modernization Actions
Post-launch actions allow you to control and automate actions performed after your servers have been launched in AWS. You can use predefined or use custom post-launch actions.

Application Migration Service now has eight additional predefined post-launch actions to run in your EC2 instances on top of the existing four predefined post-launch actions. These additional post-launch actions provide you with flexibility to maximize your migration experience.

The new additional predefined post-launch actions are as follows:

  • Convert MS-SQL license – You can easily convert Windows MS-SQL BYOL to an AWS license using the Windows MS-SQL license conversion action. The launch process includes checking the SQL edition (Enterprise, Standard, or Web) and using the right AMI with the right billing code.
  • Create AMI from instance – You can create a new Amazon Machine Image (AMI) from your Application Migration Service launched instance.
  • Upgrade Windows version – This feature allows you to easily upgrade your migrated server to Windows Server 2012 R2, 2016, 2019, or 2022. You can see the full list of available OS versions on AWSEC2-CloneInstanceAndUpgradeWindows page.
  • Conduct EC2 connectivity checks – You can conduct network connectivity checks to a predefined list of ports and hosts using the EC2 connectivity check feature.
  • Validate volume integrity – You can use this feature to ensure that Amazon Elastic Block Store (Amazon EBS) volumes on the launched instance are the same size as the source, properly mounted on the EC2 instance, and accessible.
  • Verify process status – You can validate the process status to ensure that processes are in a running state after instance launch. You will need to provide a list of processes that you want to verify and specify how long the service should wait before testing begins. This feature lets you do the needed validations automatically and saves time by not having to do them manually.
  • CloudWatch agent installation – Use the Amazon CloudWatch agent installation feature to install and set up the CloudWatch agent and Application Insights features.
  • Join Directory Service domain – You can simplify the AWS join domain process by using this feature. If you choose to activate this action, your instance will be managed by the AWS Cloud Directory (instead of on premises).

Things to Know
Keep in mind the following:

  • Updated UI/UX – We have updated the user interface with card layout and table layout view for the action list on the Application Migration Service console. This update helps you to determine which post-launch actions are suitable for your use case . We have also added filter options to make it easy to find relevant actions by operating system, category, and more.
  • Support for additional OS versions – Application Migration Service now supports CentOS 5.5 and later and Red Hat Enterprise Linux (RHEL) 5.5 and later operating systems.
  • Availability – These features are available now, and you can start using them today in all Regions where Application Migration Service is supported.

Get Started Today

Visit the Application Migration Service User Guide page to learn more about these features and understand the pricing. You can also visit Getting started with AWS Application Migration Service to learn more about how to get started to migrate your workloads.

Happy migrating!

Donnie

AWS Clean Rooms Now Generally Available — Collaborate with Your Partners without Sharing Raw Data

Post Syndicated from Donnie Prakoso original https://aws.amazon.com/blogs/aws/aws-clean-rooms-now-generally-available/

Companies across multiple industries, such as advertising and marketing, retail, consumer packaged goods (CPG), travel and hospitality, media and entertainment, and financial services, increasingly look to supplement their data with data from business partners, to build a complete view of their business.

Let’s take a marketing use case as an example. Brands, publishers, and their partners need to collaborate using datasets that are stored across many channels and applications to improve the relevance of their campaigns and better engage with consumers. At the same time, they also want to protect sensitive consumer information and eliminate the sharing of raw data. Data clean rooms can help solve this challenge by allowing multiple companies to analyze their collective data in a private environment.

However, it’s difficult to build data clean rooms. It requires complex privacy controls, specialized tools to protect each collaborator’s data, and months of development time customizing analytics tools. The effort and complexity grows when a new collaborator is added, or a different type of analysis is needed, as companies have to spend even more development time. Finally, companies prefer to limit data movement as much as possible, usually leading to less collaboration and missed opportunities to generate new business insights.

Introducing AWS Clean Rooms
Today, I’m excited to announce the general availability of AWS Clean Rooms which we first announced at AWS re:Invent 2022 and released the preview of in January 2023. AWS Clean Rooms is an analytics service of AWS Applications that helps companies and their partners more easily and securely analyze and collaborate on their collective datasets without sharing or copying each other’s data. AWS Clean Rooms enables customers to generate unique insights about advertising campaigns, investment decisions, clinical research, and more, while helping them protect data.

Now, with AWS Clean Rooms, companies are able to easily create a secure data clean room on the AWS Cloud in minutes and collaborate with their partners. They can use a broad set of built-in, privacy-enhancing controls for clean rooms. These controls allow companies to customize restrictions on the queries run by each clean room participant, including query controls, query output restrictions, and query logging. AWS Clean Rooms also includes advanced cryptographic computing tools that keep data encrypted—even as queries are processed—to help comply with stringent data handling policies.

Key Features of AWS Clean Rooms
Let me share with you the key features and how easy it is to collaborate with AWS Clean Rooms.

Create Your Own Clean Rooms
AWS Clean Rooms helps you to start a collaboration in minutes and then select the other companies you want to collaborate with. You can collaborate with any of your partners that agree to participate in your clean room collaboration. You can create a collaboration by following several steps.

After creating a collaboration in AWS Clean Rooms, you can select additional collaboration members who can contribute. Currently, AWS Clean Rooms supports up to five collaboration members, including you as the collaboration creator.

The next step is to define which collaboration member can perform a query in collaboration with the member abilities setting.

Then, collaboration members will get notifications in their accounts, see detailed info from a collaboration, and decide whether to join the collaboration by selecting Create membership in their AWS Clean Rooms dashboard.

Collaborate without Moving Data Outside AWS
AWS Clean Rooms works by analyzing Amazon S3 data in place. This eliminates the need for companies to copy and load their data into destinations outside their respective AWS environments of the collaboration members or using third-party services.

Each collaboration member can create configured tables, an AWS Clean Rooms resource that contains reference to the AWS Glue catalog with underlying data that define how that data can be used. The configured table can be used across many collaborations.

Protecting Data
AWS Clean Rooms provides you with a broad set of privacy-enhancing controls to protect your customers’ and partners’ data. Each collaboration member has the flexibility to determine what columns can be accessed in a collaboration.

In addition to column-level privacy controls, as in the example above, AWS Clean Rooms also provides fine-grained query controls called analysis rules. With built-in and flexible analysis rules, customers can tailor queries to specific business needs. AWS Clean Rooms provides two types of analysis rules for customers to use:

  • Aggregation analysis rules allows queries that aggregate analysis without revealing user-level information using COUNT, SUM, and AVG functions along optional dimensions.
  • List analysis rules allow queries that output user-level attribute analysis of the overlap between the customer’s table and the tables of the member who can query.

Both analysis rule types allow data owners to require a join between their datasets and the datasets of the collaborator running the query. This limits the results to just their intersection of the collaborators datasets.

After defining the analysis rules, the member who can query and receive results can start writing queries according to the restrictions defined by each participating collaboration member. The following is an example query in the collaboration.

Analysis rules allow collaboration members to restrict the types of queries that can be performed against their datasets and the usable output of the query results. The following screenshot is an example of a query that will not be successful because it does not satisfy the analysis rule since the hashed_email column cannot be used in SELECT queries.

Full Programmatic Access
Any functionality offered by AWS Clean Rooms can also be accessed via the API using AWS SDKs or AWS CLI. This makes it easier for you to integrate AWS Clean Rooms into your products or workflows. This programmatic access also unlocks the opportunity for you to host clean rooms for your customers with your own branding.

Query Logging
This feature allows collaboration members to review and audit the queries that use their datasets to make sure data is being used as intended. With query logging, collaboration members who have query control and other members whose data is part of the query, can receive logs if they enable query logging.

If this feature is enabled, query logs are written to Amazon CloudWatch Logs in each collaboration member’s account. You can access the summary of the log queries in the last 7 days from the collaboration dashboard.

Cryptographic Computing
With this feature, you have the option to perform client-side encryption for sensitive data with cryptographic computing. You can encrypt your dataset to add a protection layer, and the data will use a cryptographic computing protocol called private-set intersection to keep data encrypted even as the query runs.

To use the cryptographic computing feature, you need to download and use the Cryptographic Computing for Clean Rooms (C3R) encryption client to encrypt and decrypt your data. C3R keeps your data cryptographically protected while in use in AWS Clean Rooms. C3R supports a subset of SQL queries, including JOIN, SELECT, GROUP BY, COUNT, and other supported statements on cryptographically protected data.

The following image shows how you can enable cryptographic computing when creating a collaboration:

Customer Voices
During the preview period, we heard lots of feedback from our customers about AWS Clean Rooms. Here’s what our customers say:

Comscore is a measurement and analytics company that brings trust and transparency to media. Brian Pugh, Chief Information Officer at Comscore, said, “As advertisers and marketers adapt to deliver relevant campaigns leveraging their combined datasets while protecting consumer data, Comscore’s Media Metrix suite, powered by Unified Digital Measurement 2.0 and Campaign Ratings services, will continue to support critical measurement and planning needs with services like AWS Clean Rooms. AWS Clean Rooms will enable new methods of collaboration among media owners, brands, or agency customers through customized data access controls managed and set by each data owner without needing to share underlying data.”

DISH Media is a leading TV provider that offers over-the-top IPTV service. “At DISH Media, we empower brands and agencies to run their own analyses of prior campaigns to allow for flexibility, visibility, and ease in optimizing future campaigns to reach DISH Media’s 31 million consumers. With AWS Clean Rooms, we believe advertisers will benefit from the ease of use of these services with their analysis, including data access and security controls,” said Kemal Bokhari, Head of Data, Measurement, and Analytics at DISH Media.

Fox Corporation is a leading producer and distributor of ad-supported content through its sports, news, and entertainment brands. Lindsay Silver, Senior Vice President of Data and Commercial Technology at Fox Corporation, said, “It can be challenging for our advertising clients to figure out how to best leverage more data sources to optimize their media spend across their combined portfolio of entertainment, sports, and news brands which reach 200 million monthly viewers. We are excited to use AWS Clean Rooms to enable data collaborations easily and securely in the AWS Cloud that will help our advertising clients unlock new insights across every Fox brand and screen while protecting consumer data.”

Amazon Marketing Cloud (AMC) is a secure, privacy-safe clean room application from Amazon Ads that supports thousands of marketers with custom analytics and cross-channel analysis.

“Providing marketers with greater control over their own signals while being able to analyze them in conjunction with signals from Amazon Ads is crucial in today’s marketing landscape. By migrating AMC’s compute infrastructure to AWS Clean Rooms under the hood, marketers can use their own signals in AMC without storing or maintaining data outside of their AWS environment. This simplifies how marketers can manage their signals and enables AMC teams to focus on building new capabilities for brands,” said Paula Despins, Vice President of Ads Measurement at Amazon Ads.

Watch this video to learn more about AWS Clean Rooms:

Availability
AWS Clean Rooms is generally available in the following AWS Regions: US East (Ohio), US East (N. Virginia), US West (Oregon), Asia Pacific (Seoul), Asia Pacific (Singapore), Asia Pacific (Sydney), Asia Pacific (Tokyo), Europe (Frankfurt), Europe (Ireland), Europe (London), and Europe (Stockholm).

Pricing & Free Tier
AWS Clean Rooms measures compute capacity in Clean Rooms Processing Units (CRPUs). You only pay the compute capacity of queries that you run in CRPU-hours on a per-second basis (with a 60-second minimum charge). AWS Clean Rooms automatically scales up or down to meet your query workload demands and shuts down during periods of inactivity, saving you administration time and costs. AWS Clean Rooms free tier provides a tier of 9 CRPU-hours per month for the first 12 months per new customer.

AWS Clean Rooms helps companies and their partners more easily and securely analyze and collaborate on their collective datasets without sharing or copying each other’s data. Learn more about benefits, use cases, how to get started, and pricing details on the AWS Clean Rooms page.

Happy collaborating!

Donnie

Now Open — AWS Asia Pacific (Melbourne) Region in Australia

Post Syndicated from Donnie Prakoso original https://aws.amazon.com/blogs/aws/now-open-aws-asia-pacific-melbourne-region-in-australia/

Following up on Jeff’s post on the announcement of the Melbourne Region, today I’m pleased to share the general availability of the AWS Asia Pacific (Melbourne) Region with three Availability Zones and API name ap-southeast-4.

The AWS Asia Pacific (Melbourne) Region is the second infrastructure Region in Australia, in addition to the Asia Pacific (Sydney) Region, and 12th the twelfth Region in Asia Pacific, joining existing Rregions in Singapore, Tokyo, Seoul, Mumbai, Hong Kong, Osaka, Jakarta, Hyderabad, Sydney, and Mainland China Beijing and Ningxia Regions.

Melbourne city historic building: Flinders Street Station built of yellow sandstone

AWS in Australia: Long-Standing History
In November 2012, AWS established a presence in Australia with the AWS Asia Pacific (Sydney) Region. Since then, AWS has provided continuous investments in infrastructure and technology to help drive digital transformations in Australia, to support hundreds of thousands of active customers each month.

Amazon CloudFront — Amazon CloudFront is a content delivery network (CDN) service built for high performance, security, and developer convenience that was first launched in Australia alongside Asia Pacific (Sydney) Region in 2012. To further accelerate the delivery of static and dynamic web content to end users in Australia, AWS announced additional CloudFront locations for Sydney and Melbourne in 2014. In addition, AWS also announced a Regional Edge Cache in 2016 and an additional CloudFront point of presence (PoP) in Perth in 2018. CloudFront points of presence ensure popular content can be served quickly to your viewers. Regional Edge Caches are positioned (network-wise) between the CloudFront locations and the origin and further help to improve content performance. AWS currently has seven edge locations and one Regional Edge Cache location in Australia.

AWS Direct Connect — As with CloudFront, the first AWS Direct Connect location was made available with Asia Pacific (Sydney) Region launch in 2012. To continue helping our customers in Australia improve application performance, secure data, and reduce networking costs, AWS announced the opening of additional Direct Connect locations in Sydney (2014), Melbourne (2016), Canberra (2017), Perth (2017), and an additional location in Sydney (2022), totaling six locations.

AWS Local Zones — To help customers run applications that require single-digit millisecond latency or local data processing, customers can use AWS Local Zones. They bring AWS infrastructure (compute, storage, database, and other select AWS services) closer to end users and business centers. AWS customers can run workloads with low latency requirements on the AWS Local Zones location in Perth while seamlessly connecting to the rest of their workloads running in AWS Regions.

Upskilling Local Developers, Students, and Future IT Leaders
Digital transformation will not happen on its own. AWS runs various programs and has trained more than 200,000 people across Australia with cloud skills since 2017. There is an additional goal to train more than 29 million people globally with free cloud skills by 2025. Here’s a brief description of related programs from AWS:

  • AWS re/Start is a digital skills training program that prepares unemployed, underemployed, and transitioning individuals for careers in cloud computing and connects students to potential employers.
  • AWS Academy provides higher education institutions with a free, ready-to-teach cloud computing curriculum that prepares students to pursue industry-recognized certifications and in-demand cloud jobs.
  • AWS Educate provides students with access to AWS services. AWS is also collaborating with governments, educators, and the industry to help individuals, both tech and nontech workers, build and deepen their digital skills to nurture a workforce that can harness the power of cloud computing and advanced technologies.
  • AWS Industry Quest is a game-based training initiative designed to help professionals and teams learn and build vital cloud skills and solutions. At re:Invent 2022, AWS announced the first iteration of the program for the financial services sector. National Australia Bank (NAB) is AWS Industry Quest: Financial Services’ first beta customer globally. Through AWS Industry Quest, NAB has trained thousands of colleagues in cloud skills since 2018, resulting in more than 4,500 industry-recognized certifications.

In addition to the above programs, AWS is also committed to supporting Victoria’s local tech community through digital upskilling, community initiatives, and partnerships. The Victorian Digital Skills is a new program from the Victorian Government that helps create a new pipeline of talent to meet the digital skills needs of Victorian employers. AWS has taken steps to help solve the retraining challenge by supporting the Victorian Digital Skills Program, which enables mid-career Victorians to reskill on technology and gain access to higher-paying jobs.

The Climate Pledge
Amazon is committed to investing and innovating across its businesses to help create a more sustainable future. With The Climate Pledge, Amazon is committed to reaching net-zero carbon across its business by 2040 and is on a path to powering its operations with 100 percent renewable energy by 2025.

As of May 2022, two projects in Australia are operational. Amazon Solar Farm Australia – Gunnedah and Amazon Solar Farm Australia – Suntop will aim to generate 392,000 MWh of renewable energy each year, equal to the annual electricity consumption of 63,000 Australian homes. Once Amazon Wind Farm Australia – Hawkesdale also becomes operational, it will boost the projects’ combined yearly renewable energy generation to 717,000 MWh, or enough for nearly 115,000 Australian homes.

AWS Customers in Australia
We have customers in Australia that are doing incredible things with AWS, for example:

National Australia Bank Limited (NAB)
NAB is one of Australia’s largest banks and Australia’s largest business bank. “We have been exploring the potential use cases with AWS since the announcement of the AWS Asia Pacific (Melbourne) Region,” said Steve Day, Chief Technology Officer at NAB.

Locating key banking applications and critical workloads geographically close to their compute platform and the bulk of their corporate workforce will provide lower latency benefits. Moreover, it will simplify their disaster recovery plans. With AWS Asia Pacific (Melbourne) Region, it will also accelerate their strategy to move 80 percent of applications to the cloud by 2025.

Littlepay
This Melbourne-based financial technology company works with more than 250 transport and mobility providers to enable contactless payments on local buses, city networks, and national public transport systems.

“Our mission is to create a universal payment experience around the world, which requires world-class global infrastructure that can grow with us,” said Amin Shayan, CEO at Littlepay. “To drive a seamless experience for our customers, we ingest and process over 1 million monthly transactions in real time using AWS, which enables us to generate insights that help us improve our services. We are excited about the launch of a second AWS Region in Australia, as it gives us access to advanced technologies, like machine learning and artificial intelligence, at a lower latency to help make commuting a simpler and more enjoyable experience.”

Royal Melbourne Institute of Technology (RMIT)
RMIT is a global university of technology, design, and enterprise with more than 91,000 students and 11,000 staff around the world.

“Today’s launch of the AWS Region in Melbourne will open up new ways for our researchers to drive computational engineering and maximize the scientific return,” said Professor Calum Drummond, Deputy Vice-Chancellor and Vice-President, Research and Innovation, and Interim DVC, STEM College, at RMIT.

“We recently launched RMIT University’s AWS Cloud Supercomputing facility (RACE) for RMIT researchers, who are now using it to power advances into battery technologies, photonics, and geospatial science. The low latency and high throughput delivered by the new AWS Region in Melbourne, combined with our 400 Gbps-capable private fiber network, will drive new ways of innovation and collaboration yet to be discovered. We fundamentally believe RACE will help truly democratize high-performance computing capabilities for researchers to run their datasets and make faster discoveries.”

Australian Bureau of Statistics (ABS)
ABS holds the Census of Population and Housing every five years. It is the most comprehensive snapshot of Australia, collecting data from around 10 million households and more than 25 million people.

“In this day and age, people expect a fast and simple online experience when using government services,” said Bindi Kindermann, program manager for 2021 Census Field Operations at ABS. “Using AWS, the ABS was able to scale and securely deliver services to people across the country, making it possible for them to quickly and easily participate in this nationwide event.”

With the success of the 2021 Census, the ABS is continuing to expand its use of AWS into broader areas of its business, making use of the security, reliability, and scalability of the cloud.

You can find more inspiring stories from our customers in Australia by visiting Customer Success Stories page.

Things to Know
AWS User Groups in Australia — Australia is also home to 9 AWS Heroes, 43 AWS Community Builders and community members of 17 AWS User Groups in various cities in Australia. Find an AWS User Group near you to meet and collaborate with fellow developers, participate in community activities and share your AWS knowledge.

AWS Global Footprint — With this launch, AWS now spans 99 Availability Zones within 31 geographic Regions around the world. We have also announced plans for 12 more Availability Zones and 4 more AWS Regions in Canada, Israel, New Zealand, and Thailand.

Available Now — The new Asia Pacific (Melbourne) Region is ready to support your business, and you can find a detailed list of the services available in this Region on the AWS Regional Services List.

To learn more, please visit the Global Infrastructure page, and start building on ap-southeast-4!

Happy building!

Donnie

New — Create Point-to-Point Integrations Between Event Producers and Consumers with Amazon EventBridge Pipes

Post Syndicated from Donnie Prakoso original https://aws.amazon.com/blogs/aws/new-create-point-to-point-integrations-between-event-producers-and-consumers-with-amazon-eventbridge-pipes/

It is increasingly common to use multiple cloud services as building blocks to assemble a modern event-driven application. Using purpose-built services to accomplish a particular task ensures developers get the best capabilities for their use case. However, communication between services can be difficult if they use different technologies to communicate, meaning that you need to learn the nuances of each service and how to integrate them with each other. We usually need to create integration code (or “glue” code) to connect and bridge communication between services. Writing glue code slows our velocity, increases the risk of bugs, and means we spend our time writing undifferentiated code rather than building better experiences for our customers.

Introducing Amazon EventBridge Pipes
Today, I’m excited to announce Amazon EventBridge Pipes, a new feature of Amazon EventBridge that makes it easier for you to build event-driven applications by providing a simple, consistent, and cost-effective way to create point-to-point integrations between event producers and consumers, removing the need to write undifferentiated glue code.

The simplest pipe consists of a source and a target. An optional filtering step allows only specific source events to flow into the Pipe and an optional enrichment step using AWS Lambda, AWS Step Functions, Amazon EventBridge API Destinations, or Amazon API Gateway enriches or transforms events before they reach the target. With Amazon EventBridge Pipes, you can integrate supported AWS and self-managed services as event producers and event consumers into your application in a simple, reliable, consistent and cost-effective way.

Amazon EventBridge Pipes bring the most popular features of Amazon EventBridge Event Bus, such as event filtering, integration with more than 14 AWS services, and automatic delivery retries.

How Amazon EventBridge Pipes Works
Amazon EventBridge Pipes provides you a seamless means of integrating supported AWS and self-managed services, favouring configuration over code. To start integrating services with EventBridge Pipes, you need to take the following steps:

  1. Choose a source that is producing your events. Supported sources include: Amazon DynamoDB, Amazon Kinesis Data Streams, Amazon SQS, Amazon Managed Streaming for Apache Kafka, and Amazon MQ (both ActiveMQ and RabbitMQ).
  2. (Optional) Specify an event filter to only process events that match your filter (you’re not charged for events that are filtered out).
  3. (Optional) Transform and enrich your events using built-in free transformations, or AWS Lambda, AWS Step Functions, Amazon API Gateway, or EventBridge API Destinations to perform more advanced transformations and enrichments.
  4. Choose a target destination from more than 14 AWS services, including Amazon Step Functions, Kinesis Data Streams, AWS Lambda, and third-party APIs using EventBridge API destinations.

Amazon EventBridge Pipes provides simplicity to accelerate development velocity by reducing the time needed to learn the services and write integration code, to get reliable and consistent integration.

EventBridge Pipes also comes with additional features that can help in building event-driven applications. For example, with event filtering, Pipes helps event-driven applications become more cost-effective by only processing the events of interest.

Get Started with Amazon EventBridge Pipes
Let’s see how to get started with Amazon EventBridge Pipes. In this post, I will show how to integrate an Amazon SQS queue with AWS Step Functions using Amazon EventBridge Pipes.

The following screenshot is my existing Amazon SQS queue and AWS Step Functions state machine. In my case, I need to run the state machine for every event in the queue. To do so, I need to connect my SQS queue and Step Functions state machine with EventBridge Pipes.

Existing Amazon SQS queue and AWS Step Functions state machine

First, I open the Amazon EventBridge console. In the navigation section, I select Pipes. Then I select Create pipe.

On this page, I can start configuring a pipe and set the AWS Identity and Access Management (IAM) permission, and I can navigate to the Pipe settings tab.

Navigate to Pipe Settings

In the Permissions section, I can define a new IAM role for this pipe or use an existing role. To improve developer experience, the EventBridge Pipes console will figure out the IAM role for me, so I don’t need to manually configure required permissions and let EventBridge Pipes configures least-privilege permissions for IAM role. Since this is my first time creating a pipe, I select Create a new role for this specific resource.

Setting IAM Permission for pipe

Then, I go back to the Build pipe section. On this page, I can see the available event sources supported by EventBridge Pipes.

List of available services as the event source

I select SQS and select my existing SQS queue. If I need to do batch processing, I can select Additional settings to start defining Batch size and Batch window. Then, I select Next.

Select SQS Queue as event source

On the next page, things get even more interesting because I can define Event filtering from the event source that I just selected. This step is optional, but the event filtering feature makes it easy for me to process events that only need to be processed by my event-driven application. In addition, this event filtering feature also helps me to be more cost-effective, as this pipe won’t process unnecessary events. For example, if I use Step Functions as the target, the event filtering will only execute events that match the filter.

Event filtering in Amazon EventBridge Pipes

I can use sample events from AWS events or define custom events. For example, I want to process events for returned purchased items with a value of 100 or more. The following is the sample event in JSON format:

{
   "event-type":"RETURN_PURCHASE",
   "value":100
}

Then, in the event pattern section, I can define the pattern by referring to the Content filtering in Amazon EventBridge event patterns documentation. I define the event pattern as follows:

{
   "event-type": ["RETURN_PURCHASE"],
   "value": [{
      "numeric": [">=", 100]
   }]
}

I can also test by selecting test pattern to make sure this event pattern will match the custom event I’m going to use. Once I’m confident that this is the event pattern that I want, I select Next.

Defining and testing an event pattern for filtering

In the next optional step, I can use an Enrichment that will augment, transform, or expand the event before sending the event to the target destination. This enrichment is useful when I need to enrich the event using an existing AWS Lambda function, or external SaaS API using the Destination API. Additionally, I can shape the event using the Enrichment Input Transformer.

The final step is to define a target for processing the events delivered by this pipe.

Defining target destination service

Here, I can select various AWS services supported by EventBridge Pipes.

I select my existing AWS Step Functions state machine, named pipes-statemachine.

In addition, I can also use Target Input Transformer by referring to the Transforming Amazon EventBridge target input documentation. For my case, I need to define a high priority for events going into this target. To do that, I define a sample custom event in Sample events/Event Payload and add the priority: HIGH in the Transformer section. Then in the Output section, I can see the final event to be passed to the target destination service. Then, I select Create pipe.

In less than a minute, my pipe was successfully created.

Pipe successfully created

To test this pipe, I need to put an event into the Amaon SQS queue.

Sending a message into Amazon SQS Queue

To check if my event is successfully processed by Step Functions, I can look into my state machine in Step Functions. On this page, I see my event is successfully processed.

I can also go to Amazon CloudWatch Logs to get more detailed logs.

Things to Know
Event Sources
– At launch, Amazon EventBridge Pipes supports the following services as event sources: Amazon DynamoDB, Amazon Kinesis, Amazon Managed Streaming for Apache Kafka (Amazon MSK) alongside self-managed Apache Kafka, Amazon SQS (standard and FIFO), and Amazon MQ (both for ActiveMQ and RabbitMQ).

Event Targets – Amazon EventBridge Pipes supports 15 Amazon EventBridge targets, including AWS Lambda, Amazon API Gateway, Amazon SNS, Amazon SQS, and AWS Step Functions. To deliver events to any HTTPS endpoint, developers can use API destinations as the target.

Event Ordering – EventBridge Pipes maintains the ordering of events received from an event sources that support ordering when sending those events to a destination service.

Programmatic Access – You can also interact with Amazon EventBridge Pipes and create a pipe using AWS Command Line Interface (CLI), AWS CloudFormation, and AWS Cloud Development Kit (AWS CDK).

Independent Usage – EventBridge Pipes can be used separately from Amazon EventBridge bus and Amazon EventBridge Scheduler. This flexibility helps developers to define source events from supported AWS and self-managed services as event sources without Amazon EventBridge Event Bus.

Availability – Amazon EventBridge Pipes is now generally available in all AWS commercial Regions, with the exception of Asia Pacific (Hyderabad) and Europe (Zurich).

Visit the Amazon EventBridge Pipes page to learn more about this feature and understand the pricing. You can also visit the documentation page to learn more about how to get started.

Happy building!

— Donnie

New — Introducing Support for Real-Time and Batch Inference in Amazon SageMaker Data Wrangler

Post Syndicated from Donnie Prakoso original https://aws.amazon.com/blogs/aws/new-introducing-support-for-real-time-and-batch-inference-in-amazon-sagemaker-data-wrangler/

To build machine learning models, machine learning engineers need to develop a data transformation pipeline to prepare the data. The process of designing this pipeline is time-consuming and requires a cross-team collaboration between machine learning engineers, data engineers, and data scientists to implement the data preparation pipeline into a production environment.

The main objective of Amazon SageMaker Data Wrangler is to make it easy to do data preparation and data processing workloads. With SageMaker Data Wrangler, customers can simplify the process of data preparation and all of the necessary steps of data preparation workflow on a single visual interface. SageMaker Data Wrangler reduces the time to rapidly prototype and deploy data processing workloads to production, so customers can easily integrate with MLOps production environments.

However, the transformations applied to the customer data for model training need to be applied to new data during real-time inference. Without support for SageMaker Data Wrangler in a real-time inference endpoint, customers need to write code to replicate the transformations from their flow in a preprocessing script.

Introducing Support for Real-Time and Batch Inference in Amazon SageMaker Data Wrangler
I’m pleased to share that you can now deploy data preparation flows from SageMaker Data Wrangler for real-time and batch inference. This feature allows you to reuse the data transformation flow which you created in SageMaker Data Wrangler as a step in Amazon SageMaker inference pipelines.

SageMaker Data Wrangler support for real-time and batch inference speeds up your production deployment because there is no need to repeat the implementation of the data transformation flow. You can now integrate SageMaker Data Wrangler with SageMaker inference. The same data transformation flows created with the easy-to-use, point-and-click interface of SageMaker Data Wrangler, containing operations such as Principal Component Analysis and one-hot encoding, will be used to process your data during inference. This means that you don’t have to rebuild the data pipeline for a real-time and batch inference application, and you can get to production faster.

Get Started with Real-Time and Batch Inference
Let’s see how to use the deployment supports of SageMaker Data Wrangler. In this scenario, I have a flow inside SageMaker Data Wrangler. What I need to do is to integrate this flow into real-time and batch inference using the SageMaker inference pipeline.

First, I will apply some transformations to the dataset to prepare it for training.

I add one-hot encoding on the categorical columns to create new features.

Then, I drop any remaining string columns that cannot be used during training.

My resulting flow now has these two transform steps in it.

After I’m satisfied with the steps I have added, I can expand the Export to menu, and I have the option to export to SageMaker Inference Pipeline (via Jupyter Notebook).

I select Export to SageMaker Inference Pipeline, and SageMaker Data Wrangler will prepare a fully customized Jupyter notebook to integrate the SageMaker Data Wrangler flow with inference. This generated Jupyter notebook performs a few important actions. First, define data processing and model training steps in a SageMaker pipeline. The next step is to run the pipeline to process my data with Data Wrangler and use the processed data to train a model that will be used to generate real-time predictions. Then, deploy my Data Wrangler flow and trained model to a real-time endpoint as an inference pipeline. Last, invoke my endpoint to make a prediction.

This feature uses Amazon SageMaker Autopilot, which makes it easy for me to build ML models. I just need to provide the transformed dataset which is the output of the SageMaker Data Wrangler step and select the target column to predict. The rest will be handled by Amazon SageMaker Autopilot to explore various solutions to find the best model.

Using AutoML as a training step from SageMaker Autopilot is enabled by default in the notebook with the use_automl_step variable. When using the AutoML step, I need to define the value of target_attribute_name, which is the column of my data I want to predict during inference. Alternatively, I can set use_automl_step to False if I want to use the XGBoost algorithm to train a model instead.

On the other hand, if I would like to instead use a model I trained outside of this notebook, then I can skip directly to the Create SageMaker Inference Pipeline section of the notebook. Here, I would need to set the value of the byo_model variable to True. I also need to provide the value of algo_model_uri, which is the Amazon Simple Storage Service (Amazon S3) URI where my model is located. When training a model with the notebook, these values will be auto-populated.

In addition, this feature also saves a tarball inside the data_wrangler_inference_flows folder on my SageMaker Studio instance. This file is a modified version of the SageMaker Data Wrangler flow, containing the data transformation steps to be applied at the time of inference. It will be uploaded to S3 from the notebook so that it can be used to create a SageMaker Data Wrangler preprocessing step in the inference pipeline.

The next step is that this notebook will create two SageMaker model objects. The first object model is the SageMaker Data Wrangler model object with the variable data_wrangler_model, and the second is the model object for the algorithm, with the variable algo_model. Object data_wrangler_model will be used to provide input in the form of data that has been processed into algo_model for prediction.

The final step inside this notebook is to create a SageMaker inference pipeline model, and deploy it to an endpoint.

Once the deployment is complete, I will get an inference endpoint that I can use for prediction. With this feature, the inference pipeline uses the SageMaker Data Wrangler flow to transform the data from your inference request into a format that the trained model can use.

In the next section, I can run individual notebook cells in Make a Sample Inference Request. This is helpful if I need to do a quick check to see if the endpoint is working by invoking the endpoint with a single data point from my unprocessed data. Data Wrangler automatically places this data point into the notebook, so I don’t have to provide one manually.

Things to Know
Enhanced Apache Spark configuration — In this release of SageMaker Data Wrangler, you can now easily configure how Apache Spark partitions the output of your SageMaker Data Wrangler jobs when saving data to Amazon S3. When adding a destination node, you can set the number of partitions, corresponding to the number of files that will be written to Amazon S3, and you can specify column names to partition by, to write records with different values of those columns to different subdirectories in Amazon S3. Moreover, you can also define the configuration in the provided notebook.

You can also define memory configurations for SageMaker Data Wrangler processing jobs as part of the Create job workflow. You will find similar configuration as part of your notebook.

Availability — SageMaker Data Wrangler supports for real-time and batch inference as well as enhanced Apache Spark configuration for data processing workloads are generally available in all AWS Regions that Data Wrangler currently supports.

To get started with Amazon SageMaker Data Wrangler supports for real-time and batch inference deployment, visit AWS documentation.

Happy building
— Donnie

New — Amazon SageMaker Data Wrangler Supports SaaS Applications as Data Sources

Post Syndicated from Donnie Prakoso original https://aws.amazon.com/blogs/aws/new-amazon-sagemaker-data-wrangler-supports-saas-applications-as-data-sources/

Data fuels machine learning. In machine learning, data preparation is the process of transforming raw data into a format that is suitable for further processing and analysis. The common process for data preparation starts with collecting data, then cleaning it, labeling it, and finally validating and visualizing it. Getting the data right with high quality can often be a complex and time-consuming process.

This is why customers who build machine learning (ML) workloads on AWS appreciate the ability of Amazon SageMaker Data Wrangler. With SageMaker Data Wrangler, customers can simplify the process of data preparation and complete the required processes of the data preparation workflow on a single visual interface. Amazon SageMaker Data Wrangler helps to reduce the time it takes to aggregate and prepare data for ML.

However, due to the proliferation of data, customers generally have data spread out into multiple systems, including external software-as-a-service (SaaS) applications like SAP OData for manufacturing data, Salesforce for customer pipeline, and Google Analytics for web application data. To solve business problems using ML, customers have to bring all of these data sources together. They currently have to build their own solution or use third-party solutions to ingest data into Amazon S3 or Amazon Redshift. These solutions can be complex to set up and not cost-effective.

Introducing Amazon SageMaker Data Wrangler Supports SaaS Applications as Data Sources
I’m happy to share that starting today, you can aggregate external SaaS application data for ML in Amazon SageMaker Data Wrangler to prepare data for ML. With this feature, you can use more than 40 SaaS applications as data sources via Amazon AppFlow and have these data available on Amazon SageMaker Data Wrangler. Once the data sources are registered in AWS Glue Data Catalog by AppFlow, you can browse tables and schemas from these data sources using Data Wrangler SQL explorer. This feature provides seamless data integration between SaaS applications and SageMaker Data Wrangler using Amazon AppFlow.

Here is a quick preview of this new feature:

This new feature of Amazon SageMaker Data Wrangler works by using integration with Amazon AppFlow, a fully managed integration service that enables you to securely exchange data between SaaS applications and AWS services. With Amazon AppFlow, you can establish bidirectional data integration between SaaS applications, such as Salesforce, SAP, and Amplitude and all supported services, into your Amazon S3 or Amazon Redshift.

Then, with Amazon AppFlow, you can catalog the data in AWS Glue Data Catalog. This is a new feature where with Amazon AppFlow, you can create an integration with AWS Glue Data Catalog for Amazon S3 destination connector. With this new integration, customers can catalog SaaS data applications into AWS Glue Data Catalog with a few clicks, directly from the Amazon AppFlow Flow configuration, without the need to run any crawlers.

Once you’ve established a flow and inserted it into the AWS Glue Data Catalog, you can use this data inside the Amazon SageMaker Data Wrangler. Then, you can do the data preparation as you usually do. You can write Amazon Athena queries to preview data, join data from multiple sources, or import data to prepare for ML model training.

With this feature, you need to do a few simple steps to perform seamless data integration between SaaS applications into Amazon SageMaker Data Wrangler via Amazon AppFlow. This integration supports more than 40 SaaS applications, and for a complete list of supported applications, please check the Supported source and destination applications documentation.

Get Started with Amazon SageMaker Data Wrangler Support for Amazon AppFlow
Let’s see how this feature works in detail. In my scenario, I need to get data from Salesforce, and do the data preparation using Amazon SageMaker Data Wrangler.

To start using this feature, the first thing I need to do is to create a flow in Amazon AppFlow that registers the data source into the AWS Glue Data Catalog. I already have an existing connection with my Salesforce account, and all I need now is to create a flow.

One important thing to note is that to make SaaS application data available in Amazon SageMaker Data Wrangler, I need to create a flow with Amazon S3 as the destination. Then, I need to enable Create a Data Catalog table in the AWS Glue Data Catalog settings. This option will automatically catalog my Salesforce data into AWS Glue Data Catalog.

On this page, I need to select a user role with the required AWS Glue Data Catalog permissions and define the database name and the table name prefix. In addition, in this section, I can define the data format preference, be it in JSON, CSV, or Apache Parquet formats, and filename preference if I want to add a timestamp into the file name section.

To learn more about how to register SaaS data in Amazon AppFlow and AWS Glue Data Catalog, you can read Cataloging the data output from an Amazon AppFlow flow documentation page.

Once I’ve finished registering SaaS data, I need to make sure the IAM role can view the data sources in Data Wrangler from AppFlow. Here is an example of a policy in the IAM role:

{
    "Version": "2012-10-17",
    "Statement": [
        {
            "Effect": "Allow",
            "Action": "glue:SearchTables",
            "Resource": [
                "arn:aws:glue:*:*:table/*/*",
                "arn:aws:glue:*:*:database/*",
                "arn:aws:glue:*:*:catalog"
            ]
        }
    ]
} 

By enabling data cataloging with AWS Glue Data Catalog, from this point on, Amazon SageMaker Data Wrangler will be able to automatically discover this new data source and I can browse tables and schema using the Data Wrangler SQL Explorer.

Now it’s time to switch to the Amazon SageMaker Data Wrangler dashboard then select Connect to data sources.

On the following page, I need to Create connection and select the data source I want to import. In this section, I can see all the available connections for me to use. Here I see the Salesforce connection is already available for me to use.

If I would like to add additional data sources, I can see a list of external SaaS applications that I can integrate into the Set up new data sources section. To learn how to recognize external SaaS applications as data sources, I can learn more with the select How to enable access.

Now I will import datasets and select the Salesforce connection.

On the next page, I can define connection settings and import data from Salesforce. When I’m done with this configuration, I select Connect.

On the following page, I see my Salesforce data that I already configured with Amazon AppFlow and AWS Glue Data Catalog called appflowdatasourcedb. I can also see a table preview and schema for me to review if this is the data I need.

Then, I start building my dataset using this data by performing SQL queries inside the SageMaker Data Wrangler SQL Explorer. Then, I select Import query.

Then, I define a name for my dataset.

At this point, I can start doing the data preparation process. I can navigate to the Analysis tab to run the data insight report. The analysis will provide me with a report on the data quality issues and what transform I need to use next to fix the issues based on the ML problem I want to predict. To learn more about how to use the data analysis feature, see Accelerate data preparation with data quality and insights in the Amazon SageMaker Data Wrangler blog post.

In my case, there are several columns I don’t need, and I need to drop these columns. I select Add step.

One feature I like is that Amazon SageMaker Data Wrangler provides numerous ML data transforms. It helps me to streamline the process of cleaning, transforming and feature engineering my data in one dashboard. For more about what SageMaker Data Wrangler provides for transformation data, please read this Transform Data documentation page.

In this list, I select Manage columns.

Then, in the Transform section, I select the Drop column option. Then, I select a few columns that I don’t need.

Once I’m done, the columns I don’t need are removed and the Drop column data preparation step I just created is listed in the Add step section.

I can also see the visual of my data flow inside the Amazon SageMaker Data Wrangler. In this example, my data flow is quite basic. But when my data preparation process becomes complex, this visual view makes it easy for me to see all the data preparation steps.

From this point on, I can do what I require with my Salesforce data. For example, I can export data directly to Amazon S3 by selecting Export to and choosing Amazon S3 from the Add destination menu. In my case, I specify Data Wrangler to store the data in Amazon S3 after it has processed it by selecting Add destination and then Amazon S3.

Amazon SageMaker Data Wrangler provides me flexibility to automate the same data preparation flow using scheduled jobs. I can also automate feature engineering with SageMaker Pipelines (via Jupyter Notebook) and SageMaker Feature Store (via Jupyter Notebook), and deploy to Inference end point with SageMaker Inference Pipeline (via Jupyter Notebook).

Things to Know
Related news – This feature will make it easy for you to do data aggregation and preparation with Amazon SageMaker Data Wrangler. As this feature is an integration with Amazon AppFlow and also AWS Glue Data Catalog, you might want to learn more on Amazon AppFlow now supports AWS Glue Data Catalog integration and provides enhanced data preparation page.

Availability – Amazon SageMaker Data Wrangler supports SaaS applications as data sources available in all the Regions currently supported by Amazon AppFlow.

Pricing – There is no additional cost to use SaaS applications supports in Amazon SageMaker Data Wrangler, but there is a cost to running Amazon AppFlow to get the data in Amazon SageMaker Data Wrangler.

Visit Import Data From Software as a Service (SaaS) Platforms documentation page to learn more about this feature, and follow the getting started guide to start data aggregating and preparing SaaS applications data with Amazon SageMaker Data Wrangler.

Happy building!
Donnie

New — Amazon Athena for Apache Spark

Post Syndicated from Donnie Prakoso original https://aws.amazon.com/blogs/aws/new-amazon-athena-for-apache-spark/

When Jeff Barr first announced Amazon Athena in 2016, it changed my perspective on interacting with data. With Amazon Athena, I can interact with my data in just a few steps—starting from creating a table in Athena, loading data using connectors, and querying using the ANSI SQL standard.

Over time, various industries, such as financial services, healthcare, and retail, have needed to run more complex analyses for a variety of formats and sizes of data. To facilitate complex data analysis, organizations adopted Apache Spark. Apache Spark is a popular, open-source, distributed processing system designed to run fast analytics workloads for data of any size.

However, building the infrastructure to run Apache Spark for interactive applications is not easy. Customers need to provision, configure, and maintain the infrastructure on top of the applications. Not to mention performing optimal tuning resources to avoid slow application starts and suffering from idle costs.

Introducing Amazon Athena for Apache Spark
Today, I’m pleased to announce Amazon Athena for Apache Spark. With this feature, we can run Apache Spark workloads, use Jupyter Notebook as the interface to perform data processing on Athena, and programmatically interact with Spark applications using Athena APIs. We can start Apache Spark in under a second without having to manually provision the infrastructure.

Here’s a quick preview:

Quick preview of Amazon Athena for Apache Spark

How It Works
Since Amazon Athena for Apache Spark runs serverless, this benefits customers in performing interactive data exploration to gain insights without the need to provision and maintain resources to run Apache Spark. With this feature, customers can now build Apache Spark applications using the notebook experience directly from the Athena console or programmatically using APIs.

The following figure explains how this feature works:

How Amazon Athena for Apache Spark works

On the Athena console, you can now run notebooks and run Spark applications with Python using Jupyter notebooks. In this Jupyter notebook, customers can query data from various sources and perform multiple calculations and data visualizations using Spark applications without context switching.

Amazon Athena integrates with AWS Glue Data Catalog, which helps customers to work with any data source in AWS Glue Data Catalog, including data in Amazon S3. This opens possibilities for customers in building applications to analyze and visualize data to explore data to prepare data sets for machine learning pipelines.

As I demonstrated in the demo preview section, the initialization for the workgroup running the Apache Spark engine takes under a second to run resources for interactive workloads. To make this possible, Amazon Athena for Apache Spark uses Firecracker, a lightweight micro-virtual machine, which allows for instant startup time and eliminates the need to maintain warm pools of resources. This benefits customers who want to perform interactive data exploration to get insights without having to prepare resources to run Apache Spark.

Get Started with Amazon Athena for Apache Spark
Let’s see how we can use Amazon Athena for Apache Spark. In this post, I will explain step-by-step how to get started with this feature.

The first step is to create a workgroup. In the context of Athena, a workgroup helps us to separate workloads between users and applications.

To create a workgroup, from the Athena dashboard, select Create Workgroup.

Select Create Workgroup

On the next page, I give the name and description for this workgroup.

Creating a workgroup

On the same page, I can choose Apache Spark as the engine for Athena. In addition, I also need to specify a service role with appropriate permissions to be used inside a Jupyter notebook. Then, I check Turn on example notebook, which makes it easy for me to get started with Apache Spark inside Athena. I also have the option to encrypt Jupyter notebooks managed by Athena or use the key I have configured in AWS Key Management Service (AWS KMS).

After that, I need to define an Amazon Simple Storage Service (Amazon S3) bucket to store calculation results from the Jupyter notebook. Once I’m sure of all the configurations for this workgroup, I just have to select Create workgroup.

Configure Calculation Results Settings

Now, I can see the workgroup already created in Athena.

Select newly created workgroup

To see the details of this workgroup, I can select the link from the workgroup. Since I also checked the Turn on example notebook when creating this workgroup, I have a Jupyter notebook to help me get started. Amazon Athena also provides flexibility for me to import existing notebooks that I can upload from my laptop with Import file or create new notebooks from scratch by selecting Create notebook.

Example notebook is available in the workgroup

When I select the Jupyter notebook example, I can start building my Apache Spark application.

When I run a Jupyter notebook, it automatically creates a session in the workgroup. Subsequently, each time I run a calculation inside the Jupyter notebook, all results will be recorded in the session. This way, Athena provides me with full information to review each calculation by selecting Calculation ID, which took me to the Calculation details page. Here, I can review the Code and also Results for the calculation.

Review code and results of a calculation

In the session, I can adjust the Coordinator size and Executor size, with 1 data processing unit (DPU) by default. A DPU consists of 4 vCPU and 16 GB of RAM. Changing to a larger DPU allows me to process tasks faster if I have complex calculations.

Configuring session parameters

Programmatic API Access
In addition to using the Athena console, I can also use programmatic access to interact with the Spark application inside Athena. For example, I can create a workgroup with the create-work-group command, start a notebook with create-notebook, and run a notebook session with start-session.

Using programmatic access is useful when I need to execute commands such as building reports or computing data without having to open the Jupyter notebook.

With my Jupyter notebook that I’ve created before, I can start a session by running the following command with the AWS CLI:

$> aws athena start-session \
    --work-group <WORKGROUP_NAME>\
    --engine-configuration '{"CoordinatorDpuSize": 1, "MaxConcurrentDpus":20, "DefaultExecutorDpuSize": 1, "AdditionalConfigs":{"NotebookId":"<NOTEBOOK_ID>"}}'
    --notebook-version "Jupyter 1"
    --description "Starting session from CLI"

{
    "SessionId":"<SESSION_ID>",
    "State":"CREATED"
}

Then, I can run a calculation using the start-calculation-execution API.

$ aws athena start-calculation-execution \
    --session-id "<SESSION_ID>"
    --description "Demo"
    --code-block "print(5+6)"

{
    "CalculationExecutionId":"<CALCULATION_EXECUTION_ID>",
    "State":"CREATING"
}

In addition to using code inline, with the --code-block flag, I can also pass input from a Python file using the following command:

$ aws athena start-calculation-execution \
    --session-id "<SESSION_ID>"
    --description "Demo"
    --code-block file://<PYTHON FILE>

{
    "CalculationExecutionId":"<CALCULATION_EXECUTION_ID>",
    "State":"CREATING"
}

Pricing and Availability
Amazon Athena for Apache Spark is available today in the following AWS Regions: US East (Ohio), US East (N. Virginia), US West (Oregon), Asia Pacific (Tokyo), and Europe (Ireland). To use this feature, you are charged based on the amount of compute usage defined by the data processing unit or DPU per hour. For more information see our pricing page here.

To get started with this feature, see Amazon Athena for Apache Spark to learn more from the documentation, understand the pricing, and follow the step-by-step walkthrough.

Happy building,

Donnie

New — Create and Share Operational Reports at Scale with Amazon QuickSight Paginated Reports

Post Syndicated from Donnie Prakoso original https://aws.amazon.com/blogs/aws/new-create-and-share-operational-reports-at-scale-with-amazon-quicksight-paginated-reports/

There are various ways to report on data insights, and paginated reports is one of them. Paginated reports are essential documents that contain critical business information for end-users. For decades, paginated reports have been the standard business reporting format. The following are examples of paginated reports. On the left shows the report for income statement and on the right is the yearly summary corporate statement:

Examples of paginated reports

As the example shows, paginated reports contain various highly formatted insights and are designed to be printable, in landscape or portrait orientation, so they can be consumed easily by readers. It’s called paginated because it often spans tens of hundreds of pages of data.

Although it may appear to be a simple task, generating paginated reports is heavily dependent on legacy data warehouses and legacy business intelligence tools, especially because modern business intelligence tools do not offer this capability. As a result, organizations typically have to maintain multiple business intelligence systems to have separate solutions for building critical operational reports and summarized dashboards. Each solution presents its set of challenges with data governance, security, and access management. This caused a disjointed experience both authors and end users. Legacy BI systems also run on-premises infrastructure, which is expensive to maintain and upgrade.

Introducing Amazon QuickSight Paginated Reports
Today, I’m pleased to announce Amazon QuickSight Paginated Reports. This feature allows customers to create and share highly formatted, personalized reports containing business-critical data to hundreds of thousands of end-users without any infrastructure setup or maintenance, up-front licensing, or long-term commitments.

Here’s a quick look on how Amazon QuickSight Paginated Reports works:

Quick look on Amazon QuickSight Paginated Reports

With Amazon QuickSight Paginated Reports, customers can now create and share paginated reports to their users from the same familiar QuickSight interface that they use to create and consume interactive dashboards. They can use one single BI service to create and deliver interactive analytics in dashboards, format reports with paginated reports, or embed analytics in apps while also allowing end users to ask questions of the underlying data using machine learning (ML) powered natural language query with QuickSight Q. From ML powered interactive dashboard to generating and distributing operational reports, these benefits impact different stakeholder groups in an organization

For Readers – Amazon QuickSight Paginated Reports makes it easy for readers to consume reports in a familiar and scheduled fashion, in highly formatted models in .pdf or .csv formats. Readers can access these reports via email, Amazon QuickSight web and mobile interfaces, mobile applications, or embedded portals.

For Authors – This feature gives report authors the flexibility to create highly formatted reports with images, texts, charts, tables, and exact page sizes. They can create reports from the same data models as dashboards, reusing data models built up, using access permissions (RLS/CLS) setup, and publishing in the same dashboards where their users look for data. These dashboards are also available via API, allowing migration between accounts or programmatic creation and migration of these assets as needed.

The Amazon QuickSight Paginated Reports makes it easy to build reports without the need for separate training or investment in a dedicated application. With an easy-to-use web-based authoring interface, this feature allows report authors to create complex data models in the form of operational reports for hundreds of thousands of report readers and enables data-driven decision-making.

For IT Leaders – This feature also provides IT leaders with benefits such as fully managed reporting capabilities consolidated within Amazon QuickSight. This reduces the time and resources required to set up and maintain reporting solutions, helping IT leaders to start looking at the cloud for their BI needs and transitioning legacy reporting to the cloud to save time and resources.

Amazon QuickSight Paginated Reports also leverages existing QuickSight capabilities, such as user management, data preparation, advanced scheduling and audit logging. By inheriting the capabilities from QuickSight, it removes the need to manage any infrastructure or provisioning setup to deliver reports to hundreds of thousands of users.

Get Started with Amazon QuickSight Paginated Reports
Let’s see how to get started with Amazon QuickSight Paginated Reports. I will focus more on how authors can create, publish and deliver reports to readers.

For Authors: Creating a Report
First, I open the QuickSight console. Then, in the navigation section, I select the dataset that I will use for reporting purposes. 

Selecting dataset

After I check and confirm the dataset, I select Use in Analysis.

Using dataset in analysis

On the next page, I have the option to select the sheet type, Interactive sheet, or Paginated report. I select Paginated report, and here I can configure the report for Paper size and either Portrait or Landscape orientation.

Select Paginated report

Now I’m starting my report creation. The sheet area I can use is adjusted to the paper size option I defined in the previous step. In this reporting sheet, QuickSight provides me with Header and Footer areas.

Header and footer area

First, I want to add the title of this report in the header section. I select the Header area, and in the menu section, I select Add text.

Adding text

Now, I can start entering the title of the report. I name this report “Attendance Statistics” and customize the header using the company logo. I can also use the text toolbar to format the text and add page numbers. For any changes I’ve made, I can also see the preview directly on this page.

Using text toolbar

I can also add other visuals in any section by selecting Add visual.

Adding visual

From here, I can start building reports with the available visuals, just like I normally do on the Amazon QuickSight dashboard. For example, if I need to add a summary to the pie chart, I can add another text box and drag and drop to set the layout and resize the visuals as needed.

Arranging layout

If I need to add another section, from the menu, I select Add section, and I can add other visuals or insights into this new section. As for visual tabular data, the visual will be generated across pages.

Table will automatically expand across pages

For Author: Publish and Schedule Report
Once the analysis is completed, I need to publish this analysis as a dashboard by selecting Share and then Publish dashboard. Then I can choose to create a new dashboard by selecting Publish new dashboard or Replace an existing dashboard. I can also select the sheet(s) I want to publish.

Publishing dashboard

At this stage, I’m ready to set a schedule to deliver my reports to readers. To do that, I need to open the dashboard and define a schedule by selecting Add schedule.

Select Add Schedule

In this menu, I can specify the schedule name and also the content format. In the Content section, I can choose either PDF or CSV format. For PDF format, I can select the sheet I want to use. For CSV format, I can select multiple visuals.

Schedule configuration

As for the delivery report schedule, I can define the schedule as Daily, Weekly, Monthly, or one-time delivery with Do not repeat. I can also specify the date and time of delivery, including the time zone.

Schedule timing configuration

Then, I specify the configuration of the email message. In the final section, I can also specify how readers access this report, by using Download link or File attachment. Once I’m done setting up the schedule, I can Save it or send this report according to the schedule by selecting Save and run now.


Save or save and run now

For Readers: Receiving and Accessing Reports
Here is an example email from the schedule that QuickSight has sent to me as a reader. I can download this report from the email attachment or from the dashboard. 

Example mail with paginated report

I can also use the provided link in the email to view recent snapshots. The Recent Snapshots feature allows me to review previously generated reports.Recent snapshots feature

Things to Know
Programmatic API Access – In addition to using the Amazon QuickSight console, customers can also use the AWS API and SDK to interact programmatically with Amazon QuickSight Paginated Reports.

AWS Partners – To make it easier for customers to migrate their legacy BI solutions to Amazon QuickSight, customers can work with AWS partners, Ironside Consulting and Data Terrain. Ironside and Data Terrain offerings are available in the AWS Marketplace, with more details at Amazon QuickSight Partners page.

Availability and Pricing – Amazon QuickSight Paginated Reports is available as an add-on to the existing Amazon QuickSight Enterprise or Enterprise enabled with Q in all supported AWS Regions.

Visit the Amazon QuickSight Paginated Reports page to learn more details on how to use this feature, learn how to get started, and understand the pricing.

Happy building!
Donnie

New — Fine-Grained Visual Embedding Powered by Amazon QuickSight

Post Syndicated from Donnie Prakoso original https://aws.amazon.com/blogs/aws/new-fine-grained-visual-embedding-powered-by-amazon-quicksight/

Today, we are announcing a new feature, Fine-Grained Visual Embedding Powered by Amazon QuickSight. With this feature, individual visualizations from Amazon QuickSight dashboards can now be embedded in high-traffic webpages and applications. Additionally, this feature enables you to provide rich insights for your end-users where they need them the most, without server or software setup or infrastructure management.

This is a quick preview of this new feature:

Quick Preview of Fine-Grained Visual Embedding Powered by Amazon QuickSight

Quick Preview: Fine-Grained Visual Embedding Powered by Amazon QuickSight

New Feature: Fine-Grained Visual Embedding

Amazon QuickSight is a cloud-based embeddable and ML-powered business intelligence (BI) service that delivers interactive data visualizations, analysis, and reporting to enable data-driven decision-making within the organization and with the end user, without servers to manage.

Amazon QuickSight supports embedded analytics, a feature that enables you to incorporate branded analytics into internal portals or public sites. Customers can easily embed interactive dashboards, natural language querying (NLQ), or the complete BI-authoring experience seamlessly in their applications. This provides convenience for your end users to simplify the process of data-informed decisions.

Our customers want to be able to embed visuals from various dashboards into their applications and websites in order to bring forth deeply integrated data-driven experiences to enhance end user experiences. Previously, customers needed to build, scale, and maintain generation layer and charting libraries to embed individual visualizations.

With Fine-Grained Visual Embedding Powered by Amazon QuickSight, developers and ISVs now have the ability to embed any visuals from dashboards into their applications using APIs. As for enterprises, they can embed visuals into their internal sites using 1-Click Embedding. For end-users, Fine-Grained Visual Embedding provides a seamless and integrated experience to access a variety of key data visuals to get insights.

Here’s an example view where we can embed a visual using this feature in a sample web application page:

Sample Web App with a Visual

Sample Web App with a Visual

The embedded visuals are automatically updated when the source data changes or when the visual is updated. Embedded visuals scale automatically without the need to manage servers from your end and are optimized for high performance on high-traffic pages.

Get Started with Fine-Grained Visual Embedding

There are two ways to use Fine-Grained Visual Embedding, with 1-Click Embedding or using QuickSight APIs to generate the embed URL. The 1-Click Embedding feature makes it easy for nontechnical users to generate embed code that can be inserted directly into internal portals or public sites. Using APIs, ISVs and developers can embed rich visuals in their applications. Furthermore, with row-level security, data access is secured enabling users to access only their data.

To start using this feature, let’s turn to the Amazon QuickSight dashboard. Here, I already have a dashboard using a dataset that you can follow from the Create an Amazon QuickSight dashboard using sample data documentation.

Amazon QuickSight Dashboard Using Sample Data

Amazon QuickSight Dashboard Using Sample Data

Using 1-Click Embedding to Generate Embed Code

Amazon QuickSight supports 1-Click Embedding—a feature that allows you to get the embed code without any development efforts. There are two types of 1-Click Embedding: 1) 1-Click Enterprise Embedding and 2) 1-Click Public Embedding. With enterprise embedding, it allows you to enable access to the dashboard with registered users in your account. In public embedding, you can enable access to the dashboards for anyone.

To get the embed code via 1-Click Embedding, you can select the visual you want to embed, then select Menu Options and choose Embed visual.

Select "Embed visual" from Menu Options

Select Embed visual from Menu Options

Once you select Embed visual, you will get a new menu on the right side, which contains the details of the visual you selected.

Copy "Embed code"

Copy the Embed code

The Embed code section contains iframe code that you can insert into your application, portal, or website. Domains hosting these embedded visuals must be on an allow list, which you can learn more about on the Allow listing static domains page. This is a sample display of how the embed code is rendered:

Sample Display of Fine-Grained Visual Embedding Powered by Amazon QuickSight

Sample Display of Fine-Grained Visual Embedding Powered by Amazon QuickSight

When there is a change in the visual source within Amazon QuickSight, it will also be reflected within the web app or app where you embed your visuals. In addition, embedded visuals from QuickSight will automatically scale as traffic on the website grows.

From a customer’s perspective, 1-Click Embedding will help customers provide key data visuals from various dashboards in Amazon QuickSight for end users anywhere on their websites without requiring technical skills.

Programmatically Generate Embed URL

In addition to the 1-Click Embedding, you can also perform visual embedding through the API. To perform visual embedding through the API, you can use AWS CLI or SDK to call the API GenerateEmbedUrlForAnonymousUser or GenerateEmbedUrlForRegisteredUser.

You can use the GenerateEmbedUrlForAnonymousUser API to embed visuals in your applications for your users without provisioning them in Amazon QuickSight.

You can also use GenerateEmbedUrlForRegisteredUser API to embed visuals in your application for your users that are provisioned in Amazon QuickSight.

The API works by passing the ExperienceConfiguration parameter in DashboardVisual with the properties below:

{
    'DashboardId':'<DASHBOARD_ID>',  
    'SheetId':'<SHEET_ID>',  
    'VisualId':'<VISUAL_ID>'  
}

Then, to get the IDs for DashboardSheet, and Visual, you can find the value of these properties under IDs for Developers menu section for the visual you selected.

IDs for Developers

IDs for Developers

Using CLI to Generate Embed URL

After collecting all the required IDs, we can pass them as parameters. Here’s an example API command to generate an embed URL:

aws quicksight generate-embed-url-for-anonymous-user \  
    --aws-account-id <ACCOUNT_ID> \  
    --session-lifetime-in-minutes 15 \          
    --authorized-resource-arns “<DASHBOARD_ARN>”           
    --namespace default           
    --experience-configuration '{"DashboardVisual": \
        {
            "InitialDashboardVisualId": \
            {  
                    "DashboardId”:”<DASHBOARD_ID>”,  \
                    "SheetId”:”<SHEET_ID>”,  \
                    "VisualId”:”<VISUAL_ID”  \
            }  
        }}'  

If the request is successful, you will get the following response. You can then use the EmbedUrl property within your web or application.

{  
    "Status": 200,  
    "EmbedUrl": “<EMBED_URL>”,  
    "RequestId": “<REQUEST_ID>”,  
    "AnonymousUserArn": “<ARN>”  
}

Using SDK to Generate Embed URL

In addition to the AWS CLI, generating embed URLs can also be done using the AWS SDK. Here’s an example in Python:

response = client.generate_embed_url_for_anonymous_user(  
    AwsAccountId='123456789012',  
    SessionLifetimeInMinutes=15,  
    Namespace='default',  
    AuthorizedResourceArns=[  
        '<DASHBOARD_ARN>',  
    ],  
    ExperienceConfiguration={  
        'DashboardVisual': {  
            'InitialDashboardVisualId': {  
                'DashboardId':'<DASHBOARD_ID>',  
                'SheetId':'<SHEET_ID>',  
                'VisualId':'<VISUAL_ID>'  
            }  
        }  
    },  
    AllowedDomains=[  
        'https://YOUR-DOMAIN.com',  
    ]  
)  

With API, you have the flexibility to configure allowed domains at runtime. From the example above, you can pass your domains in AllowedDomains property.

When the request is successful, the API will return a successful response, along with a URL from Visual Embedding that can be inserted into external web apps. Example response as below:

{
    "Status": 200,  
    "EmbedUrl":"<EMBED_URL>",  
    "RequestId": "<REQUEST_ID>”
}  

Using the API approach gives developers the flexibility to programmatically generate embed URLs. Developers can specify the access for visuals for nonregistered and registered users in Amazon QuickSight.

Demo

To see Fine-Grained Visual Embedding Powered by Amazon QuickSight in action, have a look at this demo:

Pricing and Availability

You can use this new feature, Fine-Grained Visual Embedding in Amazon QuickSight Enterprise Edition, in all supported Regions. For more detailed information, please visit the documentation page.

Happy building,

— Donnie

New — Detect and Resolve Issues Quickly with Log Anomaly Detection and Recommendations from Amazon DevOps Guru

Post Syndicated from Donnie Prakoso original https://aws.amazon.com/blogs/aws/new-detect-and-resolve-issues-quickly-with-log-anomaly-detection-and-recommendations-from-amazon-devops-guru/

Today, we are announcing a new feature, Log Anomaly Detection and Recommendations for Amazon DevOps Guru. With this feature, you can find anomalies throughout relevant logs within your app, and get targeted recommendations to resolve issues. Here’s a quick look at this feature:

AWS launched DevOps Guru, a fully managed AIOps platform service, in December 2020 to make it easier for developers and operators to improve applications’ reliability and availability. DevOps Guru minimizes the time needed for issue remediation by using machine learning models based on more than 20 years of operational expertise in building, scaling, and maintaining applications for Amazon.com.

You can use DevOps Guru to identify anomalies such as increased latency, error rates, and resource constraints and then send alerts with a description and actionable recommendations for remediation. You don’t need any prior knowledge in machine learning to use DevOps Guru, and only need to activate it in the DevOps Guru dashboard.

New Feature – Log Anomaly Detection and Recommendations

Observability and monitoring are integral parts of DevOps and modern applications. Applications can generate several types of telemetry, one of which is metrics, to reveal the performance of applications and to help identify issues.

While the metrics analyzed by DevOps Guru today are critical to surfacing issues occurring in applications, it is still challenging to find the root cause of these issues. As applications become more distributed and complex, developers and IT operators need more automation to reduce the time and effort spend detecting, debugging, and resolving operational issues. By sourcing relevant logs in conjunction with metrics, developers can now more effectively monitor and troubleshoot their applications.

With this new Log Anomaly Detection and Recommendations feature, you can get insights along with precise recommendations from application logs without manual effort. This feature delivers contextualized log data of anomaly occurrences and provides actionable insights from recommendations integrated inside the DevOps Guru dashboard.

The Log Anomaly Detection and Recommendations feature is able to detect exception keywords, numerical anomalies, HTTP status codes, data format anomalies, and more. When DevOps Guru identifies anomalies from logs, you will find relevant log samples and deep links to CloudWatch Logs on the DevOps Guru dashboard. These contextualized logs are an important component for DevOps Guru to provide further features, namely targeted recommendations to help faster troubleshooting and issue remediation.

Let’s Get Started!

This new feature consists of two things, “Log Anomaly Detection” and “Recommendations.” Let’s explore further into how we can use this feature to find the root cause of an issue and get recommendations. As an example, we’ll look at my serverless API built using Amazon API Gateway, with AWS Lambda integrated with Amazon DynamoDB. The architecture is shown in the following image:

If it’s your first time using DevOps Guru, you’ll need to enable it by visiting the DevOps Guru dashboard. You can learn more by visiting the Getting Started page.

Since I’ve already enabled DevOps Guru I can go to the Insights page, navigate to the Log groups section, and select the Enable log anomaly detection.

Log Anomaly Detection

After a few hours, I can visit the DevOps Guru dashboard to check for insights. Here, I get some findings from DevOps Guru, as seen in the following screenshots:

With Log Anomaly Detection, DevOps Guru will show the findings of my serverless API in the Log groups section, as seen in the following screenshot:

I can hover over the anomaly and get a high-level summary of the contextualized enrichment data found in this log group. It also provides me with additional information, including the number of log records analyzed and the log scan time range. From this information, I know these anomalies are new event types that have not been detected in the past with the keyword ERROR.

To investigate further, I can select the log group link and go to the Detail page. The graph shows relevant events that might have occurred around these log showcases, which is a helpful context for troubleshooting the root cause. This Detail page includes different showcases, each representing a cluster of similar log events, like exception keywords and numerical anomalies, found in the logs at the time of the anomaly.

Looking at the first log showcase, I noticed a ConditionalCheckFailedException error within the AWS Lambda function. This can occur when AWS Lambda fails to call DynamoDB. From here, I learned that there was an error in the conditional check section, and I reviewed the logic on AWS Lambda. I can also investigate related CloudWatch Logs groups by selecting View details in CloudWatch links.

One thing I want to emphasize here is that DevOps Guru identifies significant events related to application performance and helps me to see the important things I need to focus on by separating the signal from the noise.

Targeted Recommendations

In addition to anomaly detection of logs, this new feature also provides precise recommendations based on the findings in the logs. You can find these recommendations on the Insights page, by scrolling down to find the Recommendations section.

Here, I get some recommendations from DevOps Guru, which make it easier for me to take immediate steps to remediate the issue. One recommendation shown in the following image is Check DynamoDB ConditionalExpression, which relates to an anomaly found in the logs derived from AWS Lambda.

Availability

You can use DevOps Guru Log Anomaly Detection and Recommendations today at no additional charge in all Regions where DevOps Guru is available, US East (Ohio), US East (N. Virginia), US West (Oregon), Asia Pacific (Singapore), Asia Pacific (Sydney), Asia Pacific (Tokyo), Europe (Frankfurt), Europe (Ireland), and Europe (Stockholm).

To learn more, please visit Amazon DevOps Guru web site and technical documentation, and get started today.

Happy building
— Donnie