Post Syndicated from original https://lwn.net/Articles/907382/
Security updates have been issued by Fedora (curl, protobuf-c, and vim) and SUSE (gimp, java-1_8_0-openj9, libostree, openvswitch, python-bottle, python-Flask-Security-Too, and zabbix).
Post Syndicated from original https://lwn.net/Articles/907382/
Security updates have been issued by Fedora (curl, protobuf-c, and vim) and SUSE (gimp, java-1_8_0-openj9, libostree, openvswitch, python-bottle, python-Flask-Security-Too, and zabbix).
Post Syndicated from Kyle Duong original https://aws.amazon.com/blogs/big-data/crawl-delta-lake-tables-using-aws-glue-crawlers/
In recent evolution in data lake technologies, it became popular to bring ACID (atomicity, consistency, isolation, and durability) transactions on Amazon Simple Storage Service (Amazon S3). You can achieve that by introducing open-source data lake formats such as Apache Hudi, Apache Iceberg, and Delta Lake. Delta Lake is one of the common open-source data lake formats.
Delta Lake is available with multiple AWS services, such as AWS Glue Spark jobs, Amazon EMR, Amazon Athena, and Amazon Redshift Spectrum. To utilize Delta Lake from Glue Spark jobs, follow this blog series. To utilize Delta Lake from Athena and Redshift Spectrum, you need to have specific table definitions on the AWS Glue Data Catalog, and there is an extra step to make it queryable from Athena and Redshift Spectrum.
One of the key capabilities of Delta Lake and other data lake formats is reading consistent snapshot using ACID transactions. Even when there are many concurrent writes, you can guarantee consistent version of the tables at the specific point in time without retrieving intermediate or incomplete state. It is highly demanded capability especially in complex data pipelines.
AWS Glue crawlers are designed to populate table definitions on the Data Catalog based on data dynamically. This year, AWS Glue crawlers started supporting Delta Lake. It simplifies those use cases by creating table definitions of Delta tables dynamically, populating the metadata from the Delta Lake transaction logs, and creating the manifest files in Amazon S3 for Athena and Redshift Spectrum to consume. With Delta lake crawler, you can easily read consistent snapshot from Athena and Redshift Spectrum. AWS Glue crawler integration with Delta Lake also supports AWS Lake Formation access control. You can grant Lake Formation permissions on the Delta tables created by the crawler to AWS principals that then query through Athena and Redshift Spectrum to access data in Delta tables.
This post demonstrates how AWS Glue crawlers work with Delta tables, and describes typical use cases to query Delta tables.
Delta Lake provides an abstraction known as a Delta table that encapsulates all metadata, data files, and partitions under a transaction log. Delta Lake stores the metadata and schema within the distributed file system rather than in a central data catalog.
To access data using the Delta Lake protocol, Redshift Spectrum and Athena need a manifest file that lists all files that are associated to a particular Delta table, along with the table metadata populated in the AWS Glue Data Catalog. Traditionally, this manifest file creation required running a GENERATE symlink_format_manifest query on Apache Spark.
The AWS Glue crawler populates the metadata from the Delta Lake transaction log into the Data Catalog, and creates the manifest files in Amazon S3 for different query engines to consume. To simplify access to Delta tables, the crawler provides an option to select a Delta Lake data store, which encapsulates all parameters that are required for crawling. For each Delta Lake data store, the crawler scans the Delta table’s transaction log to detect metadata. It populates the _symlink_manifest folder with the manifest files that are partitioned by the partition keys, based on configuration parameters that you choose.
In this tutorial, let’s go through how to crawl delta tables using AWS Glue Crawler.
Complete the following prerequisite steps for this tutorial:
your_s3_bucket with your S3 bucket name):You can create a Delta Lake crawler via the AWS Glue console, the AWS Glue SDK, or the AWS CLI. In the SDK, specify a DeltaTarget with the following configurations:
DeltaPath values where the Delta tables are located. (Note that each path must be the parent of a _delta_log folder).DeltaPath.To create your crawler on the AWS Glue console, complete the following steps:
delta-lake-crawler, and choose Next.s3://your_s3_bucket/data/sample_delta_table/.
delta_lake, then choose Create database. Then come back to the previous page. For Target database, click the reload button, and select delta_lake database.StartCrawl API. You could also schedule a trigger via the AWS Glue console. For this post, we run the crawler via the AWS Glue console.delta-lake-crawler, and choose Run.After the crawler runs, it writes a single manifest table in the Data Catalog for each DeltaPath under its configuration that has a valid Delta table. The manifest table uses the format SymlinkTextInputFormat and the manifest location s3://your_s3_bucket/data/sample_delta_table/_symlink_format_manifest/.
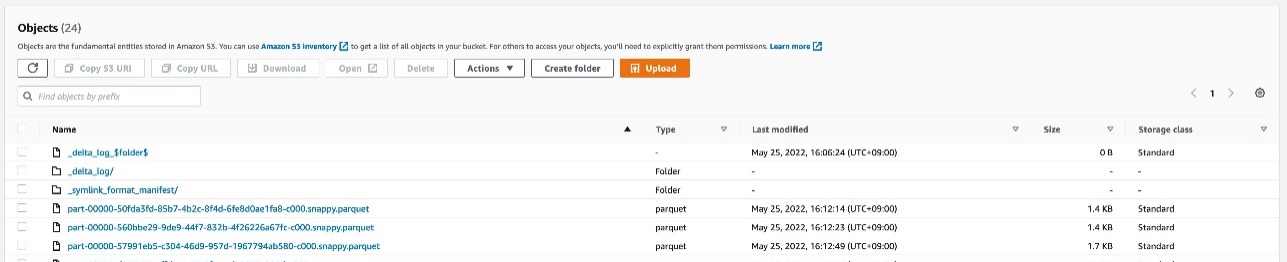
You can see the Delta table definition on the AWS Glue console. The table location points to the preceding manifest location.

The table definition also includes an AdditionalLocations field, which is an array that points to the location s3://your_s3_bucket/data/sample_delta_table/. You can access this additional field through the following AWS CLI command:
After you create the manifest table, AWS query engines such as Athena and Redshift Spectrum are able to query against the files by reading the manifest file locations to filter which data files to query in the Delta table.
Athena users need to point their catalog to the AWS Glue Data Catalog. Open the Athena console in the same Region as where your table is registered in the Data Catalog, and confirm that the data source is set to AwsDataCatalog.

Now you’re ready to run queries on Athena. To access your Delta table, run the following query:
The following screenshot shows our output.

Redshift Spectrum requires an external schema pointing to the database in which the Delta table was created.
To query with Redshift Spectrum, complete the following steps:
arn:aws:iam::aws:policy/AmazonS3ReadOnlyAccess, or your custom policy for reading your S3 bucket.To lean more, visit IAM policies for Amazon Redshift Spectrum.
delta_lake database to use in Redshift Spectrum (replace <your IAM role ARN> with your IAM role ARN):
spectrum.sample_delta_table:
The following screenshot shows our output.

When the data or schema in a Delta table is updated, the manifest tables in the AWS Glue Data Catalog may become out of sync. It means that you can still query the manifest table and get the consistent result, but the result of the table is at the previous point of time. To get the latest result, you must update the manifest tables using the crawler or manually update the manifest table through the AWS Glue SDK or AWS CLI. When you want to keep the manifest table up-to-date, you can run Delta Lake crawlers on a schedule (for example, once an hour).
When the Delta table data is updated, the manifest files under the _symlink_manifest folder of your Delta tables may also become out of sync, in which case you need to rerun a crawler with writeManifest enabled.
The delta lake crawler is designed for use in Athena, Redshift Spectrum, and other engines compatible with parquet-based manifest tables. For EMR Spark or Glue Spark jobs, you do not need to create a manifest table by running the delta lake crawler, instead, you can read from and write to delta table directly using Delta Lake library. You can follow this blog series to understand how to process Delta tables on Glue Spark jobs.
Manifest tables created by the Delta Lake crawler support Lake Formation access control, including cell-level security. It allows Data Lake administrators to filter specific rows and columns for certain users of their manifest tables. Through the use of CreateDataCellFilter and GrantPermissions APIs, you can grant row and column filters to the Delta manifest table. You can query the Delta manifest table from Athena and Redshift Spectrum with the use of these filters configured on the Delta manifest tables.
To learn more about Lake Formation cell-level security, refer to the following blog posts:
Now to the final step, cleaning up the resources:
s3://your_s3_bucket/data/sample_delta_table/.delta-lake-crawler.delta_lake.This post demonstrated how to crawl Delta tables using an AWS Glue crawler, and how to query against the crawled tables from Athena and Redshift Spectrum. With AWS Glue crawlers, the manifest files are automatically created, so you can easily integrate Delta tables with Athena and Redshift Spectrum without manual effort in maintaining manifest files. It also enables you to manage cell-level security on the Delta tables using Lake Formation permissions.
Let’s start using Glue crawlers for your own Delta tables. If you have comments or feedback, please feel free to leave them in the comments.
 Kyle Duong is a Software Development Engineer on the AWS Glue and AWS Lake Formation team. He is passionate about building big data technologies and distributed systems. In his free time, he enjoys cycling or playing basketball.
 Noritaka Sekiyama is a Principal Big Data Architect on the AWS Glue team. He is responsible for building software artifacts to help customers. This summer, he enjoyed goldfish scooping with his children.
Post Syndicated from original https://xkcd.com/2669/

Post Syndicated from Let's Encrypt original https://letsencrypt.org/2022/09/07/new-life-for-crls.html
This month, Let’s Encrypt is turning on new infrastructure to support revoking certificates via Certificate Revocation Lists. Despite having been largely supplanted by the Online Certificate Status Protocol for over a decade now, CRLs are gaining new life with recent browser updates. By collecting and summarizing CRLs for their users, browsers are making reliable revocation of certificates a reality, improving both security and privacy on the web. Let’s talk about exactly what this new infrastructure does, and why it’s important.
When a certificate becomes untrustworthy (for instance because its private key was compromised), that certificate must be revoked and that information publicized so that no one relies upon it in the future. However, it’s a well-worn adage in the world of the Web Public Key Infrastructure (the Web PKI) that revocation is broken. Over the history of the Web PKI, there have been two primary mechanisms for declaring that a TLS/SSL certificate should no longer be trusted: Certificate Revocation Lists (CRLs) and the Online Certificate Status Protocol (OCSP). Unfortunately, both have major drawbacks.
CRLs are basically just lists of all of the certificates that a given Certificate Authority (CA) has issued which have been revoked. This means that they’re often very large – easily the size of a whole movie. It’s inefficient for your browser to download a giant list of revoked certificates just to check if the single certificate for the site you’re visiting right now is revoked. These slow downloads and checks made web page loads slow, so OCSP was developed as an alternative.
OCSP is sort of like “what if there were a separate CRL for every single certificate”: when you want to check whether a given certificate has been revoked, your browser can check the status for just that one certificate by contacting the CA’s OCSP service. But because OCSP infrastructure has to be running constantly and can suffer downtime just like any other web service, most browsers treat getting no response at all as equivalent to getting a “not revoked” response. This means that attackers can prevent you from discovering that a certificate has been revoked simply by blocking all of your requests for OCSP information. To help reduce load on a CA’s OCSP services, OCSP responses are valid and can be cached for about a week. But this means that clients don’t retrieve updates very frequently, and often continue to trust certificates for a week after they’re revoked. And perhaps worst of all: because your browser makes an OCSP request for every website you visit, a malicious (or legally compelled) CA could track your browsing behavior by keeping track of what sites you request OCSP for.
So both of the existing solutions don’t really work: CRLs are so inefficient that most browsers don’t check them, and OCSP is so unreliable that most browsers don’t check it. We need something better.
One possible solution that has been making headway recently is the idea of proprietary, browser-specific CRLs. Although different browsers are implementing this differently (e.g. Mozilla calls theirs CRLite, and Chrome’s are CRLSets), the basic idea is the same.
Rather than having each user’s browser download large CRLs when they want to check revocation, the browser vendor downloads the CRLs centrally. They process the CRLs into a smaller format such as a Bloom filter, then push the new compressed object to all of the installed browser instances using pre-existing rapid update mechanisms. Firefox, for example, is pushing updates as quickly as every 6 hours.
This means that browsers can download revocation lists ahead of time, keeping page loads fast and mitigating the worst problems of vanilla CRLs. It keeps revocation checks local, and the pushed updates can take immediate effect without waiting for a potentially days-long OCSP cache to expire, preventing all of the worst problems with OCSP.
Thanks to the promise of these browser-summarized CRLs, both the Apple and Mozilla root programs are requiring that all CAs begin issuing CRLs before October 1st, 2022. Specifically, they are requiring that CAs begin issuing one or more CRLs which together cover all certificates issued by that CA, and that the list of URLs pointing to those CRLs be disclosed in the Common CA Database (CCADB). This will allow Safari and Firefox to switch to using browser-summarized CRL checking for revocation.
When Let’s Encrypt was founded, we made an explicit decision to only support OCSP and not produce CRLs at all. This was because the root program requirements at the time only mandated OCSP, and maintaining both revocation mechanisms would have increased the number of places where a bug could lead to a compliance incident.
When we set out to develop CRL infrastructure, we knew we needed to build for scale, and do so in a way that reflects our emphasis on efficiency and simplicity. Over the last few months we have developed a few new pieces of infrastructure to enable us to publish CRLs in compliance with the upcoming requirements. Each component is lightweight, dedicated to doing a single task and doing it well, and will be able to scale well past our current needs.
Let’s Encrypt currently has over 200 million active certificates on any given day. If we had an incident where we needed to revoke every single one of those certificates at the same time, the resulting CRL would be over 8 gigabytes. In order to make things less unwieldy, we will be dividing our CRLs into 128 shards, each topping out at a worst-case maximum of 70 megabytes. We use some carefully constructed math to ensure that – as long as the number of shards doesn’t change – all certificates will remain within their same shards when the CRLs are re-issued, so that each shard can be treated as a mini-CRL with a consistent scope.
In line with the same best practices that we follow for our certificate issuance, all of our CRLs will be checked for compliance with RFC 5280 and the Baseline Requirements before they are signed by our issuing intermediates. Although the popular linting library zlint does not yet support linting CRLs, we have written our own collection of checks and hope to upstream them to zlint in the future. These checks will help prevent compliance incidents and ensure a seamless issuance and renewal cycle.
As part of developing these new capabilities, we have also made several improvements to the Go standard library’s implementation of CRL generation and parsing. We look forward to contributing more improvements as we and the rest of the Go community work with CRLs more frequently in the future.
Although we will be producing CRLs which cover all certificates that we issue, we will not be including those URLs in the CRL Distribution Point extension of our certificates. For now, as required by the Baseline Requirements, our certificates will continue to include an OCSP URL which can be used by anyone to obtain revocation information for each certificate. Our new CRL URLs will be disclosed only in CCADB, so that the Apple and Mozilla root programs can consume them without exposing them to potentially large download traffic from the rest of the internet at large.
There’s still a long way to go before revocation in the Web PKI is truly fixed. The privacy concerns around OCSP will only be mitigated once all clients have stopped relying on it, and we still need to develop good ways for non-browser clients to reliably check revocation information.
We look forward to continuing to work with the rest of the Web PKI community to make revocation checking private, reliable, and efficient for everyone.
If you’re excited about our work developing more robust and private revocation mechanisms, you can support us with a donation, or encourage your company or organization to sponsor our work. As a nonprofit project, 100% of our funding comes from contributions from our community and supporters, and we depend on your support.
Post Syndicated from Talks at Google original https://www.youtube.com/watch?v=F4dgIAGg92s
Post Syndicated from Rapid7 original https://blog.rapid7.com/2022/09/06/5-things-rapid7-looks-for-in-a-bdr-and-how-we-spot-them/

Every successful organization has a great salesforce. At Rapid7, the Business Development Representative (BDR) Program is a huge source of talent for our sales organization. Some of our most successful salespeople come from the program. So, what is it?
The BDR Program at Rapid7 is an entry-level program that aims to provide early careerists the opportunity to kickstart their career and grow their selling skills. As a part of the program, new hires develop the skills to uncover opportunities with prospects and customers and partner with account executives to continue to expand their knowledge around the entirety of the sales cycle.
As we gear up to welcome another round of applicants, our Talent Acquisition Partner, Lauren Coloumbe, shares five things we look for in BDRs and how we spot them in the interview process.

Sales gives you an opportunity to flex a lot of different problem-solving muscles. At Rapid7, we believe the key to solving problems effectively is through building strong relationships. Each customer has different needs and priorities, and building a relationship establishes trust and understanding that will help us learn more and determine how Rapid7 can meet those needs.
How we spot it: We’re looking for people who demonstrate a passion for problem-solving and are excited to build relationships. Sharing what you’re passionate about in your career and how a role in sales can help you use these skills is something we want to see.
You don’t have to be a subject matter expert, but showing an interest in our industry is a great way to help you stand out. Our lives are becoming more digital and connected every day. While that comes with a lot of excitement and efficiency, it also opens up a lot of new risks to our information and communities.
How we spot it: Think about real-life examples of cybersecurity threats around you every day and how impactful it can be to play a role in protecting not only our customers, but our communities at large. We love when candidates can make a personal connection to our mission or share something interesting they may have learned when conducting some initial industry research.
We don’t expect you to come in with a ton of industry knowledge, but we do expect you to be prepared to learn, take direction, and ask thoughtful questions. As a BDR, you will be given a lot of opportunities for coaching and development. Being open to learning new things will help you grow and establish a strong foundation.
How we spot it: Natural curiosity drives opportunities for learning. Think of a time when you were especially curious about something or were put in a position where you had to learn a new skill or subject. The interview is also an opportunity for you to express your curiosity. Ask thoughtful questions and let us see your curiosity in action.
At Rapid7, selling is a team sport. You’ll have a group of people in your corner who are invested in your success and ready to lend a helping hand, and you’ll be encouraged to do the same when you get the opportunity. The more we partner together, the better outcomes we can create for our customers and for the company.
How we spot it: There’s nothing wrong with celebrating your wins, but how you got there and how you worked as part of a team are equally important. Share examples of how you worked as a team and either succeeded or failed together. Focus on the effort of the team and the collective impact rather than your own personal role in the process.
Challenging convention means speaking up to share an idea when you feel it can benefit the team. This is a place where everyone is expected to check their ego at the door. This makes it easy for everyone to try new things, fail, learn, and try again. You don’t need to be a manager or a long-time employee to challenge convention, we all have an equal voice when it comes to creating positive customer outcomes.
How we spot it: Think of examples where you stood up for a new or different way of doing things. How did you challenge the status quo or share a new perspective that helped the final outcome?
Learn more about our BDR program and entry-level sales roles at Rapid7.
Additional reading:
Post Syndicated from Poulomi Dasgupta original https://aws.amazon.com/blogs/big-data/cross-account-streaming-ingestion-for-amazon-redshift/
As the most widely used and fastest cloud data warehouse, Amazon Redshift makes it simple and cost-effective to analyze all your data using standard SQL, your existing ETL (extract, transform, and load), business intelligence (BI), and reporting tools quickly and securely. Tens of thousands of customers use Amazon Redshift to analyze exabytes of data per day and power analytics workloads such as BI, predictive analytics, and real-time streaming analytics without having to manage the data warehouse infrastructure. You can also gain up to three times better price performance with Amazon Redshift than other cloud data warehouses.
We are continuously innovating and releasing new features of Amazon Redshift for our customers, enabling the implementation of a wide range of data use cases and meeting requirements with performance and scale. One of the features recently announced is Amazon Redshift Streaming Ingestion for Amazon Kinesis Data Streams and Amazon Managed Streaming for Apache Kafka (Amazon MSK), which lets you experience performance at scale by ingesting real-time streaming data. Amazon Redshift with Kinesis Data Streams is fully managed and runs your streaming applications without requiring infrastructure management. You can use SQL to connect to and directly ingest data from multiple Kinesis data streams simultaneously with low latency and high bandwidth, allowing you to derive insights in seconds instead of minutes.
Previously, loading data from a streaming service like Kinesis Data Streams into Amazon Redshift included several steps. These included connecting the stream to an Amazon Kinesis Data Firehose and waiting for Kinesis Data Firehose to stage the data in Amazon Simple Storage Service (Amazon S3), using various-sized batches at varying-length buffer intervals. After this, Kinesis Data Firehose triggered a COPY command to load the data from Amazon S3 to a table in Amazon Redshift.
Rather than including preliminary staging in Amazon S3, streaming ingestion provides low-latency, high-speed ingestion of stream data from Kinesis Data Streams into an Amazon Redshift materialized view.
In this post, we walk through cross-account Amazon Redshift streaming ingestion by creating a Kinesis data stream in one account, and generating and loading streaming data into Amazon Redshift in a second account within the same Region using role chaining.
The following diagram illustrates our solution architecture.

We demonstrate the following steps to perform cross-account streaming ingestion for Amazon Redshift:
Complete the following steps in Account-1:
my-data-stream -> Monitoring tab.
KinesisStreamPolicy in Account-1.KinesisStreamPolicy and add the following JSON to your policy (provide the AWS account ID for Account-1):
KinesisStreamRole.KinesisStreamPolicy.Complete the following steps in Account-2:
RedshiftStreamPolicy and add the following JSON (provide the AWS account ID for Account-1):
RedshiftStreamRole.RedshiftStreamPolicy to the role.To set up the trust relationship, complete the following steps:
KinesisStreamRole and modify the trust relationship (provide the AWS account ID for Account-2):
To set up streaming ingestion, complete the following steps:
my-data-stream in Account-1.You can now view the results, as shown in the following screenshot.

In this post, we discussed how to set up two different AWS accounts to enable cross-account Amazon Redshift streaming ingestion. It’s simple to get started and you can perform rich analytics on streaming data, right within Amazon Redshift using existing familiar SQL.
For information about how to set up Amazon Redshift streaming ingestion using Kinesis Data Streams in a single account, refer to Real-time analytics with Amazon Redshift streaming ingestion.
 Poulomi Dasgupta is a Senior Analytics Solutions Architect with AWS. She is passionate about helping customers build cloud-based analytics solutions to solve their business problems. Outside of work, she likes travelling and spending time with her family.
 Raks Khare is an Analytics Specialist Solutions Architect at AWS based out of Pennsylvania. He helps customers architect data analytics solutions at scale on the AWS platform.
Post Syndicated from original https://lwn.net/Articles/906859/
Linux Mint 21 “Vanessa” was released
on July 31. There are no real headline-grabbing features that come
with the new release, as the project generally seeks to make incremental
changes, rather than larger, potentially disruptive ones.
Changes in this release include a new Bluetooth manager that brings several
improvements, driverless printing and scanning
by default, a process monitor to inform the user
about resource-intensive background tasks, new functionality for the
Timeshift system backup tool, and several major under-the-hood improvements
to the Cinnamon
desktop environment.
Post Syndicated from Pat Patterson original https://www.backblaze.com/blog/lights-camera-custom-action-integrating-frame-io-with-backblaze-b2/
At Backblaze, we love hearing from our customers about their unique and varied storage needs. Our media and entertainment customers have some of the most interesting use cases and often tell us about their workflow needs moving assets at every stage of the process, from camera to post-production and everywhere in between.
The desire to have more flexibility controlling data movement in their media management systems is a consistent theme. In the interest of helping customers with not just storing their data, but using their data, today we are publishing a new open-source custom integration we have created for Frame.io. Read on to learn more about how to use Frame.io to streamline your media workflows.
Frame.io, an Adobe company, has built a cloud-based media asset management (MAM) platform allowing creative professionals to collaborate at every step of the video production process. For example, videographers can upload footage from the set after each take; editors can work with proxy files transcoded by Frame.io to speed the editing process; and production staff can share sound reports, camera logs, and files like Color Decision Lists.
Creative professionals who use Frame.io know that it can be a powerful tool for content collaboration. Many of those customers also leverage Backblaze B2 for long-term archive, and often already have large asset inventories in Backblaze B2 as well.
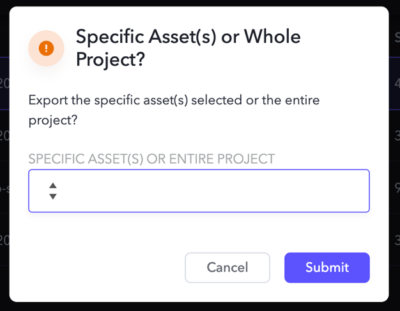
What our Backblaze B2 Custom Action for Frame.io does is quite simple: it allows you to quickly move data between Backblaze B2 and Frame.io. Media professionals can use the action to export selected assets or whole projects from Frame.io to B2 Cloud Storage, and then later import exported assets and projects from B2 Cloud Storage back to Frame.io.
Let’s take a quick look at how to use the custom action:
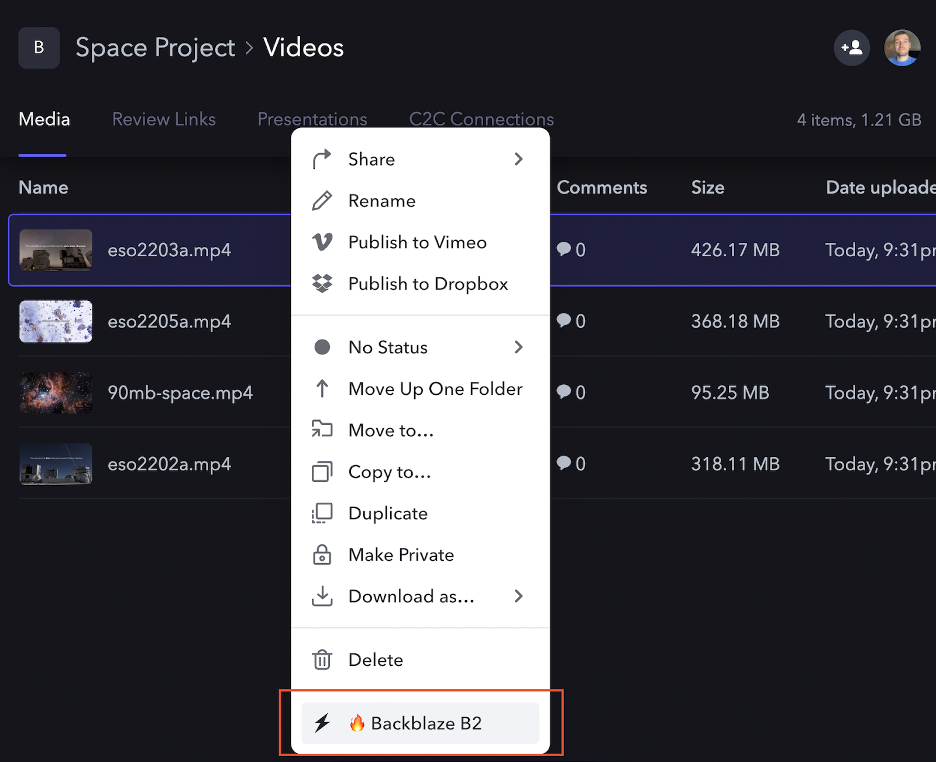
As you can see, after enabling the Custom Action, a new option appears in the asset context dropdown. Once you select the action, you are presented with a dialog to select Import or Export of data:
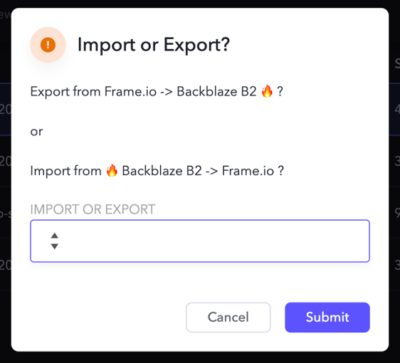
After selecting Export, you can choose whether you want just the single selected asset, or the entire project sent to Backblaze B2.
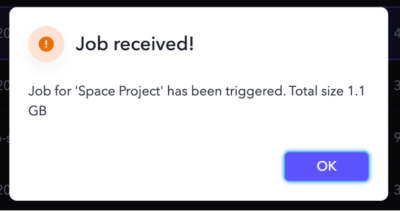
Once you make a selection, that’s it! The custom action handles the movement for you behind the scenes. The export is a point-in-time snapshot of the data from Frame.io—which remains as it was—to Backblaze B2.
The Custom Action creates a new exports folder in your B2 bucket, and then uploads the asset(s) to the folder. If you opt to upload the entire Project, it will be structured the same way it is organized in Frame.io.
To get started using the Custom Action described above, you will need:
If you don’t have a Backblaze B2 account yet, you can sign up here and get 10GB free, or contact us here to run a proof of concept with more than 10GB.
We’ve written previously about similar open-sourced custom integrations for other tools, and by releasing this one we are continuing in that same spirit. If you are interested in learning more about this integration, you can jump straight to the source code on GitHub.
Watch this space for a follow-up post diving into more of the technical details. We’ll discuss how we secured the solution, made it deployable anywhere (including to options with free bandwidth), and how you can customize it to your needs.
We would love to hear your feedback on this integration, and also any other integrations you would like to see from Backblaze. Feel free to reach out to us in the comments below or through our social channels. We’re particularly active on Twitter and Reddit—let’s chat!
The post Lights, Camera, Custom Action: Integrating Frame.io with Backblaze B2 appeared first on Backblaze Blog | Cloud Storage & Cloud Backup.
Post Syndicated from Michael Tremante original https://blog.cloudflare.com/cloudflare-waap-named-leader-gartner-magic-quadrant-2022/

Gartner has recognised Cloudflare as a Leader in the 2022 “Gartner® Magic Quadrant™ for Web Application and API Protection (WAAP)” report that evaluated 11 vendors for their ‘ability to execute’ and ‘completeness of vision’.
You can register for a complimentary copy of the report here.
We believe this achievement highlights our continued commitment and investment in this space as we aim to provide better and more effective security solutions to our users and customers.
With over 36 million HTTP requests per second being processed by the Cloudflare global network we get unprecedented visibility into network patterns and attack vectors. This scale allows us to effectively differentiate clean traffic from malicious, resulting in about 1 in every 10 HTTP requests proxied by Cloudflare being mitigated at the edge by our WAAP portfolio.
Visibility is not enough, and as new use cases and patterns emerge, we invest in research and new product development. For example, API traffic is increasing (55%+ of total traffic) and we don’t expect this trend to slow down. To help customers with these new workloads, our API Gateway builds upon our WAF to provide better visibility and mitigations for well-structured API traffic for which we’ve observed different attack profiles compared to standard web based applications.
We believe our continued investment in application security has helped us gain our position in this space, and we’d like to thank Gartner for the recognition.
At Cloudflare, we have built several features that fall under the Web Application and API Protection (WAAP) umbrella.
Our network, which spans more than 275 cities in over 100 countries is the backbone of our platform, and is a core component that allows us to mitigate DDoS attacks of any size.
To help with this, our network is intentionally anycasted and advertises the same IP addresses from all locations, allowing us to “split” incoming traffic into manageable chunks that each location can handle with ease, and this is especially important when mitigating large volumetric Distributed Denial of Service (DDoS) attacks.
The system is designed to require little to no configuration while also being “always-on” ensuring attacks are mitigated instantly. Add to that some very smart software such as our new location aware mitigation, and DDoS attacks become a solved problem.
For customers with very specific traffic patterns, full configurability of our DDoS Managed Rules is just a click away.
Our WAF is a core component of our application security and ensures hackers and vulnerability scanners have a hard time trying to find potential vulnerabilities in web applications.
This is very important when zero-day vulnerabilities become publicly available as we’ve seen bad actors attempt to leverage new vectors within hours of them becoming public. Log4J, and even more recently the Confluence CVE, are just two examples where we observed this behavior. That’s why our WAF is also backed by a team of security experts who constantly monitor and develop/improve signatures to ensure we “buy” precious time for our customers to harden and patch their backend systems when necessary. Additionally, and complementary to signatures, our WAF machine learning system classifies each request providing a much wider view in traffic patterns.
Our WAF comes packed with many advanced features such as leaked credential checks, advanced analytics and alerting and payload logging.
It is no secret that a large portion of web traffic is automated, and while not all automation is bad, some is unnecessary and may also be malicious.
Our Bot Management product works in parallel to our WAF and scores every request with the likelihood of it being generated by a bot, allowing you to easily filter unwanted traffic by deploying a WAF Custom Rule, all this backed by powerful analytics. We make this easy by also maintaining a list of verified bots that can be used to further improve a security policy.
In the event you want to block automated traffic, Cloudflare’s managed challenge ensures that only bots receive a hard time without impacting the experience of real users.
API traffic, by definition, is very well-structured relative to standard web pages consumed by browsers. At the same time, APIs tend to be closer abstractions to back end databases and services, resulting in increased attention from malicious actors and often go unnoticed even to internal security teams (shadow APIs).
API Gateway, that can be layered on top of our WAF, helps you both discover API endpoints served by your infrastructure, as well detect potential anomalies in traffic flows that may indicate compromise, both from a volumetric and sequential perspective.
The nature of APIs also allows API Gateway to much more easily provide a positive security model contrary to our WAF: only allow known good traffic and block everything else. Customers can leverage schema protection and mutual TLS authentication (mTLS) to achieve this with ease.
Attacks that leverage the browser environment directly can go unnoticed for some time, as they don’t necessarily require the back end application to be compromised. For example, if any third party JavaScript library used by a web application is performing malicious behavior, application administrators and users may be none the wiser while credit card details are being leaked to a third party endpoint controlled by an attacker. This is a common vector for Magecart, one of many client side security attacks.
Page Shield is solving client side security by providing active monitoring of third party libraries and alerting application owners whenever a third party asset shows malicious activity. It leverages both public standards such as content security policies (CSP) along with custom classifiers to ensure coverage.
Page Shield, just like our other WAAP products, is fully integrated on the Cloudflare platform and requires one single click to turn on.
Cloudflare’s new Security Center is the home of the WAAP portfolio. A single place for security professionals to get a broad view across both network and infrastructure assets protected by Cloudflare.
Moving forward we plan for the Security Center to be the starting point for forensics and analysis, allowing you to also leverage Cloudflare threat intelligence when investigating incidents.
Our WAAP portfolio is delivered from a single horizontal platform, allowing you to leverage all security features without additional deployments. Additionally, scaling, maintenance and updates are fully managed by Cloudflare allowing you to focus on delivering business value on your application.
This applies even beyond WAAP, as, although we started building products and services for web applications, our position in the network allows us to protect anything connected to the Internet, including teams, offices and internal facing applications. All from the same single platform. Our Zero Trust portfolio is now an integral part of our business and WAAP customers can start leveraging our secure access service edge (SASE) with just a few clicks.
If you are looking to consolidate your security posture, both from a management and budget perspective, application services teams can use the same platform that internal IT services teams use, to protect staff and internal networks.
We did not build our WAAP portfolio overnight, and over just the past year we’ve released more than five major WAAP portfolio security product releases. To showcase our speed of innovation, here is a selection of our top picks:
Our roadmap is packed with both new application security features and improvements to existing systems. As we learn more about the Internet we find ourselves better equipped to keep your applications safe. Stay tuned for more.
Gartner, “Magic Quadrant for Web Application and API Protection”, Analyst(s): Jeremy D’Hoinne, Rajpreet Kaur, John Watts, Adam Hils, August 30, 2022.
Gartner and Magic Quadrant are registered trademarks of Gartner, Inc. and/or its affiliates in the U.S. and internationally and is used herein with permission. All rights reserved.
Gartner does not endorse any vendor, product or service depicted in its research publications, and does not advise technology users to select only those vendors with the highest ratings or other designation.
Gartner research publications consist of the opinions of Gartner’s research organization and should not be construed as statements of fact. Gartner disclaims all warranties, expressed or implied, with respect to this research, including any warranties of merchantability or fitness for a particular purpose.
Post Syndicated from Talks at Google original https://www.youtube.com/watch?v=-e_pAu4XM7U
Post Syndicated from John Hartman original https://blog.rapid7.com/2022/09/06/5-steps-for-dealing-with-unknown-environments-in-insightvm/

Trying to deal with a large network can be difficult. All too often, engineers and admins don’t know the full scope of their environment and have trouble defining the actual subnets and the systems that exist on those subnets. They know of a couple /24 subnets here or there, but it’s very possible they’re missing a few. Once you get over a couple thousand assets, it can get fairly unruly pretty quick. Different teams own different servers and different network ranges. With regards to InsightVM, how do you know what sites create if you don’t even know what you own?
Luckily, in InsightVM, we can use a little bit of SQL, an overarching site with a ping sweep, and a nifty little tag to help get a handle on things – all outside any third-party software or other management tools you may acquire to help you wrangle in your IP space. This method in InsightVM lets you find all live assets and identify all network spaces being used in your environment. Then, we can correlate this list against our known subnets and begin building out defined sites for scanning. As we create our known sites, we can start whittling down the number of unknown or undefined subnets.
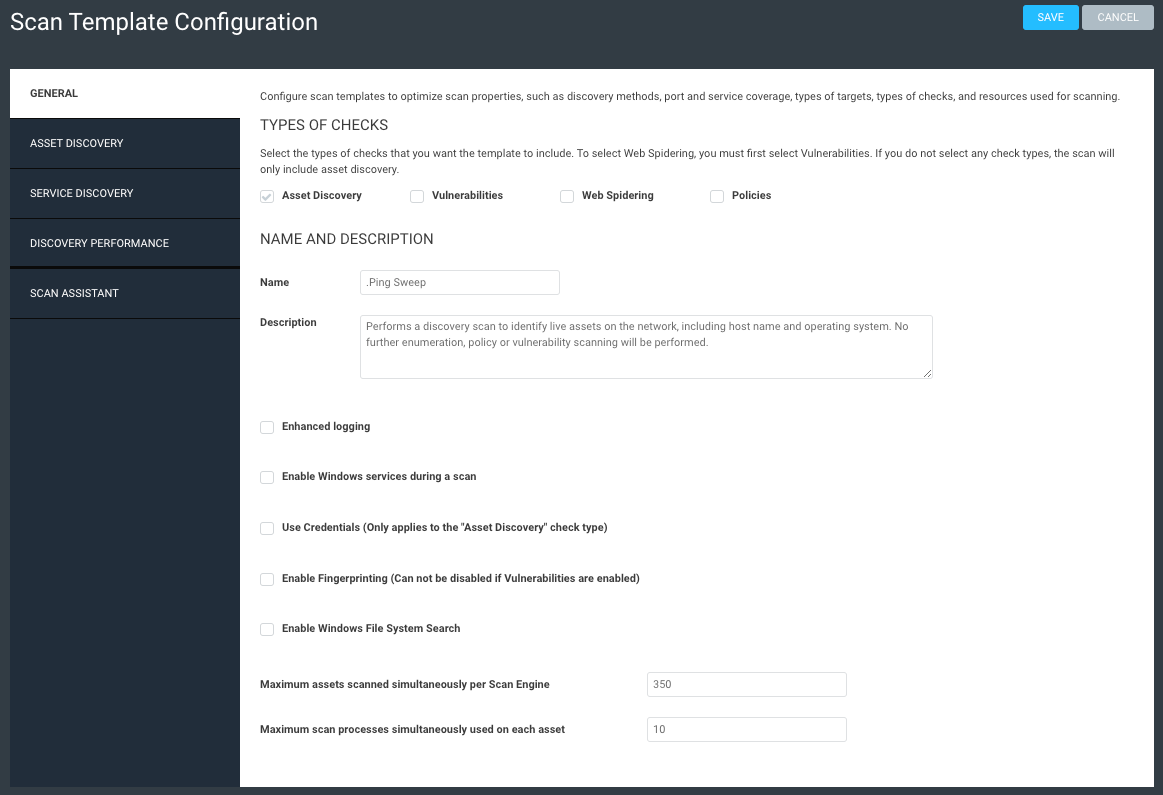
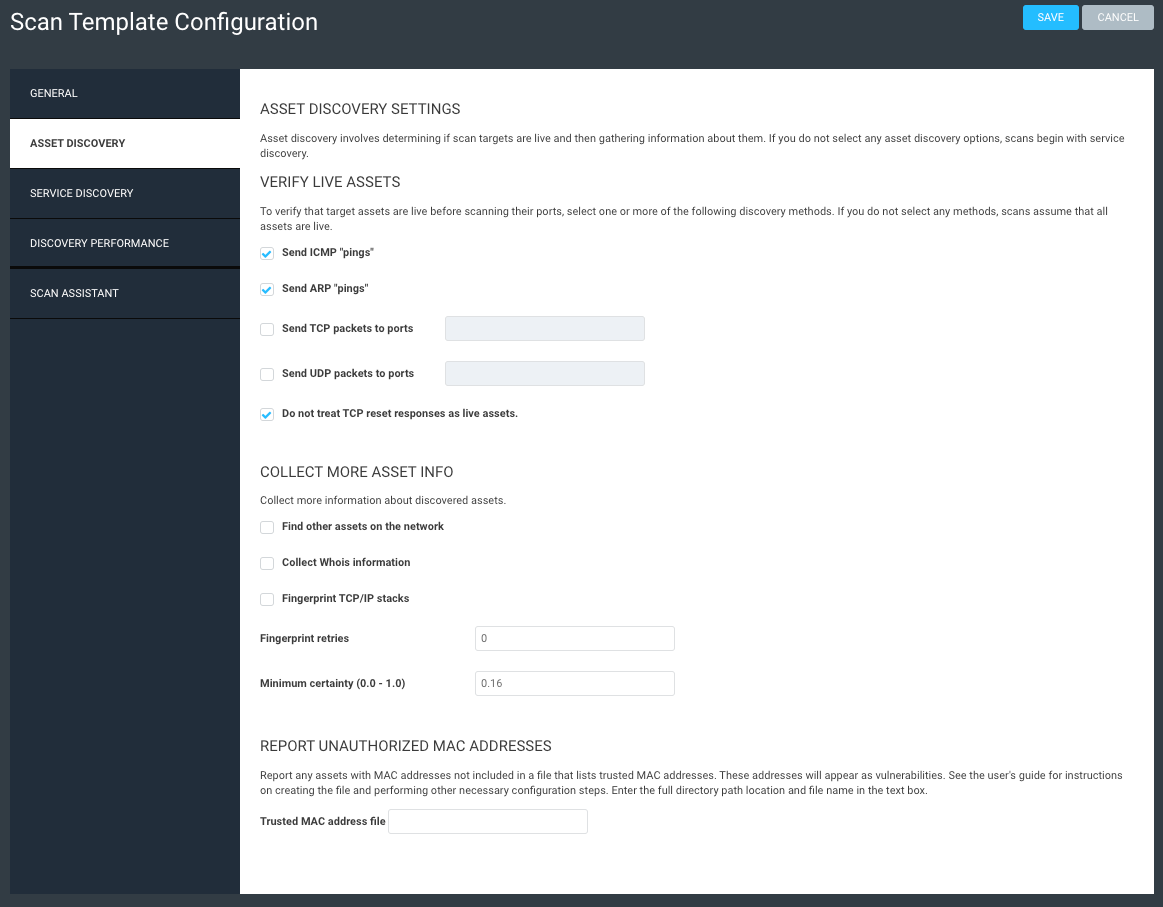
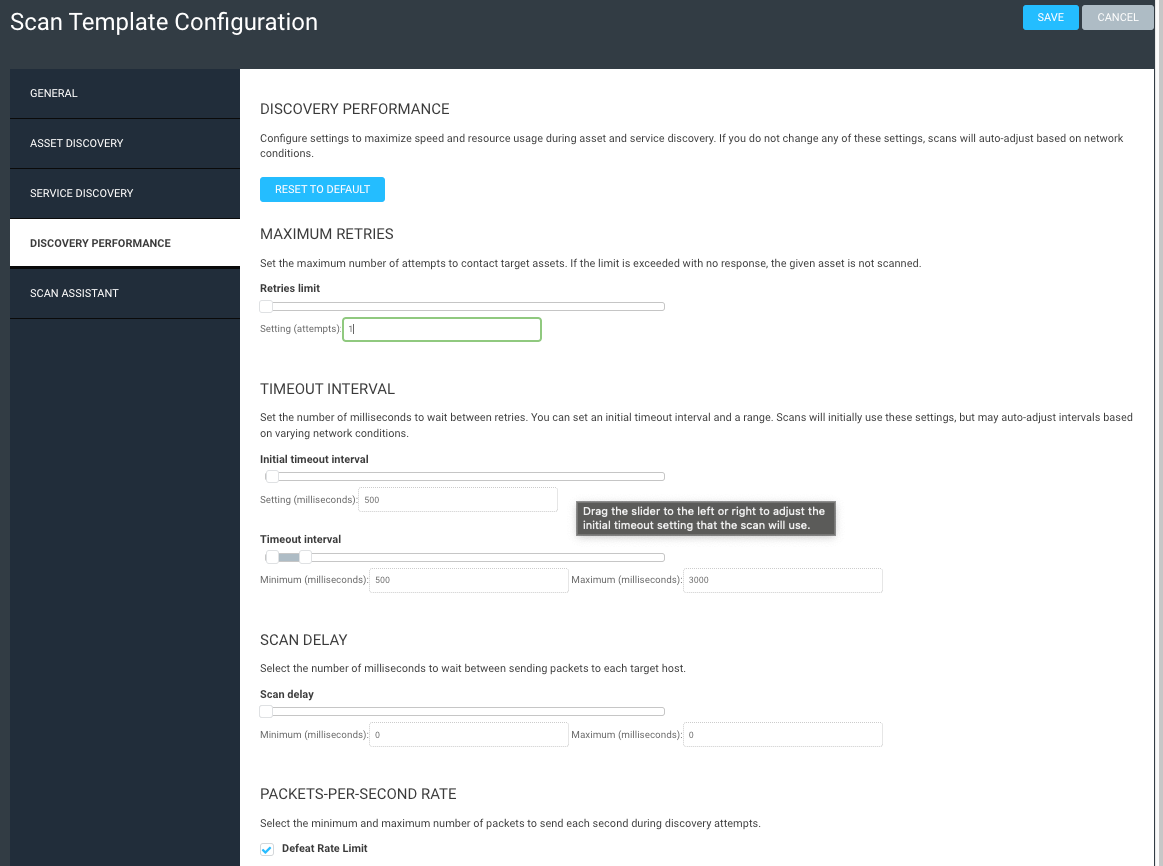
The first step is to create a new scan template dedicated solely to a ping sweep. This template isn’t scanning for any other services or ports, fingerprinting, or performing any other action – it is simply sending pings to see what is alive. If we get a response back, we assume there is a live asset there, and this will help build out our known networks.
Create your template using these screenshots as guidance. Note that pretty much everything is off except ICMP and ARP pings, and we’re not treating TCP resets as live assets (we don’t want firewalls throwing us off). This scan should take just a few minutes to complete, as it’s not doing all the other functions that a typical scan can do.
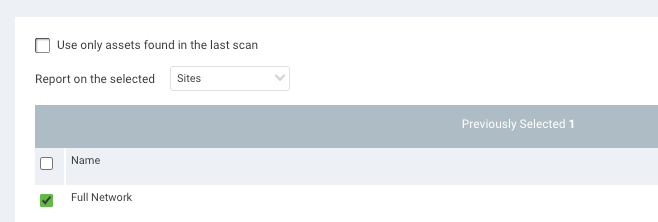
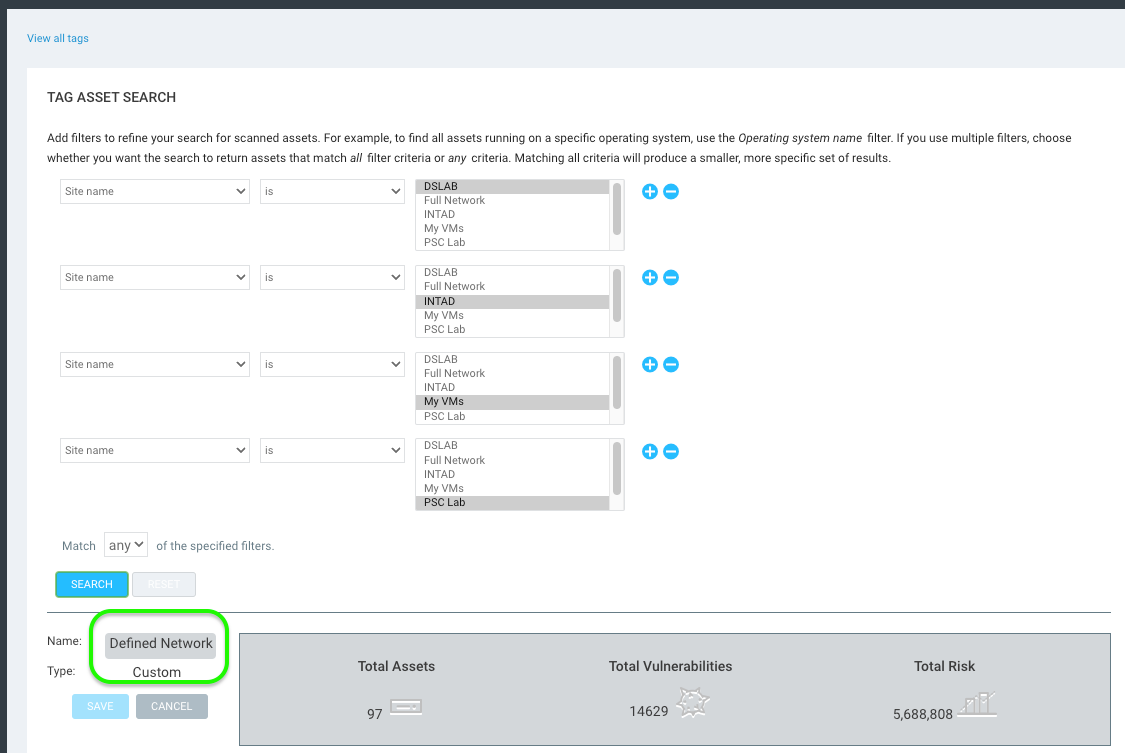
The second step in this process is to create an overarching site. Give it a simple name like “Full Network” or whatever floats your boat. What’s important is that, within this site, you define as large of a network range as you know of. Think /16 here, or even a couple /16 networks. I don’t know your network, so use your judgment as to what you think exists. The idea is to be as broad as possible.
Now, within this site, set the default scan template as your “.Ping Sweep” template, as in my example above. Set your default scan engine or pool, and then save and scan.
What you should get back now is a full list of every live IP that exists within the defined network. If your defined network includes all the possible IP space, and we are assuming that all assets are online and able to respond, then you should have a pretty robust list of found assets.
The next step is to go to the Reports tab and create a SQL Query Export. Throw the following SQL query in the definition, and scope the query from the GUI to your “Full Network” site.
WITH a AS (
SELECT
asset_id,
CONCAT(split_part(ip_address,'.',1),'.',split_part(ip_address,'.',2),'.',split_part(ip_address,'.',3),'.0/24') AS Network
FROM dim_asset
)

SELECT DISTINCT Network
FROM a
ORDER BY Network ASC
Save and run this report, and you will get a CSV output of all the /24 networks that have at least one live IP in them. You can use this CSV to compare to your known list of networks and start defining the actual sites within your environment. For example, if this report lists out 10.0.0.0/24 and you know that network as your main corporate server’s VLAN, then you can include that network into a separate site for vulnerability scanning.
Now that we’ve started defining our known networks into sites, we need to create a dynamic tag that gets applied to all assets within any site. Now, in my example, I exclude the Rapid7 Insight Agents site, because depending on your environment and whether people are working from home, the Insight Agent may report the IP of their computer when logged onto their home network. We obviously can’t scan home networks, so we want to exclude this site to deter any of that bad data.
Create a dynamic tag with several lines to include each site. Note that if your site structure is large enough that you have hundreds of sites, you may want to use the API for this part, but we won’t go into that here – that’s a whole other conversation.
In my example below, I only have four sites – keep in mind I did not select the Rapid7 Insight Agents or my Full Network site. Make sure the operator is set to match ANY of the specified filters. Apply a tag called “Defined Network” to this criteria to tag all assets within a defined site.
You could also optionally create a secondary tag for “Undefined Networks,” but it’s not exactly necessary for this process. The below query would get you the Undefined Network assets. Basically, the query is just looking for any assets that don’t have the Defined Network tag and are not in the Rapid7 Insight Agents sites.
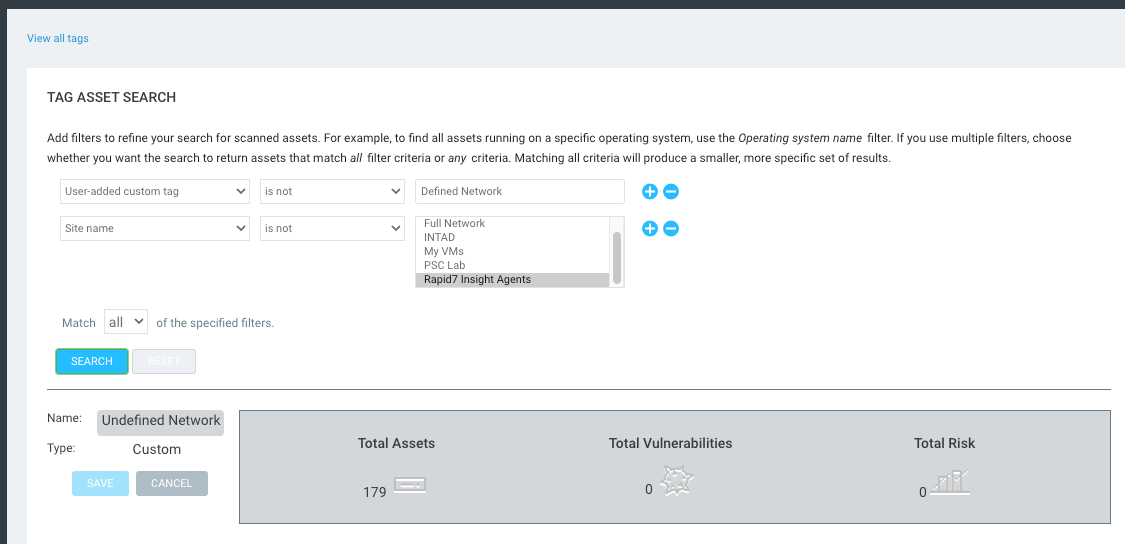
Now, we can set up our secondary SQL report to show us all networks that are not defined within the scope of a site. Once again, go to the Reports tab, create a SQL Query Export report, and throw this query into the definition.
WITH a AS (
SELECT
asset_id,
CONCAT(split_part(ip_address,'.',1),'.',split_part(ip_address,'.',2),'.',split_part(ip_address,'.',3),'.0/24') AS Network
FROM dim_asset
)

SELECT DISTINCT Network
FROM a

WHERE a.asset_id NOT IN (
SELECT DISTINCT asset_id
FROM dim_asset
LEFT JOIN dim_tag_asset USING (asset_id)
LEFT JOIN dim_tag USING (tag_id)
WHERE tag_name = 'Defined Network'
)

ORDER BY Network ASC
Save and run this report, and you will get a new CSV that lists out all /24 networks where there was at least one live asset found but the assets are within a /24 that has not been defined within the scope of a created site. You can use this CSV to work your way through those networks to determine what they are and who owns them and then ensure they are included in future or current sites.
Large environments with unknown network components can be difficult to manage and monitor for vulnerabilities. These five steps in InsightVM help make the process easier and more intuitive, so you can maintain better oversight and a stronger security posture within your environment.
Additional reading:
Post Syndicated from Ariel Deitcher original https://github.blog/2022-09-06-contributing-to-open-source-at-github/
Ariel Deitcher (@mntlty) is a Senior Software Engineer at GitHub, working on Pull Requests and Merge Queue (beta). In this post, he shares the challenges he encountered finding his path to contributing to open source, what it was like contributing to open source at GitHub, and some of the lessons he learned.
As a computer science graduate in 2011 and searching for my first tech job, I read that contributing to an open source project could help. It was a great way to build skills, make industry connections, and gain practical experience with a real-world problem. Perfect, I thought, I’ll just pick an open source project on this new website called GitHub, and, well, actually I wasn’t sure how to do that. Finding that “Goldilocks” project (where the size, language(s), domain, and community felt just right) was a lot harder than I thought, and I didn’t feel self-confident enough to make much progress. Overwhelmed, I decided the timing wasn’t right but resolved to try again someday.
It bugged me that the contribution graph on my GitHub profile remained stubbornly empty, as all the code I had committed lived in private repositories. That changed in 2016 when contributions to private repositories could be shown on my profile, but my contributions to open source had not. Between my family, work, life, and the explosive growth in projects to choose from, making that first contribution to open source felt more daunting than ever.
Fast forward to 2021. I read Working in Public: The Making and Maintenance of Open Source Software by Nadia Eghbal while interviewing at GitHub. I was especially captivated by the Stadium model of open source projects, where a small number of maintainers and occasional contributors are vastly outnumbered by a project’s users. This aligned with my mental model of open source projects, where a few performers on a digital stage would conjure feats of coding wizardry. I could only imagine how vulnerable working in public could be, and hoped it would feel less intimidating working at GitHub.
I joined the GitHub team building Merge Queue (beta), a feature which helps users coordinate their merges to a protected branch, ensures that changes are up to date, and that all required checks pass before automatically merging a pull request. Early on, I shared my long-held goal of contributing code to an open source project with my manager, and discussed the GitHub CLI, an open source tool written in Go which lets users interact with GitHub from the command line, as a possible candidate.
While building Merge Queue, our team carefully integrated it with GitHub’s many APIs and tools, checking each one for compatibility and correctness. Testing different scenarios of merging a pull request with the GitHub CLI, I saw that once a Merge Queue was required, running the CLI command gh pr merge would fail in most cases. The Merge Queue was correctly preventing direct merges to its protected branch, and so I began scoping out what changes the CLI might need to support Merge Queue.
As I didn’t have write access to the CLI repository, I forked it, started a new Codespace, and spent some time getting familiar with the CLI’s contributing guidelines and code. Wanting to minimize my changes, I targeted a few places in the merge command to modify. When I was ready, I pushed a commit to my fork and opened a pull request to share with the CLI maintainers. I expected that I would provide support but defer to them for the final implementation.
In reviewing my pull request with the CLI maintainers, it quickly became clear that my changes were hard to reason about. The merge command had accumulated sufficient technical debt that adding more complexity to it was risky. The team asked if I could refactor the merge command in an initial pull request and follow up with a subsequent pull request for the Merge Queue changes after the first was merged. What I had thought would be a rough guide of changes for the CLI maintainers was, in fact, the opportunity I had been looking for to contribute to open source at GitHub. I confirmed that my manager was onboard with this increased commitment, and was ready to get started.
merge command and adding Merge Queue supportI set out to refactor the merge command with a focus on simplicity, readability, and returning early over deeply nested conditionals. The existing test coverage gave me a confidence boost as I began stepping through the code, copying each section into a separate file for later reference, and wrote comments which I felt captured the intent of the removed section. I then grouped related Git and API operations, consolidated common code into appropriately named functions and variables, trimmed unreachable code paths, created a MergeContext struct to encapsulate state, and leaned into Go’s explicit error returns – all of which gave the code a more linear and consistent structure.
As an example, the mergeRun function, which is the heart of the merge command, went from over 220 lines to just 30:
func mergeRun(opts *MergeOptions) error {
    ctx, err := NewMergeContext(opts)
    if err != nil {
        return err
    }

    // no further action is possible when disabling auto merge
    if opts.AutoMergeDisable {
        return ctx.disableAutoMerge()
    }

    ctx.warnIfDiverged()

    if err := ctx.canMerge(); err != nil {
        return err
    }

    if err := ctx.merge(); err != nil {
        return err
    }

    if err := ctx.deleteLocalBranch(); err != nil {
        return err
    }

    if err := ctx.deleteRemoteBranch(); err != nil {
        return err
    }

    return nil
}
When I was finished, I opened a pull request from my fork to the CLI repository, and was blown away by how supportive the code review process was. After a few rounds of feedback, my code was merged and ready to ship in the next release. I was an open source contributor at GitHub!
Returning to my fork, my original Merge Queue changes were now completely out of date. In fact, much of the code I had on my branch no longer existed on the CLI’s trunk branch. Fortunately, I was now intimately familiar with the merge command and was able to make the Merge Queue changes and tests in a subsequent pull request quickly and with confidence.
Looking back, I learned that searching for the right open source project on my own, trying to create time outside of work, and context switching from my existing projects were obstacles I could not overcome. Instead, the key for me was to find an open source project that was important to what I was already working on, and that I was accountable for. If this sounds familiar, consider asking your manager if you can devote some time to work on an issue in an open source project that you or your team rely on. It’s much easier to get started with an open source project you know and can align with work you’re already committed to. I recognize how fortunate I was to be in the right place at the right time, and with the right support from my manager, but it wasn’t easy.
Many people I know struggle with impostor syndrome, and working in public made me even more aware of mine. I am learning to accept that even though my commits aren’t perfect, and that I’m afraid of being judged for creating bugs like this regression, which will be discoverable forever, I should still contribute. Despite these challenges, I enjoy picking up new issues in the CLI labeled “help wanted (contributions welcome)” whenever I can, and hope you will too!
Post Syndicated from Claire Given original https://www.raspberrypi.org/blog/astro-pi-mission-space-lab-mentor-journey-inspiration-career/
Sobhy Fouda started his Astro Pi journey in 2019 by helping a group of young people participate in Astro Pi Mission Zero, the beginners’ activity of the annual European Astro Pi Challenge. In Mission Zero, participants write a simple computer program that runs on board the International Space Station (ISS).
Seeing the wonder on the faces of the young people on the day when their programs were sent to space motivated Sobhy to take the next step: the year after, he became the mentor of a team of young people who wanted to take part in Astro Pi Mission Space Lab 2020/21. Sobhy supported them for 8 months as they designed and wrote a program to conduct their own scientific experiment on the ISS. The team placed among the 10 winners of Mission Space Lab that year.
Among this winning team was Ismail, who joined Sobhy as a mentor for the next round of Astro Pi Mission Space Lab in 2021/22. We spoke to Sobhy and Ismail about their experiences as mentors, about how being involved in Astro Pi changed their life, and about how when you dream big, you can inspire others to do the same.
“I have always loved space and I had big dreams of becoming a pilot,” said Sobhy. After graduating with a mechatronics engineering degree from the German University in Cairo, he moved to the UK to study aircraft maintenance and aerospace engineering. During this time, Sobhy heard about the Astro Pi Challenge and decided to support some young people in his community to take part in Mission Zero. “It was my first experience with the Astro Pi programme, so it was a great first step for me to teach the team some basic Python skills.”

Sadly, Sobhy was unable to continue down his chosen career path in the UK due to health issues. He said, “It was a very difficult time for me. It was hard to walk away from a dream I had held for so long. I decided to apply for a scholarship within aerospace in Germany, focusing more on writing code, as well as on R&D [research and development].” Sobhy credited his participation as a mentor in Mission Zero as crucial to his success with this next step: “I thoroughly believe that my mentorship of a Mission Zero team helped me to demonstrate my social commitment, which was a significant requirement for the scholarship.”
When Sobhy was awarded the scholarship, he and his wife moved to Berlin, but it was hard for him to find inspiration. This changed when he decided to be an Astro Pi mentor again. “My wife put the word out about it [Astro Pi Mission Space Lab] in my community, and we had a number of young people come forward.”
With help from Sobhy, his Mission Space Lab team started thinking through experiment ideas a couple of months in advance of the challenge start. “Once I had got the kids familiarised with the sensors on the Astro Pi computer and the conditions on the ISS, it was the logical next step to start introducing more Python to learn how to control these sensors and discuss what we could analyse.”

Sobhy’s team successfully submitted an idea for a Mission Space Lab experiment: investigating how the Earth’s magnetic field correlates with its climate, and how this affects near-Earth objects’ behaviour in low-Earth orbit. Next, the team of young people received an Astro Pi hardware kit with which to test the program they wrote in realistic conditions. Sobhy said that “once we received our Astro Pi kit with the sensors, I then used these sensors to make the experiments more relatable to the kids, getting them to measure the humidity in their rooms for example, and I tried to gamify the sessions as much as possible to keep it fun and ignite their imagination.”

One young person on Sobhy’s Mission Space Lab team was Ismail, who was 17 at the time. Ismail explained, “I had some programming experience, as I had worked in Sobhy’s previous teams for Mission Zero, but taking part in Mission Space Lab really helped me to develop these skills in a practical way.”

Ismail was particularly surprised by how much he loved working with the Astro Pi hardware . “I always thought I would follow a career path in programming, however, working with the Raspberry Pi computer and its sensors made me realise that I liked working with the hardware even more than doing programming,” said Ismail. “I ended up changing my choice of degree to mechatronics, so my Mission Space Lab experience really helped me to find the career path I was meant to be on.”
Taking part in Astro Pi Mission Space Lab wasn’t the only thing that shaped Ismail’s path: he credits Sobhy’s mentorship for helping him achieve his goals. “Sobhy was such a good mentor. His passion for the project radiated from him and infected us all! He explained what we needed to tackle, asked questions, and then gave us small activities to put our programming experience into practice in a practical way. It made the programming so much more interesting.”
Sobhy said that when the team was announced among the winners of Mission Space Lab in the 20/21 Astro Pi Challenge, “seeing the team’s reaction was so rewarding. All our hard work paid off, and I was so happy and proud of the team and what they had achieved.” Ismail added, “I still have to pinch myself that we actually won. I’m constantly asking myself if it actually happened, as it was so unbelievable. It was incredible.”

Sobhy has stayed in contact with the young people he mentored in the Astro Pi Challenge and their bond remains strong. Ismail said, “He has really become a friend. He was always so helpful and knowledgeable. I just loved working with him, so when he asked if I wanted to become an assistant Astro Pi mentor, I took the opportunity despite having other commitments.”
Moving on to become a mentor alongside Sobhy in the 2021/22 Astro Pi Challenge was an eye-opening experience for Ismail. “I had to learn a new set of skills,” said Ismail. “In particular, I realised I needed to improve my presentation skills. To start with I was really uncomfortable speaking in front of a group, but now I’m not, and this confidence transferred over to my university studies. That’s been a really great benefit I’ve taken from the experience.”
“[My] Mission Space Lab experience really helped me to find the career path I was meant to be on.”
Ismail, Mission Space Lab participant and mentor
For us it was wonderful to hear about these lasting friendships and connections that have formed among the people participating in Mission Space Lab. Both Sobhy and Ismail felt that while mentoring a Mission Space Lab team can be challenging at times, the rewards are worth it. Watching their team develop and seeing the young people connect made the experience extremely rewarding.
Ismail concluded by saying: “Astro Pi has been one of the best experiences I have had in my life. I have so much to be thankful for, and I owe this to Astro Pi, but even more to my mentor Sobhy. He has encouraged me to have this incredible experience, helped me find my path in life, and guided me every step of the way. I will remember him and be thankful to him for the rest of my life. It’s been life-changing.”
In only a few days, you’ll be able to register as a team mentor for Astro Pi Mission Space Lab 2022/23.
The European Astro Pi Challenge, an ESA education programme in collaboration with us at the Raspberry Pi Foundation, starts again from 12 September. Sign up to the newsletter at astro-pi.org to be the first to hear news about the programme.
The post Astro Pi Mission Space Lab: The journey of two mentors appeared first on Raspberry Pi.
Post Syndicated from original https://lwn.net/Articles/907278/
Version 5.2.0 of the GNU Awk implementation is out. The biggest change,
perhaps, is the addition of “persistent memory” support that allows gawk to
keep values around between runs. Old-timers will be disappointed by
the removal of VAX/VMS support.
Post Syndicated from original https://lwn.net/Articles/907275/
Security updates have been issued by Red Hat (pcs), SUSE (389-ds and firefox), and Ubuntu (linux-hwe-5.4 and linux-oracle).
Post Syndicated from original https://lwn.net/Articles/907238/
Version
22.03.0 of the OpenWrt distribution for routers (and beyond) has been
released. “It incorporates over 3800 commits since branching the
“. Changes include a new firewall implementation using nftables,
previous OpenWrt 21.02 release and has been under development for about one
year
year-2032 readiness, dark mode in the LuCI web-based administration tool,
and support for many more devices.
Post Syndicated from Bozho original https://blog.bozho.net/blog/3940
Вчера пътувах до Ловеч за откриване на кампанията. Пътният знак за „винетка“ и предизборният билборд на ГЕРБ с водач – бившият министър на регионалното развитие и благоустройството Николай Нанков се преплитоха в една тема – тол системата, с която проблемите са твърде много. И смятам че е важно да ги разкажа, както на избирателите в ловешкия избирателен район, така и на всички останали, които пътуваме по републиканската пътна мрежа.
Проблемите са поне четири:
Първият, който засяга гражданите пряко, е липсата на елементарни функционалности на сайта за онлайн винетки на пътната агенция (АПИ). Той не ни известява, когато ни изтече винетката. Трупат ни се глоби за едно и също нарушение, ако сме забравили да си купим нова. И за тях не получаваме известия, макар че сме си оставили имейла. Сайтът работи бавно, а понякога не работи.
За тези проблеми, като министър, изпратих писмо до АПИ още през февруари, за да добавят тези прости, но важни за гражданите функционалности. Оттам обещаха, че ще заявят към изпълнителя това да бъде реализирано. За да сме сигурни, че няма да има такива пропуски в никоя система, в проекта на Закон за електронното управление задължаваме всички администрации да уведомяват гражданите за изтичащи документи – не само за винетки, а за лични документи, разрешителни, лицензи и др.
Вторият проблем са грешките (съзнателни или от некомпетентност) при възлагането – сметната палата в свой доклад до Народното събрание установи, че възлагането на втората поръчка е станало в нарушение на Закона за обществените поръчки. Изпълнителят е избран без търг с аргумент, че никой друг не може да поддържа системата. Ако това е вярно, то първият договор не е бил изпълнен, тъй като там има изрични изисквания изходният код да бъде предоставен на АПИ. Това, обаче, не се е случило, а под ръководството на министър Нанков системата е приета, в ущърб на държавата, обвързвайки ни с Капш завинаги.
При първия договор за тол системата има и друг проблем – той е анексиран, с анекс, който не беше публикуван, заради вратичка в ЗОП, чието затваряне предложихме, но не стигна времето да бъде прието. В анекса двете страни се договарят, че от първоначалният обхват ще отпаднат дейности, като за тяхна сметка се добавят други, уж на същата стойност. Липсва обаче остойностяване на отпадналото, като е напълно възможно държавата да е била ощетена и при този анекс – отпада прокарване на оптична свързаност до ГКПП-та, както и известен брой рамки.
Третият проблем е с модела на посредниците, които прибират 7% комисионна от всяка винетка. В доклада на Световната банка, на база на който е изградена тол системата, изрично се казва, че не е целесъобразно посредници (т.нар. НДУ) да продават винетки. Въпреки това, политическото ръководство на МРРБ при ГЕРБ в лицето на министър Нанков променя този модел и посредниците не само продават винетки онлайн, а благодарение на google реклама излизат преди сайта на АПИ (а АПИ не си плаща за реклама). Съответно държавата губи милиони (по оценка на предходен служебен кабинет, около 25 милиона годишно). Самите условия за посредничество са излишно тежки, така че дори телекомите, които имат технически капацитет да изградят връзка с тол системата, минават през трета страна, като така губят част от собствената си комисионна.
На заседание на Министерски съвет веднъж взех думата и казах, че посредниците при продажба на винетки онлайн са напълно излишни и не добавят стойност. Да, пунктове за продажба като бензиностанции, интегрираните мобилни приложения на телекомите и подобни добавят удобство за гражданите и там има смисъл. Но няма никакъв смисъл от няколко сайта за винетки, освен, че едни милиони „отичат“ към частни фирми.
Четвъртият проблем е липсата на технически капацитет в тол управлението. Извън няколкото ИТ експерта, там за толкова години не е изградена достатъчен капацитет за да управлява тол системата. Пример за това е, че въпреки мое изрично писмо като министър, все още в публичния регистър на мрежите (RIPE DB), мрежата на тол управлението се води, че се управлява от единия от подизпълнителите на Капш.
ГЕРБ са направили почти всички възможни грешки при изграждането на тол системата. И правни, и технически, и организационни.
Похарчени са милиони, ежегодно изтичат милиони към посредници, гражданите не получават удобна услуга, а капацитет за нейното поддържане няма. За седемте месеца в управлението, съвместно с МРРБ и АПИ, проведохме няколко срещи, установихме в дълбочина проблемите, предложихме законодателни изменения за част от тях, и предприехме първи стъпки за това онлайн винетките да станат по-удобни за гражданите и да гарантираме устойчивост и независимост от един софтуерен доставчик.
След изборите ще продължим с решаването на тези проблеми, за да спестим главоболия на шофьорите и за да спестим милиони на бюджета.

Материалът Пронлемите на тол системата и техните решения е публикуван за пръв път на БЛОГодаря.
Post Syndicated from original http://www.gatchev.info/blog/?p=2489
Не, не за мен. А за – и от – вероятно най-добрия от живите български фантасти. Вие го познавате още като преводач и на много десетки прекрасни книги.
Начело с „Властелинът на пръстените“ – и всичко друго, написано от Толкин.
Точно така. Този писател е Любомир Николов – Нарви.
Молбата му за помощ – да помогнете да се разпродаде първия том на „Сивият път“ – можете да прочетете в блога му. И – да си го кажем директно – си е жива далавера. За общо 15 лева – на днешните военни цени! – получавате две прекрасни книги. Без да броим и печата „Спасител на Сивият път“.
И без да броим личната благодарност на Любо Николов.
А и вашия собствен интерес. Освен двете чудесни четива, вие плащате и това да има и още. Които също ще си струват. (Представяте ли си Любо Николов да напише нещо лошо?! И аз не мога.)
А, и още нещо. Любо предположи, че не може да продаде книгите си, понеже ги пусна в „Моята библиотека“ (ака Читанка.инфо). Според мен е точно обратното – именно запознанството с книга оттам я продава в днешни времена. Уви, днешният българин най-често не е чувал не само за Любо Николов, а и за Вазов, Яворов, Шекспир и Пушкин. (Съжалявам, ама Николета, Цеца, Васко Жабата, Азис и прочее не са им адекватни заместители. Въпреки че „циганинът“ Азис за разлика от днешния българин е чел Вазов, Яворов, Шекспир и Пушкин, а най-вероятно и Любомир Николов…) Така че нека му покажем, че не е прав – че и тези, които са се запознали с творчеството му оттам, също купуват книги!
Благодаря ви!
Post Syndicated from Danilo Poccia original https://aws.amazon.com/blogs/aws/aws-week-in-review-september-5-2022/
As a new week begins, let’s quickly look back at the most significant AWS news from the previous seven days.
Last Week’s Launches
Here are the launches that got my attention last week:
AWS announces open-sourced credentials-fetcher to simplify Microsoft AD access from Linux containers. You can find more in the What’s New post.
AWS Step Functions now has 14 new intrinsic functions that help you process data more efficiently and make it easier to perform data processing tasks such as array manipulation, JSON object manipulation, and math functions within your workflows without having to invoke downstream services or add Task states.
AWS SAM CLI esbuild support is now generally available. You can now use esbuild in the SAM CLI build workflow for your JavaScript applications.
Amazon QuickSight launches a new user interface for dataset management that replaces the existing popup dialog modal with a full-page experience, providing a clearer breakdown of dataset management categories.
AWS GameKit adds Unity support. With this release for Unity, you can integrate cloud-based game features into Win64, MacOS, Android, or iOS games from both the Unreal and Unity engines with just a few clicks.
AWS and VMware announce VMware Cloud on AWS integration with Amazon FSx for NetApp ONTAP. Read more in Veliswa‘s blog post.
The AWS Region in the United Arab Emirates (UAE) is now open. More info in Marcia‘s blog post.

For a full list of AWS announcements, be sure to keep an eye on the What’s New at AWS page.
Other AWS News
A few more blog posts you might have missed:
Easy analytics and cost-optimization with Amazon Redshift Serverless – Four different use cases of Redshift Serverless are discussed in this post.
Building cost-effective AWS Step Functions workflows – In this blog post, Ben explains the difference between Standard and Express Workflows, including costs, migrating from Standard to Express, and some interesting ways of using both together.
How to subscribe to the new Security Hub Announcements topic for Amazon SNS – You can now receive updates about new Security Hub services and features, newly supported standards and controls, and other Security Hub changes.
Deploying AWS Lambda functions using AWS Controllers for Kubernetes (ACK) – With the ACK service controller for AWS Lambda, you can provision and manage Lambda functions with kubectl and custom resources.
For AWS open-source news and updates, here’s the latest newsletter curated by Ricardo to bring you the most recent updates on open-source projects, posts, events, and more.
Upcoming AWS Events
Depending on where you are on this planet, there are many opportunities to meet and learn:
AWS Summits – Come together to connect, collaborate, and learn about AWS. Registration is open for the following in-person AWS Summits: Ottawa (September 8), New Delhi (September 9), Mexico City (September 21–22), Bogotá (October 4), and Singapore (October 6).
AWS Community Days – AWS Community Day events are community-led conferences to share and learn with one another. In September, the AWS community in the US will run events in the Bay Area, California (September 9) and Arlington, Virginia (September 30). In Europe, Community Day events will be held in October. Join us in Amersfoort, Netherlands (October 3), Warsaw, Poland (October 14), and Dresden, Germany (October 19).
That’s all from me for this week. Come back next Monday for another Week in Review!
— Danilo