Managing and Securing AWS Outposts Instances using AWS Systems Manager, Amazon Inspector, and Amazon GuardDuty

Post Syndicated from sbbusser original https://aws.amazon.com/blogs/compute/managing-and-securing-aws-outposts-instances-using-aws-systems-manager-amazon-inspector-and-amazon-guardduty/

This post is written by Sumeeth Siriyur, Specialist Solutions Architect.

AWS Outposts is a family of fully managed solutions that deliver AWS infrastructure and services to virtually any on-premises or edge location for a truly consistent hybrid experience. Outposts is ideal for workloads that need low latency access to on-premises applications or systems, local data processing, and secure storage of sensitive customer data that must remain anywhere without an AWS region, including inside company-controlled environments or a specific country.

A key feature of Outposts is that it offers the same AWS hardware infrastructure, services, APIs, and tools to build and run your applications on-premises and “in AWS Regions”. Outposts is part of the cloud for a truly consistent hybrid experience. AWS compute, storage, database, and other services run locally on Outposts, and you can access the full range of AWS services available in the Region to build, manage, and scale your on-premises applications using familiar AWS services and tools.

Outposts comes in a variety of form factors, from 1U and 2U servers to 42U Outposts rack. This post focuses on the 42U form factor of Outposts.

This post demonstrates how to use some of the existing AWS services in the Region, such as AWS System Manager (SSM), Amazon Inspector, and Amazon GuardDuty to manage and secure your workload environment on Outposts rack. This is no different from how you use these services for workloads in the AWS Regions.

Solution overview

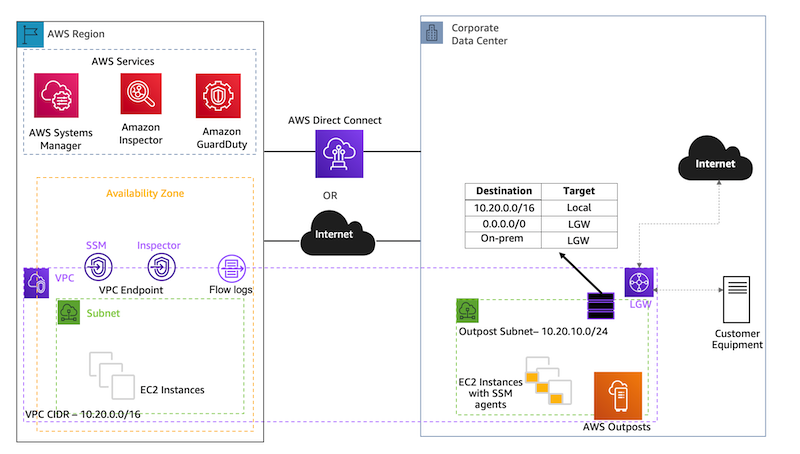
In this scenario, Outposts rack is locally installed in a customer premises. The service link connectivity to the AWS Region can be either via an AWS Direct Connect private virtual interface, a public virtual interface, or the public internet.

The local gateway (LGW) provides connectivity between the Outposts instances and the local on-premises network.

A virtual private cloud (VPC) spans all Availability Zones in its AWS Region. You can extend the VPC in the Region to the Outpost by adding an Outpost subnet. To add an Outpost subnet to a VPC, specify the Amazon Resource Name (ARN) – arn:aws:outposts:region:account-id – of the Outpost when you create the subnet. Outposts rack support multiple subnets. In this scenario, we have extended the VPC from the Region (us-west-2) to the Outpost.

To improve the security posture of the Outposts instance, you can configure AWS SSM to use an interface VPC endpoint in Amazon Virtual Private Cloud (VPC). An interface VPC endpoint lets you connect to services powered by AWS PrivateLink, a technology that lets you privately access AWS SSM APIs by using private IP addresses. See the details in the following AWS SSM section for the VPC endpoints.

Most importantly, to leverage any of the AWS services in the Region, Outposts rack relies on connectivity to the parent AWS Region. Outposts rack is not designed for disconnected operations or environments with limited to no connectivity. We recommend that you have highly-available networking connections back to your AWS Region. For an optimal experience and resiliency, AWS recommends that you use redundant connectivity of at least 500 Mbps (1 Gbps or higher) for the service link connection to the AWS Region.

An overview of the AWS Outposts setup and connectivity back to the region.

Outposts offers a consistent experience with the same hardware infrastructure, services, APIs, management, and operations on-premises as in the AWS Regions. Unlike other hybrid solutions that require different APIs, manual software updates, and purchase of third-party hardware and support, Outposts enables developers and IT operations teams to achieve the same pace of innovation across different environments.

In the first section, let’s see how we can use AWS SSM services for managing and operating Outposts instances.

Managing Outposts instances using AWS SSM

The Amazon Systems Manager Agent (SSM Agent) is installed and running on the Outposts instances.

SSM Agent is installed by default on Amazon Linux, Amazon Linux 2, Ubuntu Server16.04 and Ubuntu Server 18.04 LTS based Amazon Elastic Compute Cloud (EC2) AMIs. If SSM Agent isn’t preinstalled, then you must manually install the agent. Agent communication with SSM is via TCP port 443.

Linux: Manually install SSM Agent on EC2 instances for Linux

Windows: Manually install SSM Agent on EC2 instances for Windows Server

  1. Create an IAM instance profile for SSM

By default, SSM doesn’t have permission to perform actions on your instances. Grant access by using an AWS Identity and Access Management (IAM) instance profile. An instance profile is a container that passes IAM role information to an Amazon EC2 instance at launch. You can create an instance profile for SSM by attaching one or more IAM policies that define the necessary permissions to a new role or to a role that you already created. Make sure that you follow AWS best practices by having a least-privileges policy created.

  1. Create VPC endpoints for SSM.

a. amazonaws.us-west-2.ssm: The endpoint for the Systems Manager service.

b. amazonaws.us-west-2.ec2messages: Systems Manager uses this endpoint to make calls from the SSM Agent to the Systems Manager service.

c. amazonaws.us-west-2.ec2: If you’re using Systems Manager to create VSS-enabled snapshots, then you must make sure that you have an endpoint to the EC2 service. Without the EC2 endpoint defined, a call to enumerate attached Amazon Elastic Block Storage (EBS) volumes fails, which causes the Systems Manager command to fail.

d. amazonaws.us-west-2.ssmmessages: This endpoint is for connecting to your instances with a secure data channel using Session Manager.

e. amazonaws.us-west-2.s3: Systems Manager uses this endpoint to update SSM agent, perform patch operation, and for uploading logs into Amazon Simple Storage Service (S3) buckets.

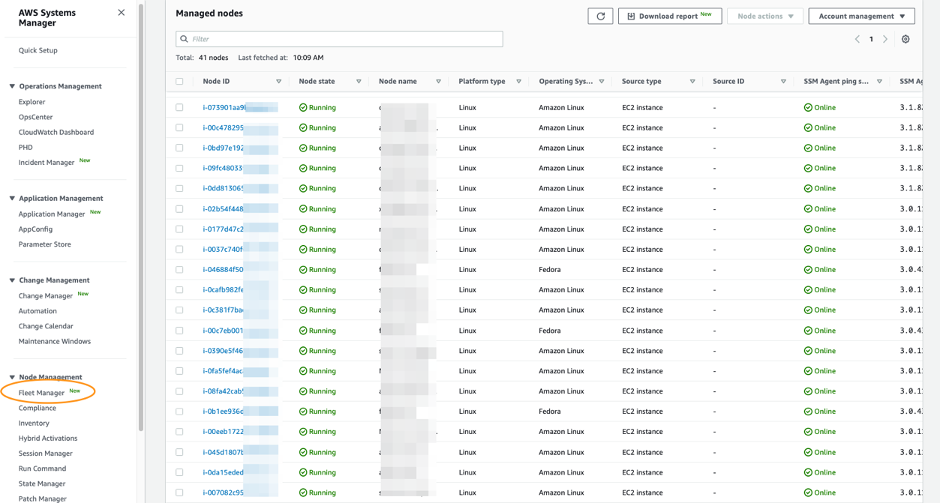
  1. Once the SSM agent has been installed and the necessary permission has been provided for the Systems Manager, log in to Systems Manager Console and navigate to Fleet Manager to discover the Outposts instances as shown in the following image.

Fleet Manager to discover the Outposts instances.

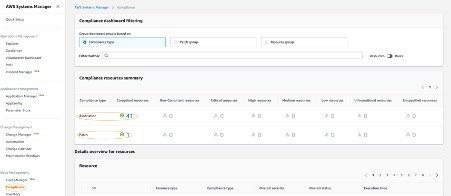
4. You can use compliance to scan the Outposts instances for patch compliance and configuration inconsistencies.

Compliance to scan the Outposts instances for patch compliance and configuration inconsistencies.

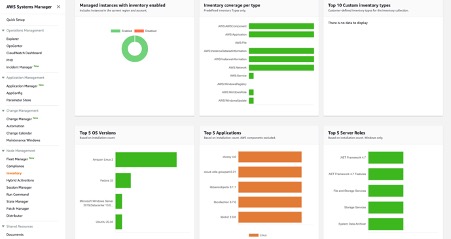
5. AWS Systems Manager Inventory provides visibility into your Outposts computing environment. You can use this inventory to collect metadata about the instances.

AWS SSM inventory to collect metadata about the instances.

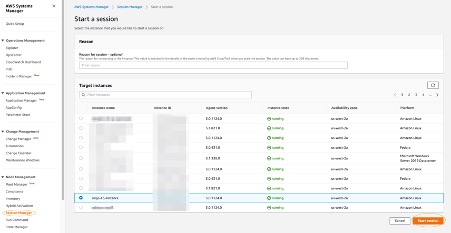
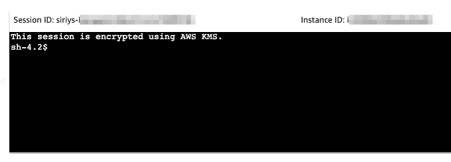
6. With Session Manager, you can log into your Outposts instances. You can use either an interactive one-click browser-based shell, or the AWS Command Line Interface (CLI) for Linux based EC2 instances. For Windows instances, you can connect using Remote Desktop Protocol (RDP). For better SEO, suggest replacing this with “Check out”, attach the link to “how to connect to Windows instances from the Fleet Manager console”, and delete can be found here. here.

Note that accessing the Outposts EC2 instances through SSH or RDP via the Region based Session Manager will have more latency via service link than accessing via the LGW.

Session Manager to connect to Outposts EC2 instances.

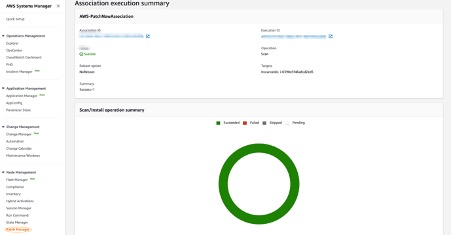
7. Patch Manager automated the process of patching the Outposts instances with both security-related and other types of updates. In the following you can see that one of the Outposts instances is scanned and updated with an operational update.

AWS SSM Patch Manager to patch the Outposts Instances.

Security at AWS is the highest priority. Security is a shared responsibility between AWS and customers. We offer the security tools and procedures to secure the Outposts instances as in the AWS region. By using AWS services, you can enhance your security posture on Outposts rack in these areas.

In the second section, let’s see how we can use Amazon Inspector running in the AWS Region to scan for vulnerabilities within the Outposts environment. Amazon Inspector uses the widely deployed SSM Agent to automatically scan for vulnerabilities on Outposts instances.

Scan Outposts instances for vulnerabilities using Amazon Inspector

Amazon Inspector is an automated vulnerability management service that continually scans AWS workloads for software vulnerabilities and unintended network exposure. Amazon Inspector automatically discovers all of the Outposts EC2 instances (installed with SSM Agent) and container images residing in Amazon Elastic Container Registry (ECR) that are identified for scanning. Then, it immediately starts scanning them for software vulnerabilities and unintended network exposure.

All workloads are continually rescanned when a new Common Vulnerabilities And Exposures (CVE) is published, or when there are changes in the workloads, such as installation of new software in an Outposts EC2 instance.

Amazon Inspector uses the widely deployed SSM Agent (deployed in the previous scenario) to collect the software inventory and configurations from your Outposts EC2 instances. Use the VPC interface endpoint – com.amazonaws.us-west-2.inspector2 – to privately access Amazon Inspector. The collected application inventory and configurations are used to assess workloads for vulnerabilities.

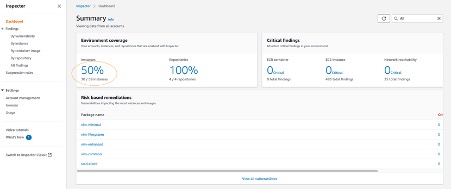
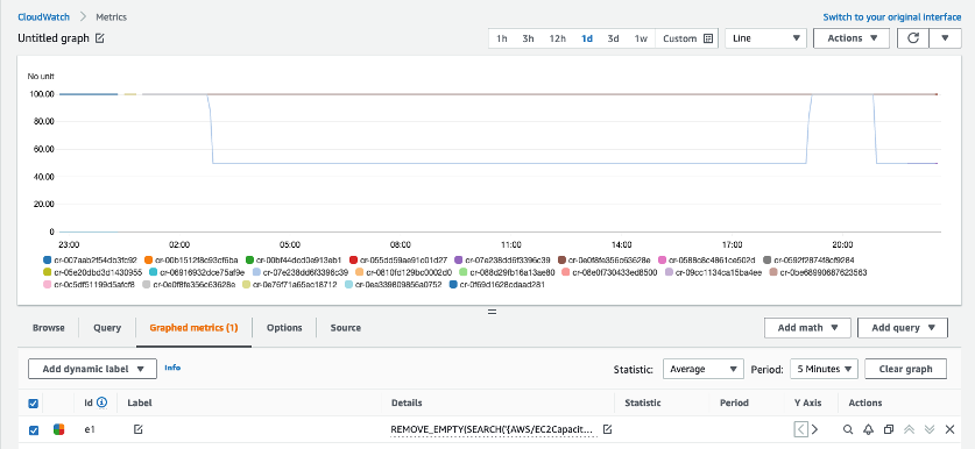
  1. The following Summary Dashboard provides information on how many Outposts EC2 instances and the container repositories are scanned and discovered.

Amazon Inspector Summary Console.

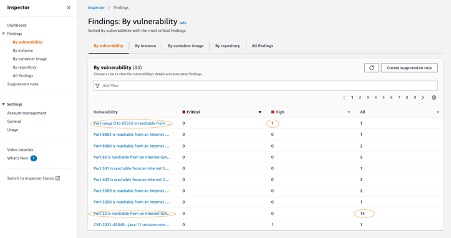
2. The findings by Vulnerability tab help to identify the most vulnerable Outposts EC2 instances in your environment. In the following, you can see Outposts instances with the following vulnerability highlighted.

a. Port range 0 to 65535 is reachable from an Internet Gateway

b. Port 22 is reachable from an Internet Gateway

Amazon Inspector Vulnerability console.

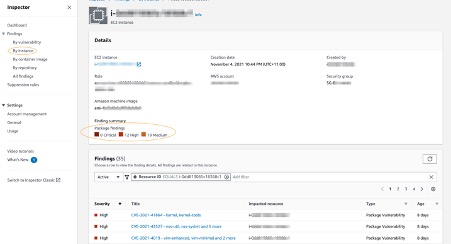
3. The findings by instance tab shows you all of the active findings for a Single Outposts instance in your environment. In the following, you can see that for this instance there are a total of 12 high and 19 medium findings based on the rules in the Common Vulnerabilities And Exposures (CVE) package.

Amazon Inspector Instances Console.

In the last section, let’s see how we can use GuardDuty to detect any threats within the Outposts environment.

Threat Detection service for your AWS accounts and Outposts workloads using Amazon GuardDuty

GuardDuty is a threat detection service that continuously monitors your AWS accounts and workloads for malicious activities and delivers detailed security findings for visibility and remediation.

GuardDuty continuously monitors and analyses the Outposts instances and reports suspicious activities using the GuardDuty console. It gets this information from CloudTrail Management Events, VPC Flow Logs, and DNS logs.

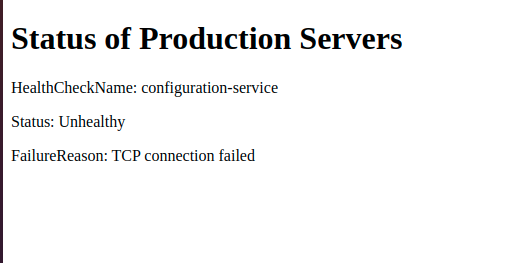
In this scenario, GuardDuty has detected an SSH brute force attack against an Outposts instance.

Amazon GuardDuty threat detection console.

Costs associated with the scenario

  • Systems Manager: With AWS Systems Manager, you pay only for what you use on the priced feature. In this scenario, we have used the following features.
    1. Inventory – No additional charges
    2. Session Manager – No additional charges
    3. Patch Manager – No additional charges

*Note that there will be charges for the VPC endpoint created.

  • Amazon Inspector: Costs for Amazon Inspector are based on container images scanned to ECR and the EC2 instances being scanned.
    1. The average number of EC2 instances scanned per month in US-WEST-2 region is $1.258 per instance. In the above scenario, there are three instances within the Outposts at $1.258 = $3.774
  • Amazon GuardDuty: VPC Flow logs and CloudWatch logs are used for GuardDuty analysis. In this scenario, Only VPC Flow logs are considered.
    1. VPC Flow log is charged per GB/month. In US-WEST-2 region – the First 500 GB/month is $1 per GB. In the above scenario, there are three instances within the Outposts that would generate approximately 80 MB of data, which is still within the 500 GB limit.
  • Understand more about AWS Outposts rack pricing on our website.

Cleaning up

Please delete example resources if they are no longer needed to avoid incurring future costs.

  • Amazon Inspector: Disable Amazon Inspector from the Amazon Inspector Console.
  • Amazon GuardDuty: You can use the GuardDuty console to suspend or disable GuardDuty. You are not charged for using GuardDuty when the service is suspended.
  • Delete unused IAM policies

Conclusion

On-premises data centers traditionally use a variety of infrastructure, tools, and APIs. This disparate assortment of hardware and software solutions results in complexity. In turn, this leads to greater management costs, inability of staff to translate skills from one setting to another, and limits in innovation and knowledge-sharing between environments.

Using a common set of tools, services in the AWS Regions and on Outposts on premises allows you to have a consistent operation environment, thereby delivering a true hybrid cloud experience. Equally, by using the same tools to deploy and manage workloads in both environments, you can reduce operational overhead.

To get started with Outposts, see AWS Outposts Family. For more information about Outposts availability, see the Outposts rack FAQ.

Automate the Creation of On-Demand Capacity Reservations for running EC2 instances

Post Syndicated from sbbusser original https://aws.amazon.com/blogs/compute/automate-the-creation-of-on-demand-capacity-reservations-for-running-ec2-instances/

This post is written by Ballu Singh a Principal Solutions Architect at AWS, Neha Joshi a Senior Solutions Architect at AWS, and Naveen Jagathesan a Technical Account Manager at AWS.

Customers have asked how they can “create On-Demand Capacity Reservations (ODCRs) for their existing instances during events, such as the holiday season, Black Friday, marketing campaigns, or others?”

ODCRs let you reserve compute capacity for your your Amazon Elastic Compute Cloud (Amazon EC2) instances. ODCRs further make sure that you always have EC2 capacity access when required, and for as long as you need it. Customers who want to make sure that any instances that are stopped/started during the critical event and are available when needed should be covered by ODCRs.

ODCRs let you reserve compute capacity for your Amazon EC2 instances in a specific availability zone for any duration. This means that you can create and manage capacity reservations independently from the billing discounts offered by Savings Plans or Regional Reserved Instances. You can create ODCR at any time, without entering into a one-year or three-year term commitment, and the capacity is available immediately. Billing starts as soon as the ODCR enters the active state. When you no longer need it, cancel the ODCR to stop incurring charges.

At the time of this blog publication, if you need to create ODCR for existing running instances, you must manually identify your running instances configuration with matching attributes, such as instance type, platform, and Availability Zone. This is a time and resource consuming process.

In this post, we provide an automated way to manage ODCR operations. This includes creating, modifying, and cancelling ODCRs for the running instances across regions in an account, all without requiring any manual intervention of specifying instance configuration attributes. Additionally, it creates an Amazon CloudWatch Alarm for InstanceUtilization and an Amazon Simple Notification Service (Amazon SNS) topic with topic name ODCRAlarmNotificationTopic to notify when the threshold breaches.

Note: This will not create cluster placement group ODCRs. For details on capacity reservations in cluster placement groups, refer here.

Getting started

Before you create Capacity Reservations, note the limitations and restrictions here.

To get started, download the scripts for registering, modifying, and canceling ODCRs and associated requirements.txt, as well as AWS Identity and Access Management (IAM) policy from the GitHub link here.

Pre-requisites

To implement these scripts, you need the following prerequisites:

  1. Access to AWS Management Console, AWS Command Line Interface (CLI),or AWS SDK for ODCR.
  2. The following IAM role permissions for IAM users using the solution as provided in ODCR_IAM.json.
  3. Amazon EC2 instance having supported platform for capacity reservation. Capacity Reservations support the following platforms listed here for Linux and Windows.
  4. Refer to the above GitHub link for the code, and save the requirements.txt file in the same directory with other python scripts. You may want to run the requirements.txt file if you don’t have appropriate dependency to run the rest of the python scripts. You can run this using the following command:
pip3 install -r requirements.txt

Implementation Details

To create ODCR capacity reservation

The following instructions will guide you through creating a capacity reservation of running instances across all of the Regions within an AWS account.
Input variables needed from users:

  • EndDateType (String) – Indicates how the Capacity Reservation ends. A Capacity Reservation can have one of the following end types:
      • unlimited – The Capacity Reservation remains active until you explicitly cancel it. Don’t provide an EndDate if the EndDateType is unlimited.
      • limited – The Capacity Reservation expires automatically at a specified date and time. You must provide an EndDate value if the EndDateType value is limited.
  • EndDate (datetime) – The date and time when the Capacity Reservation expires. When a Capacity Reservation expires, the reserved capacity is released and you can no longer launch instances into it. The Capacity Reservation’s state changes to expired when it reaches its end date and time.

You must provide EndDateType as ‘limited’ and the EndDate in standard UTC format to secure instances for a limited period. Command to execute register ODCR script with limited period:

You must provide EndDateType as ‘unlimited’ to secure instances for unlimited period. Command to execute register ODCR script with unlimited period:

registerODCR.py '<EndDateType>' '<EndDate>'
    Example- registerODCR.py 'limited' '2022-01-31 14:30:00'
  • You must provide EndDateType as ‘unlimited’ to secure instances for unlimited period. Command to execute register ODCR script with unlimited period:
registerODCR.py 'EndDateType'
    Example- registerODCR.py 'unlimited'

This registerODCR.py script does following four things:

1. Describe instances cross-region in an account. It checks for the instance that has:

    • No Capacity reservation
    • State of the instance is running
    • Tenancy is default
    • InstanceLifecycle is None indicates whether this is a Spot Instance or a Scheduled Instance

Note: Describe instances API call is counted toward your account API limit. Therefore, it is advisable to run the script during non-peak hours or before the short-term scaling event begins. Work with AWS Support team if you run into API throttling.

2. Aggregates instances with similar attributes, such as InstanceType, AvailabilityZone, Tenancy, and Platform.

3. Describe reserved instances cross-region in an account. It checks for instance(s) that have Zonal Reservation Instances (ZRIs) and compares them with aggregated instances with similar attributes.

4. Finally,

    • Reserves ODCR(s) for existing running instances with matching attributes for which ZRIs do not exist.

Note: If you have one or more ZRIs in an account, then the script compares them with the existing instances with matching characteristics – Instance Type, AZ, and Platform – and does NOT create ODCR for the ZRIs to avoid incurring redundant charges. If there are more running instances than ZRIs, then the script creates an ODCR for just the delta.

    • Creates an SNS topic with the topic name – ODCRAlarmNotificationTopic in the region where you’re registering ODCR, if it doesn’t already exist.
    • Creates CloudWatch alarm for InstanceUtilization using the best practices, which can be found here.

Note: You must subscribe and confirm to the SNS topic, if you haven’t already, to receive notifications.

The CloudWatch alarm is also created on your behalf in the region for each ODCR. This alarm monitors your ODCR metric- InstanceUtilization. Whenever it breaches threshold (50% in this case), it enters the alarm state and sends an SNS notification using the topic that was created for you if you subscribed to it.

Note: You can change the alarm threshold based on your specific needs.

  • You will receive an email notification when CloudWatch Alarm State changes to Alarm with:
    • SNS Subject (Assuming CW alarms triggers in US East region).
ALARM: "ODCRAlarm-cr-009969c7abf4daxxx" in US East (N. Virginia)
    • SNS Body will have the details
      • CW alarm, region, link to view the alarm, alarm details, and state change actions.

With this, if your ODCR InstanceUtilization drops, then you will be notified in near-real time to help you optimize the capacity and stop unnecessary payments for unused capacity.

To modify ODCR capacity reservation

To modify the attributes of an active capacity reservation after you have created it, adhere to the following instructions.

Note: When modifying a Capacity Reservation, you can only increase or decrease the quantity and change how it is released. You can’t change the instance type, EBS optimization, instance store settings, platform, Availability Zone, or instance eligibility of a Capacity Reservation. If you must modify any of these attributes, then we recommend that you cancel the reservation, and then create a new one with the required attributes. You can’t modify a Capacity Reservation after it has expired or after you have explicitly canceled it.

  • Input variables needed from users:
    • CapacityReservationID – The ID of the Capacity Reservation that you want to modify.
    • InstanceCount (integer) – The number of instances for which to reserve capacity. The number of instances can’t be increased or decreased by more than 1000 in a single request.
    • EndDateType (String) – Indicates how the Capacity Reservation ends. A Capacity Reservation can have one of the following end types:
      • unlimited – The Capacity Reservation remains active until you explicitly cancel it. Don’t provide an EndDate if the EndDateType is unlimited.
      • limited – The Capacity Reservation expires automatically at a specified date and time. You must provide an EndDate value if the EndDateType value is limited.
    • EndDate (datetime) – The date and time of when the Capacity Reservation expires. When a Capacity Reservation expires, the reserved capacity is released, and you can no longer launch
    • instances into it. The Capacity Reservation’s state changes to expired when it reaches its end date and time.
      Example to run the modify ODCR script for ‘limited’ period:
    • You must provide EndDateType as ‘unlimited’ to modify instances for an unlimited period. Command to the run modify ODCR script with unlimited period:
  • Command to execute modify ODCR script:
    modifyODCR.py <CapacityReservationId> <InstanceCount> <EndDateType> <EndDate> 
  • Example to execute the modify ODCR script for limited period:
modifyODCR.py 'cr-05e6a94b99915xxxx' '1' 'limited' '2022-01-31 14:30:00'

Note: EndDate is in the standard UTC time.

  • You must provide EndDateType as ‘unlimited’ to modify instances for unlimited period. Command to execute modify ODCR script with unlimited period:
modifyODCR.py <CapacityReservationId> <InstanceCount> <EndDateType>
  • Example to execute the modify ODCR script for unlimited period:
modifyODCR.py 'cr-05e6a94b99915xxxx' '1' 'unlimited'

To cancel ODCR capacity reservation

To cancel the ODCR that are in the “Active” state, follow these instructions:

Note: Once the cancellation request succeeds, the reservation status will be marked as “cancelled”.

  • Input variables needed from users:
    • CapacityReservationID – The ID of the Capacity Reservation to cancel.
  • You must provide one parameter while executing the cancellation script.
  • Command to execute cancel ODCR script:
cancelODCR.py <CapacityReservationId> 
  • Example to execute the cancel ODCR script:
Example - cancelODCR.py 'cr-05e6a94b99915xxxx'

Monitoring

CloudWatch metrics let you monitor the unused capacity in your Capacity Reservations to optimize the ODCR. ODCRs send metric data to CloudWatch every five minutes. Although Capacity Reservation usage metrics are UsedInstanceCount, AvailableInstanceCount, TotalInstanceCount, and InstanceUtilization, for this solution we will be using the InstanceUtilization metric. This shows the percentage of reserved capacity instances that are currently in use. This will be useful for monitoring and optimizing ODCR consumption.

For example, if your On-Demand Capacity Reservation is for four instances and with matching criteria only one EC2 instance is currently running, then the InstanceUtilization metric will be 25% for your respective capacity reservation.

Let’s look at the steps to create the CloudWatch monitoring dashboard for your On-Demand Capacity Reservation solution:

  1. Open the CloudWatch console at https://console.aws.amazon.com/cloudwatch/.
  2. If necessary, change the Region. From the navigation bar, select the Region where your Capacity Reservation resides. For more information, see Regions and Endpoints.
  3. In the navigation pane, choose Metrics.

Amazon CloudWatch Dashboard

For All metrics, choose EC2 Capacity Reservations.

Amazon CloudWatch Dashboard: Metrics

4. Choose the metric dimension By Capacity Reservation. Metrics will be grouped by

Amazon CloudWatch Metrics: Capacity Reservation Ids

5. Select the dropdown arrow for InstanceUtilization, and select Search for this only.

Amazon CloudWatch Metrics Filter

Once we see the InstanceUtilization metric in the filter list, select Graph Search.

Amazon CloudWatch Metrics: Graph Search

This displays the InstanceUtilization metrics for the selected period.

Amazon CloudWatch Metrics Duration

OPTIONAL: To display the Capacity Reservation IDs for active metrics only:

    • Navigate to Graphed metrics.

Amazon CloudWatch: Graphed Metrics

    • Under Details column, select Edit math expression.

Amazon CloudWatch Metrics: Math Expression

    • Edit the math expression with the following, and select Apply:
REMOVE_EMPTY(SEARCH('{AWS/EC2CapacityReservations,CapacityReservationId} MetricName="InstanceUtilization"', 'Average', 300))

Amazon CloudWatch Graphed Metrics: Math Expression Apply

This displays the Capacity Reservation IDs for active metrics only.

Amazon CloudWatch Metrics: Active Capacity Reservation Ids

With this configuration, whenever new Capacity Reservations are created, the InstanceUtilization metric for respective Capacity Reservation IDs will be populated.

6. From the Actions drop-down menu, select Add to dashboard.

Amazon CloudWatch Metrics: Add to Dashboard

Select Create new to create a new dashboard for monitoring your ODCR metrics.

Amazon CloudWatch: Creat New Dashboard

Specify the new dashboard name, and select Add to dashboard.

Amazon CloudWatch: Create New Dashboard

7. These configuration steps will navigate you to your newly created CloudWatch dashboard under Dashboards.

Amazon CloudWatch Dashboard: ODCR Metrics

Once this is created, if you create new Capacity Reservations, or new instances get added to existing reservations, then those metrics will be automatically be added to your CloudWatch Dashboard.

Note: You may see a delay of approximately 5-10 minutes from the point when changes are made to your environment (ODCR operations or instances launch/termination activities) to those changes getting reflected on your CloudWatch Dashboard metrics.

Conclusion

In this post, we discussed a solution for automating ODCR operations for existing EC2 instances. This included creating capacity reservation, modifying capacity reservation, and cancelling capacity reservation operations that inherit your existing EC2 instances for attribute details. We also discussed monitoring aspects of ODCR metrics using CloudWatch. This solution allows you to automate some of the ODCR operations for existing instances, thereby optimizing and speeding up the entire process.

For more information, see Target a group of Amazon EC2 On-Demand Capacity Reservations blog and Capacity Reservations documentation.

If you have feedback or questions about this post, please submit your comments in the comments section or contact AWS Support.

Cloudflare’s investigation of the January 2022 Okta compromise

Post Syndicated from John Graham-Cumming original https://blog.cloudflare.com/cloudflare-investigation-of-the-january-2022-okta-compromise/

Cloudflare’s investigation of the January 2022 Okta compromise

Today, March 22, 2022 at 03:30 UTC we learnt of a compromise of Okta. We use Okta internally for employee identity as part of our authentication stack. We have investigated this compromise carefully and do not believe we have been compromised as a result. We do not use Okta for customer accounts; customers do not need to take any action unless they themselves use Okta.

Investigation and actions

Our understanding is that during January 2022, hackers outside Okta had access to an Okta support employee’s account and were able to take actions as if they were that employee. In a screenshot shared on social media, a Cloudflare employee’s email address was visible, along with a popup indicating the hacker was posing as an Okta employee and could have initiated a password reset.

We learnt of this incident via Cloudflare’s internal SIRT. SIRT is our Security Incident Response Team and any employee at Cloudflare can alert SIRT to a potential problem. At exactly 03:30 UTC, a Cloudflare employee emailed SIRT with a link to a tweet that had been sent at 03:22 UTC. The tweet indicated that Okta had potentially been breached. Multiple other Cloudflare employees contacted SIRT over the following two hours.

The following timeline outlines the major steps we took following that initial 03:30 UTC email to SIRT.

Timeline (times in UTC)

03:30 – SIRT receives the first warning of the existence of the tweets.

03:38 – SIRT sees that the tweets contain information about Cloudflare (logo, user information).

03:41 – SIRT creates an incident room to start the investigation and starts gathering the necessary people.

03:50 – SIRT concludes that there were no relevant audit log events (such as password changes) for the user that appears in the screenshot mentioned above.

04:13 – Reached out to Okta directly asking for detailed information to help our investigation.

04:23 – All Okta logs that we ingest into our Security Information and Event Management (SIEM) system are reviewed for potential suspicious activities, including password resets over the past three months.

05:03 – SIRT suspends accounts of users that could have been affected.

We temporarily suspended access for the Cloudflare employee whose email address appeared in the hacker’s screenshots.

05:06 – SIRT starts an investigation of access logs (IPs, locations, multifactor methods) for the affected users.

05:38 – First tweet from Matthew Prince acknowledging the issue.

Because it appeared that an Okta support employee with access to do things like force a password reset on an Okta customer account had been compromised, we decided to look at every employee who had reset their password or modified their Multi-Factor Authentication (MFA) in any way since December 1 up until today. Since Dec. 1, 2021, 144 Cloudflare employees had reset their password or modified their MFA. We forced a password reset for them all and let them know of the change.

05:44 – A list of all users that changed their password in the last three months is finalized. All accounts were required to go through a password reset.

06:40 – Tweet from Matthew Prince about the password reset.

07:57 – We received confirmation from Okta that there were no relevant events that may indicate malicious activity in their support console for Cloudflare instances.

How Cloudflare uses Okta

Cloudflare uses Okta internally as our identity provider, integrated with Cloudflare Access to guarantee that our users can safely access internal resources. In previous blog posts, we described how we use Access to protect internal resources and how we integrated hardware tokens to make our user authentication process more resilient and prevent account takeovers.

In the case of the Okta compromise, it would not suffice to just change a user’s password. The attacker would also need to change the hardware (FIDO) token configured for the same user. As a result it would be easy to spot compromised accounts based on the associated hardware keys.

Even though logs are available in the Okta console, we also store them in our own systems. This adds an extra layer of security as we are able to store logs longer than what is available in the Okta console. That also ensures that a compromise in the Okta platform cannot alter evidence we have already collected and stored.

Okta is not used for customer authentication on our systems, and we do not store any customer data in Okta. It is only used for managing the accounts of our employees.

The main actions we took during this incident were:

  1. Reach out to Okta to gather more information on what is known about the attack.
  2. Suspend the one Cloudflare account visible in the screenshots.
  3. Search the Okta System logs for any signs of compromise (password changes, hardware token changes, etc.). Cloudflare reads the system Okta logs every five minutes and stores these in our SIEM so that if we were to experience an incident such as this one, we can look back further than the 90 days provided in the Okta dashboard. Some event types within Okta that we searched for are: user.account.reset_password, user.mfa.factor.update, system.mfa.factor.deactivate, user.mfa.attempt_bypass, and user.session.impersonation.initiate. It’s unclear from communications we’ve received from Okta so far who we would expect the System Log Actor to be from the compromise of an Okta support employee.
  4. Search Google Workplace email logs to view password resets. We confirmed password resets matched the Okta System logs using a separate source from Okta considering they were breached, and we were not sure how reliable their logging would be.
  5. Compile a list of Cloudflare employee accounts that changed their passwords in the last three months and require a new password reset for all of them. As part of their account recovery, each user will join a video call with the Cloudflare IT team to verify their identity prior to having their account re-enabled.

What to do if you are an Okta customer

If you are also an Okta customer, you should reach out to them for further information. We advise the following actions:

  1. Enable MFA for all user accounts. Passwords alone do not offer the necessary level of protection against attacks. We strongly recommend the usage of hard keys, as other methods of MFA can be vulnerable to phishing attacks.
  2. Investigate and respond:
    a. Check all password and MFA changes for your Okta instances.
    b. Pay special attention to support initiated events.
    c. Make sure all password resets are valid or just assume they are all under suspicion and force a new password reset.
    d. If you find any suspicious MFA-related events, make sure only valid MFA keys are present in the user’s account configuration.
  3. Make sure you have other security layers to provide extra security in case one of them fails.

Conclusion

Cloudflare’s Security and IT teams are continuing to work on this compromise. If further information comes to light that indicates compromise beyond the January timeline we will publish further posts detailing our findings and actions.

We are also in contact with Okta with a number of requests for additional logs and information. If anything comes to light that alters our assessment of the situation we will update the blog or write further posts.

Guidelines for research on the kernel community

Post Syndicated from original https://lwn.net/Articles/888891/

As part of the response to last year’s UMN
fiasco
, Kees Cook and a group of collaborators have put together a set
of guidelines for researchers who are studying how the kernel-development
community (or any development community, really) works. That document has
just been merged into
the mainline
as part
of the 5.18 merge window.

This document seeks to clarify what the Linux kernel community
considers acceptable and non-acceptable practices when conducting
such research. At the very least, such research and related
activities should follow standard research ethics rules.

How Multi-cloud Backups Outage-proof Data

Post Syndicated from Molly Clancy original https://www.backblaze.com/blog/how-multi-cloud-backups-outage-proof-data/

Bob Graw, Director of IT for CallTrackingMetrics, a leading marketing automation platform, put words to a concern that’s increasingly troubling for businesses of all sizes: “If the data center gets wiped out, what happens to our business?”

Lately, high profile cloud outages happen at a regular clip, and the only thing you can count on is that systems will fail at some point. Savvy IT leaders work from that assumption regardless of their primary cloud provider, because they know redundant fail-safes should always be part of your plan.

Bob shared how CallTrackingMetrics outage-proofed their data by establishing a vendor-independent, multi-cloud system. Read on to learn how they did it.

About CallTrackingMetrics

CallTrackingMetrics is a conversation analytics platform that enables marketers to drive data-backed advertising strategies, track every conversion, and optimize ad spend. Customers can discover which marketing campaigns are generating leads and conversions, and use that data to automate lead flows and create better buyer experiences—across all communication channels. More than 100,000 users around the globe trust CallTrackingMetrics to align their sales and marketing teams around every customer touchpoint.

CallTrackingMetrics has been recognized in Inc. Magazine’s 5000™ list of fastest-growing private companies and best places to work, and as a leader on G2 and Gartner for call tracking and marketing attribution software.

Multi-cloud Storage Protects Data From Disasters

As CallTrackingMetrics’ data grew over the years, so did their data backups. They stored more than a petabyte of backups with one vendor. It was a strategy they grew less comfortable with over time. Their concerns included:

  • Operating with a single point of failure.
  • Becoming locked in with one vendor.
  • Maintaining compliance with data regulations.
  • Diversifying their storage infrastructure within budget.
CallTrackingMetrics generates 3TB of backups daily from the volume of data gathered through their platform.

Multi-cloud Solves for a Single Point of Failure

Bob had thought about diversifying CallTrackingMetrics’ storage infrastructure for years, and as outages continued apace, he decided to pull the trigger. He sought out an additional storage vendor where CallTrackingMetrics could store a redundant copy of their backups for disaster recovery and business continuity. “You should always have at least two viable, ready to go backups. It costs real money, but if you can’t come back to life in a disaster scenario, it is basically game over,” Bob explained.

They planned to mirror data from their diversified cloud provider in Backblaze B2, creating a robust multi-cloud strategy. With data backups in two places, they would be better protected from outages and disasters.

“We trust the Backblaze technology. I’d be very surprised if I ever lost data with Backblaze.”
—Bob Graw, Senior Software Engineer, CallTrackingMetrics

Multi-cloud Solves for Vendor Lock-in

Diversifying storage providers came with the added benefit of solving for vendor lock-in. “We did not want to be stuck with one cloud provider forever,” Bob said. Addressing storage was only one part of that strategy, though. They also intentionally avoided using specific services from their diversified cloud vendor like elastic search and databases to keep their data portable. That way, “We could really take our system to anybody that provides compute or storage, and we would be fine,” Bob said.

Solving for Compliance

Some of CallTrackingMetrics’ clients work in highly regulated industries, so compliance with regulations like HIPAA and GDPR was important for them to maintain when searching for a new storage provider. Those regulations stipulate how data is stored, the security protocols in place to protect data, and data retention requirements. “We feel like Backblaze is very secure, and we rely on Backblaze being secure so that our backups are safe and we stay compliant,” Bob said.

CallTrackingMetrics’ analytics console.

Solving for Budget Concerns

Bob and CallTrackingMetrics Founder, Todd Fisher, had both used Backblaze Personal Backup for years, so that familiarity opened the door. But the Backblaze Cloud to Cloud Migration service sealed the deal. Due to high data transfer fees, “Getting out of our previous provider isn’t cheap,” Bob said. But with data transfer fees covered through the Cloud to Cloud Migration service, they addressed one of their primary concerns—staying within budget. On top of an easy migration, after making the switch, Bob saw an immediate 50% savings on his storage bill thanks to Backblaze’s affordable, single-tier pricing.

“With Backblaze, the benefits are threefold: We like the cost savings, we like that our eggs aren’t all in one basket, and Backblaze is super simple to use.”
—Bob Graw, Senior Software Engineer, CallTrackingMetrics

Cloud Storage Helps Leading Marketing Platform Level Up

Now that CallTrackingMetrics has a multi-cloud system to protect their data from outages, they can focus on solving for the next challenge—getting better visibility into their overall cloud usage. With the savings they recouped from moving backups to Backblaze B2, Bob was able to invest in Lacework, software that helps with automation to protect their multi-cloud environment.

Thinking about going multi-cloud but worried about the cost of transferring your data? Check out our Cloud to Cloud Migration service and get started today—the first 10GB are free.

“Backblaze is our ultimate security blanket. We know our big pile of data is safe and sound.”
—Bob Graw, Senior Software Engineer, CallTrackingMetrics

The post How Multi-cloud Backups Outage-proof Data appeared first on Backblaze Blog | Cloud Storage & Cloud Backup.

8 Tips for Securing Networks When Time Is Scarce

Post Syndicated from Erick Galinkin original https://blog.rapid7.com/2022/03/22/8-tips-for-securing-networks-when-time-is-scarce/

8 Tips for Securing Networks When Time Is Scarce

“At this particular mobile army hospital, we’re not concerned with the ultimate reconstruction of the patient. We only care about getting the kid out of here alive enough for someone else to put on the fine touches. We work fast and we’re not dainty, because a lot of these kids who can stand 2 hours on the table just can’t stand one second more. We try to play par surgery on this course. Par is a live patient.” – Hawkeye, M*A*S*H

Recently, CISA released their Shields Up guidance around reducing the likelihood and impact of a cyber intrusion in response to increased risk around the Russia-Ukraine conflict. This week, the White House echoed those sentiments and released a statement about potential impact to Western companies from Russian threat actors. The White House guidance also included a fact sheet identifying urgent steps to take.

Given the urgency of these warnings, many information security teams find themselves scrambling to prioritize mitigation actions and protect their networks. We may not have time to make our networks less flat, patch all the vulnerabilities, set up a backup plan, encrypt all the data at rest, and practice our incident response scenarios before disaster strikes. To that end, we’ve put together 8 tips for “emergency field security” that defenders can take right now to protect themselves.

1. Familiarize yourself with CISA’s KEV, and prioritize those patches

CISA’s Known Exploited Vulnerabilities (KEV) catalog enumerates vulnerabilities that are, as the name implies, known to be exploited in the wild. This should be your first stop for patch remediation.

These vulns are known to be weaponized and effective — thus, they’re likely to be exploited if your organization is targeted and attackers expose one of them in your environment. CISA regularly updates this catalog, so it’s important to subscribe to their update notices and prioritize patching vulnerabilities included in future releases.

2. Keep an eye on egress

Systems, especially those that serve customers or live in a DMZ, are going to see tons of inbound requests – probably too many to keep track of. On the other hand, those systems are going to initiate very few outbound requests, and those are the ones that are far more likely to be command and control.

If you’re conducting hunting, look for signs that the calls may be coming from inside your network. Start keeping track of the outbound requests, and implement a default deny-all outbound rule with exceptions for the known-good domains. This is especially important for cloud environments, as they tend to be dynamic and suffer from “policy drift” far more than internal environments.

3. Review your active directory groups

Now is the perfect time to review active directory group memberships and permissions. Making sure that users are granted access to the minimum set of assets required to do their jobs is critical to making life hard for attackers.

Ideally, even your most privileged users should have regular accounts that they use for the majority of their job, logging into administrator accounts only when it’s absolutely necessary to complete a task. This way, it’s much easier to track privileged users and spot anomalous behavior for global or domain administrators. Consider using tools such as Bloodhound to get a handle on existing group membership and permissions structure.

4. Don’t laugh off LOL

Living off the land (LOL) is a technique in which threat actors use legitimate system tools in attacks. These tools are frequently installed by default and used by systems administrators to do their jobs. That means they’re often ignored or even explicitly allowed by antivirus and endpoint protection software.

You can help protect systems against LOL attacks by configuring logging for Powershell and adding recommended block rules for these binaries unless they are necessary. Refer to the regularly updated (but not comprehensive, as this is a constantly evolving space) list of these at LOLBAS.

5. Don’t push it

If your organization hasn’t mandated multi-factor authentication (MFA) yet, now would be a very good time to require it. Even if you already require MFA, you may need to let users know to immediately report any notifications they did not initiate.

Nobelium, a likely Russian-state sponsored threat actor, has been observed repeatedly sending MFA push notifications to users’ smartphones. Though push notifications are considered more secure than email or SMS notifications due to the need for physical access, it turns out that sending enough requests means many users eventually – either due to annoyance or accident – approve the request, effectively defeating the two-factor authentication.

When you do enable MFA, be sure to regularly review the authentication logs, keeping an eye out for accounts being placed in “recovery” mode, especially for extended periods of time or repeatedly. Also consider using tools or services that monitor the MFA configuration status of your environment to ensure configuration drift (or attackers) have not disabled MFA.

6. Stick to the script

Often, your enterprise’s first line of defense is the help desk. Over the next few days, it’s important that these people feel empowered to enforce your security policies.

Sometimes, people lose their phone and can’t perform their MFA. Other times, their company laptop just up and dies, and they can’t get at their presentation materials on the shared drive. Or maybe they’re sure what their password should be, but today, it just isn’t. It happens. Any number of regular disasters can befall your users, and they’ll turn to your help desk to get them back up and running. Most of the time, these aren’t devious social engineering attacks. They just need help.

Of course, the point of a help desk is to help people. Sometimes, however, the “users” are attackers in disguise, looking for a quick path around your security controls. It can be hard to tell when someone calling in to the help desk is a legitimate user who is pressed for time or an attacker trying to scale the walls. Your help desk folks should be extra wary of these requests — and, more importantly, know they won’t be fired, reprimanded, or retaliated against for following the standard, agreed-upon procedures. It might be a key executive or customer who’s having trouble, and it might not be.

You already have a procedure for resets and re-enrollments, and exceptions to that procedure need to be accompanied by exceptional evidence.

(Hat tip to Bob Lord for bringing this mentality up on a recent Security Nation episode.)

7. Call for backup

Now is the time to make sure you have solid offline backups of:

  • Business-critical data
  • Active Directory (or your equivalent identity store)
  • All network configurations (down to the device level)
  • All cloud service configurations

Continue to refresh these backups moving forward. In addition, make sure your backups are integrity-tested and that you can (quickly) recover them, especially for the duration of this conflict.

8. Practice good posture

While humans will be targeted with phishing attacks, your internet-facing components will also be in the sights of attackers. There are numerous attack surface profiling tools and services out there that help provide an attacker’s-eye view of what you’re exposing and identify any problematic services and configurations — we have one that is free to all Rapid7 customers, and CISA provides a free service to any US organization that signs up. You should review your attack surface regularly to ensure there are no unseen gaps.

While security is a daunting task, especially when faced with guidance from the highest levels of the US government, we don’t necessarily need to check all the boxes today. These 8 steps are a good start on “field security” to help your organization stabilize and prepare ahead of any impending attack.

Additional reading:

NEVER MISS A BLOG

Get the latest stories, expertise, and news about security today.

Get updates on the health of your origin where you need them

Post Syndicated from Darius Jankauskas original https://blog.cloudflare.com/get-updates-on-the-health-of-your-origin-where-you-need-them/

Get updates on the health of your origin where you need them

Get updates on the health of your origin where you need them

We are thrilled to announce the availability of Health Checks in the Cloudflare Dashboard’s Notifications tab, available to all Pro, Business, and Enterprise customers. Now, you can get critical alerts on the health of your origin without checking your inbox! Keep reading to learn more about how this update streamlines notification management and unlocks countless ways to stay informed on the health of your servers.

Keeping your site reliable

We first announced Health Checks when we realized some customers were setting up Load Balancers for their origins to monitor the origins’ availability and responsiveness. The Health Checks product provides a similarly powerful interface to Load Balancing, offering users the ability to ensure their origins meet criteria such as reachability, responsiveness, correct HTTP status codes, and correct HTTP body content. Customers can also receive email alerts when a Health Check finds their origin is unhealthy based on their custom criteria. In building a more focused product, we’ve added a slimmer, monitoring-based configuration, Health Check Analytics, and made it available for all paid customers. Health Checks run in multiple locations within Cloudflare’s edge network, meaning customers can monitor site performance across geographic locations.

What’s new with Health Checks Notifications

Health Checks email alerts have allowed customers to respond quickly to incidents and guarantee minimum disruption for their users. As before, Health Checks users can still select up to 20 email recipients to notify if a Health Check finds their site to be unhealthy. And if email is the right tool for your team, we’re excited to share that we have jazzed up our notification emails and added details on which Health Check triggered the notification, as well as the status of the Health Check:

Get updates on the health of your origin where you need them
New Health Checks email format with Time, Health Status, and Health Check details

That being said, monitoring an inbox is not ideal for many customers needing to stay proactively informed. If email is not the communication channel your team typically relies upon, checking emails can at best be inconvenient and, at worst, allow critical updates to be missed. That’s where the Notifications dashboard comes in.

Users can now create Health Checks notifications within the Cloudflare Notifications dashboard. By integrating Health Checks with Cloudflare’s powerful Notification platform, we have unlocked myriad new ways to ensure customers receive critical updates for their origin health. One of the key benefits of Cloudflare’s Notifications is webhooks, which give customers the flexibility to sync notifications with various external services. Webhook responses contain JSON-encoded information, allowing users to ingest them into their internal or third-party systems.

For real-time updates, users can now use webhooks to send Health Check alerts directly to their preferred instant messaging platforms such as Slack, Google Chat, or Microsoft Teams, to name a few. Beyond instant messaging, customers can also use webhooks to send Health Checks notifications to their internal APIs or their Security Information and Event Management (SIEM) platforms, such as DataDog or Splunk, giving customers a single pane of glass for all Cloudflare activity, including notifications and event logs. For more on how to configure popular webhooks, check out our developer docs. Below, we’ll walk you through a couple of powerful webhook applications. But first, let’s highlight a couple of other ways the update to Health Checks notifications improves user experience.

By including Health Checks in the Notifications tab, users need only to access one page for a single source of truth where they can manage their account notifications.  For added ease of use, users can also migrate to Notification setup directly from the Health Check creation page as well.  From within a Health Check, users will also be able to see what Notifications are tied to it.

Additionally, configuring notifications for multiple Health Checks is now simplified. Instead of configuring notifications one Health Check at a time, users can now set up notifications for multiple or even all Health Checks from a single workflow.

Get updates on the health of your origin where you need them

Also, users can now access Health Checks notification history, and Enterprise customers can integrate Health Checks directly with PagerDuty. Last but certainly not least, as Cloudflare’s Notifications infrastructure grows in capabilities, Health Checks will be able to leverage all of these improvements. This guarantees Health Checks users the most timely and versatile notification capabilities that Cloudflare offers now and into the future.

Setting up a Health Checks webhook

To get notifications for health changes at an origin, we first need to set up a Health Check for it. In this example, we’ll monitor HTTP responses: leave the Type and adjacent fields to their defaults. We will also monitor HTTP response codes: add `200` as an expected code, which will cause any other HTTP response code to trigger an unhealthy status.

Get updates on the health of your origin where you need them

Creating the webhook notification policy

Once we’ve got our Health Check set up, we can create a webhook to link it to. Let’s start with a popular use case and send our Health Checks to a Slack channel. Before creating the webhook in the Cloudflare Notifications dashboard, we enable webhooks in our Slack workspace and retrieve the webhook URL of the Slack channel we want to send notifications to. Next, we navigate to our account’s Notifications tab to add the Slack webhook as a Destination, entering the name and URL of our webhook — the secret will populate automatically.

Get updates on the health of your origin where you need them
Webhook creation page with the following user input: Webhook name, Slack webhook url, and auto-populated Secret

Once we hit Save and Test, we will receive a message in the designated Slack channel verifying that our webhook is working.

Get updates on the health of your origin where you need them
Message sent in Slack via the configured webhook, verifying the webhook is working

This webhook can now be used for any notification type available in the Notifications dashboard. To have a Health Check notification sent to this Slack channel, simply add a new Health Check notification from the Notifications dashboard, selecting the Health Check(s) to tie to this webhook and the Slack webhook we just created. And, voilà! Anytime our Health Check detects a response status code other than 200 or goes from unhealthy to healthy, this Slack channel will be notified.

Get updates on the health of your origin where you need them
Health Check notification sent to Slack, indicating our server is online and Healthy.

Create an Origin Health Status Page

Let’s walk through another powerful webhooks implementation with Health Checks. Using the Health Check we configured in our last example, let’s create a simple status page using Cloudflare Workers and Durable Objects that stores an origin’s health, updates it upon receiving a webhook request, and displays a status page to visitors.

Writing our worker
You can find the code for this example in this GitHub repository, if you want to clone it and try it out.

We’ve got our Health Check set up, and we’re ready to write our worker and durable object. To get started, we first need to install wrangler, our CLI tool for testing and deploying more complex worker setups.

$ wrangler -V
wrangler 1.19.8

The examples in this blog were tested in this wrangler version.

Then, to speed up writing our worker, we will use a template to generate a project:

$ wrangler generate status-page [https://github.com/cloudflare/durable-objects-template](https://github.com/cloudflare/durable-objects-template)
$ cd status-page

The template has a Durable Object with the name Counter. We’ll rename that to Status, as it will store and update the current state of the page.

For that, we update wrangler.toml to use the correct name and type, and rename the Counter class in index.mjs.

name = "status-page"
# type = "javascript" is required to use the `[build]` section
type = "javascript"
workers_dev = true
account_id = "<Cloudflare account-id>"
route = ""
zone_id = ""
compatibility_date = "2022-02-11"
 
[build.upload]
# Upload the code directly from the src directory.
dir = "src"
# The "modules" upload format is required for all projects that export a Durable Objects class
format = "modules"
main = "./index.mjs"
 
[durable_objects]
bindings = [{name = "status", class_name = "Status"}]

Now, we’re ready to fill in our logic. We want to serve two different kinds of requests: one at /webhook that we will pass to the Notification system for updating the status, and another at / for a rendered status page.

First, let’s write the /webhook logic. We will receive a JSON object with a data and a text field. The `data` object contains the following fields:

time - The time when the Health Check status changed.
status - The status of the Health Check.
reason - The reason why the Health Check failed.
name - The Health Check name.
expected_codes - The status code the Health Check is expecting.
actual_code - The actual code received from the origin.
health_check_id - The id of the Health Check pushing the webhook notification. 

For the status page we are using the Health Check name, status, and reason (the reason a Health Check became unhealthy, if any) fields. The text field contains a user-friendly version of this data, but it is more complex to parse.

 async handleWebhook(request) {
  const json = await request.json();
 
  // Ignore webhook test notification upon creation
  if ((json.text || "").includes("Hello World!")) return;
 
  let healthCheckName = json.data?.name || "Unknown"
  let details = {
    status: json.data?.status || "Unknown",
    failureReason: json.data?.reason || "Unknown"
  }
  await this.state.storage.put(healthCheckName, details)
 }

Now that we can store status changes, we can use our state to render a status page:

 async statusHTML() {
  const statuses = await this.state.storage.list()
  let statHTML = ""
 
  for(let[hcName, details] of statuses) {
   const status = details.status || ""
   const failureReason = details.failureReason || ""
   let hc = `<p>HealthCheckName: ${hcName} </p>
         <p>Status: ${status} </p>
         <p>FailureReason: ${failureReason}</p> 
         <br/>`
   statHTML = statHTML + hc
  }
 
  return statHTML
 }
 
 async handleRoot() {
  // Default of healthy for before any notifications have been triggered
  const statuses = await this.statusHTML()
 
  return new Response(`
     <!DOCTYPE html>
     <head>
      <title>Status Page</title>
      <style>
       body {
        font-family: Courier New;
        padding-left: 10vw;
        padding-right: 10vw;
        padding-top: 5vh;
       }
      </style>
     </head>
     <body>
       <h1>Status of Production Servers</h1>
       <p>${statuses}</p>
     </body>
     `,
   {
    headers: {
     'Content-Type': "text/html"
    }
   })
 }

Then, we can direct requests to our two paths while also returning an error for invalid paths within our durable object with a fetch method:

async fetch(request) {
  const url = new URL(request.url)
  switch (url.pathname) {
   case "/webhook":
    await this.handleWebhook(request);
    return new Response()
   case "/":
    return await this.handleRoot();
   default:
    return new Response('Path not found', { status: 404 })
  }
 }

Finally, we can call that fetch method from our worker, allowing the external world to access our durable object.

export default {
 async fetch(request, env) {
  return await handleRequest(request, env);
 }
}
async function handleRequest(request, env) {
 let id = env.status.idFromName("A");
 let obj = env.status.get(id);
 
 return await obj.fetch(request);
}

Testing and deploying our worker

When we’re ready to deploy, it’s as simple as running the following command:

$ wrangler publish --new-class Status

To test the change, we create a webhook pointing to the path the worker was deployed to. On the Cloudflare account dashboard, navigate to Notifications > Destinations, and create a webhook.

Get updates on the health of your origin where you need them
Webhook creation page, with the following user input: name of webhook, destination URL, and optional secret is left blank.

Then, while still in the Notifications dashboard, create a Health Check notification tied to the status page webhook and Health Check.

Get updates on the health of your origin where you need them
Notification creation page, with the following user input: Notification name and the Webhook created in the previous step added.

Before getting any updates the status-page worker should look like this:

Get updates on the health of your origin where you need them
Status page without updates reads: “Status of Production Servers”

Webhooks get triggered when the Health Check status changes. To simulate the change of Health Check status we take the origin down, which will send an update to the worker through the webhook. This causes the status page to get updated.

Get updates on the health of your origin where you need them
Status page showing the name of the Health Check as “configuration-service”, Status as “Unhealthy”, and the failure reason as “TCP connection failed”. 

Next, we simulate a return to normal by changing the Health Check expected status back to 200. This will make the status page show the origin as healthy.

Get updates on the health of your origin where you need them
Status page showing the name of the Health Check as “configuration-service”, Status as “Healthy”, and the failure reason as “No failures”. 

If you add more Health Checks and tie them to the webhook durable object, you will see the data being added to your account.

Authenticating webhook requests

We already have a working status page! However, anyone possessing the webhook URL would be able to forge a request, pushing arbitrary data to an externally-visible dashboard. Obviously, that’s not ideal. Thankfully, webhooks provide the ability to authenticate these requests by supplying a secret. Let’s create a new webhook that will provide a secret on every request. We can generate a secret by generating a pseudo-random UUID with Python:

$ python3
>>> import uuid
>>> uuid.uuid4()
UUID('4de28cf2-4a1f-4abd-b62e-c8d69569a4d2')

Now we create a new webhook with the secret.

Get updates on the health of your origin where you need them
Webhook creation page, with the following user input: name of webhook, destination URL, and now with a secret added.

We also want to provide this secret to our worker. Wrangler has a command that lets us save the secret.

$ wrangler secret put WEBHOOK_SECRET
Enter the secret text you'd like assigned to the variable WEBHOOK_SECRET on the script named status-page:
4de28cf2-4a1f-4abd-b62e-c8d69569a4d2
🌀 Creating the secret for script name status-page
✨ Success! Uploaded secret WEBHOOK_SECRET.

Wrangler will prompt us for the secret, then provide it to our worker. Now we can check for the token upon every webhook notification, as the secret is provided by the header cf-webhook-auth. By checking the header’s value against our secret, we can authenticate incoming webhook notifications as genuine. To do that, we modify handleWebhook:

 async handleWebhook(request) {
  // ensure the request we receive is from the Webhook destination we created
  // by examining its secret value, and rejecting it if it's incorrect
  if((request.headers.get('cf-webhook-auth') != this.env.WEBHOOK_SECRET) {
    return
   }
  ...old code here
 }

This origin health status page is just one example of the versatility of webhooks, which allowed us to leverage Cloudflare Workers and Durable Objects to support a custom Health Checks application. From highly custom use cases such as this to more straightforward, out-of-the-box solutions, pairing webhooks and Health Checks empowers users to respond to critical origin health updates effectively by delivering that information where it will be most impactful.

Migrating to the Notifications Dashboard

The Notifications dashboard is now the centralized location for most Cloudflare services. In the interest of consistency and streamlined administration, we will soon be limiting Health Checks notification setup to the Notifications dashboard.  Many existing Health Checks customers have emails configured via our legacy alerting system. Over the next three months, we will support the legacy system, giving customers time to transition their Health Checks notifications to the Notifications dashboard. Customers can expect the following timeline for the phasing out of existing Health Checks notifications:

  • For now, customers subscribed to legacy emails will continue to receive them unchanged, so any parsing infrastructure will still work. From within a Health Check, you will see two options for configuring notifications–the legacy format and a deep link to the Notifications dashboard.
  • On May 24, 2022, we will disable the legacy method for the configuration of email notifications from the Health Checks dashboard.
  • On June 28, 2022, we will stop sending legacy emails, and adding new emails at the /healthchecks endpoint will no longer send email notifications.

We strongly encourage all our users to migrate existing Health Checks notifications to the Notifications dashboard within this timeframe to avoid lapses in alerts.

White House Warns of Possible Russian Cyberattacks

Post Syndicated from Bruce Schneier original https://www.schneier.com/blog/archives/2022/03/white-house-warns-of-possible-russian-cyberattacks.html

News:

The White House has issued its starkest warning that Russia may be planning cyberattacks against critical-sector U.S. companies amid the Ukraine invasion.

[…]

Context: The alert comes after Russia has lobbed a series of digital attacks at the Ukrainian government and critical industry sectors. But there’s been no sign so far of major disruptive hacks against U.S. targets even as the government has imposed increasingly harsh sanctions that have battered the Russian economy.

  • The public alert followed classified briefings government officials conducted last week for more than 100 companies in sectors at the highest risk of Russian hacks, Neuberger said. The briefing was prompted by “preparatory activity” by Russian hackers, she said.
  • U.S. analysts have detected scanning of some critical sectors’ computers by Russian government actors and other preparatory work, one U.S. official told my colleague Ellen Nakashima on the condition of anonymity because of the matter’s sensitivity. But whether that is a signal that there will be a cyberattack on a critical system is not clear, Neuberger said.
  • Neuberger declined to name specific industry sectors under threat but said they’re part of critical infrastructure ­– a government designation that includes industries deemed vital to the economy and national security, including energy, finance, transportation and pipelines.

President Biden’s statement. White House fact sheet. And here’s a video of the extended Q&A with deputy national security adviser Anne Neuberger.

EDITED TO ADD (3/23): Long — three hour — conference call with CISA.

Sending events to Amazon EventBridge from AWS Organizations accounts

Post Syndicated from James Beswick original https://aws.amazon.com/blogs/compute/sending-events-to-amazon-eventbridge-from-aws-organizations-accounts/

This post is written by Elinisa Canameti, Associate Cloud Architect, and Iris Kraja, Associate Cloud Architect.

AWS Organizations provides a hierarchical grouping of multiple accounts. This helps larger projects establish a central managing system that governs the infrastructure. This can help with meeting budgetary and security requirements.

Amazon EventBridge is a serverless event-driven service that delivers events from customized applications, AWS services, or software as service (SaaS) applications to targets.

This post shows how to send events from multiple accounts in AWS Organizations to the management account using AWS CDK. This uses AWS CloudFormation StackSets to deploy the infrastructure in the member’s accounts.

Solution overview

This blog post describes a centralized event management strategy in a multi-account setup. The AWS accounts are organized by using AWS Organizations service into one management account and many member accounts.  You can explore and deploy the reference solution from this GitHub repository.

In the example, there are events from three different AWS services: Amazon CloudWatch, AWS Config, and Amazon GuardDuty. These are sent from the member accounts to the management account.

The management account publishes to an Amazon SNS topic, which sends emails when these events occur. AWS CloudFormation StackSets are created in the management account to deploy the infrastructure in the member’s accounts.

Overview

To fully automate the process of adding and removing accounts to the organization unit, an EventBridge rule is triggered:

  • When a new account is moved from and in the organization unit (MoveAccount event).
  • When an account is removed from the organization (RemoveAccountFromOrganization event).

These events invoke an AWS Lambda function, which updates the management EventBridge rule with the additional source accounts.

Prerequisites

  1. At least one AWS account, which represents the member’s account.
  2. An AWS account, which is the management account.
  3. Install AWS Command Line (CLI).
  4. Install AWS CDK.

Set up the environment with AWS Organizations

1. Login into the main account used to manage your organization.

2. Select the AWS Organizations service. Choose Create Organization. Once you create the organization, you receive a verification email.

3. After verification is completed, you can add other customer accounts into the organization.

4. AWS sends an invitation to each account added under the root account.

5. To see the invitation, log in to each of the accounts and search for AWS Organization service. You can find the invitation option listed on the side.

6. Accept the invitation from the root account.

7. Create an Organization Unit (OU) and place all the member accounts, which should propagate the events to the management account in this OU. The OU identifier is used later to deploy the StackSet.

8. Finally, enable trusted access in the organization to be able to create StackSets and deploy resources from the management account to the member accounts.

Management account

After the initial deployment of the solution in the management account, a StackSet is created. It’s configured to deploy the member account infrastructure in all the members of the organization unit.

When you add a new account in the organization unit, this StackSet automatically deploys the resources specified. Read the Member account section for more information about resources in this stack.

All events coming from the member account pass through the custom event bus in the management account. To allow other accounts to put events in the management account, the resource policy of the event bus grants permission to every account in the organization:

{
  "Version": "2012-10-17",
  "Statement": [{
    "Sid": "AllowAllAccountsInOrganizationToPutEvents",
    "Effect": "Allow",
    "Principal": "*",
    "Action": "events:PutEvents",
    "Resource": "arn:aws:events:us-east-1:xxxxxxxxxxxx:event-bus/CentralEventBus ",
    "Condition": {
      "StringEquals": {
        "aws:PrincipalOrgID": "o-xxxxxxxx"
      }
    }
  }]
}

You must configure EventBridge in the management account to handle the events coming from the member accounts. In this example, you send an email with the event information using SNS. Create a new rule with the following event pattern:

Event pattern

When you add or remove accounts in the organization unit, an EventBridge rule invokes a Lambda function to update the rule in the management account. This rule reacts to two events from the organization’s source: MoveAccount and RemoveAccountFromOrganization.

Event pattern

// EventBridge to trigger updateRuleFunction Lambda whenever a new account is added or removed from the organization.
new Rule(this, 'AWSOrganizationAccountMemberChangesRule', {
   ruleName: 'AWSOrganizationAccountMemberChangesRule',
   eventPattern: {
      source: ['aws.organizations'],
      detailType: ['AWS API Call via CloudTrail'],
      detail: {
        eventSource: ['organizations.amazonaws.com'],
        eventName: [
          'RemoveAccountFromOrganization',
          'MoveAccount'
        ]
      }
    },
    targets: [
      new LambdaFunction(updateRuleFunction)
    ]
});

Custom resource Lambda function

The custom resource Lambda function is executed to run custom logic whenever the CloudFormation stack is created, updated or deleted.

// Cloudformation Custom resource event
switch (event.RequestType) {
  case "Create":
    await putRule(accountIds);
    break;
  case "Update":
    await putRule(accountIds);
    break;
  case "Delete":
    await deleteRule()
}

async function putRule(accounts) {
  await eventBridgeClient.putRule({
    Name: rule.name,
    Description: rule.description,
    EventBusName: eventBusName,
    EventPattern: JSON.stringify({
      account: accounts,
      source: rule.sources
    })
  }).promise();
  await eventBridgeClient.putTargets({
    Rule: rule.name,
    Targets: [
      {
        Arn: snsTopicArn,
        Id: `snsTarget-${rule.name}`
      }
    ]
  }).promise();
}

Amazon EventBridge triggered Lambda function code

// New AWS Account moved to the organization unit of out it.
if (eventName === 'MoveAccount' || eventName === 'RemoveAccountFromOrganization') {
   await putRule(accountIds);
}

All events generated from the members’ accounts are then sent to a SNS topic, which has an email address as an endpoint. More sophisticated targets can be configured depending on the application’s needs. The targets include, but are not limited to: Step Functions state machine, Kinesis stream, SQS queue, etc.

Member account

In the member account, we use an Amazon EventBridge rule to route all the events coming from Amazon CloudWatch, AWS Config, and Amazon GuardDuty to the event bus created in the management account.

    const rule = {
      name: 'MemberEventBridgeRule',
      sources: ['aws.cloudwatch', 'aws.config', 'aws.guardduty'],
      description: 'The Rule propagates all Amazon CloudWatch Events, AWS Config Events, AWS Guardduty Events to the management account'
    }

    const cdkRule = new Rule(this, rule.name, {
      description: rule.description,
      ruleName: rule.name,
      eventPattern: {
        source: rule.sources,
      }
    });
    cdkRule.addTarget({
      bind(_rule: IRule, generatedTargetId: string): RuleTargetConfig {
        return {
          arn: `arn:aws:events:${process.env.REGION}:${process.env.CDK_MANAGEMENT_ACCOUNT}:event-bus/${eventBusName.valueAsString}`,
          id: generatedTargetId,
          role: publishingRole
        };
      }
    });

Deploying the solution

Bootstrap the management account:

npx cdk bootstrap  \ 
    --profile <MANAGEMENT ACCOUNT AWS PROFILE>  \ 
    --cloudformation-execution-policies arn:aws:iam::aws:policy/AdministratorAccess  \
    aws://<MANAGEMENT ACCOUNT ID>/<REGION>

To deploy the stack, use the cdk-deploy-to.sh script and pass as argument the management account ID, Region, AWS Organization ID, AWS Organization Unit ID and an accessible email address.

sh ./cdk-deploy-to.sh <MANAGEMENT ACCOUNT ID> <REGION> <AWS ORGANIZATION ID> <MEMBER ORGANIZATION UNIT ID> <EMAIL ADDRESS> AwsOrganizationsEventBridgeSetupManagementStack 

Make sure to subscribe to the SNS topic, when you receive an email after the Management stack is deployed.

After the deployment is completed, a stackset starts deploying the infrastructure to the members’ account. You can view this process in the AWS Management Console, under the AWS CloudFormation service in the management account as shown in the following image, or by logging in to the member account, under CloudFormation stacks.

Stack output

Testing the environment

This project deploys an Amazon CloudWatch billing alarm to the member accounts to test that we’re retrieving email notifications when this metric is in alarm. Using the member’s account credentials, run the following AWS CLI Command to change the alarm status to “In Alarm”:

aws cloudwatch set-alarm-state --alarm-name 'BillingAlarm' --state-value ALARM --state-reason "testing only" 

You receive emails at the email address configured as an endpoint on the Amazon SNS topic.

Conclusion

This blog post shows how to use AWS Organizations to organize your application’s accounts by using organization units and how to centralize event management using Amazon EventBridge across accounts in the organization. A fully automated solution is provided to ensure that adding new accounts to the organization unit is efficient.

For more serverless learning resources, visit https://serverlessland.com.

Migrating a self-managed message broker to Amazon SQS

Post Syndicated from Vikas Panghal original https://aws.amazon.com/blogs/architecture/migrating-a-self-managed-message-broker-to-amazon-sqs/

Amazon Payment Services is a payment service provider that operates across the Middle East and North Africa (MENA) geographic regions. Our mission is to provide online businesses with an affordable and trusted payment experience. We provide a secure online payment gateway that is straightforward and safe to use.

Amazon Payment Services has regional experts in payment processing technology in eight countries throughout the Gulf Cooperation Council (GCC) and Levant regional areas. We offer solutions tailored to businesses in their international and local currency. We are continuously improving and scaling our systems to deliver with near-real-time processing capabilities. Everything we do is aimed at creating safe, reliable, and rewarding payment networks that connect the Middle East to the rest of the world.

Our use case of message queues

Our business built a high throughput and resilient queueing system to send messages to our customers. Our implementation relied on a self-managed RabbitMQ cluster and consumers. Consumer is a software that subscribes to a topic name in the queue. When subscribed, any message published into the queue tagged with the same topic name will be received by the consumer for processing. The cluster and consumers were both deployed on Amazon Elastic Compute Cloud (Amazon EC2) instances. As our business scaled, we faced challenges with our existing architecture.

Challenges with our message queues architecture

Managing a RabbitMQ cluster with its nodes deployed inside Amazon EC2 instances came with some operational burdens. Dealing with payments at scale, managing queues, performance, and availability of our RabbitMQ cluster introduced significant challenges:

  • Managing durability with RabbitMQ queues. When messages are placed in the queue, they persist and survive server restarts. But during a maintenance window they can be lost because we were using a self-managed setup.
  • Back-pressure mechanism. Our setup lacked a back-pressure mechanism, which resulted in flooding our customers with huge number of messages in peak times. All messages published into the queue were getting sent at the same time.
  • Customer business requirements. Many customers have business requirements to delay message delivery for a defined time to serve their flow. Our architecture did not support this delay.
  • Retries. We needed to implement a back-off strategy to space out multiple retries for temporarily failed messages.
Figure 1. Amazon Payment Services’ previous messaging architecture

Figure 1. Amazon Payment Services’ previous messaging architecture

The previous architecture shown in Figure 1 was able to process a large load of messages within a reasonable delivery time. However, when the message queue built up due to network failures on the customer side, the latency of the overall flow was affected. This required manually scaling the queues, which added significant human effort, time, and overhead. As our business continued to grow, we needed to maintain a strict delivery time service level agreement (SLA.)

Using Amazon SQS as the messaging backbone

The Amazon Payment Services core team designed a solution to use Amazon Simple Queue Service (SQS) with AWS Fargate (see Figure 2.) Amazon SQS is a fully managed message queuing service that enables customers to decouple and scale microservices, distributed systems, and serverless applications. It is a highly scalable, reliable, and durable message queueing service that decreases the complexity and overhead associated with managing and operating message-oriented middleware.

Amazon SQS offers two types of message queues. SQS standard queues offer maximum throughput, best-effort ordering, and at-least-once delivery. SQS FIFO queues provide that messages are processed exactly once, in the exact order they are sent. For our application, we used SQS FIFO queues.

In SQS FIFO queues, messages are stored in partitions (a partition is an allocation of storage replicated across multiple Availability Zones within an AWS Region). With message distribution through message group IDs, we were able to achieve better optimization and partition utilization for the Amazon SQS queues. We could offer higher availability, scalability, and throughput to process messages through consumers.

Figure 2. Amazon Payment Services’ new architecture using Amazon SQS, Amazon ECS, and Amazon SNS

Figure 2. Amazon Payment Services’ new architecture using Amazon SQS, Amazon ECS, and Amazon SNS

This serverless architecture provided better scaling options for our payment processing services. This helps manage the MENA geographic region peak events for the customers without the need for capacity provisioning. Serverless architecture helps us reduce our operational costs, as we only pay when using the services. Our goals in developing this initial architecture were to achieve consistency, scalability, affordability, security, and high performance.

How Amazon SQS addressed our needs

Migrating to Amazon SQS helped us address many of our requirements and led to a more robust service. Some of our main issues included:

Losing messages during maintenance windows

While doing manual upgrades on RabbitMQ and the hosting operating system, we sometimes faced downtimes. By using Amazon SQS, messaging infrastructure became automated, reducing the need for maintenance operations.

Handling concurrency

Different customers handle messages differently. We needed a way to customize the concurrency by customer. With SQS message group ID in FIFO queues, we were able to use a tag that groups messages together. Messages that belong to the same message group are always processed one by one, in a strict order relative to the message group. Using this feature and a consistent hashing algorithm, we were able to limit the number of simultaneous messages being sent to the customer.

Message delay and handling retries

When messages are sent to the queue, they are immediately pulled and received by customers. However, many customers ask to delay their messages for preprocessing work, so we introduced a message delay timer. Some messages encounter errors that can be resubmitted. But the window between multiple retries must be delayed until we receive delivery confirmation from our customer, or until the retries limit is exceeded. Using SQS, we were able to use the ChangeMessageVisibility operation, to adjust delay times.

Scalability and affordability

To save costs, Amazon SQS FIFO queues and Amazon ECS Fargate tasks run only when needed. These services process data in smaller units and run them in parallel. They can scale up efficiently to handle peak traffic loads. This will satisfy most architectures that handle non-uniform traffic without needing additional application logic.

Secure delivery

Our service delivers messages to the customers via host-to-host secure channels. To secure this data outside our private network, we use Amazon Simple Notification Service (SNS) as our delivery mechanism. Amazon SNS provides HTTPS endpoint delivery of messages coming to topics and subscriptions. AWS enables at-rest and/or in-transit encryption for all architectural components. Amazon SQS also provides AWS Key Management Service (KMS) based encryption or service-managed encryption to encrypt the data at rest.

Performance

To quantify our product’s performance, we monitor the message delivery delay. This metric evaluates the time between sending the message and when the customer receives it from Amazon payment services. Our goal is to have the message sent to the customer in near-real time once the transaction is processed. The new Amazon SQS/ECS architecture enabled us to achieve 200 ms with p99 latency.

Summary

In this blog post, we have shown how using Amazon SQS helped transform and scale our service. We were able to offer a secure, reliable, and highly available solution for businesses. We use AWS services and technologies to run Amazon Payment Services payment gateway, and infrastructure automation to deliver excellent customer service. By using Amazon SQS and Amazon ECS Fargate, Amazon Payment Services can offer secure message delivery at scale to our customers.

Activists are targeting Russians with open-source “protestware” (Technology Review)

Post Syndicated from original https://lwn.net/Articles/888860/

MIT Technology Review has taken
a brief look
at open-source projects that have added changes protesting
the war in Ukraine and drawn some questionable conclusions:

No tech firm has gone that far, but around two dozen open-source
software projects have been spotted adding code protesting the war,
according to observers tracking the protestware
movement. Open-source software is software that anyone can modify
and inspect, making it more transparent—and, in this case at least,
more open to sabotage.

Security updates for Tuesday

Post Syndicated from original https://lwn.net/Articles/888859/

Security updates have been issued by Debian (apache2 and thunderbird), Fedora (abcm2ps, containerd, dotnet6.0, expat, ghc-cmark-gfm, moodle, openssl, and zabbix), Mageia (389-ds-base, apache, bind, chromium-browser-stable, nodejs-tar, python-django/python-asgiref, and stunnel), openSUSE (icingaweb2, lapack, SUSE:SLE-15-SP4:Update (security), and thunderbird), Oracle (openssl), Slackware (bind), SUSE (apache2, bind, glibc, kernel-firmware, lapack, net-snmp, and thunderbird), and Ubuntu (binutils, linux, linux-aws, linux-aws-5.13, linux-gcp, linux-hwe-5.13, linux-kvm, linux-raspi, linux, linux-aws, linux-aws-5.4, linux-azure, linux-azure-5.4, linux-gke, linux-gkeop, linux-hwe-5.4, linux-ibm, linux-ibm-5.4, linux-kvm, linux-oracle, linux-oracle-5.4, and linux, linux-aws, linux-aws-hwe, linux-azure, linux-azure-4.15, linux-dell300x, linux-hwe, linux-gcp-4.15, linux-kvm, linux-oracle, linux-snapdragon).

Zero Trust for SaaS: Deploying mTLS on custom hostnames

Post Syndicated from Dina Kozlov original https://blog.cloudflare.com/zero-trust-for-saas-deploying-mtls-on-custom-hostnames/

Zero Trust for SaaS: Deploying mTLS on custom hostnames

Cloudflare has a large base of Software-as-a-Service (SaaS) customers who manage thousands or millions of their customers’ domains that use their SaaS service. We have helped those SaaS providers grow by extending our infrastructure and services to their customer’s domains through a product called Cloudflare for SaaS. Today, we’re excited to give our SaaS providers a new tool that will help their customers add an extra layer of security: they can now enable mutual TLS authentication on their customer’s domains through our Access product.

Primer on Mutual TLS

When you connect to a website, you should see a lock icon in the address bar — that’s your browser telling you that you’re connecting to a website over a secure connection and that the website has a valid public TLS certificate. TLS certificates keep Internet traffic encrypted using a public/private key pair to encrypt and decrypt traffic. They also provide authentication, proving to clients that they are connecting to the correct server.

To make a secure connection, a TLS handshake needs to take place. During the handshake, the client and the server exchange cryptographic keys, the client authenticates the identity of the server, and both the client and the server generate session keys that are later used to encrypt traffic.

A TLS handshake looks like this:

Zero Trust for SaaS: Deploying mTLS on custom hostnames

In a TLS handshake, the client always validates the certificate that is served by the server to make sure that it’s sending requests to the right destination. In the same way that the client needs to authenticate the identity of the server, sometimes the server needs to authenticate the client — to ensure that only authorized clients are sending requests to the server.

Let’s say that you’re managing a few services: service A writes information to a database. This database is absolutely crucial and should only have entries submitted by service A. Now, what if you have a bug in your system and service B accidentally makes a write call to the database?

You need something that checks whether a service is authorized to make calls to your database — like a bouncer. A bouncer has a VIP list — they can check people’s IDs against the list to see whether they’re allowed to enter a venue. Servers can use a similar model, one that uses TLS certificates as a form of ID.

In the same way that a bouncer has a VIP list, a server can have a Certificate Authority (CA) Root from which they issue certificates. Certificates issued from the CA Root are then provisioned onto clients. These client certificates can then be used to identify and authorize the client. As long as a client presents a valid certificate — one that the server can validate against the Root CA, it’s allowed to make requests. If a client doesn’t present a client certificate (isn’t on the VIP list) or presents an unauthorized client certificate, then the server can choose to reject the request. This process of validating client and server certificates is called mutual TLS authentication (mTLS) and is done during the TLS handshake.

When mTLS isn’t used, only the server is responsible for presenting a certificate, which the client verifies. With mTLS, both the client and the server present and validate one another’s certificates, pictured below.

Zero Trust for SaaS: Deploying mTLS on custom hostnames

mTLS + Access = Zero Trust

A few years ago, we added mTLS support to our Access product, allowing customers to enable a Zero Trust policy on their applications. Access customers can deploy a policy that dictates that all clients must present a valid certificate when making a request. That means that requests made without a valid certificate — usually from unauthorized clients — will be blocked, adding an extra layer of protection. Cloudflare has allowed customers to configure mTLS on their Cloudflare domains by setting up Access policies. The only caveat was that to use this feature, you had to be the owner of the domain. Now, what if you’re not the owner of a domain, but you do manage that domain’s origin? This is the case for a large base of our customers, the SaaS providers that extend their services to their customers’ domains that they do not own.

Extending Cloudflare benefits through SaaS providers

Cloudflare for SaaS enables SaaS providers to extend the benefits of the Cloudflare network to their customers’ domains. These domains are not owned by the SaaS provider, but they do use the SaaS provider’s service, routing traffic back to the SaaS provider’s origin.

By doing this, SaaS providers take on the responsibility of providing their customers with the highest uptime, lightning fast performance, and unparalleled security — something they can easily extend to their customers through Cloudflare.

Cloudflare for SaaS actually started out as SSL for SaaS. We built SSL for SaaS to give SaaS providers the ability to issue TLS certificates for their customers, keeping the SaaS provider’s customers safe and secure.

Since then, our SaaS customers have come to us with a new request: extend the mTLS support that we built out for our direct customers, but to their customers.

Why would SaaS providers want to use mTLS?

As a SaaS provider, there’s a wide range of services that you can provide. Some of these services require higher security controls than others.

Let’s say that the SaaS solution that you’re building is a payment processor. Each customer gets its own API endpoint that their users send requests to, for example, pay.<business_name>.com. As a payment processor, you don’t want any client or device to make requests to your service, instead you only want authorized devices to do so — mTLS does exactly that.

As the SaaS provider, you can configure a Root CA for each of your customers’ API endpoints. Then, have each Root CA issue client certificates that will be installed on authorized devices. Once the client certificates have been installed, all that is left is enforcing a check for valid certificates.

To recap, by doing this, as a SaaS provider, your customers can now ensure that requests bound for their payment processing API endpoint only come from valid devices. In addition, by deploying individual Root CAs for each customer, you also prevent clients that are authorized to make requests to one customers’ API endpoint from making requests to another customers’ API endpoint when they are not authorized to do so.

How can you set this up with Cloudflare?

As a SaaS provider, configure Cloudflare for SaaS and add your customer’s domains as Custom Hostnames. Then, in the Cloudflare for Teams dashboard, add mTLS authentication with a few clicks.

This feature is currently in Beta and is available for Enterprise customers to use. If you have any feedback, please let your Account Team know.

Free Software Awards winners announced: SecuRepairs, Protesilaos Stavrou, Paul Eggert

Post Syndicated from original https://lwn.net/Articles/888745/

The just-completed, online LibrePlanet conference was the venue for awarding this year’s Free Software Awards:

SecuRepairs was this year’s winner of the Award for Projects of Social Benefit, which is presented to a project or team responsible for applying free software, or the ideas of the free software movement, to intentionally and significantly benefit society. This award stresses the use of free software in service to humanity. SecuRepairs is an association of professionals working in the information security industry, who have the common cause of supporting the “right to repair” devices and software.

[…] The 2021 Award for Outstanding New Free Software Contributor went to Protesilaos “Prot” Stavrou, who in a few short years has become a mainstay of the GNU Emacs community through his blog posts, livestreams, conference talks, and code contributions.

[…] Paul Eggert was this year’s honoree for the Award for the Advancement of Free Software, an award given to an individual who has made a great contribution to the progress and development of free software through activities that accord with the spirit of free software. Eggert has been a contributor to the GNU operating system for over thirty years, including contributions to components like GNU Compiler Collection (GCC), and is the current maintainer of the Time Zone Database (tz), which provides accurate information on the world’s time zones.

AWS Week in Review – March 21, 2022

Post Syndicated from Danilo Poccia original https://aws.amazon.com/blogs/aws/aws-week-in-review-march-21-2022/

This post is part of our Week in Review series. Check back each week for a quick round up of interesting news and announcements from AWS!

Another week, another round up of the most significant AWS launches from the previous seven days! Among the news, we have new AWS Heroes and a cost reduction. Also, improvements for customers using AWS Lambda and Amazon Elastic Kubernetes Service (EKS), and a new database-to-database connectivity option for Amazon Relational Database Service (RDS).

Last Week’s Launches
Here are some launches that caught my attention last week:

AWS Billing Conductor – This new tool provides customizable pricing and cost visibility for your end customers or business units and helps when you have specific showback and chargeback needs. To get started, see Getting Started with AWS Billing Conductor. And yes, you can call it “ABC.”

Cost Reduction for Amazon Route 53 Resolver DNS Firewall – Starting from the beginning of March, we are introducing a new tiered pricing structure that reduces query processing fees as your query volume increases. We are also implementing internal optimizations to reduce the number of DNS queries for which you are charged without affecting the number of DNS queries that are inspected or introducing any other changes to your security posture. For more info, see the What’s New.

Share Test Events in the Lambda Console With Other Developers – You can now share the test events you create in the Lambda console with other team members and have a consistent set of test events across your team. This new capability is based on Amazon EventBridge schemas and is available in the AWS Regions where both Lambda and EventBridge are available. Have a look at the What’s New for more details.

Use containerd with Windows Worker Nodes Managed by Amazon EKS – containerd is a container runtime that manages the complete container lifecycle on its host system with an emphasis on simplicity, robustness, and portability. In this way, you can get on Windows similar performance, security, and stability benefits to those available for Linux worker nodes. Here’s the What’s New with more info.

Amazon RDS for PostgreSQL databases can now connect and retrieve data from MySQL databases – You can connect your RDS PostgreSQL databases to Amazon Aurora MySQL-compatible, MySQL, and MariaDB databases. This capability works by adding support to mysql_fdw, an extension that implements a Foreign Data Wrapper (FDW) for MySQL. Foreign Data Wrappers are libraries that PostgreSQL databases can use to communicate with an external data source. Find more info in the What’s New.

For a full list of AWS announcements, be sure to keep an eye on the What’s New at AWS page.

Other AWS News
New AWS Heroes – It’s great to see both new and familiar faces joining the AWS Heroes program, a worldwide initiative that acknowledges individuals who have truly gone above and beyond to share knowledge in technical communities. Get to know them in the blog post!

More Than 400 Points of Presence for Amazon CloudFront – Impressive growth here, doubling the Points of Presence we had in October 2019. This number includes edge locations and mid-tier caches in AWS Regions. Do you know that edge locations are connected to the AWS Regions through the AWS network backbone? It’s a fully redundant, multiple 100GbE parallel fiber that circles the globe and links with tens of thousands of networks for improved origin fetches and dynamic content acceleration.

AWS Open Source News and Updates – A newsletter curated by my colleague Ricardo where he brings you the latest open-source projects, posts, events, and much more. This week he is also sharing a short list of some of the open-source roles currently open across Amazon and AWS, covering a broad range of open-source technologies. Read edition #105 here.

Upcoming AWS Events
Check your calendars and sign up for these AWS events:

The AWS Summits Are Back – Don’t forget to register to the AWS Summits in Brussels (on March 31) and Paris (on April 12). More summits are coming in the next weeks, and we’ll let you know in this weekly posts.

That’s all from me for this week. Come back next Monday for another Week in Review!

Danilo

Running cross-account workflows with AWS Step Functions and Amazon API Gateway

Post Syndicated from James Beswick original https://aws.amazon.com/blogs/compute/running-cross-account-workflows-with-aws-step-functions-and-amazon-api-gateway/

This post is written by Hardik Vasa, Senior Solutions Architect, and Pratik Jain, Cloud Infrastructure Architect.

AWS Step Functions allow you to build scalable and distributed applications using state machines. With the launch of Step Functions nested workflows, you can start a Step Functions workflow from another workflow. However, this requires both workflows to be in the same account. There are many use cases that require you to orchestrate workflows across different AWS accounts from one central AWS account.

This blog post covers a solution to invoke Step Functions workflows cross account using Amazon API Gateway. With this, you can perform cross-account orchestration for scheduling, ETL automation, resource deployments, security audits, and log aggregations all from a central account.

Overview

The following architecture shows a Step Functions workflow in account A invoking an API Gateway endpoint in account B, and passing the payload in the API request. The API then invokes another Step Functions workflow in account B asynchronously.  The resource policy on the API allows you to restrict access to a specific Step Functions workflow to prevent anonymous access.

Cross-account workflows

You can extend this architecture to run workflows across multiple Regions or accounts. This blog post shows running cross-account workflows with two AWS accounts.

To invoke an API Gateway endpoint, you can use Step Functions AWS SDK service integrations. This approach allows users to build solutions and integrate services within a workflow without writing code.

The example demonstrates how to use the cross-account capability using two AWS example accounts:

  • Step Functions state machine A: Account ID #111111111111
  • API Gateway API and Step Functions state machine B: Account ID #222222222222

Setting up

Start by creating state machine A in the account #111111111111. Next, create the state machine in target account #222222222222, followed by the API Gateway REST API integrated to the state machine in the target account.

Account A: #111111111111

In this account, create a state machine, which includes a state that invokes an API hosted in a different account.

Create an IAM role for Step Functions

  1. Sign in to the IAM console in account #111111111111, and then choose Roles from left navigation pane
  2. Choose Create role.
  3. For the Select trusted entity, under AWS service, select Step Functions from the list, and then choose Next.
  4. On the Add permissions page, choose Next.
  5. On the Review page, enter StepFunctionsAPIGatewayRole for Role name, and then choose Create role.
  6. Create inline policies to allow Step Functions to access the API actions of the services you need to control. Navigate to the role that you created and select Add Permissions and then Create inline policy.
  7. Use the Visual editor or the JSON tab to create policies for your role. Enter the following:
    Service: Execute-API
    Action: Invoke
    Resource: All Resources
  8. Choose Review policy.
  9. Enter APIExecutePolicy for name and choose Create Policy.

Creating a state machine in source account

  1. Navigate to the Step Functions console in account #111111111111 and choose Create state machine
  2. Select Design your workflow visually, and the click Standard and then click Next
  3. On the design page, search for APIGateway:Invoke state, then drag and drop the block on the page:
    Step Functions designer console
  4. In the API Gateway Invoke section on the right panel, update the API Parameters with the following JSON policy:
     {
      "ApiEndpoint.$": "$.ApiUrl",
      "Method": "POST",
      "Stage": "dev",
      "Path": "/execution",
      "Headers": {},
      "RequestBody": {
       "input.$": "$.body",
       "stateMachineArn.$": "$.stateMachineArn"
      },
      "AuthType": "RESOURCE_POLICY"
    }

    These parameters indicate that the ApiEndpoint, payload (body) and stateMachineArn are dynamically assigned values based on input provided during workflow execution. You can also choose to assign these values statically, based on your use case.

  5. [Optional] You can also configure the API Gateway Invoke state to retry upon task failure by configuring the retries setting.
    Configuring State Machine
  6. Choose Next and then choose Next again. On the Specify state machine settings page:
    1. Enter a name for your state machine.
    2. Select Choose an existing role under Permissions and choose StepFunctionsAPIGatewayRole.
    3. Select Log Level ERROR.
  7. Choose Create State Machine.

After creating this state machine, copy the state machine ARN for later use.

Account B: #222222222222

In this account, create an API Gateway REST API that integrates with the target state machine and enables access to this state machine by means of a resource policy.

Creating a state machine in the target account

  1. Navigate to the Step Functions Console in account #222222222222 and choose Create State Machine.
  2. Under Choose authoring method select Design your workflow visually and the type as Standard.
  3. Choose Next.
  4. On the design page, search for Pass state. Drag and drop the state.
    State machine
  5. Choose Next.
  6. In the Review generated code page, choose Next and:
    1. Enter a name for the state machine.
    2. Select Create new role under the Permissions section.
    3. Select Log Level ERROR.
  7. Choose Create State Machine.

Once the state machine is created, copy the state machine ARN for later use.

Next, set up the API Gateway REST API, which acts as a gateway to accept requests from the state machine in account A. This integrates with the state machine you just created.

Create an IAM Role for API Gateway

Before creating the API Gateway API endpoint, you must give API Gateway permission to call Step Functions API actions:

  1. Sign in to the IAM console in account #222222222222 and choose Roles. Choose Create role.
  2. On the Select trusted entity page, under AWS service, select API Gateway from the list, and then choose Next.
  3. On the Select trusted entity page, choose Next
  4. On the Name, review, and create page, enter APIGatewayToStepFunctions for Role name, and then choose Create role
  5. Choose the name of your role and note the Role ARN:
    arn:aws:iam::222222222222:role/APIGatewayToStepFunctions
  6. Select the IAM role (APIGatewayToStepFunctions) you created.
  7. On the Permissions tab, choose Add permission and choose Attach Policies.
  8. Search for AWSStepFunctionsFullAccess, choose the policy, and then click Attach policy.

Creating the API Gateway API endpoint

After creating the IAM role, create a custom API Gateway API:

  1. Open the Amazon API Gateway console in account #222222222222.
  2. Click Create API. Under REST API choose Build.
  3. Enter StartExecutionAPI for the API name, and then choose Create API.
  4. On the Resources page of StartExecutionAPI, choose Actions, Create Resource.
  5. Enter execution for Resource Name, and then choose Create Resource.
  6. On the /execution Methods page, choose Actions, Create Method.
  7. From the list, choose POST, and then select the check mark.

Configure the integration for your API method

  1. On the /execution – POST – Setup page, for Integration Type, choose AWS Service. For AWS Region, choose a Region from the list. For Regions that currently support Step Functions, see Supported Regions.
  2. For AWS Service, choose Step Functions from the list.
  3. For HTTP Method, choose POST from the list. All Step Functions API actions use the HTTP POST method.
  4. For Action Type, choose Use action name.
  5. For Action, enter StartExecution.
  6. For Execution Role, enter the role ARN of the IAM role that you created earlier, as shown in the following example. The Integration Request configuration can be seen in the image below.
    arn:aws:iam::222222222222:role/APIGatewayToStepFunctions
    API Gateway integration request configuration
  7. Choose Save. The visual mapping between API Gateway and Step Functions is displayed on the /execution – POST – Method Execution page.
    API Gateway method configuration

After you configure your API, you can configure the resource policy to allow the invoke action from the cross-account Step Functions State Machine. For the resource policy to function in cross-account scenarios, you must also enable AWS IAM authorization on the API method.

Configure IAM authorization for your method

  1. On the /execution – POST method, navigate to the Method Request, and under the Authorization option, select AWS_IAM and save.
  2. In the left navigation pane, choose Resource Policy.
  3. Use this policy template to define and enter the resource policy for your API.
    {
        "Version": "2012-10-17",
        "Statement": [
            {
                "Effect": "Allow",
                "Principal": {
                    "Service": "states.amazonaws.com"
                },
                "Action": "execute-api:Invoke",
                "Resource": "execute-api:/*/*/*",
                "Condition": {
                    "StringEquals": {
                        "aws:SourceArn": [
                            "<SourceAccountStateMachineARN>"
                         ]
                    }
                }
            }
        ]
    }

    Note: You must replace <SourceAccountStateMachineARN> with the state machine ARN from account #111111111111 (account A).

  4. Choose Save.

Once the resource policy is configured, deploy the API to a stage.

Deploy the API

  1. In the left navigation pane, click Resources and choose Actions.
  2. From the Actions drop-down menu, choose Deploy API.
  3. In the Deploy API dialog box, choose [New Stage], enter dev in Stage name.
  4. Choose Deploy to deploy the API.

After deployment, capture the API ID, API Region, and the stage name. These are used as inputs during the execution phase.

Starting the workflow

To run the Step Functions workflow in account A, provide the following input:

{
   "ApiUrl": "<api_id>.execute-api.<region>.amazonaws.com",
   "stateMachineArn": "<stateMachineArn>",
   "body": "{\"someKey\":\"someValue\"}"
}

Start execution

Paste in the values of APIUrl and stateMachineArn from account B in the preceding input. Make sure the ApiUrl is in the format as shown.

AWS Serverless Application Model deployment

You can deploy the preceding solution architecture with the AWS Serverless Application Model (AWS SAM), which is an open-source framework for building serverless applications. During deployment, AWS SAM transforms and expands the syntax into AWS CloudFormation syntax, enabling you to build serverless applications faster.

Logging and monitoring

Logging and monitoring are vital for observability, measuring performance and audit purposes. Step Functions allows logging using CloudWatch Logs. Step Functions also automatically sends execution metrics to CloudWatch. You can learn more on monitoring Step Functions using CloudWatch.

Cleaning up

To avoid incurring any charges, delete all the resources that you have created in both the accounts. This would include deleting the Step Functions state machines and API Gateway API.

Conclusion

This blog post provides a step-by-step guide on securely invoking a cross-account Step Functions workflow from a central account using API Gateway as front end. This pattern can be extended to scale workflow executions across different Regions and accounts.

By using a centralized account to orchestrate workflows across AWS accounts, this can help prevent duplicating work in each account.

To learn more about serverless and AWS Step Functions, visit the Step Functions Developer Guide.

For more serverless learning resources, visit Serverless Land.

The collective thoughts of the interwebz