The Flathub organization (in the form of Robert McQueen) has posted a lengthy
update on the state of Flathub and its plans for the coming year.
So far, the GNOME Foundation has acted as an incubator and legal
host for Flathub even though it’s not purely a GNOME product or
initiative. Distributing software to end users along with
processing and forwarding payments and donations also has a
different legal profile in terms of risk exposure and nonprofit
compliance than the current activities of the GNOME
Foundation. Consequently, we plan to establish an independent legal
entity to own and operate Flathub which reduces risk for the GNOME
Foundation, better reflects the independent and cross-desktop
interests of Flathub, and provides flexibility in the future should
we need to change the structure.
At Cloudflare, we reuse existing core systems to power multiple products and testing of these core systems is essential. In particular, we require being able to have a wide and thorough visibility of our live APIs’ behaviors. We want to be able to detect regressions, prevent incidents and maintain healthy APIs. That is why we built Scout.
Scout is an automated system periodically running Python tests verifying the end to end behavior of our APIs. Scout allows us to evaluate APIs in production-like environments and thus ensures we can green light a production deployment while also monitoring the behavior of APIs in production.
Why Scout?
Before Scout, we were using an automated test system leveraging the Robot Framework. This older system was limiting our testing capabilities. In fact, we could not easily match json responses against keys we were looking for. We would abandon covering different behaviors of our APIs as it was impossible to decide on which resources a given test suite would run. Two different test suites would create false negatives as they were running on the same account.
Regarding schema validation, only API responses were validated against a json schema and tests would not fail if the response did not match the schema. Moreover, It was impossible to validate API requests.
Test suites were run in a queue, making the delay to a new feature assessment dependent on the number of test suites to run. The queue would as well potentially make newer test suites run the following day. Hence we often ended up with a mismatch between tests and APIs versions. Test steps could not be run in parallel either.
We could not split test suites between different environments. If a new API feature was being developed it was impossible to write a test without first needing the actual feature to be released to production.
We built Scout to overcome all these difficulties. We wanted the developer experience to be easy and we wanted Scout to be fast and reliable while spotting any live API issue.
A Scout test example
Scout is built in Python and leverages the functionalities of Pytest. Before diving into the exact capabilities of Scout and its architecture, let’s have a quick look at how to use it!
Following is an example of a Scout test on the Rulesets API (the docs are available here):
from scout import requires, validate, Account, Zone

@validate(schema="rulesets", ignorePaths=["accounts/[^/]+/rules/lists"])
@requires(
    account=Account(
        entitlements={"rulesets.max_rules_per_ruleset": 2),
    zone=Zone(plan="ENT",
        entitlements={"rulesets.firewall_custom_phase_allowed": True},
        account_entitlements={"rulesets.max_rules_per_ruleset": 2 }))
class TestZone:
    def test_create_custom_ruleset(self, cfapi):
        response = cfapi.zone.request(
            "POST",
            "rulesets",
            payload=f"""{{
            "name": "My zone ruleset",
            "description": "My ruleset description",
            "phase": "http_request_firewall_custom",
            "kind": "zone",
            "rules": [
                {{
                    "description": "My rule",
                    "action": "block",
                    "expression": "http.host eq \"fake.net\""
                }}
            ]
        }}""")
        response.expect_json_success(
            200,
            result=f"""{{
            "name": "My zone ruleset",
            "version": "1",
            "source": "firewall_custom",
            "phase": "http_request_firewall_custom",
            "kind": "zone",
            "rules": [
                {{
                    "description": "My rule",
                    "action": "block",
                    "expression": "http.host eq \"fake.net\"",
                    "enabled": true,
                    ...
                }}
            ],
            ...
        }}""")
A Scout test is a succession of roundtrips of requests and responses against a given API. We use the functionalities of Pytest fixtures and marks to be able to target specific resources while validating the request and responses. Pytest marks in Scout allow to provide an extra set of information to test suites. Pytest fixtures are contexts with information and methods which can be used across tests to enhance their capabilities. Hence the conjunction of marks with fixtures allow Scout to build the whole harness required to run a test suite against APIs.
Being able to exactly describe the resources against which a given test will run provides us confidence the live API behaves as expected under various conditions.
The cfapi fixture provides the capability to target different resources such as a Cloudflare account or a zone. In the test above, we use a Pytest mark @requires to describe the characteristics of the resources we want, e.g. we need here an account with a flag allowing us to have 2 rules for a ruleset. This will allow the test to only be run against accounts with such entitlements.
The @validate mark provides the capability to validate requests and responses to a given OpenAPI schema (here the rulesets OpenAPI schema). Any validation failure will be reported and flagged as a test failure.
Regarding the actual requests and responses, their payloads are described as f-strings, in particular the response f-string can be written as a “semi-json”:
Among many test assertions possible, Scout can assert the validity of a partial json response and it will log the information. We added the handling of ellipsis … as an indication for Scout not to care about any further fields at a given json nesting level. Hence, we are able to do partial matching on JSON API responses, thus focusing only on what matters the most in each test.
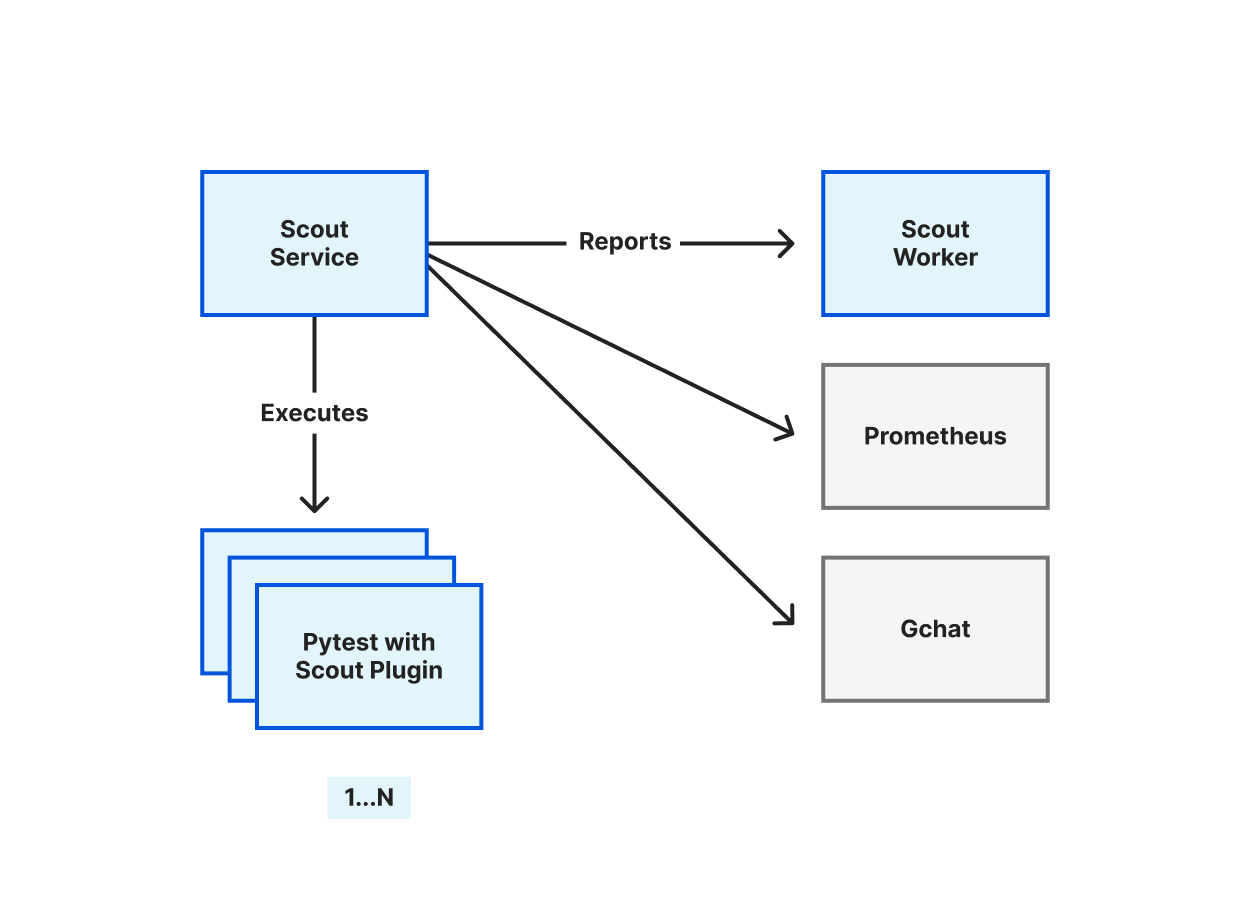
Once a test suite run is complete, the results are pushed by the service and stored using Cloudflare Workers KV. They are displayed via a Cloudflare Worker.
Scout is run in separate environments such as production-like and production environments. It is part of our deployment process to verify Scout is green in our production-like environment prior to deploying to production where Scout is also used for monitoring purposes.
How we built it
The core of Scout is written in Python and it is a combination of three components interacting together:
The Scout plugin: a Pytest plugin to write tests easily
The Scout service: a scheduler service to run the test suites periodically
The Scout Worker: a collector and presenter of test reports
The Scout plugin
This is the core component of the Scout system. It allows us to write self explanatory tests while ensuring a high level of compliance against OpenAPI schemas and verifying the APIs’ behaviors.
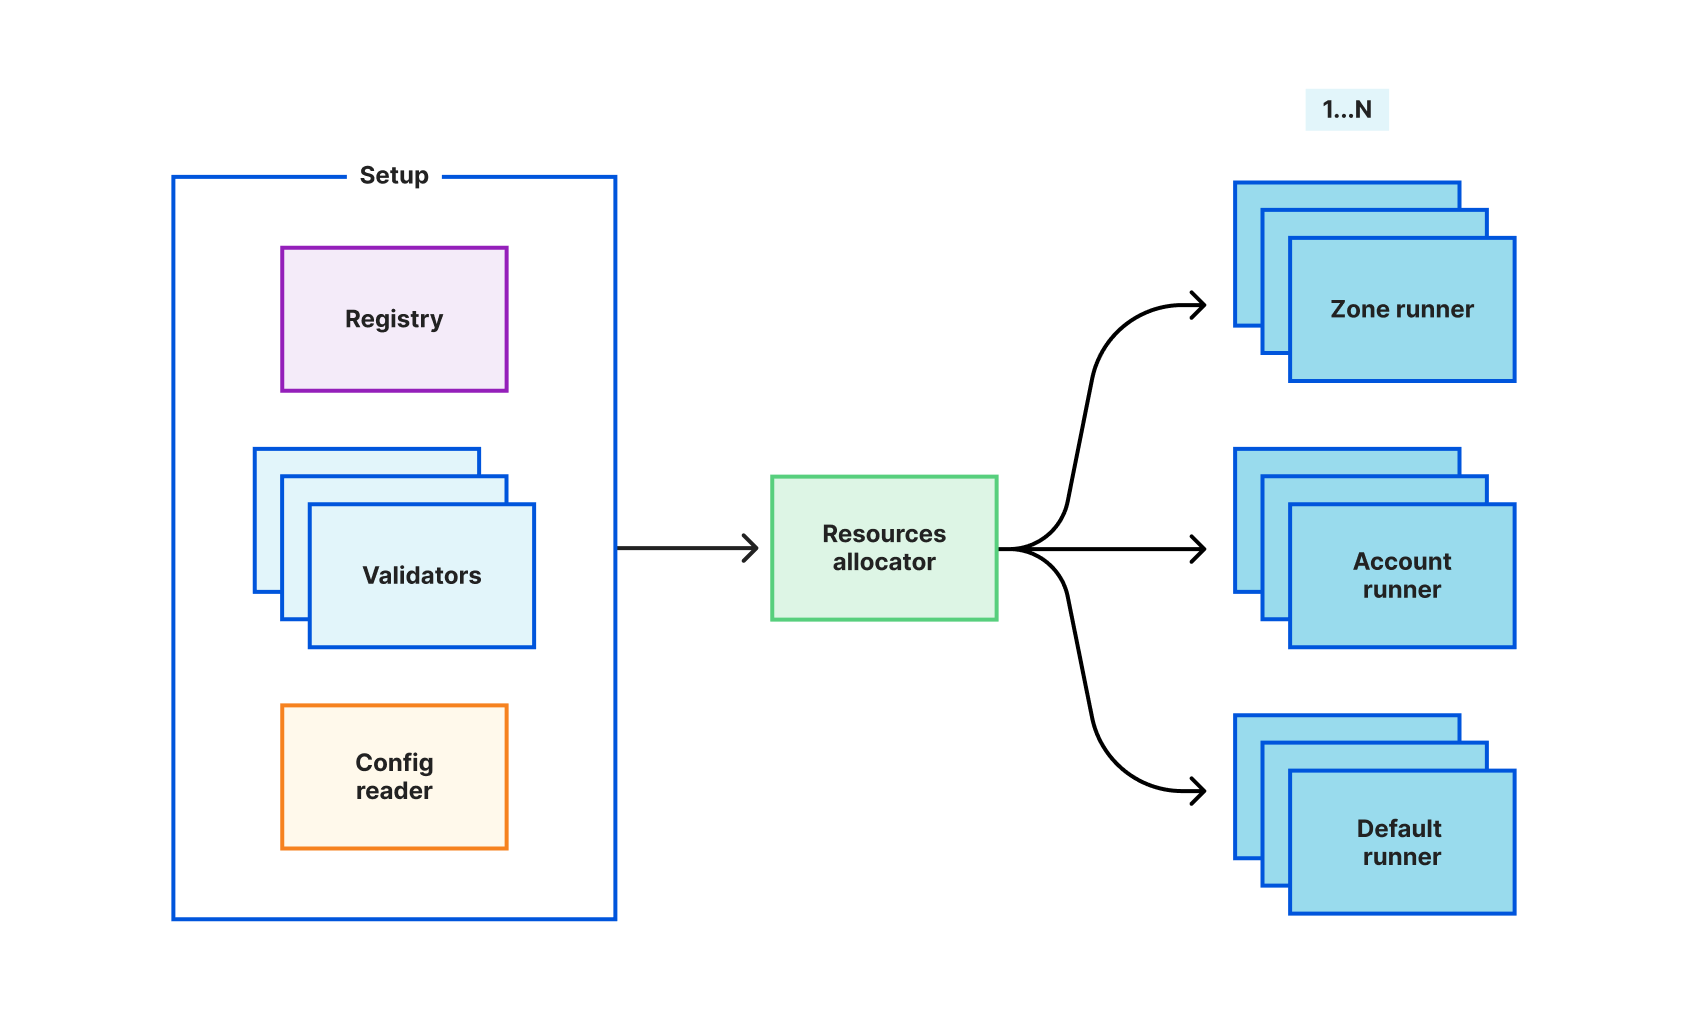
The Scout plugin architecture can be split into three components: setup, resource allocator, and runners. Setup is a conjunction of multiple sub components in charge of setting up the plugin.
The Registry contains all the information regarding a pool of accounts and zones we use for testing. As an example, entitlements are flags gating customers for using products features, the Registry provides the capability to describe entitlements per account and zone so that Scout can run a test against a specific setup.
As explained earlier, Scout can validate requests and responses against OpenAPI schemas. This is the responsibility of validators. A validator is built per OpenAPI schema and can be selected via the @validate mark we saw above.
As soon as a validator is selected, all the interaction of a given test with an API will be validated. If there is a validation failure, it will be marked as a test failure.
Last element of the setup, the config reader. It is the sub component in charge of providing all the URLs and authentication elements required for the Scout plugin to communicate with APIs.
Next in the chain, the resources allocator. This component is in charge of consuming the configuration and objects of the setup to build multiple runners. This is a factory which will make available the runners in the cfapi fixture.
When such a line of code is processed, it is the actual method request of the zone runner allocated for the test which is executed. Actually, the resources allocator is able to provide specialized runners (account, zone or default) which grant the possibility of targeting specific API endpoints for a given account or zone.
Runners are in charge of handling the execution of requests, managing the test expectations and using the validators for request/response schema validation.
Any failure on expectation or validation and any exceptions are recorded in the stash. The stash is shared across all runners. As such, when a test setup, run or cleanup is processed, the timeline of execution and potential retries are logged in the stash. The stash contents are later used for building the test suite reports.
Scout is able to run multiple test steps in parallel. Actually, each resource couple (Account Runner, Zone Runner) is associated with a Pytest-xdist worker which runs test steps independently. There can be as many workers as there are resource couples. An extra “default” runner is provided for reaching our different APIs and/or URLs with or without authentication.
Testing a test system was not the easiest part. We have been required to build a fake API and assert the Scout plugin would behave as it should in different situations. We reached and maintained a test coverage confidence which was considered good (close to 90%) for using the Scout plugin permanently.
The Scout service
The Scout service is meant to schedule test suites periodically. It is a configurable scheduler providing a reporting harness for the test suites as well as multiple metrics. It was a design decision to build a scheduler instead of using cron jobs.
We wanted to be aware of any scheduling issue as well as run issues. For this we used Prometheus metrics. The problem is that the Prometheus default configuration is to scrape metrics advertised by services. This scraping happens periodically and we were concerned about the eventuality of missing metrics if a cron job was to finish prior to the next Prometheus metrics scraping. As such we decided a small scheduler was better suited for overall observability of the test runs. Among the metrics the Scout service provides are network failures, general test failures, reporting failures, tests lagging and more.
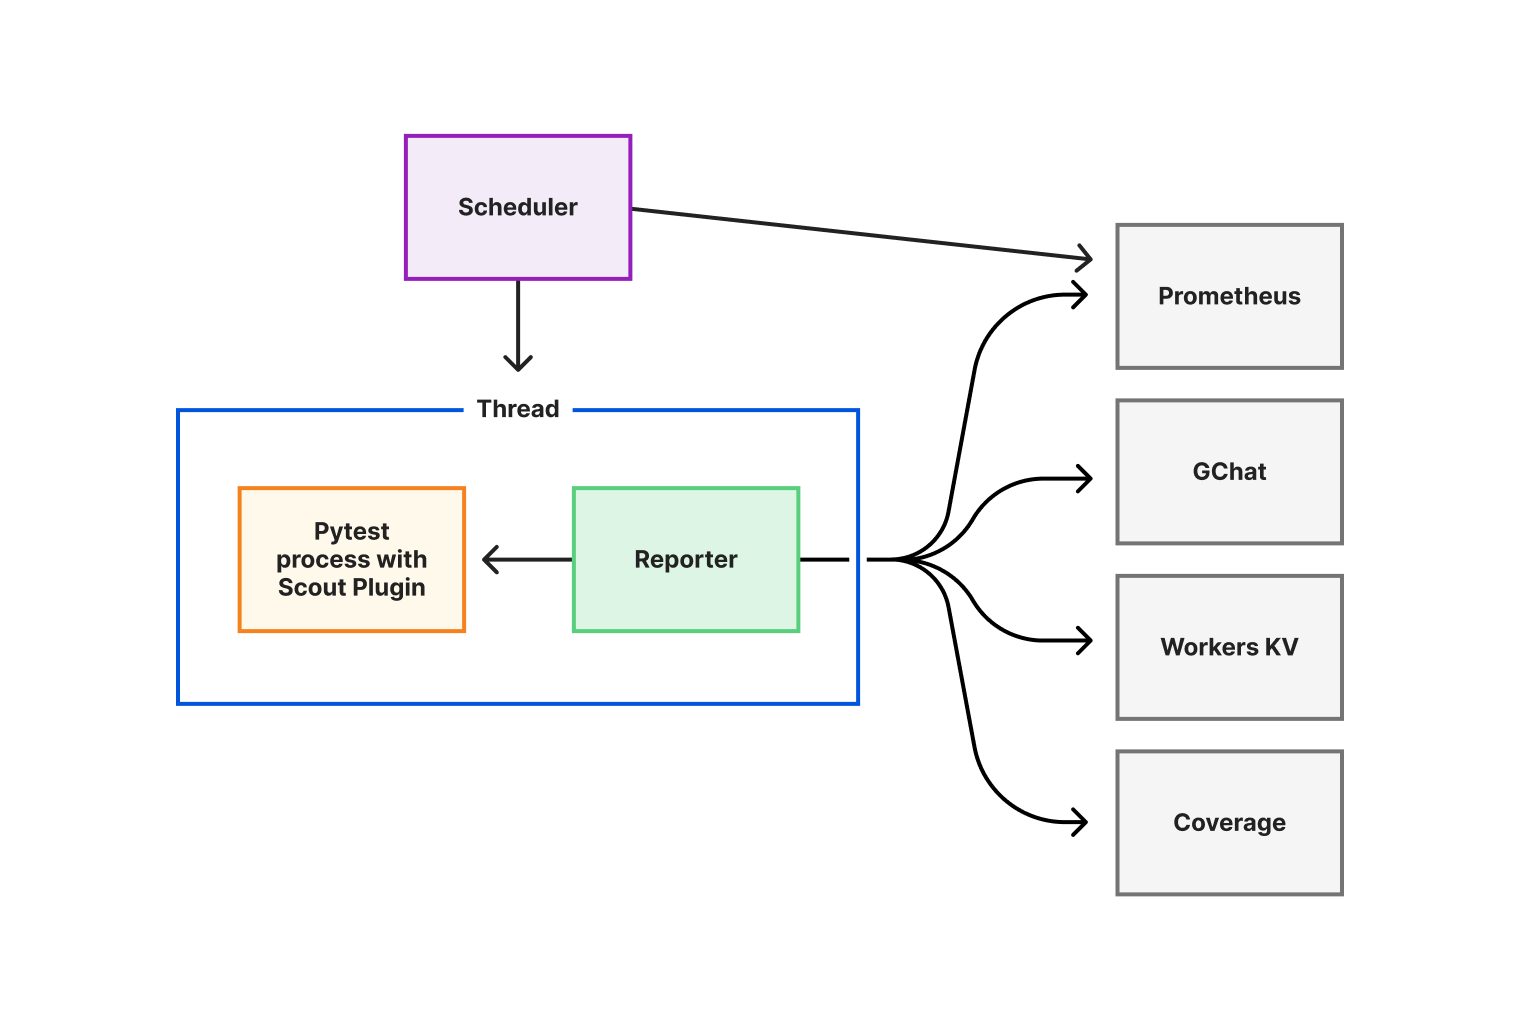
The Scout service runs threads on configured periods. Each thread is a test suite run as a separate Pytest with Scout plugin process followed by a reporting execution consuming the results and publishing them to the relevant parties.
The reporting component provided to each thread publishes the report to Workers KV and notifies us on chat in case there is a failure. Reporting takes also care of publishing the information relevant for building API testing coverage. In fact it is mandatory for us to have coverage of all the API endpoints and their possible methods so that we can achieve a wide and thorough visibility of our live APIs.
As a fallback, if there are any thread failure, test failure or reporting failure we are alerted based on the Prometheus metrics being updated across the service execution. The logs of the Scout service as well as the logs of each Pytest-Scout plugin execution provide the last resort information if no metrics are available and reporting is failing.
The service can be deployed with a minimal YAML configuration and be set up for different environments. We can for example decide to run different test suites based on the environment, publish or not to Cloudflare Workers, set different periods and retry mechanisms and so on.
We keep the tests as part of our code base alongside the configuration of the Scout service, and that’s about it, the Scout service is a separate entity.
The Scout Worker
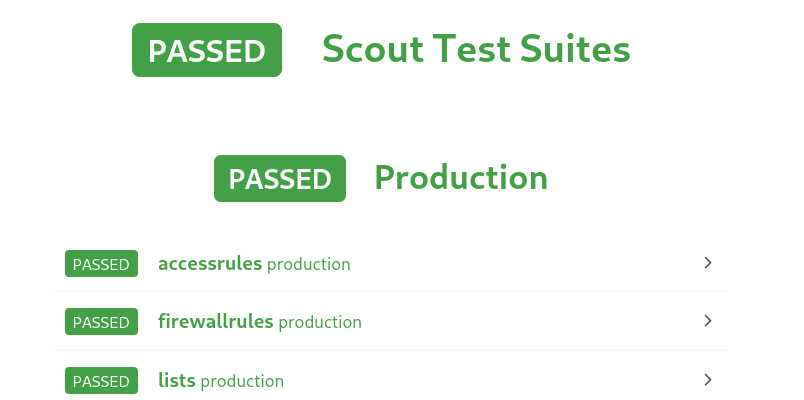
It is a Cloudflare worker in charge of fetching the most recent Worker KVs and displaying them in an eye pleasing manner. The Scout service publishes a test report as JSON, thus the Scout worker parses the report and displays its content based on the status of the test suite run.
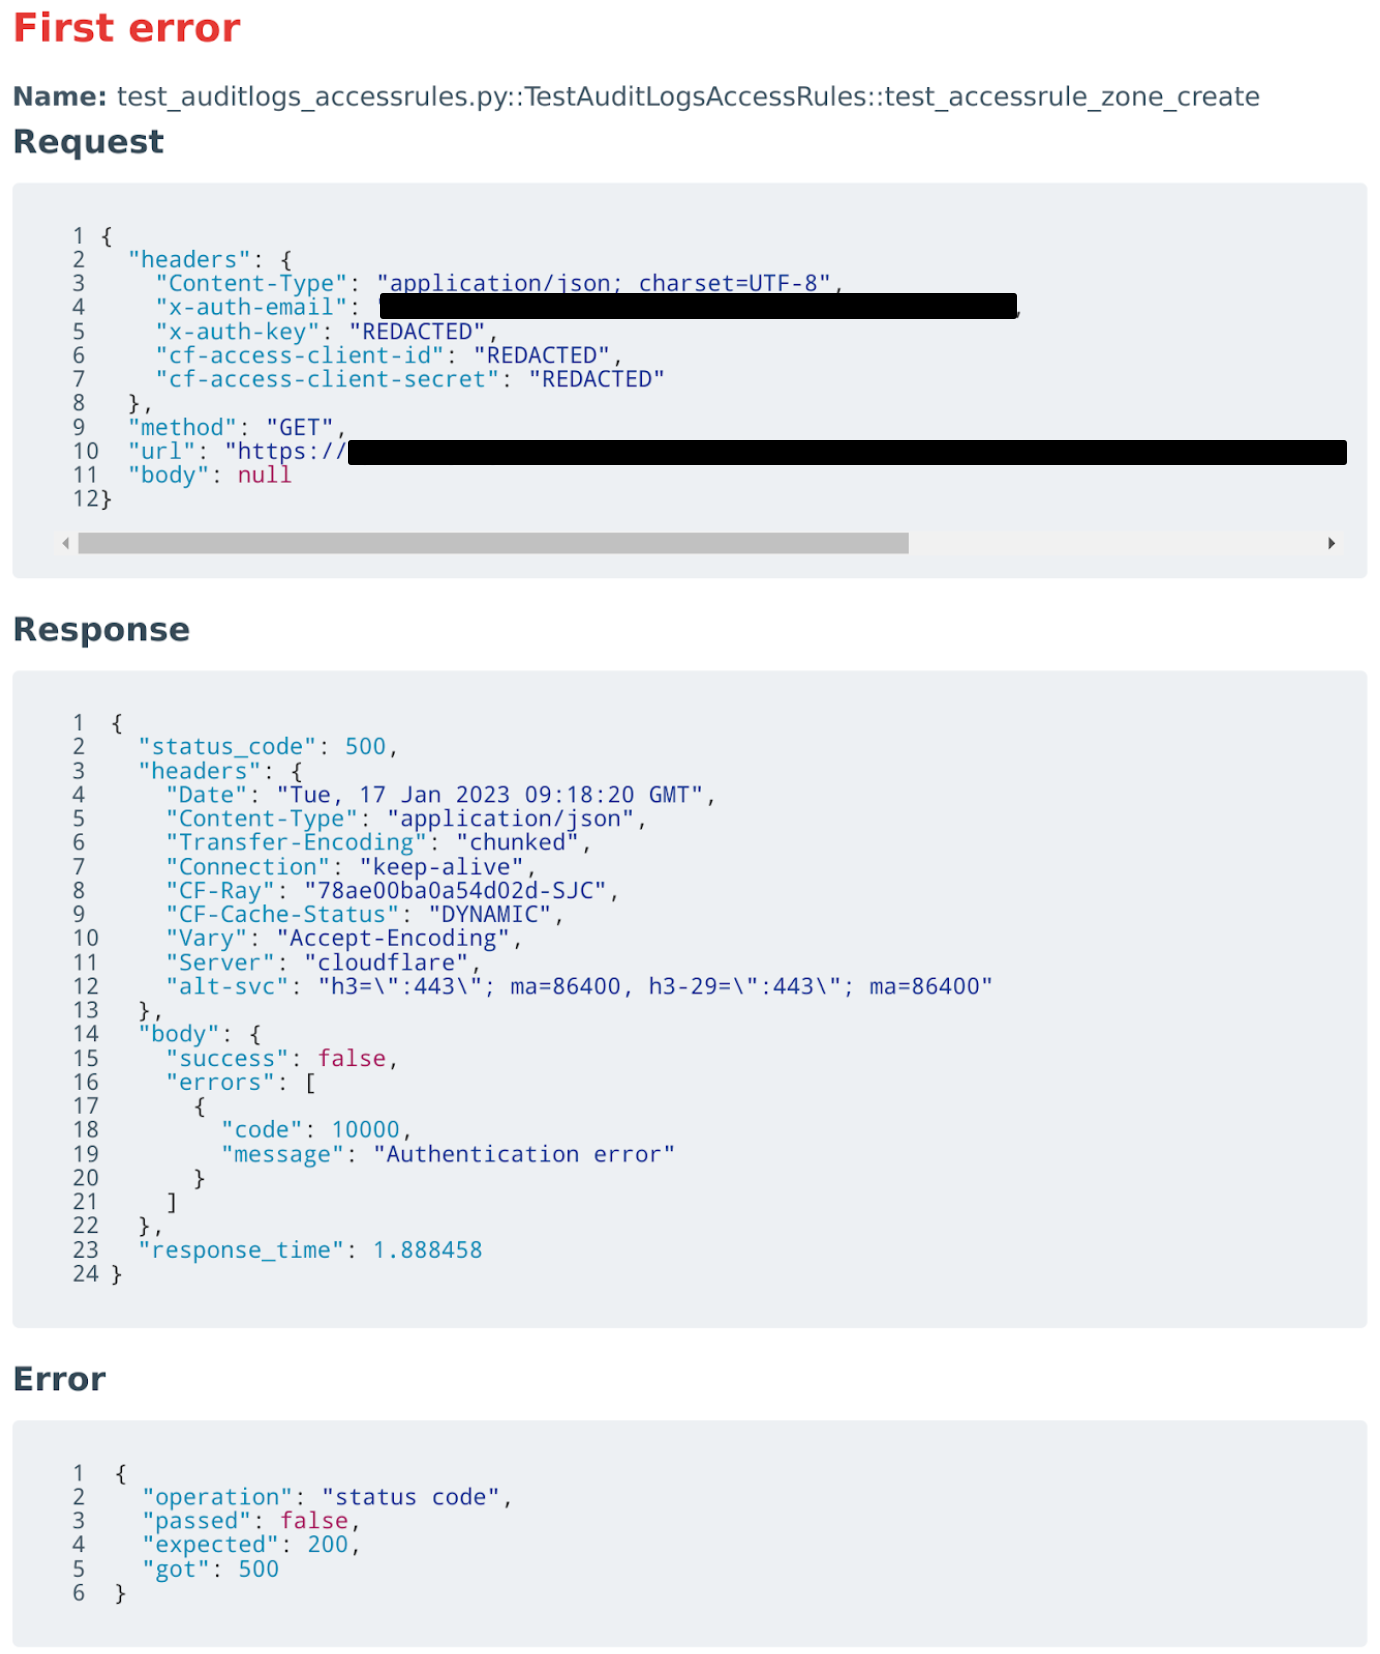
For example, we present below an authentication failure during a test which resulted in such a display in the worker:
What does Scout let us do
Through leveraging the capabilities of Pytest and Cloudflare Workers, we have been able to build a configurable, robust and reliable system which allows us to easily write self explanatory tests for our APIs.
We can validate requests and responses against OpenAPI schemas and test behaviors over specific resources while getting alerted through multiple means if something goes wrong.
For specific use cases, we can write a test verifying the API behaves as it should, the configuration to be pushed at the edge is valid and a given zone will react as it should to security threats. Thus going beyond an end-to-end API test.
Scout quickly became our permanent live tester and monitor of APIs. We wrote tests for all endpoints to maintain a wide coverage of all our APIs. Scout has since been used for verifying an API version prior to its deployment to production. In fact, after a deployment in a production-like environment we can know in a couple of minutes if a new feature is good to go to production and assess if it is behaving correctly.
We hope you enjoyed this deep dive description into one of our systems!
Zabbix team is pleased to announce the release of the latest Zabbix major version – Zabbix 6.4. The release delivers many long-awaited improvements, such as Just-in-time LDAP and SAML user provisioning; support of older Zabbix proxy versions for simplified proxy management and zero–downtime Zabbix upgrades; near-instant configuration sync across Zabbix agents and proxies, and much more!
New features and improvements
Just-in-time (JIT) user provisioning
Zabbix 6.4 adds support of JIT user provisioning for LDAP and SAML authentication.
JIT user provisioning can be enabled in LDAP/SAML authentication settings
Zabbix administrators can now configure user provisioning by selecting the LDAP group pattern for matching and automatically assign User groups and User roles to the discovered users. Media types can also be mapped based on LDAP/SAML attributes.
A media can be assigned to the provisioned users based on their LDAP/SAML attributesA group and role is assigned to the provisioned users
Cause and symptom events
Zabbix 6.4 adds the ability to mark events as Cause or Symptom events. This allows us to filter events in a way, where we can see only root cause problems instead of being overwhelmed by symptom events. It is also possible to pause action operations for symptom events as to avoid unnecessary noise.
Multiple symptom events can be linked to a single cause eventAny event can be marked as a symptom or converted to a cause eventAction operations can be paused for symptom problems
Instant propagation of configuration changes
Continuing to build on changes introduced in Zabbix 6.2 (Collecting only configuration change deltas), Zabbix 6.4 introduces instant configuration synchronization across passive and active agents and proxies.
Instead of receiving the full configuration copy every 2 minutes (old behavior), in Zabbix 6.4 active agent receives the configuration copy only when changes have been performed
RefreshActiveChecks parameter now supports a range 1-86400 (old range: 60-3600)
The ProxyConfigFrequency parameter is now used in both Zabbix server (for passive mode) and Zabbix proxy (for active mode) configuration files
ConfigFrequency parameter in Zabbix proxy configuration is now deprecated
Default ProxyConfigFrequency parameter is 10 seconds (down from 1 hour)
This also improves the performance of Zabbix servers and proxies, since only configuration deltas are synced. As for active agents – the active agent receives a full configuration copy only when any changes are detected in the configuration instead of receiving it every RefreshActiveChecks interval (old behavior)
New SNMP walk item for bulk collection and discovery of SNMP metrics
A new SNMP agent walk item has been introduced. The item looks at a specified OID or OIDs and polls their indexes by suing the SNMP GetBulk requests. An SNMP GetBulk request can provide better performance and more rapid metric collection and discovery from enterprise-tier SNMP devices.
Once the data is converted to JSON, we can use SNMP walk value preprocessing step together with LLD macros, to create dependent item prototypes:
SNMP walk value preprocessing step can be used to specify value for extraction in item prototypes
Support of data collection for outdated proxies
To improve the Zabbix component upgrade workflows (especially for large environments), outdated proxies can still perform data collection with a newer Zabbix server version:
Proxy is fully supported if it has the same major version as the Zabbix server
Proxy is marked as outdated if its major version is older than the Zabbix server but not older than the previous LTS release
Outdated proxies still support data collection and remote command execution
In other scenarios, the proxy becomes not supported
Deployed proxy compatibility can be seen in Zabbix frontend
Server version
Current proxy version
Outdated proxy version
Unsupported proxy version
6.4
6.4
6.0, 6.2
Older than 6.0; newer than 6.4
7.0
7.0
6.0, 6.2, 6.4
Older than 6.0; newer than 7.0
7.2
7.2
7.0
Older than 7.0; newer than 7.2
New menu layout
Zabbix menu layout has been redesigned. The goal of the new menu layout is to provide logical and consistent access to main Zabbix features.
The new menu provides a more consistent and logical layout to Zabbix features
Real-time streaming of metrics and events over HTTP
In addition to streaming collected metrics and events to files, Zabbix 6.4 adds the option to stream metrics and events over HTTP. Zabbix administrators have the option to filter the data for streaming by using tag filters. A new Connectors section has been introduced under Administration – General. Here Zabbix administrators can define an external system where item values and events should be pushed to.
Define a new connector to stream metrics and events over HTTP
Zabbix 6.4 can be used as a source of information for other applications, analytics reports, and AI engines by streaming metrics and events over HTTP in real time. Metrics and events can be streamed to message brokers like Kafka, RabbitMQ, or Amazon Kinesis to adapt the behavior of external systemsin real time.
Template versioning
Template versioning has been introduced to improve template management and ease of use. Templates are now marked with vendor ar version fields, which are visible in Zabbix frontend; these fields can also be added when writing a custom template.
Template version and vendor fields are visible in the frontend
Development framework for Zabbix widget creation
Zabbix has a large developer community creating their own custom frontend modules, widgets and Go plugins. In Zabbix 6.4, our goal was to streamline this process by creating a development framework for widget creation. To achieve this, the following changes have been introduced:
Widgets have been converted to modules
Modules are now fully self-contained and modular
Built-in widgets reside in ui/widgets
Custom widgets reside in ui/modules/<widget>
Adding new widgets is as simple as adding new files without changing the existing files
In addition to these changes, we have also added a new Developer Center section to our documentation. The section contains guides, tutorials and code examples to guide our community in developing Frontend modules and widgets, as well as help with Zabbix agent 2 custom Go plugin development.
The Developer Center section contains guides, tutorials, and code examples for extending Zabbix
Other features and improvements
The release includes many other changes:
Simple check, External check, SSH agent, Telnet agent item types now do not require an interface to be present on the host
Pre-configured email media type settings for Gmail and O365 email providers
Dynamic item value widget thresholds
Option to define custom labeled links for hosts and events
Ability to label trigger URLs
Improved preprocessing performance and thread-based preprocessing workers
Ability to label aggregated datasets in Graph widget
SQLite3 Zabbix proxies now automatically recreate the SQLite3 database file during an upgrade
A host status filter (enabled/disabled) has been added under Data collection – Hosts
Additional filtering options have been added to the Action log
Action log now supports import to CSV
Multiple context menu improvements to Host, Item and Event context menus
Old password verification is now required when changing your internal Zabbix user password
Value cache performance improvements when working with metrics that get updated less frequently than once per day
Added commands to enable profiling of rwlocks/mutexes (for debugging)
Zabbix 6.4 comes pre-packaged with many new templates and integrations for the most popular vendors and cloud providers. Multiple existing templates have also received improvements:
Microsoft Azure MySQL servers
Microsoft Azure PostgreSQL servers
Microsoft Azure virtual machines
Low-level discovery improvements in AWS by HTTP template
Veeam Backup Enterprise Manager
Veeam Backup and Replication
Cisco Nexus 9000 Series
BMC Control-M
Cisco Meraki dashboard
OS processes by Zabbix agent
Improvements to filesystem discovery in official Zabbix OS templates
Zabbix 6.4 introduces a webhook integration for the Line messaging app, allowing Zabbix events to be forwarded to the Line messenger.
Zabbix 6.4 adds a variety of new templates and integrations
Zabbix 6.4 packages and images
Official Zabbix packages and images are available for:
Linux distributions for different hardware platforms on RHEL, CentOS, Oracle Linux, Debian, SUSE, Ubuntu, Raspbian
Virtualization platforms based on VMWare, VirtualBox, Hyper-V, XEN
Docker
Packages and pre-compiled agents for the most popular platforms, including macOS and MSI packages for Microsoft Windows
You can find the download instructions and download the new version on the Download page.
One-click deployments for the following cloud platforms are coming soon:
AWS, Azure, Google Cloud Platform, Digital Ocean
Upgrading to Zabbix 6.4
In order to upgrade to Zabbix 6.4 you need to upgrade your repository package and download and install the new Zabbix component packages (Zabbix server, proxy, frontend, and other Zabbix components). When you start the Zabbix server, an automatic database schema upgrade will be performed. Zabbix agents are backward compatible; therefore, it is not required to install the new agent versions. You can perform the agent upgrade at a later time.
If you’re using the official Docker container images – simply deploy a new set of containers for your Zabbix components. Once the Zabbix server container connects to the backend database, the database upgrade will be performed automatically.
You can find detailed step-by-step upgrade instructions on our Upgrade procedure page.
Join the webinar
If you wish to learn more about the Zabbix 6.4 features and improvements, we invite you to join our What’s new in Zabbix 6.4 public webinar.
During the webinar, you will get the opportunity to:
Learn about Zabbix 6.4 features and improvements
See the latest Zabbix templates and integrations
Participate in a Q&A session with Zabbix founder and CEO Alexei Vladishev
Discuss the latest Zabbix version with Zabbix community and Zabbix team members
This is a public webinar – anyone can sign up, attend and have their questions answered by the Zabbix team!
This is a good survey on prompt injection attacks on large language models (like ChatGPT).
Abstract: We are currently witnessing dramatic advances in the capabilities of Large Language Models (LLMs). They are already being adopted in practice and integrated into many systems, including integrated development environments (IDEs) and search engines. The functionalities of current LLMs can be modulated via natural language prompts, while their exact internal functionality remains implicit and unassessable. This property, which makes them adaptable to even unseen tasks, might also make them susceptible to targeted adversarial prompting. Recently, several ways to misalign LLMs using Prompt Injection (PI) attacks have been introduced. In such attacks, an adversary can prompt the LLM to produce malicious content or override the original instructions and the employed filtering schemes. Recent work showed that these attacks are hard to mitigate, as state-of-the-art LLMs are instruction-following. So far, these attacks assumed that the adversary is directly prompting the LLM.
In this work, we show that augmenting LLMs with retrieval and API calling capabilities (so-called Application-Integrated LLMs) induces a whole new set of attack vectors. These LLMs might process poisoned content retrieved from the Web that contains malicious prompts pre-injected and selected by adversaries. We demonstrate that an attacker can indirectly perform such PI attacks. Based on this key insight, we systematically analyze the resulting threat landscape of Application-Integrated LLMs and discuss a variety of new attack vectors. To demonstrate the practical viability of our attacks, we implemented specific demonstrations of the proposed attacks within synthetic applications. In summary, our work calls for an urgent evaluation of current mitigation techniques and an investigation of whether new techniques are needed to defend LLMs against these threats.
In this blog you will learn how to track and attribute Amazon Pinpoint push notification events for Campaigns and Journeys via API.
Amazon Pinpoint is a multichannel customer engagement platform allowing you to engage with your customers across 6 different channels. Amazon Pinpoint’s push notification channel, can send messages to your mobile app users via Firebase Cloud Messaging (FCM), Apple Push Notification service (APNs), Baidu Cloud Push, Amazon Device Messaging (ADM).
Push notifications is a preferable channel of communication as it notifies your app users even when they are not on your app. This increases app engagement and probability of customers to convert. Additionally, users who download your app but don’t register, can still be targeted and receive your messages.
Using Amazon Pinpoint’s push notification channel you can engage users with highly curated content. The messages can be personalized with customer data stored in Amazon Pinpoint, images, deep links and custom alert sounds – read more here. Amazon Pinpoint Campaigns and Journeys enable marketers to schedule communications, build multichannel experiences and for developers it offers a rich API to send messages. By default, all Amazon Pinpoint accounts are configured to send 25,000 messages per second, which can be increased by requesting a quota increase.
Measuring success of your communications is paramount for optimizing future customer engagements. Amazon Pinpoint push notifications offer the following three events:
_opened_notification – This event type indicates that the recipient tapped the notification to open it.
_received_foreground – This event type indicates that the recipient received the message as a foreground notification.
_received_background – This event type indicates that the recipient received the message as a background notification.
To track the above events from your mobile application, it is recommended using AWS Amplify’s push notification library which is currently available only in React Native.
Solution description
This blog provides an alternative for AWS Amplify for Amazon Pinpoint push notification tracking. Specifically, it utilizes Amazon Pinpoint’s Events API operation, which can be used to record events your customers generate on your mobile or web application. The same API operation can be used to record push notification engagement events.
The Events API operation request body is populated with the Campaign or Journey attributes received via the push notification payload metadata. These attributes help Amazon Pinpoint to attribute the events back to the correct Campaign or Journey
This blog provides examples of campaign, journey & transactional push notification payloads and how to correctly populate the Events API operation. Furthermore it shares an architecture to securely call Amazon Pinpoint’s API from your application’s frontend.
Prerequisites
This post assumes that you already have an Amazon Pinpoint project that is correctly configured to send push notification to your various endpoints using Campaigns or Journeys. Refer to the getting started guide and setting up Amazon Pinpoint mobile push channels for information on how to set up your Amazon Pinpoint project.
You will also need the AWS Mobile SDKs for the respective platform of your apps. The following are the repositories that can be used:
The push notification payload received from the application differs between campaign, journey and transactional messages. This blog provides examples for campaign, journey and transactional message payloads as well as how to populate the Amazon Pinpoint Events API request body correctly to report push notification tracking data to Amazon Pinpoint.
Note the transactional payload is the same for both messages sent to a push notification token and endpoint-id. Additionally the pinpoint.campaign.campaign_id is always set to _DIRECT.
To record push notification events from your mobile or web application, we will leverage the AWS Mobile SDKs or the Amazon Pinpoint Events API. To prevent inaccurate metrics such as double counting” it is recommended using the appropriate endpoint_id as Pinpoint uses this for de-duplication. Below you can find examples for both Events REST API and put_events AWS Python SDK – Boto3. Visit this page for more information on how to create a signed AWS API request.
Campaign event example – REST API:
Required fields: endpoint_id1, EventType, Timestamp, campaign_id and campaign_activity_id
Amazon Pinpoint doesn’t support push notification metrics for transactional messages. Specifically, transactional messages don’t offer a field that can be used to attribute engagement events. These engagement events can still be recorded using the Amazon Pinpoint’s Events API. However, unlike Campaign & Journey events, the transactional push notification message payload doesn’t provide an identifier such as Campaign id or Journey Id that can be used as an Amazon Pinpoint event attribute for data reconciliation purposes.
Next steps
Requests to the Amazon Pinpoint Events API must be signed using AWS Signature version 4. We recommend using the AWS Mobile SDKs which handle request signing on your behalf. You can use the AWS Mobile SDKs with temporary limited-privilege Amazon Cognito credentials. For more information and examples, see Getting credentials.
About the Authors
Franklin Ochieng
Franklin Ochieng is a senior software engineer at the Amazon Pinpoint team. He has attained over 7 years experience at AWS building highly scalable system that solve complex problems for our customers. Outside of work, Frank enjoys getting out in nature and playing basketball or pool.
Pavlos Ioannou Katidis
Pavlos Ioannou Katidis is an Amazon Pinpoint and Amazon Simple Email Service Senior Specialist Solutions Architect at AWS. He enjoys diving deep into customers’ technical issues and help in designing communication solutions. In his spare time, he enjoys playing tennis, watching crime TV series, playing FPS PC games, and coding personal projects.
It has been a week full of interesting launches and I am thrilled to be able to share them with you today. We’ve got a new region in the works, a new tool for researchers, updates to Amazon Timestream, Control Tower, and Amazon Inspector, Lambda Powertools for .NET, existing services in new locations, lots of posts from other AWS blogs, upcoming events, and more.
Last Week’s Launches Here are some of the launches that caught my eye this past week:
AWS Region in Malaysia – We are working on an AWS Region in Malaysia, bringing the number of regions that are currently in the works to five. The upcoming region will include three Availability Zones, and represents our commitment to invest at least $6 Billion in Malaysia by 2037. You can read my post to learn about how our enterprise, startup, and public sector customers are already using AWS.
Amazon Lightsail for Research – You can get access to analytical applications such as Scilab, RStudio, and Jupyter with just a couple of couple of clicks. Instead of processing large data sets on your laptop, you can get to work quickly without having to deal with hardware setup, software setup, or tech support.
Batch Loading of Data into Amazon Timestream – You can now batch-load time series data into Amazon Timestream. You upload the data to an Amazon Simple Storage Service (Amazon S3) bucket in CSV form, specify a target database and table, and a data model. The ingestion happens automatically and reliably, with parallel processes at work for efficiency.
Control Tower Progress Tracker – AWS Control Tower now includes a progress tracker that shows you the milestones (and their status) of the landing zone setup and upgrade process. Milestones such as updating shared accounts for logging, configuring Account Factory, and enabling mandatory controls are tracked so that you have additional visibility into the status of your setup or upgrade process.
Kinesis Data Streams Throughput Increase – Each Amazon Kinesis Data Stream now supports up to 1 GB/second of write throughput and 2 GB/second of read throughput, both in On-Demand capacity mode. To reach this level of throughput for your data streams you will need to submit a Support Ticket, as described in the What’s New.
Lambda Powertools for .NET – This open source developer library is now generally available. It helps you to incorporate Well-Architected serverless best practices into your code, with a focus on observability features including distributed tracing, structured logging, and asynchronous metrics (both business and applications).
Amazon Inspector Code Scans for Lambda Functions – This preview launch gives Amazon Inspector the power to scan your AWS Lambda functions for vulnerabilities such as injection flaws, data leaks, weak cryptography, or missing encryption. Findings are aggregated in the Amazon Inspector console, routed to AWS Security Hub, and pushed to Amazon EventBridge.
X in Y – We made existing services and features available in additional regions and locations:
AWS Open Source – My colleague Ricardo writes a weekly newsletter to highlight new open source projects, tools, and demos from the AWS Community. Read edition #147 to learn more.
Upcoming AWS Events Check your calendar and be sure to attend these upcoming events:
AWSome Women Community Summit LATAM 2023 – Organized by members of the woman-led AWS communities in Perú, Chile, Argentina, Guatemala, Colombia, this event will take place in Bogotá, Colombia with an online option as well.
AWS Pi Day – Join us on March 14th for the third annual AWS Pi Day live, virtual event hosted on the AWS On Air channel on Twitch as we celebrate the 17th birthday of Amazon S3 and the cloud.
We will discuss the latest innovations across AWS Data services, from storage to analytics and AI/ML. If you are curious about how AI can transform your business, register here and join my session.
AWS Innovate Data and AI/ML edition – AWS Innovate is a free online event to learn the latest from AWS experts and get step-by-step guidance on using AI/ML to drive fast, efficient, and measurable results. Register now for EMEA (March 9) and the Americas (March 14th).
Today AWS launched two new global condition context keys that make it simpler for you to write policies in which Amazon Elastic Compute Cloud (Amazon EC2) instance credentials work only when used on the instance to which they are issued. These new condition keys are available today in all AWS Regions, as well as AWS GovCloud and China partitions.
Using these new condition keys, you can write service control policies (SCPs) or AWS Identity and Access Management (IAM) policies that restrict the virtual private clouds (VPCs) and private IP addresses from which your EC2 instance credentials can be used, without hard-coding VPC IDs or IP addresses in the policy. Previously, you had to list specific VPC IDs and IP addresses in the policy if you wanted to use it to restrict where EC2 credentials were used. With this new approach, you can use less policy space and reduce the time spent on updates when your list of VPCs and network ranges changes.
In this blog post, we will show you how to use these new condition keys in an SCP and a resource policy to help ensure that the IAM role credentials assigned to your EC2 instances can only be used from the instances to which they were issued.
New global condition keys
The two new condition keys are as follows:
aws:EC2InstanceSourceVPC — This single-valued condition key contains the VPC ID to which an EC2 instance is deployed.
aws:EC2InstanceSourcePrivateIPv4 — This single-valued condition key contains the primary IPv4 address of an EC2 instance.
These new conditions are available only for use with credentials issued to an EC2 instance. You don’t have to make configuration changes to activate the new condition keys.
Let’s start by reviewing some existing IAM conditions and how to combine them with the new conditions. When requests are made to an AWS service over a VPC endpoint, the value of the aws:SourceVpc condition key is the ID of the VPC into which the endpoint is deployed. The value of the aws:VpcSourceIP condition key is the IP address from which the endpoint receives the request. The aws:SourceVpc and aws:VpcSourceIP keys are null when requests are made through AWS public service endpoints. These condition keys relate to dynamic properties of the network path by which your AWS Signature Version 4-signed request reached the API endpoint. For a list of AWS services that support VPC endpoints, see AWS services that integrate with AWS PrivateLink.
The two new condition keys relate to dynamic properties of the EC2 role credential itself. By using the two new credential-relative condition keys with the existing network path-relative aws:SourceVPC and aws:VpcSourceIP condition keys, you can create SCPs to help ensure that credentials for EC2 instances are only used from the EC2 instances to which they were issued. By writing policies that compare the two sets of dynamic values, you can configure your environment such that requests signed with an EC2 instance credential are denied if they are used anywhere other than the EC2 instance to which they were issued.
Policy examples
In the following SCP example, access is denied if the value of aws:SourceVpc is not equal to the value of aws:ec2InstanceSourceVPC, or if the value of aws:VpcSourceIp is not equal to the value of aws:ec2InstanceSourcePrivateIPv4. The policy uses aws:ViaAWSService to allow certain AWS services to take action on your behalf when they use your role’s identity to call services, such as when Amazon Athena queries Amazon Simple Storage Service (Amazon S3).
Because we encase aws:SourceVpc and aws:VpcSourceIp in “${}” in these policies, they are treated as a variable using the value in the request being made. However, in the IAM policy language, the operator on the left side of a comparison is implicitly treated as a variable, while the operator on the right side must be explicitly declared as a variable. The “Null” operator on the ec2:SourceInstanceARN condition key is designed to ensure that this policy only applies to EC2 instance roles, and not roles used for other purposes, such as those used in AWS Lambda functions.
The two deny statements in this example form a logical “or” statement, such that either a request from a different VPC or a different IP address evaluates in a deny. But functionally, they act in an “and” fashion. To be allowed, a request must satisfy both the VPC-based and the IP-based conditions because failure of either denies the call. Because VPC IDs are globally unique values, it’s reasonable to use the VPC-based condition without the private IP condition. However, you should avoid evaluating only the private IP condition without also evaluating the VPC condition. Private IPs can be the same across different environments, so aws:ec2InstanceSourcePrivateIPv4 is safe to use only in conjunction with the VPC-based condition.
If you have specific EC2 instance roles that you want to exclude from the statement, you can apply exception logic through tags or role names.
The following example applies to roles used as EC2 instance roles, except those with a tag of exception-to-vpc-ip where the value is equal to true by using the aws:PrincipalTag condition key. The three condition operators (StringNotEquals, Null, and BoolIfExists) in the same condition block are evaluated with a logical AND operation, and if either of the tests doesn’t evaluate, then the deny statement doesn’t apply. Hence, EC2 instance roles with a principal tag of exception-to-vpc-ip equal to true are not subject to this SCP.
You can apply exception logic to other attributes of your IAM roles. For example, you can use the aws:PrincipalArn condition key to exempt certain roles based on their AWS account. You can also specify where you want this SCP to be applied in your AWS Organizations organization. You can apply SCPs directly to accounts, organizational units, or organizational roots. For more information about inheritance when applying SCPs in Organizations, see Understanding policy inheritance.
You can also apply exception logic to your SCP statements at the IAM Action. The following example statement restricts an EC2 instance’s credential usage to only the instance from which it was issued, except for calls to IAM by using a NotAction element. You should use this exception logic if an AWS service doesn’t have a VPC endpoint, or if you don’t want to use VPC endpoints to access a particular service.
Because these new condition keys are global condition keys, you can use the keys in all relevant AWS policy types, such as the following policy for an S3 bucket. When using this as a bucket policy, make sure to replace <DOC-EXAMPLE-BUCKET> with the ARN of your S3 bucket.
This policy restricts access to your S3 bucket to EC2 instance roles that are used only from the instance to which they were vended. Like the previous policy examples, there are two deny statements in this example to form a logical “or” statement but a functional “and” statement, because a request must come from the same VPC and same IP address of the instance that it was issued to, or else it evaluates to a deny.
Conclusion
In this blog post, you learned about the newly launchedaws:ec2InstanceSourceVPC and aws:ec2InstanceSourcePrivateIPv4 condition keys. You also learned how to use them with SCPs and resource policies to limit the usage of your EC2 instance roles to the instances from which they originated when requests are made over VPC endpoints. Because these new condition keys are global condition keys, you can use them in all relevant AWS policy types. These new condition keys are available today in all Regions, as well as AWS GovCloud and China partitions.
As the leading specialized storage cloud platform, Backblaze is a big proponent of the open, collaborative nature of independent cloud service providers. From our participation in the Bandwidth Alliance to our large ecosystem of partners, we’re focused on what we call “Phase Three” of the cloud. What’s happening in Phase Three? The age of walled gardens, hidden fees, and out of control egress fees driven by the hyperscalers is in the past. Today’s specialized cloud solutions are oriented toward what’s best for users—an open, multi-cloud internet.
Which is why I’m particularly happy to announce today that we’ve joined the CDN Alliance, a nonprofit organization and community of industry leaders focused on ensuring that the content delivery network (CDN) industry is evolving in a way that best serves businesses distributing content of every type around the world—from streaming media to stock image resources to e-commerce and more.
The majority of the content we consume today on our many devices and platforms is being delivered through a CDN. Being part of the CDN Alliance allows Backblaze to collaborate and drive innovation with our peers to ensure that everyone’s content experience only gets better.
Through participation in and sponsorships of joint events, panels, and gatherings, we look forward to working with the CDN Alliance on the key challenges facing the industry, including availability, scalability, reliability, privacy, security, sustainability, interoperability, education, certification, regulations, and numerous others. Check out the CDN Alliance and its CDN Community for more info.
For more resources on CDN integrations with Backblaze B2 Cloud Storage you can read more about our top partners here.
When I started my first role as a software engineer, I remember taking about four days to set up my local development environment. I had so many issues with missing dependencies, incorrect versions, and failed installations. When I finally finished setting up all the tools and software I needed to be a productive member of the team, I cloned one of our repositories to my machine, set up my environment variables, ran npm run dev and received so many errors because I forgot to install the dependencies (and read the README) or switch to the right node version. Ugh! I can’t tell you how many times this happened to me in my first year!
Back then, I wished I had a way that was streamlined—something I set up only once, that just worked every time I accessed the repository. Although I did learn how to automate my computer setup with a Brewfile, I wish I could just get to coding in a repository without thinking about configuration.
When I think about how we work on projects in a repository, I realize that many of the processes we need to get started on that project can be automated with the help of dev containers, in this case, by using a devcontainer.json file and Codespaces.
Let’s take a look at how we can automate our dev environment by adding a dev container to this open source project—Tech is Hiring in GitHub Codespaces.
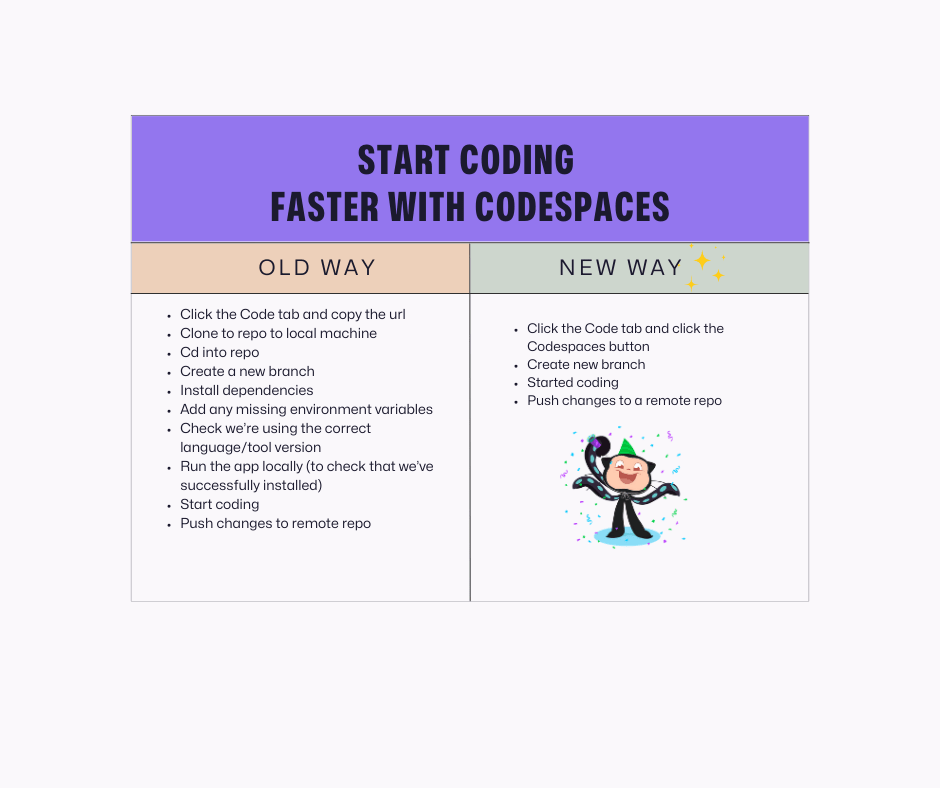
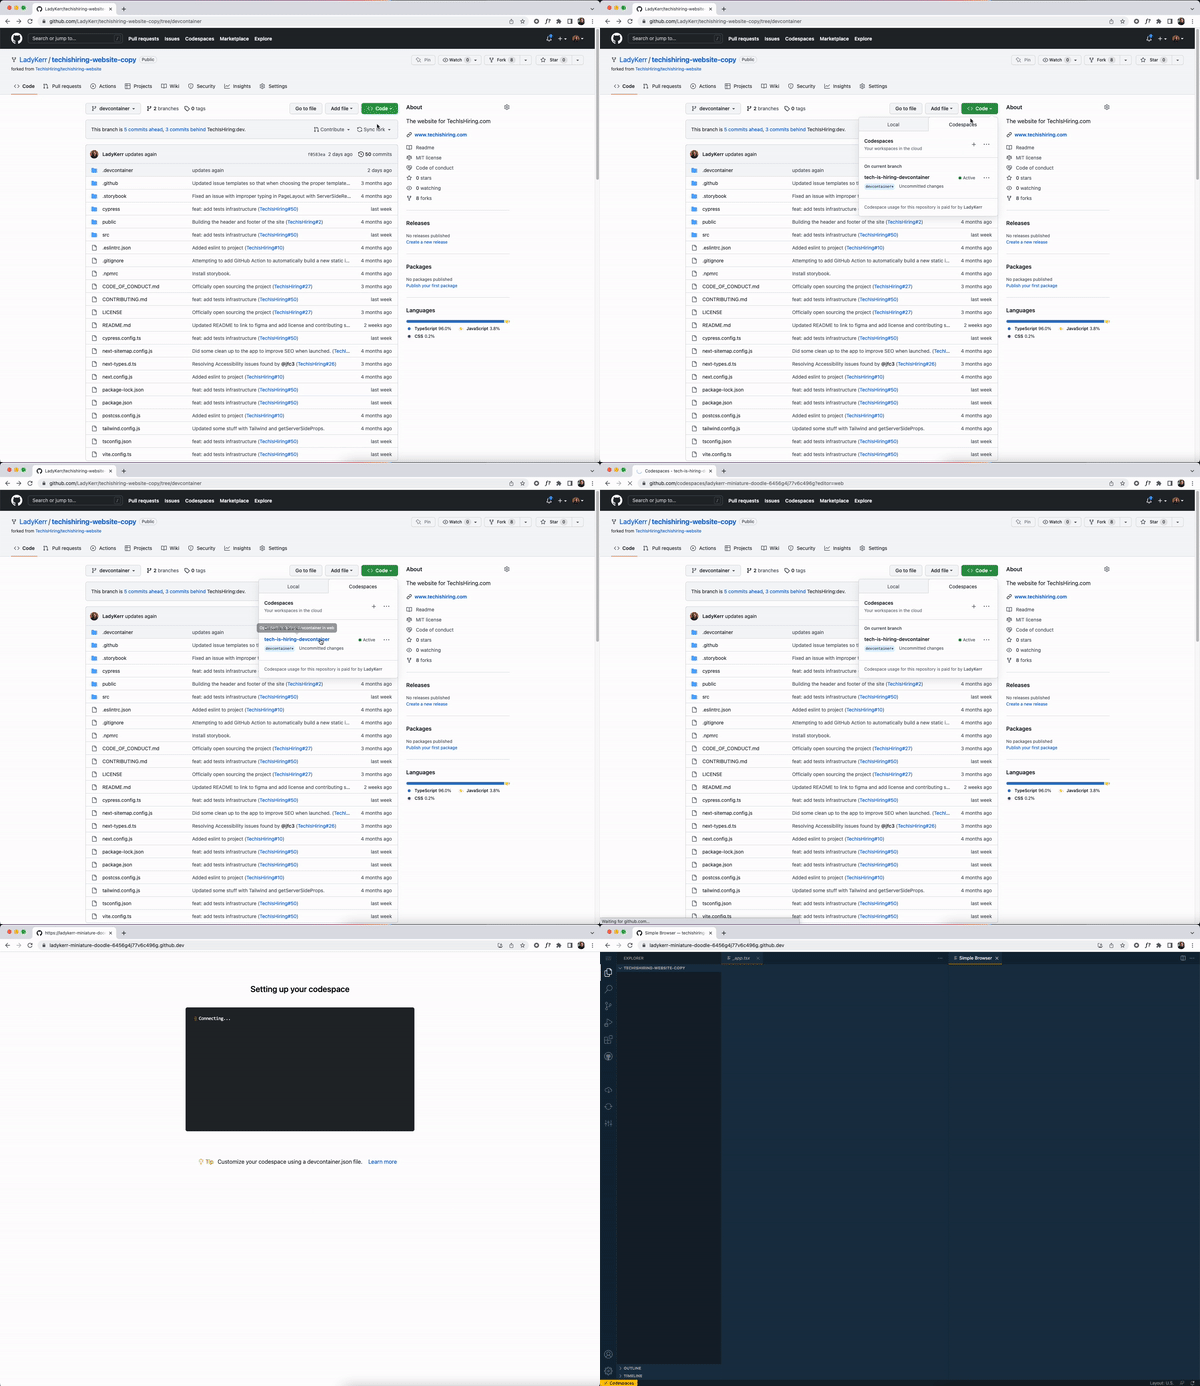
For a TLDR of this post, GitHub Codespaces enables you to start coding faster when coupled with dev containers. See image below for a summary of how:
Now, let’s get some definitions out of the way.
What is GitHub Codespaces?
GitHub Codespaces is a development environment in the cloud. It is hosted by GitHub in an isolated environment (Docker container) that runs on a virtual machine. If you’re not familiar with virtual machines or Docker containers, take a look at these videos: what is a virtual machine? and what are Docker containers?.
Currently, individual developers have 60 hours of free codespaces usage per month, so definitely take advantage of this awesomeness to build from anywhere.
What are dev containers?
Dev containers allow us to run our code in a preconfigured, isolated environment (container). It gives us the ability to predefine our dev environment in our repositories and use a consistent, reliable environment across the board without worrying about configuration files—since it’s all set up for us from the beginning with a devcontainer.json file.
What is the devcontainer.json file?
The devcontainer.json file is a document that defines how your project will build, display, and run. Simply put, it allows us to specify the behavior we want in our dev environment. For example, if we have a devcontainer.json file that includes installing the ESLint extension in VS Code, once we open up a workspace, ESLint will be automatically installed for us.
Automating your workflow with dev containers and GitHub Codespaces
To start using GitHub Codespaces, we don’t need to set up a devcontainer.json file. By default, GitHub Codespaces uses the universal dev container image, which caters to a vast array of languages and tools. This means, whenever you open up a new codespace without a devcontainer.json file your codespace will automagically load so you can code instantly. However, adding a devcontainer.json file gives us the ability to automate a lot of our dev environment workflows to our liking.
Okay, okay, that was a lot of chatter—let’s now get into what you really came here for!
Using the open source project, Tech is Hiring, let’s walk through how we typically work with a repository using our local dev environment.
What work typically looks like
At first glance, we see that this project uses Nextjs, Tailwind CSS, Chakra UI, TypeScript, Storybook, Vite, Cypress, Axios, and Reactjs as some of its dependencies. We’d need to install all these dependencies to our local machine to get this project running.
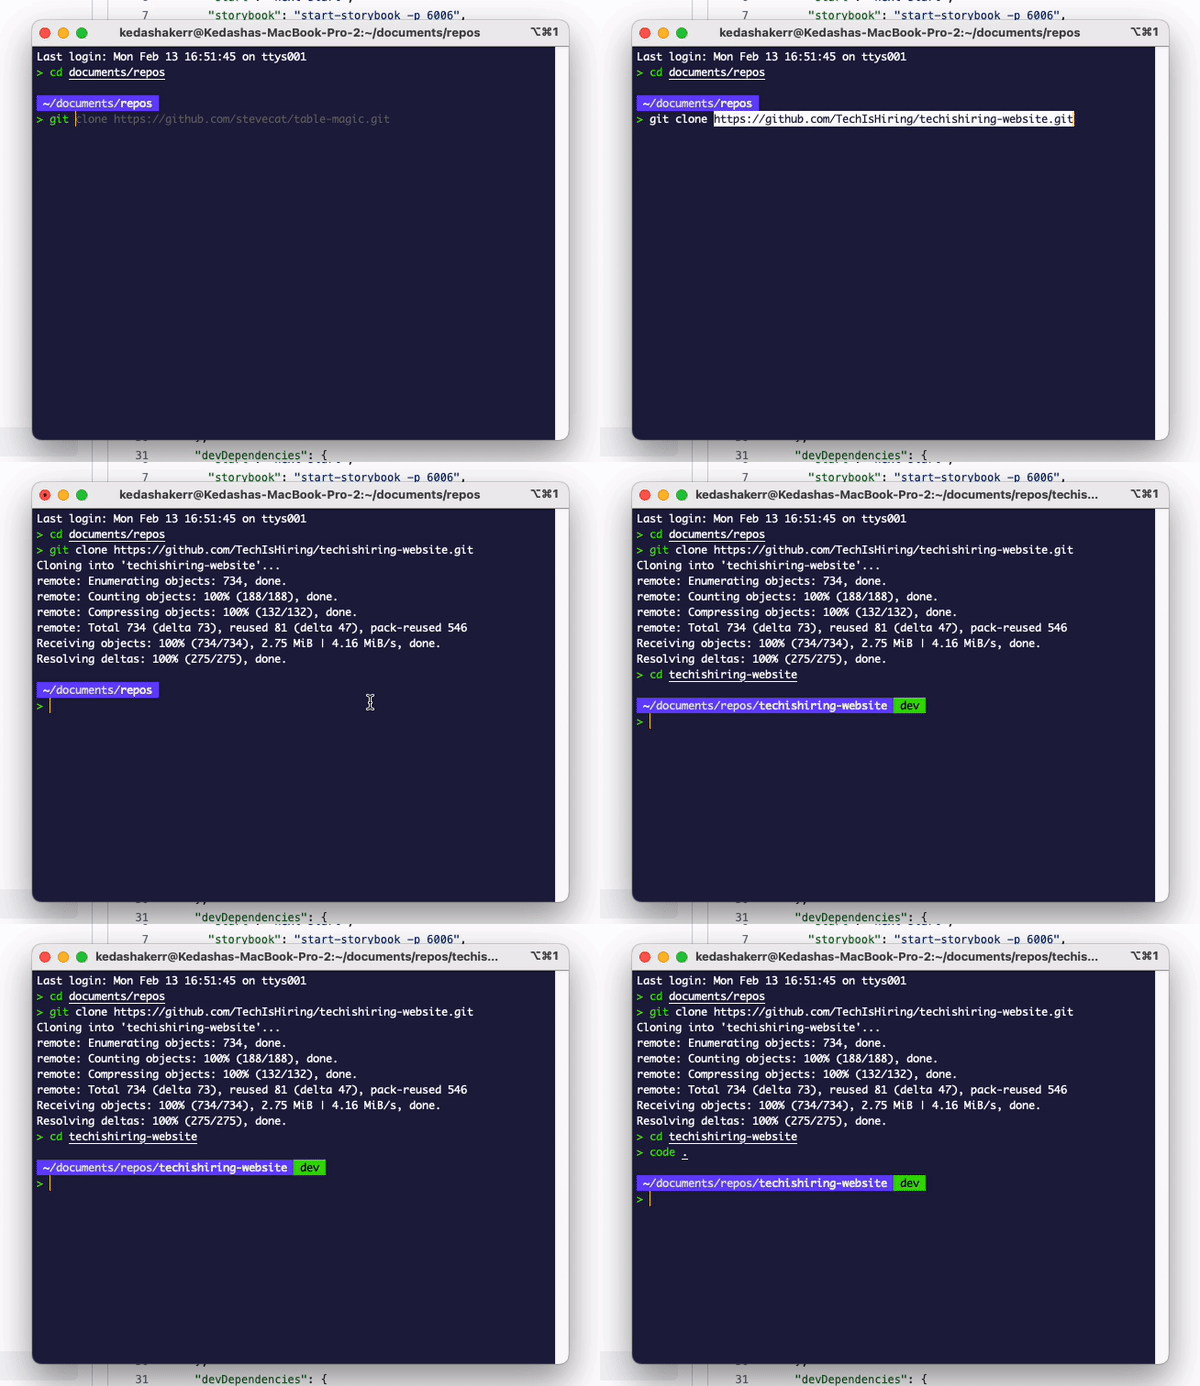
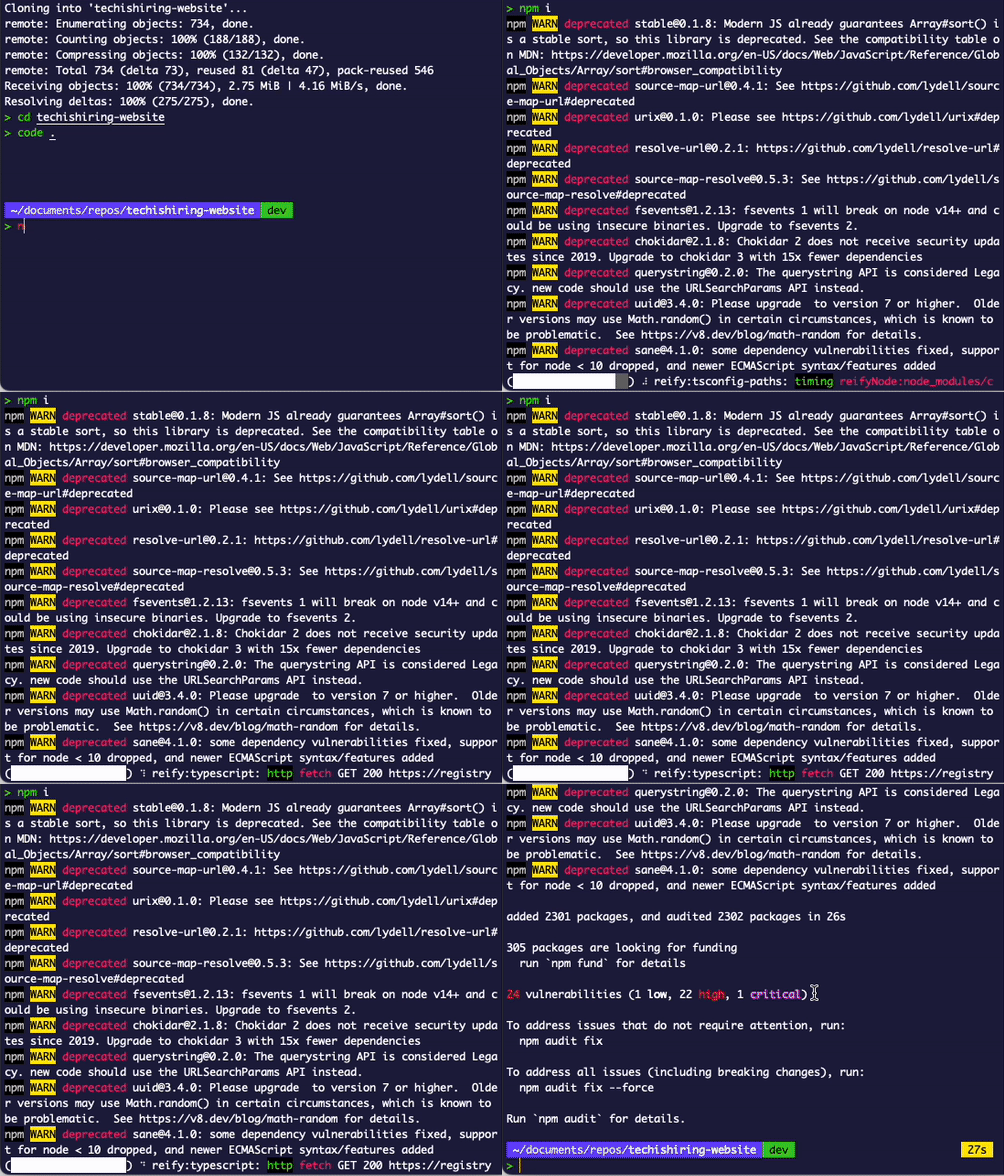
Let’s clone the repository, and cd into the project.
Then, let’s install dependencies to get the project running locally.
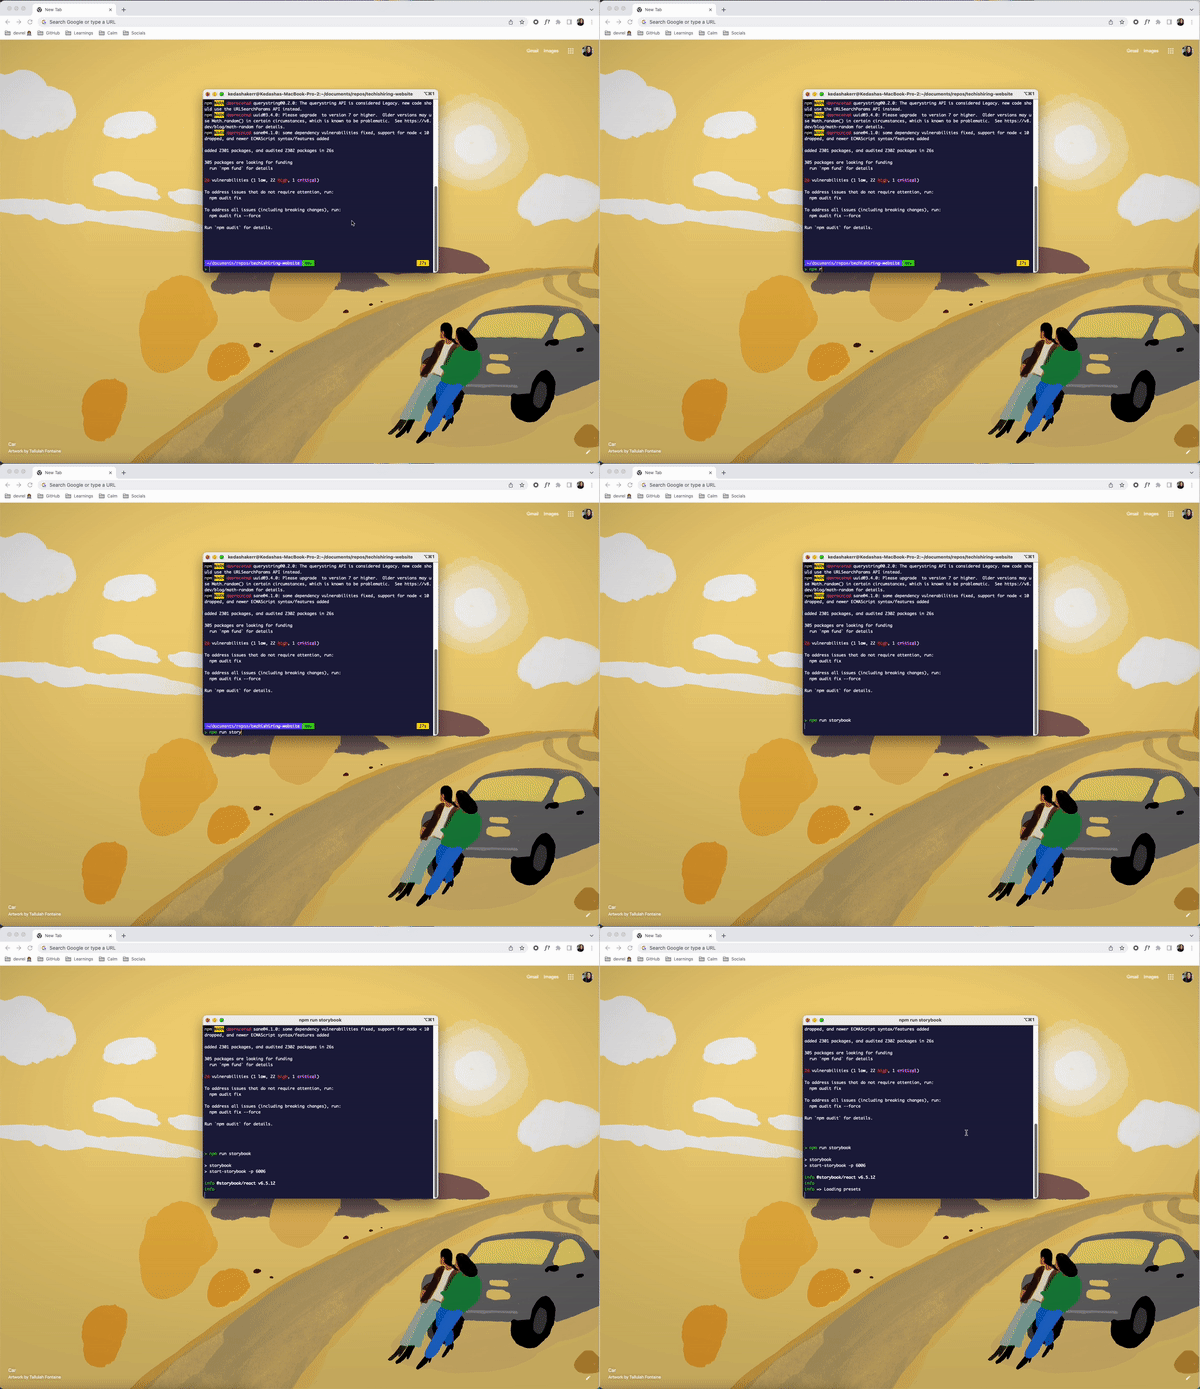
This project uses storybook, so let’s run both storybook and spin up the actual app locally.
The process is not so bad, but it took a bit of time. We also need to check to make sure we’re using the correct node version, check if we need any environment variables, and if there are any runtime errors to resolve. Thankfully, I didn’t encounter any errors while working on this, but it still took a bit of time.
Going faster with GitHub Codespaces and dev containers
Let’s make the process better by adding a devcontainer.json file to this project and opening it in GitHub Codespaces to see what happens.
We can either use the VS Code command palette to add a pre-existing dev container or we can write the configuration file ourselves (which we’ll do below).
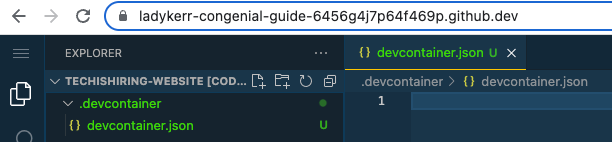
Let’s first create a .devcontainer folder in the root of the project and a devcontainer.json file in the new folder.
Now, let’s automate installing dependencies, starting the dev server, opening a preview of our app on localhost:3000, and installing vscode extensions. Once we get everything configured, your json file should look like this:
{
  // image being used
   "image": "mcr.microsoft.com/devcontainers/universal:2",
  // set minimum cpu
   "hostRequirements": {
       "cpus": 4
   },
   // install dependencies and start app
   "updateContentCommand": "npm install",
   "postAttachCommand": "npm run dev",
   // open app.tsx once container is built
   "customizations": {
       "codespaces": {
           "openFiles": [
               "src/pages/_app.tsx"
           ]
       },
       // install some vscode extensions
       "vscode": {
           "extensions": [
               "dbaeumer.vscode-eslint",
               "github.vscode-pull-request-github",
               "eamodio.gitlens",
               "christian-kohler.npm-intellisense"
           ]
       }
   },
   // connect to remote server
   "forwardPorts": [3000],
   // give port a label and open a preview of the app
   "portsAttributes": {
      "3000": {
         "label": "Application",
         "onAutoForward": "openPreview"
       }
     }
}
Sidenote: I’ve broken down the purpose of the properties in this file for you by adding comments before each. To learn more about each property, continue reading at container.dev. I also installed a few extensions that are not needed, but I wanted to show you that you could automate installing extensions, too!
Let’s commit the file and merge it into the main branch, then open up the project in GitHub Codespaces.
When we open up the application in GitHub Codespaces, our dependencies will be installed, the server will start, and a preview will automatically open for us. If we needed environment variables to work on this repository, those would have already been configured for us as a repository secret on GitHub. We also didn’t need to install hefty node_modules to our machine.
I call this a win!
Comparing both ways
There’s plenty more that we can do with dev containers and GitHub Codespaces to automate our dev environment. But let’s summarize what we just did in GitHub Codespaces and with the help of dev containers:
We clicked the GitHub Codespaces button on the GitHub repository.
Everything was setup/installed for us (thanks json file!).
We got to work and started coding.
Now, isn’t that better?
Wrapping up
So, what’s the point of GitHub Codespaces and why should you care as a developer? Well, for one, you can automate most of the startup processes you need to access a repository. You can also do a lot more customizations to your dev environment with dev containers. Take a look at all the options you have—and watch out for my next blog post where I’ll go through the anatomy of a devcontainer.json file.
Secondly, you can code from anywhere. I hate it when I’m not able to access one of my side projects on a different machine because that one machine is configured perfectly to suit the project. With GitHub Codespaces, you can start coding at the click of a button and from any machine that supports a modern browser.
I encourage you to get started with GitHub Codespaces today and try adding a devcontainer.json file to one of your projects! I promise you won’t regret it.
Linus Torvalds released
6.3-rc1 and closed the 6.3 merge window as expected on March 5.
By that time, 12,717 non-merge commits (and 848 merges) had found their
way into the mainline kernel; nearly 7,000 of those commits came in after the first-half merge-window summary was
written. The second half of the 6.3 merge window was thus a busy time,
with quite a bit of new functionality landing in the mainline.
The first drivers (and the abstractions supporting them) that will
start to be upstreamed are likely to be the Asahi Linux’s GPU
driver, Android’s Binder and the NVMe driver. These are all
non-trivial and will set the example for future Rust kernel
abstractions and drivers.
„-Г-жо, това не го разбрах, може ли да ми го обясните пак. (госпожа Колева обяснила но той пак не разбрал).
– За домашно напиши 20 пъти в тетрадката правилата за умножение на десетични дроби и ще го разбереш! – наредила госпожата”
Прибирам се вкъщи и гледам в стаята на сина ми – петокласник от Патриарх Евтимий в Пловдив, кипи някаква литературна дейност.
„- Какво толкова пишеш? – питам аз
– Г-жата по математика каза да напиша 20 пъти павилата за умножение на дроби в тетрадката.
– Какво пак си се издънил, та са те наказали?”
И той разказа сучката по-горе. Майка му му беше казала да си пита ако нещо не разбира, защото изтърве ли материал, после няма наваксване.
„- Ама чакай сега, математика се учи с решаване на задачи, а не с писане на правила за умножение. Това не ти е английски, почвай да решаваш.
– Как да ги реша като не разбирам?
– Ела тук тогава с учебника. – нареждам аз.
– Ама не искам с теб, ти пак ще ме накажеш. Искам с Бобо (големия му брат) или в Събота на урока по математика (ходим на допълнителни уроци по математика)”
И всичко може би щеше да продъжи по старо му (за което „по старо му” ще разкажа след малко), ако в 18.15 по вайбър групата на децата, чрез която общуват с г-жа Колева не пристигна домашно под формата на примерен тест за следващия ден.
Това добре, но децата в този ден имаха 9 часа. На мен ми се виждат много за петокласник, но това е положението в Голямата Лиляна (така наричат Училище Патриарх Евтимий в Пловдив)
От доста време ми прави впечатление, че нещо не е наред с този „учителски колектив” в уж елитното Пловдивско училище Патриарх Евтимий (Малката Лиляна) и съответно се наложи да поразбутам нещата. Не може дядо му да е математик, баща му математик, брат му с 92 точни на външното оценяване по математика, частни уроци веднъж седмично и занимание с родителите веднъж седмично и нещата да са толкова зле с математиката. Тоест може, но трябва малкия да е абсолютен дебил, но той въобще не дава такива признаци. Напротив, доста е креативен.
ДОМАШНИТЕ
Тръгнах с обръщане на лично внимание от сорта „-Дай си учебника и покажи домашните.”
Да, да ама Не, както казваше Петко Бочаров. Няма ориентиране. Веднъж са в Тиймс, веднъж са във Вайбър, веднъж в тетрадката, друг път устно или снимка с телефона от дъската.
И както често става да му забраня компютъра или да му огранича телфона с родителския контрол, този малкия грам идея си няма какви домашни има. Както се вижда, често пъти идват по някоя социална платформа след занятията.
Ся… Наречете ме динозавър, но в моите спомени другарката пишеше на дъската кои са задачите за домашно, ние ги преписвахме в тетрадките, отваряхме ги върху чина, тя минаваше и проверяваше дали са попълнени в тетрадките и родителите трябваше само да поискат тетрадката. Пет пъти като го направи и децата се научаваха. Само непослушковците си губеха тетрадките после. Но който искаше или беше разсеян, винаги знаеше каква му е домашната.
Днес трябва да знам коя платформа работи на телефона на госпожата, за да се ориентирам каква е домашната.
Не мога да ограничавам и достъпа на малкия до компютър или до телефон, защото и той няма да може да си види домашните.
За мен това не е редно! По-скоро смятам, че е грашно и противопоказно. Поне реалутатите това показват.
НЕРАЗБИРАНЕТО В КЛАС
Да речем, че се оправим с домашните. Идва втория проблем. Как очакваме той да си реши домашните, като не е разбрал задачитев клас. Не ми се рови назад в корепонденцията, но съм попадал и на случки когато са предавани по 2 урока. Няма лошо, но да ги разберат, а те не ги разбират по принцип. И няма как да ги разберат. Индивидуалното изпитване на дъската май вече не се практикува. Практикува се бясно преподаване и контролни. Явно е по-лесно да се изпиват всички на веднъж.
Естествено по някое време се появява съмнение в педагогическите методи прилагани от учителката и започваш да се оглеждаш. Започваш да разпитваш родители на деца в други паралелки. В съседната паралелка, учителката надушила, че децата не са разбрали задачите и взела часа на класния + още един час, предупредила родителите, че ще задържи децата след училище и преподала отново материала. И родителите казват „-Ами много сме доволни от училището”
Е как няма да са доволни. И аз ще съм доволен, ама яво сме изтеглили късата клечка с „учителския колектив”
ПРЕДВАРИТЕЛНАТА ИНФОРМАЦИЯ
В началото на годината с адв. Кендова,като загрижени родители решихме да осигурим най-добрия колектив на детето. Отидохме 2 пъти до училището да се видим с директорката, но попаднахме на заместничката по учебната част. Не ни предостави никаква информация. Всички били супер и невероятни. А какво се оказа в последствие – в единия клас ги водят в Китай на турнир по математика, а ние не можем домашните да си намерим. Друг е въпросът, че явно не предоверихме и не направихме всичко възможно да получим информацията и да направим прословутия „информиран избор”. Оказа се че много добре са знаели по онова време кои учители за кои класове ще отговарят.
Късата клечка отвсякъде.
ЧАСТИТЕ УРОЦИ
От ден първи надушихме, че нещо не е наред с „педагогческите похвати”, но нали сме с нови
учители и в нов клас, нямаше как да вдигаме пара. Решихме по изпитаната добра рецепта да дублираме каквото можем с частни уроци. При големия ни син сработи много добре тази система. Ангажирахме учител от друго училище за да няма конфликт на интереси и всяка събота вместо да се шляем из родината, ние сме на уроци по математика.
До тук добре, но се оказа, че доста деца от нашето училище ходят при тази учителка. Самата тя още в началото ни информира, че учителките в Патриарх Евтимий Пловдив пришпорват децата и „хвърчат” напред с материала. Така и стана. Рабрал-неразбрал, следващия урок вече се преподава. На една родителска среща дори г-жа Колева ни обасни че частните уроци много спъвали работата и, защото тя държала да преподаде урока първа.
Тук за първи път се позамислих, дали пък да не започнем по 2 урока в седмицата да взимаме, вместо един. Да ама частната учителка няма свободни часове, а и детето няма време. Както казах има дни с по 9 часа и тонове домашни. Не е толкова проста тази работа, да се откачиш от хватката на българското училище въпреки, че класната вече ни предложи на всеослушание да се преместим в друго училище, щом това не ни харесва. Но това ще разкажа в следващия разказ „За КЛАСНАТА в училище Патриарх Евтимий Пловдив”.
Тук искам да кажа, че ако детето Ви е изтеглило късата клечка с лош „колектив’, частните уроци няма да ви помогнат, защото физическото време на детето няма да му стигне за тях. Все пак домашни има и по другите предмети, не само по математика. Ще разказвам и за тях по-натам.
РОДИТЕЛИТЕ УЧАТ С ДЕЦАТА
Това е новата мантра – „Родителите трябва да учат с децата.”
И както е модерно в днешно време, за да звучи една лъжа правдоподобно е хубаво да я примесиш с малко истина.
Сетих се за вица за Александър Македонски, с чието образование не се е ангажирал баща му – Филип Македонски, а небезизвестният древногръцки мислител АРИСТОТЕЛ!
Въздъхнала учителката по история един ден:
„-Еееех Иванчо, Иванчо! А на твоята възраст Александър Македонски е владял половината свят.”
– Така е госпожо, но на него учител му е бил Аристотел! – отвърнал Иванчо.”
Представих си за момента как Аристотел е издълбал с длето и чук на някой камък „За домашно, папирус 12, от булаха надолу!” и е добавял „-Кажи на баща ти да удари един пръстен с мастило отдолу да знам, че ти е видял домашното.”
Сигурен съм, че някъде в основите на училище Патриарх Евтимий в Пловдив, стои подобен камък. Въпрос на разкопки е. Все пак бащата на Александър Велики – Филип Македонски е градил този град, който от тогава е център на културата и просветата.
С две думи не Александър Македонски, а Филип Македонски е бил щастливец, че е познавал Аристотел.
В тази връзка – няма лошо детето да учи у дома с родителите, но ако е 10-12 часа в чилище с учителите, защо оаквате родителите да обръщат внимание след 18.00 като се приберат от работа?
Опичайте си акъла родители. Ако ще се записвате в Голямата Лиляна в Пловдив, не го правете без предварителна информация, че нещата не само ще са зле, ами ще са и противопоказни. Времето на детето се изсмуква изцяло и няма да имате физическа възможност да корегирате грешните педагогически практики с частни уроци.
Last week, the Biden administration released a new National Cybersecurity Strategy (summary here). There is lotsofgoodcommentaryoutthere. It’s basically a smart strategy, but the hard parts are always the implementation details. It’s one thing to say that we need to secure our cloud infrastructure, and another to detail what the means technically, who pays for it, and who verifies that it’s been done.
One of the provisions getting the mostattention is a move to shift liability to software vendors, something I’ve been advocating for since at least 2003.
To provide the best experiences, we use technologies like cookies to store and/or access device information. Consenting to these technologies will allow us to process data such as browsing behavior or unique IDs on this site. Not consenting or withdrawing consent, may adversely affect certain features and functions.
Functional
Always active
The technical storage or access is strictly necessary for the legitimate purpose of enabling the use of a specific service explicitly requested by the subscriber or user, or for the sole purpose of carrying out the transmission of a communication over an electronic communications network.
Preferences
The technical storage or access is necessary for the legitimate purpose of storing preferences that are not requested by the subscriber or user.
Statistics
The technical storage or access that is used exclusively for statistical purposes.The technical storage or access that is used exclusively for anonymous statistical purposes. Without a subpoena, voluntary compliance on the part of your Internet Service Provider, or additional records from a third party, information stored or retrieved for this purpose alone cannot usually be used to identify you.
Marketing
The technical storage or access is required to create user profiles to send advertising, or to track the user on a website or across several websites for similar marketing purposes.




 AWS Pi Day – Join us on March 14th for the third annual


 МАТЕМАТИЧКАТА Елена Колева – разказ по преживяно