Everything Open call for proposals

Post Syndicated from original https://lwn.net/Articles/917792/

Everything Open is,
seemingly, the future form of the conference once known as linux.conf.au;
see this
page
for a discussion of the reasoning behind the change. The
inaugural event will be held March 14 to 16 in Melbourne,
Australia, and the call for
proposals
has gone out now, with a deadline of January 15.
“Our aim is to create a deeply technical conference where we bring
together industry leaders and experts on a wide range of subjects.
”

CVE-2022-27518: Critical Fix Released for Exploited Citrix ADC, Gateway Vulnerability

Post Syndicated from Glenn Thorpe original https://blog.rapid7.com/2022/12/13/cve-2022-27518-critical-fix-released-for-exploited-citrix-adc-gateway-vulnerability/

CVE-2022-27518: Critical Fix Released for Exploited Citrix ADC, Gateway Vulnerability

Emergent threats evolve quickly, and as we learn more about this vulnerability, this blog post will evolve, too.

On Tuesday, December 13, 2022, Citrix published Citrix ADC and Citrix Gateway Security Bulletin for CVE-2022-27518 announcing fixes for a critical unauthenticated remote code execution (RCE) vulnerability that exists in certain configurations of its Gateway and ADC products. This vulnerability has reportedly been exploited in the wild by state-sponsored threat actors.

In a blog post, Citrix states that no workarounds are available for this vulnerability and that customers running an impacted version (those with a SAML SP or IdP configuration) should update immediately.

Citrix is a high-value target for any capable attacker; earlier today, the National Security Agency (NSA) published Citrix ADC Threat Hunting Guidance warning that Citrix ADC is being targeted by state-sponsored adversaries.

Affected products

The following customer-managed product versions are affected by this vulnerability so long as the ADC or Gateway is configured as a SAML SP or a SAML IdP:

  • Citrix ADC and Citrix Gateway 13.0 before 13.0-58.32
  • Citrix ADC and Citrix Gateway 12.1 before 12.1-65.25
  • Citrix ADC 12.1-FIPS before 12.1-55.291
  • Citrix ADC 12.1-NDcPP before 12.1-55.291

Citrix’s blog post also contains information on how to determine if your configuration is a SAML SP or a SAML IdP.

Mitigation guidance

No workarounds are available; impacted organizations should update to one of the following versions on an emergency basis:

  • Citrix ADC and Citrix Gateway 13.0-58.32 and later releases of 13.0
  • Citrix ADC and Citrix Gateway 12.1-65.25 and later releases of 12.1
  • Citrix ADC 12.1-FIPS 12.1-55.291 and later releases of 12.1-FIPS
  • Citrix ADC 12.1-NDcPP 12.1-55.291 and later releases of 12.1-NDcPP

Rapid7 customers

InsightVM customers will be able to assess their exposure to CVE-2022-27518 with the content release scheduled for December 13, 2022.

A Behind the Scenes Look at Our US East Data Center

Post Syndicated from original https://www.backblaze.com/blog/a-behind-the-scenes-look-at-our-us-east-data-center/

In the last couple of years, Backblaze has taken residence in three new data center facilities. In the West, we added the CyrusOne facility in Chandler, Arizona and the Nautilus Data Center in Stockton, California. In the East, we just added the Coresight facility in Reston, Virginia as our anchor to our new U.S. East data region. Each of these data centers will house over an exabyte of customer data. A number like an exabyte of storage is nice, and we’ll share a bunch more numbers as we go. But what I really wanted to share are the stories behind the scenes as we moved into the Coresight facility in Reston, which we call IAD 1.

The process of turning a big empty room into a data center location is complex and requires intense coordination, an adaptable project plan, and folks who can think on their feet. Let’s face it, no project is perfect, and building out a data center is no different. But, once in a while, it’s fun to peek behind the curtain to see how the actual work gets done. Let’s take a look.

Big Boxes, Tight Spaces, and Construction

There were over 700 boxes of various shapes and sizes to be received at the IAD site. This included server cabinets, storage servers, support servers, networking equipment, and other odds and ends. The cabinet and storage server boxes were particularly large, and only four of these boxes at a time could fit into the service elevator used to move everything from the loading dock to the Backblaze facility on the fourth floor.

Cabinets and servers are normally received almost daily, but the IAD data center was undergoing construction which limited where and how trucks could unload their cargo. One poor fellow spent the better part of three hours trying to manipulate his semi into the loading dock. The construction also limited the amount of cargo that could stay in the dock area to basically zero. When a truck arrived and started unloading Backblaze goods, our process was: load four boxes, go up four floors, unload four boxes, go down four floors, and repeat until the truck was empty.

Each time a truck arrived, the race was on, and there were a lot of trucks as everything was scheduled to arrive within a 30-day window. Why 30 days? We wanted to install the cabinets all at once, so we could run the networking once and not have to piecemeal it in. To help out, we enlisted the help of the Coresight staff to assemble and install the cabinets, while we ran the networking and installed the servers and other gear.

Taking the Long Way Home

The Backblaze presence is spread across two buildings. One building houses the data center itself and includes the maintenance area. The Backblaze office is located in another building. It’s not ideal, but sometimes things work out that way. But, what it means is this: If you don’t know where you are going you’re either not supposed to be there or you are new. Data centers are not known for having a lot of “you are here” signs, nor are there a lot of folks around to ask if you are lost.

Being new can turn a five minute walk from the office to the data center floor into a 30 minute expletive laden stroll through unmarked halls and deadend corridors complete with visions of serial killers being behind every door. Lucky for us, Coresight does background checks on all their employees.

Let’s Talk Boxes

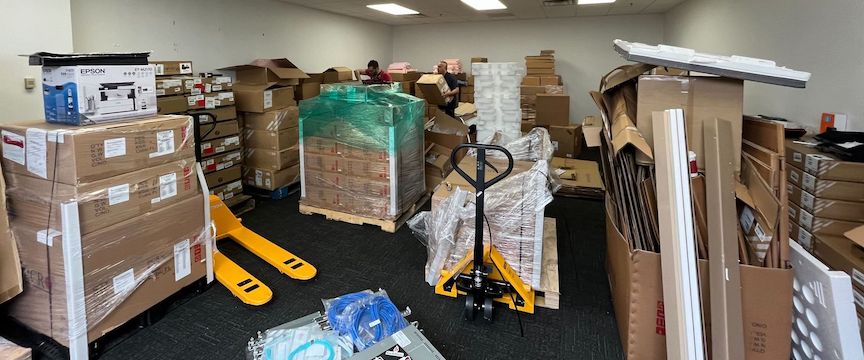
While Backblaze was responsible for getting the boxes to the new space and unboxing the contents, Coresight helped out by providing us with some temporary storage space as we built out our facility. Given our aggressive schedule, things occasionally got messy (as seen below).

Shortly after this photo was taken, we learned the site had “the crusher”, which takes boxes or garbage or whatever and, well, crushes such things into dumpster-suitable or recycling-suitable packages. While not as fun as a Megabot, the crusher ensured that we didn’t lose any employees under an avalanche of boxes.

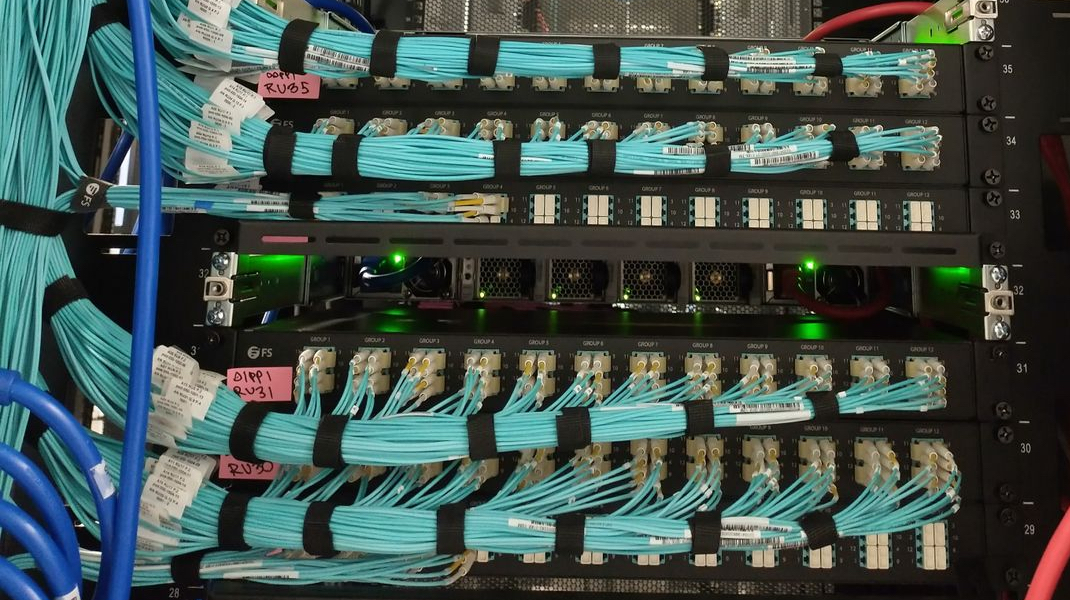
How many boxes? Well, there were 126 boxes containing cabinets, one per box. Each cabinet was assembled and installed by the Coresight folks. There were hundreds of smaller boxes containing networking servers, conduits, networking cables, and, of course, thousands of various types of cable ties used by the Backblaze cabling ninjas as we see below.

The cabinets are 52U tall, and 120 of them will be used to house 1,440 storage servers which will make up 72 Backblaze Vaults. Each vault consists of twenty storage servers. Each storage server has 60 16TB drives, which totals 960TB of raw storage per server. Doing the math, the IAD data center will have over 1.3EB of raw storage. Subtracting formatting and parity, the capacity is still over 1EB. Of course, over time we expect to use larger hard drives in all of our data centers as the cost per gigabyte for hard drives continues to decrease.

A Note on Parity

The IAD data center uses our own open-source Reed-Solomon erasure coding in a 16/4 data/parity scheme for storing data. This is our new normal when using 16TB drives and above, versus the 17/3 scheme used with smaller drives. This helps lessen the time it takes to recover from a failed drive in our farm.

My Kingdom for a Storage Pod

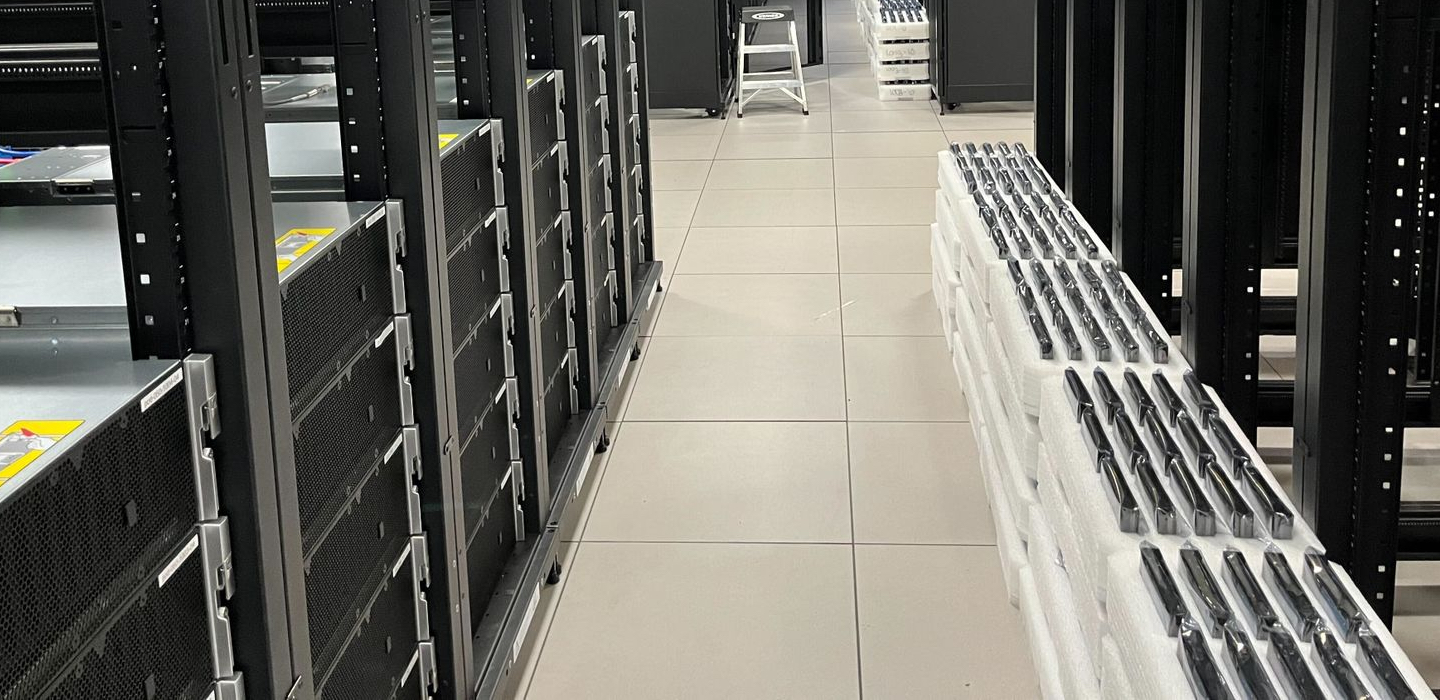
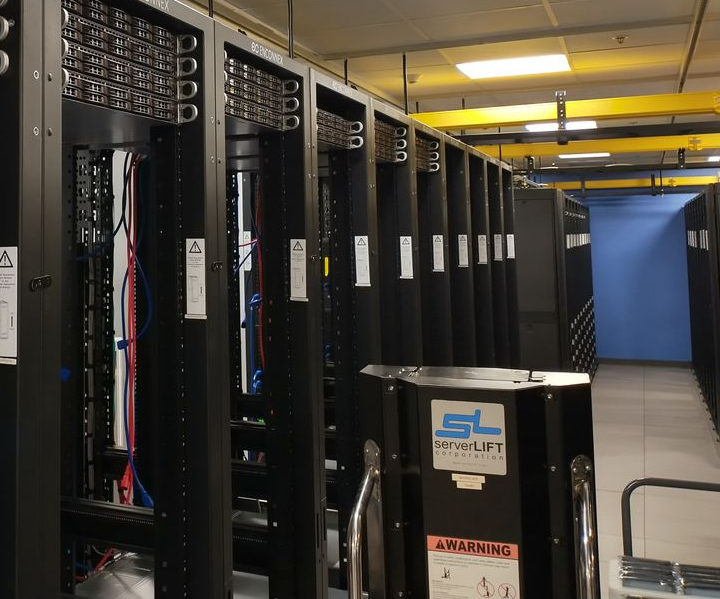
Not to be a villain here, but there are no Backblaze Storage Pods in the IAD 1 data center. All 100 of the storage servers used for the initial build out of the IAD data center are the Supermicro models we detailed in the recent Storage Pod Story blog post. You can see from the photo below each of the five vaults are racked and waiting for their hard drives to be installed. Maybe one day Supermicro will make us some pretty red bezels.

An Old Friend to the Rescue

The 52U Enconnex cabinets are 94.49 inches (2400 mm) tall. The 4U Supermicro storage servers will eventually be stacked 12 high in the cabinet, leaving 4U at the top of each for 1U core servers and IPMI (Intelligent Platform Management Interface) switches. Lifting a 4U 150lb (68kg) storage server is difficult, but so is lifting a 1U core server to nearly eight feet high. We needed some muscle, and there’s no one better than Guido, our first and most experienced server lift. He was flown in from the Phoenix data center to help the IAD staff get set up, and if he likes the gig he can stay. After all, he earned the right to a choice after nearly 12 years of heavy lifting for Backblaze.

Power

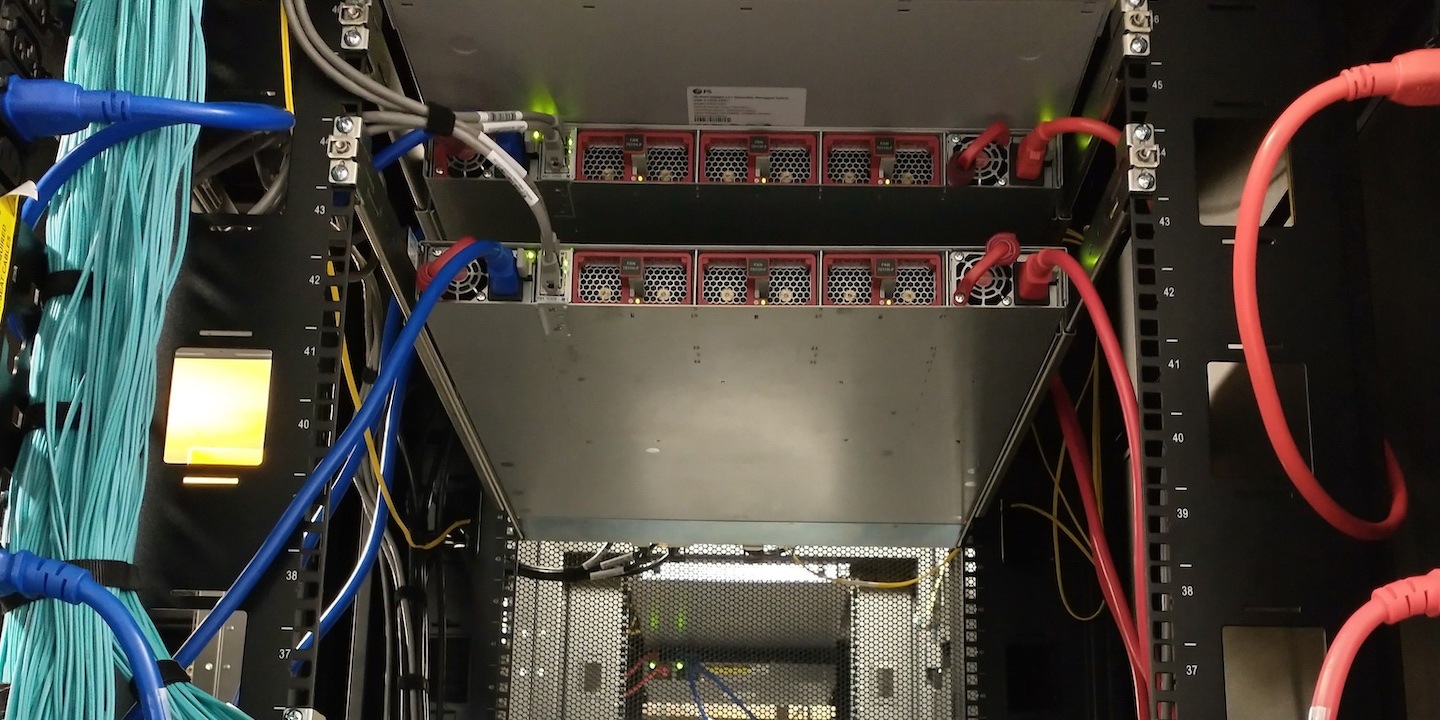
The data center provides fully redundant power to each cabinet. Each separate power source connects to a PDU in each cabinet. In each cabinet, there is a red PDU and a blue PDU with each color representing a power source. Since most of the servers we use in the data center support redundant power, a given server connects to each PDU (red and blue) in their cabinet as shown below.

The PDUs that we used were recommended by the data center and not a brand we had used before. The PDU manufacturer does not make the power cables, but they do recommend a couple of brands. We happened to like our red and blue cables and used them instead. We were surprised to discover they were a bad fit and kept falling out of the PDUs—so much for standards. Amazingly, it just so happens that a company makes PDU plug locks to keep the plugs from falling out. The plug locks also help when someone accidentally bumps into a power plug connected to the PDU while working on some equipment, so there’s that.

Security

As with all data center facilities, security is a prime concern. At the Coresite facility, Backblaze personnel must pass through a minimum of four checkpoints to get from the parking lot to the Backblaze data center facility or the Backblaze office. Along the way, both badge access and biometric scans are employed—sometimes separately and sometimes together. In addition, Backblaze personnel are limited in where they can go. For example, they are not allowed on the second and third floors of the data center building, only the fourth floor, and then they can only enter our facility. Getting lost while going from the office to the datacenter floor should make a little more sense now.

Within the Backblaze facility there are cameras that monitor everything inside. There are also cameras used by the Coresight staff to monitor the common areas such as hallways, the loading dock, and the parking lot. Before you can enter or leave the parking lot, an access badge and visual confirmation are required by the Coresight staff. This led to a very interesting dinner one evening for Backblaze and Coresight personnel…

Huevos Rancheros

Several of the Backblaze staff were temporarily deployed to Reston to set up the IAD data center. One of their favorite places to eat was Ted’s Bulletin, located in Reston near the data center. They serve breakfast all day until they close at 10 p.m. or so. Working into the evening is typical for data center set ups, and the gang decided to order from Ted’s and have it delivered via DoorDash so they could keep working.

The Dasher arrived with their order at the back gate of the compound. That’s not a public entrance and the Dasher was told to go around to the public gate. “This is where it says to go,” said the Dasher. He wasn’t even sure where he was; he just followed the GPS. Jack, who placed the DoorDash order, got a call from the Dasher. He was going to leave if someone didn’t meet him at the gate. Not wanting to see his huevos rancheros go to waste, Jack found his way to the back gate talking to the Dasher all the way so he wouldn’t leave. Jack showed his credentials to the security camera, but they would not open the gate. Why? The Dasher was a visitor at a non-visitor gate, and Jack was not a vehicle that needed to exit. The compromise; the Dasher was allowed to hand Jack the containers of food through a narrow opening in the gate. Jack showed his huevos rancheros and the other delights to security as he passed through the various checkpoints to get to a Backblaze office, and breakfast for dinner was had by all.

Three days later they wanted Ted’s again. They drove.

Epilogue

The Backblaze U.S. East data region is ready to go with five Backblaze Vaults online and accepting data. That’s 100 servers and thousands of connections open for business on day one with more vaults waiting in the wings to be deployed by the end of the year. Many thanks to Jack, Jessie, Zachary, Brent, Rich, Mark, and the supporting cast back at Backblaze HQ in San Mateo for getting IAD 1 up and running. Jessie and Zachary are part of the permanent crew at IAD 1 with more folks joining them over the coming months.

One last shoutout to the IAD crew for having the courage and sense of humor to share their stories with me. Having a Dasher squeezing your huevos through a gate in the dark while security folks watch on a live feed is not something I could ever make up. Thanks again.

Putting the New Region to Work for Your Business

With the addition of the new region, customers have more options for storing data and replicating datasets to separate cloud locations. Even better: Egress is free for Cloud Replication across the Backblaze platform. Go to our website for more information, check out our FAQ, and feel free to contact our Support Team if you have any questions.

The post A Behind the Scenes Look at Our US East Data Center appeared first on Backblaze Blog | Cloud Storage & Cloud Backup.

AWS Analytics sales team uses QuickSight Q to save hours creating monthly business reviews

Post Syndicated from Amy Laresch original https://aws.amazon.com/blogs/big-data/aws-analytics-sales-team-uses-quicksight-q-to-save-hours-creating-monthly-business-reviews/

The AWS Analytics sales team is a group of subject-matter experts who work to enable customers to become more data driven through the use of our native analytics services like Amazon Athena, Amazon Redshift, and Amazon QuickSight. Every month, each sales leader is responsible for reporting on observations and trends in their business. To support their observations, the leaders track key metrics for their region as part of their monthly business review (MBR).

Today, sales leaders use a QuickSight dashboard to analyze these key metrics. Establishing a baseline is a time-intensive process that requires navigating various tabs and filters. To save time, analytics sales managers for the Americas regions have been eager to ask QuickSight Q, in their own business language, questions like “Who are my top customers by month-over-month revenue?” or “How much did Customer X spend on Amazon Redshift this month compared with last?”

Rather than manually filtering their views to understand the underlying signals, they now use the native capabilities of QuickSight Q, resulting in many hours saved per leader.

These sales leaders can instead focus on “why it happened” and “what’s coming next” (spoiler alert: Q supports “why?” and forecast questions).

Since each leader reports on the same metrics each month, they would like to save each QuickSight Q answer, curated for their region, so they can focus on growing their business. With QuickSight Q pinboards, they can do just that. They can pin visuals for one-click access to frequently asked questions. Every time the dataset updates, the visual will reflect the latest data, all of which gets rendered in seconds because of SPICE (Super-fast, Parallel, In-memory Calculation Engine).

The features explored in this post are part of Amazon QuickSight Q. Powered by machine learning (ML), Q uses natural language processing to answer your business questions quickly. If you’re an existing QuickSight user, be sure that the Q add-on is enabled. For steps on how to do this, see Getting started with Amazon QuickSight Q.

Personalized data for sales managers

Kellie Burton, Sr. QuickSight Solutions Architect, and Amy Laresch, a Product Manager for QuickSight Q, worked with sales leaders Patrick Callahan, US West, and Jeff Pratt, US Central, to build a QuickSight Q topic for Americas Analytics revenue. A topic is a collection of one or more datasets that represents a subject area that business users can ask questions about. The Americas Analytics topic is built on a revenue dataset that is protected with row-level security (RLS), so any question asked is restricted by the same rules.

To keep the topic focused and avoid potential language ambiguity, Kellie and Amy used copies of previous MBR deliverables to understand what measures, dimensions, and calculated fields were required in the topic. With QuickSight Q automated data prep, the calculated fields were automatically added to the topic, so the topic authors did not have to recreate them. With Q, readers could ask questions like “year-to-date (YTD) YoY % for us-west analytics by segment” to get the exact table view that Patrick includes in his MBR. During a usability session, the authors worked with Jeff and Patrick to ask Q each required question and save it to their pinboard.

After opening his completed pinboard, Jeff said, “Wow, that is really cool. It answers all the questions I write the MBR for in my own custom pinboard. A report that used to take me 2-3 hours to pull together will now only take me 5 minutes.” With the extra time, he’s energized to focus more on the story behind the data and planning for future.

Patrick shared Jeff’s sentiment saying, “This will be awesome for next month when I write my MBR. What previously took a couple of hours, I can now do in a few minutes. Now I can spend more time working to deliver my customer’s outcomes.”

Completed sales pinboard showing visualizations like a bar chart for top 10 customers, using sample data from the Software Sales sample topic

Sample pinboard for a sales leader for the Americas region with mock data (from the Software Sales sample topic)

Once you have an answer to a question, you might want to understand why that happened. This is where Q Why questions come into play.

Why questions

Understanding why is critical to making data-backed decisions to delight your customers and grow your business. For example, in this Software Sales sample topic, I asked Q for monthly revenue and noticed a drop in October 2022.

Amazon QuickSight Q displaying a monthly revenue trend line chart

Mock data from the Software Sales sample topic

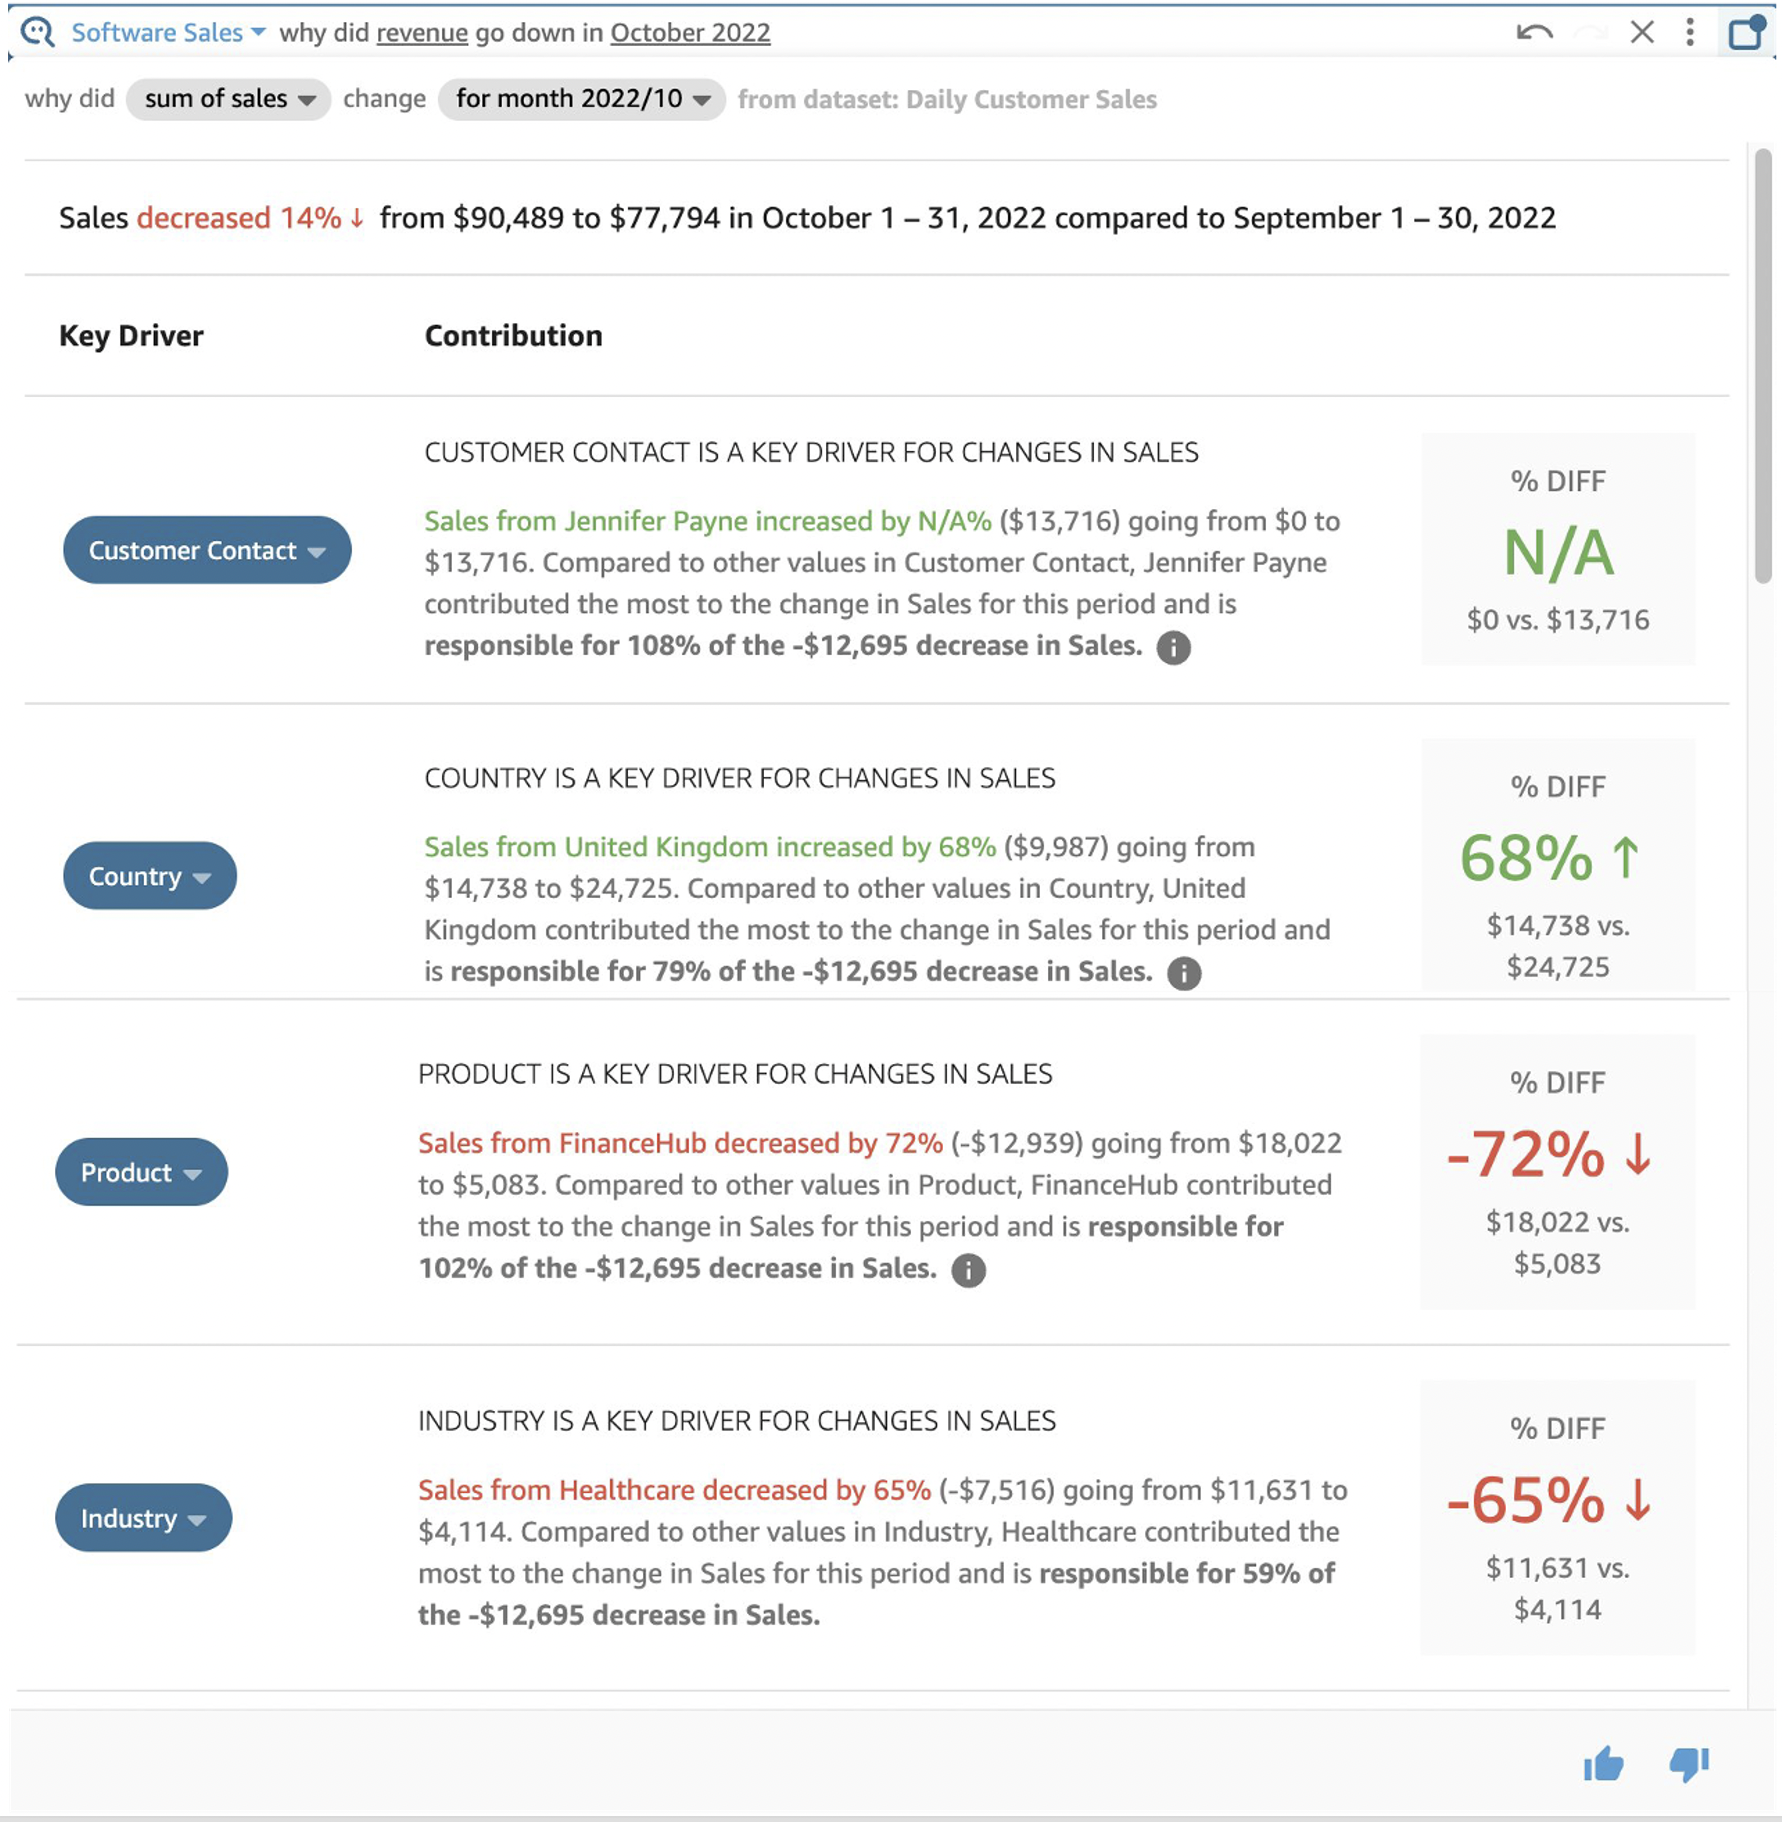
I ask Q, “Why?” and see four key drivers: Customer Contact, Country, Product, and Industry.

Amazon QuickSight Q Why visual displaying four key drivers for why revenue dropped in October 2022

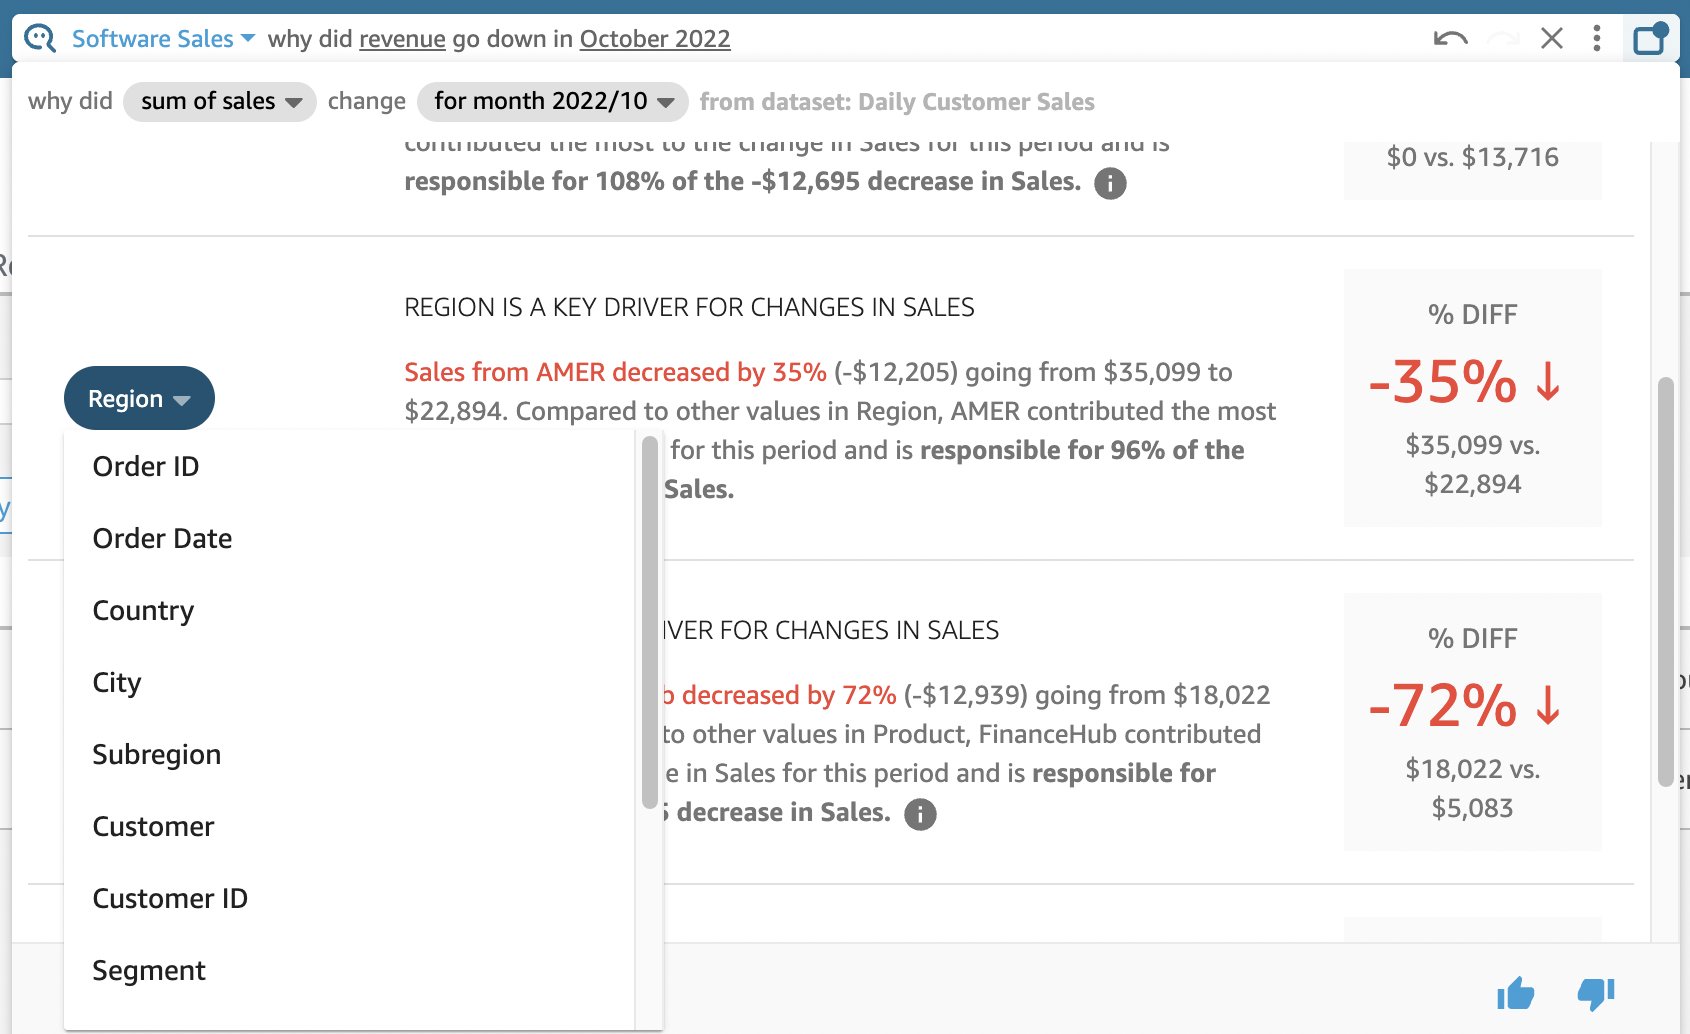
Next, I change Country to Region to see the impact at a higher level.

Amazon QuickSight Q Why visual with dropdown open to change a key driver

Forecast questions

Next, I can ask Q for a forecast that uses ML and factors, like seasonality, to predict the trend.

Amazon QuickSight Q forecast question showing trend for revenue

With pinboards, why questions, and forecast questions, QuickSight Q not only saves significant time and energy but delivers insights that previously required the help of an analyst or data scientist. Reflecting on the project, Kellie shared, “It’s been fun building on the bleeding edge of analytics. I’m so excited to see what Q will do in 2023!”

To learn more, watch What’s New for Readers with Amazon QuickSight Q and What’s New for Authors with Amazon QuickSight Q.


About the authors

Amy Laresch is a product manager for Amazon QuickSight Q. She is passionate about analytics and is focused on delivering the best experience for every QuickSight Q reader. Check out her videos on the @AmazonQuickSight YouTube channel for best practices and to see what’s new for QuickSight Q.

Kellie Burton is a Sr. Solutions Architect for Amazon QuickSight with over 25 years of experience in business analytics helping customers across a variety of industries. Kellie has a passion for helping customers harness the power of their data to uncover insights to make decisions.

Scaling AWS Outposts rack deployments with ACE racks

Post Syndicated from Sheila Busser original https://aws.amazon.com/blogs/compute/scaling-aws-outposts-rack-deployments-with-ace-racks/

This blog post is written by Eric Vasquez, Specialist Hybrid Edge Solutions Architect, and Paul Scherer, Senior Network Service Tech.

Overview

AWS Outposts brings managed, monitored AWS infrastructure, compute, and storage to your on-premises environment. It provides the same AWS APIs, and console experience you would get within the AWS Region to which the Outpost is homed to. You may already have an Outposts rack. An Outpost can consist of one or more racks creating a pool of consumable resources as a single logical Outpost. In this post, we will introduce you to an Aggregation, Core, Edge (ACE) rack.

Depending on your familiarity with the Outpost family, you might have already heard about an ACE rack. An ACE rack serves as an aggregation point for multi-rack Outpost deployments. ACE racks reduce the physical networking port requirements as well as the logical interfaces needed, while allowing for connectivity between multiple racks in your logical Outpost. ACE racks are recommended for customers with planned deployments beyond three racks excluding the ACE rack itself.

We recommend that all customers leverage an ACE rack if planning expansions beyond three racks in the long-term, even if the initial deployment is a single rack. An ACE rack contains four routers, and these routers can connect to either two or four customer upstream devices. For the best redundancy, reliability, and resiliency, we recommend deploying an ACE rack to four upstream customer devices.

ACE racks support 10G, 40G, and 100G connections to a customer network. However, 100G connections between each ACE router to a customer device are recommended.

Outpost architecture aceOutpost extension from region and ACE rack deployment in a 15 rack Outpost configuration

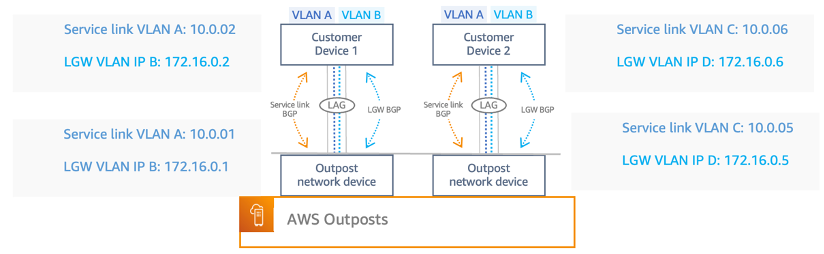
Each Outposts rack comes standard with redundant Outpost networking devices, power supplies, and two top-of-rack patch panels which serve as demarcation points between the Outpost rack and your customer networking device (CND). For the remainder of this post, we’ll refer to the Outpost Networking Devices as OND and customer switches/routers as CND. The Outpost rack ONDs form Border Gateway Protocol (BGP) neighbor relationships with either your CND or the ACE rack using point-to-point (P2P) Virtual LAN (VLAN) interfaces.

For Outposts installation without an ACE rack, each Outposts OND connects to your LAN using single-mode or multi-mode fiber with LC connectors supporting 1G, 10G, 40G, or 100G connectivity. We provide flexibility for the CNDs and allow either Layer 2 or Layer 3 devices, including firewalls. Each OND uses a single LACP port channel that carries 2 VLAN point-to-points virtual interfaced (VIF)to establish 2 BGP relationships over the port channel to your upstream CND and aggregate total bandwidth. This results in each Outpost rack requiring a minimum of two physical uplinks, but as a general best practice we recommend two-per-device for a total of four uplinks, along with two LACP port channels and 4 VLAN to establish point-to-points (P2P) BGP peering’s. Note that the IP’s used in the following diagram are just examples.

Outpost Service link and Local Gateway VLANOutpost Service link and Local Gateway VLAN

As we continue to expand rack deployments, so will the number of physical uplinks and VLAN interfaces required for the added OND to a CND. When we introduce the ACE rack, the OND is no longer attached to your CND. Instead, it goes directly to ACE devices, which provide at least one uplink to your network switch/router. In this topology, AWS owns the VLAN interface allocation and configuration between compute rack OND and the ACE routers.

Let’s cover the potential downsides to a multi-rack installation without an ACE rack. In this case, we have a three-rack Outpost deployment, with one uplink (two per rack) from each rack OND to the CND. This would require you to provide: six physical ports on your devices, six fiber cables,12 VLAN VIFs, 12 P2P subnets potentially exhausting 24 ips, and six port channels.

In comparison to a three-rack install that sits behind an ACE rack, you provide fewer physical network ports on your devices, fewer fiber cabling uplinks, fewer VLAN VIFs, fewer port channels, and fewer P2P’s. Each ACE router will have its own LACP port channel with 2x VLAN VIFs in each channel (the same as an Outposts Networking Devices (OND) <> Customer connection). The following table highlights the advantages in using an ACE rack when running a multi-rack Outpost, which becomes more desirable as you continue to scale.

2-Rack Outpost

Installation

3-Rack Outpost

Installation

4-Rack Outpost

Installation

Requirement

Without ACE With ACE Without ACE With ACE Without ACE With ACE

Physical Ports

4

4

6

4

8

4

Fiber Cables

4

4 6 4 8

4

LACP Port Channels

4

4 6 4

8

4

VLAN VIFs

8

8 12 8 16

8

P2P Subnets 8 8 12 8 16

8

ACE VS Non-ACE Rack Components Comparison

Furthermore, you should consider the additional weight, and power requirements that an ACE rack introduces when planning for multi-rack deployments. In addition to initial kVA requirements for the Outpost racks you must account for the resources required for an ACE rack. An ACE rack consumes up to 10kVA of power and weighs up to 705 lbs. Carefully planning additional capacity for these resources with your AWS account team will be critical for a successful deployment.

Similar to an Outpost rack, an ACE rack deployment is monitored by AWS. The rack provides telemetry data transmitted over a set of VPN tunnels back to the anchor points in the Region to which the Outpost is homed. This allows AWS to monitor the rack for hardware failures, performance degradation, and other alarm conditions including Links, Interfaces going down, and BGP drops.

As part of the Outpost ordering process, AWS will work closely with you to determine the location for install, power availability on-site, and the network configuration of both the Outposts rack and ACE rack. This includes BGP configuration, and the Customer Owned IP Address (CoIP), which is the pool of IP addresses for route advertisements back to your CND. The COIP pool allows resources inside your Outpost rack to communicate with on-premises resources and vice-versa. Another connectivity option would be the Direct VPC Routing (DVR) where we advertise VPC subnets associated with your LGW to your on-premises networks. Outposts uses a networking connectivity back to the Region for management purposes called the service link (SL). The SL is an encrypted set of VPN connections used whenever the Outpost communicates with your chosen home Region.

Conclusion

This post addresses the most common questions surrounding ACE racks, how an ACE rack can be deployed, and why an ACE rack would be leveraged for a multi-Outpost rack deployment. In this post, we demonstrated how an ACE rack serves as a consolidation point in your on-premises environment, making multi-rack deployments scalable, while reducing complexity and physical port allocation for connectivity between an Outpost and your LAN. In addition, we described how you can get this process started. If you want to learn more about Outposts fundamentals and how you can build your applications with AWS services using Outposts for hybrid cloud deployments you can learn more check out the Outposts user guide.

Patch Tuesday – December 2022

Post Syndicated from Greg Wiseman original https://blog.rapid7.com/2022/12/13/patch-tuesday-december-2022/

Patch Tuesday - December 2022

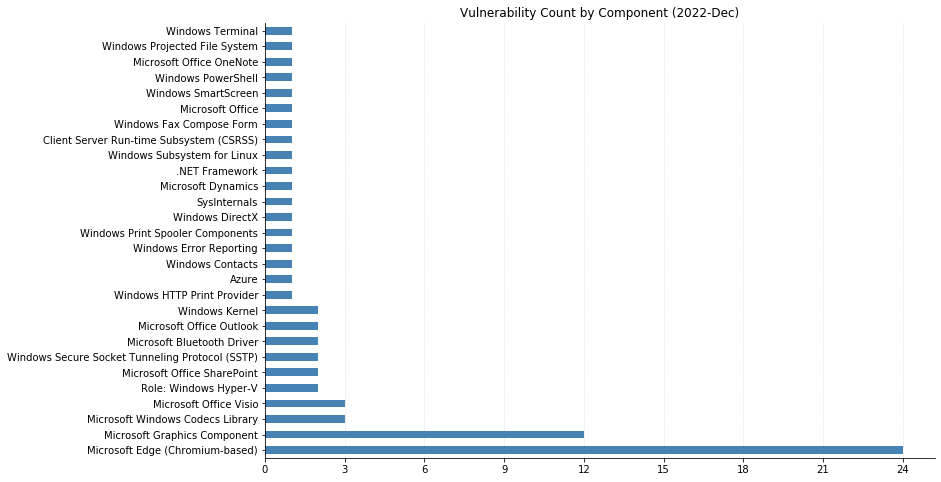
As far as Patch Tuesdays go, defenders have a relatively light month to close out the year with only 48 CVEs being published by Microsoft today. (This does not include the 24 previously disclosed vulnerabilities affecting their Chromium-based Edge browser.)

There are two zero-days in the mix today. CVE-2022-44698 is a bypass of the Windows SmartScreen security feature, and has been seen exploited in the wild. It allows attackers to craft documents that won’t get tagged with Microsoft’s “Mark of the Web” despite being downloaded from untrusted sites. This means no Protected View for Microsoft Office documents, making it easier to get users to do sketchy things like execute malicious macros. Publicly disclosed, but not seen actively exploited, is CVE-2022-44710. It’s a classic elevation of privilege vulnerability affecting the DirectX graphics kernel on Windows 11 22H2 systems.

Administrators for SharePoint and Microsoft Dynamics deployments should be aware of Critical Remote Code Execution (RCE) vulnerabilities that need to be patched. Other Critical RCEs this month affect the Windows Secure Socket Tunneling Protocol (CVE-2022-44676 and CVE-2022-44670), .NET Framework (CVE-2022-41089), and PowerShell (CVE-2022-41076).

Happy holidays, and may your patching be merry and bright!

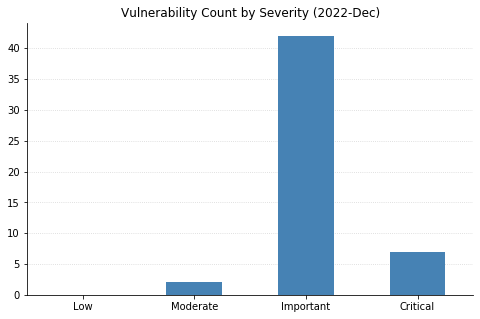
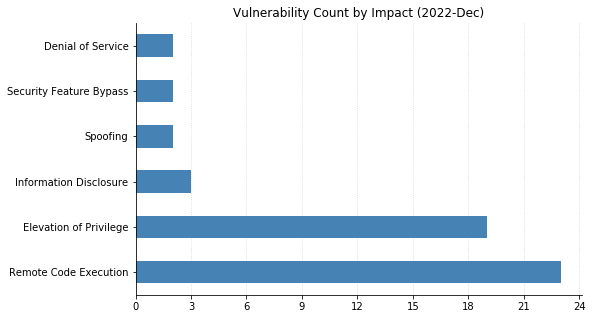
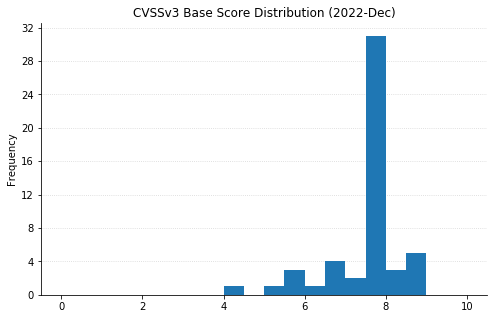
Summary charts

Patch Tuesday - December 2022

Summary tables

Apps vulnerabilities

CVE Title Exploited? Publicly disclosed? CVSSv3 base score
CVE-2022-44702 Windows Terminal Remote Code Execution Vulnerability No No 7.8
CVE-2022-24480 Outlook for Android Elevation of Privilege Vulnerability No No 6.3

Azure vulnerabilities

CVE Title Exploited? Publicly disclosed? CVSSv3 base score
CVE-2022-44699 Azure Network Watcher Agent Security Feature Bypass Vulnerability No No 5.5

Browser vulnerabilities

CVE Title Exploited? Publicly disclosed? CVSSv3 base score
CVE-2022-44708 Microsoft Edge (Chromium-based) Elevation of Privilege Vulnerability No No 8.3
CVE-2022-41115 Microsoft Edge (Chromium-based) Update Elevation of Privilege Vulnerability No No 6.6
CVE-2022-44688 Microsoft Edge (Chromium-based) Spoofing Vulnerability No No 4.3
CVE-2022-4195 Chromium: CVE-2022-4195 Insufficient policy enforcement in Safe Browsing No No N/A
CVE-2022-4194 Chromium: CVE-2022-4194 Use after free in Accessibility No No N/A
CVE-2022-4193 Chromium: CVE-2022-4193 Insufficient policy enforcement in File System API No No N/A
CVE-2022-4192 Chromium: CVE-2022-4192 Use after free in Live Caption No No N/A
CVE-2022-4191 Chromium: CVE-2022-4191 Use after free in Sign-In No No N/A
CVE-2022-4190 Chromium: CVE-2022-4190 Insufficient data validation in Directory No No N/A
CVE-2022-4189 Chromium: CVE-2022-4189 Insufficient policy enforcement in DevTools No No N/A
CVE-2022-4188 Chromium: CVE-2022-4188 Insufficient validation of untrusted input in CORS No No N/A
CVE-2022-4187 Chromium: CVE-2022-4187 Insufficient policy enforcement in DevTools No No N/A
CVE-2022-4186 Chromium: CVE-2022-4186 Insufficient validation of untrusted input in Downloads No No N/A
CVE-2022-4185 Chromium: CVE-2022-4185 Inappropriate implementation in Navigation No No N/A
CVE-2022-4184 Chromium: CVE-2022-4184 Insufficient policy enforcement in Autofill No No N/A
CVE-2022-4183 Chromium: CVE-2022-4183 Insufficient policy enforcement in Popup Blocker No No N/A
CVE-2022-4182 Chromium: CVE-2022-4182 Inappropriate implementation in Fenced Frames No No N/A
CVE-2022-4181 Chromium: CVE-2022-4181 Use after free in Forms No No N/A
CVE-2022-4180 Chromium: CVE-2022-4180 Use after free in Mojo No No N/A
CVE-2022-4179 Chromium: CVE-2022-4179 Use after free in Audio No No N/A
CVE-2022-4178 Chromium: CVE-2022-4178 Use after free in Mojo No No N/A
CVE-2022-4177 Chromium: CVE-2022-4177 Use after free in Extensions No No N/A
CVE-2022-4175 Chromium: CVE-2022-4175 Use after free in Camera Capture No No N/A
CVE-2022-4174 Chromium: CVE-2022-4174 Type Confusion in V8 No No N/A

Developer Tools vulnerabilities

CVE Title Exploited? Publicly disclosed? CVSSv3 base score
CVE-2022-41089 .NET Framework Remote Code Execution Vulnerability No No 8.8
CVE-2022-44704 Microsoft Windows Sysmon Elevation of Privilege Vulnerability No No 7.8

Developer Tools Windows ESU vulnerabilities

CVE Title Exploited? Publicly disclosed? CVSSv3 base score
CVE-2022-41076 PowerShell Remote Code Execution Vulnerability No No 8.5

Microsoft Dynamics vulnerabilities

CVE Title Exploited? Publicly disclosed? CVSSv3 base score
CVE-2022-41127 Microsoft Dynamics NAV and Microsoft Dynamics 365 Business Central (On Premises) Remote Code Execution Vulnerability No No 8.5

Microsoft Office vulnerabilities

CVE Title Exploited? Publicly disclosed? CVSSv3 base score
CVE-2022-44690 Microsoft SharePoint Server Remote Code Execution Vulnerability No No 8.8
CVE-2022-44693 Microsoft SharePoint Server Remote Code Execution Vulnerability No No 8.8
CVE-2022-44694 Microsoft Office Visio Remote Code Execution Vulnerability No No 7.8
CVE-2022-44695 Microsoft Office Visio Remote Code Execution Vulnerability No No 7.8
CVE-2022-44696 Microsoft Office Visio Remote Code Execution Vulnerability No No 7.8
CVE-2022-44691 Microsoft Office OneNote Remote Code Execution Vulnerability No No 7.8
CVE-2022-44692 Microsoft Office Graphics Remote Code Execution Vulnerability No No 7.8
CVE-2022-26804 Microsoft Office Graphics Remote Code Execution Vulnerability No No 7.8
CVE-2022-26805 Microsoft Office Graphics Remote Code Execution Vulnerability No No 7.8
CVE-2022-26806 Microsoft Office Graphics Remote Code Execution Vulnerability No No 7.8
CVE-2022-47211 Microsoft Office Graphics Remote Code Execution Vulnerability No No 7.8
CVE-2022-47212 Microsoft Office Graphics Remote Code Execution Vulnerability No No 7.8
CVE-2022-47213 Microsoft Office Graphics Remote Code Execution Vulnerability No No 7.8
CVE-2022-44713 Microsoft Outlook for Mac Spoofing Vulnerability No No 7.5

Open Source Software Windows vulnerabilities

CVE Title Exploited? Publicly disclosed? CVSSv3 base score
CVE-2022-44689 Windows Subsystem for Linux (WSL2) Kernel Elevation of Privilege Vulnerability No No 7.8

Windows vulnerabilities

CVE Title Exploited? Publicly disclosed? CVSSv3 base score
CVE-2022-44677 Windows Projected File System Elevation of Privilege Vulnerability No No 7.8
CVE-2022-44683 Windows Kernel Elevation of Privilege Vulnerability No No 7.8
CVE-2022-44680 Windows Graphics Component Elevation of Privilege Vulnerability No No 7.8
CVE-2022-44671 Windows Graphics Component Elevation of Privilege Vulnerability No No 7.8
CVE-2022-44687 Raw Image Extension Remote Code Execution Vulnerability No No 7.8
CVE-2022-44710 DirectX Graphics Kernel Elevation of Privilege Vulnerability No Yes 7.8
CVE-2022-44669 Windows Error Reporting Elevation of Privilege Vulnerability No No 7
CVE-2022-44682 Windows Hyper-V Denial of Service Vulnerability No No 6.8
CVE-2022-44707 Windows Kernel Denial of Service Vulnerability No No 6.5
CVE-2022-44679 Windows Graphics Component Information Disclosure Vulnerability No No 6.5
CVE-2022-44674 Windows Bluetooth Driver Information Disclosure Vulnerability No No 5.5
CVE-2022-44698 Windows SmartScreen Security Feature Bypass Vulnerability Yes No 5.4

Windows ESU vulnerabilities

CVE Title Exploited? Publicly disclosed? CVSSv3 base score
CVE-2022-44676 Windows Secure Socket Tunneling Protocol (SSTP) Remote Code Execution Vulnerability No No 8.1
CVE-2022-44670 Windows Secure Socket Tunneling Protocol (SSTP) Remote Code Execution Vulnerability No No 8.1
CVE-2022-44678 Windows Print Spooler Elevation of Privilege Vulnerability No No 7.8
CVE-2022-44681 Windows Print Spooler Elevation of Privilege Vulnerability No No 7.8
CVE-2022-44667 Windows Media Remote Code Execution Vulnerability No No 7.8
CVE-2022-44668 Windows Media Remote Code Execution Vulnerability No No 7.8
CVE-2022-41094 Windows Hyper-V Elevation of Privilege Vulnerability No No 7.8
CVE-2022-44697 Windows Graphics Component Elevation of Privilege Vulnerability No No 7.8
CVE-2022-41121 Windows Graphics Component Elevation of Privilege Vulnerability No No 7.8
CVE-2022-41077 Windows Fax Compose Form Elevation of Privilege Vulnerability No No 7.8
CVE-2022-44666 Windows Contacts Remote Code Execution Vulnerability No No 7.8
CVE-2022-44675 Windows Bluetooth Driver Elevation of Privilege Vulnerability No No 7.8
CVE-2022-44673 Windows Client Server Run-Time Subsystem (CSRSS) Elevation of Privilege Vulnerability No No 7
CVE-2022-41074 Windows Graphics Component Information Disclosure Vulnerability No No 5.5

Heads-Up: Amazon S3 Security Changes Are Coming in April of 2023

Post Syndicated from Jeff Barr original https://aws.amazon.com/blogs/aws/heads-up-amazon-s3-security-changes-are-coming-in-april-of-2023/

Starting in April of 2023 we will be making two changes to Amazon Simple Storage Service (Amazon S3) to put our latest best practices for bucket security into effect automatically. The changes will begin to go into effect in April and will be rolled out to all AWS Regions within weeks.

Once the changes are in effect for a target Region, all newly created buckets in the Region will by default have S3 Block Public Access enabled and access control lists (ACLs) disabled. Both of these options are already console defaults and have long been recommended as best practices. The options will become the default for buckets that are created using the S3 API, S3 CLI, the AWS SDKs, or AWS CloudFormation templates.

As a bit of history, S3 buckets and objects have always been private by default. We added Block Public Access in 2018 and the ability to disable ACLs in 2021 in order to give you more control, and have long been recommending the use of AWS Identity and Access Management (IAM) policies as a modern and more flexible alternative.

In light of this change, we recommend a deliberate and thoughtful approach to the creation of new buckets that rely on public buckets or ACLs, and believe that most applications do not need either one. If your application turns out be one that does, then you will need to make the changes that I outline below (be sure to review your code, scripts, AWS CloudFormation templates, and any other automation).

What’s Changing
Let’s take a closer look at the changes that we are making:

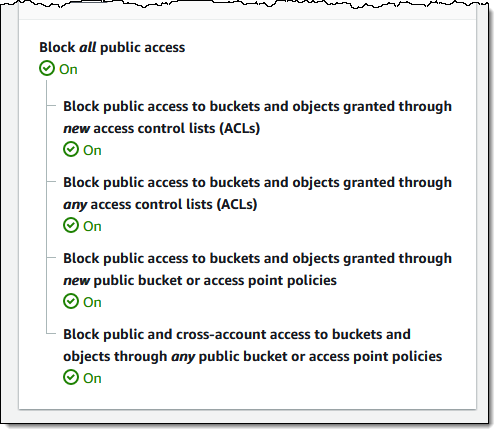
S3 Block Public Access – All four of the bucket-level settings described in this post will be enabled for newly created buckets:

A subsequent attempt to set a bucket policy or an access point policy that grants public access will be rejected with a 403 Access Denied error. If you need public access for a new bucket you can create it as usual and then delete the public access block by calling DeletePublicAccessBlock (you will need s3:PutBucketPublicAccessBlock permission in order to call this function; read Block Public Access to learn more about the functions and the permissions).

ACLs Disabled – The Bucket owner enforced setting will be enabled for newly created buckets, making bucket ACLs and object ACLs ineffective, and ensuring that the bucket owner is the object owner no matter who uploads the object. If you want to enable ACLs for a bucket, you can set the ObjectOwnership parameter to ObjectWriter in your CreateBucket request or you can call DeleteBucketOwnershipControls after you create the bucket. You will need s3:PutBucketOwnershipControls permission in order to use the parameter or to call the function; read Controlling Ownership of Objects and Creating a Bucket to learn more.

Stay Tuned
We will publish an initial What’s New post when we start to deploy this change and another one when the deployment has reached all AWS Regions. You can also run your own tests to detect the change in behavior.

— Jeff;

Trying to remove the need to trust cloud providers

Post Syndicated from original https://mjg59.dreamwidth.org/63261.html

First up: what I’m covering here is probably not relevant for most people. That’s ok! Different situations have different threat models, and if what I’m talking about here doesn’t feel like you have to worry about it, that’s great! Your life is easier as a result. But I have worked in situations where we had to care about some of the scenarios I’m going to describe here, and the technologies I’m going to talk about here solve a bunch of these problems.

So. You run a typical VM in the cloud. Who has access to that VM? Well, firstly, anyone who has the ability to log into the host machine with administrative capabilities. With enough effort, perhaps also anyone who has physical access to the host machine. But the hypervisor also has the ability to inspect what’s running inside a VM, so anyone with the ability to install a backdoor into the hypervisor could theoretically target you. And who’s to say the cloud platform launched the correct image in the first place? The control plane could have introduced a backdoor into your image and run that instead. Or the javascript running in the web UI that you used to configure the instance could have selected a different image without telling you. Anyone with the ability to get a (cleverly obfuscated) backdoor introduced into quite a lot of code could achieve that. Obviously you’d hope that everyone working for a cloud provider is honest, and you’d also hope that their security policies are good and that all code is well reviewed before being committed. But when you have several thousand people working on various components of a cloud platform, there’s always the potential for something to slip up.

Let’s imagine a large enterprise with a whole bunch of laptops used by developers. If someone has the ability to push a new package to one of those laptops, they’re in a good position to obtain credentials belonging to the user of that laptop. That means anyone with that ability effectively has the ability to obtain arbitrary other privileges – they just need to target someone with the privilege they want. You can largely mitigate this by ensuring that the group of people able to do this is as small as possible, and put technical barriers in place to prevent them from pushing new packages unilaterally.

Now imagine this in the cloud scenario. Anyone able to interfere with the control plane (either directly or by getting code accepted that alters its behaviour) is in a position to obtain credentials belonging to anyone running in that cloud. That’s probably a much larger set of people than have the ability to push stuff to laptops, but they have much the same level of power. You’ll obviously have a whole bunch of processes and policies and oversights to make it difficult for a compromised user to do such a thing, but if you’re a high enough profile target it’s a plausible scenario.

How can we avoid this? The easiest way is to take the people able to interfere with the control plane out of the loop. The hypervisor knows what it booted, and if there’s a mechanism for the VM to pass that information to a user in a trusted way, you’ll be able to detect the control plane handing over the wrong image. This can be achieved using trusted boot. The hypervisor-provided firmware performs a “measurement” (basically a cryptographic hash of some data) of what it’s booting, storing that information in a virtualised TPM. This TPM can later provide a signed copy of the measurements on demand. A remote system can look at these measurements and determine whether the system is trustworthy – if a modified image had been provided, the measurements would be different. As long as the hypervisor is trustworthy, it doesn’t matter whether or not the control plane is – you can detect whether you were given the correct OS image, and you can build your trust on top of that.

(Of course, this depends on you being able to verify the key used to sign those measurements. On real hardware the TPM has a certificate that chains back to the manufacturer and uniquely identifies the TPM. On cloud platforms you typically have to retrieve the public key via the metadata channel, which means you’re trusting the control plane to give you information about the hypervisor in order to verify what the control plane gave to the hypervisor. This is suboptimal, even though realistically the number of moving parts in that part of the control plane is much smaller than the number involved in provisioning the instance in the first place, so an attacker managing to compromise both is less realistic. Still, AWS doesn’t even give you that, which does make it all rather more complicated)

Ok, so we can (largely) decouple our trust in the VM from having to trust the control plane. But we’re still relying on the hypervisor to provide those attestations. What if the hypervisor isn’t trustworthy? This sounds somewhat ridiculous (if you can’t run a trusted app on top of an untrusted OS, how can you run a trusted OS on top of an untrusted hypervisor?), but AMD actually have a solution for that. SEV (“Secure Encrypted Virtualisation”) is a technology where (handwavily) an encryption key is generated when a new VM is created, and the memory belonging to that VM is encrypted with that key. The hypervisor has no access to that encryption key, and any access to memory initiated by the hypervisor will only see the encrypted content. This means that nobody with the ability to tamper with the hypervisor can see what’s going on inside the OS (and also means that nobody with physical access can either, so that’s another threat dealt with).

But how do we know that the hypervisor set this up, and how do we know that the correct image was booted? SEV has support for a “Launch attestation”, a CPU generated signed statement that it booted the current VM with SEV enabled. But it goes further than that! The attestation includes a measurement of what was booted, which means we don’t need to trust the hypervisor at all – the CPU itself will tell us what image we were given. Perfect.

Except, well. There’s a few problems. AWS just doesn’t have any VMs that implement SEV yet (there are bare metal instances that do, but obviously you’re building your own infrastructure to make that work). Google only seem to provide the launch measurement via the logging service – and they only include the parsed out data, not the original measurement. So, we still have to trust (a subset of) the control plane. Azure provides it via a separate attestation service, but again it doesn’t seem to provide the raw attestation and so you’re still trusting the attestation service. For the newest generation of SEV, SEV-SNP, this is less of a big deal because the guest can provide its own attestation. But Google doesn’t offer SEV-SNP hardware yet, and the driver you need for this only shipped in Linux 5.19 and Azure’s SEV Ubuntu images only offer up to 5.15 at the moment, so making use of that means you’re putting your own image together at the moment.

And there’s one other kind of major problem. A normal VM image provides a bootloader and a kernel and a filesystem. That bootloader needs to run on something. That “something” is typically hypervisor-provided “firmware” – for instance, OVMF. This probably has some level of cloud vendor patching, and they probably don’t ship the source for it. You’re just having to trust that the firmware is trustworthy, and we’re talking about trying to avoid placing trust in the cloud provider. Azure has a private beta allowing users to upload images that include their own firmware, meaning that all the code you trust (outside the CPU itself) can be provided by the user, and once that’s GA it ought to be possible to boot Azure VMs without having to trust any Microsoft-provided code.

Well, mostly. As AMD admit, SEV isn’t guaranteed to be resistant to certain microarchitectural attacks. This is still much more restrictive than the status quo where the hypervisor could just read arbitrary content out of the VM whenever it wanted to, but it’s still not ideal. Which, to be fair, is where we are with CPUs in general.

(Thanks to Leonard Cohnen who gave me a bunch of excellent pointers on this stuff while I was digging through it yesterday)

comment count unavailable comments

[$] The return of lazy imports for Python

Post Syndicated from original https://lwn.net/Articles/917280/

Back in September, we looked at a Python
Enhancement Proposal (PEP) to add “lazy” imports to the language; the
execution of such an import would be deferred until its symbols were needed
in order to save program-startup time. While the problem of startup time
for short-running, often command-line-oriented, tools is widely
acknowledged in the Python community, and the idea of deferring imports is
generally popular, there are concerns about the effect of the feature on
the ecosystem as a whole. Since our article, the PEP has been revised and
discussed further, but the feature was recently rejected by the steering
council (SC) because of those concerns; that has not completely ended the
quest for lazy
imports, however.

Amazon EMR launches support for Amazon EC2 M6A, R6A instances to improve cost performance for Spark workloads by 15–50% 

Post Syndicated from Al MS original https://aws.amazon.com/blogs/big-data/amazon-emr-launches-support-for-amazon-ec2-m6a-r6a-instances-to-improve-cost-performance-for-spark-workloads-by-15-50/

Amazon EMR provides a managed service to easily run analytics applications using open-source frameworks such as Apache Spark, Hive, Presto, Trino, HBase, and Flink. The Amazon EMR runtime for Spark and Presto includes optimizations that provide over 2x performance improvements over open-source Apache Spark and Presto.

With Amazon EMR release 6.8, you can now use Amazon Elastic Compute Cloud (Amazon EC2) instances such as M6A and C6A, which use the third generation AMD EPYC processors. These instances improve the price performance of running Spark workloads on Amazon EMR by 15–50 percent over previous generation instances. In this blog post, we describe how we estimated this price performance benefit.

Amazon EMR runtime performance with EC2 M6A instances

We ran TPC-DS 3 TB benchmark queries on Amazon EMR 6.8 using Amazon EMR runtime for Apache Spark (compatible with Apache Spark 3.3) with M6a instances. Data was stored in Amazon Simple Storage Service (Amazon S3), and results were compared to equivalent clusters with M5a, which is the previous generation instance family. We measured performance improvements using the total query runtime and the geometric mean of query runtime across TPC-DS 3 TB benchmark queries.

Our results showed a 23.6–50.3 percent improvement in total query runtime performance and 22.8–52.4 percent in geometric mean on an EMR cluster with M6a compared to an equivalent EMR cluster with M5a instances. In comparing costs, we observed a 23.2–41.4 percent reduction in cost on the EMR cluster with M6a compared to the equivalent with M5a. M6A 48 XL and 32 XL instances were not benchmarked because the M5A generation does not offer equivalent sizes.

The following table shows the results from running TPC-DS 3 TB benchmark queries using Amazon EMR 6.8 over equivalent M6a and M5a instance EMR clusters.

Instance Size 24 XL 16 XL 12 XL 8 XL 4 XL 2 XL XL
Total size of the cluster (1 Leader + 5 core nodes) 6 6 6 6 6 6 6
Total query runtime on M5A (seconds) 6624.1713838714 5466.7251180433 5269.0578151495 5366.1486275129 7753.6218015794 12118.0922180235 21070.6905510002
Total query runtime on M6A (seconds) 3295.2894058371 3063.7807673078 3399.1509249577 3482.8401591909 4906.2216891762 9184.4366036450 16107.9707619002
Total query runtime improvement with M6A 50.25% 43.96% 35.49% 35.10% 36.72% 24.21% 23.55%
Geometric mean query runtime M5A (sec) 51.1422829354 40.9550798753 38.4890223194 35.3863834186 44.8454957416 61.0454658020 92.6414502105
Geometric mean query runtime M6A (sec) 24.3406154481 22.3484713891 22.9913163520 23.0351017440 28.2855683398 46.4363267349 71.5498816854
Geometric mean query runtime improvement with M6A 52.41% 45.43% 40.27% 34.90% 36.93% 23.93% 22.77%
EC2 M5A instance price ($ per hour) $4.12800 $2.75200 $2.06400 $1.37600 $0.68800 $0.34400 $0.17200
EMR M5A instance price ($ per hour) $0.27000 $0.27000 $0.27000 $0.27000 $0.17200 $0.08600 $0.04300
(EC2 + EMR) M5A instance price ($ per hour) $4.39800 $3.02200 $2.33400 $1.64600 $0.86000 $0.43000 $0.21500
Cost of running on M5A ($ per instance) $8.09253 $4.58901 $3.41611 $2.45352 $1.85225 $1.44744 $1.25839
EC2 M6A instance price ($ per hour) $4.14720 $2.76480 $2.07360 $1.38240 $0.69120 $0.34560 $0.17280
EMR M6A price ($ per hour per instance) $1.03680 $0.69120 $0.51840 $0.34560 $0.17280 $0.08640 $0.04320
(EC2 + EMR) M6A instance price ($ per hour) $5.18400 $3.45600 $2.59200 $1.72800 $0.86400 $0.43200 $0.21600
Cost of running on M6A ($ per instance) $4.74522 $2.94123 $2.44739 $1.67176 $1.17749 $1.10213 $0.96648
Total cost reduction with M6A including performance improvement -41.36% -35.91% -28.36% -31.86% -36.43% -23.86% -23.20%

The following graph shows per query improvements observed on M6a 2XL instances compared to equivalent M5a generation. We observed that two queries take longer to execute on M6a instance clusters compared to M5a instance clusters. Q91 regressed up to 6.64 percent and Q55 regressed up to 1.86 percent on 4 XL instance clusters.

Amazon EMR runtime performance with EC2 R6A instances

R6A instances showed a similar performance improvement while running Apache Spark workloads compared to equivalent R5A instances. R6A 32XL and 48XL instances were not benchmarked since R5A instances do not have 32XL and 48XL sizes available. Our results showed 16–58.22 percent improvement in total query runtime for seven different instance sizes within the instance family and 20.04–59.59 percent improvement in geometric mean. In comparing costs, we observed 15.85–-50.07 percent reduction in cost on R6A instance EMR clusters compared to R5A EMR instance clusters.

The following table shows the results from running TPC-DS 3 TB benchmark queries using Amazon EMR 6.8 over equivalent R6A and R5A instance EMR clusters.

Instance Size 24 XL 16 XL 12 XL 8 XL 4 XL 2 XL XL
Total size of the cluster (1 Leader + 5 core nodes) 6 6 6 6 6 6 6
Total query runtime on R5A (seconds) 6934.22936 5530.74672 5834.32344 5718.72582 7615.58392 11431.37368 20688.58642
Total query runtime on R6A (seconds) 2897.44817 2906.49952 3017.85315 3488.83875 4661.32856 7717.33575 17378.49043
Total query runtime improvement with R6A 58.22% 47.45% 48.27% 38.99% 38.79% 32.49% 16.00%
Geometric mean query runtime R5A (sec) 53.27574 41.76973 42.50324 37.62155 44.58173 58.88182 91.72095
Geometric mean query runtime R6A (sec) 21.52803 21.36831 19.94607 21.59493 26.90097 36.57557 73.3405
Geometric mean query runtime improvement with R6A 59.59% 48.84% 53.07% 42.60% 39.66% 37.88% 20.04%
EC2 R5A instance price ($ per hour) $5.42400 $3.61600 $2.71200 $1.80800 $0.90400 $0.45200 $0.22600
EMR R5A instance price ($ per hour) $0.27000 $0.27000 $0.27000 $0.27000 $0.22600 $0.11300 $0.05700
(EC2 + EMR) R5A instance price ($ per hour) $5.69400 $3.88600 $2.98200 $2.07800 $1.13000 $0.56500 $0.28300
Cost of running on R5A ($ per instance) $10.96764 $5.97013 $4.83276 $3.30098 $2.39045 $1.79409 $1.62635
EC2 R6A instance price ($ per hour) $5.44320 $3.62880 $2.72160 $1.81440 $0.90720 $0.45360 $0.22680
EMR R6A price ($ per hour per instance) $1.36080 $0.90720 $0.68040 $0.45360 $0.22680 $0.11340 $0.05670
(EC2 + EMR) R6A instance price ($ per hour) $6.80400 $4.53600 $3.40200 $2.26800 $1.13400 $0.56700 $0.28350
Cost of running on R6A ($ per instance) $5.47618 $3.66219 $2.85187 $2.19797 $1.46832 $1.21548 $1.36856
Total cost reduction with R6A including performance improvement -50.07% -38.66% -40.99% -33.41% -38.58% -32.25% -15.85%

Benchmarking methodology

The benchmark used in this post is derived from the industry-standard TPC-DS benchmark and uses queries from the Spark SQL Performance Tests GitHub repo with the following fixes applied.

We calculated TCO by multiplying cost per hour by number of instances in the cluster and time taken to run the queries on the cluster. We used the on-demand pricing in the US East (N. Virginia) Region for all instances.

Conclusion

In this post, we described how we estimated the cost-performance benefit from using Amazon EMR with M6A and R6A instances compared to using equivalent previous-generation instances. Using these new instances with Amazon EMR improves price performance by 15–50%.


About the authors

AI MSAl MS is a product manager for Amazon EMR at Amazon Web Services.

Kyeonghyun Ryoo is a Software Development Engineer for EMR at Amazon Web Services. He primarily works on designing and building automation tools for internal teams and customers to maximize their productivity. Outside of work, he is a retired world champion in professional gaming who still enjoy playing video games.

Using Workflows to Build, Test, and Deploy with Amazon CodeCatalyst

Post Syndicated from Kumar Karra original https://aws.amazon.com/blogs/devops/using-workflows-to-build-test-and-deploy-with-amazon-codecatalyst/

Amazon CodeCatalyst workflows are continuous integration and continuous delivery (CI/CD) pipelines that enable you to easily build, test and deploy applications. CodeCatalyst was announced at re:Invent 2022 and is currently in preview.

Introduction:

I recently read The Unicorn Project, the follow-up to the bestselling title The Phoenix Project from Gene Kim. After a few years at Amazon, I had forgotten how some companies write software, but it all came back to me as I read. In the book, the main character, Maxine, struggles with a complicated software development lifecycle (SLDC) after joining a new team. Some of the challenges she encounters include:

  • Continually delivering high-quality updates is complicated and slow
  • Collaborating efficiently with others is challenging
  • Managing application environments is increasingly complex
  • Setting up a new project is a time consuming chore

Amazon CodeCatalyst can help address all of these issues. CodeCatalyst is an integrated DevOps service that makes it easy for development teams to quickly build and deliver applications on AWS. Over the next few weeks, my colleagues and I will release a series of blog posts describing the individual features of CodeCatalyst and how they will help you overcome the challenges that Maxine encountered in The Unicorn Project. In this first post, I focus on Workflows and address the first bullet above, “continually delivering high-quality updates is complicated and slow”.

CodeCatalyst Workflows help you reliably deliver high-quality application updates frequently, quickly and securely. CodeCatalyst uses a visual editor — or if you prefer YAML — to quickly assemble and configure actions to compose workflows that automate your CI/CD pipeline, test reporting and other manual processes. Workflows use provisioned compute, lambda compute, custom container images and a managed build infrastructure to scale execution easily without sacrificing flexibility

Prerequisites

If you would like to follow along with this walkthrough, you will need to:

Walkthrough

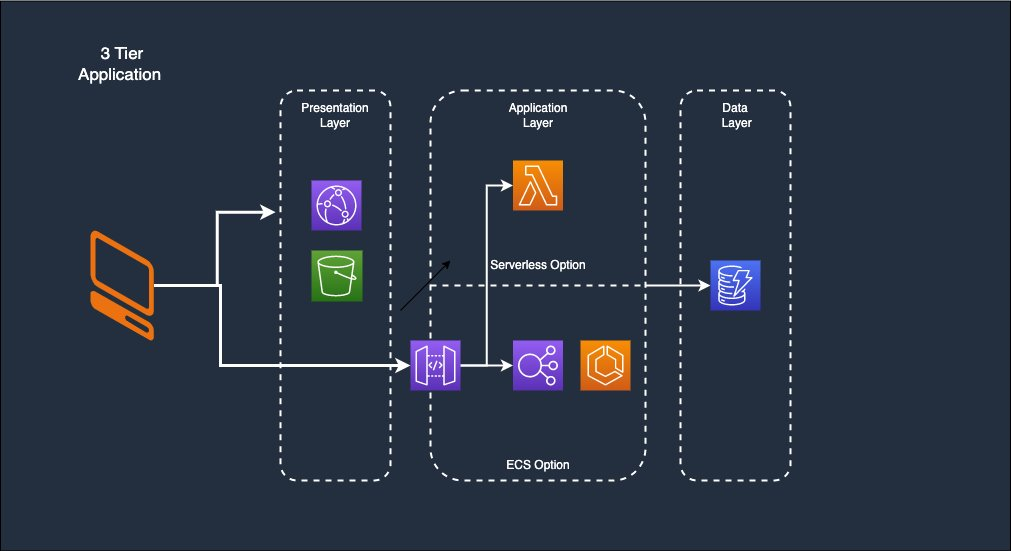
For this walkthrough, I am going use the Modern Three-tier Web Application blueprint. A CodeCatalyst blueprint provides a template for a new project. If you would like to follow along, you can launch the blueprint as described in Creating a project in Amazon CodeCatalyst.  This will deploy the architecture shown below.

Modern Three-tier Web Application architecture including a presentation, application and data layer

Figure 1. Modern Three-tier Web Application architecture including a presentation, application and data layer

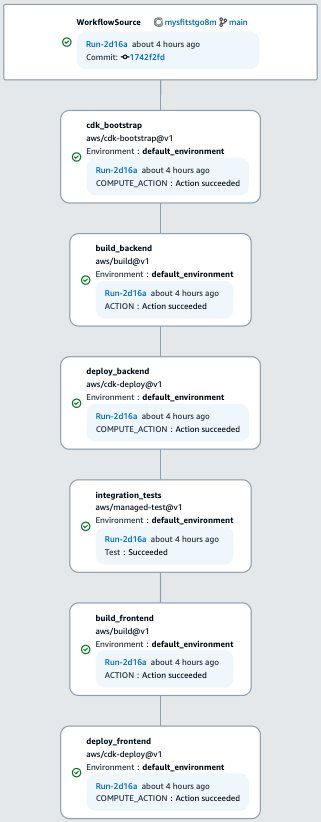
Once the new project is launched, navigate to CI/CD > Workflows. You will see two workflows listed. Click on  ApplicationDeploymentPipeline and you will be presented with the workflow pictured below. The workflow consists of six actions: 1) ensures that CDK is configured in the account; 2) builds the backend, written in Python, including unit tests; 3) deploys the backend to either AWS Lambda or AWS Fargate depending on which you selected when you launched the project; 4) runs a series of integration tests on the deployed backend; 5) builds the frontend, written with Vue, including unit tests; and finally, 6) deploys the frontend to Amazon Simple Storage Service (Amazon S3) and Amazon CloudFront.

Six step Workflow described in the prior paragraph

Figure 2. Six step Workflow described in the prior paragraph

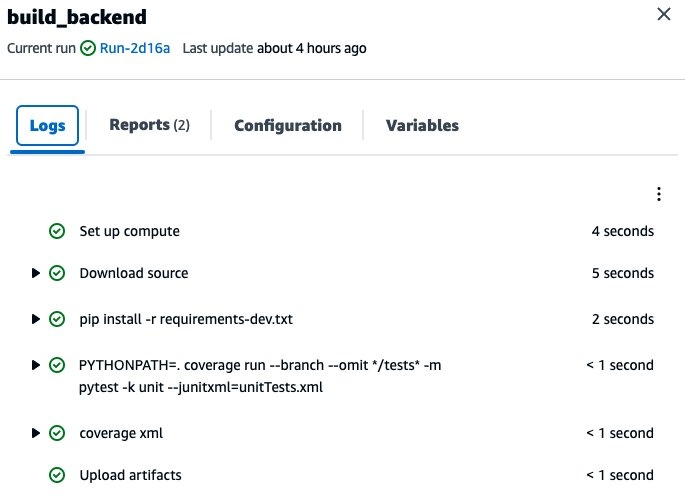
Let’s look at a few of these actions. If you click on each action you will see details about the workflow execution. For example, I clicked on build_backend. On the logs tab, I can see the build action executes a series of steps. In this example,  pip installs requirements and then pytest and coverage run a series of unit test. If this had been a compiled language — like Java or .NET — there would have been a build step as well.

Logs from the build action including pip, pytest, and coverage

Figure 3. Logs from the build action including pip, pytest, and coverage

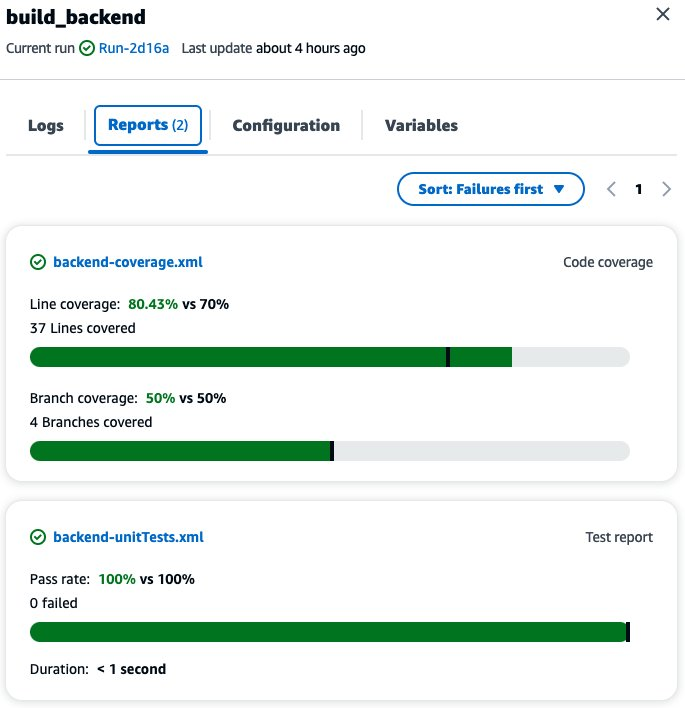
If I switch to the Reports tab, I see the result of the unit tests as well as code and branch coverage. In each case the test has exceeded the pass rate, indicated by the black bar on the graph. If they had not, the build would have failed.

Results of the unit tests including code and branch coverage

Figure 4. Results of the unit tests including code and branch coverage

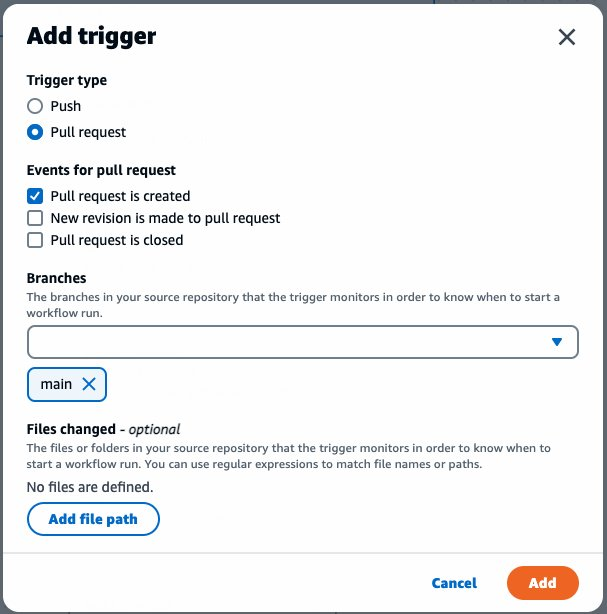
Next, let’s examine how the workflow is defined by clicking on the Edit button in the top right corner of the screen. If the editor opens in YAML mode, switch to Visual mode using the toggle above the code. If I click on WorkflowSource, I see that the Workflow is triggered by a push to the main branch. I could add additional triggers. CodeCatalyst supports triggering on Push or Pull Request. In addition, I can trigger off multiple branches, including wildcards (e.g. “release-.*”).  Finally, I can trigger branches when only some files in a repository change (e.g. "src/.*")

Trigger configuration showing various options

Figure 5. Trigger configuration showing various options

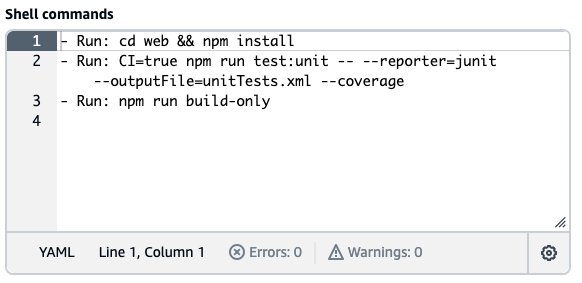
Now, let’s look at the build_frontend action. This is a build action, similar to the build_backend action you looked at earlier. On the Configure tab I can see the Shell commands that will be executed during the build. Remember that the frontend is written using Vue. Here I can see  npm install used to install dependencies, npm run test:unit used to run tests, and finally npm run build-only to build the Single Page App (SPA). The resulting artifacts are passed to subsequent actions in the Workflow.

Shell commands run in the build action

Figure 6. Shell commands run in the build action

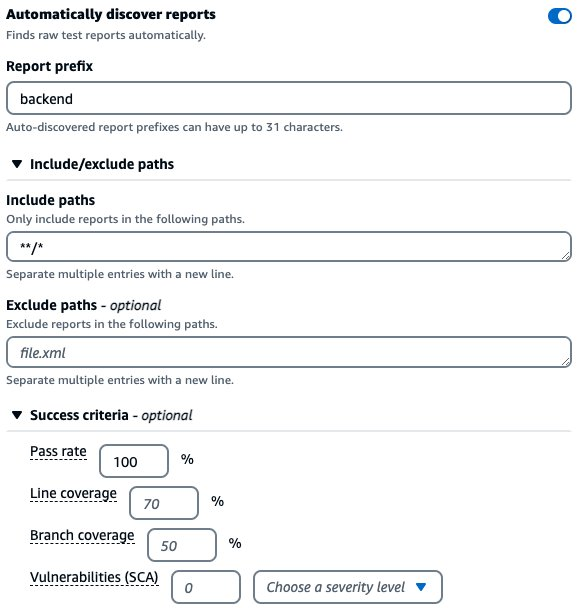
Next, let’s look at the integration_test action. A managed test action is very similar to a build action, defining a series of commands to execute. On the configuration tab (not shown), I can see that this action is again running pytest. Switching to the Outputs tab, I see that CodeCatalyst is configured to automatically discover the test reports generated by pytest and other test frameworks. In addition, I have defined a minimum pass rate of 100%. This means that the workflow should fail if any of the integration tests fail.

Test report configuration dialog including success criteria

Figure 7. Test report configuration dialog including success criteria

Finally, let’s examine the deploy_frontend action. Note that all of the actions you have looked at so far include a series of commands to run in their configuration. While these actions are highly flexible, CodeCatalyst also supports purpose built actions. The cdk-deploy action is an example of this. As the name implies, this action deploys AWS Cloud Development Kit (CDK) resources. I could have called cdk deploy from the shell commands in a build action. However, using the purpose built action is easier. CodeCatalyst supports many purpose build actions developed by AWS as well as third parties. Click on the + sign in the top left corner of the screen to see a few examples.  In addition, CodeCatalyst supports GitHub actions, but that is a topic for another post.

Cleanup

If you have been following along with this workflow, you should delete the resources you deployed so you do not continue to incur charges (See pricing page for more details). First, delete the two stacks that CDK deployed using the AWS CloudFormation console in the AWS account you associated when you launched the blueprint. These stacks will have names like mysfitsXXXXXWebStack and mysfitsXXXXXAppStack. Second, delete the project from CodeCatalyst by navigating to Project settings and clicking the Delete project button.

Conclusion

In this post, you learned how CodeCatalyst can help you rapidly assemble automation workflows by configuring composable, pre-built actions into CI/CD pipelines. I examined actions to build, test and deploy both frontend and backend applications. In future posts, I will discuss how CodeCatalyst can address the rest of the challenges Maxine encountered in The Unicorn Project.

About the authors:

Kumar Karra

Kumar Karra is a Field Solutions Architect for AWS Small and Medium Business Customers. He has a strong background in designing and developing applications for small consumer facing customers to large mission critical applications for enterprises. He specialized in Builder’s Experience tools and enjoys helping customer shorten their time to value by guiding them on strategies to implement fast, repeatable, testable, and scalable tools and architectures.

Kawshik Sarkar

Kawshik Sarkar is a Field Solutions Architect for AWS Small Medium Business customers . He helps customers by designing solutions using AWS cloud services , to enhance their user experience ,maximize outcomes and improve business agility . He enjoys music , podcasts ,tennis  and being outdoors

Divya Konaka Satyapal

Divya Konaka Satyapal is a Sr.Technical Account Manager for WWPS Edtech/EDU customers. Her expertise lies in DevOps and Serverless architectures. She works with customers heavily on cost optimization and overall operational excellence to accelerate their cloud journey. Outside of work, she enjoys traveling and playing tennis.

Simplify private network access for solutions using Amazon OpenSearch Service managed VPC endpoints

Post Syndicated from Aish Gunasekar original https://aws.amazon.com/blogs/big-data/simplify-private-network-access-for-solutions-using-amazon-opensearch-service-managed-vpc-endpoints/

Amazon OpenSearch Service makes it easy for you to perform interactive log analytics, real-time application monitoring, website search, and more. Amazon OpenSearch is an open source, distributed search and analytics suite. Amazon OpenSearch Service offers the latest versions of OpenSearch, support for 19 versions of Elasticsearch (1.5 to 7.10 versions), as well as visualization capabilities powered by OpenSearch Dashboards and Kibana (1.5 to 7.10 versions). Amazon OpenSearch Service currently has tens of thousands of active customers with hundreds of thousands of clusters under management processing trillions of requests per month.

To meet the needs of customers who want simplicity in their network setup with the Amazon OpenSearch Service, you can now use Amazon OpenSearch Service-managed virtual private cloud (VPC) endpoints (powered by AWS PrivateLink) to connect to your applications using Amazon OpenSearch Service domains launched in Amazon Virtual Private Cloud (VPC). With Amazon OpenSearch Service-managed VPC endpoints, you can privately access your Amazon OpenSearch Service domain from multiple VPCs in your account or other AWS accounts based on your application needs without configuring other services features such as VPC peering, AWS Transit Gateway (TGW), or other more complex network routing strategies that place operational burden on your support and engineering teams.

The feature is built using AWS PrivateLink. AWS PrivateLink provides private connectivity between VPCs, supported AWS services, and your on-premises networks without exposing your traffic to the public internet. It provides you with the means to connect multiple application deployments effortlessly to your Amazon OpenSearch Service domains.

This post introduces Amazon OpenSearch Service-managed VPC endpoints that build on top of AWS PrivateLink and shows how you can access a private Amazon OpenSearch Service from one or more VPCs hosted in the same account, or even VPCs hosted in other AWS accounts using AWS PrivateLink managed by Amazon OpenSearch Service.

­­­­Amazon OpenSearch Service managed VPC endpoints

Before the launch of Amazon OpenSearch Service managed VPC endpoints, if you needed to gain access to your domain outside of your VPC, you had three options:

  • Use VPC peering to connect your VPC with other VPCs
  • Use AWS Transit Gateway to connect your VPC with other VPCs
  • Create your own implementation of an AWS PrivateLink setup

The first two options require you to setup your VPCs so that the Classless Inter-Domain Routing (CIDR) block ranges don’t overlap. If they did, then your options are more complicated. The third option, create your own implementation of AWS PrivateLink, involve configuring a network load balancer (NLB) and associating a target group with the NLB as one of the steps in the setup. The architecture discussed in this post, demonstrates these additional layers of complexity.

With Amazon OpenSearch Service managed VPC endpoints (i.e., powered by AWS PrivateLink), these complex setups and processes are no longer needed!

You can access your Amazon OpenSearch Service private domain as if it were deployed in all the VPCs that you want to connect to your domain. If you need private connectivity from your on-premises hybrid deployments, then AWS PrivateLink helps you bring access from your Amazon OpenSearch Service domain to your data centers with minimal effort.

By using AWS PrivateLink with Amazon OpenSearch Service, you can realize the following benefits:

  • You simplify your network architecture between hybrid, multi-VPC, and multi account solutions
  • You address a multitude of compliance concerns by better controlling the traffic that moves between your solutions and Amazon OpenSearch Service domains

Shared search cluster for multiple development teams

Imagine that your company hosts a service as a software (SaaS) application that provides a search application programming interface (API) for the healthcare industry. Each team works on a different function of the API. The development teams API team 1 and API team 2 are in two different AWS accounts and each has their own VPCs within these accounts. Another team (data refinement team) works on the ingestion and data refinement to populate the Amazon OpenSearch Service domain hosted in the same account as API team 2 but in different VPC. Each team shares the domain during the development cycles to save costs and foster collaboration on the data modeling.

Solution overview

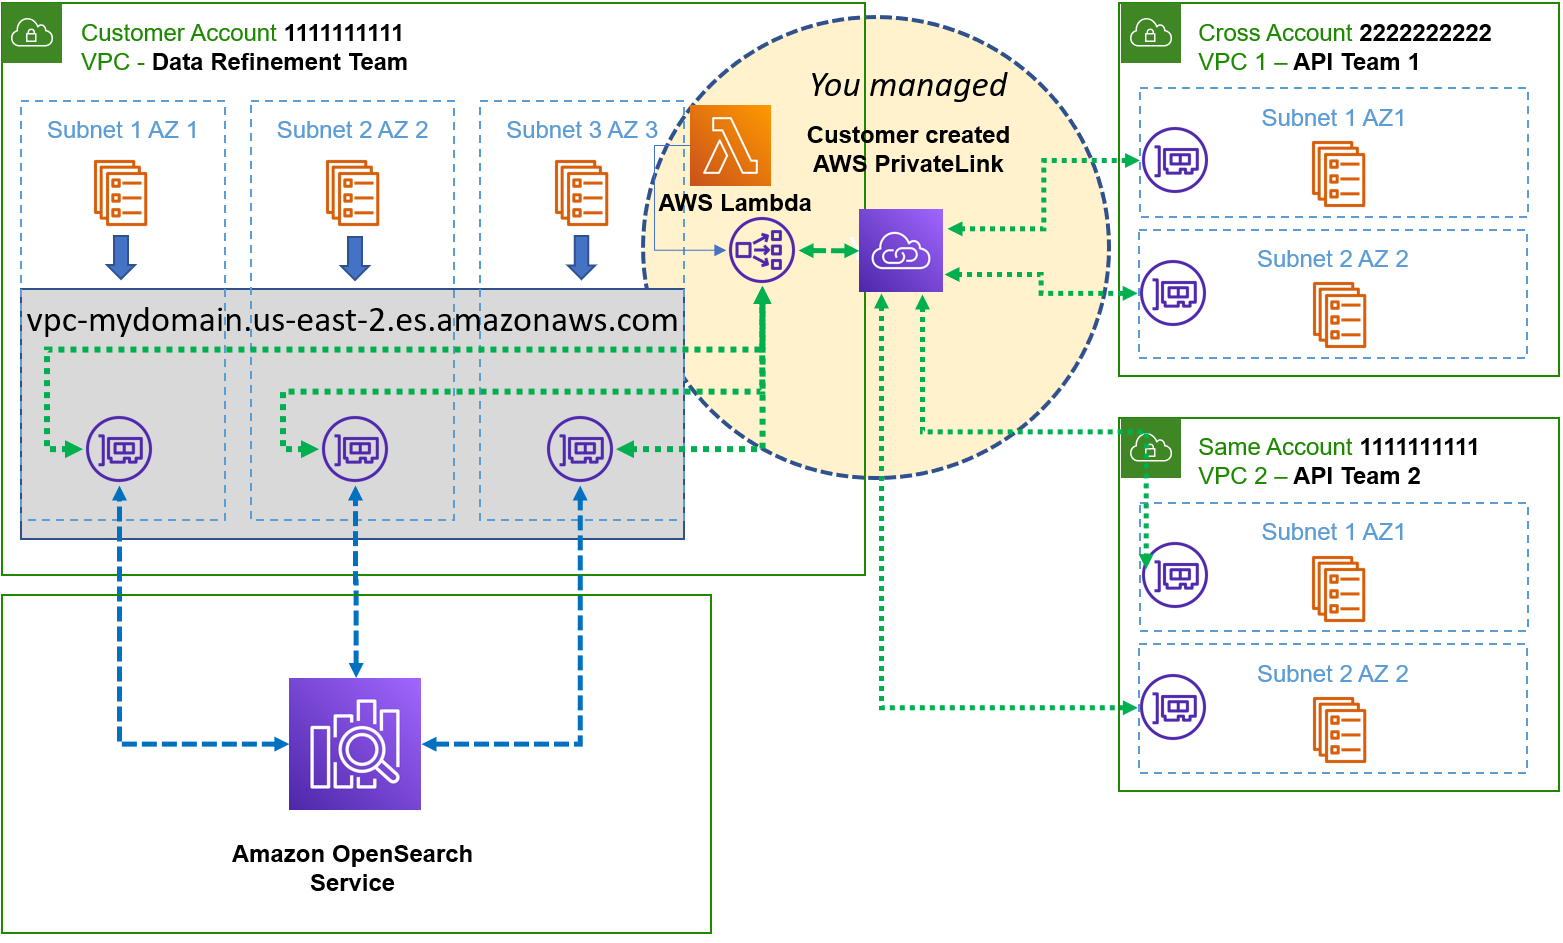
Self-managed AWS PrivateLink architecture to connect different VPCs

In this scenario prior to Amazon OpenSearch Service manage VPC endpoints (i.e., powered by AWS PrivateLink), you would have to create the following items:

  1. Deploy an NLB in your VPC
  2. Create a target group that points to the IP addresses of the Elastic Network Interfaces (ENIs), which the Amazon OpenSearch Service creates in your VPC and is used to launch the Amazon OpenSearch Service
  3. Create an AWS PrivateLink deployment and reference your newly created NLB

When you implement the NLB, a target group can only reference IP addresses, an Amazon EC2 instance, or an Application Load Balancer (ALB). If you referenced the IP addresses as targets, then you had to build a process that detected the changes in the IP address if the domain changed due to service initiated or self-initiated blue/green deployments. You must maintain yet another complex process to ensure that you always have active ENIs with which to point your target groups or you lose connectivity.

Typically, customers use an AWS Lambda with scheduled events in Amazon CloudWatch. This means that you use the AWS Lambda to detect the current state where the ENIs that provided the IP addresses were marked as active for the description that matched the ENIs your domain creates. You schedule AWS Lambda to wake up within the time to live (TTL) of the Domain Name Service (DNS) settings (typically 60 seconds) and compare the existing IP addresses in the target group with any new ones found when you query all ENIs with a description referencing your domain in the VPC. You then build a new target group with the deltas and you swap the target groups and drop the old one. It’s tricky, it’s complex, and you have to maintain the solution!

With the new simplified networking architecture, your teams go through the following steps.

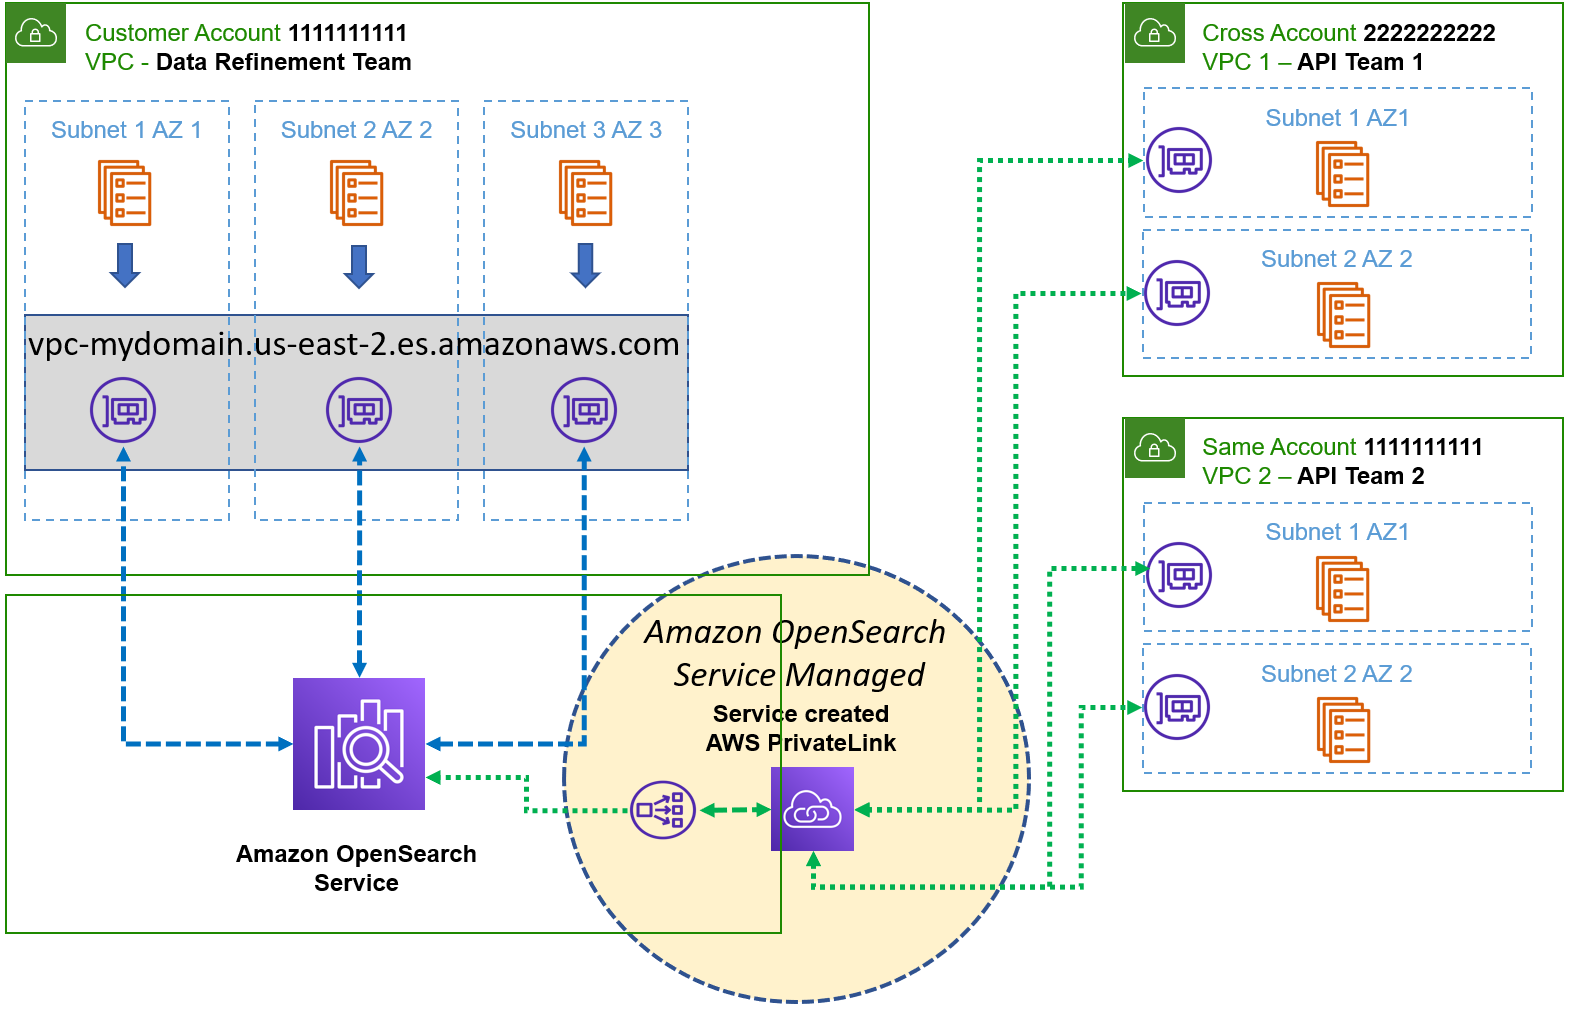
OpenSearch Service managed VPC endpoints architecture (powered by AWS PrivateLink)

Since the Amazon OpenSearch Service takes care of the infrastructure described previously — but not necessarily on the same implementation — all you really need to concern yourself with is creating the connections using the instructions in our service documentation.

Once you complete the steps in the instructions and remove your own implementation, your architecture is then simplified as seen in the following diagram.

Once you complete the steps in the instructions and remove your own implementation, your architecture is then simplified.

At this point, the development teams (API team 1 and API team 2) can access the Amazon OpenSearch cluster via Amazon OpenSearch Service Managed VPC Endpoint. This option is highly scalable with a simplified network architecture in which you don’t have to worry about managing a NLB, or setting up target groups and the additional resources. If the number of development teams and VPCs grow in the future, you associate the domain with the associated interface VPC endpoint. You can access services in VPCs in same or different accounts, even if there are overlapping CIDR Block IP ranges.

Conclusion

In this post, we walked through the architectural design of accessing Amazon OpenSearch cluster from different VPCs across different accounts using OpenSearch Service-managed VPC endpoint (AWS PrivateLink). Using Transit Gateway, self-managed AWS PrivateLink or VPC peering required complex networking strategies that increased operation burden. With the introduction of VPC endpoints for Amazon OpenSearch Service, the complexity of your solutions is greatly simplified and what’s even better, it’s managed for you!


About the authors

Aish Gunasekar is a Specialist Solutions architect with a focus on Amazon OpenSearch Service. Her passion at AWS is to help customers design highly scalable architectures and help them in their cloud adoption journey. Outside of work, she enjoys hiking and baking.

Kevin Fallis (@AWSCodeWarrior) is an AWS specialist search solutions architect.  His passion at AWS is to help customers leverage the correct mix of AWS services to achieve success for their business goals. His after-work activities include family, DIY projects, carpentry, playing drums, and all things music.

Scale read and write workloads with Amazon Redshift

Post Syndicated from Harsha Tadiparthi original https://aws.amazon.com/blogs/big-data/scale-read-and-write-workloads-with-amazon-redshift/

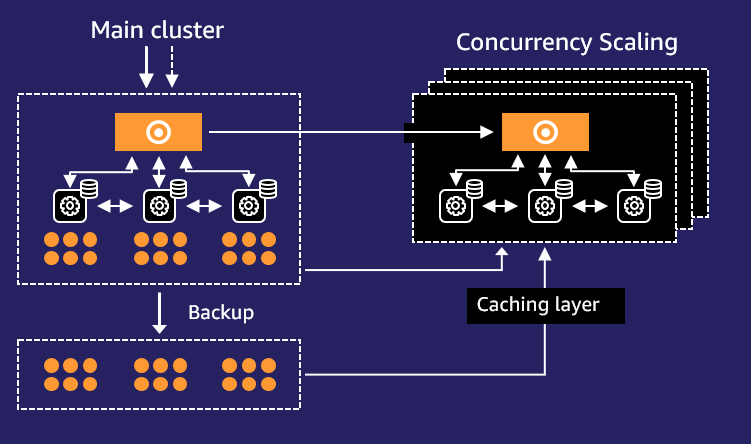
Amazon Redshift is a fast, fully managed, petabyte-scale cloud data warehouse that enables you to analyze large datasets using standard SQL. The concurrency scaling feature in Amazon Redshift automatically adds and removes capacity by adding concurrency scaling to handle demands from thousands of concurrent users, thereby providing consistent SLAs for unpredictable and spiky workloads such as BI reports, dashboards, and other analytics workloads.

Until now, concurrency scaling only supported auto scaling for read queries; write queries had to run on the main cluster. Now, we are extending concurrency scaling to support auto scaling for common write queries including COPY, INSERT, UPDATE, and DELETE. This is available on Amazon Redshift RA3 provisioned instance types in the Regions where concurrency scaling is available. Amazon Redshift serverless comes with built in dynamic auto scaling capability for read workload scaling.

In this post, we discuss how to enable concurrency scaling to offer consistent SLAs for concurrent workloads such as data loads, ETL (extract, transform, and load), and data processing with reduced queue times.

Concurrency scaling overview

With concurrency scaling, Amazon Redshift automatically and elastically scales query processing power to provide consistently fast performance for hundreds of concurrent queries. Concurrency scaling resources are added to your Amazon Redshift cluster transparently in seconds, as concurrency increases, to serve sudden spikes in concurrent requests with fast performance without wait time. When the workload demand subsides, Amazon Redshift automatically shuts down concurrency scaling resources to save you cost.

The following diagram shows how concurrency scaling works at a high level.

The workflow contains the following steps:

  1. All queries go to the main cluster.
  2. When queries in the designated workload management (WLM) queue begin queuing, Amazon Redshift automatically routes eligible queries to the new clusters, enabling concurrency scaling.
  3. Amazon Redshift automatically spins up a new cluster, processes waiting queries, and shuts down the concurrency scaling cluster when no longer needed.

Enable Amazon Redshift concurrency scaling

You can manage concurrency scaling at the WLM queue level, where you set concurrency scaling policies for specific queues. When concurrency scaling is enabled for a queue, eligible write and read queries are sent to concurrency scaling clusters without having to wait for resources to free up on the main Amazon Redshift cluster. Amazon Redshift handles spinning up concurrency scaling clusters, routing of the queries to the transient clusters, and relinquishing the concurrency clusters.

You can enable concurrency scaling on both automatic and manual WLM.

You first need to determine which parameter group your cluster is. To do so, complete the following steps:

  1. On the Amazon Redshift console, choose Clusters in the navigation pane.
  2. Choose your cluster.
  3. On the Properties tab, note the parameter group associated to the cluster.
    Now you can configure your WLM parameters.
  4. Under Configurations in the navigation pane, choose Workload management.
  5. Choose the parameter group associated to the cluster.If you’re using the default parameter group default.redshift-1.0, you need to create a custom parameter group and assign that to the cluster. The default parameter group has preset values for each of its parameters, and it can’t be modified.
  6. On the Parameters tab, you can choose between 1–10 max_concurrency_scaling_clusters.This is the max number of concurrent Amazon Redshift clusters you can have running at the same time. Ten is the soft limit; this limit can be increased by submitting a service limit increase request with a support case.
  7. On the Workload management tab, choose auto mode for the concurrency scaling cluster.

Example use cases

In this section, we use three use cases to help you understand how concurrency scaling for read and write heavy workloads can seamlessly scale to improve workload performance SLAs.

We used a 3 TB Cloud DW benchmark dataset. The test included a total of 103 concurrent queries, with each run using a separate database connection. The 103 queries constituted 60 queries from the 99 TPC-DS queries and 43 write queries, with a mix of copy, insert, update and delete statements. We used RA3.4xlarge 5 compute nodes.

The following scenarios showcase how concurrency scaling for reads and writes can seamlessly auto scale and positively impact a heavy concurrent mixed workload:

  • All queries triggered concurrently with concurrency scaling turned off
  • All queries triggered concurrently with concurrency scaling cluster limit set to 5 clusters
  • All queries triggered concurrently with concurrency scaling cluster limit set to 10 clusters

Scenario 1: All queries triggered concurrently with concurrency scaling turned off

In this benchmark test, all queries completed in 299 minutes. The following are the test details.

The Amazon Redshift query optimizer turned the 103 queries into 257 sub-queries for better performance in this run. Amazon Redshift continuous to learn from operational statistics to optimize your workload.

The following screenshot shows how Amazon Redshift auto WLM mode chose to run 16 queries concurrently while queuing the rest. Because concurrency scaling is turned off, no additional clusters are spun up and the queries continue to wait for running queries to complete before they can be processed. Notice the number of queries queued stayed at a higher number for a long period of time and eventually lowered as only a few queries could concurrently run.

No additional concurrent clusters spun up during the window of the workload, as seen in the following screenshot, requiring the primary cluster to process all the queries.

Scenario 2: All queries triggered concurrently with concurrency scaling cluster max limit set to 5 clusters

In this test, all queries completed in 49 minutes.

The following screenshot depicts significant queuing. Within seconds, five additional Amazon Redshift clusters are spun up into ready state, allowing 53 queries to run simultaneously. This number can change in your cluster based on the query types. Notice the number of queries queued starts lowering as more queries are completed using the five additional clusters.

Over time, the concurrency scaling clusters start to wind down progressively to 0 as the queries no longer waited.

Scenario 3: All queries triggered concurrently with concurrency scaling cluster limit set to 10 clusters

In this test, all queries completed in 28 minutes.

The following screenshot depicts significant queuing. Within seconds, 10 additional Amazon Redshift clusters are spun up into ready state, allowing multiple queries to run simultaneously. This number can change in your cluster based on the query types. Notice the number of queries queued starts lowering as more queries are completed using the five additional clusters.

Over time, the concurrency scaling clusters start to wind down progressively to 0 as the queries no longer waited.

Test results review

The following table summarizes our test results.

. Test Scenario 1 Test Scenario 2 Test Scenario 3
Total Workload Completion Time 299 Minutes 49 Minutes 28 Minutes

The test results reveal how concurrency scaling for a mixed workload of reads and writes lowered the total workload completion time from 299 minutes to 28 minutes, which is more than 10 times an improvement in SLAs while being cost effective by only paying for the additional clusters when scaling is necessary.

Monitor concurrency scaling

One method to monitor concurrency scaling is via system views. To monitor which queries benefitted from concurrency scaling, you can use concurrency_scaling_status from stl_query. Concurrency scaling of 1 indicates that the query ran on a concurrency scaling cluster. To monitor concurrency scaling usage, you can use the SVCS_CONCURRENCY_SCALING_USAGE system view.

The Amazon CloudWatch metrics ConcurrencyScalingActiveClusters and ConcurrencyScalingSeconds enable you to set up monitoring of concurrency scaling usage. For more information, refer to Monitoring Amazon Redshift using CloudWatch metrics.

Configure usage limit

With every 24 hours used of the main Amazon Redshift cluster, you accrue 1 hour of concurrency scaling credit. This free credit can be used by both read and write queries. For any usage that exceeds the accrued free usage credits, you’re billed on a per-second basis based on the on-demand rate of your Amazon Redshift cluster. You can apply cost controls for concurrency scaling at the cluster level. You can choose to create multiple queues for ETL, Dashboard, and adhoc workload. With this you can choose to turn on concurrency scaling for selective queues.

As shown in the following screenshot, you can choose a time period (daily, weekly, or monthly) and specify the desired usage limit. You can then choose an action option (Alert, Log to system table, or Disable feature). For more details on how to set cost controls for concurrency scaling, refer to Manage and control your cost with Amazon Redshift Concurrency Scaling and Spectrum.

Summary

In this post, we showed how you can enable concurrency scaling to help you meet the SLAs for both read and write workloads by seamlessly scaling out to the maximum number of clusters you configured, thereby increasing your cluster throughput while controlling your costs. Concurrency scaling with read and write capability can enable you to handle a number of scenarios, such as sudden increases in the volume of data in your data pipeline, backfill operations, ad hoc reporting, and month end processing. It’s now time to put this learning into action and begin optimizing your Redshift cluster(s) for both read and write throughput!


About the Authors

Harsha Tadiparthi is a specialist Principal Solutions Architect, Analytics at AWS. He enjoys solving complex customer problems in databases and analytics and delivering successful outcomes. Outside of work, he loves to spend time with his family, watch movies, and travel whenever possible.

Harshida Patel is a Specialist Principal Solutions Architect, Analytics with AWS.

Ramu Ponugumati is a Sr. Technical Account Manager, specialist in Analytics and AI/ML at AWS. He works with enterprise customers to modernize and cost optimize workloads, and helps them build reliable and secure applications on the AWS platform. Outside of work, he loves spending time with his family, playing tennis, and gardening.

Creating an accessible search experience with the QueryBuilder component

Post Syndicated from Lindsey Wild original https://github.blog/2022-12-13-creating-an-accessible-search-experience-with-the-querybuilder-component/

Overview

Throughout the GitHub User Interface (UI), there are complex search inputs that allow you to narrow the results you see based on different filters. For example, for repositories with GitHub Discussions, you can narrow the results to only show open discussions that you created. This is completed with the search bar and the use of defined filters. The current implementation of this input has accessibility considerations that need to be examined at a deeper level, from the styled search input to the way items are grouped, that aren’t natively accessible, so we had to take some creative approaches. This led us to creating the QueryBuilder component, which is a fully accessible component designed for these types of situations.

As we rethought this core pattern within GitHub, we knew we needed to make search experiences accessible so everyone can successfully use them. GitHub is the home for all developers, including those with disabilities. We don’t want to stop at making GitHub accessible; we want to empower other developers to make a similar pattern accessible, which is why we’ll be open sourcing this component!

Process

GitHub is a very large organization with many moving pieces. Making sure that accessibility is considered in every step of the process is important. Our process looked a little something like this:

The first step was that we, the Accessibility Team at GitHub, worked closely with the designers and feature teams to design and build the QueryBuilder component. We wanted to understand the intent of the component and what the user should be able to accomplish. We used this information to help construct the product requirements.

Our designers and accessibility experts worked together on several iterations of what this experience would look like and annotated how it should function. Once everyone agreed on a path forward, it was time to build a proof of concept!

The proof of concept helped to work out some of the trickier parts of the implementation, which we will get to in the following Accessibility Considerations section. An accessibility expert review was conducted at multiple points throughout the process.

The Accessibility Team built the reusable component in collaboration with the Primer Team (GitHub’s Design System), and then collaborated with the GitHub Discussions Team on what it’d take to integrate the component. At this point in time, we have a fully accessible MVP component that can be seen on any GitHub.com Discussions landing page.

Introducing the QueryBuilder component

The main purpose of the QueryBuilder is to allow a user to enter a query that will narrow their results or complete a search. When a user types, a list of suggestions appears based on their input. This is a common pattern on web, which doesn’t sound too complicated, until you start to consider these desired features:

  • The input should contain visual styling that shows a user if they’ve typed valid input.

Text input with an icon of a magnifier at the beginning. The input text of "language:" is a dark gray and the value "C++" is a shade of medium blue with a highlight background of a lighter blue.

  • When a suggestion is selected, it can either take a user somewhere else (“Jump to”) or append the selection to the input (“Autocomplete”).

Two different search inputs with results. The results in the first example have "Autocomplete" appended to the end of the row of each suggestion. The results in the second example have "Jump to" appended to the end of the row of each suggestion.

  • The set of suggestions should change based on the entered input.

Text input example "is:" is giving a different list of results than "language:" did: Action, Discussion, Marketplace, Pull request, Project, Saved, Topic, User, and Wiki.

  • There should be groups of suggestions within the suggestion box.

Search input with results; first group of items is "Recent" with the Recent header on top. The second group is "Pages" with the Pages header on top of the second group. There is a line separator between each group of items.

Okay, now we’re starting to get more complicated. Let’s break these features down from an accessibility perspective.

Accessibility considerations

Note: these considerations are not comprehensive to every accessibility requirement for the new component. We wanted to highlight the trickier-to-solve issues that may not have been addressed before.

Semantics

We talked about this component needing to take a user’s input and provide suggestions that a user can select from in a listbox. We are using the Combobox pattern, which does exactly this.

Styled input

Zoomed in look at the styling between a qualifier, in this case "language:" and the value, "C++". The qualifier has a label of "color: $fg.default" which is a dark gray, and the value has a label of "color: $fg.accent; background: $bg.accent”, which are a lighter and darker shade of blue.

Natively, HTML inputs do not allow specific styling for individual characters, unless you use contenteditable. We didn’t consider this to be an accessible pattern; even basic mark-up can disrupt the expected keyboard cursor movement and contenteditable’s support for ARIA attributes is widely inconsistent. To achieve the desired styling, we have a styled element – a <div aria-hidden="true"> with <span> elements inside—that is behind the real <input> element that a user interacts with. It is perfectly lined up visually so all of the keyboard functionality works as expected, the cursor position is retained, input text is duplicated inside, and we can individually style characters within the input. We also tested this at high Zoom levels to make sure that everything scaled correctly. color: transparent was added to the real input’s text, so sighted users will see the styled text from the <div>.

While the styled input adds some context for sighted users, we also explored whether we could make this apparent for people relying on a screen reader. Our research led us to create a proof of concept with live-region-based announcements as the cursor was moved through the text. However, based on testing, the screen reader feedback proved to be quite overwhelming and occasionally flaky, and it would be a large effort to accurately detect and manage the cursor position and keyboard functionality for all types of assistive technology users. Particularly when internationalization was taken into account, we decided that this would not be overly helpful or provide good return on investment.

Items with different actions

Search results displaying the "Jump to" appended text to the results in the Recent group and "Autocomplete" appended to the results in the Saved searches group; there is a rectangular highlight over the appended words for emphasis.

Typical listbox items in a combobox pattern only have one action–and that is to append the selected option’s value to the input. However, we needed something more. We wanted some selected option values to be appended to the input, but others to take you to a different page, such as search results.

For options that will append their values to the input when selected, there is no additional screen reader feedback since this is the default behavior of a listbox option. These options don’t have any visual indication (color, underline, etc.) that they will do anything other than append the selection to the input.

When an option will take a user to a new location, we’ve added an aria-label to that option explaining the behavior. For example, an option with the title README.md and description primer/react that takes you directly to https://github.com/primer/react/blob/main/README.md will have aria-label=”README.md, primer/react, jump to this file”. This explains the file (README.md), description/location of the file (primer/react), action (jump to), and type (this file). Since this is acting as a link, it will have visual text after the value stating the action. Since options may have two different actions, having a visual indicator is important so that a user knows what will happen when they make a selection.

Group support

A text input and an expanded list of suggestions. The group titles, "Recent" and "Saved searches,” which contain list items related to those groups, are highlighted.

Groups are fully supported in an accessible way. role="group" is not widely supported inside of listbox for all assistive technologies, so our approach conveys the intent of grouped items to each user, but in different ways.

For sighted users, there is a visual header and separator for each group of items. The header is not focusable, and it has role="presentation" so that it’s hidden from screen reader users because this information is presented in a different way to them (which is described later in this blog). The wrapping <ul> and <li> elements are also given role="presentation" since a listbox is traditionally a list of <li> items inside of one parent <ul>.

For screen reader users, the grouped options are denoted by an aria-label with the content of each list item and the addition of the type of list item. This is the same aria-label as described in the previous section about items with different actions. An example aria-label for a list item with the value primer/react that takes you to the Primer React repository when chosen is “primer/react, jump to this repository.” In this example, adding “repository” to the aria-label gives the context that the item is part of the “Repository” group, the same way the visual heading helps sighted users determine the groups. We chose to add the item type at the end of the aria-label so that screen reader users hear the name of the item first and can navigate through the suggestions quicker. Since the aria-label is different from the visible label, it has to contain the visible label’s text at the beginning for voice recognition software users.

Screen reader feedback

By default, there is no indication to a screen reader user how many suggestions are displayed or if the input is successfully cleared via the optional clear button.

To address this, we added an aria-live region that updates the text whenever the suggestions change or the input is cleared. A screen reader will receive feedback when they press the “Clear” button that the input has been cleared, focus is restored to the input, and how many suggestions are currently visible.

While testing the aria-live updates, we noticed something interesting; if the same number of results are displayed as a user continues typing, the aria-live region will not update. For example, if a user types “zzz” and there are 0 results, and then they add an additional “z” to their query (still 0 results), the screen reader will not re-read “0 results” since the aria-live API did not detect a change in the text. To address this, we are adding and removing a &nbsp; character if the previous aria-live message is the same as the new aria-live message. The &nbsp; will cause the aria-live API to detect a change and the screen reader will re-read the text without an audible indication that a space was added.

Recap

In conclusion, this was a tremendous effort with a lot of teams involved. Thank you to the many Hubbers who collaborated on this effort, and to our accessibility friends at Prime Access Consulting (PAC). We are excited for users to get their hands on this new experience and really accelerate their efficiency in complex searches. This component is currently in production in a repository with GitHub Discussions enabled, and it will be rolling out to more parts of the UI. Stay tuned for updates about the progress of the component being open sourced.

What’s next

We will integrate this component into additional parts of GitHub’s UI, such as the new global search experience so all users can benefit from this accessible, advanced searching capability. We will continue to add the component to other areas of the GitHub UI and address any bugs or feedback we receive.

As mentioned in the beginning of this post, it will be open sourced in Primer ViewComponents and Primer React along with clear guidelines on how to use this component. The base of the component is a Web Component which allows us to share the functionality between ViewComponents and React. This will allow developers to easily create an advanced, accessible, custom search component without spending time researching how to make this pattern accessible or functional, since we’ve already done that work! It can work with any source of data as long as it’s in the expected format.

Many teams throughout GitHub are constantly working on accessibility improvements to GitHub.com. For more on our vision for accessibility at GitHub, visit accessibility.github.com.

Visualizing the impact of AWS Lambda code updates

Post Syndicated from David Boyne original https://aws.amazon.com/blogs/compute/visualizing-the-impact-of-aws-lambda-code-updates/

This post is written by Brigit Brown (Solutions Architect), and Helen Ashton (Observability Specialist Solutions Architect).

When using AWS Lambda, changes made to code can impact performance, functionality, and cost. It can be challenging to gain insight into how these code changes impact performance.

This blog post demonstrates how to capture, record, and visualize Lambda code deployment data with other data in an Amazon CloudWatch dashboard. This solution enables serverless developers to gain insight into the impact of code changes to Lambda functions and make data-driven decisions.

There are three steps to this solution:

  1. Capture: Lambda function code updates using Amazon EventBridge.
  2. Record: Lambda function code updates by creating an Amazon CloudWatch metric.
  3. Visualize: The relationship between Lambda function code updates and application KPIs by creating a CloudWatch dashboard.

Overview

EventBridge and CloudWatch are used to monitor and visualize the impact of code changes to Lambda functions on key application metrics.

Architecture diagram for capturing, recording, and visualizing Lambda function updates, showing the AWS Lambda function event being detected by Amazon EventBridge, and finally being sent to Amazon CloudWatch

Step 1: Capturing

AWS CloudTrail records all management events for AWS services. These are the operations performed on resources in your AWS account and include Lambda function code updates.

An EventBridge rule can listen for Lambda functions code updates and send these events to other AWS services, in this case to CloudWatch.

You can create EventBridge rules using an example event syntax as reference. To get the example event, update the code of a Lambda function and search in CloudTrail for all events with Event source of lambda.amazonaws.com, and an Event name starting with UpdateFunctionCode. UpdateFunctionCode is one of many events captured for Lambda functions. For example:

{
  "eventVersion": "1.08",
  "userIdentity": {
    "type": "AssumedRole",
    "principalId": "x",
    "arn": "arn:aws:sts::xxxxxxxxxxxx:assumed-role/Admin/x",
    "accountId": "xxxxxxxxxxxx",
    "accessKeyId": "xxxxxxxxxxxxxxxxx",
    "sessionContext": {
      "sessionIssuer": {
        "type": "Role",
        "principalId": "x",
        "arn": "arn:aws:iam::xxxxxxxxxxxx:role/Admin",
        "accountId": "xxxxxxxxxxxx",
        "userName": "Admin"
      },
      "webIdFederationData": {},
      "attributes": {
        "creationDate": "2022-09-22T16:37:04Z",
        "mfaAuthenticated": "false"
      }
    }
  },
  "eventTime": "2022-09-22T16:42:07Z",
  "eventSource": "lambda.amazonaws.com",
  "eventName": "UpdateFunctionCode20150331v2",
  "awsRegion": "us-east-1",
  "sourceIPAddress": "AWS Internal",
  "userAgent": "AWS Internal",
  "requestParameters": {
    "fullyQualifiedArn": {
      "arnPrefix": {
        "partition": "aws",
        "region": "us-east-1",
        "account": "xxxxxxxxxxxx"
      },
      "relativeId": {
        "functionName": "example-function"
      },
      "functionQualifier": {}
    },
    "functionName": "arn:aws:lambda:us-east-1:xxxxxxxxxxxx:function:example-function",
    "publish": false,
    "dryRun": false
  },
  "responseElements": {
    "functionName": "example-function",
    "functionArn": "arn:aws:lambda:us-east-1:xxxxxxxxxxxx:function:example-function",
    "runtime": "python3.8",
    "role": "arn:aws:iam::xxxxxxxxxxxx:role/role-name",
    "handler": "lambda_function.lambda_handler",
    "codeSize": 1011,
    "description": "",
    "timeout": 123,
    "memorySize": 128,
    "lastModified": "2022-09-22T16:42:07.000+0000",
    "codeSha256": "x",
    "version": "$LATEST",
    "environment": {},
    "tracingConfig": {
      "mode": "PassThrough"
    },
    "revisionId": "x",
    "state": "Active",
    "lastUpdateStatus": "InProgress",
    "lastUpdateStatusReason": "The function is being created.",
    "lastUpdateStatusReasonCode": "Creating",
    "packageType": "Zip",
    "architectures": ["x86_64"],
    "ephemeralStorage": {
      "size": 512
    }
  },
  "requestID": "f566f75f-a7a8-4e87-a177-2db001d40382",
  "eventID": "4f90175d-3063-49b4-a467-04150b418457",
  "readOnly": false,
  "eventType": "AwsApiCall",
  "managementEvent": true,
  "recipientAccountId": "113420664689",
  "eventCategory": "Management",
  "sessionCredentialFromConsole": "true"
}

The key fields are eventSource, eventName, functionName, and eventType. This is the event syntax containing only the key fields.

{
    "eventSource": "lambda.amazonaws.com",
    "eventName": "UpdateFunctionCode20150331v2",
    "responseElements": {
        "functionName": "example-function"
        }
    "eventType": "AwsApiCall",
}

Use this example event as a reference to write the EventBridge rule pattern.

{
  "source": ["aws.lambda"],
  "detail-type": ["AWS API Call via CloudTrail"],
  "detail": {
    "eventSource": ["lambda.amazonaws.com"],
    "eventName": [{
      "prefix": "UpdateFunctionCode"
    }],
    "eventType": ["AwsApiCall"]
  }
}

In this EventBridge rule, the detail section contains properties to match the original UpdateFunctionCode event pattern. The values to match are in square brackets using EventBridge syntax.

The eventName changes with each UpdateFunctionCode event, including date and version information within the value (i.e. UpdateFunctionCode20150331v2) and so a prefix matching filter is used to match the start of the eventName.

The source and the detail-type of the event are two additional fields included by EventBridge. For all Lambda CloudTrail calls, the detail-type is [“AWS API Call via CloudTrail”] and the source is “aws.lambda“.

Next, send an event to CloudWatch. Each EventBridge rule can send events to multiple targets, including Amazon SNS and CloudWatch log groups. Choose a target of CloudWatch log groups, with the log group specified as /aws/events/lambda/updates. EventBridge creates this log group in CloudWatch.

Finally, test the EventBridge rule.

  1. To trigger an event, change the code for any Lambda function and deploy.

    AWS Console

  2. To view the event, navigate to the CloudWatch console > Logs > Log groups.

    Log group


  3. Choose the log group (/aws/events/lambda/updates).

    Selected log group

  4. Select the most recent log stream.

    Recent log stream

  5. If the EventBridge rule is successful, the Lambda code update event is visible. To see the JSON from the event, expand the event with the arrows to the left and see the detail field.

    Expanded view of event

Step 2: Recording

To display the Lambda function update data alongside other CloudWatch metrics, convert the log event into a metric using metric filters. A metric filter is created on a log group. If a log event matches a metric filter, a metric data point is created.

A metric filter uses a filter pattern to match on specific fields in the JSON event. In this case, the filter pattern matches on the eventName starting with UpdateFunctionCode (note the star as a wildcard).

{ $.detail.eventName=UpdateFunctionCode* }

Create a metric filter with the following:

  • Metric namespace: LambdaEvents
  • Metric name: UpdateFunction
  • Metric value: 1
  • Dimensions: DimensionName: FunctionName; Dimension Value: $.detail.responseElements.functionName

Dimensions allow metadata to be added to metrics. Setting a dimension with the JSON path to $.detail.responseElements.functionName allows the FunctionName value to come from the data in the log event. This makes this a generic metric filter for any Lambda function.

The event pattern of a metric filter can be tested on real data in the Test pattern section. Choose the log stream to test the filter on by using the Select log data drop down and selecting Test pattern. This shows a table with the matched events and the field value.

The CloudWatch console provides a view of the metrics for Lambda functions. To see the metric data, update the code for a Lambda function and navigate to the CloudWatch console. Choose Metrics > All metrics from the left menu, the Custom namespace of LambdaEvents, and dimension of FunctionName (as set in the preceding metric filter). To see the data on the chart, check the box beside the metric of interest. The metric can be added to a CloudWatch dashboard under the Actions menu.

Metric filters only create metrics when a new log event is ingested. You must wait for a new log event to see the metrics.

Step 3: Visualizing

A CloudWatch dashboard enables the visualization of metric data and creation of customized views. The dashboard can contain multiple widgets with data from metrics, logs, and alarms.

The following dashboard shows an example of visualizing Lambda code updates alongside other performance data. There is no single visualization that is right for everyone. The data added to the dashboard depends on the questions and actions the business wants to take. This data can be varied and include performance data, KPIs, and user experience.

The dashboard displays data on Lambda function code updates and Lambda performance (duration). A metric line widget shows a time chart of Lambda function duration with the update Lambda code metric data. Duration is a performance metric that is provided for all Lambda functions. Read more in Working with Lambda Function metrics.

A CloudWatch dashboard showing visualization of Lambda update code events alongside Lambda function durations for two functions. The duration is shown as an average value for the last hour and a time chart.

This screenshot shows the Lambda function duration for two different functions: PlaceOrder and AddToBasket. The duration for each function is represented in two ways:

  • A single number showing the average duration in the last hour.
  • A chart of the duration over time.

The Lambda function update event is shown on the duration time chart as an orange dot. The different views of duration show a high-level value and the detailed behavior over time. The detailed behavior is important to understanding the outcome. With only the high-level value, it is difficult to see if an increase in the hourly duration results from a short-term increase in duration, an upward trend, or a step change in behavior.

What is clear from this dashboard is that immediately following an update to the Lambda code, the PlaceOrder function duration dramatically increases from an average of ~100ms to ~300ms. This is a step change in behavior. The same deployment does not have the same impact on the duration of the AddToBasket function. While the duration is increasing near the end of the time period, it is less clear that this is because of the deployment. This dashboard provides awareness to the impact of the change at a function level so that the business can decide if the impact is acceptable.

Resources for creating your own dashboard

Conclusion

This blog demonstrates how to create an EventBridge rule and CloudWatch dashboard to visualize the impact of Lambda function code changes on performance data. First, an EventBridge rule is created to capture Lambda function code update events recorded in CloudTrail. EventBridge sends the event to CloudWatch where UpdateFunctionCode events are stored as a metric. The UpdateFunctionCode event data is visualized in a CloudWatch dashboard alongside Lambda performance data. This visibility enables teams to better understand the impact of code changes and make data-driven solutions.

You can modify the concepts in this blog and apply them to a wide variety of use cases. EventBridge can capture AWS CodeCommit and AWS CloudFormation deployments, and send the events to a CloudWatch dashboard to visualize alongside other metrics.

For more serverless learning resources, visit Serverless Land.
The collective thoughts of the interwebz