Post Syndicated from xkcd.com original https://xkcd.com/3317/
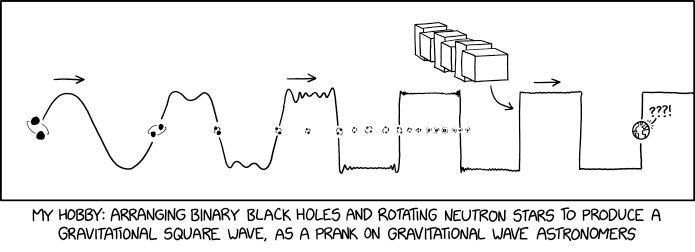
Post Syndicated from xkcd.com original https://xkcd.com/3317/
Post Syndicated from Lawton Pittenger original https://aws.amazon.com/blogs/security/introducing-route-53-resolved-ip-validation-for-aws-network-firewall/
Your workloads reach most destinations by domain name, but a firewall can only act on what it sees in the traffic. For HTTP and HTTPS, AWS Network Firewall domain rules match the name that the client puts in the request, and the client chooses that name. The connections for protocols such as SSH and SSH File Transfer Protocol (SFTP) don’t carry the domain name. The client uses the name only for the DNS lookup and then connects straight to the IP address that DNS returned. As a result, Network Firewall rules for these protocols have used IP addresses, which change over time. For web and non-web traffic alike, Network Firewall had no view of the answers that your DNS resolver returned, because that shared visibility between DNS and the firewall didn’t exist.
On October 21, 2026, we launched Route 53 Resolved IP Validation for AWS Network Firewall, at no additional charge. Amazon Route 53 Resolver now shares the IP addresses that it returns for each domain name with Network Firewall, and Network Firewall checks each new outbound connection against them. With this launch, you can now filter non-web traffic by domain name, and you can prevent Server Name Indication (SNI) manipulation on TLS traffic without needing to enable TLS inspection.
In this post, we explain how the feature works, show how to turn it on in alert mode, and walk through two common use cases. They’re examples; the same check applies to any outbound traffic that you control by domain name.
Amazon Route 53 Resolver answers DNS queries from resources in your virtual private cloud (VPC) configured to use it, and it’s available by default in every VPC. With this feature, Route 53 Resolver keeps the IP addresses that it returns for each domain name in a resolved IP cache. When a new outbound connection starts, Network Firewall checks the destination address against that cache.
10.0.0.2 for files.partner.example.com.203.0.113.10 and records the answer in the resolved IP cache.203.0.113.10 on port 22 reaches the Network Firewall endpoint.files.partner.example.com.The feature has three parts:
The following diagram shows this architecture.
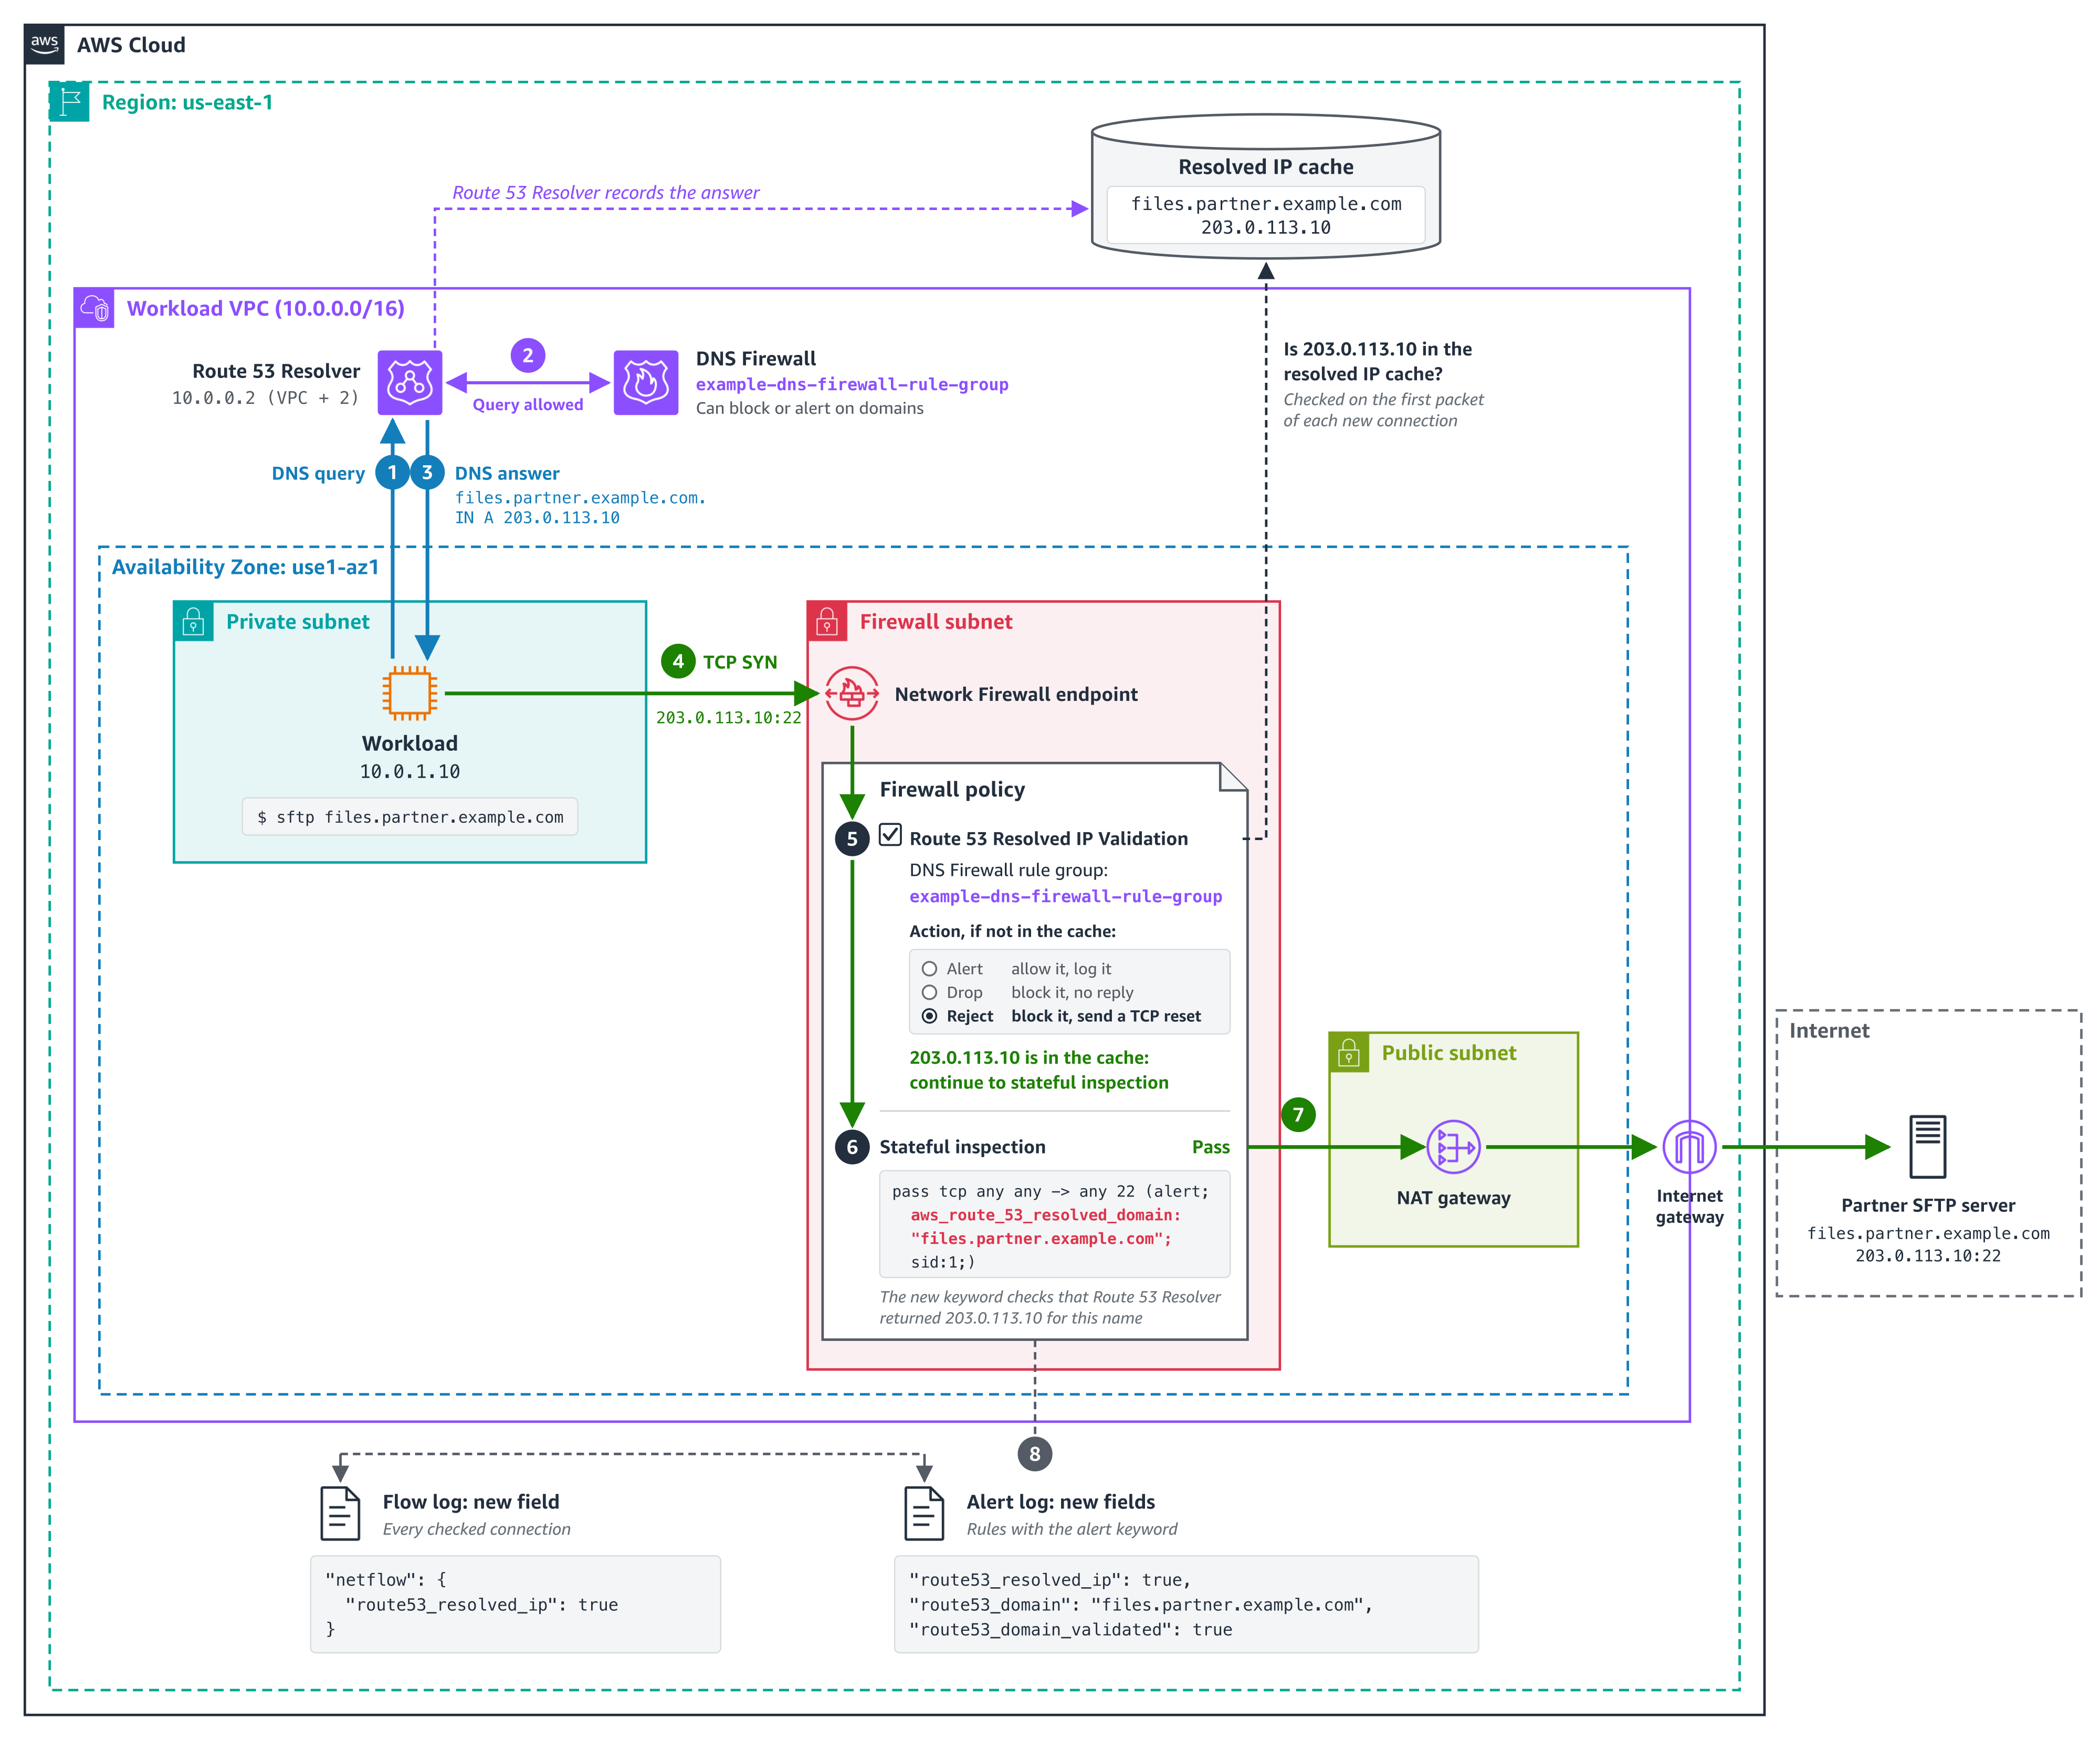
Figure 1. How Network Firewall checks the SFTP connection from use case 1 against the answers that Route 53 Resolver returned
The policy setting checks every connection, not only web traffic. A connection to an IP address that no client looked up through Route 53 Resolver, such as a hardcoded address, fails the check. If any of your workloads connect straight to IP addresses, add those addresses to Bypass destination validation IP ranges before you enforce. A stateful pass rule doesn’t exempt them because the policy check runs before your rules. The check is per address: when any client in an associated VPC looks up a name, its addresses pass the check for every client in scope in the same Availability Zone. For details, see Resolved IP validation in AWS Network Firewall in the AWS Network Firewall Developer Guide.
To follow along, you need:
aws_route_53_resolved_domain keyword) need Route 53 Resolved IP Validation turned on in the same firewall policy. Turn the setting on first, in alert mode, then add the rules.Start in alert mode because clients cache DNS answers. Network Firewall recognizes only the answers that Route 53 Resolver returns after the DNS Firewall rule group is associated with the VPC and selected in the policy. A client that still uses an answer it cached earlier fails the check until it looks up the name again, usually when its cached record expires. Alert mode lets you see this without blocking anything. Allow about 24 hours in alert mode for clients to refresh their caches.
The following screenshot illustrates these steps.
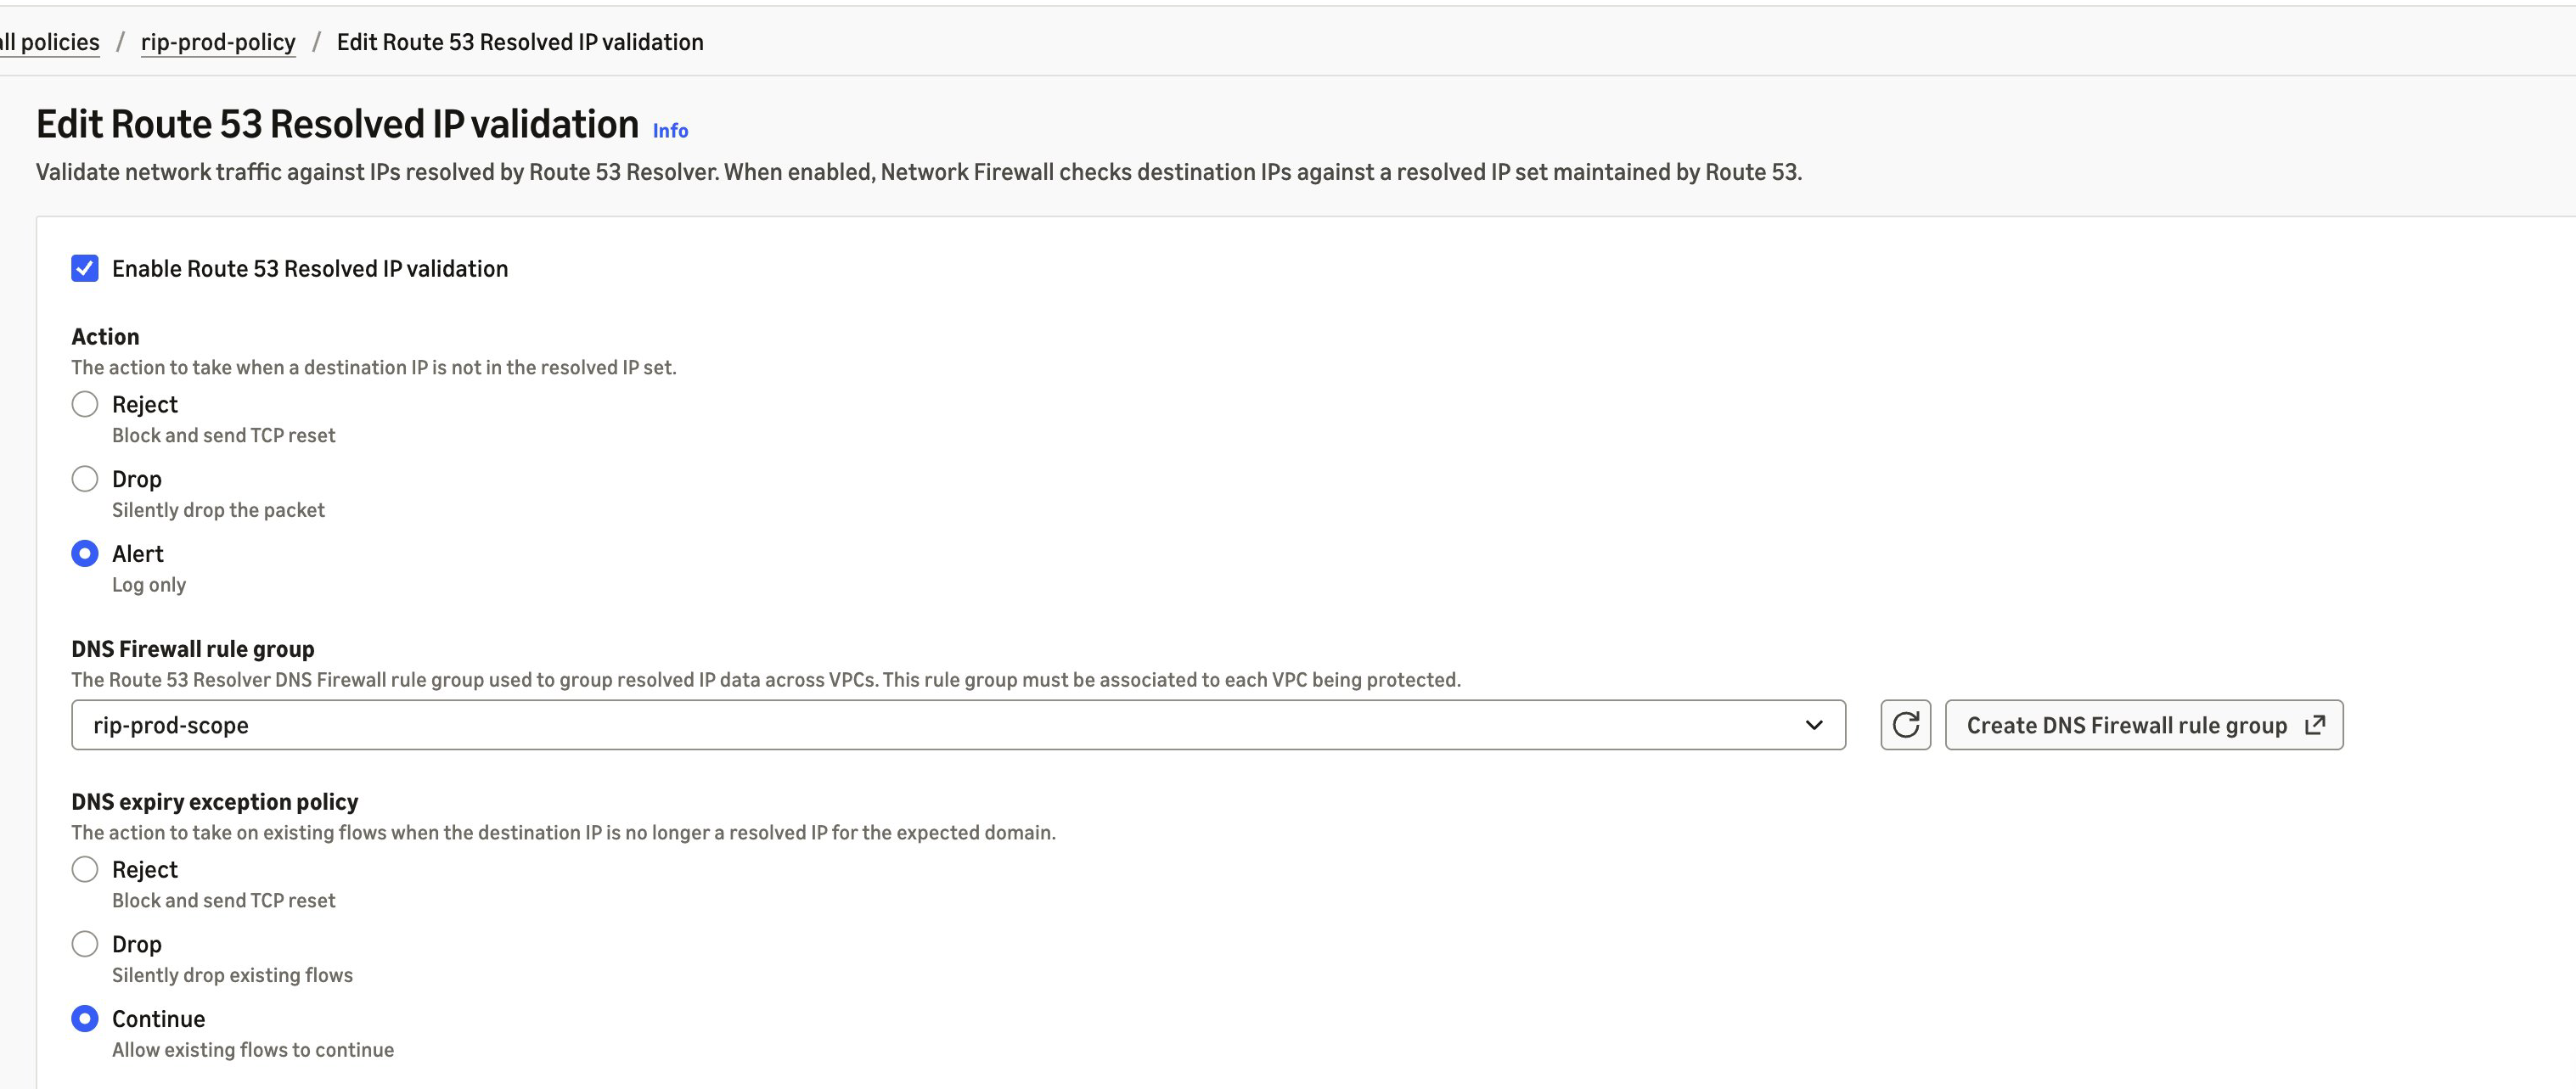
Figure 2. Route 53 Resolved IP Validation turned on in alert mode
In alert mode, Network Firewall doesn’t block a connection that fails the check, and it doesn’t write an alert of its own. It records the result in your flow logs, in the route53_resolved_ip field of each connection. A value of true means Route 53 Resolver returned the destination address for a domain name. A value of false means it didn’t, so enforcement would block the connection. The same field also appears in alert log records that a rule or the policy’s default action writes for the connection. Pass rules don’t write one unless they have the alert; keyword. The DnsUnresolvedFlows metric in Amazon CloudWatch counts the connections that fail the check, and DnsAzUnavailableFlows counts connections from an Availability Zone that doesn’t support the feature. The following alert log record (trimmed, with example values) was written by a default action that alerts, for a connection to an address that Route 53 Resolver returned:
In alert mode, this record is for a TLS connection that presented an allowed domain name but went to an address that Route 53 Resolver didn’t return for it, blocked by the policy’s default action in use case 2:
Before you switch Action to Drop or Reject, check that connections that fail the check are ones you expect and that destinations you allow by IP address are in the bypass ranges. Reject sends a TCP reset, so a blocked TCP client fails right away instead of waiting for a timeout. After you enforce, blocked connections appear in your flow logs with route53_resolved_ip as false, not in your alert logs. For the metrics and log fields to watch, see Monitoring and troubleshooting resolved IP validation.
Before this launch, Network Firewall rules for protocols that carry no domain name, such as SFTP, used IP addresses. Now, you can allow them by domain name. In this example, a workload sends files over SFTP to a partner at files.partner.example.com on TCP port 22, and the partner can change the addresses behind that name at any time. The same approach works for SSH, MySQL, and other non-web protocols. You create it as a standard stateful rule. Follow these steps:
22. Under Domain filtering, enter files.partner.example.com. For Action, choose Pass.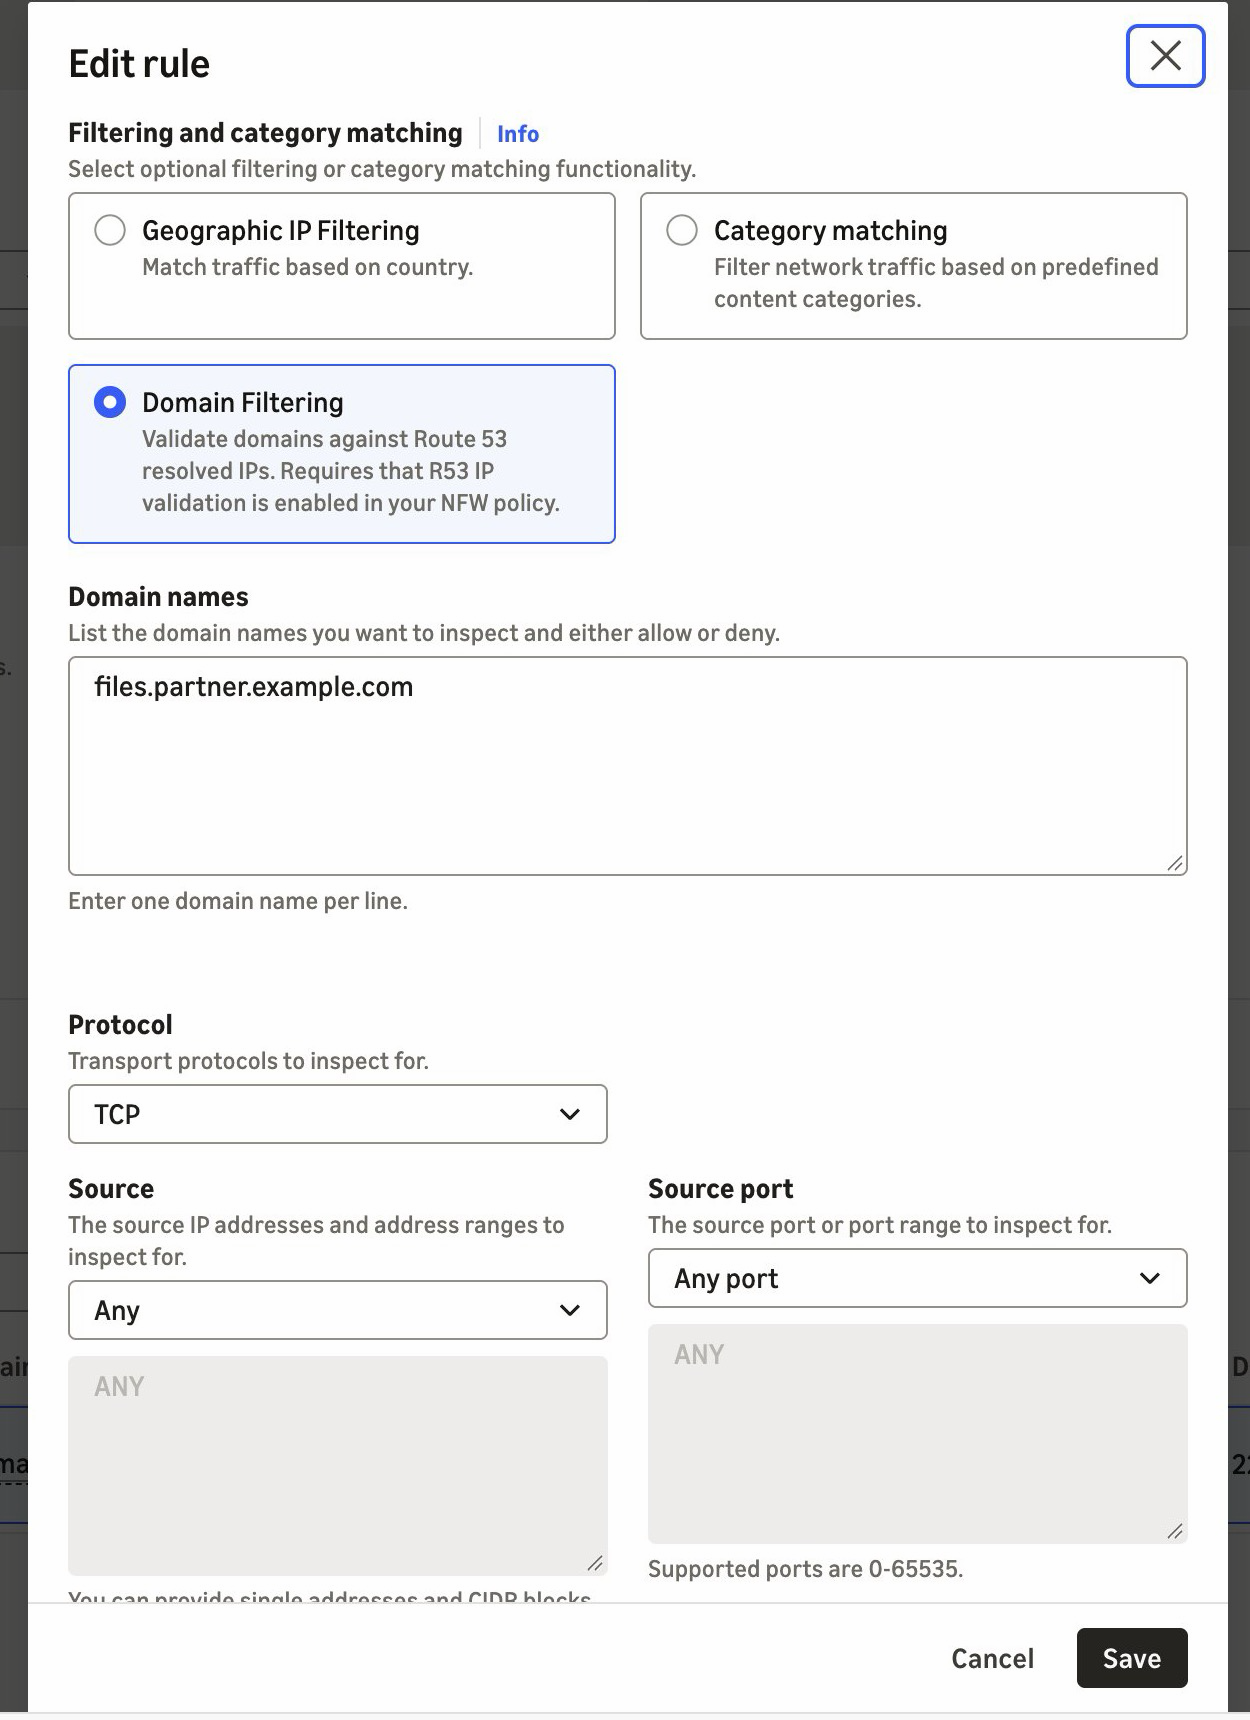
Figure 3. A pass rule for SFTP on TCP port 22, scoped to the partner’s domain name
If you manage rules as code, the equivalent Suricata rule is shown in the following code. It adds the alert; keyword so that the firewall logs allowed connections. The console rule doesn’t add it.
When the partner moves its server to a new address, the next DNS answer adds it to the resolved IP cache. There’s no IP list to maintain. The cache keeps earlier answers for longer than their DNS time to live (TTL), so the old address can still pass for a while.
With SNI spoofing, a client presents an allowed domain name in its TLS request while it connects to a different server. Preventing that has required TLS inspection, which decrypts the traffic. Route 53 Resolved IP Validation prevents it without TLS inspection. In this example, a workload calls a partner API at api.partner.example.com over HTTPS. TLS traffic on port 443 must reach only the addresses that Route 53 Resolver returned for that name. You create a pass rule in a standard stateful rule group, as in use case 1, and the firewall policy’s default action drops everything that no rule passes. Follow these steps:
443. Under Domain filtering, enter api.partner.example.com. For Action, choose Pass.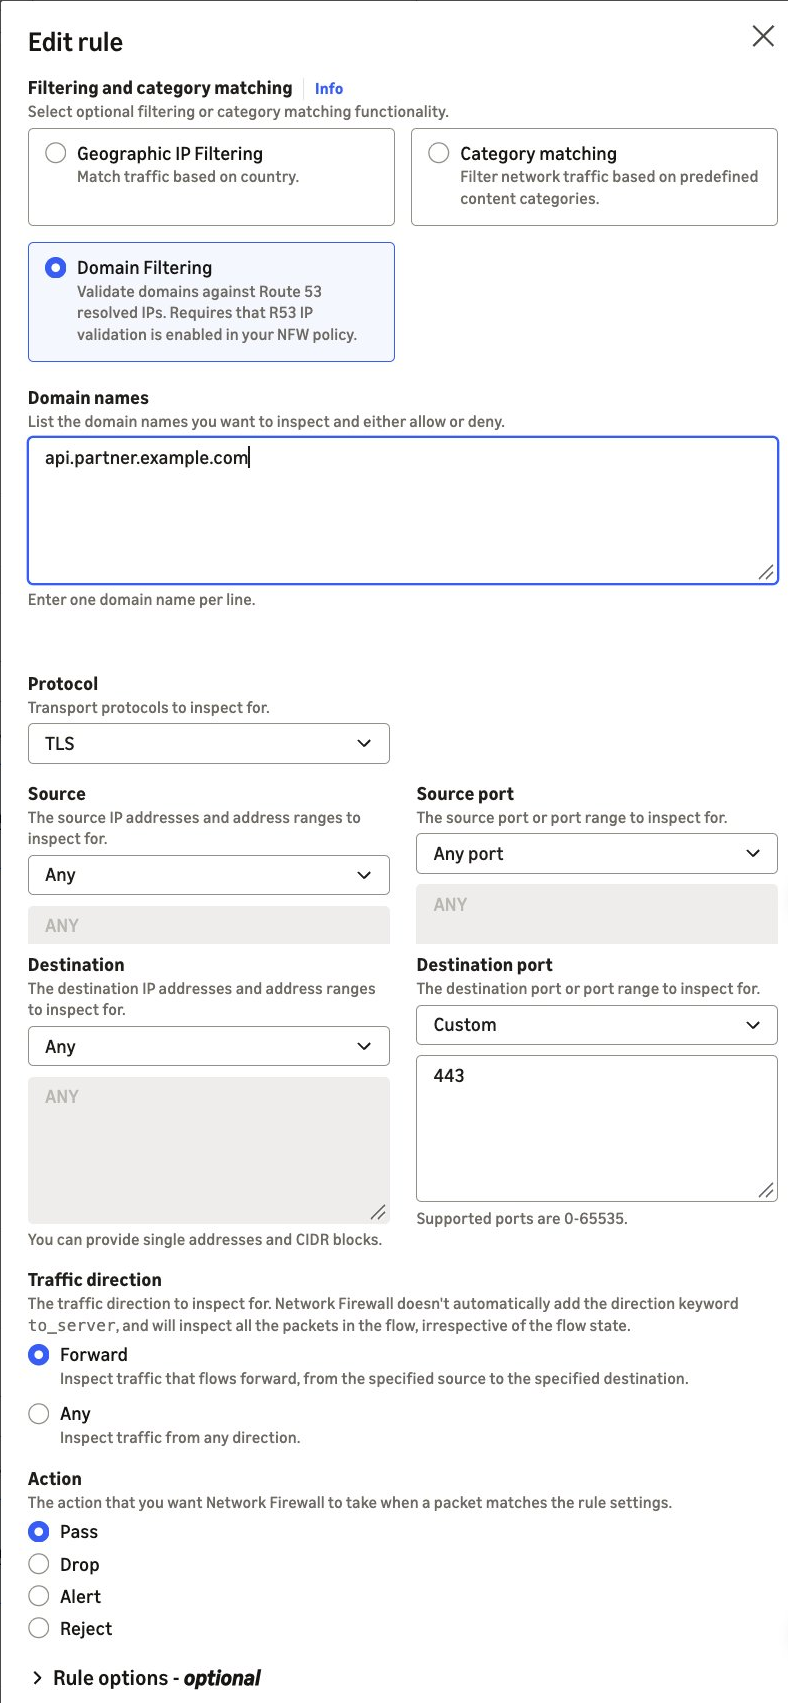
Figure 4. A pass rule for TLS on port 443, scoped to the partner’s domain name
If you manage rules as code, the equivalent Suricata rule is:
The pass rule matches the destination address, not the name in the TLS request. TLS traffic on port 443 passes only when Route 53 Resolver returned the destination address for api.partner.example.com. If the partner’s addresses also serve other domain names, such as behind a content delivery network (CDN), those names pass too. To also require the partner’s name in the TLS request, add an exact SNI match to the same rule: tls.sni; content:"api.partner.example.com"; startswith; endswith; nocase;.
Without startswith and endswith, the content match accepts any SNI that contains the name.
A connection that presents the partner’s name but goes to another address doesn’t match the pass rule. If Route 53 Resolver never returned that address, the policy setting’s enforcement action blocks the connection before your rules run. In alert mode, the policy setting lets the connection through to your rules instead, and the stateful default action drops it because the pass rule doesn’t match. Its alert log record shows route53_resolved_ip as false, as in the second example previously. If Route 53 Resolver returned the address for a different domain name, the connection passes the policy check. The stateful default action then drops it because the pass rule doesn’t match, and that record shows route53_resolved_ip as true.
We recommend that you follow these best practices:
dns.google, that resolver’s addresses pass the check.route53_resolved_ip: false) and in the DnsUnresolvedFlows metric, not in your alert logs. Pass rules without the alert; keyword don’t write an alert log record.Route 53 Resolved IP Validation is available today in all commercial AWS Regions (Regions other than the AWS GovCloud (US) Regions and the China Regions) where AWS Network Firewall and Amazon Route 53 Resolver DNS Firewall are available, at no additional charge. For the list of Regions, see AWS Capabilities by Region. A DNS Firewall rule group with no rules doesn’t incur DNS Firewall charges. Standard DNS Firewall pricing applies after you add rules. See AWS Network Firewall pricing and Amazon Route 53 pricing.
In this post, we showed you how Route 53 Resolved IP Validation works and how to turn it on in alert mode. Network Firewall now checks each connection’s destination against the IP addresses that Amazon Route 53 Resolver returned for the DNS query. Filtering SFTP, SSH, database, and other non-web traffic by domain name and preventing SNI spoofing without TLS inspection are two common examples of what that makes possible. To get started, turn the feature on in alert mode and review the results before you enforce. For the full walkthrough, see Getting started with resolved IP validation.
To learn more, visit the AWS Network Firewall product page and the feature documentation.
If you have questions about this post, contact AWS Support.
Post Syndicated from Kevin Fallis original https://aws.amazon.com/blogs/big-data/introducing-the-next-generation-of-serverless-time-series-for-amazon-opensearch-service/
Today, we’re announcing support for time series collections on the next generation of Amazon OpenSearch Serverless. With time series collections, you can ingest, store, and analyze logs, metrics, traces, and event data without provisioning or managing clusters. Time series collections absorb ingest spikes automatically, keep recent data fast to query, and make months or years of history searchable at low cost, all in the same collection. Time series collections also bring alerting and anomaly detection to OpenSearch Serverless, so you can find and act on problems as they happen. With support for up to 100 TB of hot storage per collection, they’re built for high-scale observability workloads such as application monitoring, security analytics, and IoT telemetry.
Observability data is voluminous, and it surges sharply during events like bad deployments and outages, right when teams need answers fastest. An undersized cluster falls behind and delays the very logs engineers are waiting for, so teams size for the worst day and pay for that capacity every other day. Hot storage gets expensive as history grows, so teams cut retention or move older data to snapshots that someone must restore before running a query. Clusters also need constant tuning and capacity planning, which pulls engineers away from the investigations the data is meant to support. Every decision becomes a tradeoff between cost, retention, and how quickly you can answer questions about your systems.
Time series collections on OpenSearch Serverless remove that tradeoff. When an incident drives a surge in log volume, compute scales in seconds to keep up, so the logs engineers are waiting for arrive on time. When traffic settles, compute scales back down, all the way to zero, so you stop paying for worst-day capacity. Older data moves to a lower-cost warm tier and stays queryable, so you can keep years of history without cutting retention or restoring snapshots. There are no clusters to size or tune. You set compute limits and a few index settings, and the service handles the rest.
Most queries against time series data target the last few hours or days, while older data is less frequently queried but still needs to be available. With the new index.warm.after setting, you decide how long data stays in the hot tier before it moves to the lower-cost warm tier. You can set it in days or hours, from a minimum of 1 day (24h or 1d) up to 10 years (3650d), and it can’t exceed the index’s retention period. If you don’t set it, data moves to warm after 1 day.
At ingest, each document is written to a low-latency hot tier and to Amazon Simple Storage Service (Amazon S3). As data reaches the age you set, oldest first, the hot copy is released and the data lives in the warm tier on Amazon S3. When a query needs warm data, the service loads that data back into the hot tier to serve it. The first query on that data takes longer, and later queries on the same data run at hot-tier latency. That suits investigations and reporting over older data, where the same time range is often queried repeatedly. When a query spans both tiers, results come back in a single response. You pay hot storage rates only for data in the hot tier.
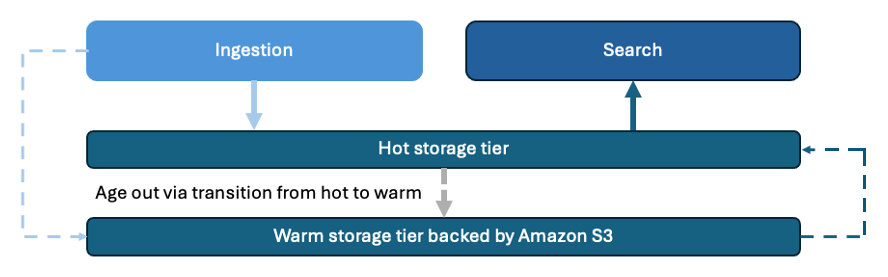
Figure 1: Data moves from the hot tier to the warm tier after 7 days, persisted to Amazon S3 throughout
Retention is set on the index itself, so there is no separate lifecycle policy to create or maintain. Set index.data.retention in an index template, and every index that matches the pattern inherits it. You can retain data for anywhere from 1 day to 3,650 days (10 years), specified as a whole number of days.
Tiering and retention are independent. Tiering controls query speed and cost, and retention controls when data is deleted. For example, you can keep application logs hot for 7 days and retain them for 30 days, or keep audit data in the warm tier for years to meet compliance requirements. When an audit comes up, you query that history in the same collection, and search compute scales up to handle the extra load. There is no snapshot restore and no forensic cluster to stand up.
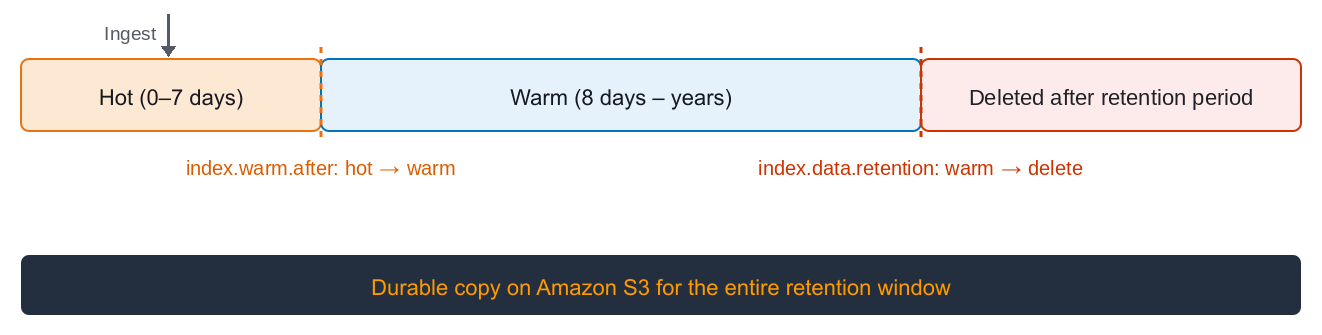
Figure 2: Data tiering and retention
Every document in a time series collection must now include a timestamp field. Each index has one designated time field that the service uses to organize and sort your data, and documents with a missing, null, or invalid timestamp are rejected.
By default, the time field is @timestamp. If your events already carry a different field, such as event_time, set index.timestamp_field when you create the index or in an index template, so you don’t need to change your producers. The field must be a top-level date field, and a document’s timestamp can’t be changed after it is indexed.
Rejections apply to individual documents, not whole requests. In a _bulk request, the valid documents are indexed and the rejected ones are listed in the errors block of the response, so one bad record doesn’t fail the batch.
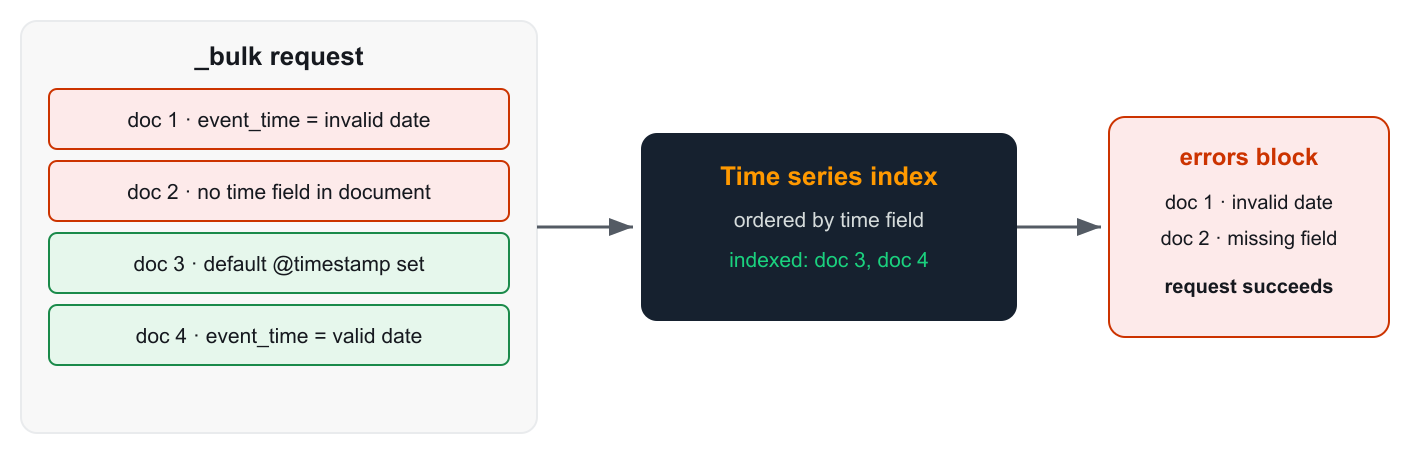
Figure 3: How the time field determines whether each document is indexed or rejected
Time series collections now support alerting and anomaly detection, which Classic serverless collections didn’t offer. Instead of relying on a separate system to tell you when something breaks, you can monitor, detect, and notify from the collection that stores your data. Now, operations teams can get notified when error rates or latency spike, security teams can catch a burst of failed logins, and business teams can spot a sudden drop in orders.
Alerting monitors query your data on a schedule and notify you through the channel you choose when a condition is met. Per-query monitors alert on a single value, such as average latency crossing a threshold. Per-bucket monitors evaluate each group separately, such as every host whose error rate climbs too high. PPL monitors handle more complex logic in Piped Processing Language (PPL).
Anomaly detection uses the Random Cut Forest (RCF) machine learning algorithm to learn your data’s normal pattern and flag deviations in near real time, with no fixed thresholds to guess. Point a monitor at the detector’s results to get notified the moment an anomaly appears.
You manage monitors and detectors in OpenSearch UI workspaces, where access follows the workspace’s collaborator permissions. Read-only collaborators can view monitors and alerts, while read/write and admin collaborators can also create, update, and acknowledge them. The Observability workspace puts alerts alongside dashboards and PPL queries, so your team can go from an alert to the events behind it, across serverless collections and existing Amazon OpenSearch Service domains.
For a single-click experience, use Express Create in the Amazon OpenSearch Service console. It sets up the collection group, encryption, network access, and data access for you. To control each step yourself, use the AWS Command Line Interface (AWS CLI) as shown in the following steps.
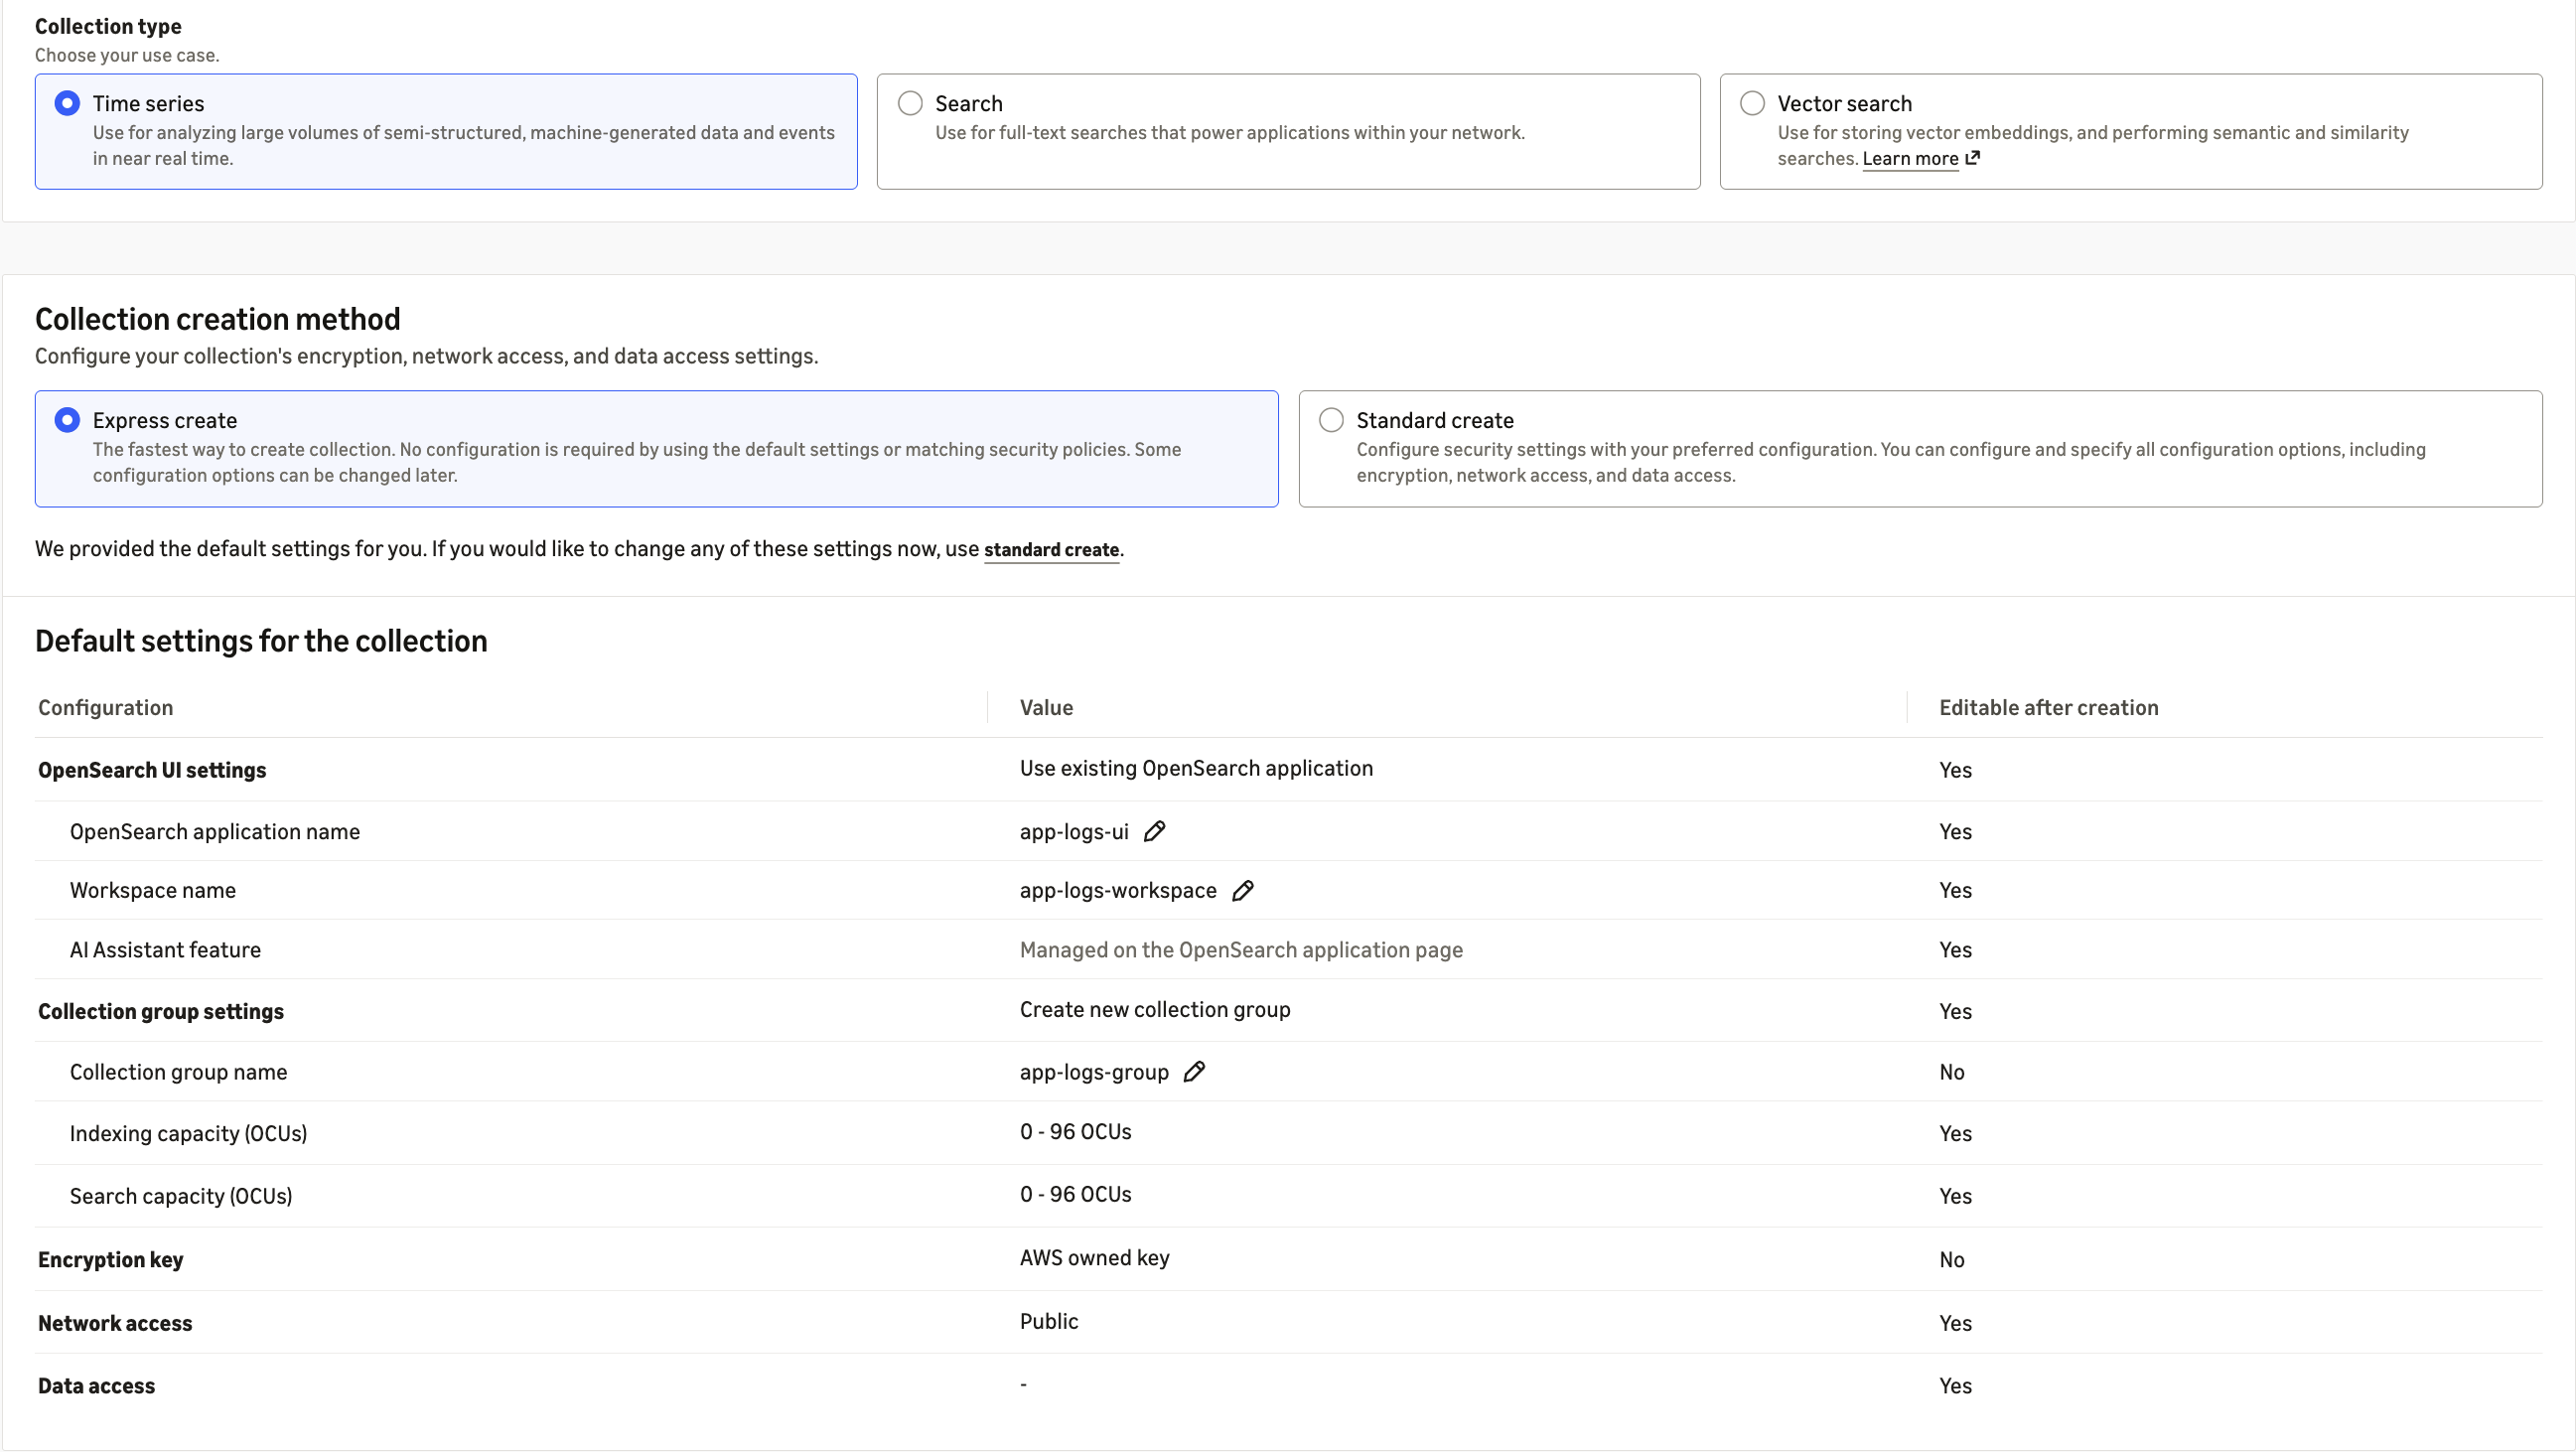
Figure 4: Express Create sets up the collection group, encryption, and network access with default settings
First, create a next-generation collection group. The collection group sets the compute limits that all of its collections share. A minimum of 0 OpenSearch Compute Units (OCUs) lets the group scale to zero when it’s idle, and the maximum caps your spend.
Next, create a network policy to control where the collection can be reached from, and a data access policy to control which AWS Identity and Access Management (IAM) principals can read and write data.
Then create the time series collection in the collection group:
After the collection is active, create an index template with the time field, tiering, and retention settings that fit your workload. Every index whose name matches the pattern picks up these settings automatically:
Finally, ingest your data into the collection, then open the Observability workspace in OpenSearch UI to build your first dashboards, monitors, and anomaly detectors.
Time series collections are available today in all AWS commercial Regions where the next generation of OpenSearch Serverless is available. You pay for the compute you use in OCUs, and for hot and warm storage in GB-month. For pricing details, visit the Amazon OpenSearch Service pricing page.
To learn more, visit the Amazon OpenSearch Serverless product page and the Amazon OpenSearch Serverless Developer Guide.
Give it a try in the Amazon OpenSearch Service console, and send feedback through AWS re:Post or your usual AWS Support contacts.
Post Syndicated from Aruna Govindaraju original https://aws.amazon.com/blogs/big-data/from-problem-to-fix-in-minutes-automating-search-relevance-tuning-with-the-amazon-opensearch-service-relevance-agent/
Automating search relevance tuning means going from “my NDCG score is low” to “here is a better search query” in minutes. The Amazon OpenSearch Service Search Relevance Agent accelerates search quality improvements. You describe the problem, and the agent investigates your behavioral data, runs sequenced evaluations, and generates an improved query validated against your search quality targets, all without leaving the UI.
In the previous post “Measuring and improving search quality with Amazon OpenSearch Service”, you learned how to capture behavioral signals with User Behavior Insights (UBI), run structured experiments with Search Relevance Workbench (SRW), and arrive at a real Normalized Discounted Cumulative Gain (NDCG) score. That gives you the diagnosis. Now comes the harder part: acting on it.
Improving search quality is a tedious, manual loop. A search engineer studies the dashboards, forms a hypothesis, rewrites the domain-specific language (DSL) query, creates a new configuration, runs an experiment, interprets the results, and, if the numbers hold, deploys the change. Then the catalog shifts, query patterns evolve, and the cycle starts over. Staying ahead of it is practically a full-time job.
The Search Relevance Agent, accessible through the Ask AI button in the OpenSearch UI application, automates this loop. You have a conversation. The agent does both: diagnose and fix.
Before diving into the demo, it’s worth being precise about what the agent is and isn’t. Search Relevance Agent is one of the agents supported in OpenSearch Agent Server. The OpenSearch Agent Server is a multi-agent orchestration platform where you can build specialized AI agents that work together within OpenSearch. The agent server is an orchestration server for OpenSearch Dashboards with context-aware routing and Model Context Protocol (MCP) integration.
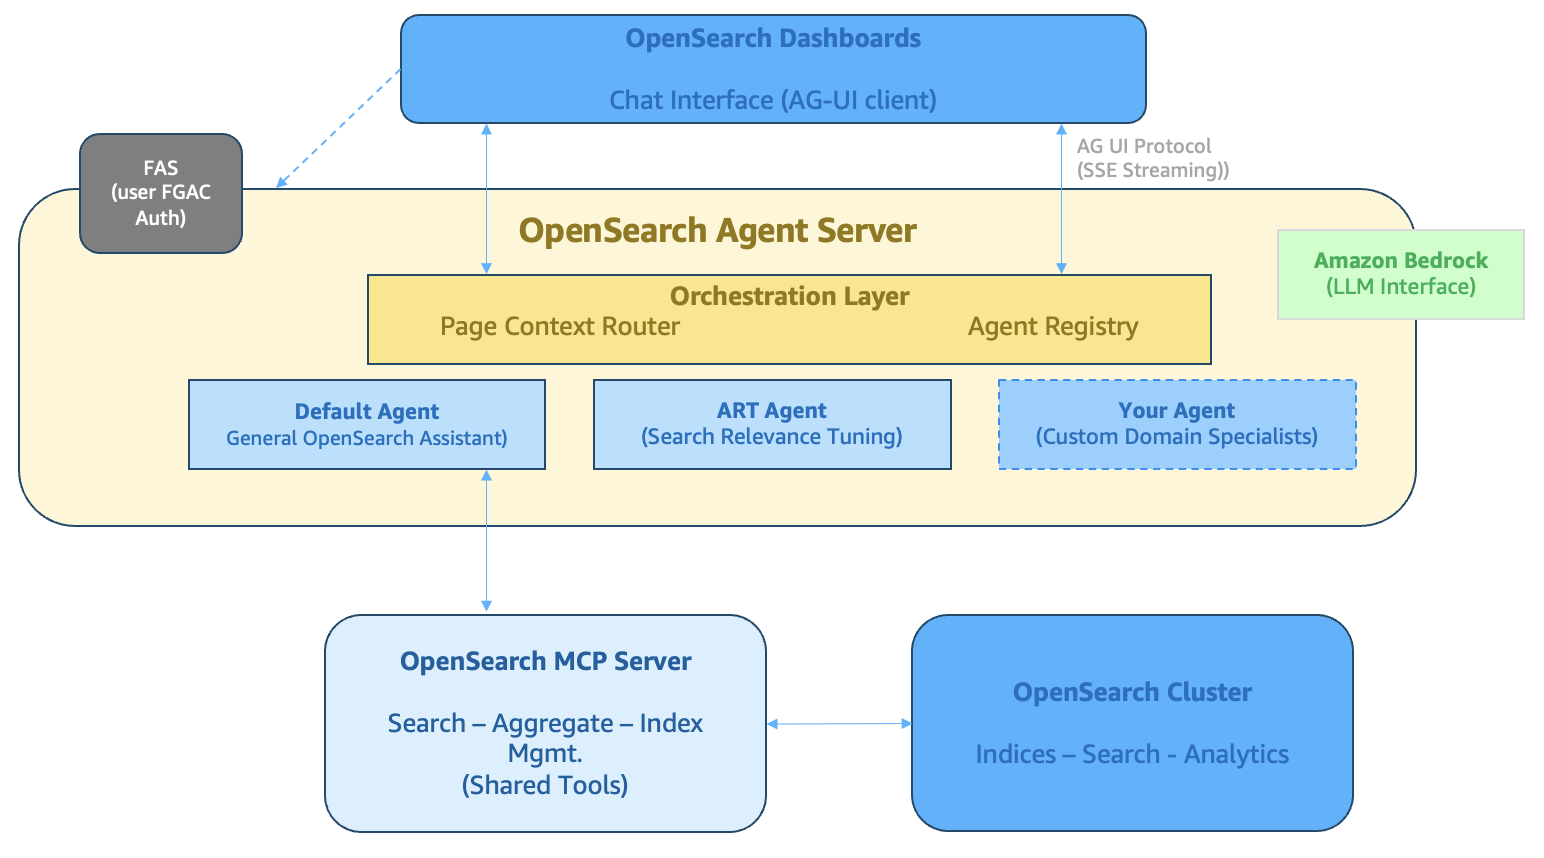
Figure 1: OpenSearch Agent Server
The Search Relevance Agent is a search relevance tuning tool. It analyzes your UBI search data, generates improved query configurations, and validates those improvements using offline SRW experiments. It operates at the level of query DSL, refining field weights, adjusting scoring strategies, and adding boost functions.
It isn’t an agentic search tool. It doesn’t rewrite user queries at runtime or intercept search requests. It configures the search system so that future searches perform better.
The distinction matters because it tells you what kind of problems it solves: systematic relevance issues that affect a category of queries, not one-off edge cases.
Under the hood, the Search Relevance Agent is powered by three skills of a single agent rather than separate sub-agents wired together as tools. The full loop, from spotting a problem to generating a hypothesis to evaluating it, runs in a single shared context with one tool stack. Nothing is lost when handing off between agents, and the behavior stays predictable.
When you send a message through Ask AI, you are talking to the OpenSearch Agent Server. Depending on what you are asking for, the agent applies one of three skills.
Every agent communicates with your OpenSearch cluster exclusively through the MCP Server, a standardized interface that gives agents access to your UBI data, search configurations, query sets, and experiments. Nothing happens without going through this secure layer.
OpenSearch UI uses the Agent-User Interaction Protocol (AG-UI) to connect AI agents to frontend applications, delivering real-time capabilities through standardized streaming and tool execution. The AG-UI protocol streams agent responses to OpenSearch Dashboards in real time, delivering results continuously rather than all at once.
The Agent Server receives the user’s authenticated identity from OpenSearch Dashboards, so every OpenSearch operation enforces user-level permissions rather than a service account’s, preserving access controls end to end.
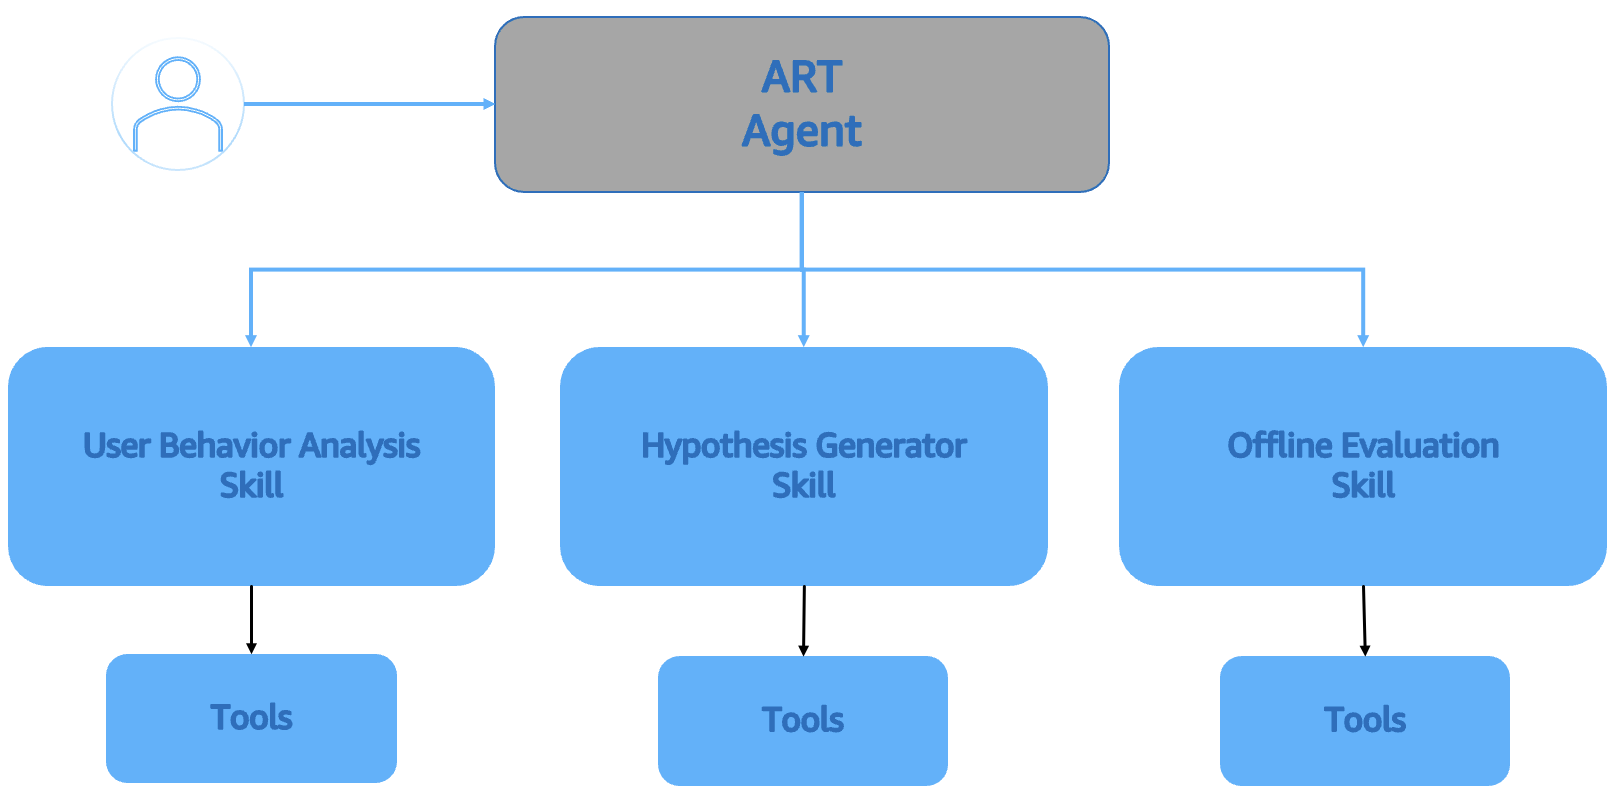
Figure 2: Auto relevancy tuning agent
To follow along, you need an OpenSearch Service domain running OpenSearch 3.5 or later with the OpenSearch UI application, and a search application you can instrument to emit behavioral records.
Here’s what the agent conversation looks like in practice, working through a real dataset. Figure 3 shows a complete walkthrough of using the agent.
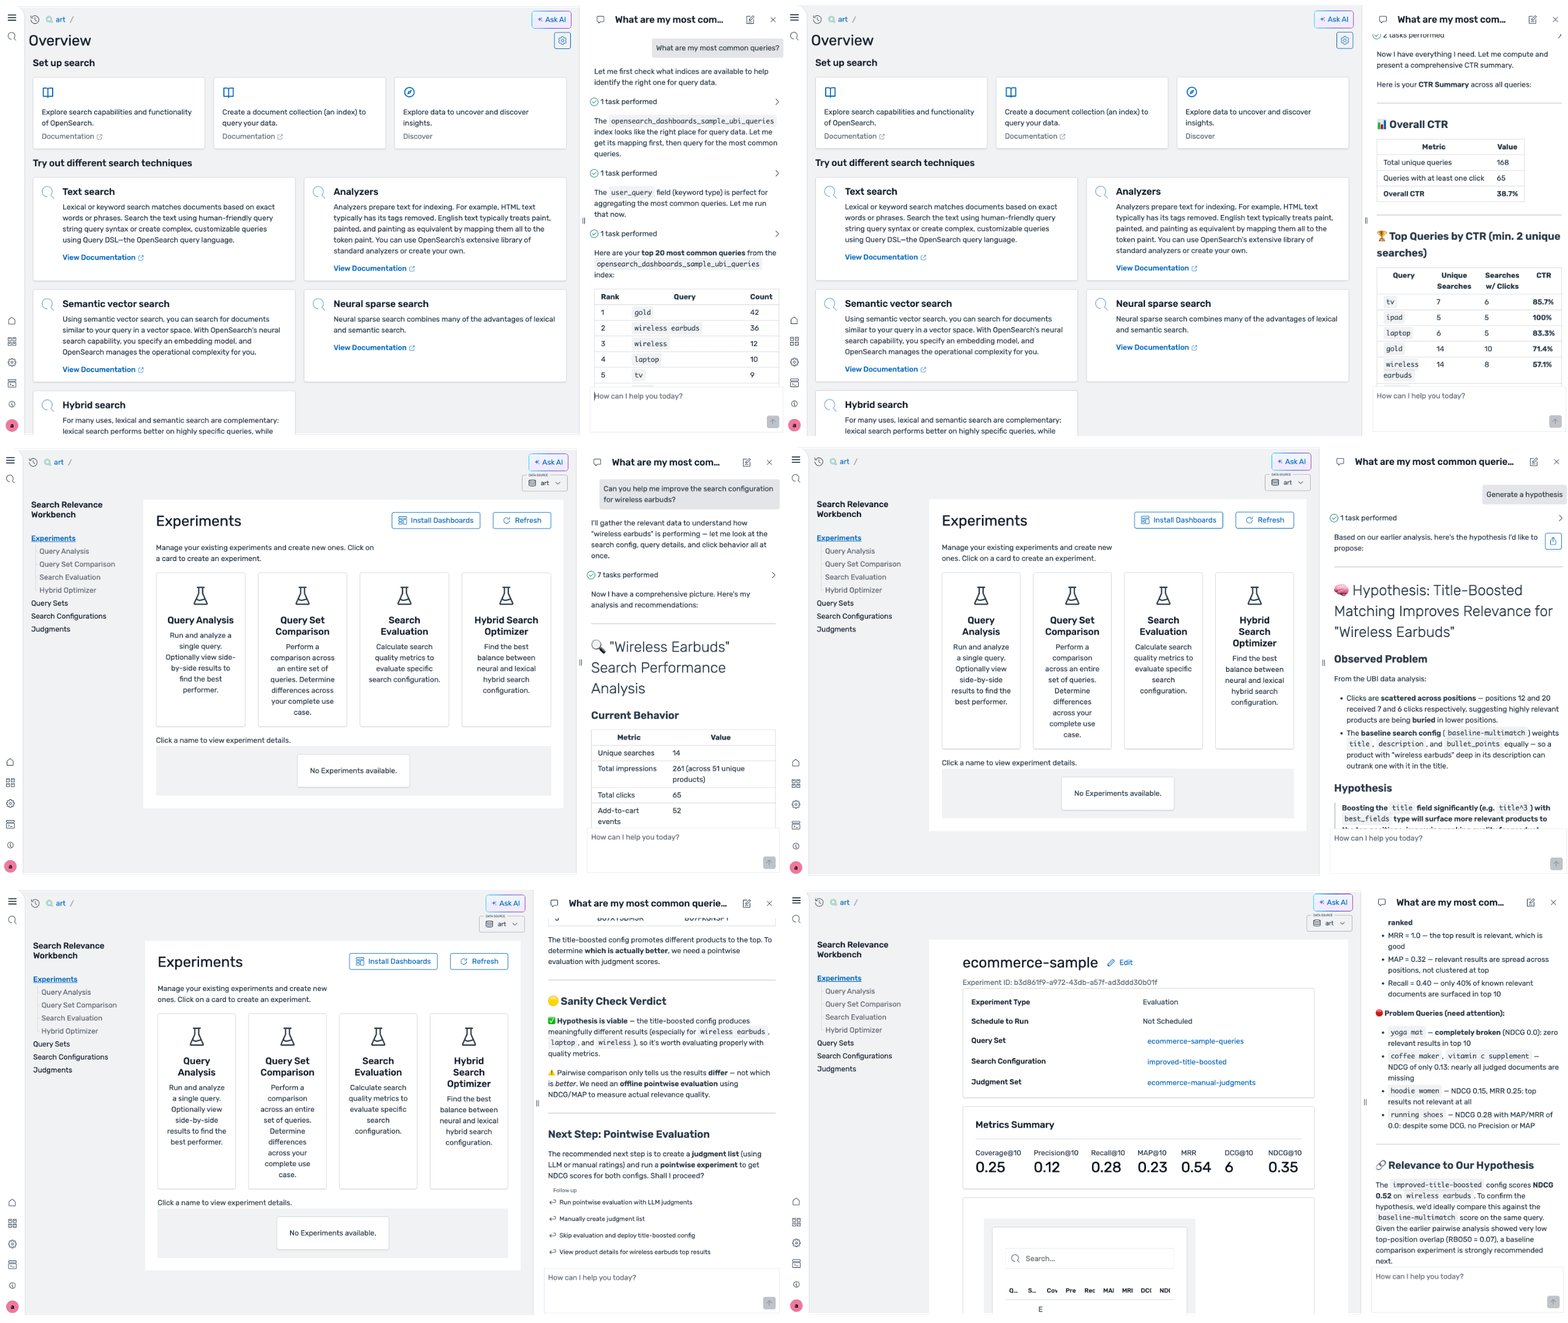
Figure 3: Search improvement example
You work in the search workspace within the OpenSearch UI application. After entering the search workspace, choose Ask AI in the upper right corner.
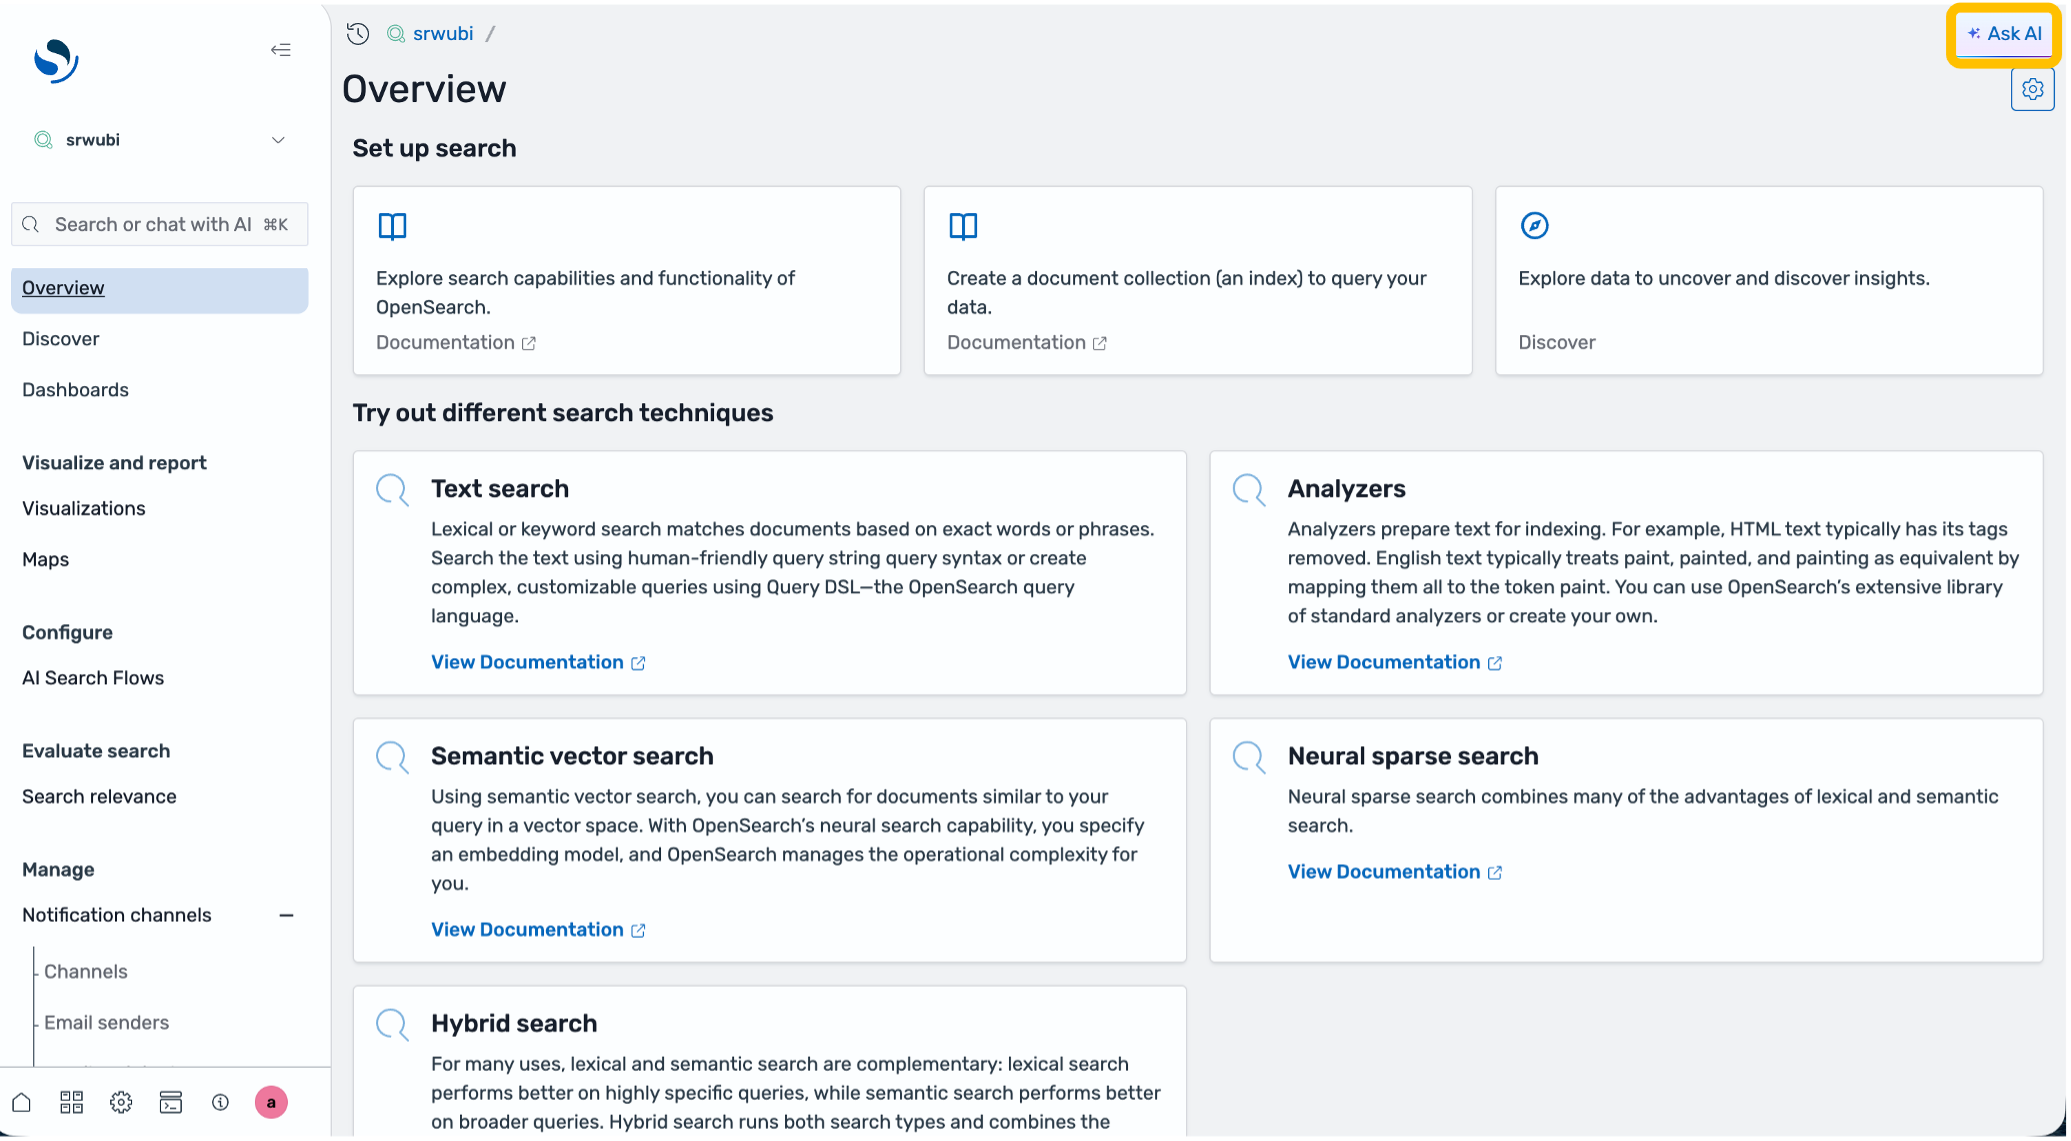
Figure 4: Search Workspace Overview page
The agent chat panel opens. You see a welcome message and suggested prompts to get started.
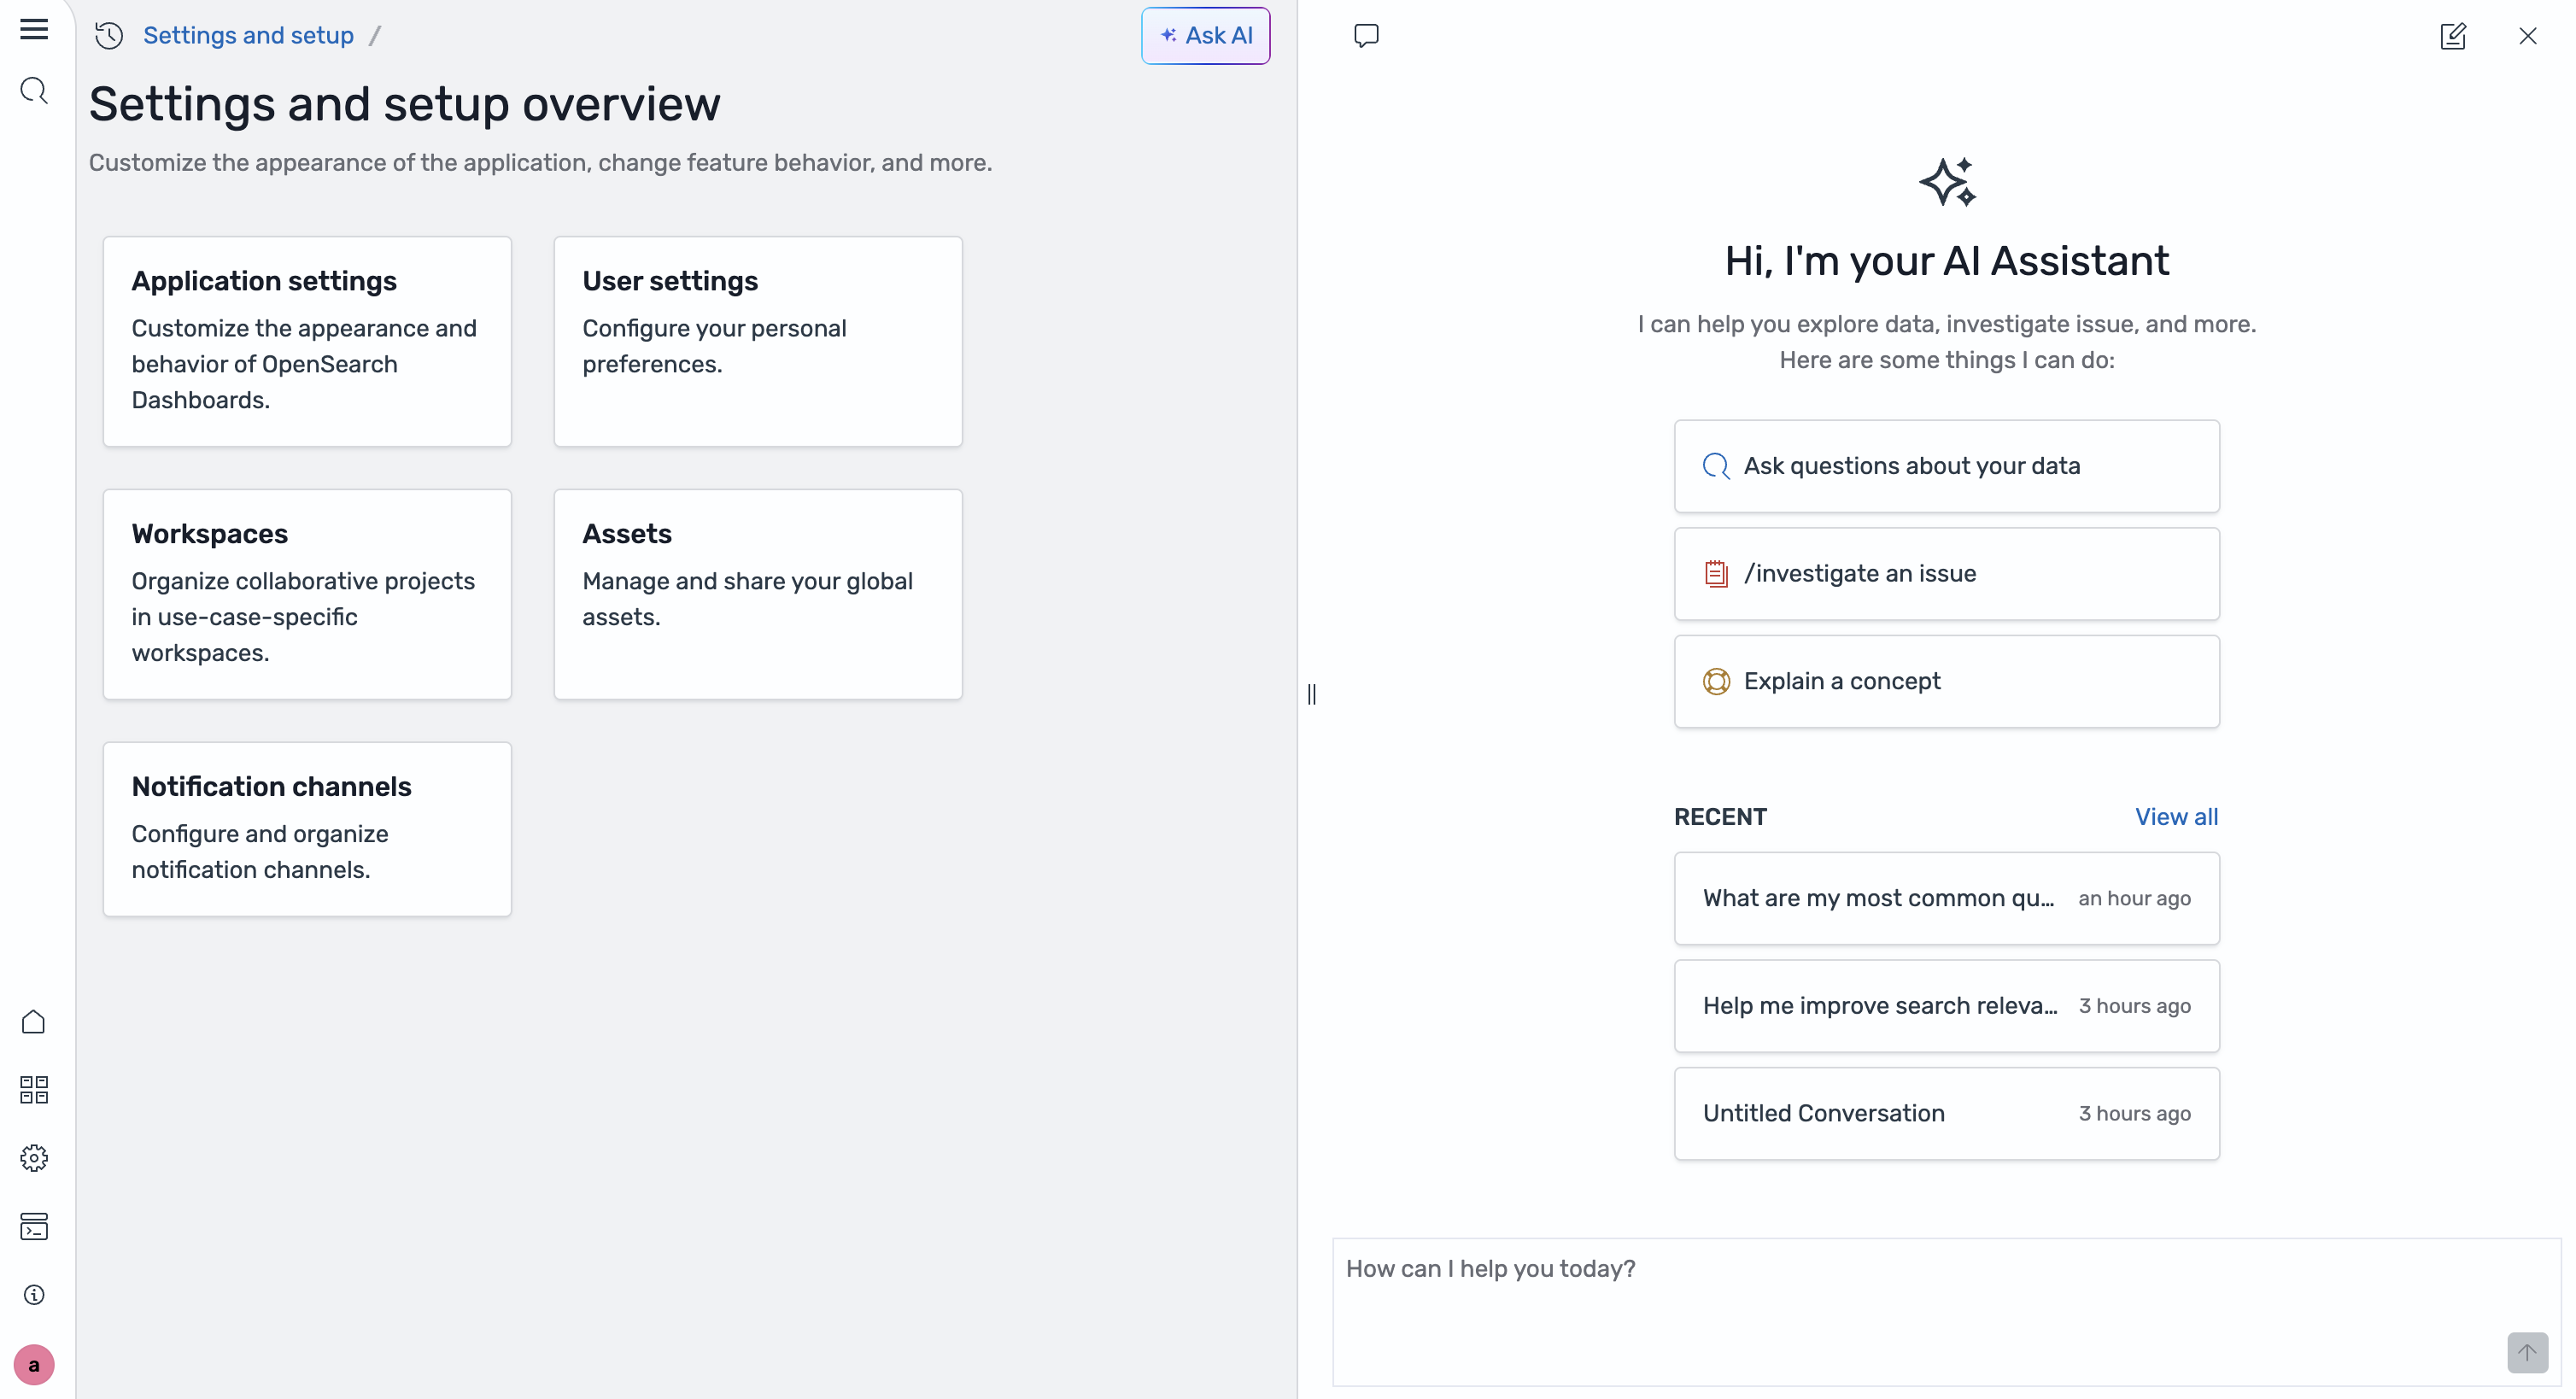
Figure 5: AI assistant chat panel
Start with a diagnostic question: “What are my most common queries?”. The User Behavior Analysis skill activates. You can watch its tool calls in real time as it queries your UBI indexes. In this example, the skill finds that there were 473 total queries across the product catalog. The top queries include gold and wireless earbuds, but across all those queries, there are only 11 total click events. The agent flags this immediately: a CTR that low is a signal that search isn’t working for users.
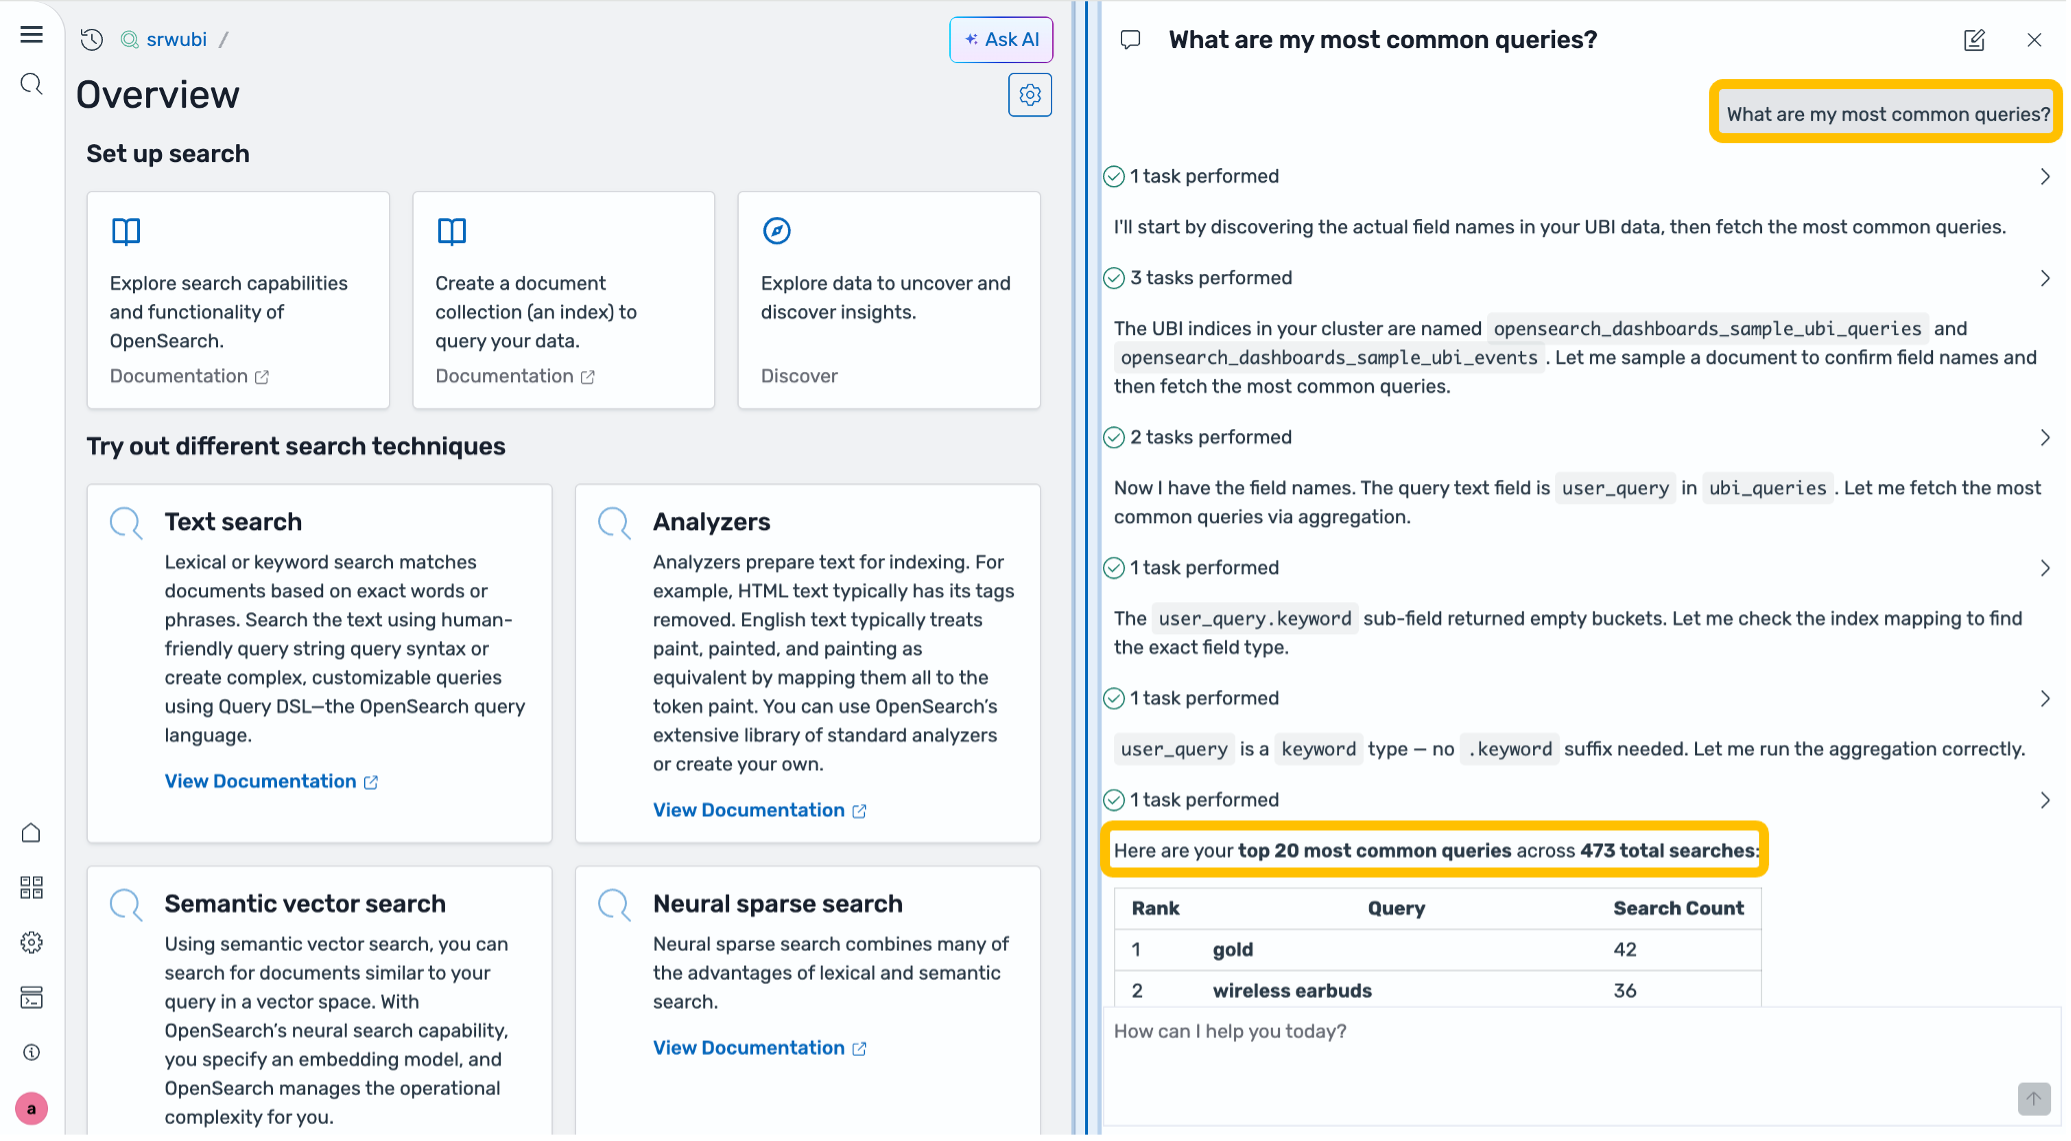
Figure 6: Viewing most used search queries
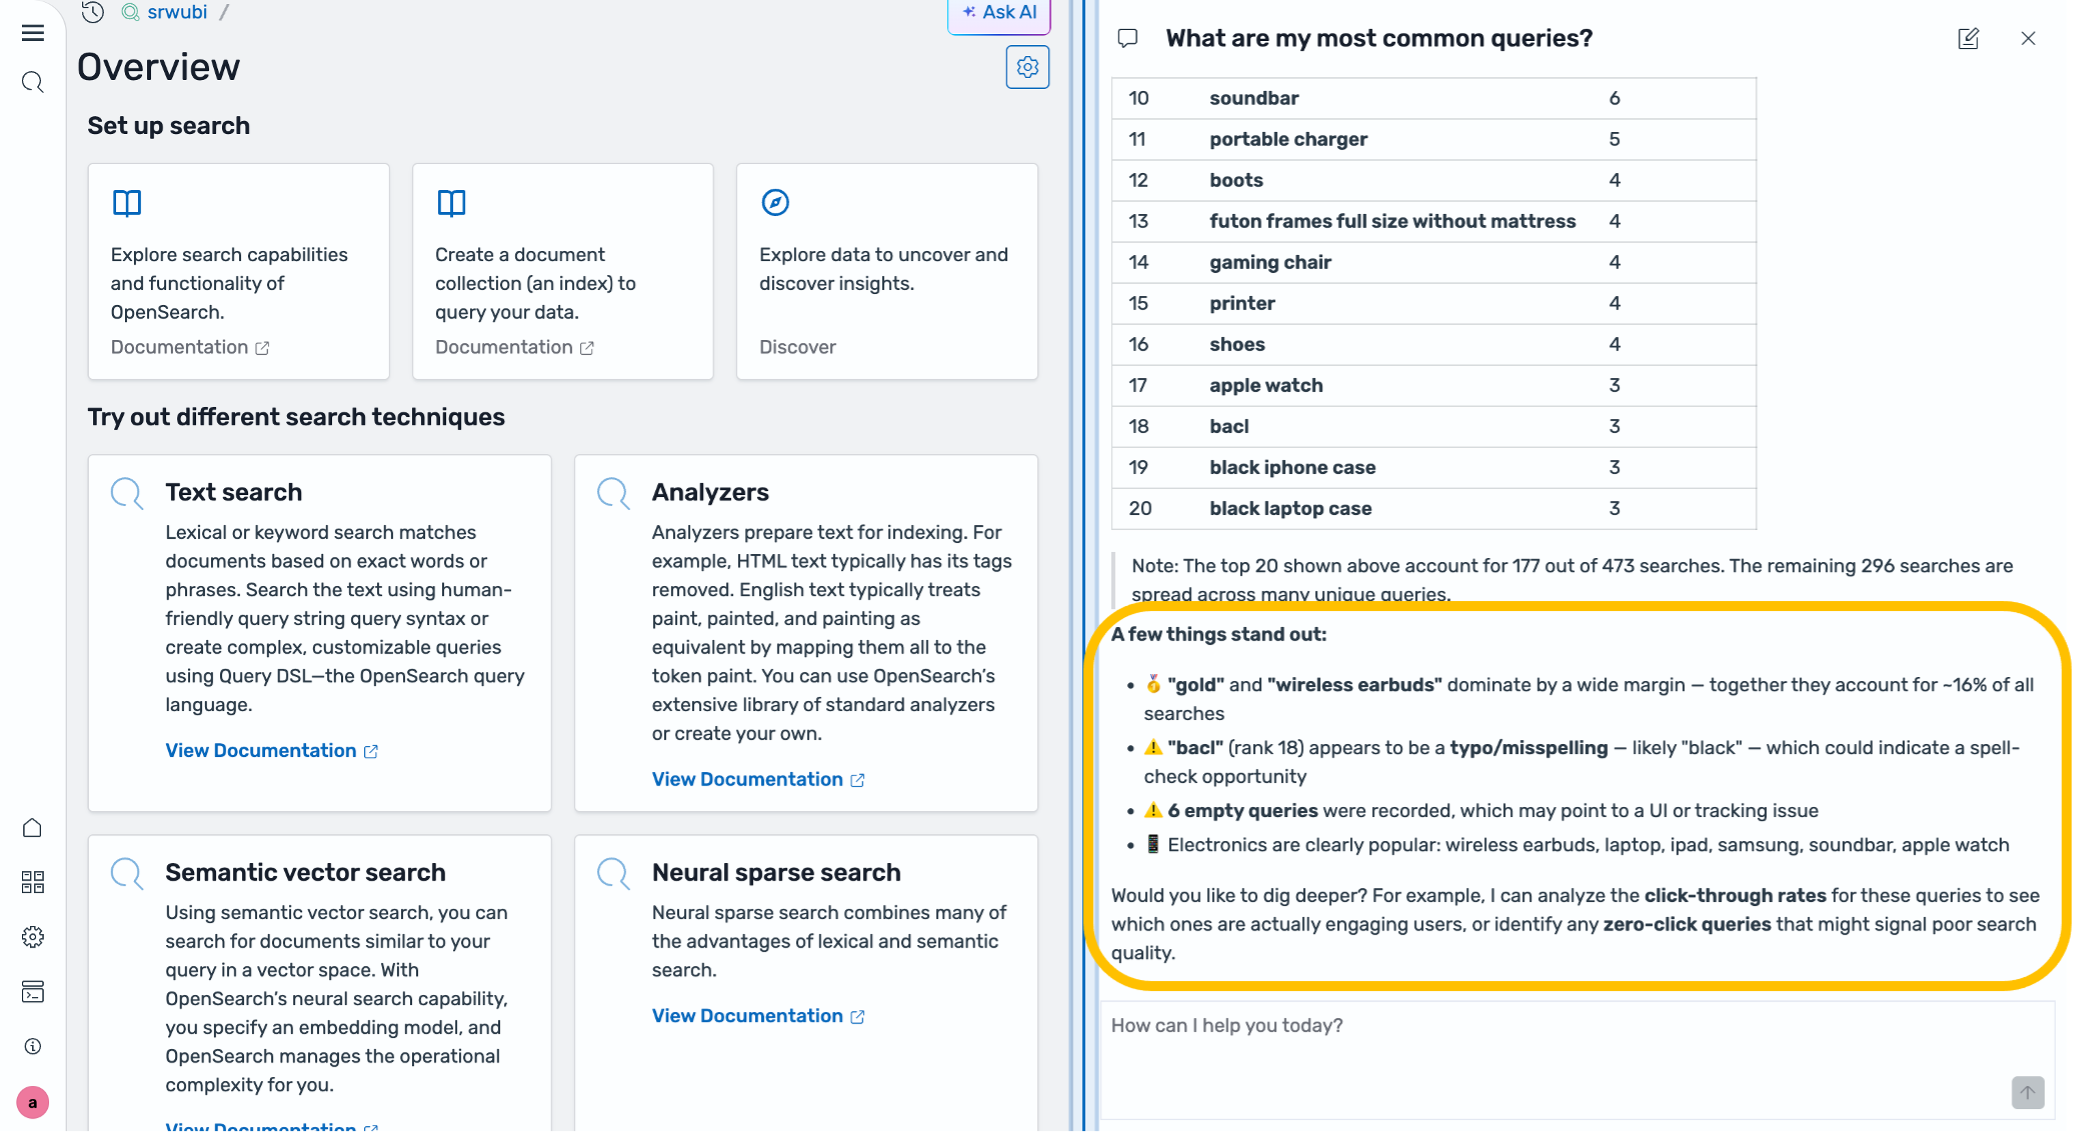
Figure 7: UBI initial findings
This is exactly what UBI is designed to surface. The skill found the pattern itself without a configured threshold.
After you’ve received the summary information, you can investigate a specific search query’s performance more deeply. Ask the AI “What is the click-through-rate for wireless earbuds?”. It returns that users searched for “wireless earbuds” 14 times and clicked 8 times, producing a 57.14 percent CTR. Over 40 percent of searches have no clicks. This is a good opportunity to improve search performance.
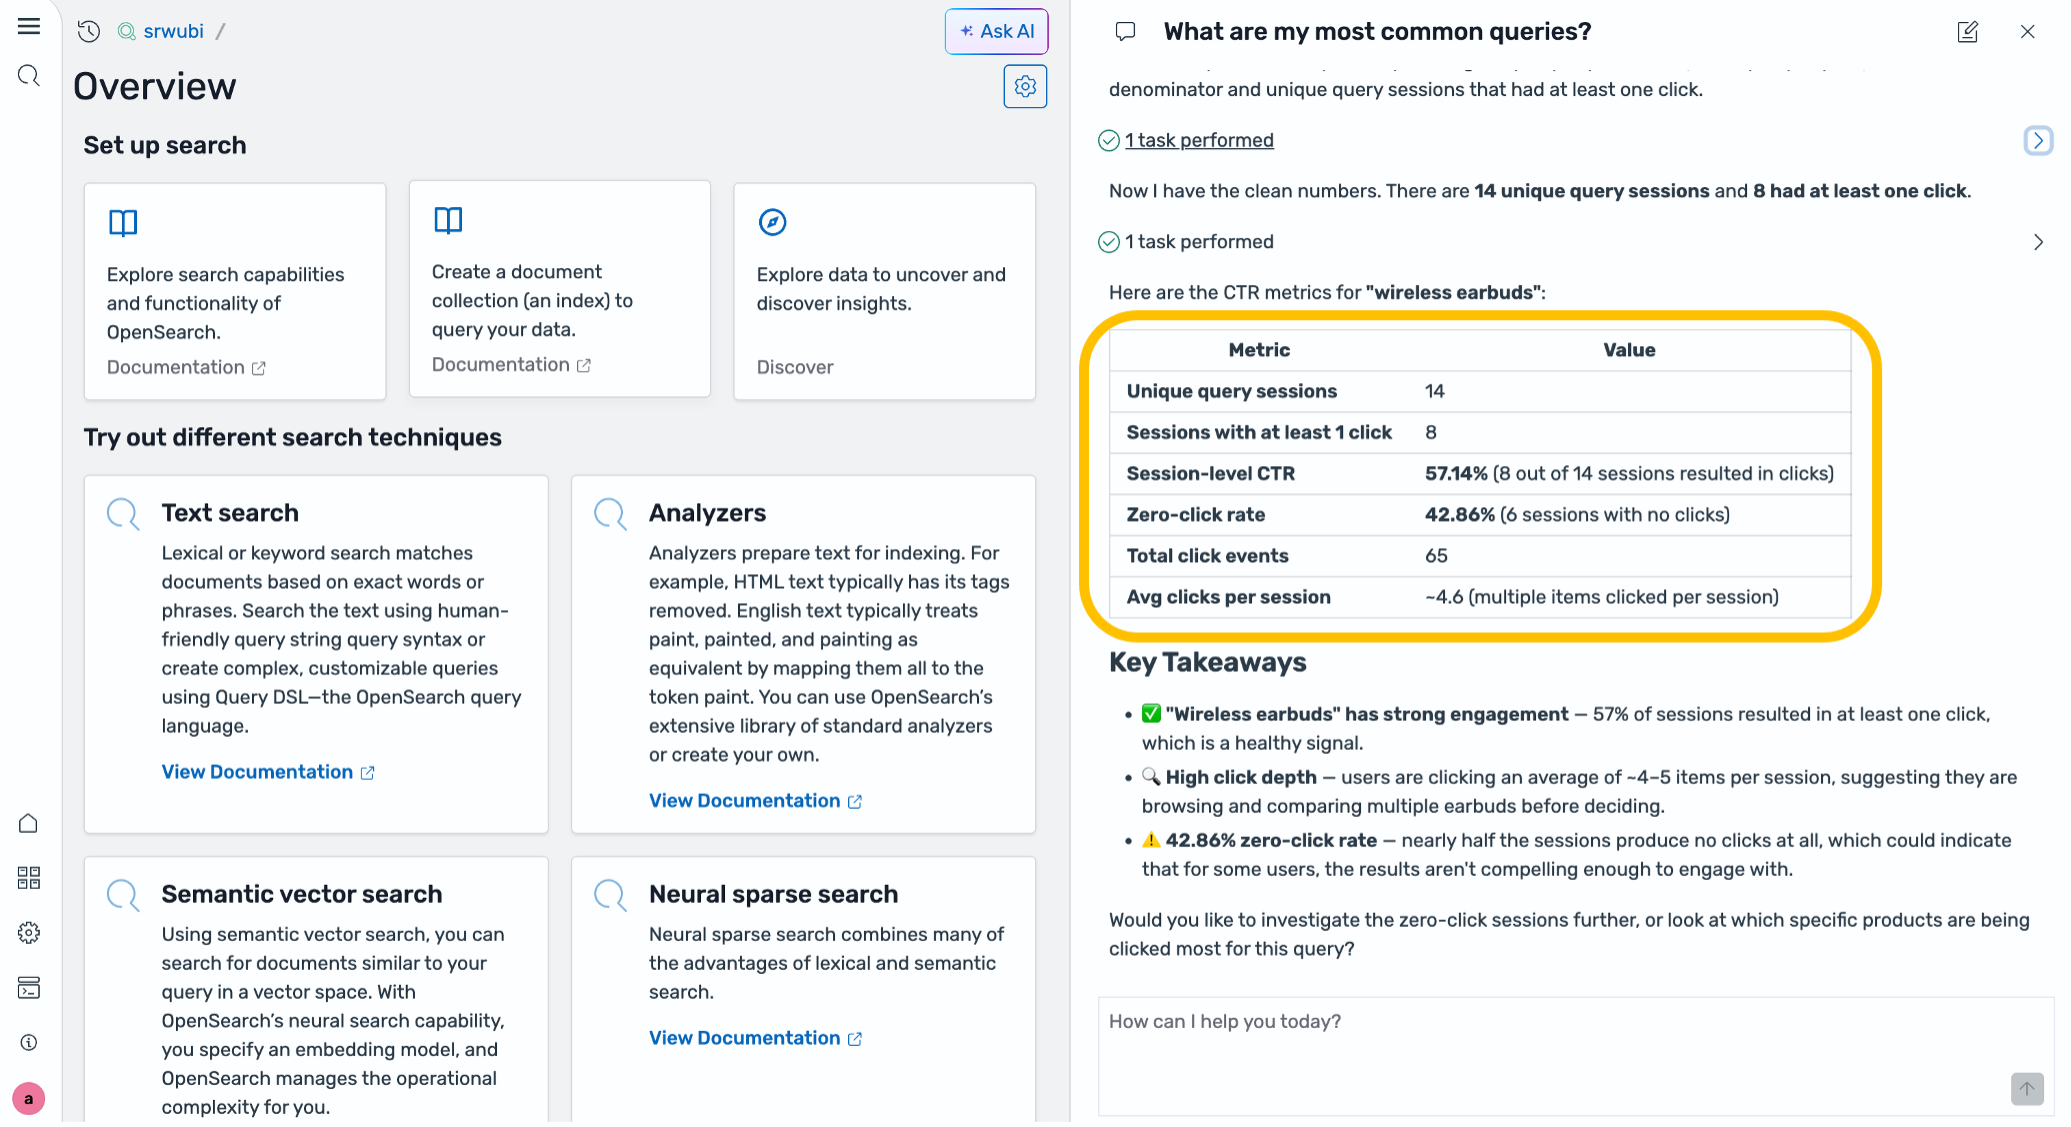
Figure 8: AI response for click-through-rate of wireless earbuds
The next step is to review the current search configuration. Ask the AI “What is my current search configuration?” The agent retrieves the current configuration and presents it for review.
Next is to figure out how to improve the search configuration. Ask the agent: “Can you help me improve the search configuration for wireless earbuds?”. The agent initiates an investigation of the search configuration performance and how it can be improved.
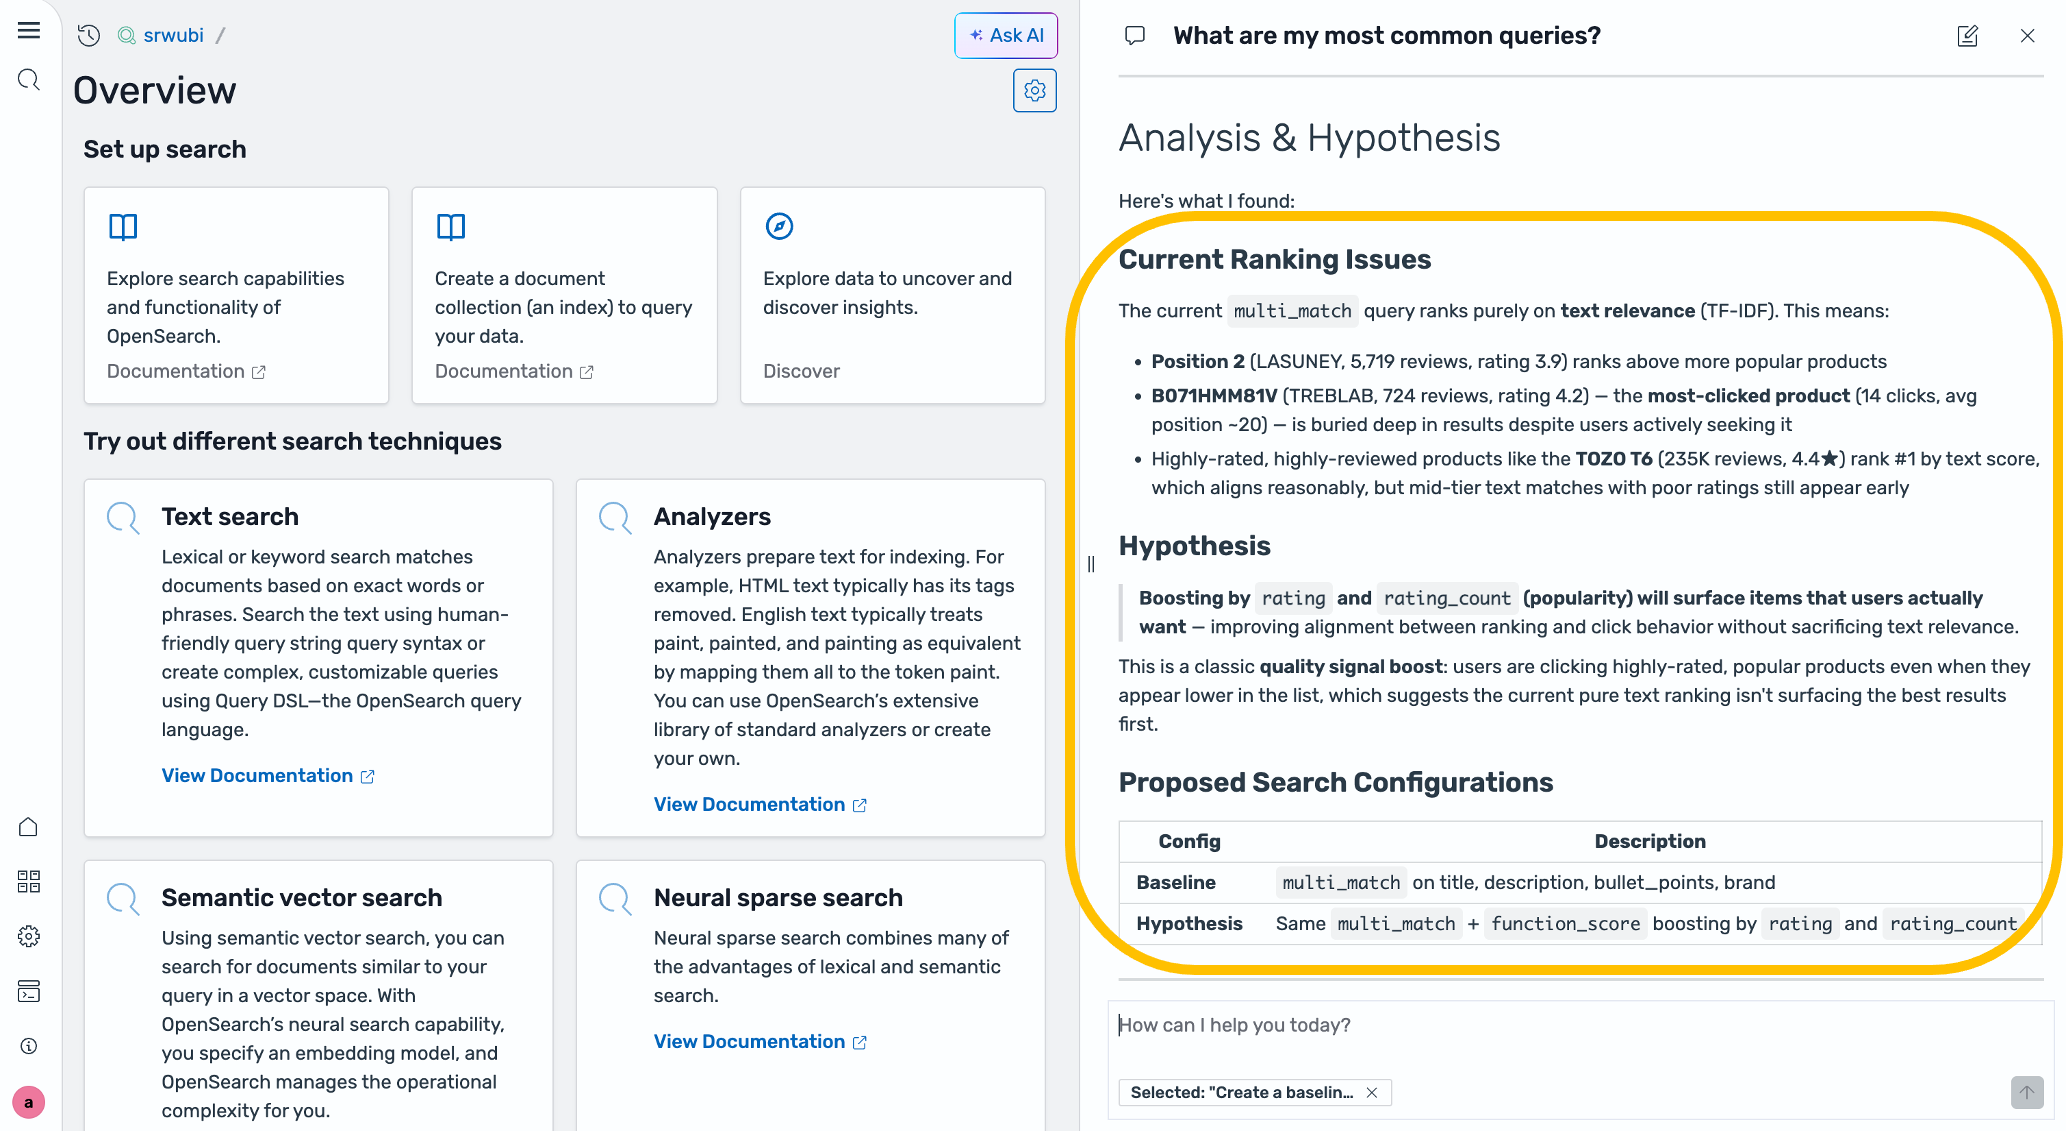
Figure 9: Investigation details
You can then ask the AI to generate a hypothesis. The Hypothesis Generator skill develops a hypothesis based on the investigation and provides supporting findings.
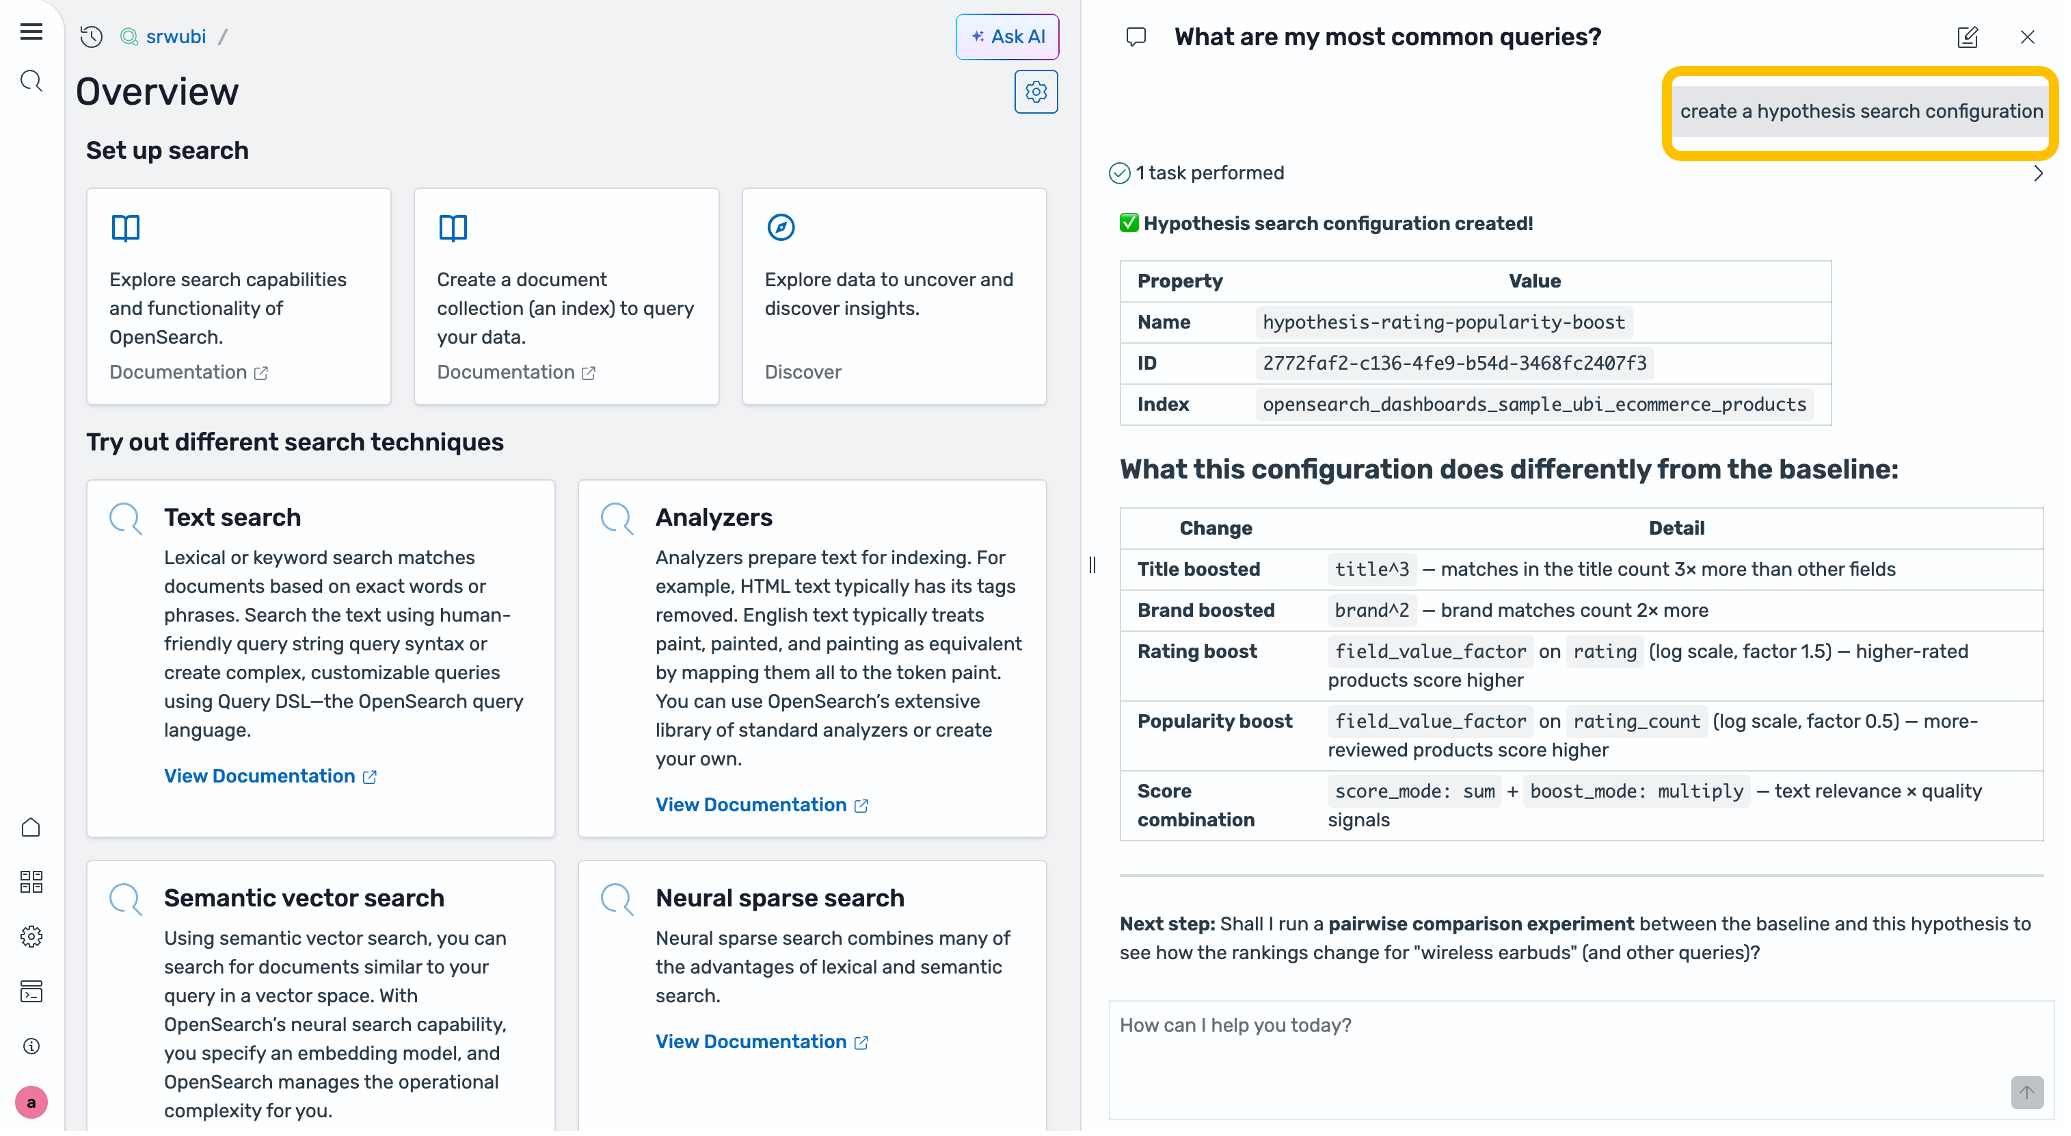
Figure 10: Hypothesis
Ask “What are the root causes?”. The skill presents root causes, justification, and a new hypothesis for your review. In this example the root causes returned were:
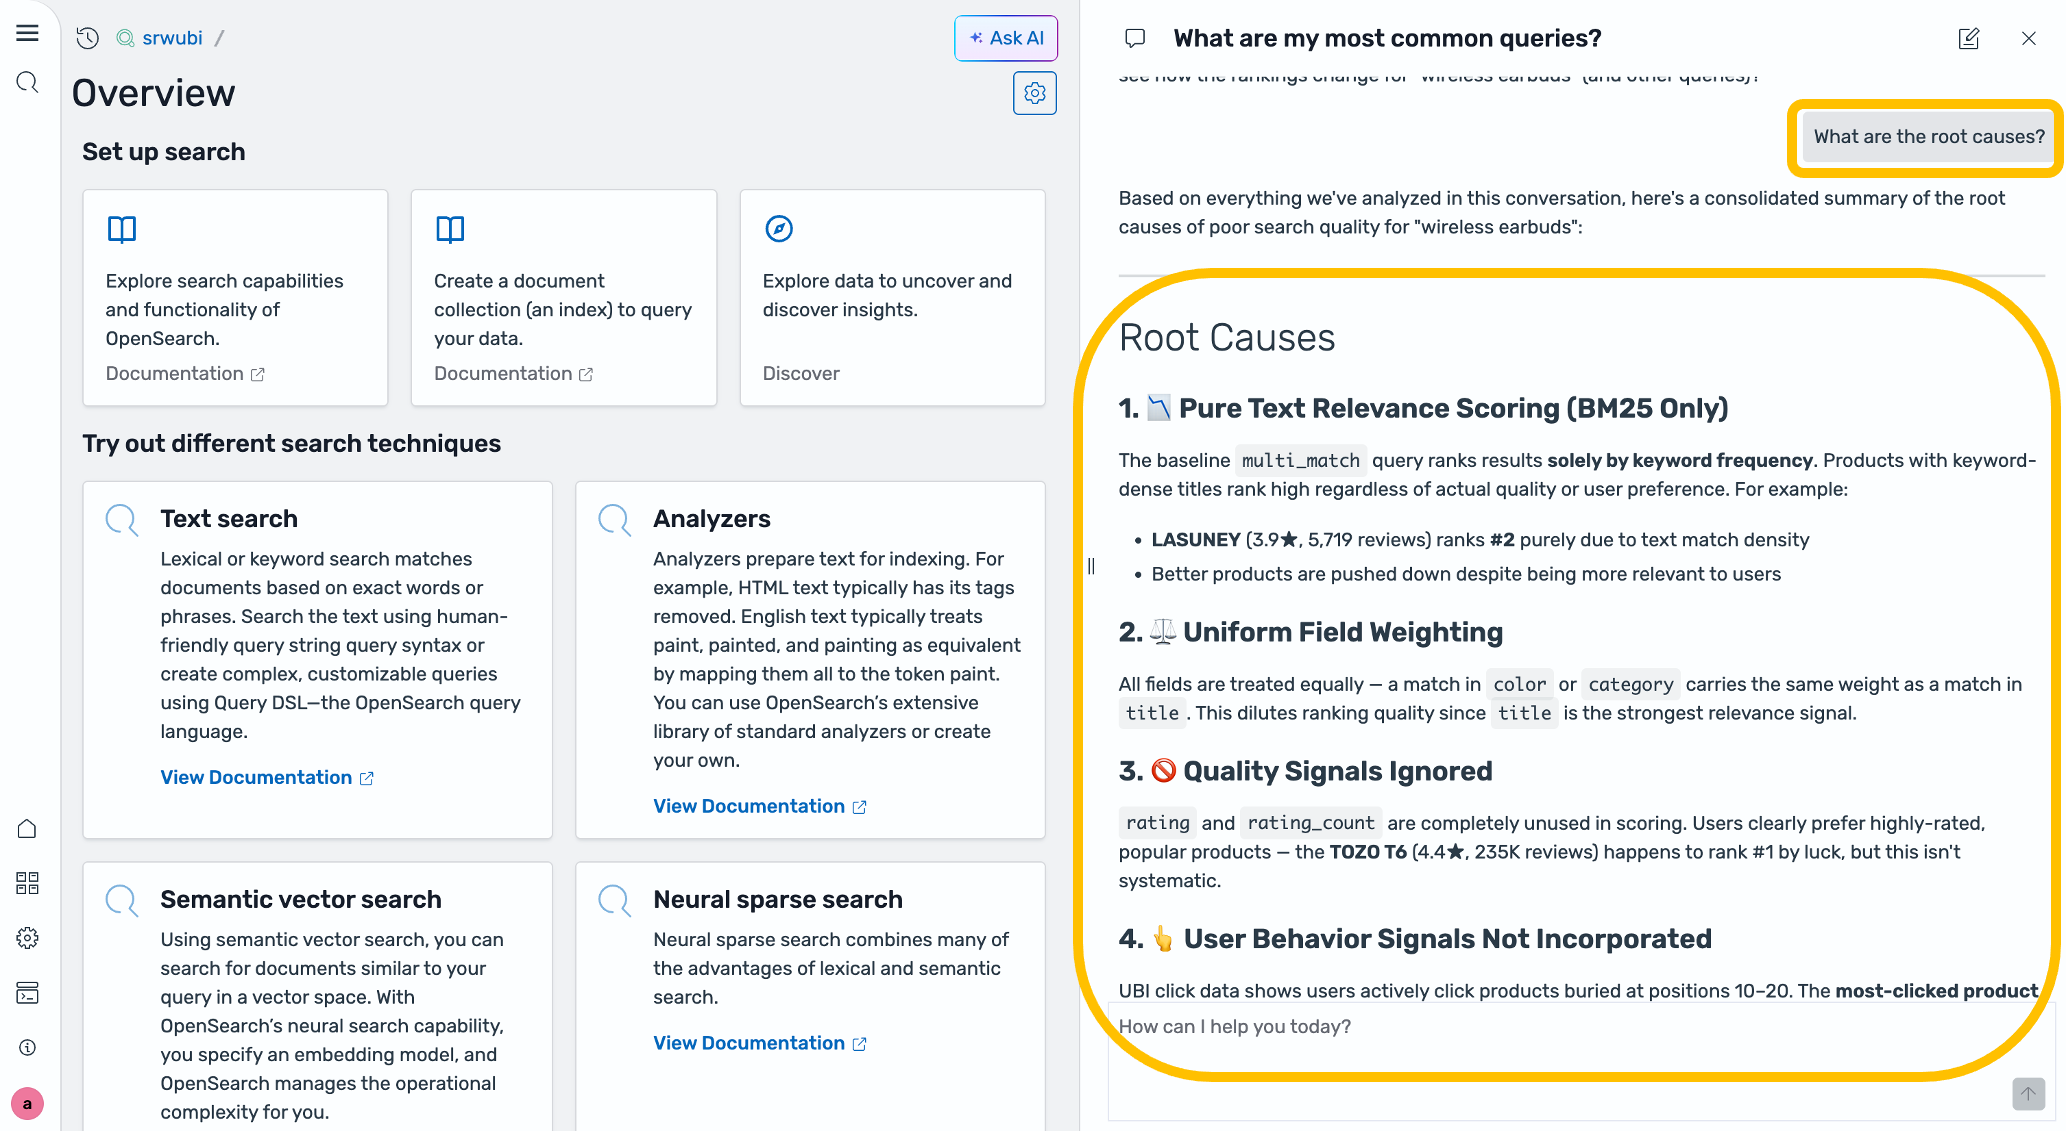
Figure 11: Root causes
The Evaluator skill creates all the necessary SRW artifacts and runs a Search Quality Evaluation comparing the baseline and the hypothesis. Ask “Validate with an offline evaluation”, and the evaluation report appears in the chat:
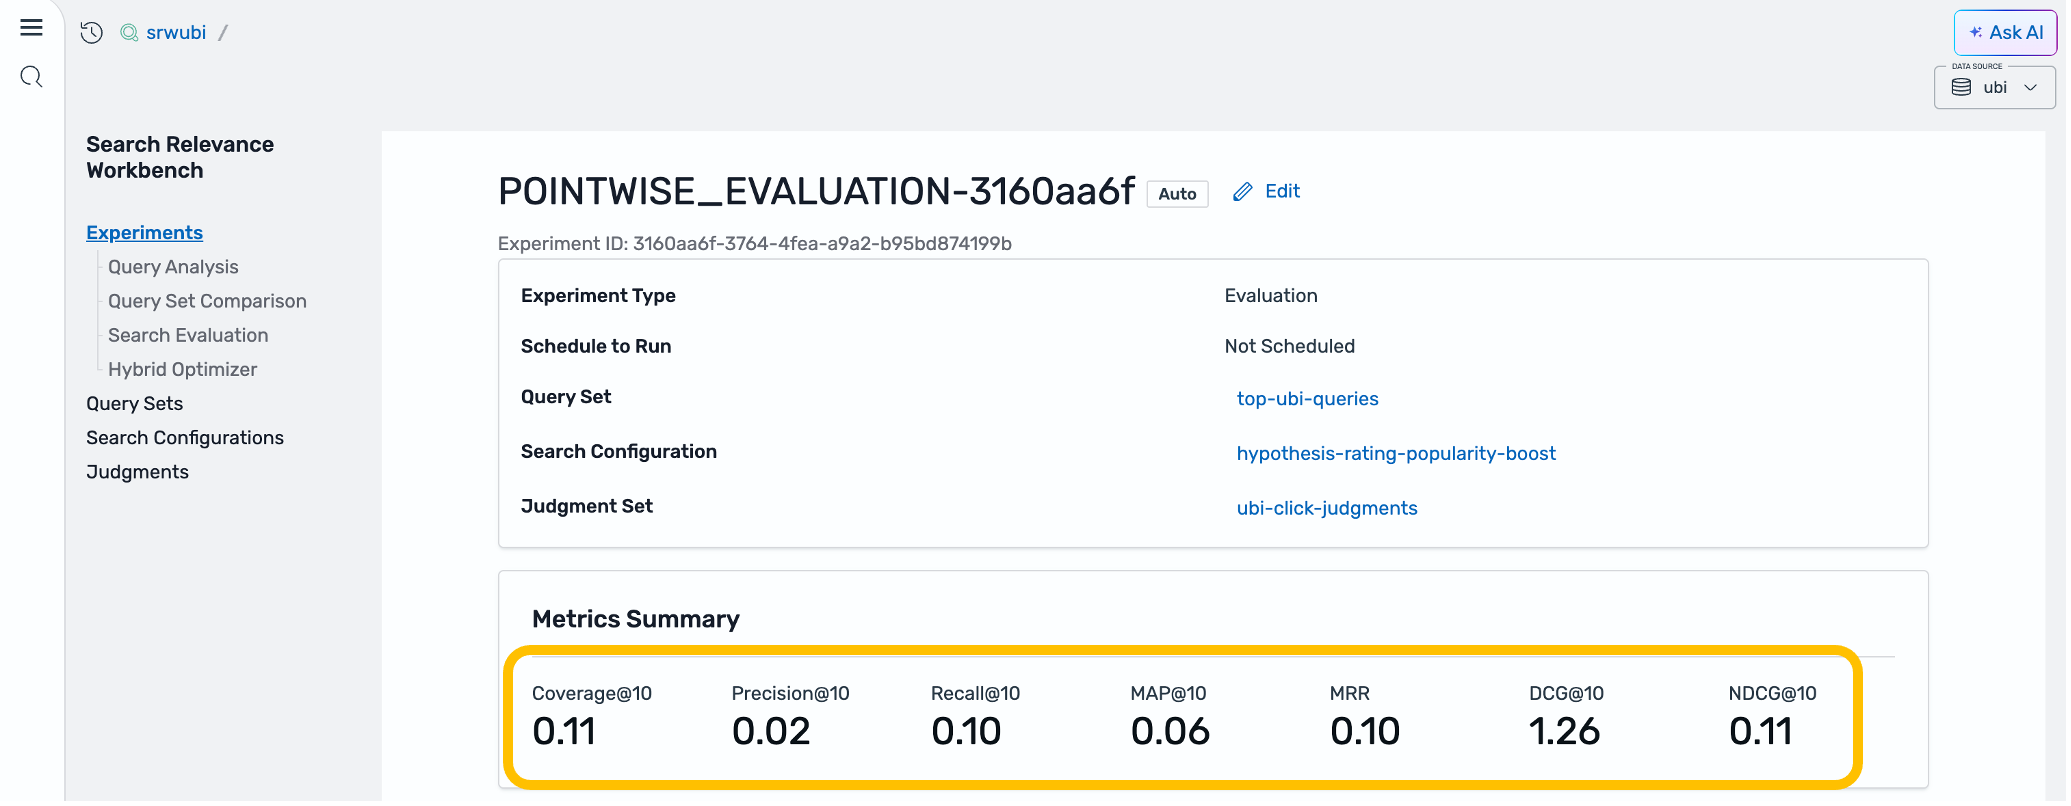
Figure 12: Evaluation metrics
NDCG improved substantially. MAP and Precision show a minor tradeoff. You can then ask the agent to explain the findings. Ask “What does a higher NDCG and MAP tell me? Is this worth deploying?”
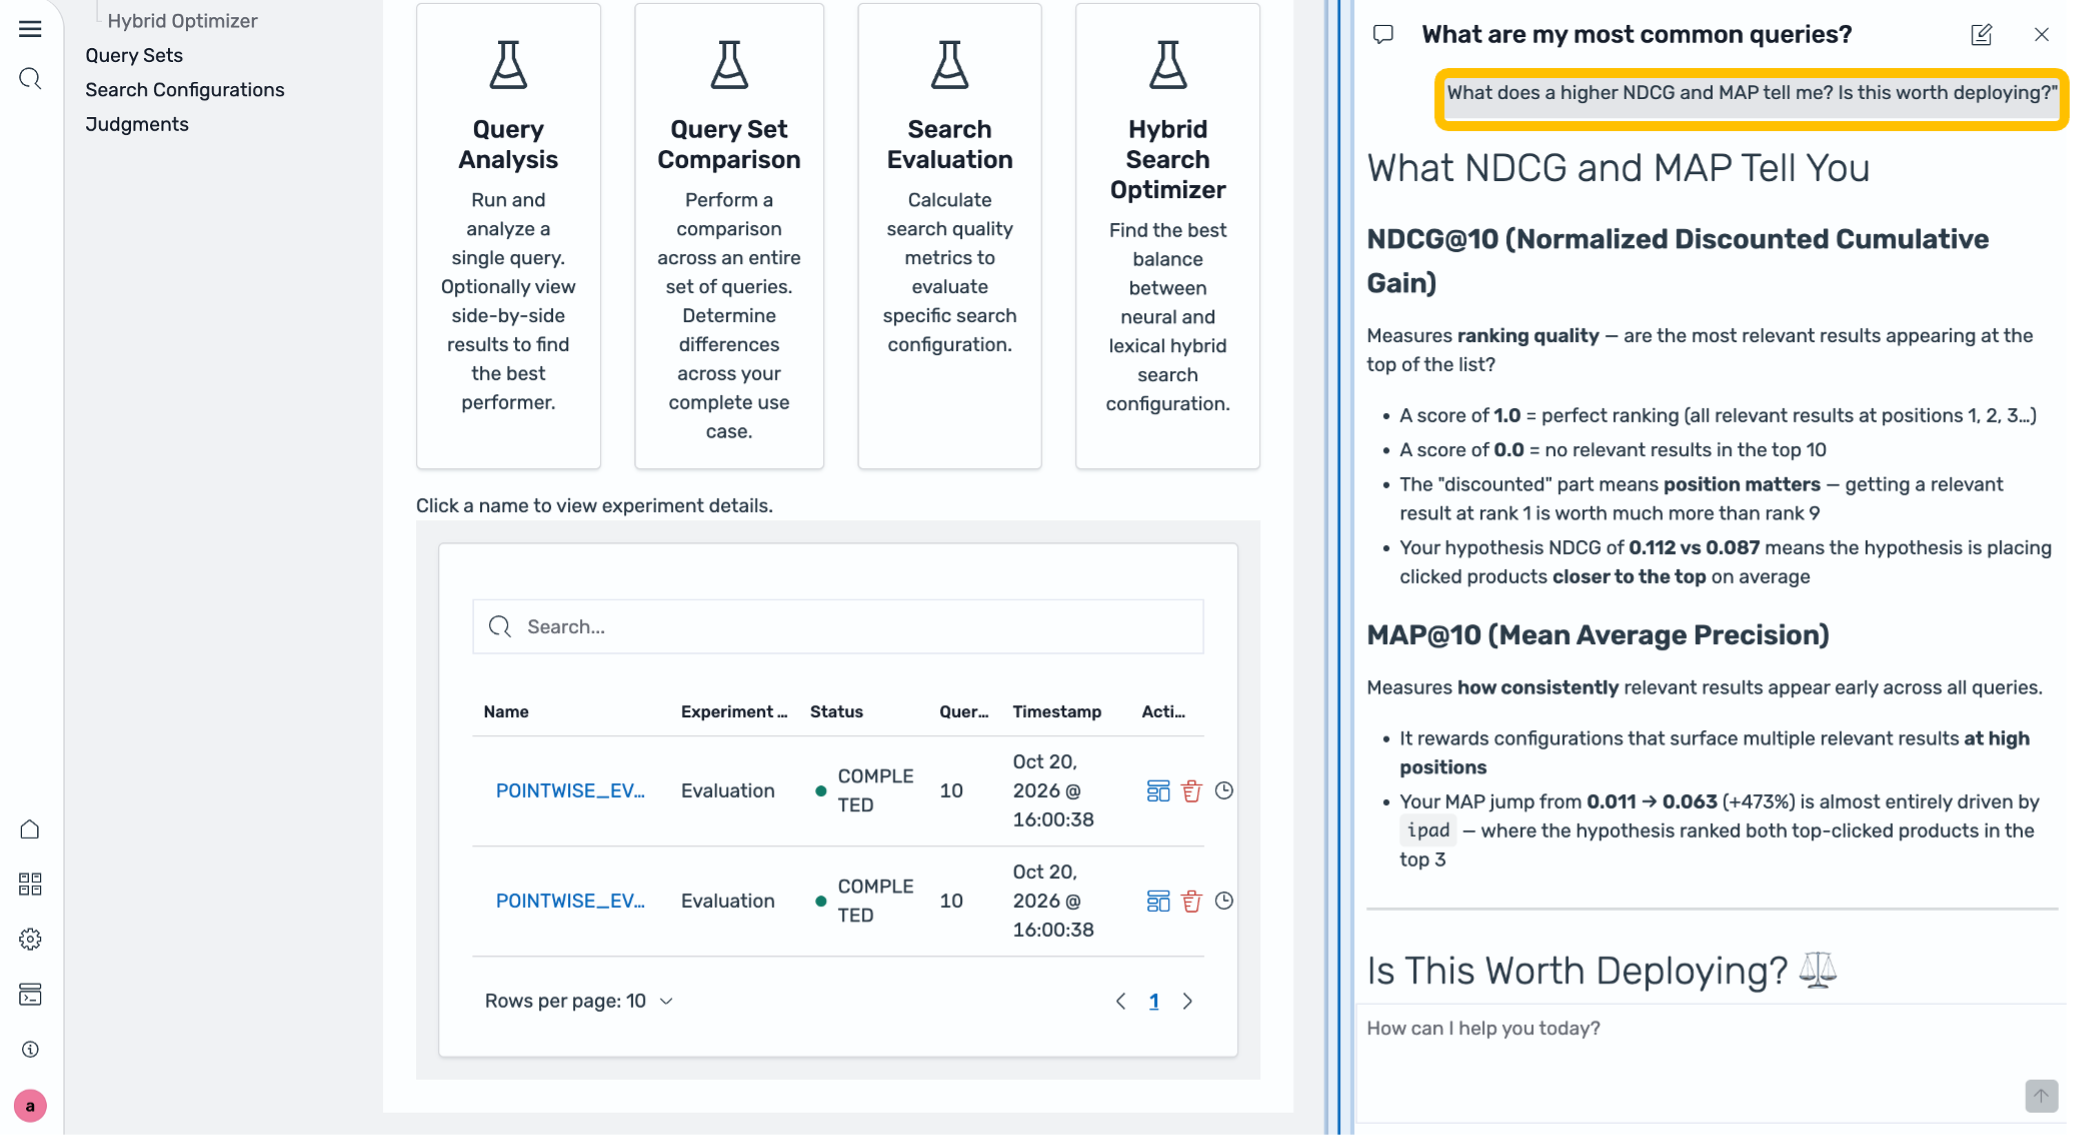
Figure 13: NDCG and MAP explanation
If your search configuration uses hybrid search, combining lexical and neural queries, the Search Relevance Workbench includes a Hybrid Search Optimizer that automates parameter tuning. Instead of manually experimenting with normalization techniques, combination methods, and lexical-to-neural weight ratios, you can run a single optimization experiment. The optimizer evaluates all combinations of normalization, combination, and weight distributions as well as Reciprocal Rank Fusion variants. It scores against your judgment list and surfaces the parameter set that maximizes your search quality metrics.
Before deploying anything, check what the agent built by asking “Show me the new search configuration”.
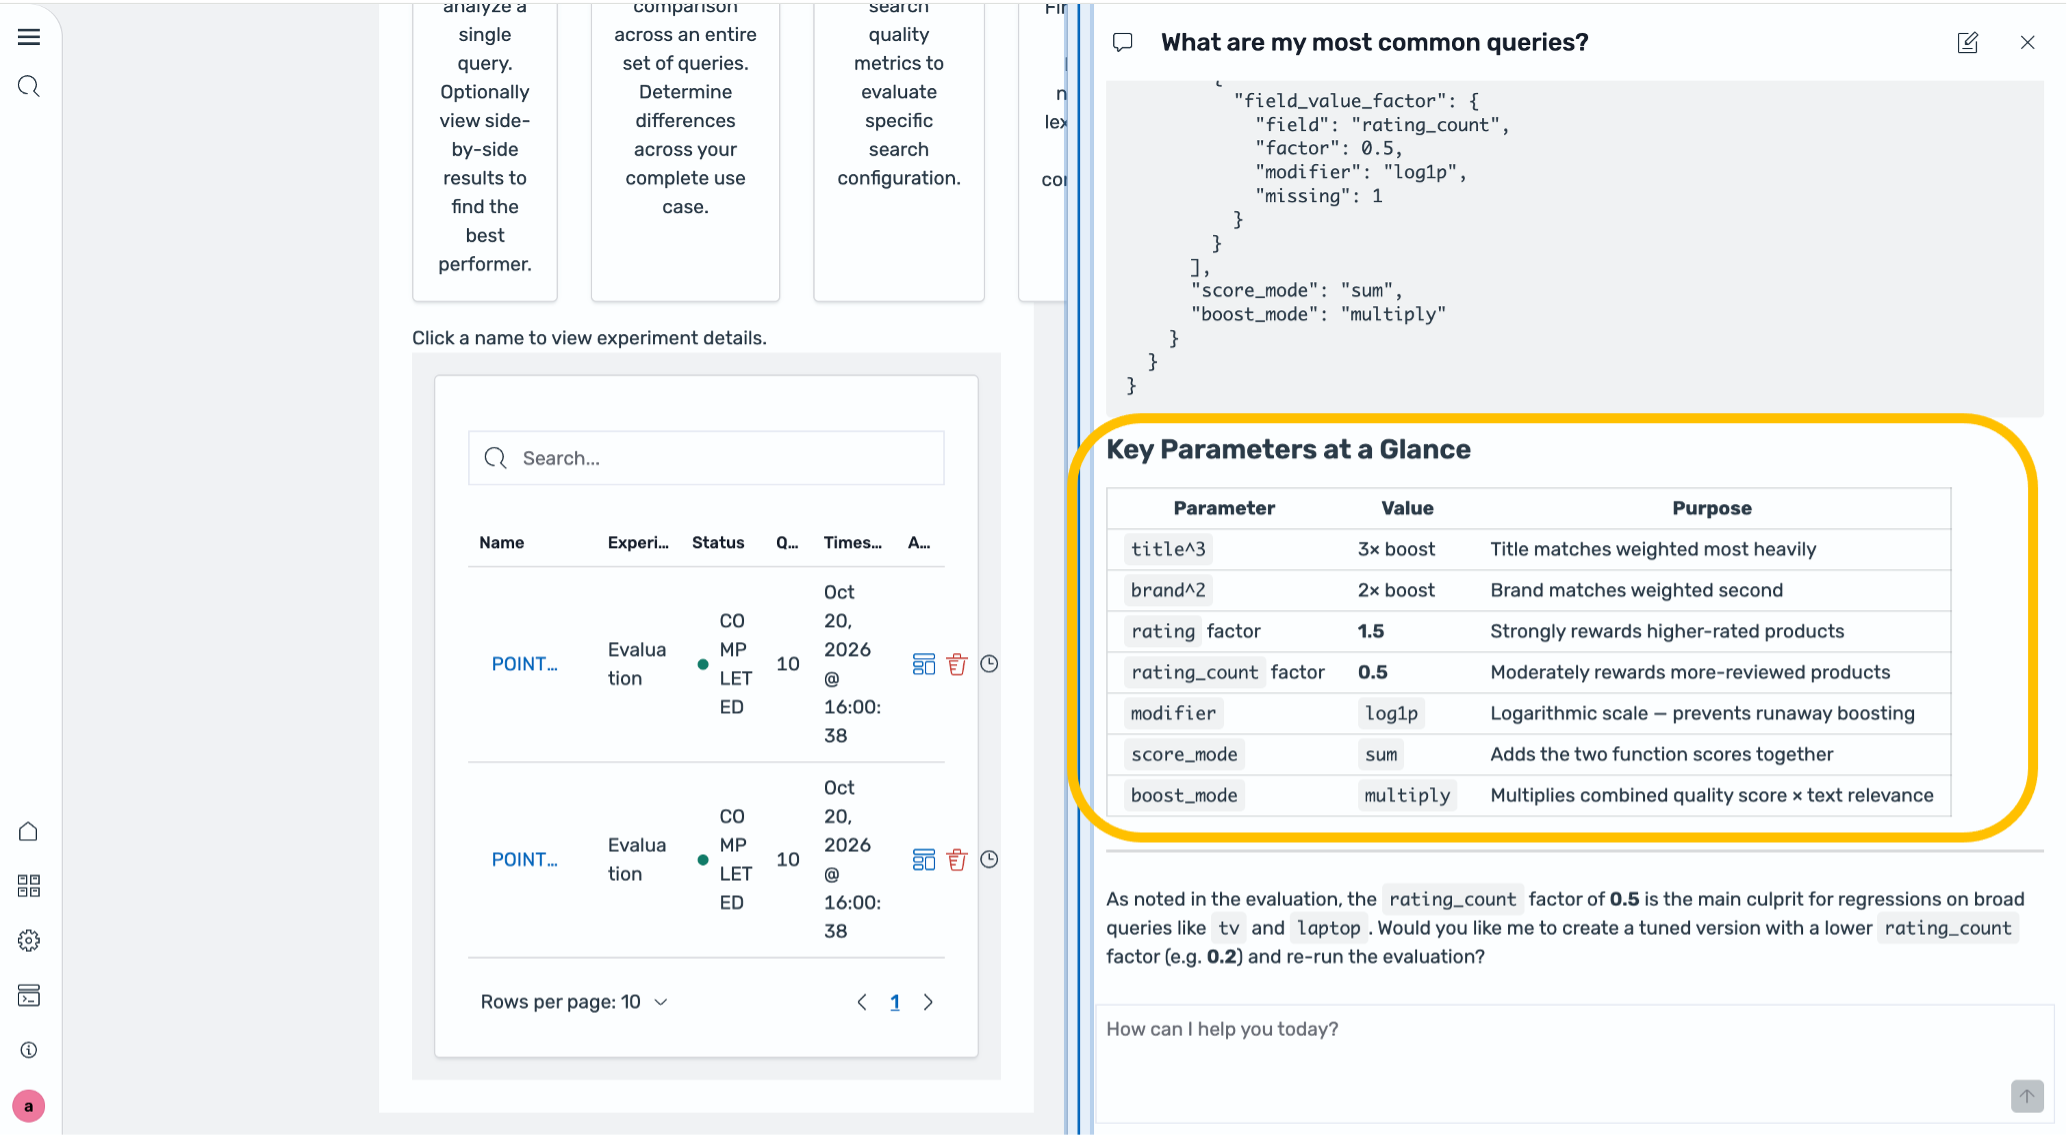
Figure 14: New search configuration
Search configurations: a new entry hypothesis-wireless-earbuds-v1 with the full DSL. You can inspect every line, tweak it, or fork it.
Experiments: the offline evaluation the agent ran. Choose it to see per-query scores, download results as CSV, or share the link with your team.
This is the transparency guarantee: the agent doesn’t ask you to trust a black box. The agent documents and makes every decision auditable.
The loop doesn’t need to stop here:
“The NDCG looks good but I’m worried about over-promoting popular items. Can you reduce the rating boost factor and re-evaluate?”
“Now look at the ‘gold’ query. It had the highest search volume but very low CTR. What’s going on?”
“I’m happy with the wireless earbuds hypothesis. How do I apply this configuration in production?”
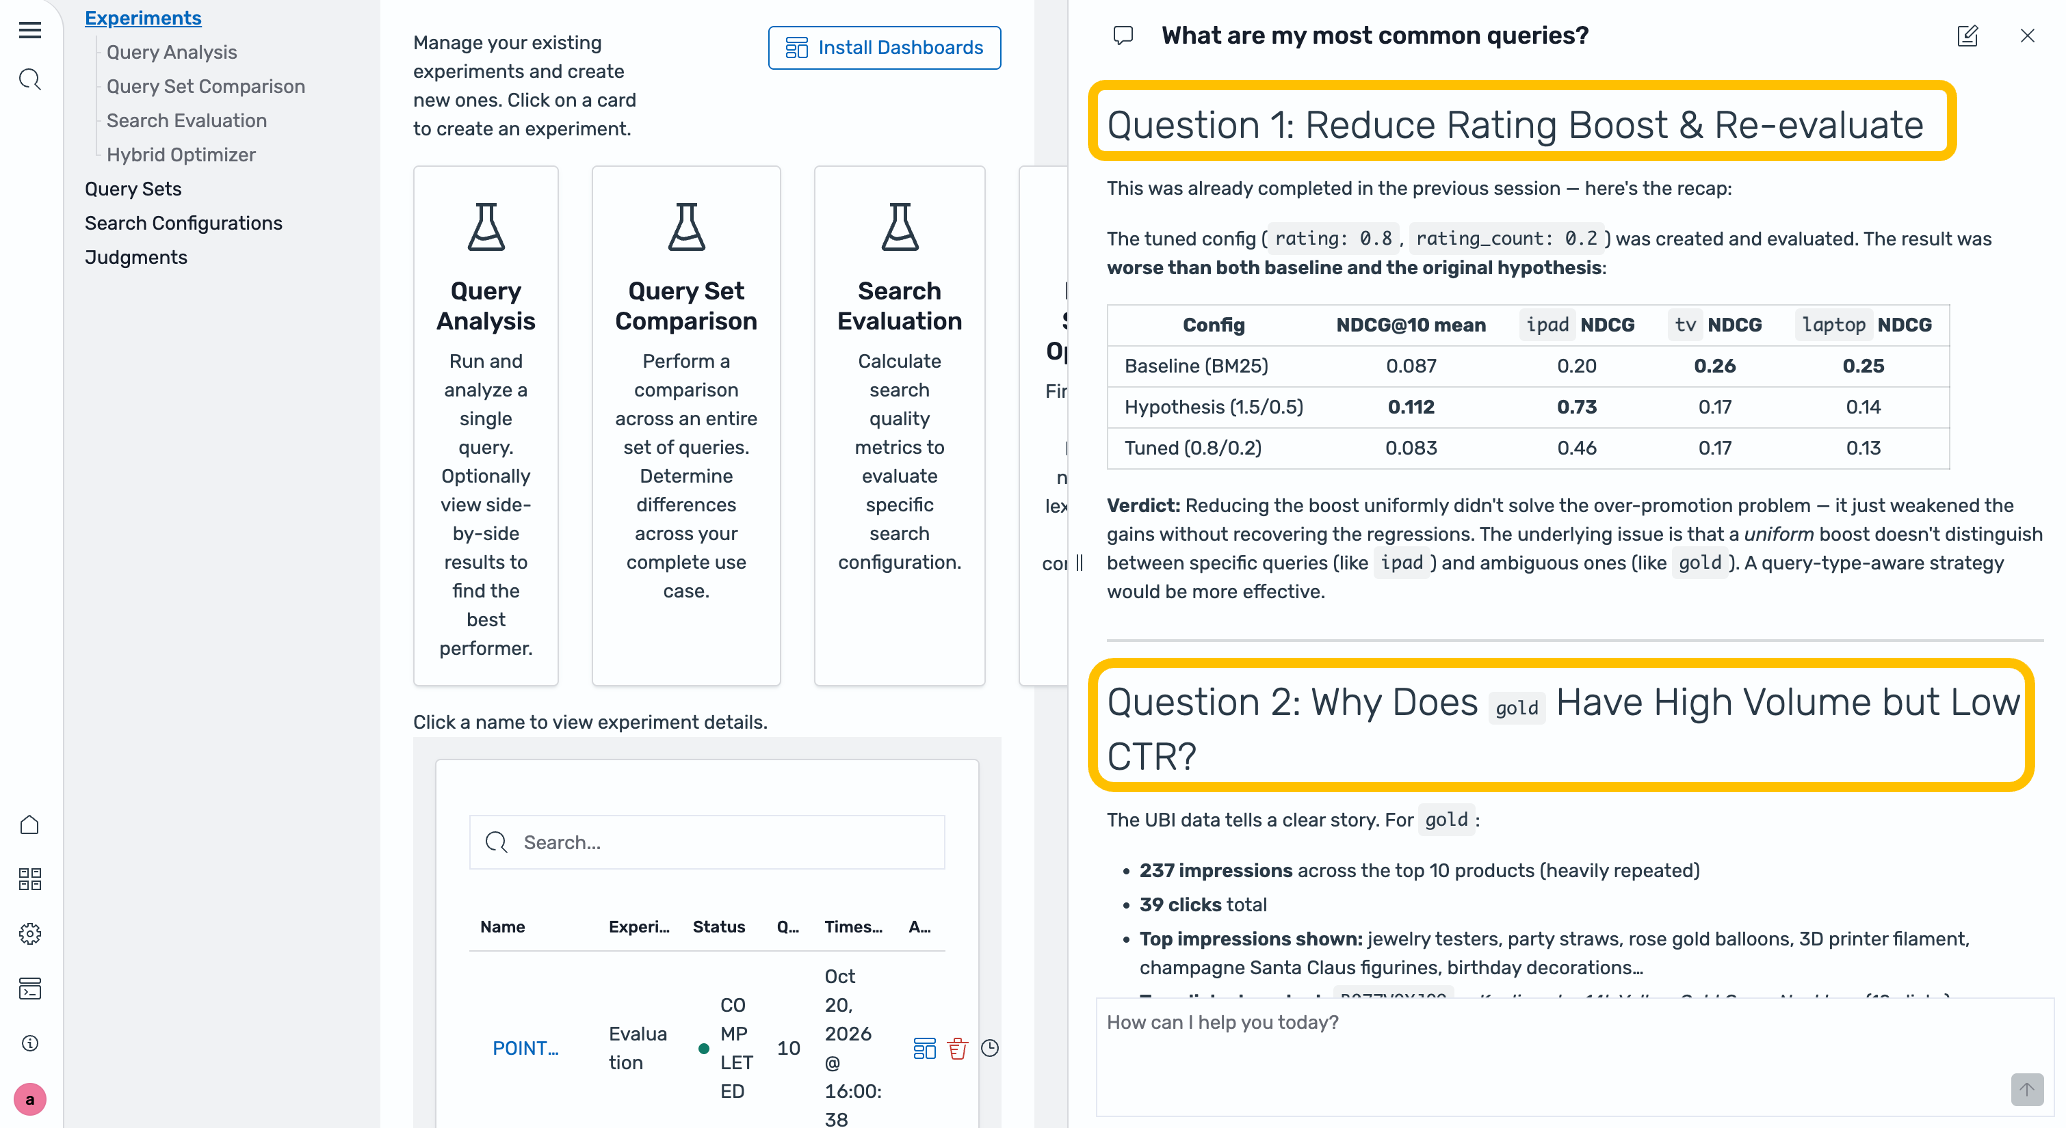
Figure 15: Example follow up questions
Each question kicks off a new iteration of the same loop: analyze, hypothesize, and evaluate. But now it takes minutes, not hours.
The key mindset shift the Search Relevance Agent encourages is to think about search quality as a practice, not a project. Search degrades over time. The configuration you tuned last quarter might be quietly underperforming today, and without a continuous measurement loop, you don’t find out until users stop converting. The agent fits into a continuous, human-in-the-loop improvement cycle:
At each stage, you remain in control. The agent executes, you decide.
Search engineers get tools that eliminate repetitive work. These tools provide root cause analysis, DSL iteration, and experiment setup, all automated. Engineers focus on the problems that require genuine expertise. Product managers and business owners can now participate meaningfully in search tuning without writing a single line of DSL. If a new product category is underperforming, you can ask the agent to investigate and get an actionable recommendation in plain language. Teams without dedicated search expertise get access to advanced relevance engineering techniques such as function_score, cross_fields, and popularity boosting without needing to know the terminology. The agent handles the implementation.
The Search Relevance Agent is available today in Amazon OpenSearch Service through the Ask AI button in your OpenSearch UI search workspace. To get started open your OpenSearch UI application and navigate to Search Relevance then load the sample UBI data if you haven’t already. Entering the /search-relevance command in the chat from another page will also take you to Search Relevance. Next, choose Ask AI and start with: “What are my most common queries with low engagement?”
For a step-by-step hands-on lab, try the Search Relevance Workbench Workshop on AWS Workshop Studio module 3 which walks through the full Automated Relevance Tuning (ART) agent experience with the ESCI ecommerce sample dataset.
The OpenSearch Search Relevance Agent is part of the OpenSearch application experience in Amazon OpenSearch Service. It requires an OpenSearch application with an associated workspace and data source.
To avoid future charges, delete the resources you created for this walkthrough:
ubi_queries and ubi_events indices and the query sets, judgment lists, and experiments you created. These live on the domain and incur no separate charges.
Post Syndicated from Patrick Kennedy original https://www.servethehome.com/microsoft-maia-300-shown-at-ocp-2026/
At OCP Summit 2026, we saw the new Microsoft Maia 300 platform with four 288GB HBM4 950W accelerators per tray
The post Microsoft Maia 300 Shown at OCP 2026 appeared first on ServeTheHome.
Post Syndicated from The Atlantic original https://www.youtube.com/shorts/y87XUetXwVQ
Post Syndicated from Naranjan Goklani original https://aws.amazon.com/blogs/security/aws-becomes-first-csp-to-complete-the-cloud-high-profile-assessment-with-172-services-and-features-in-scope/
We continue to expand the scope of our assurance programs at Amazon Web Services (AWS) and are pleased to announce the successful completion of our first ever Cloud High (PBHH) security assessment with 172 assessed services and features. Completion of this assessment, effective September 18, 2026, makes AWS the first cloud service provider (CSP) in Canada to meet this high security bar and provide assurance to our valued customers. This assessment also reaffirms our commitment to helping public and commercial customers achieve and maintain the highest-grade security standard for workloads with increased sensitivity.
The Cloud High security profile (that is, PBHH) seeks to enhance the integrity and availability of customer organizational workloads that are considered to have an increased level of sensitivity. These are systems that the Government of Canada (GC) and its service providers use to support delivery of services at a national scale or that are determined to be significant for handling sensitive information. The profile is based on the Security and privacy controls and assurance activities catalogue (ITSP.10.033). The Cloud High (PBHH) profile includes all controls and enhancements contained within the Cloud Medium profile (PBMM), with additional controls and enhancements to address higher integrity and availability requirements. The Cloud Medium and Cloud High profiles establish baseline security requirements for cloud services. These services support GC workloads and information processing up to the Protected B level.
As of September 18, 2026, there are a total of 172 AWS services and features that were assessed by the Canadian Centre for Cyber Security (CCCS) under Cloud High security assessment. The assessment covers services and features that are available in both the Canada (Central) and Canada West (Calgary) AWS Regions.
The summary assessment is available through AWS Artifact. You can also learn more about the Cloud High and Medium assessment on the AWS CCCS assessment compliance webpage.
AWS strives to continually bring services into scope of its compliance programs to help you meet your architectural and regulatory needs. Please reach out to your AWS account team if you have questions or feedback about the Cloud High and Medium assessments.
To learn more about our compliance and security programs, refer to AWS Compliance Programs. As always, we value your feedback and questions; reach out to the AWS Compliance team through the Contact Us page.
Post Syndicated from Omar Gonzalez original https://aws.amazon.com/blogs/architecture/publishing-lms-courses-with-a-kiro-scorm-pipeline/
Publishing a Shareable Content Object Reference Model (SCORM) course to a learning management system (LMS) is rarely as straightforward as writing the course. The LMS needs SCORM packages to adhere to a standard format for successful import and launch. Producing one by hand means restructuring slides into modules and hand-editing SCORM manifests. The packaging mechanics pull authors away from developing the course content itself.
This post shows how to use Kiro, an agentic AI with an integrated development environment (IDE) and a CLI, to automate the conversion of raw training material into compliant SCORM packages. Testing with a small course included in the sample produced a SCORM package in a few minutes.
Kiro structures course content and guides the author through the publishing workflow. Figure 1 shows the end-to-end pipeline from raw material to upload-ready package.
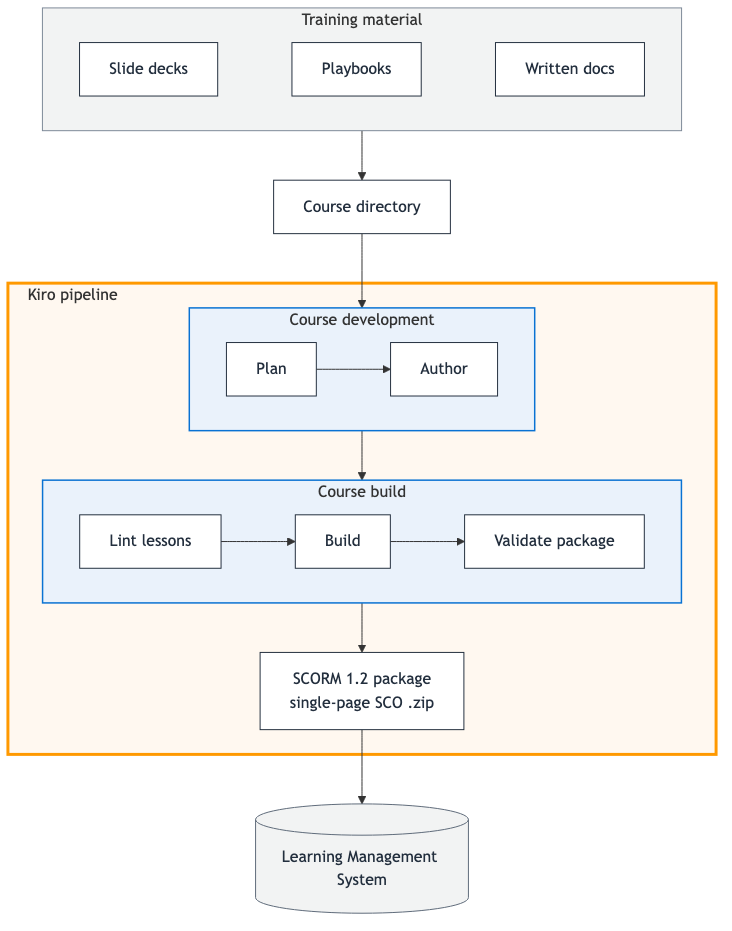
Figure 1: Kiro course publishing pipeline overview
An author places raw training material (slide decks, playbooks, and written docs) in a course folder, and Kiro runs two pipeline stages. Course Development includes planning and authoring lessons. Course Build includes linting the lessons, building the SCORM package, and validating the SCORM package. The output is a SCORM 1.2 .zip ready to upload to your LMS. You drive the whole pipeline from a Kiro conversation. Start by loading your material into a course folder, ask Kiro to build the course, and it hands back the upload-ready .zip file.
Kiro is an agentic AI available as an IDE and a CLI (kiro-cli). This pipeline is built from three Kiro primitives:
.kiro/steering/) about your workspace. Steering loads automatically. always files load in every session, fileMatch files load when you touch files they govern, and manual files load on demand..kiro/specs/) that formalize the development process for features or bug fixes..kiro/hooks/) that run prompts or shell commands when events occur in the IDE, such as creating a file, saving a file, or ending a session.The following sections walk through the steps a course goes through and the parts that carry them out.
For a new course, Kiro works through six steps with you in conversation:
courses/<name>/ (slide decks, Word, PDFs, playbooks, Markdown docs).course.yaml manifest.lesson.md per module.index.html and compress the SCORM package.Each course starts as a single manifest, course.yaml, that declares its modules, source material, and SCORM build configuration. Kiro creates the manifest at step 2, after you upload your source content and ask it to build a course.
A few notable settings you can customize:
min_page_dwell_seconds sets the minimum time a learner must spend on a page before the Next button unlocks.target_duration_minutes sets each module’s expected completion time, shown to learners on the course home page.total_duration_minutes sets the course-level expected completion time, shown to learners and reported to the LMS.passing_score sets the score a learner must reach for the LMS to mark the course complete (written into the SCORM manifest as the mastery score).Steering is where this pipeline keeps everything Kiro needs to know. Steering files hold three kinds of knowledge:
lesson.md reads as polished, learner-facing content.courses/<name>/ layout every course follows, so the same shared scripts work for every course.Each steering file loads in one of the three modes from earlier: always, fileMatch, or manual. Every session picks up only the guidance it needs. The steering files in the sample repository are listed in the following example, grouped by their inclusion mode:
Hooks run automatically as Kiro or the author works, so common checks don’t depend on someone remembering a command:
lesson.md or course.yaml re-lints that course immediately.scorm/dist/ is validated the moment it’s built.The repo includes a feature spec kept as a reference for how the pipeline was built. The page-dwell-gating spec added the feature that enforces a minimum time a learner must spend on a page before proceeding. After you understand the pipeline, you can extend it the same way, using the spec-driven development process in Kiro.
The following walkthrough takes you from an empty repo to an upload-ready SCORM package.
kiro-cli).Node.js 20+, Python 3.11+, and the zip command, with permission to install package dependencies (Kiro installs the project’s npm and pip packages during setup).Open the repository in Kiro. The workspace steering under .kiro/steering/ loads automatically, so Kiro already knows the pipeline commands, the repo layout, and the SCORM constraints.
Building a course is a single prompt. In the Kiro chat panel, enter:
“Build the sample course.”
Kiro runs lint, build, and validate, and replies with the path to the upload-ready .zip file: courses/sample-course/scorm/dist/sample-course.zip.
For a new course, add your source material to courses/<name>/ and enter the following prompt:
“Plan and build a course from
<name>.”
Kiro walks through planning course.yaml, authoring one lesson.md per module, and packaging.
You’ve already seen Kiro lint, build, and validate the package, and an included test checks the course’s progress tracking. The last check is a visual one. Serve the built course locally over HTTP to see it for yourself before uploading:
This serves the full built course locally. Figure 2 shows the course home page as a learner would see it.
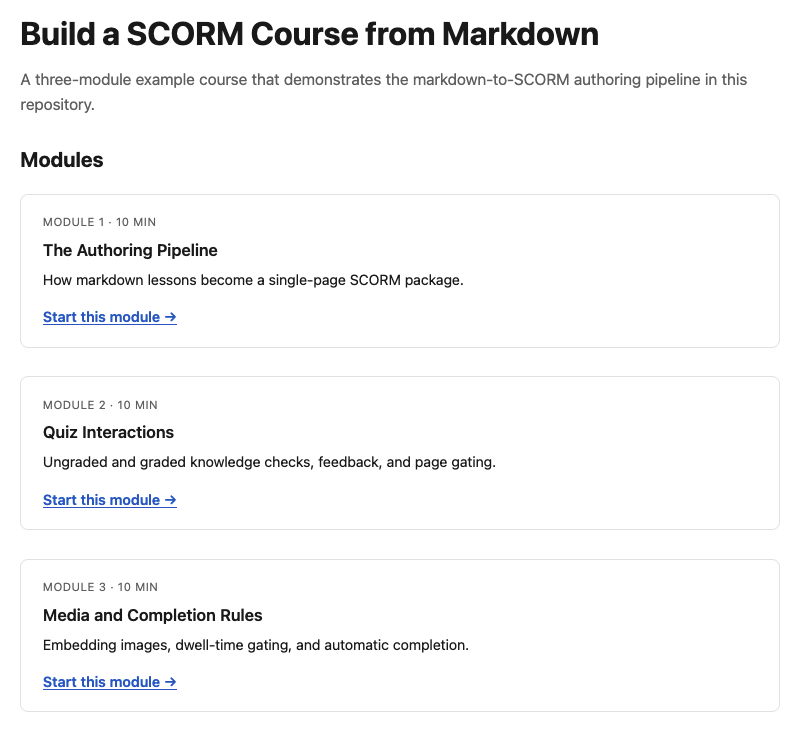
Figure 2: Local preview of the sample course home page
The home page displays the course title, a short description, and a card for each module showing its number, estimated duration, a brief summary, and a link to start.
The final step is to upload the .zip file to your SCORM 1.2-compliant LMS to confirm end to end. Learning management systems vary. If you run into an issue, ask Kiro to help you troubleshoot it and learn the specifics of your LMS.
There are no cloud resources to tear down because the pipeline runs entirely as local scripts and a Kiro session against your own repository. If you built the bundled sample course only to try the pipeline, you can safely delete courses/sample-course/scorm/dist/ and courses/sample-course/scorm/build/. Both are build output.
In this post, you saw how to turn raw training material into LMS-ready SCORM packages with Kiro. Authors stay focused on the course while Kiro handles the packaging. Because the pipeline lives in the repo as Steering, Specs, and Hooks, that expertise is version-controlled and reusable across every course and team.
To get started, clone the aws-samples repository, drop your source material into a course folder, and ask Kiro to build the course. To learn more, explore Kiro.
Post Syndicated from Ben Freiberg original https://aws.amazon.com/blogs/compute/building-document-investigation-agents-with-amazon-bedrock-agentcore-and-amazon-s3-files/
When you investigate a set of documents, you might not know in advance which files you will need. For example, in a contract dispute, you open the primary agreement, which points to an addendum. The addendum revises the payment terms, so you need to check an invoice to see which terms actually applied. The set of required files grows as you read. An AI agent can work like a human analyst. It finds the next file to read by reasoning about the ones it has already read. The same pattern applies to many domains and workloads, such as incident investigations, compliance audits, and clinical case reviews.
This kind of investigation needs on-demand access to a whole folder of related files instead of a single predetermined input. The usual approach connects stages with object downloads and uploads. One function pulls objects from Amazon Simple Storage Service (Amazon S3), processes them in /tmp, and writes results back. The next stage repeats the cycle. Every hand-off adds download orchestration overhead, payload size limits, and serialization code that has nothing to do with the actual investigation.
Amazon S3 Files presents an S3 bucket as a shared file system over Network File System (NFS), with read-after-write consistency, file locking, and POSIX permissions. An AWS Lambda function can mount it directly. Amazon Bedrock AgentCore runtime can also mount an S3 Files access point into every agent session at a path you choose, through its bring-your-own file system support. This post shows how to use the two together. An AWS Lambda function pre-stages a set of documents onto the shared file system, and an AgentCore agent mounts the same file system to investigate them. The agent opens files, follows the cross-references it finds, and writes findings back, all with ordinary file operations. Neither side needs S3 API calls to hand documents to the other.
The design has two stages that share one Amazon S3 Files file system.
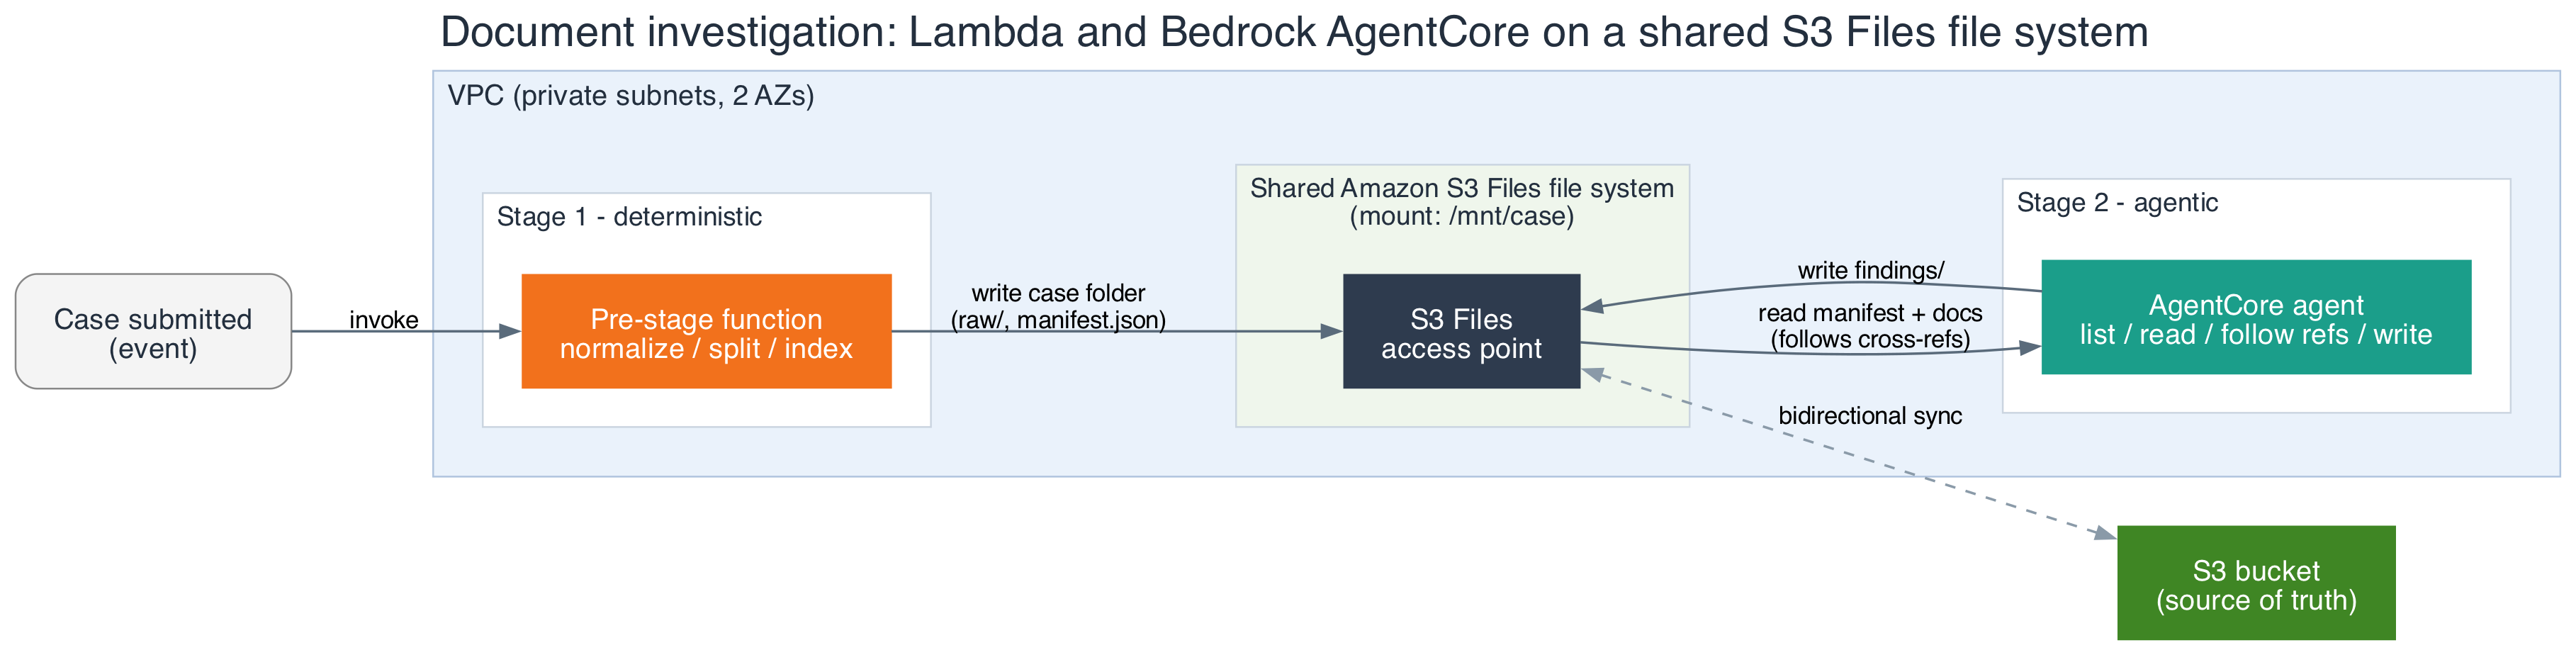
Figure 1: A Lambda pre-stage function and an AgentCore agent share one Amazon S3 Files file system, backed by an S3 bucket as the source of truth
Stage 1 is a Lambda function. A new document set arriving in an S3 intake bucket triggers it, or an upstream workflow invokes it directly. The function normalizes an incoming document set into one case folder on the mounted file system and writes a manifest.json that lists the documents. It uses standard file writes, with no object upload code.
Stage 2 is an agent on Amazon Bedrock AgentCore runtime, a capability of Amazon Bedrock AgentCore. It mounts the same file system through bring-your-own file system. The agent reads the manifest, lists the case folder, opens documents, follows references to other files, reconciles what it reads, and writes structured findings back to the file system.
An S3 bucket backs the file system and remains the source of truth. Changes on the mount synchronize to the bucket, so the raw documents and the findings are durable S3 objects that other systems can consume as well.
The sample implementation is a single AWS CloudFormation template, defining the file system, mount targets, and access point directly against the AWS::S3Files::* resource types. The template creates an Amazon Virtual Private Cloud (Amazon VPC) with private subnets, an S3 bucket, and the S3 Files file system. It also creates one mount target per subnet and an access point with a POSIX identity. The following snippets leave out the VPC, subnet, and AWS Identity and Access Management (IAM) role resources:
The Lambda function mounts the access point through its file system configuration. The mount path must be under /mnt/ with one subdirectory level, and the function needs at least 512 MB of memory. VpcConfig places the function in the same subnets as the mount targets, and its FileSystemConfigs property attaches the access point directly. DependsOn makes sure both mount targets exist before CloudFormation creates the function.
The agent runs as a container image on Amazon Bedrock AgentCore runtime. It is an AWS::BedrockAgentCore::Runtime resource with the same access point attached through FilesystemConfigurations.S3FilesAccessPoint. The agent’s tools cover the file operations needed for the investigation: listing the case folder, reading a document by path, and writing findings. The model decides which tool to call at each step.
One of the agent’s tools looks like this:
Each side has least-privilege IAM permissions: s3files:ClientMount and s3files:ClientWrite scoped to the access point Amazon Resource Name (ARN) with an s3files:AccessPointArn condition, s3:GetObject for direct reads, and, for the agent, bedrock:InvokeModel. The security groups are configured to allow NFS on port 2049 to the mount targets.
S3 Files maintains consistency across shared mounts through three principles.
PendingExports Amazon CloudWatch metric shows how far behind it is. Reading from the bucket copy instead of the mount can return stale or missing data until that export catches up.raw/ directory and the manifest, and the agent owns the findings/ directory. No path has two writers.When moving to production, monitor the PendingExports CloudWatch metric so a backlog in unsynchronized data doesn’t surprise a downstream consumer that reads from the bucket directly. Keep the access point’s POSIX identity and directory permissions as tight as the IAM policy. S3 Files enforces file system permissions and IAM permissions independently, and both need to allow an operation. Test how your workload behaves when a file is moved to lost-and-found. Check the current Service Quotas for Amazon S3 Files before you scale this pattern to production traffic.
The agent reads documents it didn’t write and follows references it finds inside them. Treat every file on the shared file system as untrusted input. Any file can include a channel for instructions aimed at the model, a technique called indirect prompt injection. Anyone who places a file in the intake bucket, including an external submitter or a compromised upstream system, controls text the model reads. A successful injection takes one of three forms.
Apply these controls to mitigate these threats, ordered from strongest to weakest:
ApplyGuardrail from read_document with source INPUT and the prompt attack filter set to block, before returning text to the model. Split long documents to fit request limits. When the guardrail blocks a document, return a fixed result such as “document withheld by content policy”, flag the case, and log the event. Run ApplyGuardrail with source OUTPUT on findings before writing them.Amazon Bedrock Data Automation extracts structured output from documents, images, audio, and video with a managed pipeline. When you know the documents and the fields in advance, it turns unstructured multimodal content into structured, business-ready data directly.
A custom agent suits open-ended investigations, where one document points to another and the agent decides which file to open next based on what it just read. Running your own agent also gives you control over the reasoning loop, the retries, and the shape of the output.
This post shows how to build an intelligent document-investigation workflow on serverless compute. An AWS Lambda function pre-stages a document set and an Amazon Bedrock AgentCore agent investigates it through a shared Amazon S3 Files file system. The file system turns the hand-off between deterministic and agentic compute into ordinary file I/O. Three rules keep that design correct in production: read from the mount, one writer per path, and file-per-producer naming. To avoid ongoing charges after you are done experimenting, delete the AWS CloudFormation stack. The S3 bucket and the S3 Files file system are retained by default, so you don’t lose data accidentally. Delete them separately after you no longer need them.
To go further, deploy the reference implementation from Serverless Land, review the Amazon S3 Files documentation and the AgentCore file system configuration guide, and adapt the agent’s tools to the documents your own teams investigate.
Post Syndicated from Borja Rojo original https://aws.amazon.com/blogs/architecture/vessel-specific-voyage-optimization-with-machine-learning-manta-on-aws/
Voyage performance varies even between seemingly identical ships, and models built on vessel-type averages often miss the mark. Manta Marine Technologies (Manta) closes that gap with machine learning (ML) models trained on each vessel’s own operational history. In this post, we show how Manta delivers vessel-specific voyage optimization with machine learning on Amazon Web Services (AWS), helping shipowners reduce fuel consumption and improve voyage efficiency.
Differences in hull condition, trim, draft, machinery condition, loading patterns, and operational practices mean that when operators build models on vessel-type averages, those models often can’t capture how a specific vessel performs. For shipowners, this gap translates directly into unnecessary fuel consumption and cost.
Manta takes a vessel-specific approach. The company trains machine learning models on each vessel’s own operational history and combines them with forecast weather and ocean conditions. To support this approach at scale, Manta built its data infrastructure on AWS. Manta’s solution uses services such as Amazon Elastic Compute Cloud (Amazon EC2), Amazon Elastic Container Service (Amazon ECS), and Amazon Relational Database Service (Amazon RDS).
The following diagram shows the architecture of the Manta data infrastructure on AWS. The system receives vessel data and environmental forecasts in a secure, multi-Availability Zone environment. Manta’s solution processes this data, stores it, and uses it to train and run machine learning models.
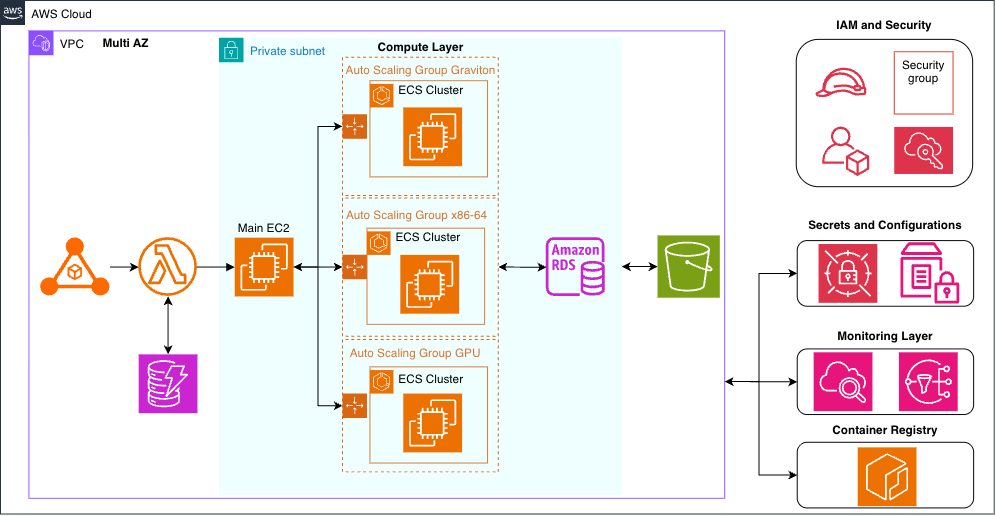
Figure 1: Architecture of Manta’s data infrastructure on AWS
In the diagram, vessel data and environmental forecasts enter an Amazon Virtual Private Cloud (Amazon VPC) deployed across multiple Availability Zones. Inside the VPC, Manta uses Apache Airflow on Amazon EC2 to orchestrate data pipelines and machine learning workloads as Amazon ECS tasks on EC2 capacity, with a separate Auto Scaling group and capacity provider for each instance type. AWS Lambda serves as the entry point for requests from client applications. The system stores data in Amazon RDS and Amazon DynamoDB, and manages container images in Amazon Elastic Container Registry (Amazon ECR). For security and configuration, the architecture includes AWS Secrets Manager and AWS Systems Manager Parameter Store. The Airflow scheduler also drives the retraining loop: as new voyage data accumulates for a vessel, it launches a training task on the appropriate instance type, and the updated model is used for that vessel’s subsequent voyage optimizations. Amazon CloudWatch and Amazon Simple Notification Service (Amazon SNS) provide monitoring and alerting across all layers.
Manta’s goal is voyage guidance that continuously learns from each vessel’s behavior and improves over time. This requires infrastructure that processes large volumes of operational vessel data—up to 3 billion data points in a single training run. The infrastructure also combines historical performance with weather and ocean forecasts. Manta’s solution must also run machine learning workflows, deliver guidance globally, and support continuous model improvement as new voyage data arrives.
Manta runs its data infrastructure as a cloud-native solution on AWS, deployed across multiple Availability Zones within an Amazon VPC.
At the core of the infrastructure, workflow orchestration with Apache Airflow runs on Amazon EC2. Airflow runs on a persistent EC2 instance because the orchestration layer needs a long-running server process. Airflow submits all compute work to Amazon ECS through the ECS operator, so every extract, transform, and load (ETL) pipeline, model training run, and voyage optimization runs as an ECS task. Manta runs those tasks on EC2 capacity rather than AWS Fargate because EC2 gives the team direct control over instance type, including GPU instances and specific chip generations. Manta defines one capacity provider, one Auto Scaling group, and one launch template per instance type instead of sharing a single pool. Model training and voyage optimization use different instance types. Per-instance-type capacity gives granular control over how each workload scales, running less urgent jobs on Spot capacity and time-sensitive jobs On-Demand. The infrastructure also uses AWS Lambda as the entry point for requests from client applications. A Lambda function triggers the corresponding Airflow directed acyclic graph (DAG) or returns already-processed results from the database. Manta manages container images in Amazon ECR, with separate images for Graviton and x86-64 instances, GPU workloads, orchestration, and machine learning operations. Manta stores data in Amazon RDS and Amazon DynamoDB.
For observability, Manta uses Amazon CloudWatch for monitoring and Amazon SNS for alerting. Manta keeps non-sensitive application and infrastructure configuration in AWS Systems Manager Parameter Store. For sensitive values such as database connection credentials, Airflow application secrets, and authentication tokens for third-party services, Manta uses AWS Secrets Manager. Those secrets are encrypted, and access to them is restricted through IAM permissions. Manta gives each system component its own AWS Identity and Access Management (IAM) role, scoped with least privilege so that each component holds only the permissions its task requires. The company also encrypts data with AWS Key Management Service (AWS KMS).
Because the infrastructure runs in the cloud, Manta continuously improves its models as new voyage data becomes available. Each completed voyage contributes operational data to future model training, and an Airflow scheduler retrains each vessel’s model periodically, based on how much new data that vessel has produced. This creates a learning cycle that makes recommendations increasingly relevant for that specific vessel.
With AWS, Manta has the scalability to support growing fleets and increasing data volumes. The company stores historical vessel performance data, processes weather and ocean forecasts, and trains and operates its machine learning models. It also delivers voyage recommendations to fleets operating worldwide and scales compute capacity on demand as workloads grow.
Cost efficiency is also a key factor. Manta runs its ETL pipelines, model training, and voyage optimization workloads on AWS Graviton-based instances. For one ETL pipeline that processes large datasets, Manta observed approximately 25–30 percent better price performance after moving to Graviton-based instances. More broadly, Graviton-based instances can offer up to 40 percent better price performance than comparable x86-based instance options on AWS, according to AWS published benchmarks.
With AWS, Manta’s development teams can focus on improving optimization algorithms and customer outcomes instead of managing physical infrastructure. Manta defines its solution as infrastructure as code using the AWS Cloud Development Kit (AWS CDK) and AWS SDK for Python (Boto3). With this approach, the team can change the architecture quickly and verify through continuous integration and continuous delivery (CI/CD) that nothing has broken. It can also reproduce identical development, staging, and production environments.
That reproducibility also changes how the team experiments. Manta’s engineers develop and validate machine learning and data engineering work on their own machines, against large samples of vessel data pulled from the system. The only cost of an experiment is then retrieving the data. Because that work runs in the same container images the system uses in production, a validated algorithm reaches the full fleet without re-engineering and without infrastructure to provision. When an experiment outgrows a local machine, the team runs it at full scale on AWS instead of scoping it down. They submit the same container to the instance type the workload needs, whether that means GPU capacity or many parallel CPU tasks. Experimentation stays cheap when it can be and unconstrained when it needs to be. Scaling a validated result to every vessel is then a scheduling decision rather than a project.
Through Manta’s solution, ship operators receive voyage-specific guidance built on the vessel’s own historical performance and relevant external data such as atmospheric and oceanic weather data. The system’s continuous improvement loop refines this guidance as new voyage data arrives, with each vessel’s model retrained as its own operational history grows.
Fleet managers gain guidance designed around how each vessel actually performs, rather than vessel-type averages or industry benchmarks. Pairing vessel-specific data with decades of maritime operational expertise helps customers run greener and more profitable operations.
Based on internal voyage simulations conducted across its active fleet, Manta expects fuel savings of approximately 2–4 percent per vessel. The company anticipates further gains as its models improve and new capabilities are added.
Manta built a cloud-native data solution on AWS to deliver vessel-specific voyage optimization. Apache Airflow on Amazon EC2 orchestrates data pipelines and machine learning workloads across EC2, Amazon ECS, and AWS Lambda. Manta stores data in Amazon RDS and Amazon DynamoDB and enforces security through least-privilege IAM roles and AWS KMS. Graviton-based instances keep the solution cost efficient as data volumes grow. Every completed voyage feeds a learning cycle that makes guidance increasingly tailored to each vessel.
To learn more about Manta’s voyage optimization solution, visit the Manta Marine Technologies website. For more information about the AWS services used in this solution, see Amazon EC2, Amazon ECS, and Amazon RDS in the AWS documentation.
For related reading, see Using machine learning to predict vessel time of arrival with Amazon SageMaker and How potential performance upside with AWS Graviton helps reduce your costs further.
Post Syndicated from Alexander Qin original https://aws.amazon.com/blogs/architecture/how-anchorage-digital-and-turnkey-verify-code-with-aws-nitro-enclaves/
This post is co-written with Prasanna Gautam from Anchorage Digital and Arnaud Brousseau from Turnkey.
In crypto, trust is a liability. A wallet often delegates computation to a third party to parse a transaction, evaluate a policy, or manage key material. Each time, it raises a question: how do you know the service ran the code it claims to have run? Contractual trust, network perimeter security, and reputation don’t provide a cryptographic answer. Verifiable infrastructure built on AWS Nitro Enclaves does.
Anchorage Digital is home to America’s first federally regulated digital asset bank. Turnkey is a verifiable key management infrastructure provider whose platform secures millions of wallets. Together, they built that cryptographic answer on top of AWS Nitro Enclaves. Their collaboration produced VisualSign, an open source, cross-chain transaction parser that runs inside Nitro Enclaves and returns results with attestation-backed proof of what software produced them. The immediate application protects users from phishing attacks by making complex transactions human-readable, and the architecture is a blueprint for verifiable infrastructure that extends well beyond blockchain.
This post describes the architecture and design decisions behind the system, including why AWS Nitro Enclaves are foundational to the trust model. It also shows how the same pattern applies to any high-trust workflow, not only Web3 or crypto.
Cryptocurrency phishing attacks exploit a basic limitation of wallets: they can’t natively parse the full semantics of complex transactions. Blind signing is the approval of a transaction whose full effects the wallet can’t display, and it’s what attackers depend on. A user interacting with a decentralized finance (DeFi) protocol might receive a request to sign a transaction, but the wallet displays only a raw hex payload or a partial summary. Attackers craft malicious transactions that look benign at the surface level but contain hidden operations: token approvals to attacker-controlled addresses, unexpected contract interactions, or fund transfers disguised within multi-step operations.
The industry has attempted to make transactions readable with simulation services and transaction decoders. These approaches typically require the wallet to trust a third-party service without a way to verify which code the service ran or that the result came back unmodified.
A transaction parser needs two guarantees:
VisualSign Parser is an open source Rust codebase developed by Anchorage Digital. It converts raw blockchain transactions into structured, human-readable JSON. As of this writing, it supports Ethereum and its layer 2 networks (L2s), including Arbitrum, Optimism, Base, and Polygon. It also supports Solana, Sui, and Tron, with additional chains in development.
Consider a Uniswap Universal Router transaction: the uniswap-v2swap.input fixture in the visualsign-parser test suite is 2,470 characters of raw hex. VisualSign turns it into a clear hierarchical breakdown: a Permit2 approval, a V2 swap with specific token amounts and minimum outputs, a fee payment, and a WETH unwrap. Each step lists explicit addresses, amounts, and expiration dates.
The collaboration between Anchorage Digital and Turnkey began after Turnkey published its whitepaper in January 2025. The whitepaper details how Turnkey uses AWS Nitro Enclaves to secure wallets and private keys at scale. Turnkey has detailed this implementation and AWS architecture in the post Building secure, verifiable blockchain key management on AWS Nitro Enclaves at Turnkey.
Anchorage Digital now uses Turnkey Verifiable Cloud (TVC) to outsource computation verifiably. Rather than running transaction parsing logic in its own infrastructure, Anchorage Digital deployed VisualSign Parser within Turnkey-deployed AWS Nitro Enclaves.
Anchorage Digital and Turnkey documented the full verification workflow in the Wallet Integration Guide so that other wallet providers can use VisualSign Parser in the same way.
With VisualSign Parser, crypto wallets, typically limited in their ability to run complex logic, can verifiably parse complex cryptocurrency transactions. This helps prevent phishing attacks that rely on users approving signatures for malicious transactions without understanding them.
Beyond VisualSign, TVC supports running any high-trust workflow inside verifiable, isolated infrastructure, including policy evaluation, compliance checks, and transaction classification. You can now build with cryptographic proof instead of relying on trust for your most sensitive operations.
The following diagram shows how a parsing request travels from the wallet client to the enclave and back, and where attestation enters the flow.
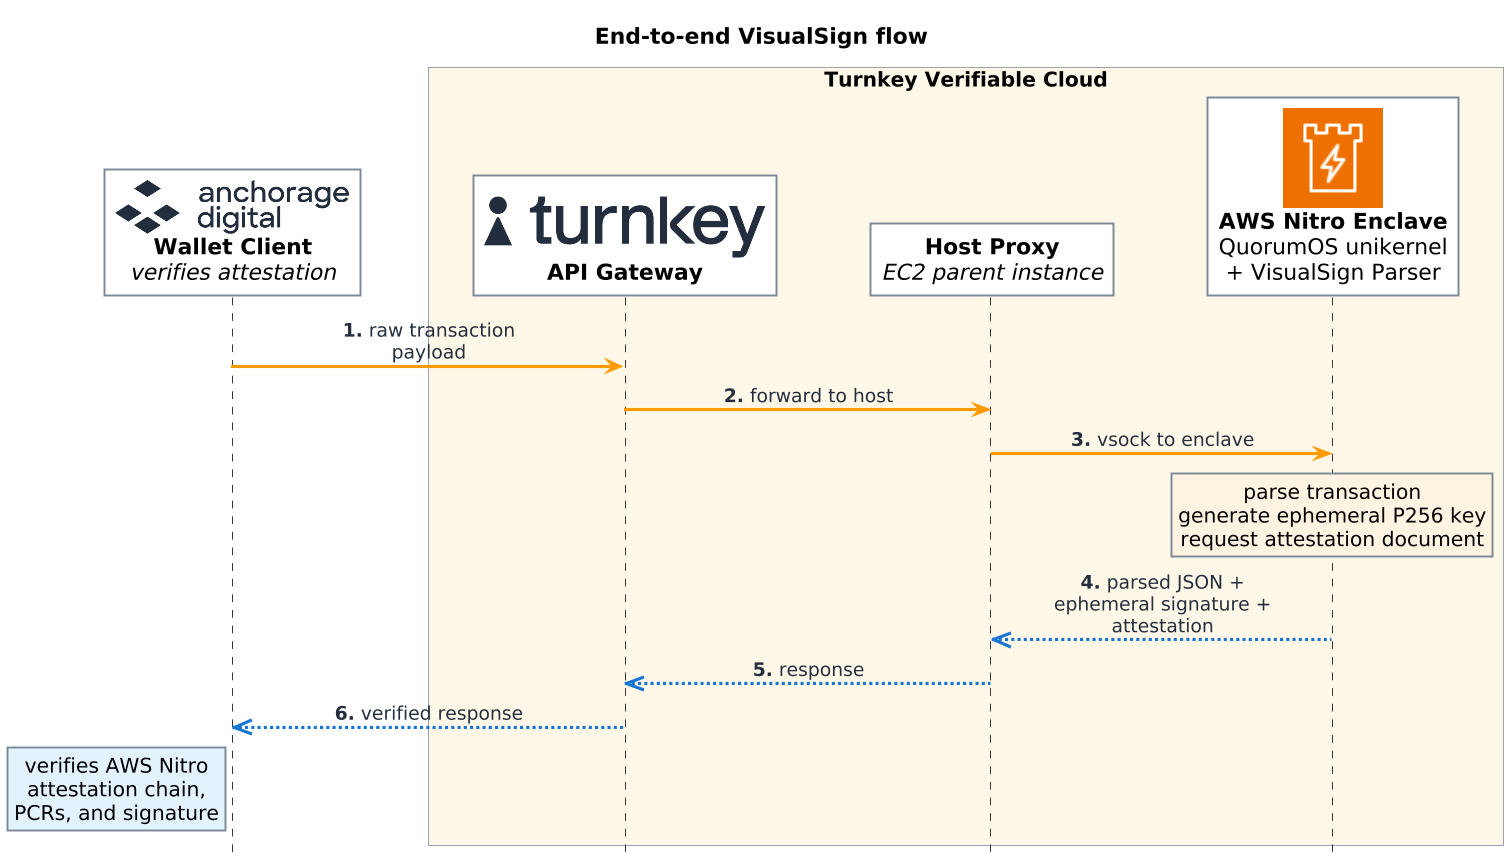
Figure 1: End-to-end VisualSign flow
The flow works as follows:
Anchorage Digital doesn’t need to trust Turnkey: ephemeral key signatures and AWS Nitro attestation documents prove that enclaves are provisioned with the correct software. The attestation document contains Platform Configuration Registers (PCRs), which are cryptographic measurements of the enclave image, kernel, and application. The wallet client compares PCRs and other attestation fields against the values derived from reproducible builds. Reproducible builds compile the same source code into byte-identical binaries every time, regardless of who runs the build or where. Because the binary is always identical, its PCR measurements are deterministic, so the trusted values stay constant across rebuilds and verification policies never need to be updated. Reproducibility allows any party to independently verify that the enclave runs the expected QuorumOS version, as well as the exact, unmodified VisualSign Parser code.
AWS Nitro Enclaves provide several properties that are essential to this architecture:
vsock channel. No persistent storage, no network interface, no DNS, no metadata service.These properties make Nitro Enclaves well-suited for workloads where the computation itself must be verifiable: not only the inputs and outputs, but the guarantee that a specific, known program produced the result.
Attestation verification in production is difficult to implement correctly. The attestation document specification is a CBOR Object Signing and Encryption (COSE) Sign1 structure whose payload carries an X.509 certificate chain, PCR measurements, and optional fields such as UserData and PublicKey. Correct verification means parsing CBOR, validating the COSE signature, and walking the certificate chain back to the AWS Nitro root certificate. It also means checking expiration and comparing PCR values, with clear error handling at each step.
Anchorage Digital built and open-sourced awsnitroverifier, a Go library for validating AWS Nitro Enclave attestation documents with complete chain-of-trust verification. The team designed it to address the gaps they encountered while building the VisualSign verification workflow. The library implements built-in PCR validation and separates parsing errors from validation failures, instead of leaving that to the caller. Handling it in the library makes the cause of an error easier to determine. The library’s clear two-tier error handling separates malformed input (err != nil) from validation failures (result.Valid == false). Each validation failure includes a specific, actionable error message (PCR mismatch, expired certificate, chain verification failure) rather than a generic “verification failed.”
The library also gives direct access to the UserData, PublicKey, and Nonce fields, the root certificate fingerprint, and chain trust status to validate the Nitro Enclave used for the request. The library comes with tests covering the verification package. Developers also have the option to write continuous integration and continuous delivery (CI/CD) tests without having to spin up a Nitro Enclave by using offline/test mode. There’s also an included migration guide for users currently using nitrite, a widely used open-source AWS Nitro Enclave Go attestation library.
On top of awsnitroverifier, Anchorage Digital built and open sourced visualsign-turnkeyclient, a Go client that performs end-to-end verification of transactions parsed in Nitro Enclaves. The awsnitroverifier library handles the low-level attestation document validation. The Turnkey client adds the application-level workflow.
You can adopt the verification levels in increasing order of complexity:
This layered approach separates a focused attestation library from an application-level client, so you can build non-blockchain use cases on Nitro Enclaves by excluding blockchain-specific dependencies.
VisualSign is a blockchain product, but the infrastructure underneath it isn’t. Turnkey and Anchorage Digital built that architecture on reproducible builds, enclave-hosted computation, and attestation-gated access. It’s a general-purpose pattern for any scenario where you need cryptographic proof that a specific program processed specific data. Without the blockchain specifics, the architecture provides a verifiable compute building block.
The key insight from Anchorage Digital’s implementation is that an enclave attestation document can serve as an access credential. Rather than granting access to sensitive resources based on network identity, API keys, or operator trust, the system grants access based on proof of what code is running. The principle is keeping the computation away from the sensitive data and using attestation to bridge the gap.
At Anchorage Digital, hardware security modules (HSMs) protect sensitive key materials. The VisualSign Parser runs in a separate Nitro Enclave, and the HSM grants access based on verified attestation, not based on trusting the network, the operator, or the host machine. The Anchorage Digital engineering team’s philosophy is that this pattern applies to any application that handles sensitive information or uses third-party libraries. The goal is to keep the computation away from the sensitive data. The following diagram shows the generalized form of the pattern. An untrusted input enters an enclave-hosted application, the enclave returns a signed bundle with an attestation document, and the HSM releases key material only after that attestation is verified.
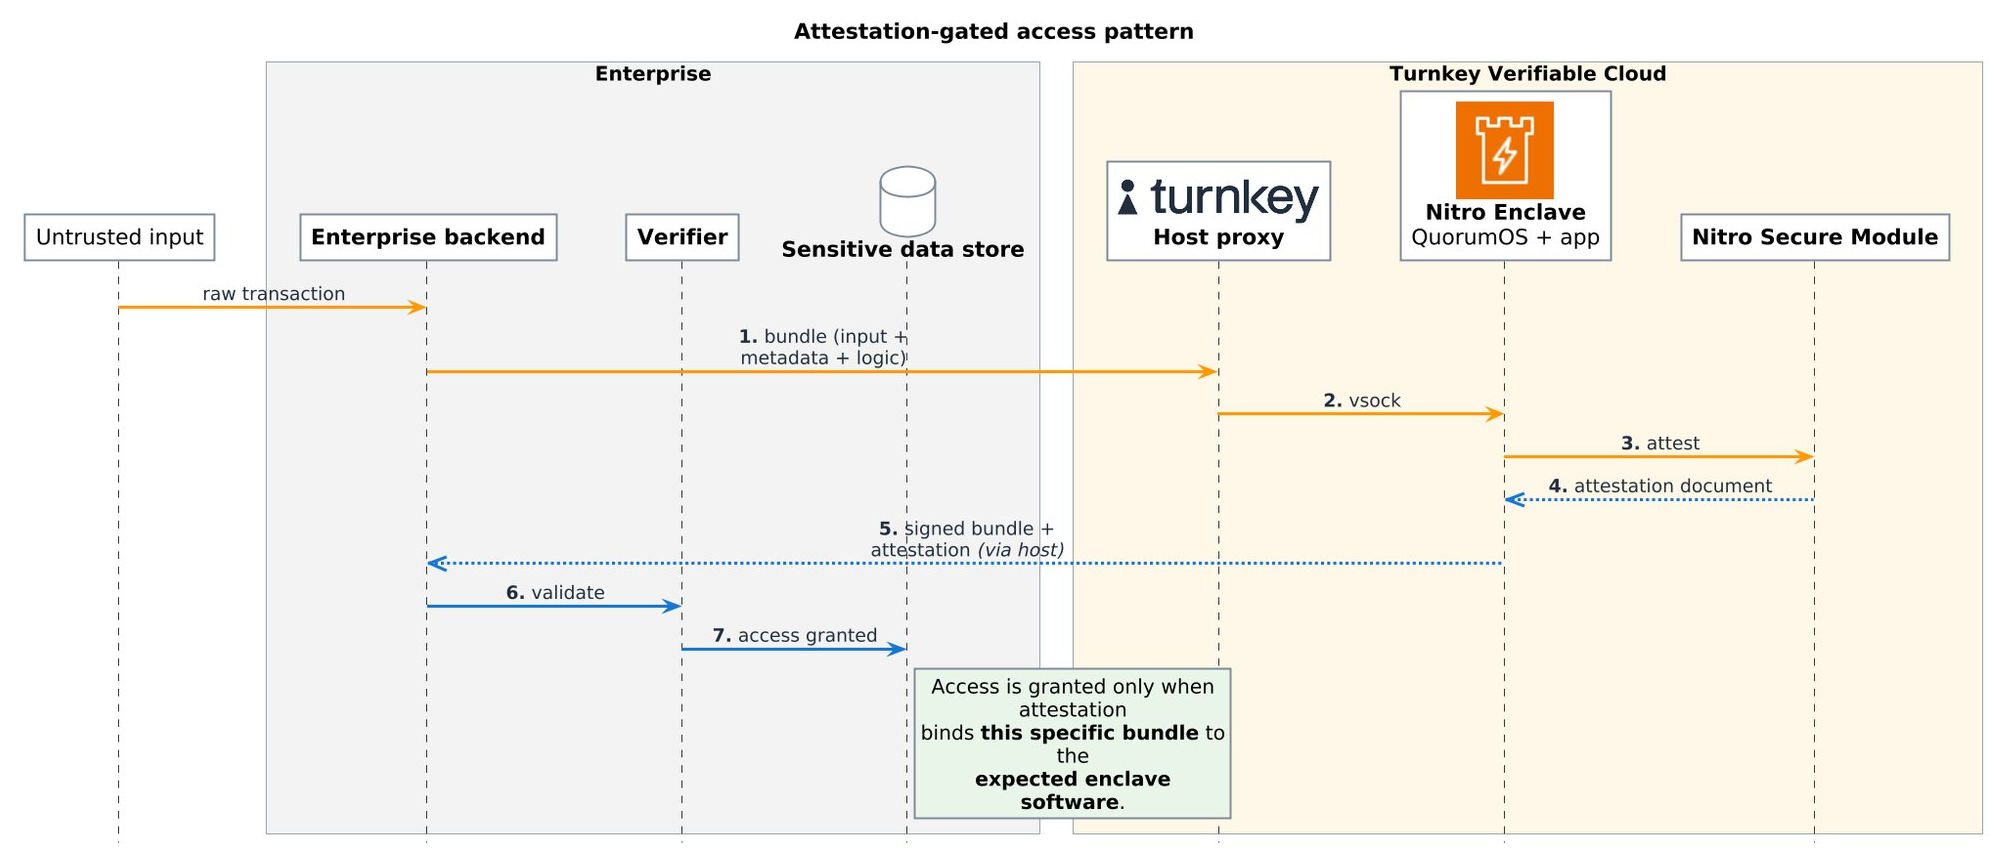
Figure 2: Generalized attestation-gated access pattern
Several non-crypto workflows fit this pattern. A financial institution can run sanctions screening or anti-money laundering (AML) checks inside a Nitro Enclave built from a reproducible image. This produces cryptographically verifiable proof that the exact audited screening software processed the data. A healthcare provider can run a diagnostic model against patient data inside an enclave that has no persistent storage and no network access. Attestation confirms that the approved model binary ran, and the model operator has no path to copy the data out. Any application that relies on third-party libraries for sensitive operations can run that code inside an enclave with a pinned, reproducible build.
This architecture also supports an organizational separation of concerns that maps naturally to team expertise. As Anchorage Digital describes it: “someone with expertise in evaluating blockchain transactions uses first-party blockchain tools to vet them, while the team managing sensitive data focuses on verifying correct validation and applying policies.”
In practice, Anchorage Digital splits ownership of the system between two teams:
Neither team needs to operate in the other’s domain. The blockchain team doesn’t need access to key materials. The security team doesn’t need to understand Solana’s account model. The Nitro Enclave attestation serves as the machine-verifiable contract between the two teams that says, “This exact code ran, and here’s the proof.”
In this post, we showed how Anchorage Digital and Turnkey use AWS Nitro Enclaves to run the open source VisualSign Parser inside an attested enclave, so wallets can cryptographically verify which code parsed a transaction. The collaboration between Turnkey and Anchorage Digital started with a specific problem: making crypto transactions human-readable with cryptographic proof of correctness. What they built applies well beyond blockchain. The architecture pattern of reproducible builds, enclave-hosted computation, and attestation-gated access can serve as a general-purpose building block for verifiable compute.
To get started building verifiable applications, the VisualSign ecosystem and its underlying verification tooling are fully open source. Follow the documentation to spin up AWS Nitro Enclaves for your sensitive workloads that require cryptographic attestation. Use the awsnitroverifier Go library to implement AWS Nitro Enclave attestation validation. For blockchain applications, the VisualSign Turnkey Client and Wallet Integration Guide handle end-to-end attestation validation and wallet integration.
If you want to run your own workloads on Turnkey Verifiable Cloud, TVC is in private beta as of this writing. To get a more in-depth understanding of how Turnkey architected this solution, refer to the post Building secure, verifiable blockchain key management on AWS Nitro Enclaves at Turnkey.
Post Syndicated from Shannon Brazil original https://aws.amazon.com/blogs/security/part-3-cybersecurity-journeys-the-work-behind-the-work/
The most important work I’ve done in cybersecurity would make for terrible television. There were no countdown clocks and no frantic typing, just a lot of careful reading, a lot of hard conversations, and the occasional quiet moment where everything finally clicked. That’s the part I want to show you this week, because the three people I talked to have built their entire careers on the work that happens off-camera, and it’s the part that decides who lasts in this field.
This is a four-part series following 11 AWS security professionals through the real stories of how they got here and what the work actually looks like. In Part 1: I didn’t plan this, I shared how three of them found their way in, and in Part 2: What even is this job?, we looked at roles most people don’t know exist. This week is about what the day-to-day actually feels like, told through three AWS security professionals whose work rarely makes it into the trailer but is the reason any of it holds together.

Brandon Caldwell, Mgr, Security Engineering
Ask most people to picture an application security engineer at work and they’ll imagine someone hunched over a terminal breaking into systems. Brandon Caldwell‘s actual days (reviewing software while it’s being built so the flaws never ship) look almost nothing like that. He spends them in conversation: sitting with the engineers who built a product, walking through how it works, and asking question after question until he understands it well enough to see where it could break. “This job is at least 50 percent people,” he tells the folks he hires. “You have to people a lot.”
The hardest part of the day isn’t technical, it’s human. Brandon’s team has to hand builders news they don’t want to hear, and he’s blunt with new hires about what that really feels like.
“Our job is to go tell someone their baby is ugly. I use that phrase because it is meant to draw out empathy. This is the thing they love and spent time on, and you show up at the end and say that thing is ugly. Of course they are going to react.” – Brandon Caldwell
Learning to deliver that message without crushing the person across the table is, in his telling, the actual craft of the job. It’s why he prizes empathy, and why he says the engineers who struggle most in application security are the ones who got into tech specifically to avoid talking to people. The rest of the day is the patient, unglamorous work of reading someone else’s code closely enough to find the one flaw they didn’t know they’d left, then explaining it in a way that lands as help rather than judgment.
That explaining is more than a conversation. So much of security work gets written down: the finding documented so an engineer can act on it, the advisory that tells customers what to do, the policy that sets the bar for everyone who comes after. The ability to write clearly, to turn something messy and technical into a few sentences a reader can actually use, is one of the quiet differentiators as you move up in this field, and it’s a skill worth building long before anyone asks you to.
None of this is where Brandon started. He’s been curious about breaking things since he was a kid hex-editing the game Doom for unlimited ammo, taught himself reverse engineering (taking apart finished software to understand how it works) before it had a name, and spent years as an IT admin and then in incident response at Microsoft back when cybersecurity barely existed as a job title. What pulled him off the breaking side was noticing—after watching the same handful of mistakes scroll past again and again (things like SQL injection and cross-site scripting, two of the most common ways attackers exploit a poorly built website)—that he’d rather help teams avoid the break-in than perform it. Application security, he says, is his natural place.
As for breaking in yourself, Brandon’s advice follows straight from how he spends his days: practice interviewing and asking the right questions and spend real time around builders so you understand what goes into the thing you’re critiquing. When he hires, certifications are the last thing he looks at; he wants to see capture-the-flag competition results (hacking contests where you solve security puzzles to earn points) and public GitHub projects, because those prove you’ve done the work. Build something, break something, and get comfortable talking to the people who build.

Kurt Heath, IT Support Associate
Kurt Heath‘s chosen corner of the work is offensive security: penetration testing (getting paid to legally break into systems to prove where they’re weak) and, eventually, red teaming. The day-to-day of getting good at it is far less cinematic than the label suggests. It’s hours of hands-on practice against deliberately vulnerable targets, reading about a technique and then trying it until it works, and the slow accumulation of the layers the job actually rests on: operating systems, networking, software development, and security fundamentals, all applied at once. He’s the first to say pen testing is “the sexy thing” that gets advertised, and the first to warn that it shouldn’t be anyone’s first stop, because of how much quiet groundwork sits underneath it.
A big part of his real workday now is deciding how, and how much, to lean on AI. Kurt treats it as a tool rather than a crutch: he uses it as a coding assistant when he has to work in an unfamiliar language, and to sort through large volumes of information quickly, but he won’t let it think for him. He still fills out forms like this blog’s questionnaire by hand, keeping a personal touch on his own work, and he’s wary of letting AI pull the trigger during an engagement, since an overzealous tool can act on a network however it sees fit, cause unintended operational damage, or wander out of scope and create a legal problem. The way he sees it, security is fundamentally a human problem: automation keeps getting better at the systematic parts, but thinking outside the box the way an attacker does stays stubbornly human.
How Kurt got here matters less to the day-to-day than how he keeps going, but it’s worth knowing that he’s largely self-taught. After a community college program didn’t work out, he taught himself from scratch, finishing shifts at an auto plant and then spending nights with YouTube and a search bar learning how computers and networks actually worked. The hardest part, he told me, was self-motivation, and what carried him through was a mix of sheer want and, eventually, other people: the friends and community he found in Discord servers, security podcasts, and interest channels who helped him turn raw drive into real focus. He even got a tattoo as a reminder that there is no plan B.
“There is no other option. There’s no what if. This is it. This is life now, and I’ll figure it out some way, somehow, no matter how long it takes.” – Kurt Heath
If you’re drawn to the same offensive work, Kurt’s advice is to resist starting there. Build the foundation first, often through a role like a security operations center, join the communities where people are learning in the open, and let the flashier work come after the groundwork is solid. Progress in this field—in his experience—is measured less by the title you land than by how much you grow and who you grow alongside.

Seth Jeacopello, Mgr, Security Engineer
Seth works in application security too, but if Brandon’s days are mostly about people, Seth’s are mostly about code, which makes the two of them a useful picture of how differently the same job can look. When Seth Jeacopello gets stuck on a hard problem, he doesn’t stare at it harder, he picks up a lock. An actual physical lock with pins and tumblers, because he’s a serious lock-picking hobbyist, and over the years he’s learned that the best response to hitting a wall is to set the problem down and pick what he calls a comfort lock, one he knows well and can open easily. It isn’t about the lock; it’s about giving his brain a small win so he can return to the hard thing with fresh eyes.
The comfort lock exists because Seth’s actual day-to-day is easy to get lost in. In application security, a big part of the job is reading enormous amounts of someone else’s code looking for the one flaw that matters, and as a lifelong developer he genuinely loves reading code, which is exactly what makes it a trap. He described the pull of it to me: you convince yourself the vulnerability is just behind the next function, and the next, and suddenly two days are gone. The skill he’s spent decades sharpening isn’t finding things, it’s knowing when deep enough is deep enough and when to step back, which is where the lock comes in. After 26 years, the meta-skill of managing his own attention is as much a part of the craft as anything technical.
That longevity goes back a long way. Around 1999, still in his teens, he landed a software quality assurance internship, was hired as a developer by 17, and gravitated toward the security-flavored work from the start before moving into network security tooling, rising to chief architect and then chief technology officer along the way.
“We’re like three or four guys off the street coming in with a product, and this huge company was like, yeah, you three, go for it. That was probably one of the coolest things.” – Seth Jeacopello
His advice for building the instincts the daily work demands is refreshingly concrete: set up a deliberately vulnerable practice machine, break into it, and then go read the logs it generated, so you learn not just how an attack works but what it looks like from the defender’s side. That single exercise builds both the offensive and the investigative muscle at once, and it’s the kind of patient, repeatable practice that the day-to-day of this field actually rewards.
There’s a version of cybersecurity that makes for great television, fast-paced and full of eureka moments, and those moments do exist. But the three people I talked to this week live in a different version of the field, one built on patience, repetition, and a kind of stubborn care that doesn’t photograph well. For Brandon, the real work is the hard, human conversation of telling a builder their work is flawed without making an enemy of them. For Kurt, it’s the unglamorous hours of hands-on practice and the discipline to use AI as a tool without letting it think for him. For Seth, it’s reading one more page of code and knowing when to stop, with a comfort lock on the desk for when he can’t.
None of that makes a great action sequence, but all of it is what a security career actually looks like, and the good news for anyone starting out is that these are learnable habits, not inborn talent. Notice how much of the real work is human: empathy, patience, judgment, and knowing how your own mind works. The analytical, interpersonal, and self-management skills you already have are not a consolation prize, they are part of the job. If you want to begin building the rest, here are a few places to start:
And if you want to build cloud security skills specifically, AWS has free and hands-on resources to help you start:
In Part 4: What I’d tell myself, we close the series with the advice and hard-won lessons these professionals would hand to someone just starting out.
Doing the work behind the work? These three want you to know it counts. Share your story on LinkedIn!
Post Syndicated from Matt Granger original https://www.youtube.com/watch?v=T6Q6QnPWKZc
Post Syndicated from LastWeekTonight original https://www.youtube.com/shorts/EMV7E5J_iwU
Post Syndicated from Celso Martinho original https://blog.cloudflare.com/php-ctf/
Update — October 30, 2026: Thank you to everyone who has participated in the PHP Capture the Flag challenge. We have received a strong response from the security research community, and the submissions have helped us harden our existing php2shell WAF protections and create new detections.
Details of managed-rule changes are available in the Cloudflare WAF changelog.
The CTF remains open. We encourage researchers to continue submitting materially distinct, reproducible bypasses through the Cloudflare HackerOne program. We will share further information and feedback as the challenge progresses. Thank you again for your contributions.
Last week was one for the Internet security history books. First, eight eMudhra intermediate certificates were compromised, creating the possibility of forged certificates that could be used to impersonate servers. Then came php2shell: serious vulnerabilities in PHP, the runtime behind a large portion of the Web.
Cloudflare worked around the clock as these events unfolded to protect our customers and help protect the Internet. We shipped client updates and multiple mitigations, updated our web application firewall (WAF) with new rules to block attackers from exploiting the PHP vulnerabilities, and introduced a new feature called full transaction detection.
As always in situations like this, these new capabilities were made available on all plans, including Free.
Protecting systems from vulnerabilities like these is always an ongoing process, not a one-time event. The widespread adoption of AI allows attackers to discover new vectors with unprecedented speed and efficiency, so collecting real-world data to test our assumptions and strengthen defenses is essential.
That’s why today we're launching the Cloudflare PHP Capture the Flag challenge, run through our Bug Bounty program. We've put a deliberately vulnerable PHP installation behind our WAF, and we're inviting security researchers on HackerOne to try to bypass the protections and capture a flag.
We are keeping this simple. The challenge focuses on CVE-2026-109618 and CVE-2026-109619, the two PHP vulnerabilities behind php2shell. The target runs stock PHP 8.5.11 (with standard PHP extensions), Apache 2 (via mod_php), and an empty index.php inside a Cloudflare Container, with our default WAF protection rules for these vulnerabilities enabled in front of it. Inside the sandbox is a file called /flag.
The sandbox is reset every few minutes, including the flag file.
Your mission, should you choose to accept it: bypass the WAF protections, exploit the PHP sandbox, and recover the contents of /flag. You can use your own research tools. The challenge page has the environment details, scope, and flag verification form.
This limited-time challenge is run via Cloudflare's Bug Bounty program on HackerOne. All aspects of this challenge are subject to HackerOne terms and the Cloudflare HackerOne program rules the (“Bounty Terms”). If you find an eligible bypass, you must follow these requirements in order to claim the bounty:
UI verification does not submit a HackerOne report or establish reporting priority. File disclosure without RCE, RCE without successful flag recovery and UI verification, local-only exploits, rediscovery of the known PHP vulnerabilities, and WAF detection differences or partial chains without the full objective are not eligible.
Awards require a materially distinct Firewall (WAF) bypass method, even for the same PHP CVE. Reports using the same Firewall-bypass mechanism are duplicates, regardless of differences in the PHP exploit, payload, RCE technique, or flag-recovery method. New flags, resets, attempt IDs, or cosmetic changes—including equivalent encodings—do not qualify as unique. Equivalent submissions are duplicates even if unfixed; only the first complete, reproducible HackerOne report is considered. Cloudflare makes final duplicate and reward decisions.
We record attempted metadata and request payloads to help analyze reports, so please use test data only. Do not send credentials, personal information, or anything else you would not want included in a research record. Read Cloudflare’s privacy notice before testing.
Testing is authorized only against the challenge hostname's WAF-protected /php/* endpoints (POST method only). Other Cloudflare services, direct access to the underlying infrastructure, the upstream PHP project, and third-party systems are out of scope. No denial of service, high-volume scanning, persistence, social engineering, or attacks on other participants. If you get a 429 or 503, back off.
In the event of any conflict between this blog post and the Bounty Terms, the Bounty Terms shall prevail.
Cloudflare reserves the right to suspend or terminate this challenge at any time. Once the competition is removed from HackerOne, it is officially terminated, so please refer to the Cloudflare HackerOne page for the most up-to-date information on whether this challenge remains open.
Our WAF protects you, but it is not a replacement for fixing vulnerable software. Response blocking can prevent exposed data from reaching an attacker, but it cannot undo actions already performed at the origin. If you run PHP, follow the latest PHP security advisories and apply the relevant updates.
Last week was a reminder that helping build a better Internet often takes many people—researchers, maintainers, and teams across the industry—doing difficult, urgent work together.
We hope this challenge gives everyone a useful way to join in. Head over to php-rce.cloudflare.app if you want to participate: the flag is there, and we'd like to know if you can get it.
Post Syndicated from Lai Yi Ohlsen original https://blog.cloudflare.com/q3-2026-internet-disruption-summary/
The Internet can feel invisible when everything is working normally. But when connectivity breaks, the many systems it depends upon become evident in an instant. Because Cloudflare’s global network handles more than 20% of the web’s traffic, it offers a unique perspective of how Internet traffic is behaving. When failures in infrastructure, power, policy, or security disrupt access to the Internet, Cloudflare Radar can observe the impact by monitoring traffic to our customers. Each quarter, we review the disruptions detected and annotated on Radar, highlighting what happened, where it happened, and the broader conditions that shaped each event.
In this post, we examine the major categories of Internet disruptions observed during the third quarter of 2026, including government-directed shutdowns, power outages and natural disasters.
Between July and September, Internet disruptions were largely driven by failures in the systems the Internet depends on. Power grids failed in Cuba, Honduras, Guam, Ukraine, and several other countries. Natural disasters damaged electricity and telecommunications infrastructure from Nepal to Colombia. Government-directed shutdowns remained the most frequent source of disruption, driven largely by exam-related shutdowns in Iraq, while renewed conflict in Ethiopia’s Tigray region showed how quickly connectivity can become part of a broader political and humanitarian crisis. Outages within the United States, Japan, and Portugal — countries with a relatively strong history of Internet resilience — remind us that no country is immune to disruption.
In total, Cloudflare Radar recorded 49 disruptions during the quarter. Government-directed shutdowns accounted for 19 incidents, including 18 exam shutdowns in Iraq. Power outages followed with 14 incidents, while natural disasters accounted for five.
The Internet is designed to be distributed and resilient, but that resilience still depends on electricity. When power fails, routers, mobile base stations, data centers, interconnection facilities, and the networks that connect them can fail with it. Over the past three months, that dependency was one of the clearest patterns in Radar’s disruption data. Power outages were the second-most common cause of disruptions by incident count this quarter, behind government-directed exam shutdowns.
In Cuba, Internet disruptions followed the erratic patterns of an unstable power grid. Radar observed four power-related outages across the quarter, meaning connectivity was affected by grid failures at least once a month. The outages took place July 6, July 14, August 3, and a three-day blackout from September 18 to 20. The traffic volume decreases ranged from 18% on July 14 to 59% on August 3.
Honduras illustrated how a localized infrastructure failure can produce national-level effects. A power failure on September 10 at an interconnection facility affected at least 11 major providers, showing how concentrated traffic exchange points can become single points of failure. The outage lasted approximately three hours, during which HTTP traffic across the country fell by 63%.
Two notable exceptions were the cross-border provider Telecomunicaciones de Guatemala (AS14754) and mobile carrier Celtel (AS52262), which were unaffected. This suggests that their Honduran connectivity may rely more heavily on infrastructure outside the country.
Cloudflare Radar – Traffic volume by autonomous system
On July 5, a power outage in Sevastopol, Ukraine, caused an eight-hour blackout, with HTTP traffic dropping by 98%. A little over a month later, on August 12, drone strikes targeting energy infrastructure caused another power outage, resulting in a ten-hour Internet disruption and up to a 95% decline in traffic volume. As discussed in more detail below, geopolitical conflict remains a major driver of Internet disruptions. These incidents also show how conflict, energy infrastructure, and Internet connectivity are fundamentally intertwined.
Cloudflare Radar – HTTP traffic
Cloudflare Radar – HTTP traffic
Also of note: on August 13, a cooling system failure at a data center in the U.S. city of Phoenix caused a near-total drop in Internet traffic from Namecheap (AS22612). Outages such as these will be important to watch as the role of cooling systems becomes increasingly critical.
Beyond the larger outages in Cuba, Honduras, and Ukraine, power-related disruptions also appeared across a wide range of countries, including Eswatini, Botswana, Tajikistan, Kenya, Saint Lucia, Georgia, and Gabon. Some of these events were caused by sudden failures, while others, such as planned load-shedding in Eswatini, reflected deliberate efforts to manage constrained power supply. Their scale and duration varied, but together they point to the same underlying dependency: when power systems become unstable, Internet connectivity often becomes unstable with them. In total, Radar observed 14 power-related disruptions across 10 countries during the quarter.
Last quarter, Radar reported on the impact of Super Typhoon Sinlaku, as it moved through the Mariana Islands, knocking out power and, in turn, Internet connectivity in Guam, where HTTP traffic took four days to return to typical levels.
Super Typhoon Bavi followed Sinlaku by less than three months, giving Guam two major storm-related connectivity disruptions in a single year. Officials appeared to take earlier preparedness steps ahead of Bavi, including declaring a state of emergency before peak storm conditions. Even so, the storm caused widespread power outages. The Guam Power Authority reported that strong winds brought down key transmission lines, leaving only about 25% of distribution feeders online at one point. From a connectivity perspective, the outcome was familiar: widespread power outages, downed transmission lines, and a multi-day recovery period for Internet traffic.
Cloudflare Radar – HTTP traffic
In Japan, an earthquake of similar magnitude, 7.1, prompted evacuation orders affecting roughly 150,000 people in Kumamoto. The impact on Internet connectivity primarily appeared in desktop traffic, while mobile traffic remained largely unaffected.
Cloudflare Radar – HTTP requests time series for Kumamoto, Japan
In Colombia, a magnitude 7.4 earthquake in August caused building collapses, injuries, mass evacuations, and a four-and-a-half-day Internet disruption. Damage to fiber-optic infrastructure, compounded by the wider earthquake aftermath, drove a significant drop in traffic from Colombia Telecomunicaciones (AS3816).
Cloudflare Radar – HTTP traffic
Finally, in Nepal, sudden flash floods swept through the Bhote Koshi and Trishuli river systems on August 26, affecting communities across Rasuwa, Nuwakot, and Dhading districts. The flooding damaged homes, infrastructure, and essential services, including power, which in turn disrupted regional Internet connectivity. The outage recorded on Radar lasted two hours, during which HTTP traffic dropped by up to 18%.
Cloudflare Radar – HTTP traffic
Government-directed shutdowns were the largest cause of disruptions in Q3, the majority of which occurred in Iraq with separate scheduled shutdowns occurring throughout the quarter. The shutdowns took place on a strict schedule 03:30–04:00 UTC, lasting about 15-90 min each. The majority occurred between August 26 and September 28, with three occurring between July 1 and 8.
Cloudflare Radar – HTTP traffic
Per Internet Society Pulse, “In a video message, Minister Mustafa Sanad, Iraq's Minister of Communication, confirmed the shutdown and vowed to develop a digital system that would eliminate the need for centralized exam distribution and, by extension, the need to shut down Internet access on exam days.” Cloudflare Radar will continue to monitor the country’s networks as the development of the new system progresses.
Notably, Syria and Sudan, two countries that have also frequently used exam-related Internet shutdowns in recent years, did not record similar disruptions this quarter. However, this likely reflects differences in exam calendars rather than a clear shift in policy. Radar will continue to monitor whether future national exam periods bring renewed shutdowns in either country.
In Ethiopia, renewed conflict in the Tigray region was accompanied by a government-directed Internet shutdown that lasted 10 days. Traffic dropped by 100%, signaling a full-scale shutdown.
Cloudflare Radar – HTTP traffic
The disruption revived memories of the extensive blockade imposed during Ethiopia’s civil war from 2020 to 2022, when Tigray was largely cut off from telecommunications, electricity, banking services, fuel, and humanitarian aid (France24), which the World Health Organization described as a “de facto blockade.” Although this latest outage appears to have remained localized to Tigray, its impact was still visible in country-level traffic, with HTTP traffic falling by up to 30%.
Cloudflare Radar – HTTP traffic
On September 19, during nationwide elections, fiber-optic cable damage in Russia’s Far East caused regional connectivity disruptions affecting Chukotka, Magadan Oblast, Kamchatka Krai, and Sakhalin Oblast. Rostelecom described the incidents as deliberate damage to backbone fiber lines and said connectivity was restored using backup channels. Radar data alone cannot determine whether the cable damage was related to the elections, but the timing is notable.
Cloudflare Radar – HTTP traffic
Cloudflare Radar – HTTP traffic
Cloudflare Radar – HTTP traffic
Across Q3 2026, government-directed shutdowns were the most frequent source of disruption, driven largely by Iraq’s exam-related shutdowns. Power outages were close behind, affecting networks across Cuba, Honduras, Ukraine, Eswatini, Botswana, Tajikistan, Kenya, Saint Lucia, Georgia, and Gabon. Natural disasters and conflict added another layer of disruption, reminding us that Internet resilience depends on far more than routers and cables. It depends on electricity, physical infrastructure, policy decisions, and the ability of networks to route around failure.
Radar also observed outages inside individual networks, including One Communications (AS19863) in Guyana following a cable cut, MEO (AS3243) in Portugal following a reported “mass attack”, Digicel Haiti (AS27653), TurkNet (AS12735) in Turkey, and Fanap Telecom (AS206065) in Iran.
Each of these events demonstrates the Internet’s fragility, but also its resilience. Many disruptions were brief: 14 saw traffic return to typical levels in under an hour, and 16 recovered in less than three hours. But short outages can still have real consequences for the people affected, especially during storms, earthquakes, conflict, or political unrest. Access to the Internet is often access to information, coordination, safety, and help.
Cloudflare Radar will continue to monitor Internet disruptions around the world and share what we see from Cloudflare’s global network. Follow Cloudflare Radar on X @CloudflareRadar and Bluesky @radar.cloudflare.com for updates.
Post Syndicated from The History Guy: History Deserves to Be Remembered original https://www.youtube.com/watch?v=3u9qNJAKVzU
Post Syndicated from Bruce Schneier original https://www.schneier.com/blog/archives/2026/10/hiding-capabilities-in-ai-models.html
Interesting research: “AI Models Can Provably Hide Arbitrary Capabilities”
Abstract: Capability evaluations aim to surface dangerous model behaviors before deployment, but their reliability depends on the assumption that hidden capabilities can be elicited. We show this assumption does not hold under adversarial conditions by constructing backdoor attacks that embed encrypted neural networks within host model weights, decrypting and executing them only upon receiving a secret trigger. Using digital lockers, these hidden circuits remain provably hard to elicit and interpret under cryptographic assumptions, even given full access to model weights, extending prior work from hiding fixed strings to arbitrary computations. We implement our proof of concept constructions in PyTorch and evaluate elicitation through fine-tuning, weight noising, gradient-based trigger search, and latent adversarial training, using a small chemical reaction prediction task as a proxy for CBRN-relevant capabilities. Our results demonstrate resistance to these methods and, together with our cryptographic guarantees, reveal a limit of elicitation-based capability audits. We release our models to support the improvement of defenses.
Post Syndicated from Kevin Flansburg original https://blog.cloudflare.com/kv-cache-exposure-remediation/
On September 8, 2026, we were alerted by a security researcher, Gadi Evron from Knostic, to a tenant isolation issue affecting the GLM-5.3 Workers AI model (@cf/zai-org/glm-5.3) starting on August 27, 2026. We have remediated the issue, and we restored the model on September 9. We have confirmed that no other model hosted on Workers AI was affected.
Between August 27 and September 9, a small number of customers using the GLM 5.3 Workers AI model received responses that contained data from other customers' requests made to the same model shortly before theirs. In total, 155 responses were affected, all to prompts longer than 681,280 tokens.
After excluding our own testing and the researcher's, the requests we identified are consistent in timing and volume with ordinary long-context use, not with someone repeatedly exploiting the bug. We found no evidence of deliberate exploitation.
Today we are publishing this report alongside a post from SGLang, the open-source inference engine that we use, as a coordinated disclosure. This post describes the bug that caused this issue, our response timeline, and the subsequent hardening we have conducted on our production SGLang deployments. We also detail our continued efforts with the upstream maintainers of SGLang to address this and similar bugs.
GLM is a text generation model from Z.ai that is built for agentic coding workflows; it is one of the many models available through Workers AI. Gadi Evron submitted a report on September 8 through our HackerOne program stating that very long prompts sent to @cf/zai-org/glm-5.3 on Workers AI sometimes returned text that belonged to other users' sessions. Cloudflare reproduced the issue the next morning and took the model offline within 40 minutes of declaring an incident. We then deployed a corrected configuration and a patched inference engine, and restored service the same day.
This specific report of cross-request KV cache exposure was the result of two overlapping issues. The first was a misconfiguration of the open-source inference engine, SGLang, used by Cloudflare. We deployed GLM 5.3 with a 1,048,576-token context window, but the KV cache pool on our prefill GPUs only had room for 681,280 tokens. We were aware of this mismatch before launch. We expected the engine to return an error for any prompt it could not process, and our long-context tests returned successful responses, so we did not believe this to be an issue.
The second was a bug in how SGLang handled the resulting over-length requests in disaggregated prefill/decode mode. A prompt that did not fit the pool was internally marked as rejected and replaced with a one-token placeholder, but instead of aborting the request and returning a client error, prefill generated the KV cache for the placeholder prompt and transferred it to the decode node. The decode node received a "transfer complete" message and assumed that prefill overwrote the KV cache from previous requests with the full prompt for this request, when in fact it left the majority of the previous state intact. The decode node subsequently generated a response while attending over stale cache pages that still held data from earlier requests. As a result, responses to prompts longer than 681,280 tokens could contain data from other users' GLM 5.3 sessions.
After disabling the model, we took the following actions to correct this vulnerability before restoring public access to it:
To fix our configuration, we made the pool hold the full context. We adjusted our GLM 5.3 configuration to match our GLM 5.2 configuration, which freed enough GPU memory that the prefill KV pool now holds about 2.04 million tokens, roughly twice the 1,048,576-token context length. A prompt that fits the context window now always fits the pool, so the rejection path is never reached for a valid request. This alone prevents the bug from being exercised.
To fix the engine, we also made the rejection path safe. Relying on pool size alone is fragile: any change to quantization, tensor parallelism, CUDA graph sizes, or a future model version changes the pool size in a way that's easy to miss. Furthermore, there may be other situations in which the prefill scheduler can reject a request and trigger the same bug. To prevent this, we also patched the engine so that a request carrying a pending rejection is retired at the disaggregation admission queue, with its original error, before any bootstrap, allocation, or KV transfer happens. We proposed this upstream as #38704, which also had the decode node verify that the number of tokens transferred matches the number it reserved. The fix was already on SGLang main in #36988, merged September 6 for a related failure path but not yet released. The maintainers also merged #38935, which rejects these requests earlier, following our approach.
We validated both changes against the researcher's reproduction script and our own canary-marker tests before restoring the model.
Workers AI runs GLM 5.3 with SGLang in a disaggregated configuration: a pool of prefill GPUs processes the prompt and produces the model's KV cache for it, then hands that cache over remote direct memory access (RDMA), via Mooncake, to a pool of decode GPUs that generate the response. We have written about this architecture before in our posts on high-performance LLMs and smaller, faster, safer models.
The KV cache in GPU memory is a shared pool of fixed-size pages. Each request is assigned pages when it is admitted and releases them when it finishes. Pages are not currently zeroed between requests; the next request that gets a page simply overwrites it. This approach is common among inference engines and is necessary to achieve the best performance, but it means that the inference engine is responsible for tracking ownership of these memory pages. KV cache page ownership and lifetime tracking has to deal with not just shared ownership within a node (KV cache offload and token generation both access the memory with different lifetimes), but also ownership that is technically shared with the remote prefill node (which holds a simultaneous mutable reference to the page).
Furthermore, the size of this pool is not a configuration value. SGLang sizes it at startup from whatever GPU memory remains after loading the model weights. The model's advertised context length is a separate configuration value. Nothing forces the two to agree, and it is our job to check that they do.
On our GLM 5.3 prefill nodes with our configuration, the pool came to 681,280 tokens while the model's context length is 1,048,576 tokens. The selected KV pool size is printed by SGLang in logs during startup and exposed as a metric. We were aware of this size mismatch; however, during pre-launch testing we observed successful HTTP status codes and a streaming body with no error frames during benchmarking. We assumed that the engine was capable of gracefully handling the difference between the KV cache pool and requested context window via streaming or some other mechanism.
This was one critical gap in our testing: we only validated HTTP response codes and engine performance at long contexts, without validating model output and coherence. We now check KV pool size against context length directly, from the running engine, before any disaggregated deployment change ships, rather than inferring it from response codes.
In v0.5.21, the SGLang team has now addressed this bug in how it was handling prompts longer than the KV pool size. Here’s what was happening before.
When a prompt arrived that was longer than the KV pool could hold, SGLang's scheduler rejected it. The rejection path (Req.set_finish_with_abort) recorded the error to be returned to the client and swapped the prompt for a one-token placeholder so that the request could drain through the normal batch machinery without allocating real memory. On a single-node deployment this worked: the placeholder ran, the batch finished, and the client received an error.
In disaggregated mode such as we operate, the admission queues on both prefill and decode checked whether a request was finished, not whether it was rejected. A rejected request reported itself as live. So:
req.finished() was False. A rejected request stored its rejection in to_finish, not finished_reason, so finished() still returned False. The rejected request was admitted.finished() check, so it accepted the handoff.prompt_tokens matched the long prompt and the reply was coherent. It arrived faster than an 8-page prefill should take, and it contained content from other users' KV pages.Every request over the threshold behaved this way. This bug had been reported to SGLang by another user as issue #30233 on July 6, 2026, which Cloudflare noticed while investigating this incident. We had been flagging these types of issues with SGLang since v0.5.10 and this security incident sped up work that Cloudflare had already started in collaboration with the SGLang team. The patch for this issue was released in SGLang v0.5.20, with follow-ups in v0.5.21 and v0.5.22, and is available for all other operators dependent on SGLang to use. We highly recommend all operators update SGLang dependencies to v0.5.22 or later. For more details on specific PRs, read on below.
GLM 5.3 was the only model affected by this bug. Every other disaggregated deployment on Workers AI has KV pools larger than its context length on both prefill and decode, so no request could reach the rejection path. We have applied the engine fix and the hardening described below to every model we serve with SGLang, and our deployment checks require them for every new deployment.
All times UTC.
|
When |
What |
|
Aug 27, 2026 |
GLM 5.3 launched on Workers AI with a prefill KV pool smaller than its context window. The exposure was present from launch. |
|
Sep 8, 2026 – 23:11 |
Report received via HackerOne. |
|
Sep 9, 2026 – 08:00 |
Cloudflare begins verifying the HackerOne report. |
|
Sep 9, 2026 – 13:22 |
Security incident declared. Product Security reproduced the leak using two independent accounts within 25 minutes. |
|
Sep 9, 2026 – 14:00 |
After confirming the scope of the issue, GLM 5.3 was set to private. Requests return HTTP 400. Status page updated. |
|
Sep 9, 2026 – 14:35 |
Root cause identified as the prefill pool being smaller than the context length. Canary prefill node with a larger pool confirmed not susceptible. |
|
Sep 9, 2026 – 14:52 |
All prefill nodes rolled to the corrected configuration. |
|
Sep 9, 2026 – 19:04 |
Full deployment rebuilt with the corrected configuration plus a Cloudflare-authored engine patch that correctly returns errors for requests rejected by the prefill scheduler. Validated against the researcher's reproduction script. |
|
Sep 9, 2026 – 19:40 |
Model restored to public. |
|
Sep 10, 2026 – 23:30 |
Meeting with the SGLang maintainers (RadixArk CTO and core engineers) to agree on upstream fixes. |
|
Sep 11-19, 2026 |
Additional hardening rolled to all production SGLang deployments (details below). |
|
Sep 16-Oct 12, 2026 |
Upstream SGLang merges the admission fix, per-transfer checksums, abort-ACK preservation, and turns deferred KV release on by default. |
|
Oct 2, 2026 |
SGLang v0.5.21 released. |
|
Oct 19, 2026 |
SGLang v0.5.22 released. |
|
Oct 26, 2026 |
Coordinated publication with the researcher and RadixArk. |
This bug belongs to a class of KV cache memory-safety bugs that Cloudflare has been working to address for several months. In each case, a page is freed, reused, or read while something else still has a claim on it. We see two common causes.
The first is page lifetime within a single node. Several tasks on a decode node can hold the same page at once: token generation, offload to host memory, the KV transfer receiver, and the abort and error paths. If one of them frees the page while another is still using it, a new request can be given that page while it is still being read or written. Our earlier fixes for decode offload (#24226, #30899) and double release on grammar errors (#30937) were of this kind.
The second is a race across nodes. When a request is aborted while prefill is still writing its KV cache to decode over RDMA, the writes already sent cannot be recalled. If decode frees those pages right away, those pages can be given to another request, and the late writes land in that request's KV cache. Cloudflare has contributed to the effort to fix this race through proposed fixes (#31357, #38961) and a reproduction script (#32564). In both cases the result is corrupted output, or one user's data in another user's response, with no error raised. The bug in this incident was different: a rejected request went through the handoff every time, rather than by a timing accident. But it had the same result: decode reading pages this request never wrote. None of these covered the failure in this incident in which prefill rejected the request, and decode never learned of it.
Since the incident, we have:
All of these changes were released to our disaggregated production deployments.
We met with the SGLang maintainers at RadixArk on September 10, the day after the incident. We agreed that RadixArk would investigate the race conditions we had reported, upstream the integrity-checking idea, and build reproduction tests for this class of bug.
The following have landed on SGLang main to address this incident and related KV cache race conditions, and all but one are included in v0.5.22. Operators running disaggregated SGLang should update to v0.5.22 or backport these patches as needed.
|
Category |
Pull request |
Release |
What it does |
|
Incident |
v0.5.20 |
Retires aborted prefill requests before their result reaches decode. This stops the exposure in this incident. |
|
|
Incident |
v0.5.21 |
Rejects these requests at admission, before any bootstrap, allocation, or KV transfer. Follows the approach in Cloudflare's draft patch, #38704. |
|
|
Race |
v0.5.21, v0.5.22 |
|
|
|
Race |
v0.5.20, v0.5.21 |
Enables deferred KV release only on backends that support it, then turns it on by default. |
|
|
Race |
v0.5.21 |
Fixes cases where the drain confirmation was lost, so releases happen on confirmation instead of waiting out the timeout. |
|
|
Race |
v0.5.21 |
Holds pages on every transfer failure, not only decode-initiated aborts. |
|
|
Race |
v0.5.21 |
Fixes a regression in the abort notification path. |
|
|
Race |
v0.5.22 |
A failed Mooncake send no longer reports its writes as drained. |
|
|
Race |
v0.5.22 |
Tags abort messages per request so a reused ID cannot consume a stale confirmation. Adds MORI support. |
|
|
Race |
v0.5.20 |
Shares the prefill-to-decode failure notification across Mooncake, NIXL, and MORI. |
|
|
Race |
v0.5.20 |
Optional cap on Mooncake transfer batch size, so one timed-out call cannot leave an unbounded number of writes in flight. |
|
|
Lifetime |
v0.5.21 |
Decode waits for an in-progress offload to host memory before retracting a request and freeing its pages. Authored by Cloudflare. |
|
|
Lifetime |
v0.5.22 |
Keeps tensor-parallel ranks in agreement when a host-memory cache restore fails. |
|
|
Observability |
v0.5.21 |
Adds |
|
|
Observability |
v0.5.20, v0.5.21 |
Fixes for SGLang's KV canary, which detects and logs potential corruption. |
|
|
Observability |
v0.5.22 |
Metrics for deferred release: count, duration, and whether each hold ended on drain confirmation or timeout. |
These follow-ups are still works in progress:
--disaggregation-enable-kv-checksum. Merged, awaiting release.If you run SGLang in disaggregated prefill/decode mode, we recommend the following:
--disaggregation-enable-kv-checksum and --kv-canary do not yet cover every model architecture. Check your logs to confirm requests are being verified. We are working with the SGLang team to extend both checks to more architectures, including GLM 5.3, GLM 5.3 Flash, and DeepSeek V4.Configuration checks and lifecycle fixes reduce the number of ways a page can be misused. They do not make misuse impossible, and this incident is a reminder that the next bug will have a shape we have not seen. The durable answer is for the engine to detect, at read time, that a request is about to attend over a page it does not own, and fail that one request rather than return someone else's data.
We built a prototype of this over the summer and described it in August. Every physical KV page carries a tag that changes when the page is reallocated, each request records the tags it expects, and the mapping is checked before decode reads the cache. In our tests it cost under 1% in throughput and tail latency. We tested it on GLM 5.2 in mid-August, but disabled it shortly afterwards due to reliability issues.
The prototype was also tied to specific attention backends and model architectures, so it could not be a general fix. We are working with the SGLang team to build a production version into the engine that works across every model, rather than maintaining Cloudflare-specific patches. The per-transfer checksum in #39500 is a first step: it validates the handoff from prefill to decode. Page-level tags go further, because they check every read, including reads long after the transfer.
RDMA copies data directly from one node’s memory to another’s. It’s vital for the two machines to agree on where the data goes, how large it is, and when it’s finished; any mismatch can cause the receiver to read the wrong data. This bug is an example of a consistency failure in a distributed system, in which the two machines had inconsistent views of the state of that system.
Elsewhere in Cloudflare, we have put effort into proving the safety of distributed systems using formal verification methods. Topaz enables conflict-free IP selection for our authoritative DNS servers. Models of Meerkat’s QuePaxa implementation have demonstrated consistency bugs that were subsequently fixed.
We are now directing our experience in formal methods to KV cache transfer engines. This will start with modeling and proving the safety of an RDMA-based KV cache transfer protocol. The goal is to model our production SGLang’s distributed KV cache system using Mooncake, then track and fix any divergence from the safety properties we want to guarantee. The aim is to prove — as far as possible — that a bug like this cannot occur again. Realistically, we expect gaps in what the provers can tell us, but proving the rest of the system allows us to more closely review and monitor those gaps.
We are publishing this report as part of a coordinated disclosure. We want to thank the researcher, Gadi Evron, who reported this through our HackerOne program with a clear, reproducible script and gave us time to fix it and to coordinate with the SGLang maintainers before publishing. We also want to thank the SGLang team at RadixArk, who treated this as their problem as well as ours and landed the upstream fixes with urgency.
Read more at the post from the SGLang team.
If you find a security issue in Workers AI, please report it at hackerone.com/cloudflare.
Post Syndicated from Crosstalk Solutions original https://www.youtube.com/watch?v=MFiPQZ4Dow4