Making Rust Workers reliable: panic and abort recovery in wasm‑bindgen

Post Syndicated from Guy Bedford original https://blog.cloudflare.com/making-rust-workers-reliable/

Rust Workers run on the Cloudflare Workers platform by compiling Rust to WebAssembly, but as we’ve found, WebAssembly has some sharp edges. When things go wrong with a panic or an unexpected abort, the runtime can be left in an undefined state. For users of Rust Workers, panics were historically fatal, poisoning the instance and possibly even bricking the Worker for a period of time.

While we were able to detect and mitigate these issues, there remained a small chance that a Rust Worker would unexpectedly fail and cause other requests to fail along with it. An unhandled Rust abort in a Worker affecting one request might escalate into a broader failure affecting sibling requests or even continue to affect new incoming requests. The root cause of this was in wasm-bindgen, the core project that generates the Rust-to-JavaScript bindings Rust Workers depend on, and its lack of built-in recovery semantics.

In this post, we’ll share how the latest version of Rust Workers handles comprehensive Wasm error recovery that solves this abort-induced sandbox poisoning. This work has been contributed back into wasm-bindgen as part of our collaboration within the wasm-bindgen organization formed last year. First with panic=unwind support, which ensures that a single failed request never poisons other requests, and then with abort recovery mechanisms that guarantee Rust code on Wasm can never re-execute after an abort.

Initial recovery mitigations

Our initial attempts to address reliability in this area focused on understanding and containing failures caused by Rust panics and aborts in production Rust Workers. We introduced a custom Rust panic handler that tracked failure state within a Worker and triggered full application reinitialization before handling subsequent requests. On the JavaScript side, this required wrapping the Rust-JavaScript call boundary using Proxy‑based indirection to ensure that all entrypoints were consistently encapsulated. We also made targeted modifications to the generated bindings to correctly reinitialize the WebAssembly module after a failure.

While this approach relied on custom JavaScript logic, it demonstrated that reliable recovery was achievable and eliminated the persistent failure modes we were seeing in practice. This solution was shipped by default to all workers‑rs users starting in version 0.6, and it laid the groundwork for the more general, upstreamed abort recovery mechanisms described in the sections that follow.

Implementing panic=unwind with WebAssembly Exception Handling

The abort recovery mechanisms described above ensure that a Worker can survive a failure, but they do so by reinitializing the entire application. For stateless request handlers, this is fine. But for workloads that hold meaningful state in memory, such as Durable Objects, reinitialization means losing that state entirely. A single panic in one request could wipe the in-memory state being used by other concurrent requests.

In most native Rust environments, panics can be unwound, allowing destructors to run and the program to recover without losing state. In WebAssembly, things historically looked very different. Rust compiled to Wasm via wasm32-unknown-unknown defaults to panic=abort, so a panic inside a Rust Worker would abruptly trap with an unreachable instruction and exit Wasm back to JS with a WebAssembly.RuntimeError.

To recover from panics without discarding instance state, we needed panic=unwind support for wasm32-unknown-unknown in wasm-bindgen, made possible by the WebAssembly Exception Handling proposal, which gained wide engine support in 2023.

We start by compiling with RUSTFLAGS='-Cpanic=unwind' cargo build -Zbuild-std, which rebuilds the standard library with unwind support and generates code with proper panic unwinding. For example:

struct HasDropA;
struct HasDropB;
extern "C" {
    fn imported_func();
}

fn some_func() {
    let a = HasDropA;
    let b = HasDropB;
    imported_func();
}

compiles to WebAssembly as:

try
  call <imported_func>
catch_all
  call <drop_b>
  call <drop_a>
  rethrow
end
call <drop_b>
call <drop_a>

This ensures that even if imported_func() panics, destructors still run. Similarly, std::panic::catch_unwind(|| some_func()) compiles into:

try
  call <some_func>
  ;; set result to Ok(return value)
catch
  try
    call <std::panicking::catch_unwind::cleanup>
    ;; set result to Err(panic payload)
  catch_all
    call <core::panicking::cannot_unwind>
    unreachable
  end
end

Getting this to work end-to-end required several changes to the wasm-bindgen toolchain. The WebAssembly parser Walrus did not know how to handle try/catch instructions, so we added support for them. The descriptor interpreter also needed to be taught how to evaluate code containing exception handling blocks. At that point, the full application could be built with panic=unwind.

The final step was modifying the exports generated by wasm-bindgen to catch panics at the Rust-JavaScript boundary and surface them as JavaScript PanicError exceptions. One subtlety: Rust will catch foreign exceptions and abort when unwinding through extern "C" functions, so exports needed to be marked extern "C-unwind" to explicitly allow unwinding across the boundary. For futures, a panic rejects the JavaScript Promise with a PanicError.

Closures required special attention to ensure unwind safety was properly checked, via a new MaybeUnwindSafe trait that checks UnwindSafe only when built with panic=unwind. This quickly exposed a problem, though: many closures capture references that remain after an unwind, making them inherently unwind-unsafe. To avoid a situation where users are encouraged to incorrectly wrap closures in AssertUnwindSafe just to satisfy the compiler, we added Closure::new_aborting variants, which terminate on panic instead of unwinding in cases where unwind safety can’t be guaranteed.

With panic unwinding enabled:

  • Panics in exported Rust functions are caught by wasm-bindgen

  • Panics surface to JavaScript as PanicError exceptions

  • Async exports reject their returned promises with a PanicError

  • Rust destructors run correctly

  • The WebAssembly instance remains valid and reusable

The full details of the approach and how to use it in wasm-bindgen are covered in the latest guide page for Wasm Bindgen: Catching Panics.

Abort recovery

Even with panic=unwind support, aborts still happen – out-of-memory errors being one common cause. Because aborts can’t unwind, there is no possibility of state recovery at all, but we can at least detect and recover from aborts for future operations to avoid invalid state erroring subsequent requests.

Panic unwind support introduced a new problem for abort recovery. When we receive an error from Wasm we don’t know if it came from an extern “C-unwind” foreign error, or if it was a genuine abort. Aborts can take many shapes in WebAssembly.

We had two options to solve this technically: either mark all errors which are definitely aborts, or mark all errors which are definitely unwinds. Either could have worked but we chose the latter. Since our foreign exception handling was directly using raw WAT-level (WebAssembly text format) Exception Handling instructions already, we found it easier to implement exception tags for foreign exceptions to distinguish them from aborting non-unwind-safe exceptions.

With the ability to clearly distinguish between recoverable and non-recoverable errors thanks to this Exception.Tag feature in WebAssembly Exception Handling, we were able to then integrate both a new abort handler as well as abort reentrancy guards.

A new abort hook, set_on_abort, can be used at initialization time to attach a handler that recovers accordingly for the platform embedding’s needs.

Hardening panic and abort handling is critical to avoiding invalid execution state. WebAssembly allows deeply interleaved call stacks, where Wasm can call into JavaScript and JavaScript can re-enter Wasm at arbitrary depths, while alongside this, multiple tasks can be functioning in the same instance. Previously, an abort occurring in one task or nested stack was not guaranteed to invalidate higher stacks through JS, leading to undefined behavior. Care was required to ensure we can guarantee the execution model, and contribution in this space remains ongoing.

While aborts are never ideal, and reinitialization on failure is an absolute worst-case scenario, implementing critical error recovery as the last line of defense ensures execution correctness and that future operations will be able to succeed. The invalid state does not persist, ensuring a single failure does not cascade into multiple failures.

Extension: abort reinitialization for wasm-bindgen libraries

While we were working on this, we realized that this is a common problem for libraries used by JS that are built with wasm-bindgen, and that they would also benefit from attaching an abort handler to be able to perform recovery.

But when building Wasm as an ES module and importing it directly (e.g. via import { func } from ‘wasm-dep’), it’s not clear what the recovery mechanism would be for a Wasm abort while calling func() for an already-linked and initialized library that is in a user JS application.

While not strictly a Rust Workers use case, our team also supports JS-based Workers users who run Rust-backed Wasm library dependencies. If we could fix this problem at the same time, that could indirectly also benefit Wasm usage on the Cloudflare Workers platform.

To support automatic abort recovery for Wasm library use cases, we added support for an experimental reinitialization mechanism into wasm‑bindgen, --reset-state-function. This exposes a function that allows the Rust application to effectively request that it reset its internal Wasm instance back to its initial state for the next call, without requiring consumers of the generated bindings to reimport or recreate them. Class instances from the old instance will throw as their handles become orphaned, but new classes can then be constructed. The JS application using a Wasm library is errored but not bricked.

The full technical details of this feature and how to use it in wasm-bindgen are covered in the new wasm-bindgen guide section Wasm Bindgen: Handling Aborts.

Maturing the Rust Wasm Exception Handling ecosystem

Upstream contributions for this work did not stop at the wasm-bindgen project. Building for Wasm with panic=unwind still requires an experimental nightly Rust target, so we’ve also been working to advance Rust’s Wasm support for WebAssembly Exception Handling to help bring this to stable Rust.

During the development of WebAssembly Exception Handling, a late‑stage specification change resulted in two variants: legacy exception handling and the final modern exception handling “with exnref”. Today, Rust’s WebAssembly targets still default to emitting code for the legacy variant. While legacy exception handling is widely supported, it is now deprecated.

Modern WebAssembly Exception Handling is supported as of the following JS platform releases:

Runtime

Version

Release Date

v8

13.8.1

April 28, 2025

workerd

v1.20250620.0

June 19, 2025

Chrome

138

June 28, 2025

Firefox

131

October 1, 2024

Safari

18.4

March 31, 2025

Node.js

25.0.0

October 15, 2025

As we were investigating the support matrix, the largest concern ended up being the Node.js 24 LTS release schedule, which would have left the entire ecosystem stuck on legacy WebAssembly Exception Handling until April 2028.

Having discovered this discrepancy, we were able to backport modern exception handling to the Node.js 24 release, and even backport the fixes needed to make it work on the Node.js 22 release line to ensure support for this target. This should allow the modern Exception Handling proposal to become the default target next year.

Over the coming months, we’ll be working to make the transition to stable panic=unwind and modern Exception Handling as invisible as possible to end users.

While these long‑term investments in the ecosystem take time, they help build a stronger foundation for the Rust WebAssembly community as a whole, and we’re glad to be able to contribute to these improvements.

Using panic unwind in Rust Workers

As of version 0.8.0 of Rust Workers, we have a new --panic-unwind flag, which can be added to the build command, following the instructions here.

With this flag, panics can be fully recovered, and abort recovery will use the new abort classification and recovery hook mechanism. We highly recommend upgrading and trying it out for a more stable Rust Workers experience, and plan to make panic=unwind the default in a subsequent release. Users remaining on panic=abort will still continue to take advantage of the previous custom recovery wrapper handling from 0.6.0.

Committing to Rust Workers stability

This work is part of our ongoing effort towards a stable release for Rust Workers. By solving these sharp edges of the Wasm platform foundations at their root, and contributing back to the ecosystem where it makes sense, we build stronger foundations not just for our platform, but the entire Rust, JS, and Wasm ecosystem.

We have a number of future improvements planned for Rust Workers, and we’ll soon be sharing updates on this additional work, including wasm-bindgen generics and automated bindgen, which Guy Bedford from our team previewed in a talk on Rust & JS Interoperability at Wasm.io last month.

Find us in #rust‑on‑workers on the Cloudflare Discord. We also welcome feedback and discussion and especially all new contributors to the workers-rs and wasm-bindgen GitHub projects.

An astronomical anniversary: Young people’s code heads to the International Space Station

Post Syndicated from Fergus Kirkpatrick original https://www.raspberrypi.org/blog/an-astronomical-anniversary-young-peoples-code-heads-to-the-international-space-station/

The results are in!

Today is the day mentors and teams find out if their code has achieved flight status for the European Astro Pi Challenge 2025/26! The first batches of Mission Space Lab programs are scheduled to start running on the International Space Station (ISS) this week, with Mission Zero programs scheduled to run in mid-May. 

This year, Astro Pi Mission Control received an incredible 17,381 submissions for Mission Zero from 24,695 young explorers. 

A selection of colourful pixel art images created by Mission Zero participants.


For Mission Space Lab, 404 teams took on the challenge of calculating the speed of the ISS. After rigorous testing and security checks by our team on the ground, we are delighted to announce that 387 teams have been awarded flight status.In total, 25,707 young people will have their programs run in space this year. Huge congratulations to everyone who passed testing — we can’t wait to see how your code performs 400km above Earth!

Who joined the mission in 2025/26?

Every year, we dive into our participation data to see how the Astro Pi community is growing. This helps us ensure we’re reaching young people everywhere, from classrooms to community hubs.

Our data shows that participants in the entry-level Mission Zero have an average age of 12, with some as young as 6 years old and the oldest 18 years old. The more advanced Mission Space Lab sees the average age rise to 15 as the technical complexity increases. The youngest participants for Mission Space Lab were 10 years olds, and the oldest were 19 years old. 

Improving gender balance in computing is a key priority for us and Astro Pi remains popular with girls: 44% of Mission Zero entrants identify as female — a fantastic result that is consistent with previous years.

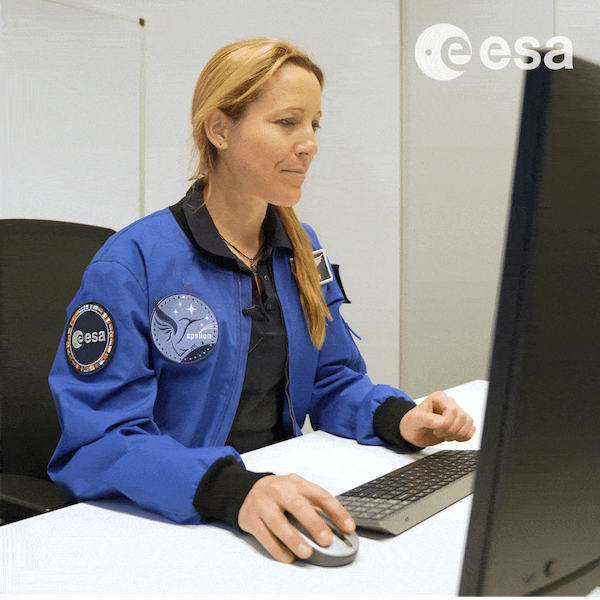
We even had one very special participant! ESA Astronaut Sophie Adenot created her own entry for Mission Zero, re-imagining her Epsilon Mission patch in pixel art.

ESA Astronaut Sophie Adenot smiling while coding her Mission Zero entry on a laptop.

For Mission Space Lab, 26% of participants identify as female. This reflects wider trends in STEM: as projects get more complex and young people get older, the gender gap widens. Despite this, girl’s participation in Mission Space Lab remains roughly consistent from year to year (27% for 2024/25). 

These results highlight the importance of our ongoing work to support girls in transitioning from block-based coding to advanced Python and reinforce our mission to keep providing accessible, inspiring pathways for everyone.

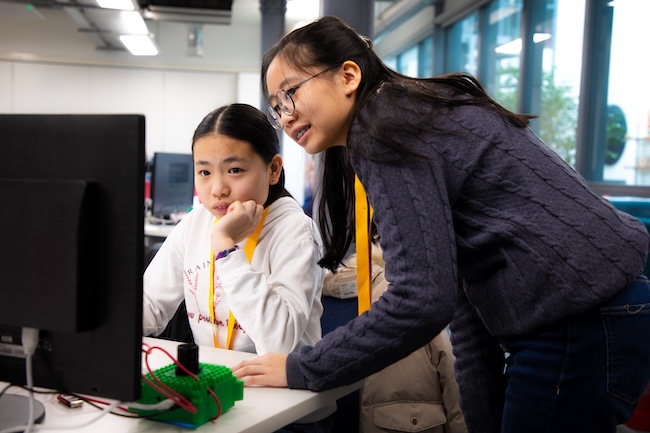
Two students working together to write Python code for their Mission Space Lab entry.

Where does Astro Pi take place?

While secondary schools remain our biggest mission hubs (hosting 68% of Mission Space Lab and 50% of Mission Zero teams), we’ve seen an exciting boost in community participation. This year, more young people than ever took part through Code Clubs, libraries, and youth centers.

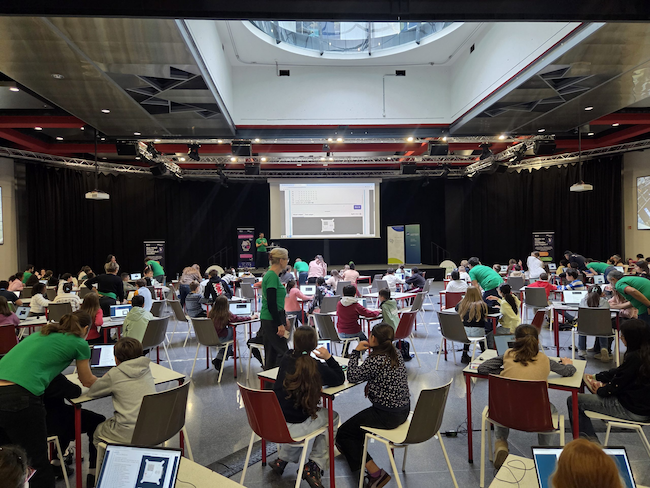
“On November 14, 2025, we organised an exceptional event around the Astro Pi Mission Zero project, bringing together nearly 300 young participants to write a short computer program to display a personalised message on board the International Space Station (ISS). For a day, students discovered that coding could literally… send them to space!” 

– ESERO Luxembourg

Young people coding Mission Zero at tables in a large events space.
Young people participating at Mission Zero event with ESERO Luxembourg

Impact on the ground

It’s been a busy year for Mission Control. We’ve been across the UK, Ireland, and ESA member states training mentors and running workshops.

“The Mission Zero workshops were a fantastic opportunity for our students to experience coding in a meaningful and inspiring context. It really helped bring computer science to life, and we’ve seen increased interest from students wanting to explore coding further.” 

– Ms Qureshi, Nene Park Academy, Peterborough, UK

It’s also been a year of incredible connections: we surprised families at the London Science Museum with a visit from Tim Peake for our 10th anniversary and our DevOps expert Geraint Ballinger visited teams taking part at libraries in Glasgow, Scotland, to help debug their code. Who knows? Next year, Mission Control could visit a school or Code Club near you!

“The structured approach helped me guide our mentors on how to deliver it step by step. We started with the pitch deck and YouTube Intro, then went to designing the 8×8 pixel art on paper, to finally translating the pixel art to Python code. Even students as young as nine were able to complete the project, and their excitement knowing their code could run in space was incredible to see.”

– Kokia, Mentor, Canada

Next steps

Well done again to everyone who achieved flight status. Your code is about to leave the atmosphere and head into orbit! 

ESA Astronaut Sophie Adenot will be aboard the ISS while your programs are running and will be recording a special video message for all our participants!

Finally, keep an eye on your inbox — we’ll be sending out official certificates for all participants in June 2026. Until then, stay curious!

The post An astronomical anniversary: Young people’s code heads to the International Space Station appeared first on Raspberry Pi Foundation.

Научни новини: Artemis II завинаги

Post Syndicated from Михаил Ангелов original https://www.toest.bg/nauchni-novini-artemis-ii-zavinagi/

Научни новини: Artemis II завинаги

След неколкократни отлагания Artemis II излетя успешно, изпращайки четиричленния си екипаж към Луната. Така, повече от 50 години след като екипажът на Apollo 17 пое обратно към Земята, човешкото присъствие около естествения ни спътник отново стана факт. Освен че изпитаха ракетата и капсулата Orion, астронавтите направиха множество наблюдения и поставиха рекорд за хора, отпътували най-далеч от Земята – на 6600 км повече от екипажа на Apollo 13, тъй като Луната беше в по-далечна част от орбитата си.

Мисията е голям успех за NASA, която дълго време имаше проблеми с ракетата носител.

Научни новини: Artemis II завинаги
Към Луната! Снимка: NASA

Екипаж

Той включва американците Рийд Уайзман (капитан), Виктор Гловър (пилот) и Кристина Кок (специалист), както и канадеца Джереми Хенсен (специалист).

Американците вече са били на мисии до Международната космическа станция (МКС), като от тримата Кук има най-голям опит – с почти двойно време в орбита и работа извън станцията. Престоят на астронавтката там беше удължен поради промени в графика на изстрелване. Така тя влезе в топ 10 на хората, прекарали най-много време в Космоса в рамките на една мисия, и стана първата жена с толкова дълъг престой. Гловър може да се похвали с участие в първата мисия с екипаж на SpaceX до МКС. За Хенсен това е първи полет, но канадецът също има интересна история с мисии в подводната лаборатория Aquarius и в програмата на Европейската космическа агенция (ЕКА) за престой в пещери CAVES.

Научни новини: Artemis II завинаги
Джереми Хенсен, Виктор Гловър, Рийд Уайзман и Кристина Кок малко преди да се качат в капсулата Orion. Снимка: NASA/John Kraus

Ракетата

Подобно на Saturn V – ракетата, отнесла астронавтите от програмата Apollo до Луната, Space Launch System (SLS) е най-голямата ракета в употреба за времето си. Към момента по размер я надминава само Starship на SpaceX, но той все още е в процес на разработка и не изпълнява рутинни полети.

SLS се дели най-общо на две части – ракета носител и кораб, с който екипажът отива до Луната и се връща оттам.

Частта, в която живеят астронавтите (Orion), е с капацитет четирима души, като всеки от тях разполага с обитаемо пространство от около 9 м3. Това е единственият модул, в който се поддържат условия, подходящи за живот. Освен че служи за жилищно пространство, той има и важната задача да върне екипажа на Земята – долната му страна е покрита с термален щит, който да предпази капсулата от изключително високите температури при преминаване през атмосферата. Този щит беше повод за тревога, защото при Artemis I по него бяха открити липсващи парчета и по-силно прогаряне от очакваното. За да се намали рискът за астронавтите, траекторията на Artemis II беше променена с по-остра, така че капсулата да прекара по-малко време в атмосферата. Все още няма официална информация за състоянието на щита, но важното е, че той изпълни задачата си и Orion се приводни успешно.

Към Orion е прикрепен сервизен модул. В него се намират животоподдържащите системи, които подават вода и кислород и регулират температурата в капсулата. Към модула са прикрепени и слънчевите панели, които произвеждат електричеството, нужно за мисията. Той отговаря и за промени в орбитата, като за целта е оборудван с 9 двигателя – един главен и осем помощни. Модулът е изработен от Airbus и е част от приноса на ЕКА към програмата Artemis.

За извеждането на Orion в орбита е нужна много енергия, затова инженерите са се спрели на добре изпитан подход – двустепенна ракета с помощни двигатели с твърдо гориво. Интересното е, че голяма част от ракетата носител е съставена от части, които вече са били в действие.

Като основни двигатели се преизползват тези от космическата совалка RS25, разработени през 70-те години на миналия век. Благодарение на напредничавия си дизайн и няколко подобрения през годините те все още са едни от най-добрите двигатели. От четирите, които изпратиха Artemis II до Луната, три вече са летели в Космоса, като единият е използван в 15 мисии на совалката.

Сходна е ситуацията и с двата помощни двигателя – с изключение на два модула, те са съставени от части, които са летели на множество мисии на космическата совалка. Има такива, които са участвали в трагично завършилата мисия STS-107 на „Колумбия“. При връщането на совалката към Земята тя се разпада поради повреда в топлинния щит на едното ѝ крило и това довежда до смъртта на седемчленния екипаж.

Макар и изградена от части, които могат да се рециклират, този път нищо от ракетата носител не беше спасено. Основната причина е финансова – изваждането на частите от океана и последващото им възстановяване е изключително скъпо. От друга страна, това позволи те да се използват на ръба на възможностите им, което даде повече тяга на ракетата.

Допълнителен багаж

Поради голямата мощност на ракетата NASA беше планирала да изстреля и няколко малки сателита от стандарта CubeSat с нея. През годините броят и параметрите за тях се променяха, като накрая на борда имаше четири изследователски сателита. Те бяха прикрепени към пръстен, намиращ се между сервизния модул и втората степен на ракетата, така че след разделянето им да бъдат освободени във висока земна орбита.

Първият сателит е немският TACHELES, чиято цел беше да изпита електроника за бъдещи луноходи в условията на космическата радиация. За съжаление, макар че бе успешно освободен по траекторията си, с него не бе установена връзка и той не успя да постигне стабилна орбита.

Аржентинският ATENEA имаше много интересна задача: да изпита система за далечна комуникация и да провери дали сигналите от GPS сателитите могат да се използват за навигация в Космоса. Данните са получени от екипа, така че ще е интересно да разберем какви са резултатите от теста. Сателитът нямаше двигатели и след като достигна предвидената височина от 70 000 км, се върна към Земята и изгоря в атмосферата.

Третият малък сателит е K-RadCube от Южна Корея. Той трябваше да оцени ефекта на радиационния пояс на Ван Алън върху специален силициев дозиметър, който имитира човешка тъкан, както и електрониката в самия сателит. След отделянето му беше установена връзка с него, но сигналът беше изключително слаб. Предполага се, че сателитът е изгорял в атмосферата.

Последният апарат – SHAMS, е принос на Саудитска Арабия и имаше за цел да изследва пространството около планетата ни, измервайки космическата радиация, рентгеновите лъчи и заредените частици от Слънцето, както и магнитното поле на Земята. Неговите двигатели се включиха успешно и в момента обикаля в силно елиптична орбита.

Дотам и обратно

Рано сутрин на 1 април беше дадена зелена светлина за изстрелване. Най-важната задача беше зареждането на ракетата с течно гориво – бавна и опасна процедура, тъй като течният водород е изключително взривоопасен. Известна тревога създаде пропускането на теста за течове при зареждане, който обикновено се извършва преди полет: ракетата се зарежда с гориво и се проверява дали всички уплътнения работят коректно, след което горивото се източва. Агенцията реши да не прави тази проверка, защото вече имаше забавяне поради теч в горивната система, а и самият тест предизвиква допълнителен стрес в нея.

В ранния следобед, след като вече бяха облекли защитните си костюми, астронавтите започнаха традиционната игра на карти преди полет. Тя се играе, докато капитанът на мисията загуби, за да остави лошия си късмет на игралната маса.

Няколко часа след като екипажът се беше настинал в капсулата, се появи проблем с комуникацията със системата за прекратяване на полета (Flight Termination System). Най-общо, това е система, която има за цел да взриви контролирано ракетата, ако тя излезе от траекторията си и създаде риск за поражения при падането си. Проблемът беше отстранен сравнително бързо и подготовката за изстрелването продължи без други инциденти. 

В 18:22 ч. официално бе дадена зелена светлина и започна 10-минутният период, в който ракетата минава през последните стъпки преди изстрелване: отделяне на ръкава за екипажа, активиране на спасителните системи, преминаване на собствена електрическа мощност. 

И така, съвсем не на шега, четиримата астронавти полетяха към Луната.

Самото изстрелване мина без проблеми и беше последвано от няколко маневри за установяване на висока елиптична орбита около Земята. През това време астронавтите не скучаеха, а се подготвяха за задачите, които ги очакват.

Малко след завършването на последната маневра капсулата се отдели от втората степен на ракетата и пилотът Гловър се зае с една от важните цели на мисията. В рамките на час той изпита различни маневри за доближаване към нея, като подготовка за скачване с друг апарат, защото прехвърлянето на екипаж на модула за кацане на Луната е изключително важна стъпка.

Следващата задача на астронавтите беше да изпробват специален уред за тренировки. Въпреки че полетът е кратък и не се очакваше сериозна загуба на мускулна маса в условията на микрогравитация, бяха събрани данни за ефикасността на уреда и беше проверена способността на животоподдържащата система да осигурява оптимални условия, докато астронавтите тренират.

След вълненията по изстрелването имахме повод и да се посмеем на добре познати компютърни неволи – капитан Уайзман се свърза с NASA и се оплака, че има два прозореца на имейл клиента Outlook, но и двата са замръзнали.

На следващия ден беше време Европейският сервизен модул да покаже възможностите си. След проверка на системите той извърши близо 6-минутен пуск на главния си двигател, с което астронавтите поеха курс към Луната. Избраната орбита беше познатата от ранните полети Apollo траектория на свободно връщане, при която, дори и да настъпи повреда в двигателите на капсулата, благодарение на гравитацията на Луната тя ще се върне отново в земна орбита.

Научни новини: Artemis II завинаги
Нощната страна на Земята, огряна от лунна светлина. Снимка: NASA

Третият ден в Космоса беше белязан от друга случка, която за нас най-вероятно е комична, но едва ли е била такава за екипажа. Специалната тоалетна, която струва над 20 млн. долара, се запуши. По-късно стана ясно, че е заради замръзнала урина, и проблемът беше отстранен със завъртане на капсулата така, че Слънцето да затопли изхода на запушената тръба. Това не бяха единствените неприятности с тоалетната – малко след излитане в орбита помпата ѝ отказа. С решаването на проблема се зае Кристина Кок, която шеговито се обяви за „космически водопроводчик“. Макар и с тези дребни неприятности, тоалетната наистина предоставя изключителен лукс на астронавтите, особено в сравнение с пионерите от мисиите Apollo, които са използвали пластмасови торби, залепени към телата им.

Четвъртият и петият ден преминаха без сътресения и астронавтите използваха времето за достигането на Луната за изпитване на различни системи. Може би най-важни бяха спасителните костюми, които могат да поддържат живота на астронавтите в рамките на няколко дни в случай на авария с капсулата и загуба на атмосферата в нея.

На шестия ден Orion навлезе в лунната сфера на влияние и към края на деня премина зад тъмната страна на Луната. Астронавтите прелетяха на около 6500 км от повърхността ѝ, като поставиха рекорд по най-далечно разстояние от Земята – 406 771 км, и така подобриха постижението на Apollo 13. След като попадна зад спътника ни, екипажът загуби връзка с наземните екипи за около 40 минути. Това е очаквано и обикновено не предизвиква напрежение.

Основната задача на екипажа по време на прелитането покрай Луната беше да направи наблюдения на повърхността и да опише възможно най-добре какво вижда. Те се бяха разделили на двойки и на смени обясняваха впечатленията си от различни елементи от пейзажа, например кратери и потоци от застинала лава. Успешно беше направена снимка, подобна на популярната Earthrise от екипажа на Apollo 8, което също беше част от програмата на астронавтите. Те имаха възможност да се насладят и на няколко непланирани уникални гледки – сблъсъци на метеорити с лунната повърхност, както и на слънчево затъмнение. То се очакваше, ако ракетата излети в началото на месеца, но не беше част от официално планираната научна програма на екипажа, който обаче все пак се беше подготвил с подходящи очила за наблюдението му. 

Затъмнението изглежда по-различно от тези, които сме свикнали да виждаме, защото Луната е по-голяма и съответно закрива по-голяма част от Слънцето, оставяйки видима само тънка част от короната. Разлика има и в продължителността – затъмненията, наблюдавани от Земята, продължават няколко минути, а астронавтите се любуваха почти един час на това красиво явление.

Научни новини: Artemis II завинаги
Залязваща Земя; аналог на Земен изгрев (Earthrise), заснет от екипажа на Apollo 8. Снимка: NASA

След като излезе от сянката на Луната, екипажът предложи имена за два кратера: Integrity – на капсулата им, и Carroll – на покойната съпруга на капитан Уайзман. Кратерите се намират на границата между близката и далечната страна на Луната и в зависимост от лунния цикъл могат да бъдат видени и от Земята. Астронавтите направиха и конферентна аудиовръзка с колегите си на борда на МКС, отбелязвайки, че в онзи момент двете групи са хората, намиращи се най-далече едни от други.

Останалият път на капсулата премина без премеждия, като седмият ден се оказа „свободен“ поради отпадането на няколко предвидени проверки. Осмият и деветият ден обаче бяха сравнително натоварени. Екипажът проведе допълнителни тестове на различни подсистеми на капсулата и я подготви за кацането, монтирайки отново креслата. Бяха направени и три кратки маневри за оптимизиране на траекторията на капсулата – по една всеки ден.

Научни новини: Artemis II завинаги
Слънчево затъмнение. Снимка: NASA

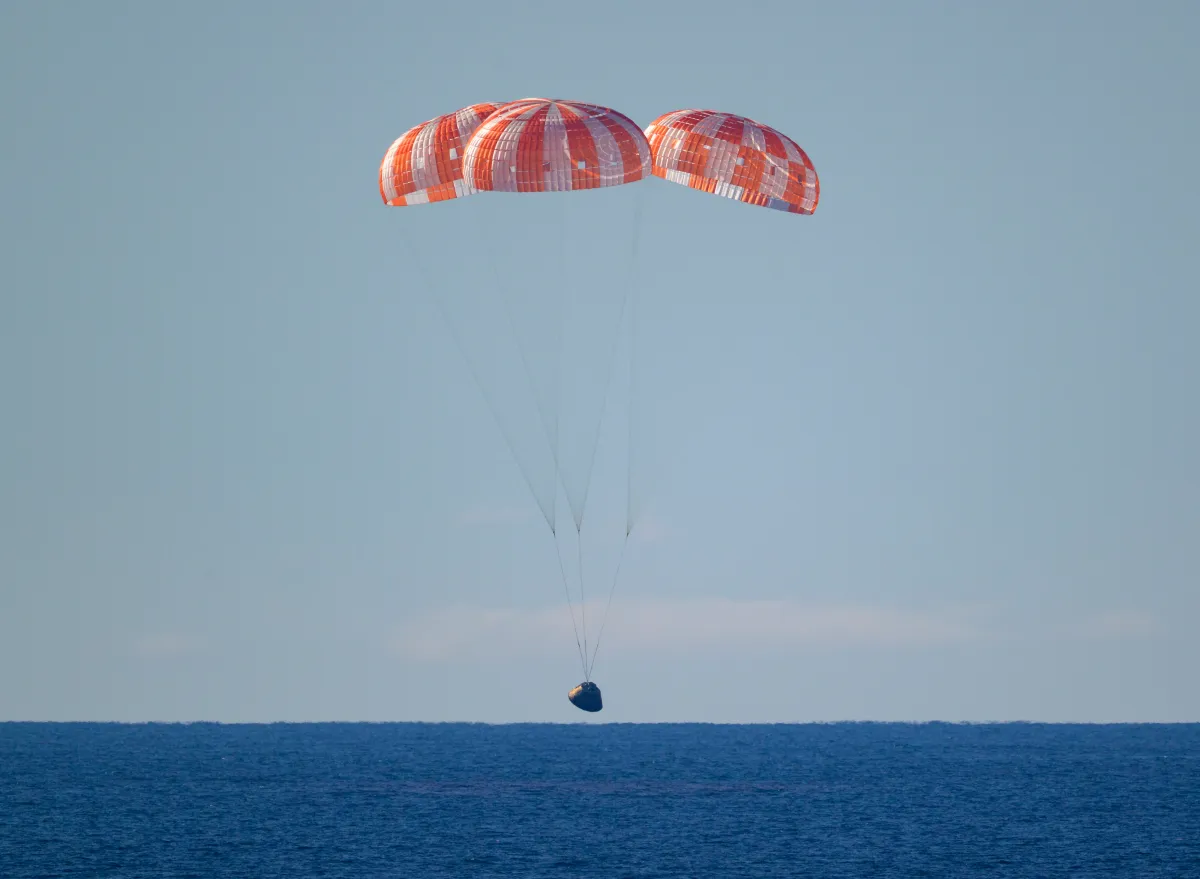
На десетия ден от пътешествието си Orion, вече разкачен от сервизния модул, навлезе в небето над Хавай със зашеметяващата скорост от почти 40 000 км/ч, която надвишава над 30 пъти скоростта на звука. За да бъде предпазена от високата скорост, в началото капсулата е обвита от плазма с температура над 2500℃. Това е напрегнат момент за екипажа и наземния екип, тъй като през тази гореща обвивка не могат да преминават радиовълни и съответно няма възможност за комуникация. Въпреки тревогите, свързани с функционирането на топлинния щит, капсулата успешно се забави в атмосферата, след което с помощта на парашути допълнително намали своята скорост. Самото приводняване премина нормално, но последващото извеждане на астронавтите от капсулата се забави поради проблеми с комуникацията.

В крайна сметка и четиримата астронавти бяха прехвърлени на кораб на американските военноморски сили, завършвайки успешно мисията.

Orion се приводнява след обиколката на Луната. Снимка: NASA

Научни новини: Artemis II завинаги

А сега накъде?

През миналия месец стана ясно, че следващата мисия Artemis III няма да стигне до Луната, а ще остане в земна орбита. Главната цел ще бъде пробно скачване на Orion с някой от модулите за кацане. Единият се изработва от SpaceX, а другият – от Blue Origin, собственост на двамата ексцентрични милиардери Илън Мъск и Джеф Безос. Към момента и двете компании са назад с разработките си, което досега беше донякъде приемливо поради забавянето от страна на NASA. Но Агенцията вече има в наличност всички модули, нужни за изстрелването на Artemis III, и топката се предава на двете компании, които получиха над 7 млрд. долара за разработките си.

SpaceX планира пробно изстрелване на обновената версия на Starship, но все още не е ясно кога. В началото на годината Мъск обяви, че това ще стане през март, после го отложи за април, а в началото на месеца съобщи за забавяне с „четири до шест седмици“. Няколко дни по-късно, по време на статичен тест, единият двигател на Starship избухна, което макар и не необичайно, може да бъде причина за допълнително забавяне.

Компанията Blue Origin също няма пълна готовност. В момента версията на капсулата ѝ Mk1, която може да пренася само товар, е почти готова за пробен полет и ако той е успешен, е възможно догодина да бъде изпитано скачване на Orion с нея. Обитаемата капсула Mk2 все още е в процес на разработка и договорът с NASA е за мисията Artemis V, планирана за 2029 г.

Освен че има неяснота с модула за кацане, NASA е поставена и пред друг труден избор – в каква орбита ще бъде проведена мисията на Artemis III? Единият вариант е висока орбита, която ще позволи по-сериозен тест на подобрения термален щит на Orion, а другата опция е ниска земна орбита. Проблемът е, че за извеждане във висока орбита е нужна горна степен в ракетата, но Агенцията има само една бройка от моделa, изпитан на Artemis I и Artemis II. Това означава, че или Artemis III ще остане в ниска орбита, или Artemis IV ще лети с нова горна степен, която не е изпитана в тази конфигурация.

Предвид колко динамична и несигурна е ситуацията с Artemis III, плановете за кацане на Луната през 2028 г. към момента предизвикват съмнение.

За финал

Макар и вълнуваща, особено за феновете на Космоса, мисията остави впечатление за вял интерес от страна на публика. Това може би се дължи на ситуацията в глобален мащаб, която беше във фокуса на новинарските емисии, но и донякъде е следствие на факта, че Artemis II не даде нещо фундаментално ново, което да заплени вниманието на хората.

Екипажът изпълни безупречно задачата си да провери функционалността на капсулата и оборудването ѝ, но повтори мисия, която вече сме виждали, без особени иновации или интересни научни постижения. Много е вероятно интересът и към следващата мисия да е вял, защото сигурно няма да постави някакъв рекорд. За приковаване на милиарди погледи към екраните ще трябва да изчакаме Artemis IV с надеждата, че отново ще стъпим на повърхността на Луната.


Веднъж месечно Михаил Ангелов – биолог, агроном и любим нърд от нашия екип, ни представя най-интересните скорошни новини от различни сфери на науката и обяснява защо тези постижения са толкова значими за света и човечеството. Или най-малкото – любопитни и забавни.

Zabbix and the Docker API, Part 1: Inspect

Post Syndicated from Janis Eidaks original https://blog.zabbix.com/zabbix-and-the-docker-api-part-1-inspect/32860/

In this blog post, I will show you how to configure Zabbix to securely gather Docker API metrics using the Zabbix HTTP agent item with certificate authentication. This guide will cover configuring the Docker API and the Zabbix server side to gather data more securely.

Getting the data to Zabbix from the Docker API

By default, Docker API uses a non-network socket for security reasons, and there are several valid reasons for this. It is not advised to expose your Docker environment over TCP to localhost, and even less to the internet. Exposing the Docker API without any security to the internet is just inviting hackers for free lunch, as anyone (bots included) who can access your Docker API will also be able to do malicious operations with it (make changes, launch malicious containers, try to take over your environment, and do a lot of harm in general) !

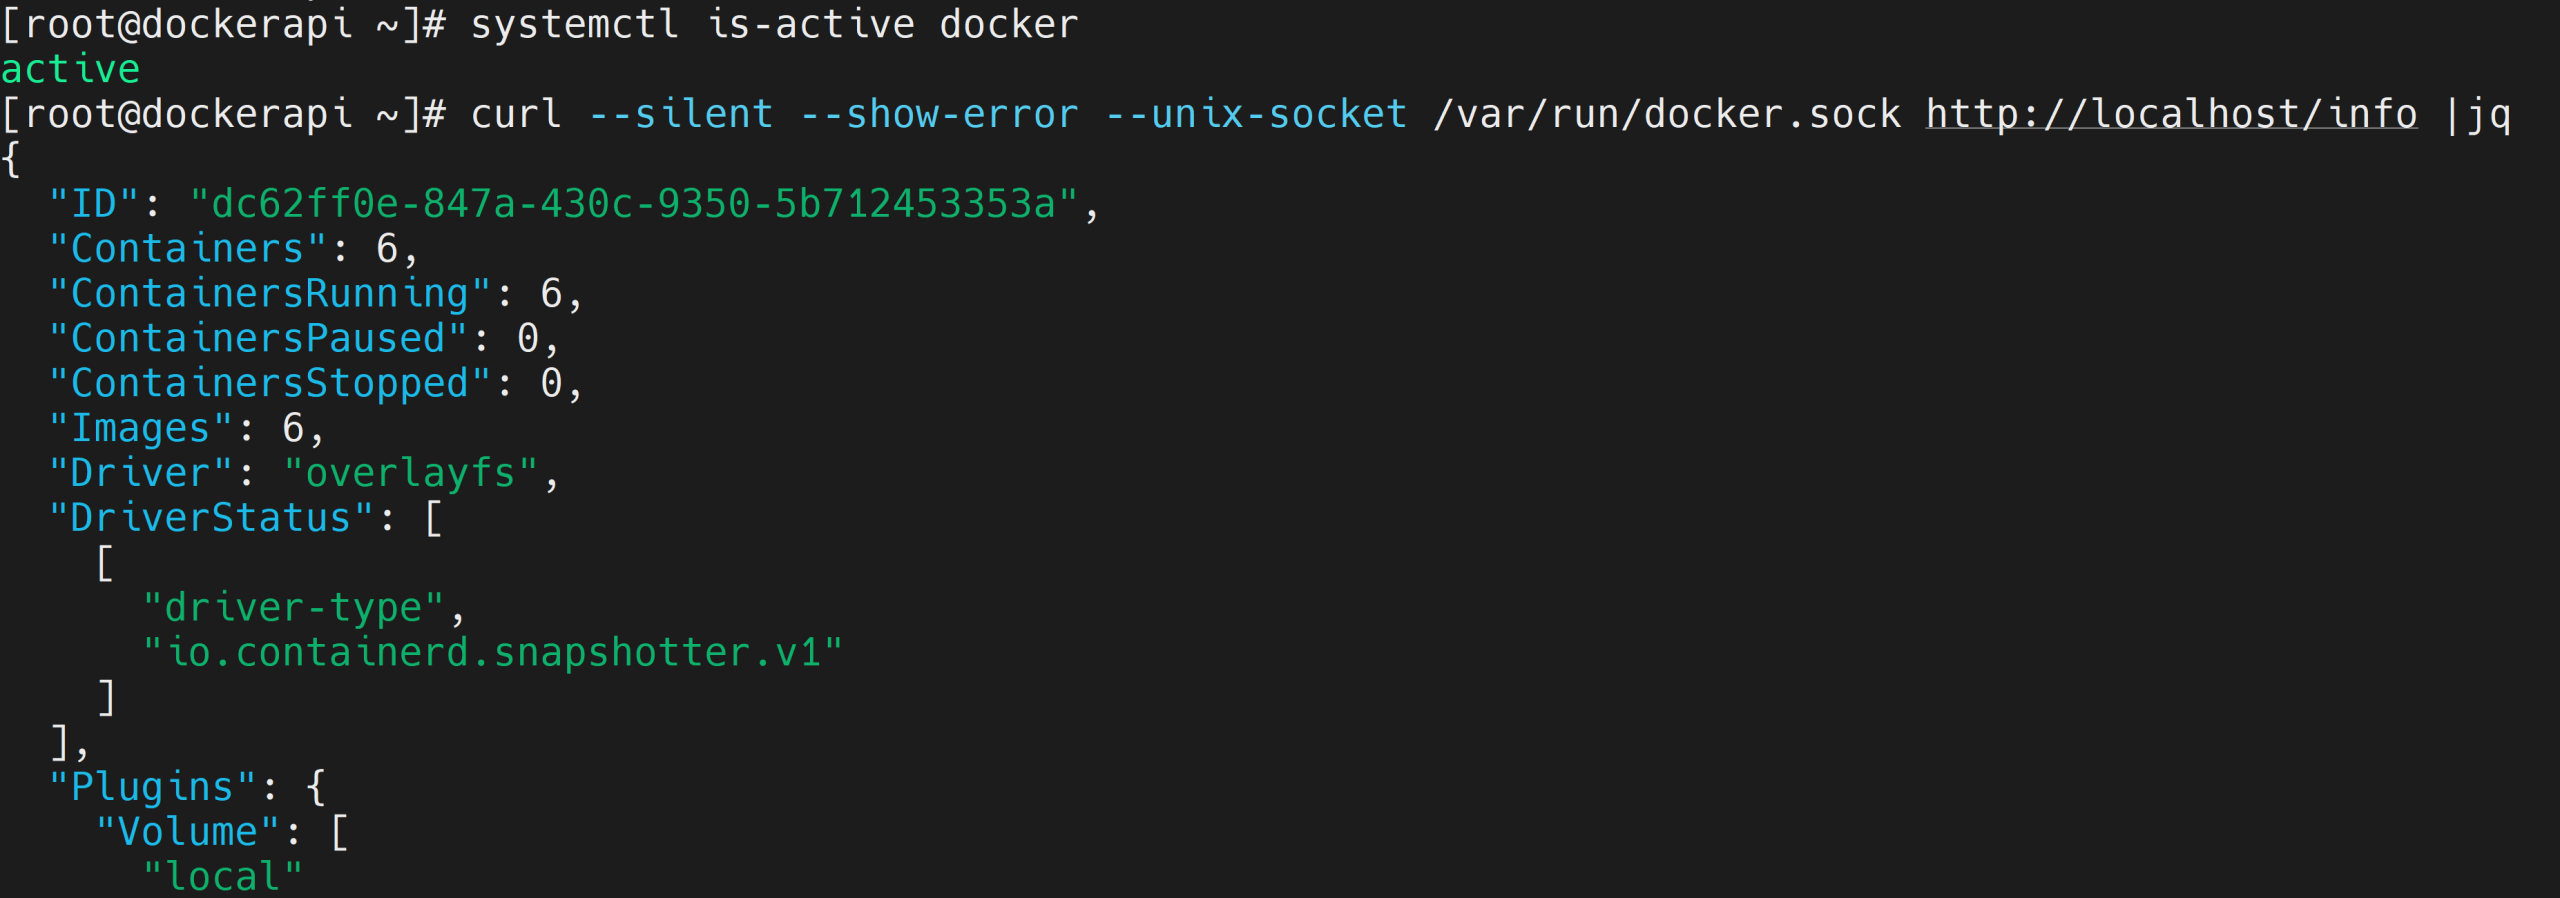
So, make sure to harden your environment’s security and use this guide at your own judgment. Also, set up your firewall so only the Zabbix server can access the Docker API port! By default, you can check if the Docker service is active and if you can get a response to the Docker API by running the curl command:

# systemctl is-active docker
# curl --silent --show-error --unix-socket /var/run/docker.sock http://localhost/info |jq
Fig 1. Output of the Docker API call in CLI

Generating the certificates for the Docker and Zabbix server

You can use the right tool for the job, such as an HTTP agent for the Docker API requests with proper certificate authentication. You will require the CA private key and CA certificate; private key and certificate for the Docker server; private key and certificate for the Zabbix server (for simplicity, you can generate all of them on the Docker server and copy the appropriate files to the Docker server and Zabbix server directories).

A guide you can follow to generate the certificate files is located here: https://docs.docker.com/engine/security/protect-access/#use-tls-https-to-protect-the-docker-daemon-socket.

Deploying the certificate files and configuring the services

On the Docker server, copy the CA and server certificate files to /etc/docker directory:

# cp -v {ca,server-cert,server-key}.pem /etc/docker

The Docker daemon also requires JSON configuration with additional settings (allow TCP/ Unix socket, TLS options):

# nano /etc/docker/daemon.json
{
  "hosts": ["tcp://0.0.0.0:2376","unix:///var/run/docker.sock"],
  "tls": true,
  "tlsverify": true,
  "tlscacert": "/etc/docker/ca.pem",
  "tlscert": "/etc/docker/server-cert.pem",
  "tlskey": "/etc/docker/server-key.pem"
}

We will have to add the Docker service override to remove the Unix socket from the Docker systemd service, then reload the daemon, and restart the Docker service.

# mkdir -p /etc/systemd/system/docker.service.d
# nano /etc/systemd/system/docker.service.d/override.conf
[Service]
ExecStart=
ExecStart=/usr/bin/dockerd
# systemctl daemon-reload
# systemctl restart docker

On the Zabbix server side, create directories for certificate files. Then, copy the relevant certificate files from the Docker server. In my case, I generated all of the certificate files on the Docker host (replace docker in the scp command with IP/DNS name of the Docker server): ca.pem, client-cert.pem, client-key.pem, to their respective directories and change their permissions.

# mkdir -pv /etc/zabbix/ssl/{ca,certs,keys}
# scp root@docker:/root/dockercerts/ca.pem /etc/zabbix/ssl/ca/
# scp root@docker:/root/dockercerts/client-cert.pem /etc/zabbix/ssl/certs/
# scp root@docker:/root/dockercerts/client-key.pem /etc/zabbix/ssl/keys/
# chmod -v 0400 /etc/zabbix/ssl/keys/client-key.pem
# chmod -v 0444 /etc/zabbix/ssl/ca/ca.pem /etc/zabbix/ssl/certs/client-cert.pem
# chown zabbix:zabbix -R /etc/zabbix/ssl

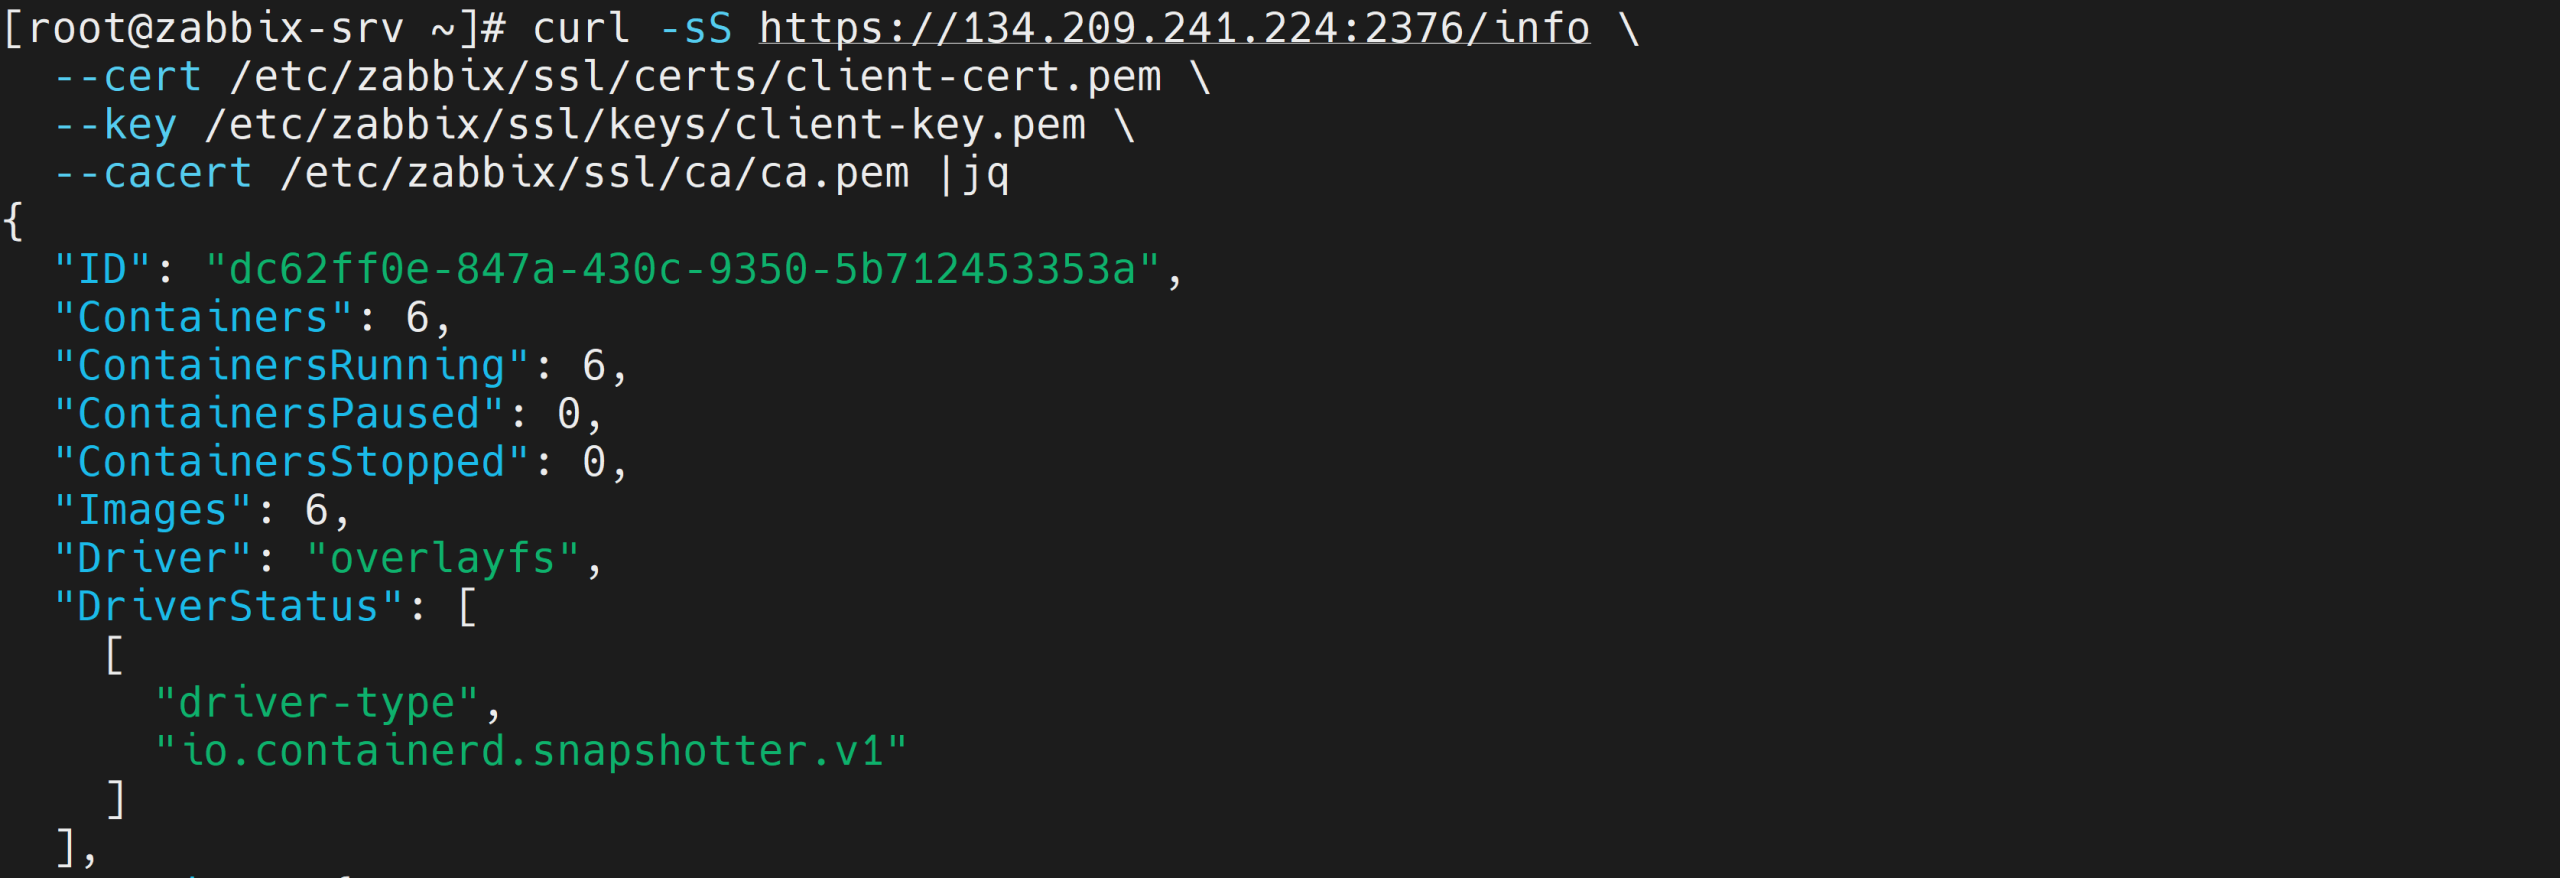
Check if you can get data in the Zabbix server from the Docker server with HTTPS request (replace $HOST with your Docker server address):

# curl -sS https://$HOST:2376/info \
  --cert /etc/zabbix/ssl/certs/client-cert.pem \
  --key /etc/zabbix/ssl/keys/client-key.pem \
  --cacert /etc/zabbix/ssl/ca/ca.pem |jq
Fig 2. Executing the HTTPS request to the Docker server from the Zabbix server machine

If everything works so far, then it is time to modify the Zabbix server configuration file and specify the location of the certificate file directories. After that, restart the Zabbix server service.

# nano /etc/zabbix/zabbix_server.conf
SSLCertLocation=/etc/zabbix/ssl/certs
SSLKeyLocation=/etc/zabbix/ssl/keys
SSLCALocation=/etc/zabbix/ssl/ca
# systemctl restart zabbix-server

You will also need to copy the Docker CA file to the trusted CA directory and update the CA list.

# cd /
# cp /etc/zabbix/ssl/ca/ca.pem /etc/pki/ca-trust/source/anchors/
# update-ca-trust extract
Fig 3. The location of certificate files in the directories for each server

Configuring the monitoring in the Zabbix frontend

If you have read this far and decided that this is too much work or this approach is not feasible in your environment (company policy or some other technical limitation), don’t be discouraged so fast! There is another way to get the metrics without changing the Docker configuration, creating certificates, and configuring the Zabbix server config file – simply use an SSH agent-type item to gather the data.

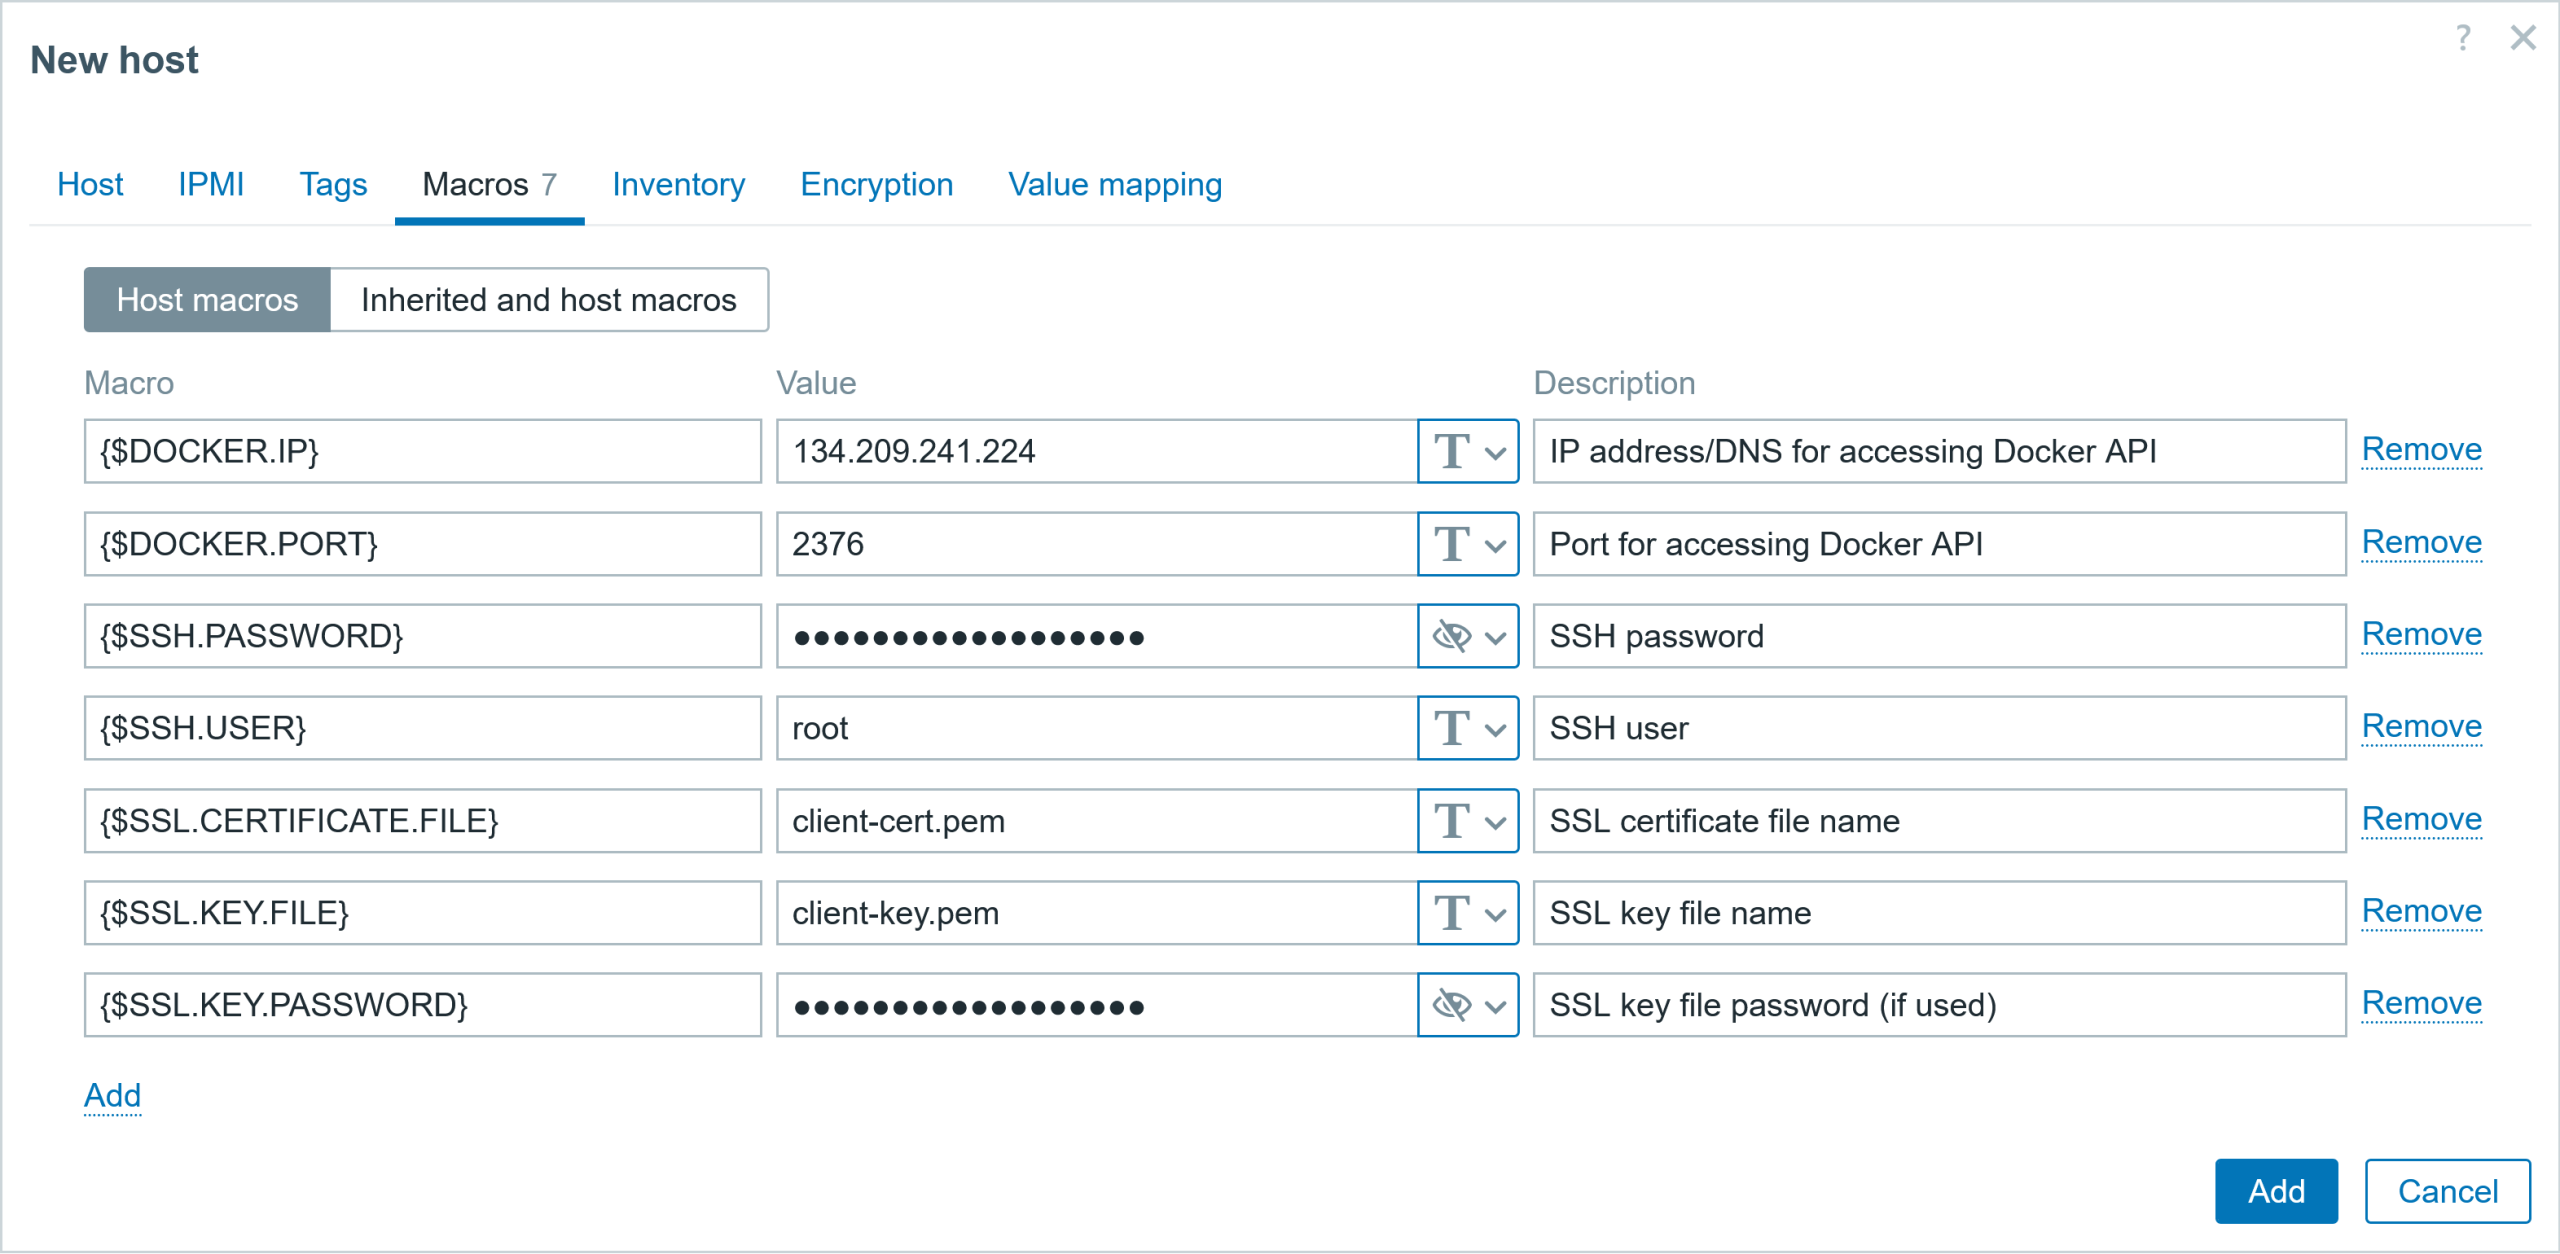
To prepare for both approaches, I will create a host with multiple user macros, which will store the IP address, port, SSH user, SSH password, and SSL certificate information.

Fig 4. Creating new host
Fig 5. Adding user macros to the host

The easy way: SSH agent items

However, what to do if the company policy prohibits installing additional applications to gather data, such as the Zabbix agent (or changing Docker configuration settings, as in this case)? In this instance, you can use other, seemingly simpler ways to gather metrics, such as using the SSH agent item.

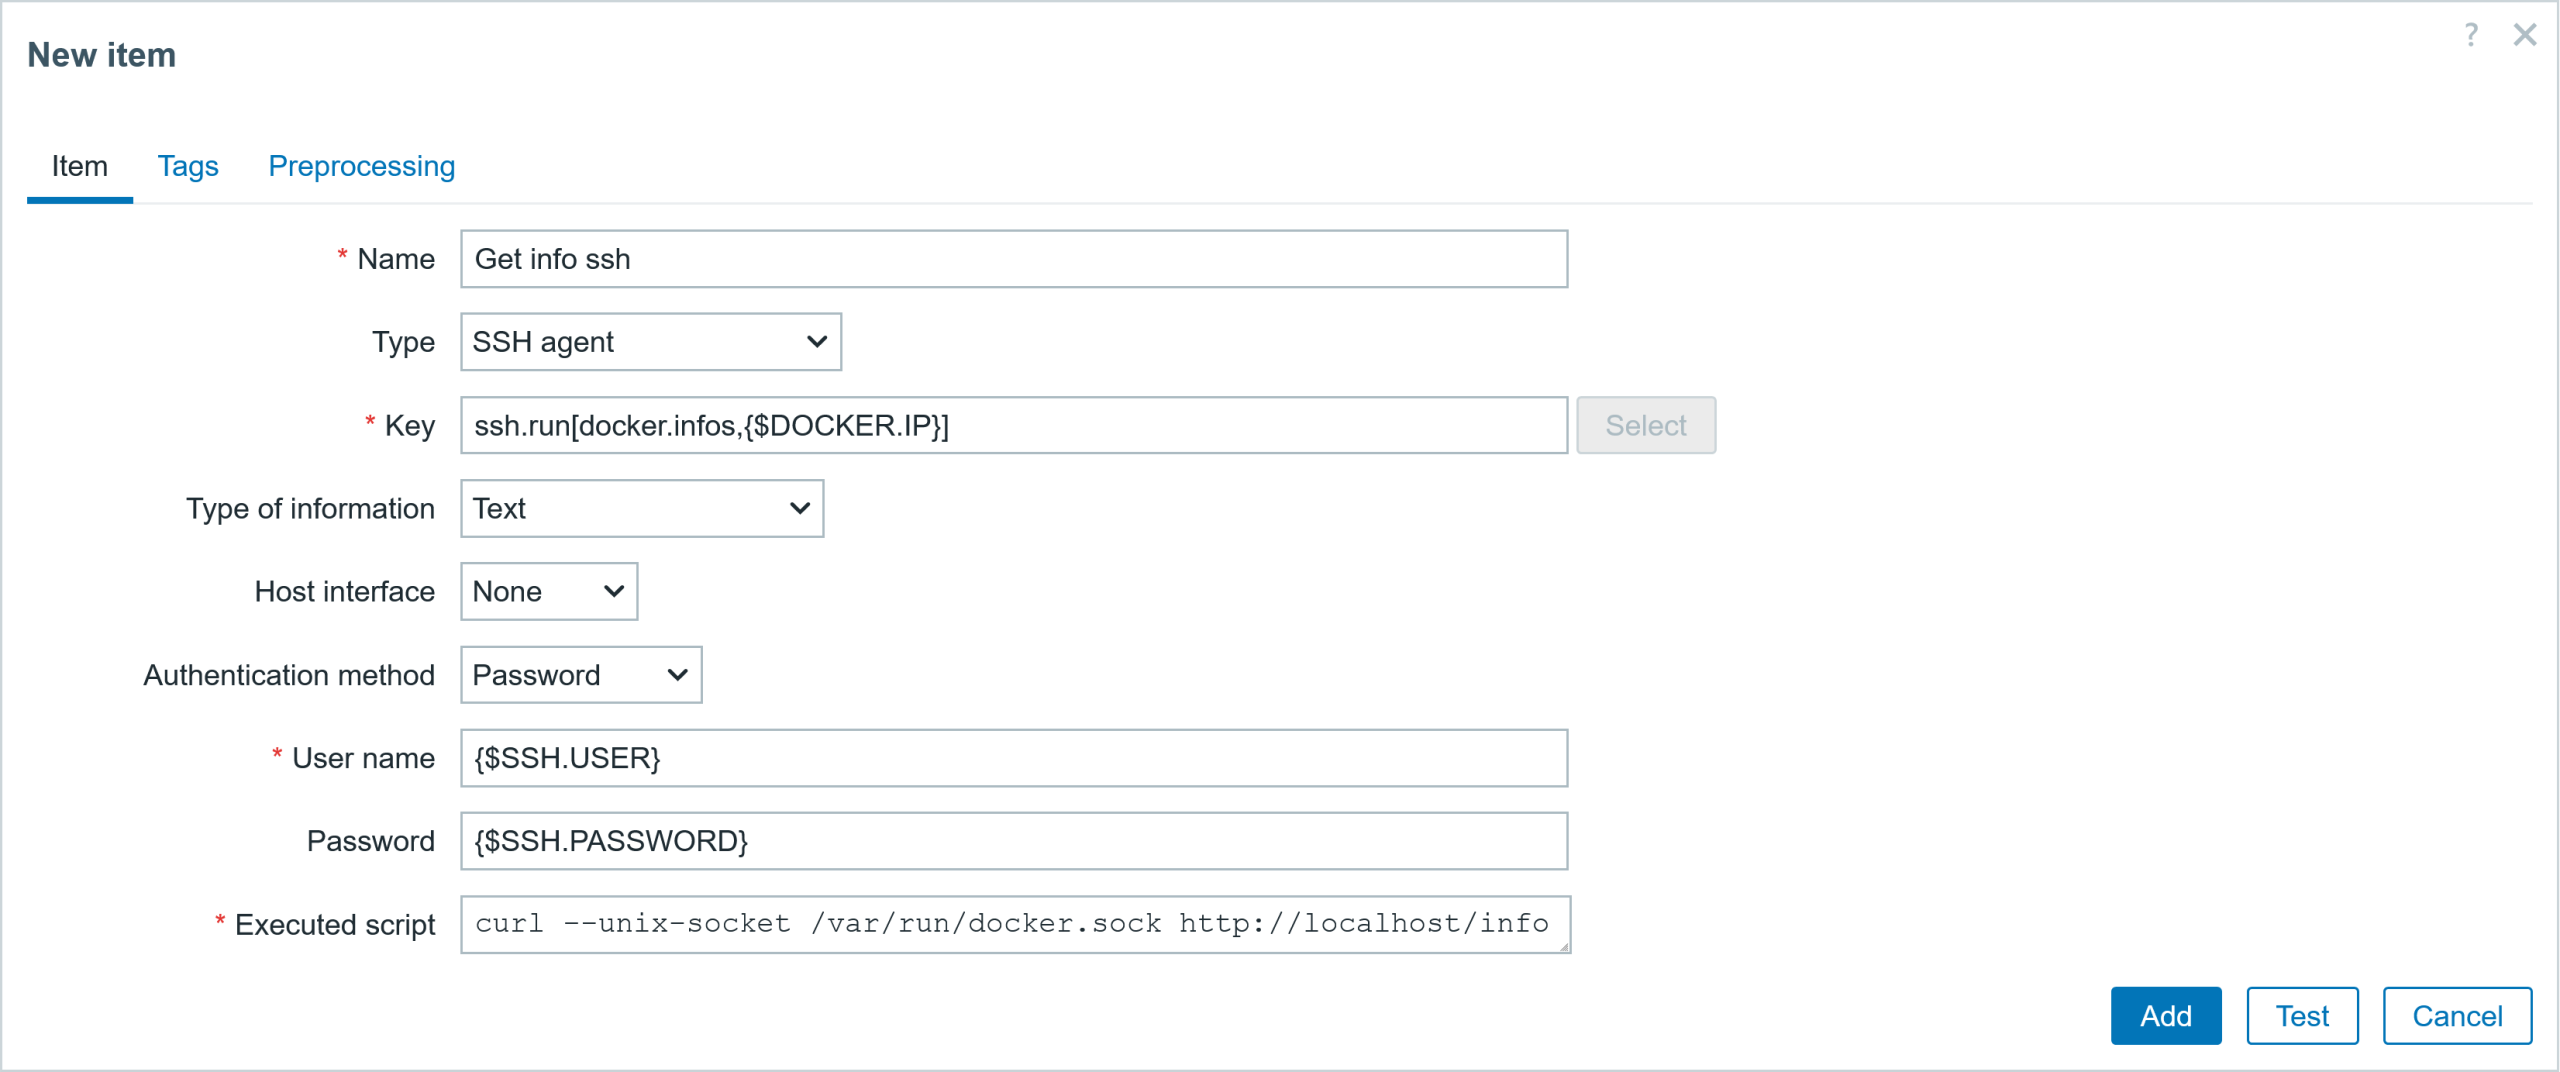
If the only tool you have is a hammer (SSH access), you tend to see every problem as a nail. The old adage “do not fix what is not broken” is still prevalent in this era! In that case, create an SSH agent-type item. Specify the IP address and SSH port in the item key, the username and password for the Docker host, and specify a command to gather the data. For those fields, I will use the previously defined user macros.

Here is an example of the SSH item configuration:

Host: Docker server items 
Item #1
  ▪ Name:          Get info ssh
  ▪ Type           SSH agent
  ▪ Key:           ssh.run[docker.infos,{$DOCKER.IP}]  
  ▪ Type of inf:   text
  ▪ Username:      {$SSH.USER}
  ▪ Password:      {$SSH.PASSWORD}
  ▪ Ex. script:    curl --unix-socket /var/run/docker.sock http://localhost/info
Fig 6. Example of SSH agent item configuration for executing a script on the Docker server

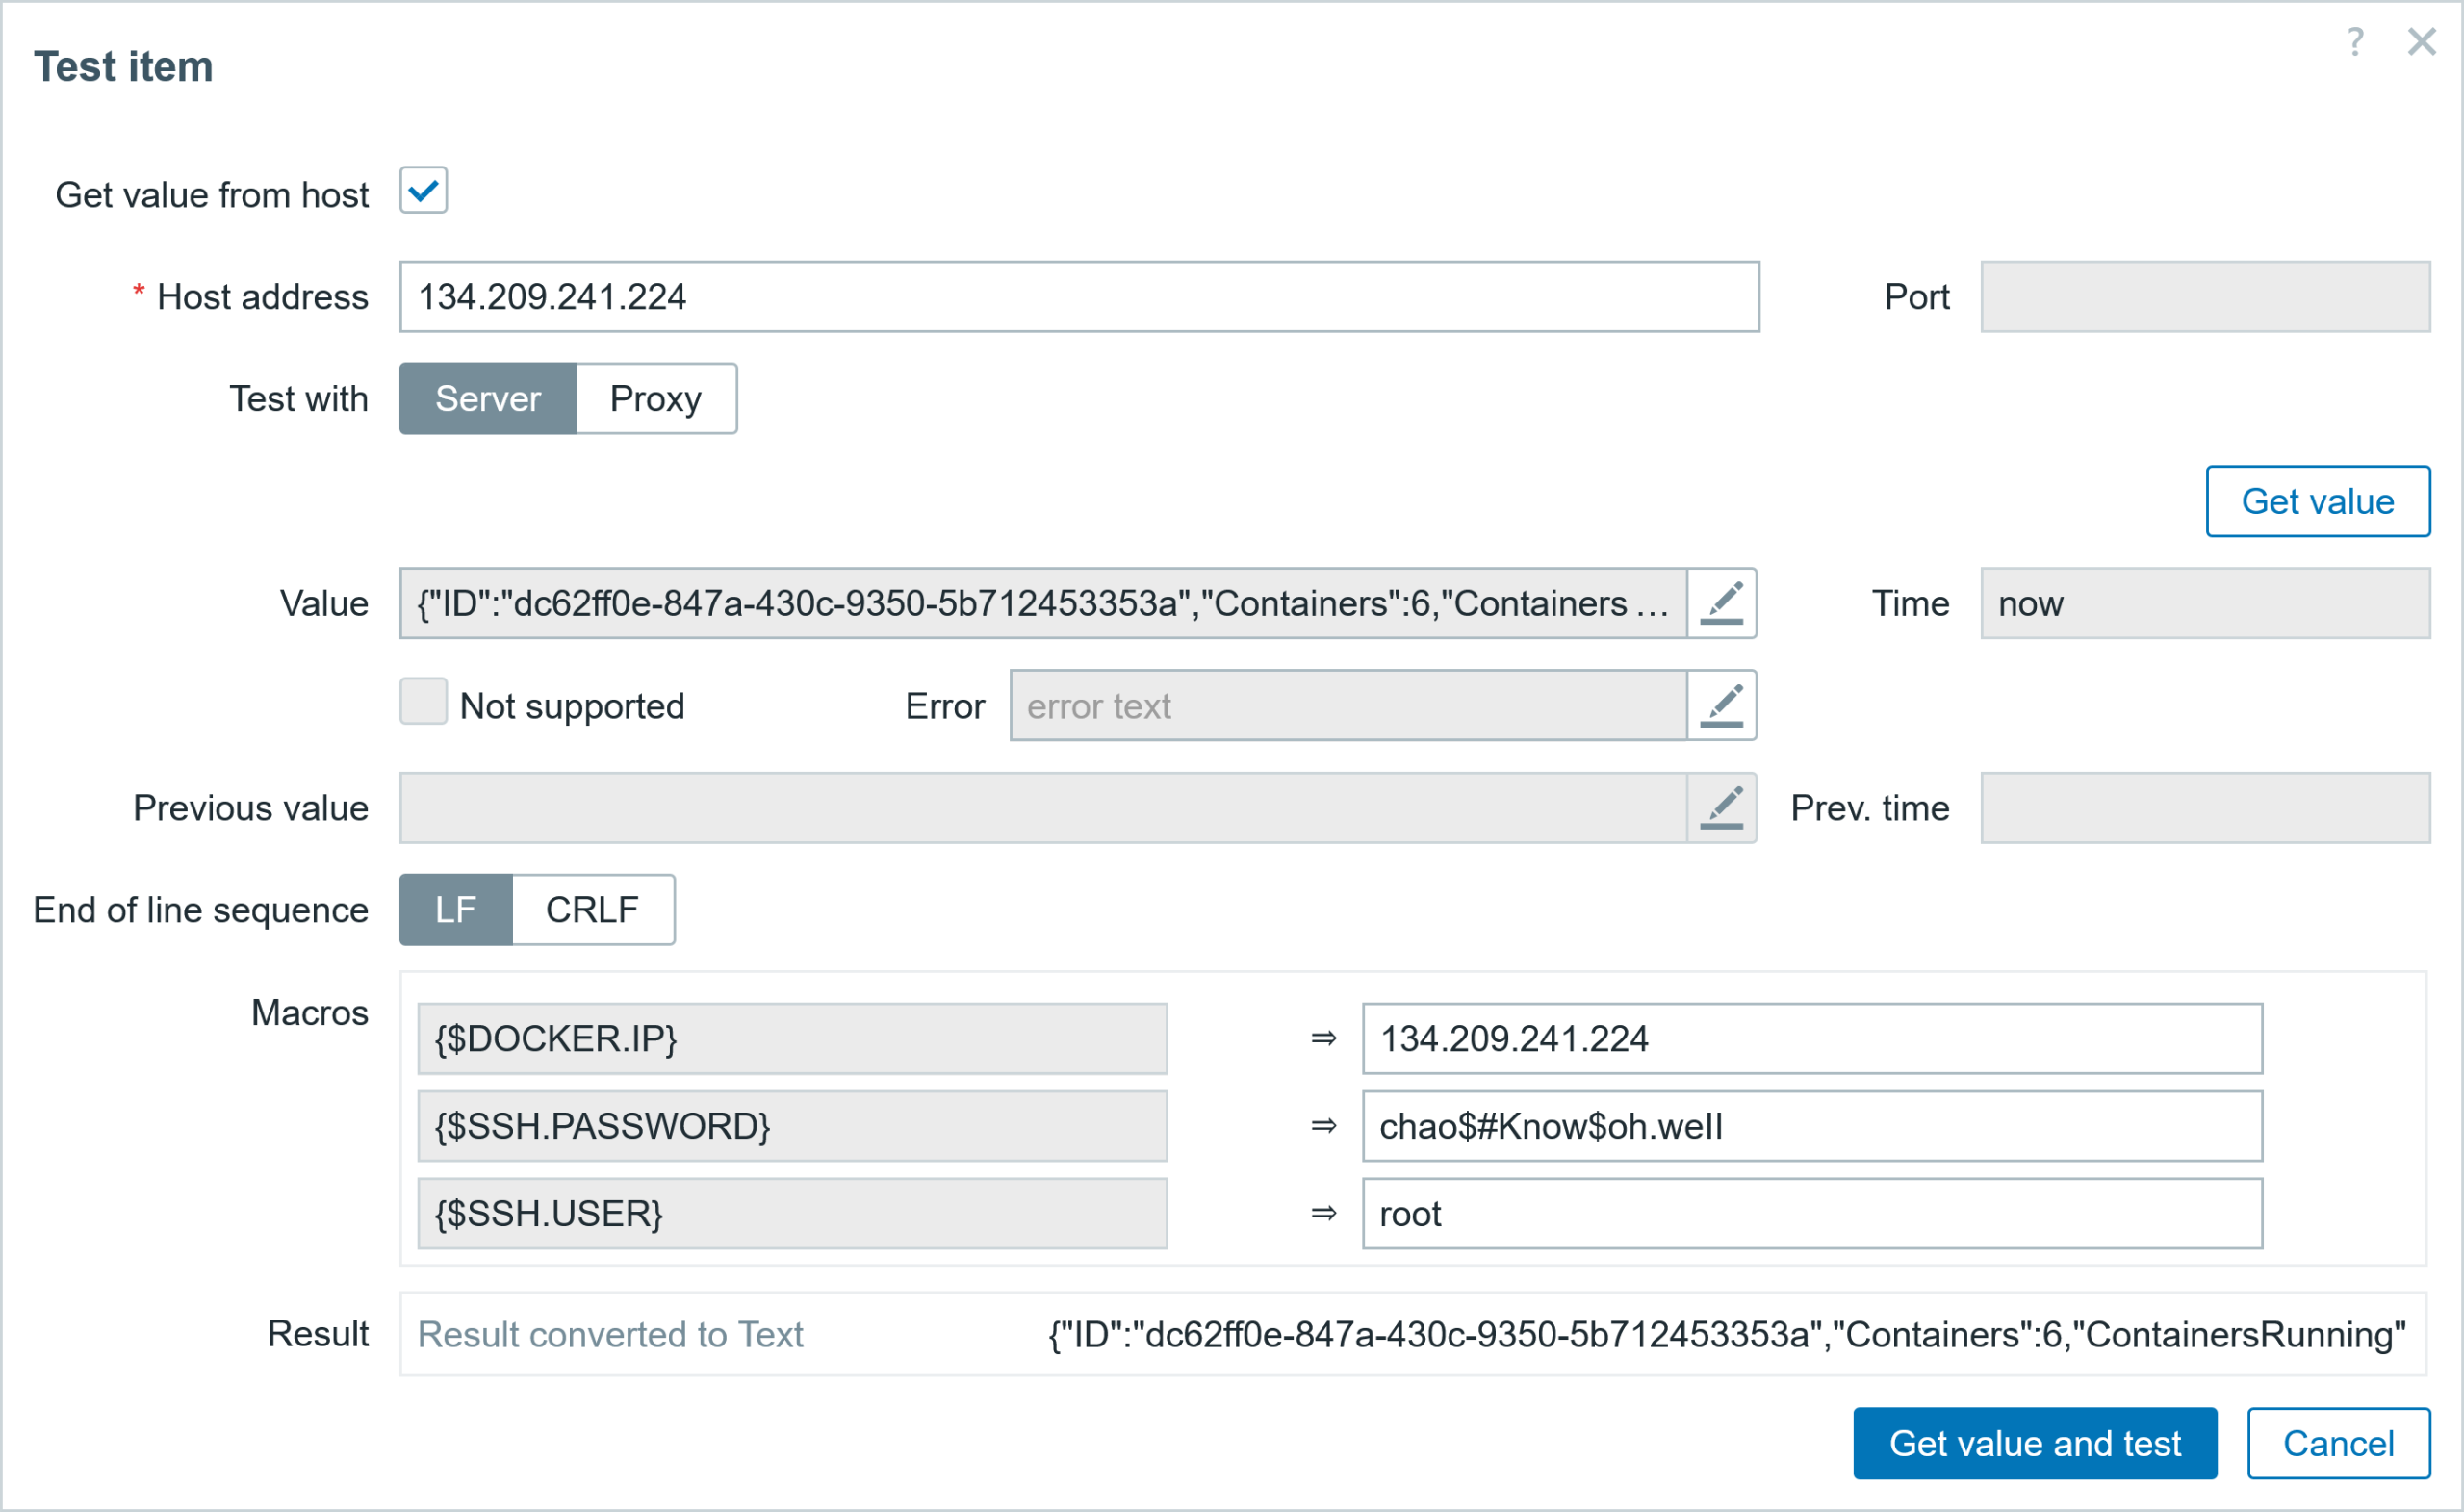
You can also test the item and obtain the same data in JSON format, shown in Fig. 1.

Fig 7. Result of the item test

The right way: HTTP agent

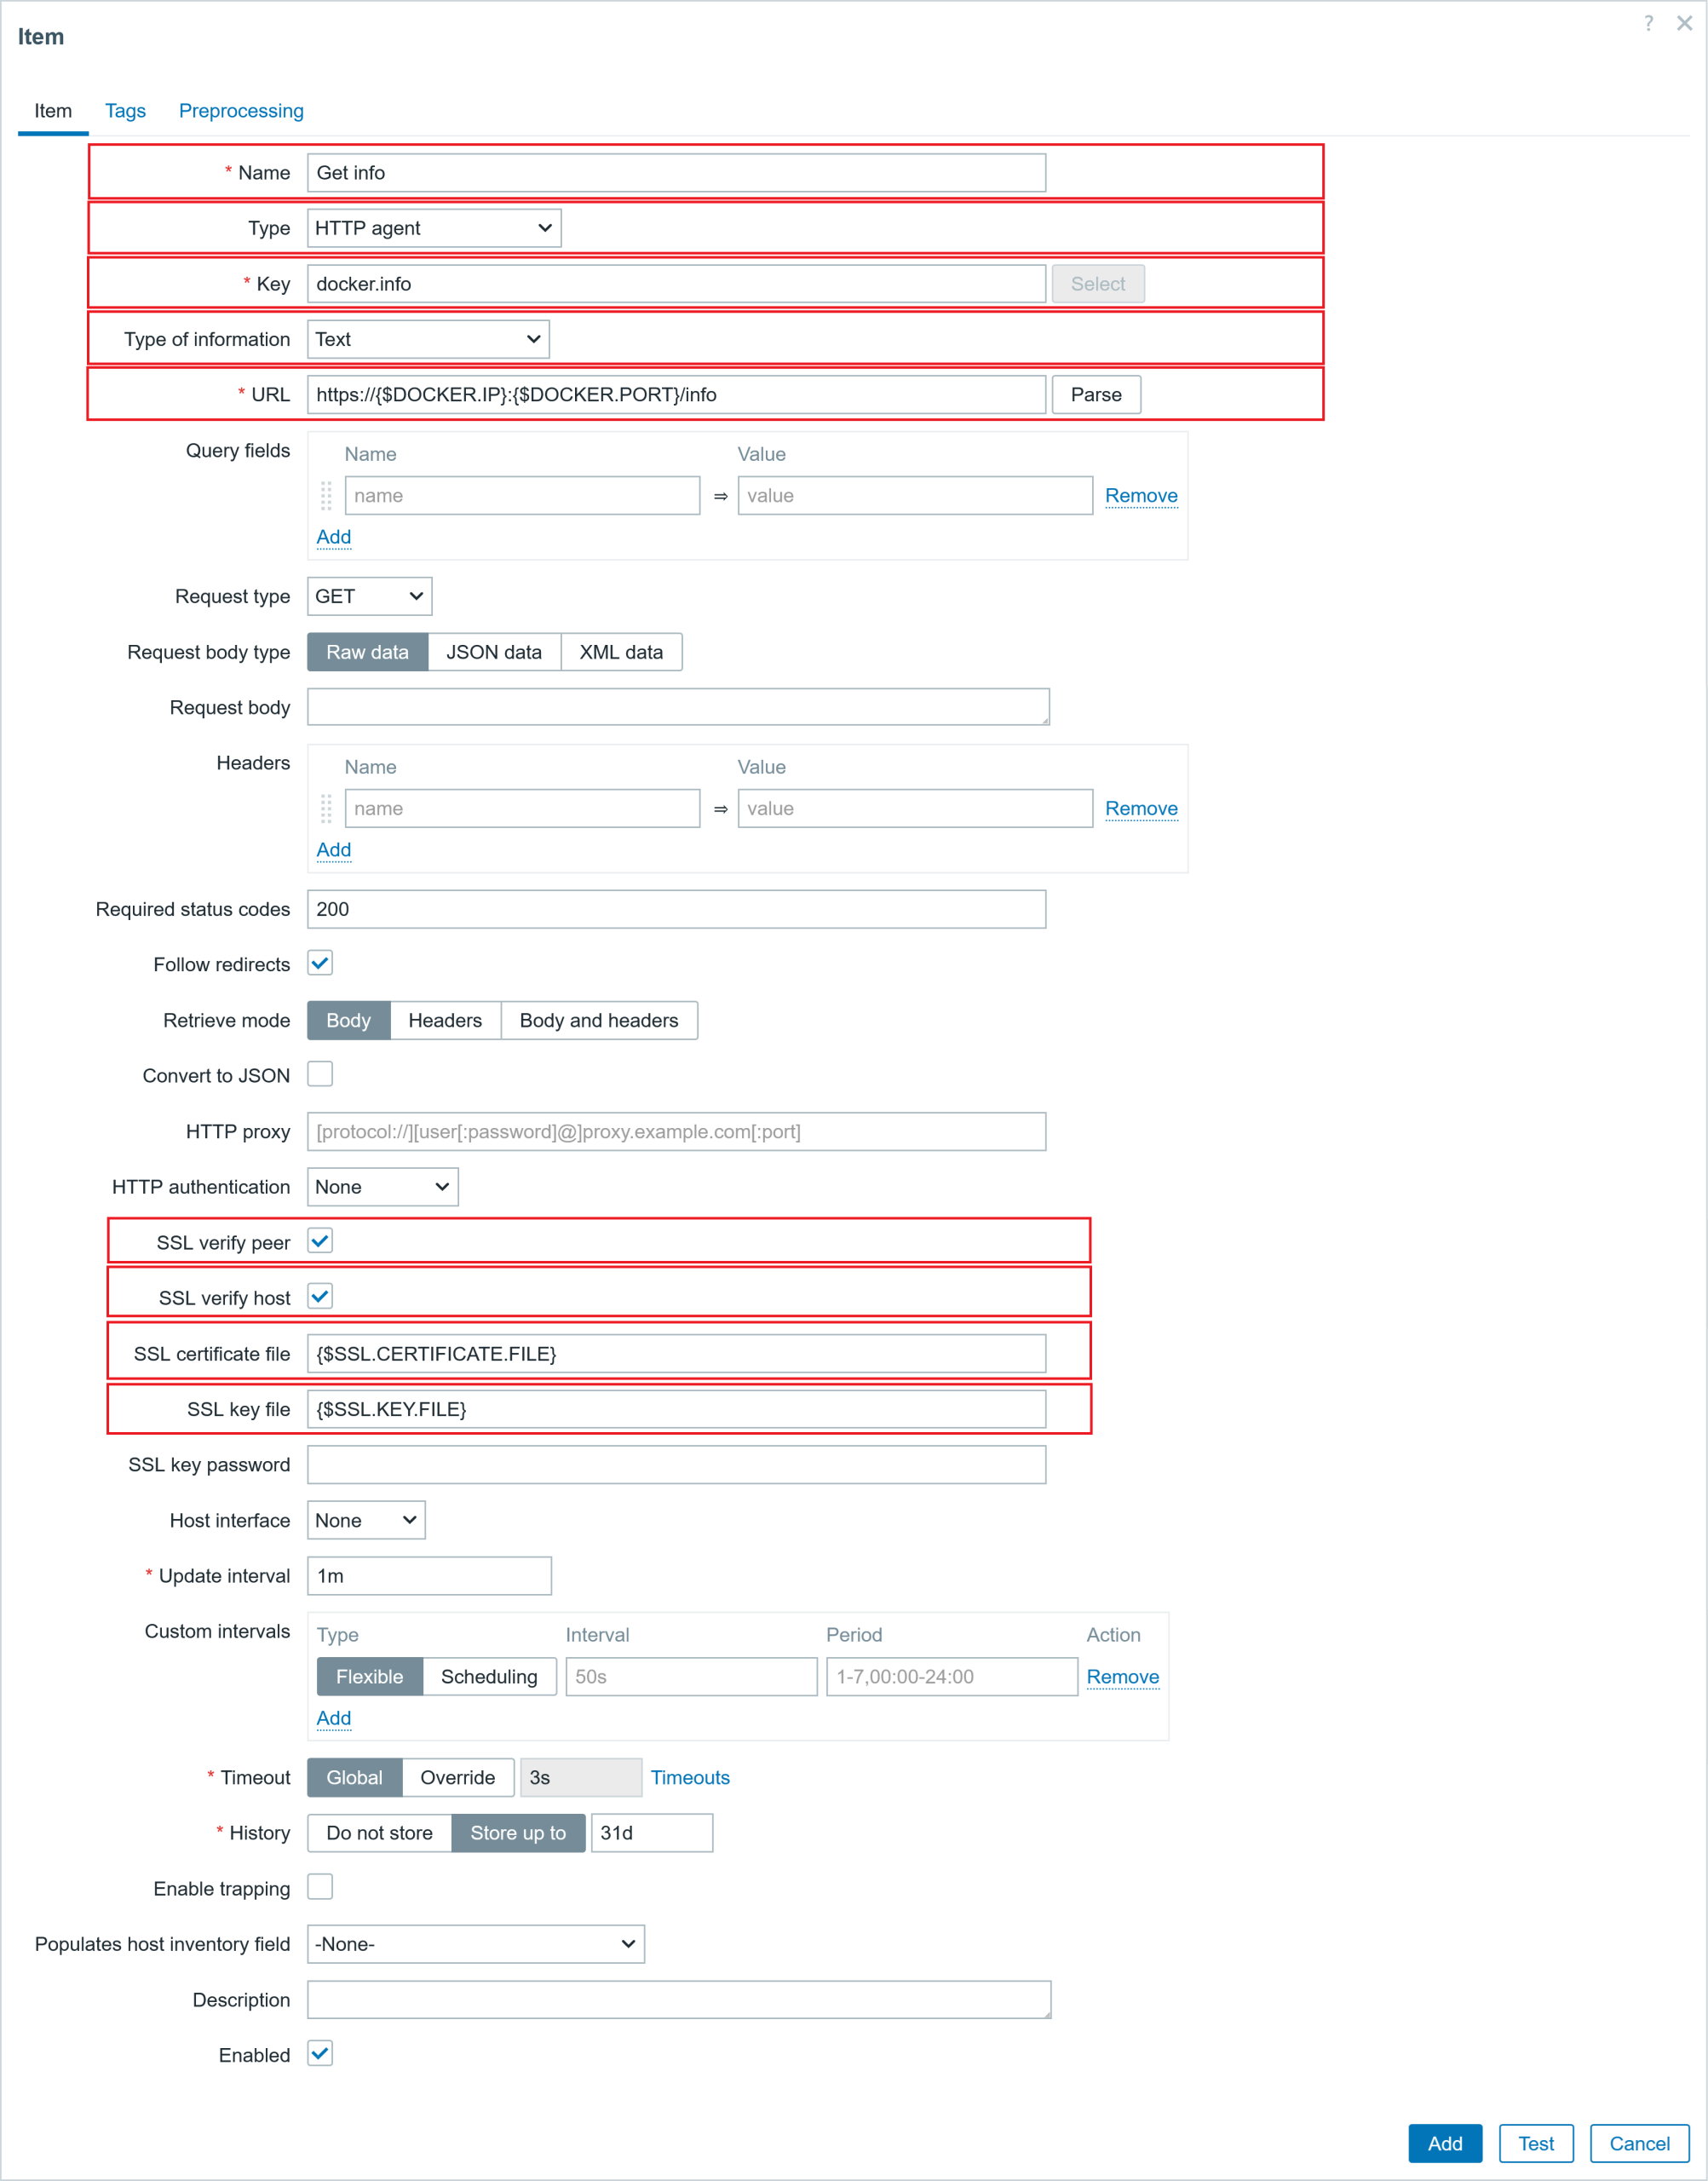
For the other approach, we will be using an HTTP agent item to collect the data in bulk, using Docker API calls. For this, I don’t need to install the Zabbix agent on the Docker server. The authentication of this item will be performed using the certificates that have been copied over. Here are the important parameters in the item:

Host: Docker server items 
Item #1
  ▪ Name:             Get info
  ▪ Type              SSH agent
  ▪ Key:              docker.info    
  ▪ Type of inf:      text
  ▪ URL:              https://{$DOCKER.IP}:{$DOCKER.PORT}/info
  ▪ SSL verify peer: check
  ▪ SSL verify host: check
  ▪ SSL cert. file:  {$SSL.CERTIFICATE.FILE}
  ▪ SSL key file:    {$SSL.KEY.FILE}

Do not forget to test the item (collected data should be the same as in Fig. 2) and add the item. If you have also encrypted the client private key (client-key.pem), you will also need to provide an SSL key password in the item configuration.

Fig 8. Example of the configured HTTP agent item
Fig 9. HTTP agent item collecting the data

Extracting the data

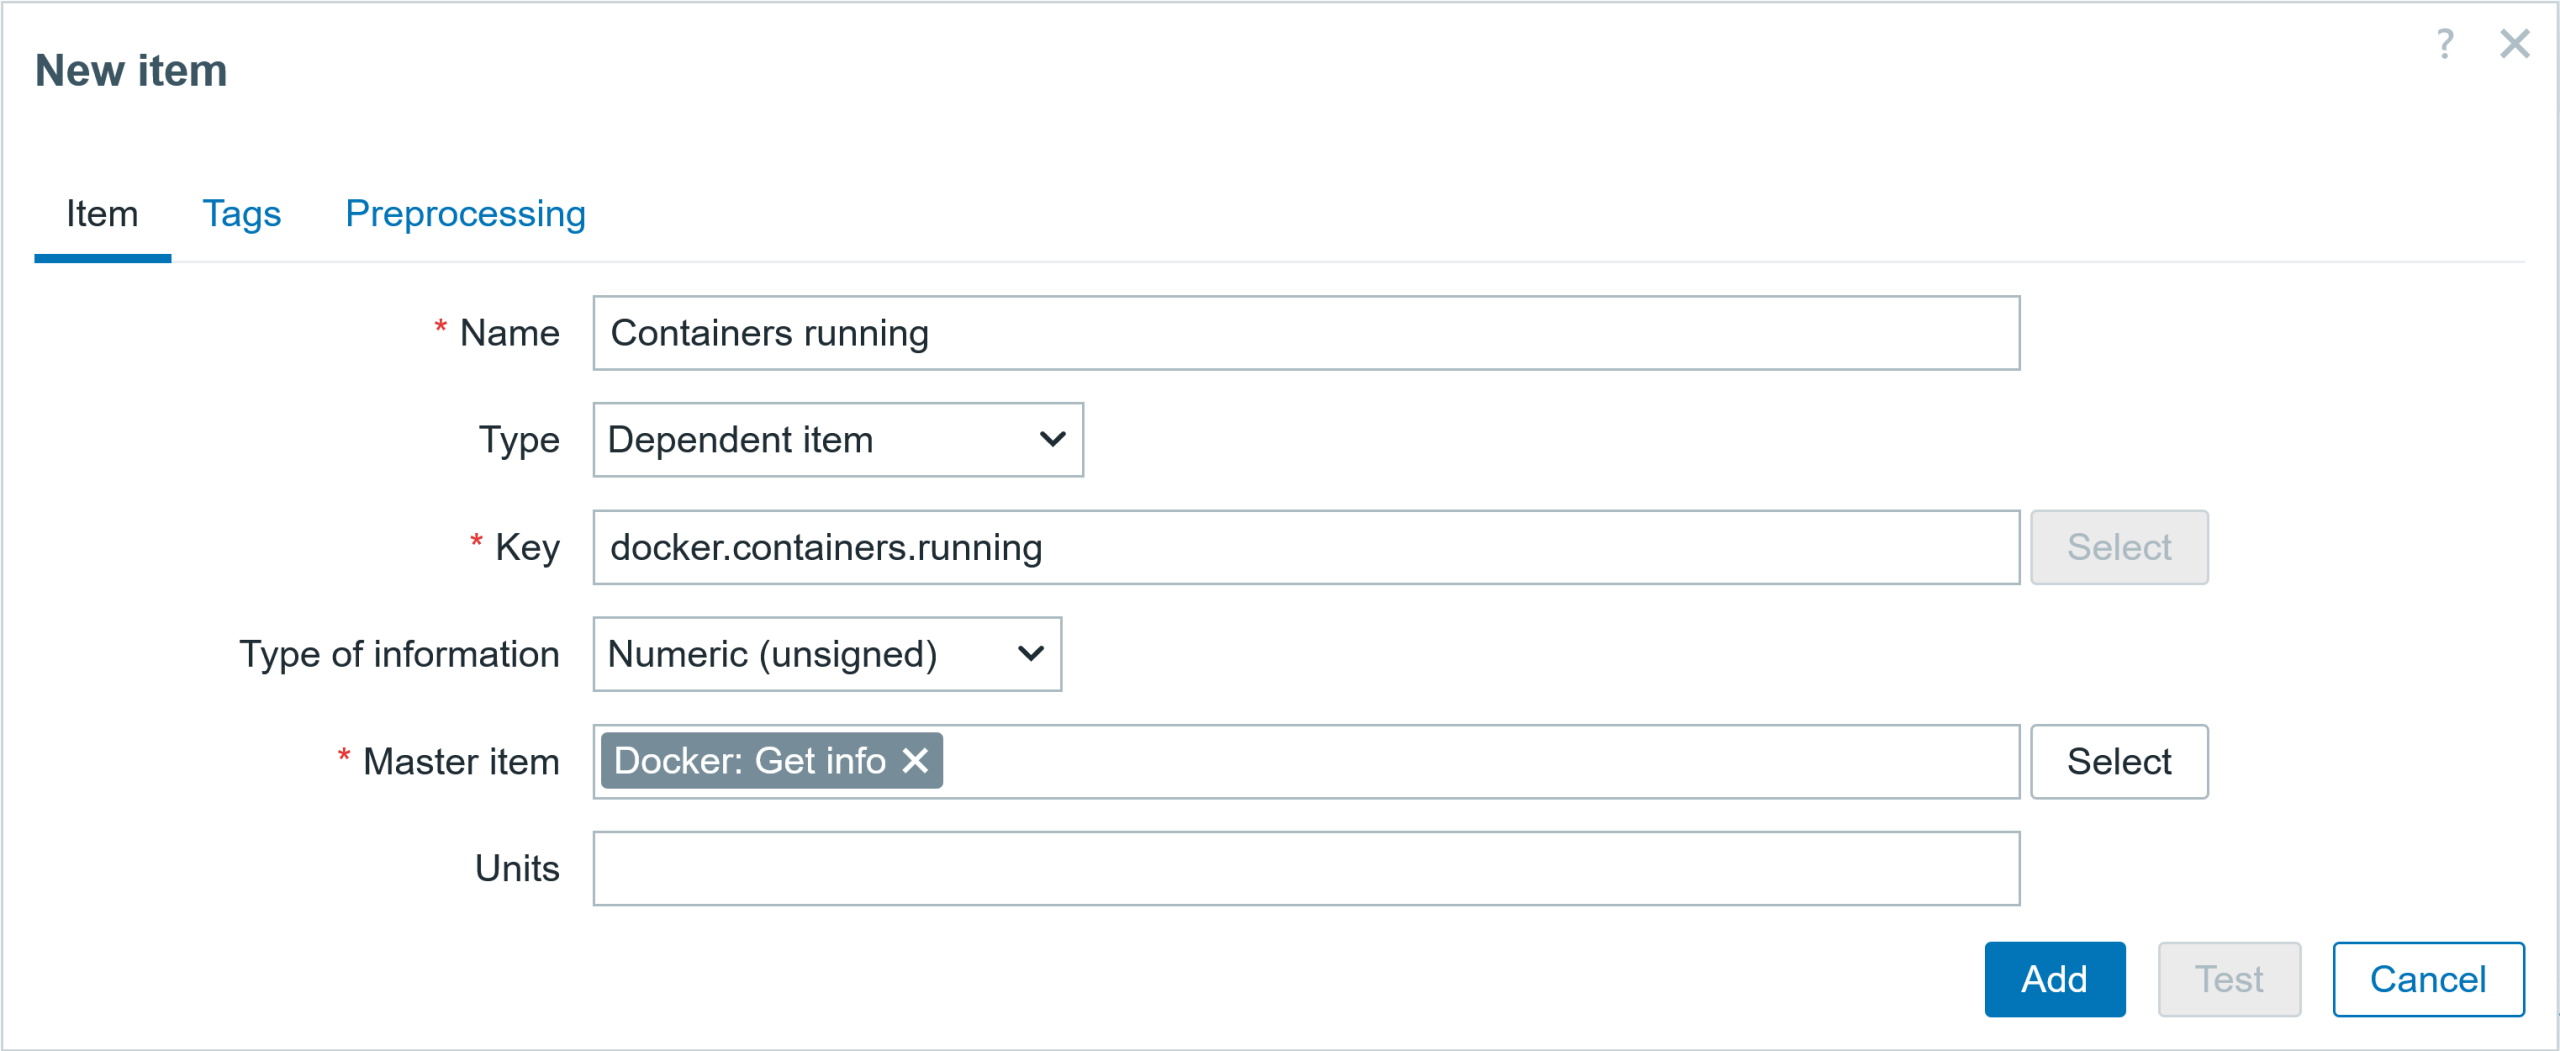
Now we can extract the important metrics by creating dependent items using the master item: Get info. Add a few dependent items to extract metrics, such as the total count, running, stopped, and paused containers. Item configuration parameters are given below the dependent item examples. The item “Containers running” parameter screenshots are shown below, together with the configuration parameters listed.

Fig 10. Dependent item tab to get the number of running containers

Tagging an item will also make your life easier for filtering when you have a legion of items.

Fig 11. Dependent item tag tab to get the number of running containers

In the preprocessing tab, we can use the JSONPath preprocessing step to extract the number of running containers from the master item.

Fig 12. Dependent item preprocessing tab to get the number of running containers
Docker Host items
● Item #1
  ▪ Name: 	Containers running	
  ▪ Type 		Dependent item
  ▪ Key: 		docker.containers.running	
  ▪ Type of inf: 	Numeric (unsigned)
  ▪ Master item	Docker: Get info
  ▪ Units: 	!containers
♦ Tags (name:value) 	
  ▪ component:containers	
♯ Preprocessing
  ▪ JSONPath  	$.ContainersRunning

● Item #2
  ▪ Name: 	Containers paused	
  ▪ Type 		Dependent item
  ▪ Key: 		docker.containers.paused	
  ▪ Type of inf: 	Numeric (unsigned)
  ▪ Master item	Docker: Get info
  ▪ Units: 	!containers
♦ Tags (name:value) 	
  ▪ component:containers	
♯ Preprocessing
  ▪ JSONPath  	$.ContainersPaused

● Item #3
  ▪ Name: 	Containers stopped	
  ▪ Type 		Dependent item
  ▪ Key: 		docker.containers.stopped	
  ▪ Type of inf: 	Numeric (unsigned)
  ▪ Master item	Docker: Get info
  ▪ Units: 	!containers
♦ Tags (name:value) 	
  ▪ component:containers	
♯ Preprocessing
  ▪ JSONPath  	$.ContainersStopped

● Item #4
  ▪ Name: 	Containers total	
  ▪ Type 		Dependent item
  ▪ Key: 		docker.containers.total	
  ▪ Type of inf: 	Numeric (unsigned)
  ▪ Master item	Docker: Get info
  ▪ Units: 	!containers
♦ Tags (name:value) 	
  ▪ component:containers	
♯ Preprocessing
  ▪ JSONPath  	$.Containers

Creating the trigger

I can also configure a trigger to receive a problem event in case some containers are not running. The screenshot of the trigger and parameter configuration is shown below.

Fig 13. Trigger configuration
Trigger
◘ Trigger 
  ▪ Name: 		Some containers are not running
  ▪ Operational data: 	Total: {ITEM.LASTVALUE1}, Running: {ITEM.LASTVALUE2}
  ▪ Severity: 		Warning
  ▪ Expression: 		last(/Docker server/docker.containers.total)last(/Docker server/docker.containers.running)
  ▪ PROBLEM event generation mode: Single
  ▪ OK event closes: All problems

Getting more data

Docker Engine also includes previous API versions. If no version of the API is specified in the URL, then the latest installed version will be used (using the API without a version is deprecated and will be removed in a future release). So even if you have the latest Docker installed (and you should always update to the latest version!), you can still use the older API calls by specifying the version (but once again, check what works).

Docker API offers several API calls that can be used to collect information about containers, images, container performance statistics, networks, volumes, or make changes to them.

Also, for more API calls, please explore this page: https://docs.docker.com/reference/api/engine/latest/.
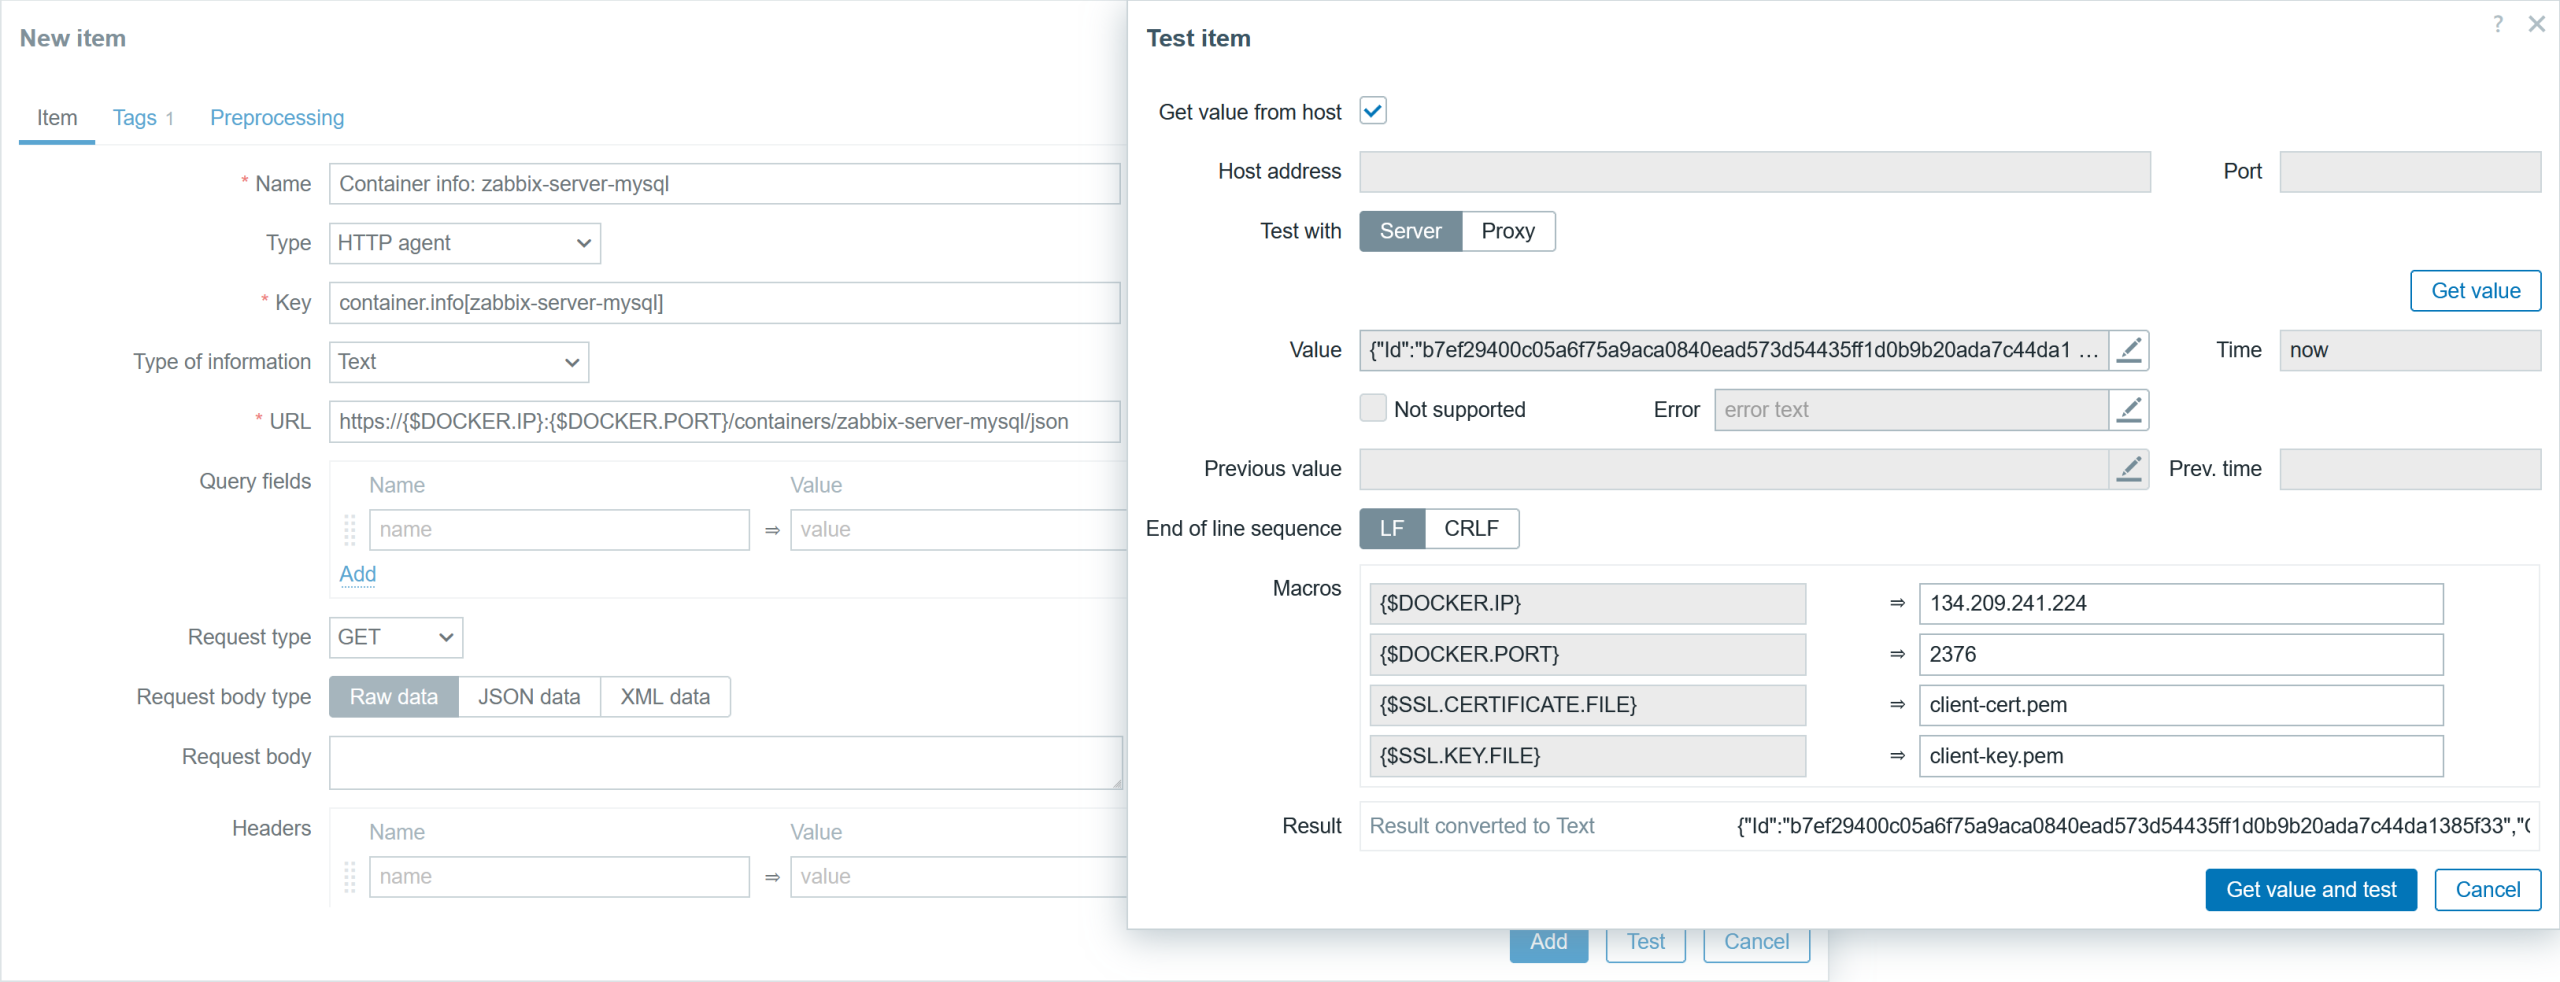
As an example, I will create another item to gather specific container information. The item configuration will differ from the one in the example in Fig.8 with the following parameters: different URL, item name, and key.

Here is an example of the ULR field (replace {$CONTAINER} with the existing container name):

https://{$DOCKER.IP}:{$DOCKER.PORT}/containers/{$CONTAINER}/json
Fig 14. HTTP agent item to get low-level information about a specific container: tomcat

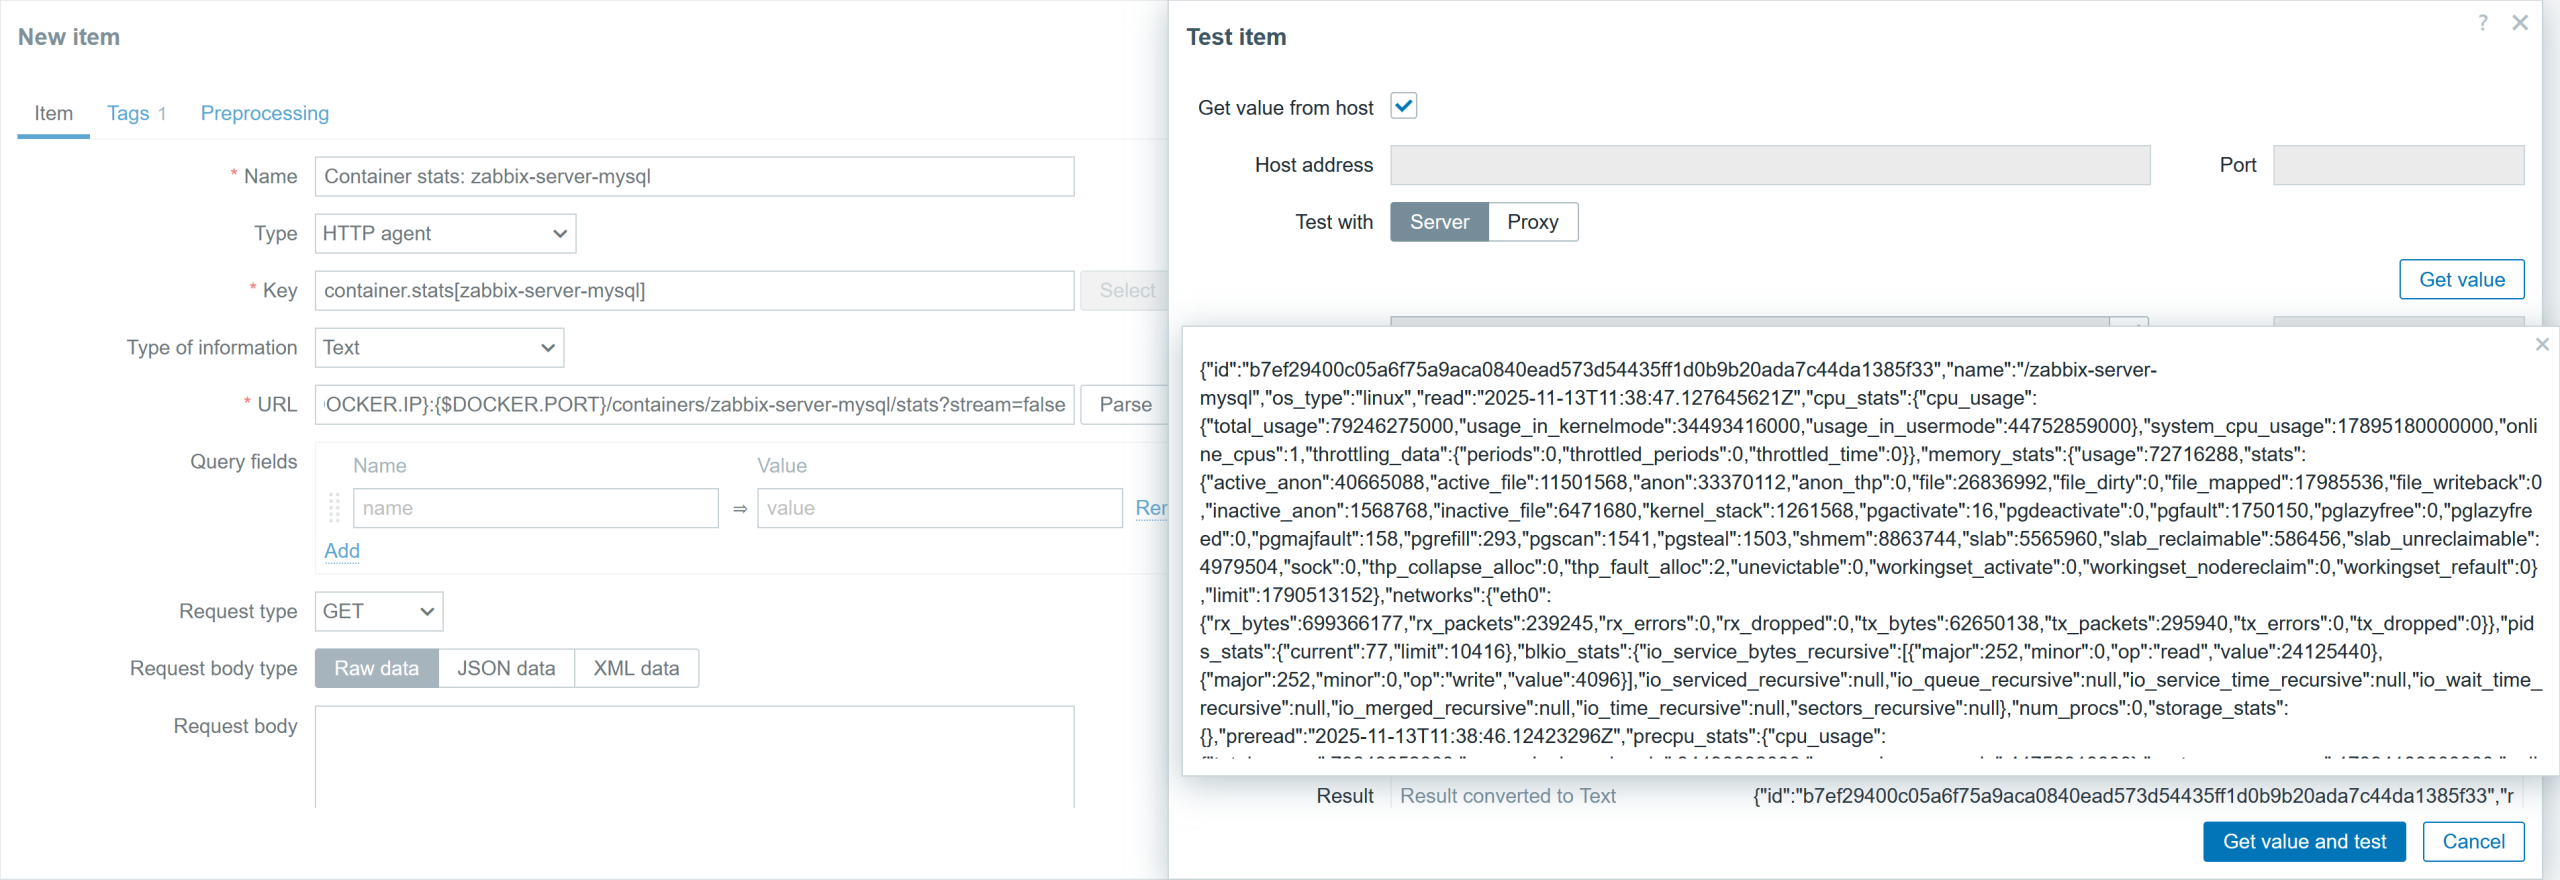
You can also get the container performance data with a different URL. The item configuration will differ from the one in an example in Fig.8 with the following parameters: URL, item name and key. Here is an example of ULR field (replace {$CONTAINER} with the existing container name):

https://{$DOCKER.IP}:{$DOCKER.PORT}/containers/{$CONTAINER}/stats?stream=false
Fig 15. HTTP agent item to get performance information about a specific container: zabbix-server-mysql

Testing the trigger

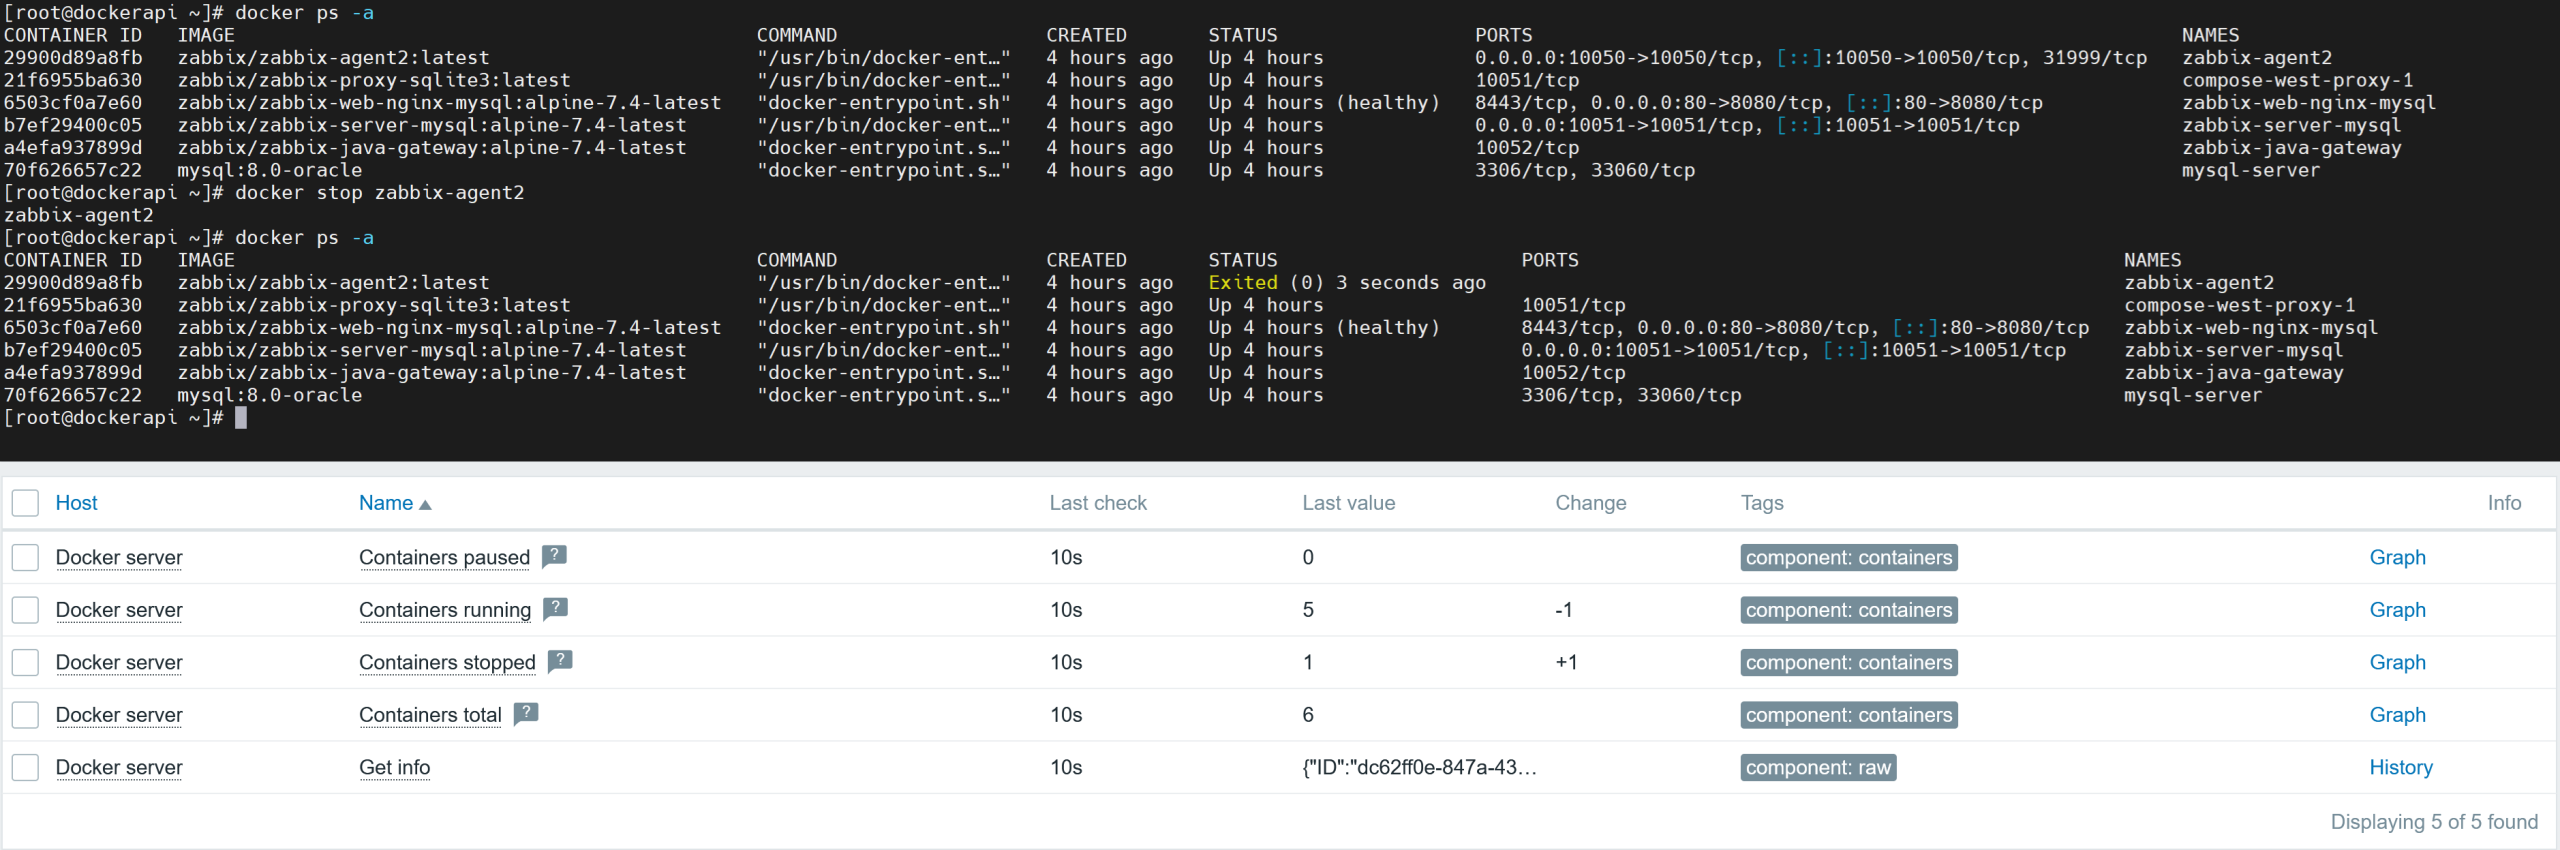
We can test if the data returned by the Docker API is as it seems, right? I have five containers created using the ‘docker run’ command, and one using the ‘docker compose’ command. Let’s stop the container made from the ‘docker run’ command and check if it will be reflected in the collected metrics.

Fig 16. The latest item data when stopping a Docker Compose container

As you can see in Figure 13, the stopped container shows up in the metrics collected by Zabbix through Docker API and in the Docker CLI. The Docker host item shows 1 stopped container and 5 running containers; the total number of containers is 6.

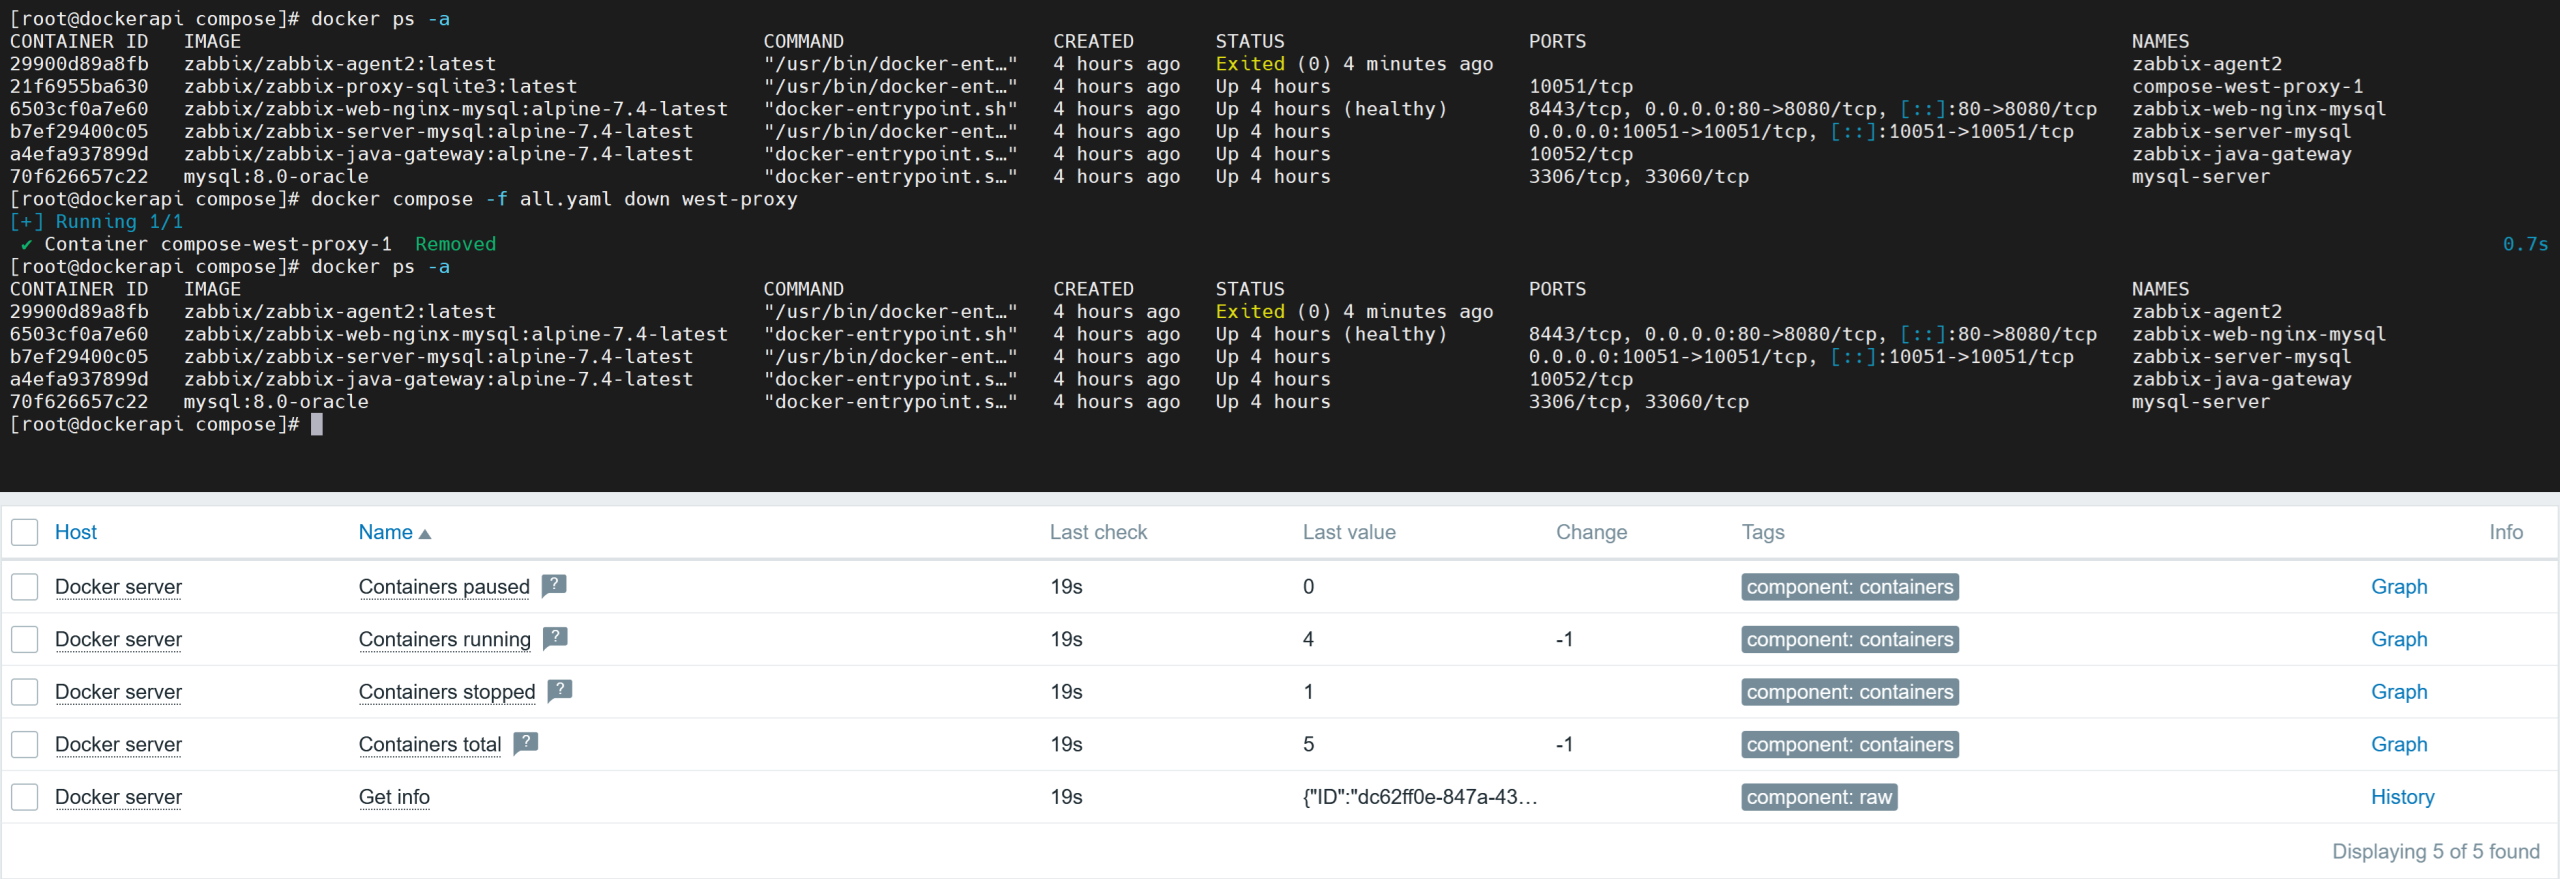
If you use the command “docker compose down” instead, the container will be stopped and removed altogether. That means, the total number of containers will also decrease by one, along with its status, as shown in Fig. 17. Therefore, make sure you understand what each command does and how it will impact your monitoring data.

Fig 17. The latest item data when using Docker Compose down for a container

In summary

Now you know more about how to collect the data from Docker using HTTP requests. Similar approaches can also be used to collect data from other applications through an API. You can select what metrics you want to extract, create triggers, graphs, or make a template if you wish.


The post Zabbix and the Docker API, Part 1: Inspect appeared first on Zabbix Blog.

Kernel code removals driven by LLM-created security reports

Post Syndicated from corbet original https://lwn.net/Articles/1068928/

There are a number of ongoing efforts to remove kernel code, mostly from
the networking subsystem, as an alternative to dealing with the increase in
security-bug reports from large language models. The proposed removals
include ISA
and PCMCIA Ethernet drivers
, a pair
of PCI drivers
, the ax25 and amateur
radio subsystem
, the ATM protocols and drivers,
and the ISDN
subsystem
.

Remove the amateur radio (AX.25, NET/ROM, ROSE) protocol
implementation and all associated hamradio device drivers from the
kernel tree. This set of protocols has long been a huge bug/syzbot
magnet, and since nobody stepped up to help us deal with the influx
of the AI-generated bug reports we need to move it out of tree to
protect our sanity.

Втора цедка на „класацията“. Превод и локализация

Post Syndicated from original https://www.toest.bg/vtora-tsedka-na-klasatsiyata-prevod-i-lokalizatsiya/

Епоха на империите
Age of Empires

Кредо на убиеца
Assassin’s Creed

Бастион
Bastion

Черно и бяло
Black & White

Цивилизацията на Сид Майер
Sid Meier’s Civilization

Светлосянка: Експедиция 33
Clair Obscur: Expedition 33

Тъмни души
Dark Souls

Deus Ex
Deus Ex

Опозорен
Dishonored

Готика
Gothic

Грандиозни автокражби
Grand Theft Auto

Полуразпад
Half-Life

Герои с мощ и магия 3
Heroes of Might and Magic III

Индика
Indika

Притчата за Стенли
The Stanley Parable

Звезден занаят
StarCraft

Да оцелееш на Марс
Surviving Mars

Системен шок
System Shock

Вълкът сред нас
The Wolf Among Us

Крадец
Thief

Цар: Тежестта на короната
Tzar: The Burden of the Crown

Вампир: Маскарадът – Кръвно родство
Vampire: The Masquerade – Bloodlines


Втора цедка на „класацията“. Превод и локализация

Миглена Николчина: Преди да обсъдим втората цедка на нашата игра на класация – нейните правила ще намерите в предишната ни публикация, – ще отворя един проблем, възникнал от реакциите на първата ни цедка. Наред с други драми, спорове възникнаха около превода на заглавията – едно от тях беше Baldur’s Gate. От една страна, това е топоним, не би следвало да се превежда, така както не би трябвало да се преведе, да речем, Димитровград. От друга страна, Димитровград може да бъде разгърнат като Градът на Димитров – Dimitrov’s City. С още по-голямо основание в един фантастичен свят можем да направим това с „Портата на Балдур“. Пример е великолепният превод на романа „Властелинът на пръстените“ от Любомир Николов. Той превежда топонимите в романа, когато са значещи неологизми. Николов е гений – не всички сме такива. По-същественото е, струва ми се, че не го е мързяло.

Ако нещо е зле преведено, нека се поправи, а не да се въздига езиковият мързел в добродетел.

Защото не само заглавията са проблем в областта на игрите, проблем е въобще преводът и „локализацията“ (ужасна дума, но хубавото ѝ е че, струва ми се, легитимира по-голяма творческа свобода в превеждането). Докато Съюзът на преводачите разбере в кой век сме, вихрят се всякакви идеи, включително доминиращата досега, че игрите няма защо да се превеждат и локализират.

Ще контрирам с любимия ни полски пример: преди да се стигне до „Вещерът“ и „Киберпънк“, през 90-те има етап на полска „локализация“ на игрите („Готика“ е първата, доколкото си спомням), с която създателите им започват. Тоест до световния успех на поляците се стига с начална точка в локализацията. У нас даровитите ни програмисти отказват да разберат, че

езикът има значение.

При все че правим прекрасна игра още в края на 90-те (стратегията „Цар“), до грижите с локализацията едва сега стигаме, и то благодарение на доброволческа страст¹. Дори съм изненадана, че се появиха проекти, посветени на локализацията – кой зад кулисите най-сетне се е сетил? Бях поканена да говоря в рамките на такъв проект и така и не успях да се преборя да не ме наричат „академик“. Всеки, който знае български и английски, ще разбере каква е смешката в случая и симптом на какво е.

Еньо Стоянов: Всъщност това, че въпросът за превода поразбуни духовете, е добър знак – свидетелства, че

има все пак жажда игрите да проговорят и на български език.

Разбира се, „локализацията“ се оказва сериозен препъникамък – производството на игри струва скъпо, трудоемко е, отнема време и е съпроводено със сериозен риск, поради което дизайнерите търсят колкото може по-широка пазарна реализация. В това отношение България вероятно им изглежда твърде малък пазар и оттук дори българските разработчици не са склонни да инвестират в професионално оформен български вариант на собствените си заглавия. По темата за превода на чуждестранни игри, особено от големи производители, вероятно сме просто невидими. Разбира се, този проблем си има решение, и то не само в доброволческите форми, които Миглена указва – ако българската държава започне да гледа на игрите като на сериозна и съществена част от културния живот, би могла да подпомага финансирането на „локализацията“ така, както през културни програми прави това за издаването на преводни книги.

Въпросът за достъпността на игрите на български е съществен и в светлината на собствените ни изготвяни тук импровизирани списъци с препоръки, тъй като засяга пътищата на рецепция на видеоигрите, както и тяхната социализация и социализацията на играчите им не само в някакъв абстрактен, универсален и поради това глобален, но и в локален план.

Северина Станкева: Относно рецепцията ми се струва важно да упоменем и нещо, което вече засегнахме накратко, когато говорихме за посткомунистическото във видеоигрите – обстоятелството, че в България няма култура на превода на игри, е свързано и с факта, че първоначално битуваха пиратски версии предимно на английски и руски език. Докато игрите започнат да се възприемат институционално като сериозен феномен на изкуството или културата (нещо, което така и още не е станало на практика), българският играч вече си беше създал речник от чуждици. Следователно понастоящем е лесно да се изходи от завареното положение и въобще усилията в тази посока да се избягват, а парите да не се харчат непрагматично с идеалистични цели нито от държавата, нито от разработчиците.

Това, разбира се, не е извинение. В „Игромислие“ се опитваме да вървим срещу течението, което, естествено, е съпроводено и от грешки, и от трудности. В тази втора цедка отново има преводачески главоблъсканици („Голямата автомобилна кражба“, Grand Theft Auto, е може би образцова такава), но освен проблема за езика, тази класация успя да отвори и проблема за общността, което на мен лично ми е много симпатично.

Миглена Николчина: Добрият преводач има куража да не робува на буквалния превод с всички произтичащи от това рискове. В разговора, за който ви споменах и който при целия си ентусиазъм е оповестен на „изяден“ български език – но да не забравяме, той е и почти уникален, сам юнак на коня, – участваха Никола Петров и Георги „Дао“ Димитров, съответно сценарист и продуцент на междувременно излязлата игра с нелекото за превод заглавие Chip ’N Clawz vs. The Brainioids (разбира се, какво се случва тук с английския, е също интересен въпрос). Играта – наред със субтитри на още десетина езика – е снабдена и с български. Тя е цветна, забавна и много детска – дали субтитрите ще помогнат на възрастта, за която е подходяща, не съм сигурна. По-интересното в случая е, че българският екип беше открил удоволствието от търсенето на превод на английските неологизми; бяха открили – каква изненада, – че преводът е творчески процес и често пъти предполага пренаписване.

Аз обаче, като се изключи въпросният разговор, не намирам играта им отразена по никакъв начин в българските медии. Затова пък до мене достигна мълвата, че почти половината български екип е бил съкратен… Дали нямаше да помогне – освен институционална подкрепа, тук съм съгласна с Еньо – една по-отворена, „по-хибридна“ медийна среда? Как родителите, които често са ме питали какви игри бих препоръчала за децата им (а аз обикновено не знам какво да кажа), да научават за игри като тази?

Така, както са нещата в момента, от едната страна се оформя гетото с изядения български, от другата – здравословният, но често прекаляващ български консерватизъм, който ще разбере след 30 години за какво е идело реч, а ние междувременно сме се оказали сплескани по средата. Е, нека...

И може би стана време да се върнем на втората цедка такава, каквато се получи. Изненадващо, при втората цедка имаме повече съвпадения! Отдалечава се моментът, в който всеки меланхолно да разкаже за самотните си избори – както каза единият от синовете ми тези дни, „имам чувството, че „Дракан, Орденът на Пламъка“ (Drakan: Order of the Flame) само в нашето семейство сме я играли“! Но оказва се, в PC Gamer съвсем неотдавна са си спомнили за нея!

Чавдар Парушев: Да посоча заглавията, които играя и преигравам периодично, за да видя кои от тях се играят от други хора по подобен начин. Това беше критерият ми при подбора на заглавията и в първата, и във втората цедка на играта ни на класация.

Колебаех се дали да не подбера игрите, които съм играл заедно с хора. Не непременно в мрежа, но включително и солови заглавия, в които един или няколко човека сме седели на един компютър и сме решавали заедно как да върви играта. В средата на 90-те, преди да се появят първите компютърни клубове, а и изобщо компютрите да станат по масово достъпни, това беше начин на игра. Компютрите в квартала се брояха на пръсти. Тъкмо в такава форма съм играл първото издание на „Цивилизация“ (Sid Meier’s Civilization). Достъпната алтернатива бяха аркадните автомати с жетони в приземния етаж на НДК и на други места (достъпни поне докато не свършат джобните). Любопитно е колко и кои от най-играните на такива аркадни автомати игри, като „Златната секира“ (Golden Axe), „Смъртоносна битка“ (Mortal Kombat) и „Кадилаци и динозаври“ (Cadillacs and Dinosaurs), биха намерили място в класация.

Във втората пресявка обаче попадат заглавия като „Звезден занаят“ (Starcraft), „Полуразпад“ (Half-Life) и „Епоха на империи 2“ (Age of Empires 2: The Age of Kings), които се играеха изключително много в периода на компютърните клубове и игрите в мрежа между 5–10 човека. Това би бил форматът, в който и към момента бих предпочел да играя тези игри.

Приятна изненада беше да видя, че не съм единственият, който все още е склонен да играе „Черно и бяло“ (Black & White). Игра, която към днешна дата се намира по-трудно, а и поставя определени предизвикателства за игра на нови машини. Въпреки изминалите 25 години от излизането ѝ тя остава много свежа по своя замисъл. Освен да поставя играча в позицията на бог в малкия игрови свят, „Черно и бяло“ вдига огледало към етическите избори, които той прави, направлявайки живота на своите предмодерни идилични селца от вярващи. При това като го кара да вижда отстрани същите тези действия, повторени от неговия божествен любимец, който с детски ентусиазъм гледа, учи се и повтаря всичко, което играчът прави – и добро, и лошо.

Николай Генов: Аз също се зарадвах да науча, че някой друг се е сетил за „Черно и бяло“, и не останах особено изненадан от възникналите казуси около превода на Grand Theft Auto – може би би било добър вариант да мислим за нещо от типа на „Грандиозни автокражби“ или в малко по-свободен регистър – „Грандиозни схеми“? И двете предложения имат своите недостатъци, но със сигурност е за предпочитане да се извеждат повече възможности за превод.

Известно разминаване се получава във вампирската поредица. От една страна, имаме консенсус, че „Вампир: Маскарадът – Кръвно родство“ (Vаmpire: The Masquerade – Bloodlines) заслужава да бъде призната и препоръчана – може би за разлика от продължението ѝ, което разочарова толкова много фенове. От друга, нямаме застъпване при „Вампир: Маскарадът – Парламент от ножове“ (Vаmpire: The Masquerade – Parliament of Knives), която според мен е една от най-добре изработените текстови видеоигри на пазара. Двете всъщност са сродни по дух и се стремят да постигнат сходна цел с различни средства, но безспорно „Кръвно родство“ се справя значително по-добре в това да покаже как би трябвало да изглежда една образцова ролева игра, стига, разбира се, човек да си затвори очите за несъвършенствата на кода и произтичащите от тях бъгове за сметка на невероятната атмосфера, сложния наратив, запомнящите се образи и тежките избори, които придават истинска плътност на пораждащия ги фикционален свят. „Маскарадът“ като цяло, но „Кръвно родство“ в частност е страхотно упражнение по проектиране на човешкото в извънчовешки контекст, а компютърната игра свидетелства за поредния успешен преход от настолното преживяване към екрана – преход, който вече засегнахме в два по-ранни разговора (вж. „В отбор със себе си. Между настолните ролеви игри и техните компютърни адаптации“ и продължението му).

В този ред на мисли Чавдар обърна внимание на един много интересен елемент, който се отразява косвено и в нашата селекция: средата на PC клубовете от началото на века, която допринесе значително за формирането на игровата субкултура и за съжаление, остана някак недокрай интегрирана в колективния разказ – наистина важно явление, подминато от културните антрополози. То поставя посочените от нас „Герои с мощ и магия“ (Heroes of Might and Magic) в съвсем различна светлина, доколкото голяма част от почитателите на играта могат да я свържат именно с този тип социално преживяване. Формата обаче не е съвсем загубена и у нас продължава да намира израз в инициативи като GG LAN party, които събират геймъри и се стремят да поддържат усещането за общност. 

Северина Станкева: В тема на тази втора цедка ненадейно се превърна проблемът за превода в контекста на това що е то игрова общност и има ли тя почва у нас. Що се отнася до говоренето за личните ни фаворити, което неминуемо предстои, мисля си, че то няма да е нито толкова меланхолно, нито толкова самотно.

Ние петимата всъщност никога не сме играли заедно в обичайния смисъл на думата –

в рамките на компютърен клуб, на едно устройство или дори на игра за много играчи. Дори когато играхме „Киберпънк“ по едно и също време, всеки си я игра сам вкъщи. Голяма част от „класацията“ ни е изтъкана именно от засичане на неподозирани заглавия.

Има няколко заглавия в тази цедка, сред които „Светлосянка“ (Clair Obscur: Expedition 33) и „Индика“ (Indika), които пък са резултат от съвсем целенасочени препоръки. В този смисъл ми се струва и че по отношение на видеоигрите, социалният аспект на феномена игра, отбелязван от редица теоретици, измежду които Хьойзинха и Кайоа, се запазва, дори да става въпрос за индивидуално играене. Самотна игра в този смисъл няма, има игра, която чака да бъде споделена.

1 Вж. например инициативата на AdventurersBG. Те впрочем оставят заглавията непреведени.

В рубриката „Игромислие“ публикуваме разговори, в които се срещат, съпоставят и противопоставят различни гледни точки към многоизмерния, многожанров феномен на видеоигрите – не толкова като електронен спорт, колкото като нов синтез на изкуствата и като ново поле на общуване и социалност.

Firefox: The zero-days are numbered

Post Syndicated from corbet original https://lwn.net/Articles/1068906/

This
Firefox blog post
reports that the Firefox 150 release includes
fixes for 271 vulnerabilities found by the Claude Mythos preview.

Elite security researchers find bugs that fuzzers can’t largely by
reasoning through the source code. This is effective, but
time-consuming and bottlenecked on scarce human
expertise. Computers were completely incapable of doing this a few
months ago, and now they excel at it. We have many years of
experience picking apart the work of the world’s best security
researchers, and Mythos Preview is every bit as capable. So far
we’ve found no category or complexity of vulnerability that humans
can find that this model can’t.

This can feel terrifying in the immediate term, but it’s ultimately
great news for defenders. A gap between machine-discoverable and
human-discoverable bugs favors the attacker, who can concentrate
many months of costly human effort to find a single bug. Closing
this gap erodes the attacker’s long-term advantage by making all
discoveries cheap.

Record, generate, run: AI-powered UI test generation for iOS

Post Syndicated from Grab Tech original https://engineering.grab.com/ai-test-generation-ios

Introduction

In our recent AutoTrack SDK blog post, we shared how we solved the challenge of capturing complete user journeys across our mobile app. One of the most promising applications we highlighted was automating iOS UI (User Interface) test case generation using the rich interaction data to automatically create test scripts that mimic real-world usage patterns.

Our vision has become a reality with the development of the Mobile UI Testing AI Workflow for iOS. This system lets developers record their interactions with the app and, within minutes, receive complete, executable UI test code. This code includes essential components such as mocks, feature flags, and analytics verification. In this post, we will explore how we brought this system to life, the architecture we selected, and the valuable lessons we learned throughout the process.

The problem: UI tests are expensive to write

Writing UI tests manually is time-consuming and repetitive. Developers typically spend days:

  • Writing test code line by line.
  • Creating mock data and API responses.
  • Configuring feature flags and test environments.
  • Maintaining tests when the UI changes.

Even more concerning is that this effort often leads to incomplete coverage. Teams prioritise critical flows and leave edge cases untested. When bugs surface in production, reproducing them requires piecing together user journeys from fragmented data, which is exactly the problem AutoTrack was designed to solve.

This prompts us to ask: What if we could turn AutoTrack’s recorded user journeys directly into UI tests?

The solution: From recording to an automatically AI-Generated test

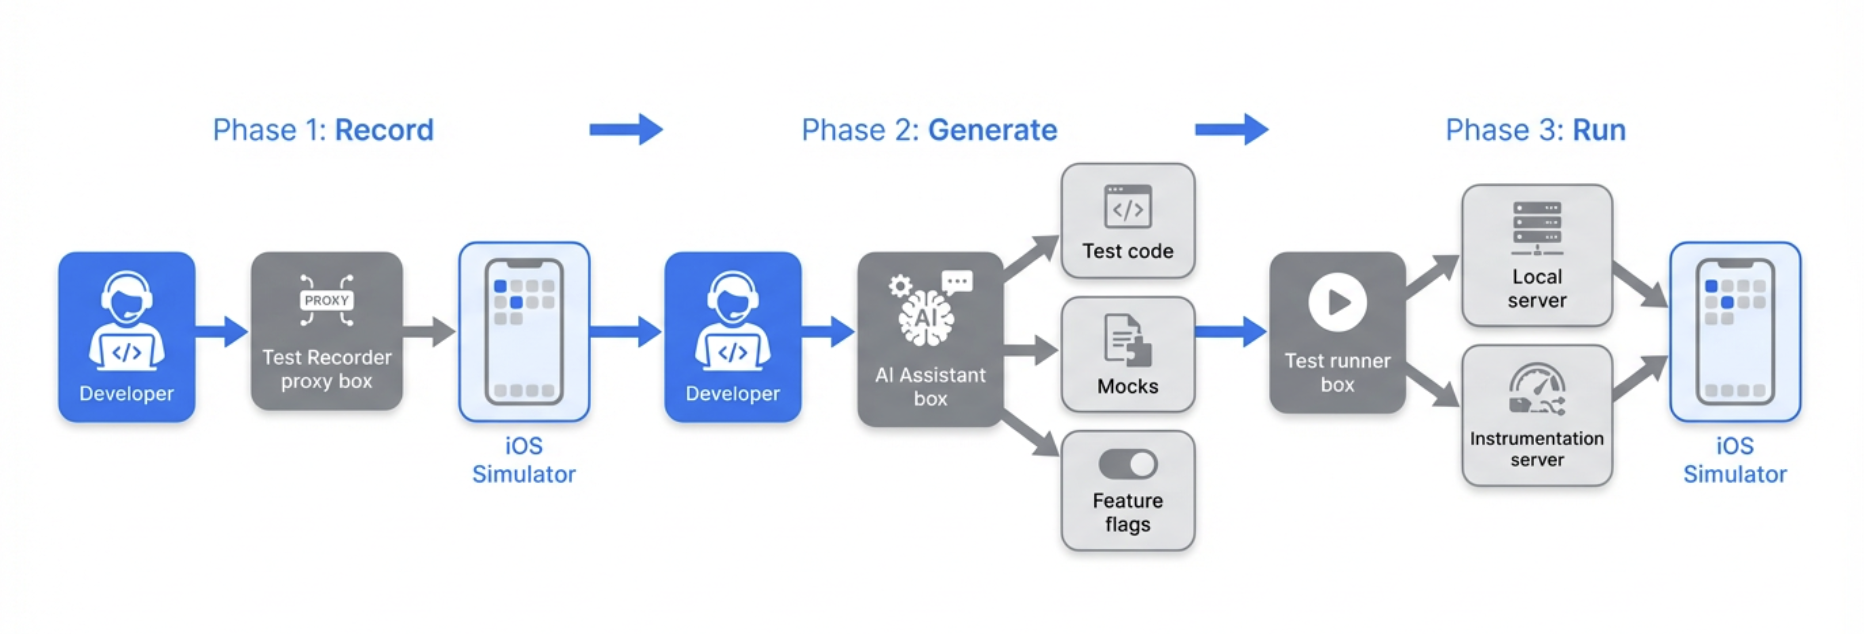
The core idea is simple: Record what you do → AI writes the test code → Run your tests.

Instead of manually instrumenting every tap and swipe, developers interact with the app on a simulator while a Test recorder captures their actions. An AI assistant then analyses the recording and generates:

  1. Test files: Xcode test-based UI test code that replays the recorded flow.
  2. API mocks: Simulated backend responses based on network requests captured during recording.
  3. Feature flag configuration: Exact feature flag state from the recording session.
  4. Analytics expectations: Verification that expected events are triggered during the test.

All of this is generated in the correct directories and formats, ready to run against the existing test infrastructure.

How we built it: Architecture overview

The workflow combines four main components:

1. Test recorder (simple proxy server)

A simple proxy that runs locally during recording. It captures all API requests and responses as the developer interacts with the app, and exposes this data for the AI to use when generating mocks.

2. AI-Powered code generation

We use an AI-assisted development environment with a custom workflow prompt. The prompt instructs the AI to:

  • Reset the recorder before each recording session.
  • Fetch and analyse the recorded flow data.
  • Generate Swift test code following our project’s conventions.
  • Create mock expectation classes for captured API calls.
  • Produce feature flag configuration files.
  • Add analytics event expectations where applicable.

The AI comprehends our test structure, including the “Given-When-Then” organization, base test classes, and helper utilities, ensuring that the generated code integrates seamlessly into the existing codebase.

3. Test execution infrastructure

Generated tests run against our existing UI test stack:

  • Local server: Mocks API responses during UI test execution.
  • Instrumentation server: Validates that expected analytics events are triggered during test runs.
  • Build system: Compiles and organises the iOS project.

No new infrastructure was required as we designed the workflow to plug into what we already have.

4. Developer workflow integration

The workflow is designed to fit into a developer’s normal flow:

  1. Setup: Start the recorder and required services (one-time or per session).
  2. Record: Interact with the app on a simulator while the recorder captures actions.
  3. Generate: Ask the AI to generate the test; it fetches recording data and produces the files.
  4. Verify: Review the generated code, run the test locally, and iterate.

The entire cycle from “I want to test this flow” to “I have a passing test” typically takes 10–20 minutes, compared to days for manual test writing.

Figure 1. Developer testing workflow.

What gets generated

The AI produces exactly three linked files per test:

File Purpose
Test expectations Mocks all network API requests captured during recording with JSON response bodies
Feature flags Recreates the exact feature flag state from the recording session
UI test class Complete test that replays the recorded user flow with analytics validation

The files are placed in the correct directories for our project structure and use our standard base classes and helpers.
The AI also uses an AIUITestUtils (Common AI Utilities functions) helper that supports:

  • Coordinate-based tapping: When accessibility IDs are unavailable, taps use recorded coordinates.
  • Swipe gestures: Pan and scroll interactions.
  • Keyboard input: Text entry for search fields and forms.

Example: API Mock (JSON response)

When the Test Recorder captures an API call during your session, the AI generates mock data from the actual response. Here’s a simplified template of the structure:


{
  "endpoint": "/api/v1/example-resource",
  "method": "GET",
  "statusCode": 200,
  "response": {
    "items": [
      {
        "id": "item-001",
        "title": "Example Item",
        "metadata": {}
      }
    ]
  }
}

Example: User steps (recorded interactions)


{
  "steps": [
    {
      "action": "tap",
      "timestamp": "2025-01-15T10:30:01.000Z",
      "element": {
        "accessibilityId": "button_primary",
        "screenName": "home"
      }
    },
    {
      "action": "type",
      "timestamp": "2025-01-15T10:30:02.500Z",
      "text": "sample input",
      "element": {
        "accessibilityId": "input_field",
        "screenName": "form"
      }
    },
    {
      "action": "swipe",
      "timestamp": "2025-01-15T10:30:05.000Z",
      "direction": "up",
      "element": {
        "accessibilityId": "scroll_view",
        "screenName": "list"
      }
    }
  ]
}

Example: Generated test structure

func testSearchFlow() {
    // GIVEN: Backend expectations (mocks from recording)
    let expectations = SearchTestExpectations()
    composer.setupExpectations(factories: [expectations])

    // WHEN: Launch app and execute recorded flow
    let app = launchApp(featureFlags: SearchFeatureFlags.capturedFlags)
    let utils = TestUtils(app: app)

    utils.tapElement(identifier: "searchBar")
    utils.typeText("pizza")
    utils.tapElement(identifier: "searchButton")

    // THEN: Add assertions
    let resultsList = app.tables["searchResults"]
    XCTAssertTrue(resultsList.waitForExistence(timeout: 5.0))
    XCTAssertGreaterThan(resultsList.cells.count, 0)
}

Enabling event verification

A key requirement was verifying that analytics events fire correctly during tests. We extended the workflow to support instrumentation testing. This ensures that tests validate not only on UI behaviour but also that the right analytics are emitted for product and data teams. The process of instrumentation testing is as follows:

  1. The instrumentation server runs locally and receives analytics events from the app during test execution.
  2. The AI captures expected events from the recording and adds them to the generated test.
  3. The test uses our event validation helper to assert that all expected events are triggered within a timeout.

Lessons learned and best practices

AI generates a starting point, not production-ready tests

The AI produces sample code that demonstrates mocking patterns, user interactions, and element identification. Developers are required to:

  • Add UI assertions: The AI often leaves assertion sections empty; you need to verify expected outcomes.
  • Replace Thread.sleep(): Generated code may include fixed delays; these should be replaced with waitForExistence() to avoid flakiness.
  • Improve element identification: When accessibility IDs are missing, the AI falls back to coordinates; adding proper IDs in the app improves reliability.
  • Validate locally: Run tests multiple times (5–10 runs) before pushing to CI to catch flakiness.

These practices have been documented to ensure teams know exactly what to review before committing their code.

Recording quality matters

Clean recordings produce better tests. We recommend these best practices:

  • Record one flow at a time: Avoid mixing multiple flows in a single session.
  • Proceed deliberately: Allow screens to load fully before interacting; unintentional clicks get recorded.
  • Use two simulators: One for recording (including login), one for running tests, since the login state can reset between runs.
  • Configure feature flags beforehand: Set flags on the experiment portal before recording so mocks match the intended state.

The human-in-the-loop is essential

We explicitly advise against pushing AI-generated tests directly to CI. The workflow accelerates test creation. However, human review ensures:

  • Assertions are meaningful.
  • Tests are not flaky.
  • Code follows team standards.
  • Edge cases and error scenarios are covered.

Key takeaways

As we reflect on our journey, several critical insights have emerged:

  • Leverage AutoTrack’s data: User journey recordings are rich enough to drive automated test generation when combined with the right tooling and prompts.
  • Streamlined workflow: The “Record → Generate → Review” process significantly reduces the need for manual coding, though human oversight remains essential to ensure quality and reliability.
  • Integration with existing systems: By aligning with our current testing infrastructure, like the local API mocking server, instrumentation server, and build system, we avoided the need to develop new systems, thereby speeding up adoption.
  • Establish clear guidelines: Providing explicit instructions on what to add, replace, and validate ensures that teams can utilize AI-generated tests safely and effectively.

In conclusion, the Mobile UI Testing AI Workflow is now available to our iOS teams, enhancing our testing capabilities and efficiency.

Join us

Grab is a leading superapp in Southeast Asia, operating across the deliveries, mobility, and digital financial services sectors, serving over 900 cities in eight Southeast Asian countries: Cambodia, Indonesia, Malaysia, Myanmar, the Philippines, Singapore, Thailand, and Vietnam. Grab enables millions of people every day to order food or groceries, send packages, hail a ride or taxi, pay for online purchases or access services such as lending and insurance, all through a single app. We operate supermarkets in Malaysia under Jaya Grocer and Everrise, which enables us to bring the convenience of on-demand grocery delivery to more consumers in the country. As part of our financial services offerings, we also provide digital banking services through GXS Bank in Singapore and GXBank in Malaysia. Grab was founded in 2012 with the mission to drive Southeast Asia forward by creating economic empowerment for everyone. Grab strives to serve a triple bottom line. We aim to simultaneously deliver financial performance for our shareholders and have a positive social impact, which includes economic empowerment for millions of people in the region, while mitigating our environmental footprint.

Powered by technology and driven by heart, our mission is to drive Southeast Asia forward by creating economic empowerment for everyone. If this mission speaks to you, join our team today!

Record, generate, run: AI-powered UI test generation for iOS

Post Syndicated from Grab Tech original https://engineering.grab.com/ios

Introduction

In our recent AutoTrack SDK blog post, we shared how we solved the challenge of capturing complete user journeys across our mobile app. One of the most promising applications we highlighted was automating iOS UI (User Interface) test case generation using the rich interaction data to automatically create test scripts that mimic real-world usage patterns.

Our vision has become a reality with the development of the Mobile UI Testing AI Workflow for iOS. This system lets developers record their interactions with the app and, within minutes, receive complete, executable UI test code. This code includes essential components such as mocks, feature flags, and analytics verification. In this post, we will explore how we brought this system to life, the architecture we selected, and the valuable lessons we learned throughout the process.

The problem: UI tests are expensive to write

Writing UI tests manually is time-consuming and repetitive. Developers typically spend days:

  • Writing test code line by line.
  • Creating mock data and API responses.
  • Configuring feature flags and test environments.
  • Maintaining tests when the UI changes.

Even more concerning is that this effort often leads to incomplete coverage. Teams prioritise critical flows and leave edge cases untested. When bugs surface in production, reproducing them requires piecing together user journeys from fragmented data, which is exactly the problem AutoTrack was designed to solve.

This prompts us to ask: What if we could turn AutoTrack’s recorded user journeys directly into UI tests?

The solution: From recording to an automatically AI-Generated test

The core idea is simple: Record what you do → AI writes the test code → Run your tests.

Instead of manually instrumenting every tap and swipe, developers interact with the app on a simulator while a Test recorder captures their actions. An AI assistant then analyses the recording and generates:

  1. Test files: Xcode test-based UI test code that replays the recorded flow.
  2. API mocks: Simulated backend responses based on network requests captured during recording.
  3. Feature flag configuration: Exact feature flag state from the recording session.
  4. Analytics expectations: Verification that expected events are triggered during the test.

All of this is generated in the correct directories and formats, ready to run against the existing test infrastructure.

How we built it: Architecture overview

The workflow combines four main components:

1. Test recorder (simple proxy server)

A simple proxy that runs locally during recording. It captures all API requests and responses as the developer interacts with the app, and exposes this data for the AI to use when generating mocks.

2. AI-Powered code generation

We use an AI-assisted development environment with a custom workflow prompt. The prompt instructs the AI to:

  • Reset the recorder before each recording session.
  • Fetch and analyse the recorded flow data.
  • Generate Swift test code following our project’s conventions.
  • Create mock expectation classes for captured API calls.
  • Produce feature flag configuration files.
  • Add analytics event expectations where applicable.

The AI comprehends our test structure, including the “Given-When-Then” organization, base test classes, and helper utilities, ensuring that the generated code integrates seamlessly into the existing codebase.

3. Test execution infrastructure

Generated tests run against our existing UI test stack:

  • Local server: Mocks API responses during UI test execution.
  • Instrumentation server: Validates that expected analytics events are triggered during test runs.
  • Build system: Compiles and organises the iOS project.

No new infrastructure was required as we designed the workflow to plug into what we already have.

4. Developer workflow integration

The workflow is designed to fit into a developer’s normal flow:

  1. Setup: Start the recorder and required services (one-time or per session).
  2. Record: Interact with the app on a simulator while the recorder captures actions.
  3. Generate: Ask the AI to generate the test; it fetches recording data and produces the files.
  4. Verify: Review the generated code, run the test locally, and iterate.

The entire cycle from “I want to test this flow” to “I have a passing test” typically takes 10–20 minutes, compared to days for manual test writing.

Figure 1. Developer testing workflow.

What gets generated

The AI produces exactly three linked files per test:

File Purpose
Test expectations Mocks all network API requests captured during recording with JSON response bodies
Feature flags Recreates the exact feature flag state from the recording session
UI test class Complete test that replays the recorded user flow with analytics validation

The files are placed in the correct directories for our project structure and use our standard base classes and helpers.
The AI also uses an AIUITestUtils (Common AI Utilities functions) helper that supports:

  • Coordinate-based tapping: When accessibility IDs are unavailable, taps use recorded coordinates.
  • Swipe gestures: Pan and scroll interactions.
  • Keyboard input: Text entry for search fields and forms.

Example: API Mock (JSON response)

When the Test Recorder captures an API call during your session, the AI generates mock data from the actual response. Here’s a simplified template of the structure:


{
  "endpoint": "/api/v1/example-resource",
  "method": "GET",
  "statusCode": 200,
  "response": {
    "items": [
      {
        "id": "item-001",
        "title": "Example Item",
        "metadata": {}
      }
    ]
  }
}

Example: User steps (recorded interactions)


{
  "steps": [
    {
      "action": "tap",
      "timestamp": "2025-01-15T10:30:01.000Z",
      "element": {
        "accessibilityId": "button_primary",
        "screenName": "home"
      }
    },
    {
      "action": "type",
      "timestamp": "2025-01-15T10:30:02.500Z",
      "text": "sample input",
      "element": {
        "accessibilityId": "input_field",
        "screenName": "form"
      }
    },
    {
      "action": "swipe",
      "timestamp": "2025-01-15T10:30:05.000Z",
      "direction": "up",
      "element": {
        "accessibilityId": "scroll_view",
        "screenName": "list"
      }
    }
  ]
}

Example: Generated test structure

func testSearchFlow() {
    // GIVEN: Backend expectations (mocks from recording)
    let expectations = SearchTestExpectations()
    composer.setupExpectations(factories: [expectations])

    // WHEN: Launch app and execute recorded flow
    let app = launchApp(featureFlags: SearchFeatureFlags.capturedFlags)
    let utils = TestUtils(app: app)

    utils.tapElement(identifier: "searchBar")
    utils.typeText("pizza")
    utils.tapElement(identifier: "searchButton")

    // THEN: Add assertions
    let resultsList = app.tables["searchResults"]
    XCTAssertTrue(resultsList.waitForExistence(timeout: 5.0))
    XCTAssertGreaterThan(resultsList.cells.count, 0)
}

Enabling event verification

A key requirement was verifying that analytics events fire correctly during tests. We extended the workflow to support instrumentation testing. This ensures that tests validate not only on UI behaviour but also that the right analytics are emitted for product and data teams. The process of instrumentation testing is as follows:

  1. The instrumentation server runs locally and receives analytics events from the app during test execution.
  2. The AI captures expected events from the recording and adds them to the generated test.
  3. The test uses our event validation helper to assert that all expected events are triggered within a timeout.

Lessons learned and best practices

AI generates a starting point, not production-ready tests

The AI produces sample code that demonstrates mocking patterns, user interactions, and element identification. Developers are required to:

  • Add UI assertions: The AI often leaves assertion sections empty; you need to verify expected outcomes.
  • Replace Thread.sleep(): Generated code may include fixed delays; these should be replaced with waitForExistence() to avoid flakiness.
  • Improve element identification: When accessibility IDs are missing, the AI falls back to coordinates; adding proper IDs in the app improves reliability.
  • Validate locally: Run tests multiple times (5–10 runs) before pushing to CI to catch flakiness.

These practices have been documented to ensure teams know exactly what to review before committing their code.

Recording quality matters

Clean recordings produce better tests. We recommend these best practices:

  • Record one flow at a time: Avoid mixing multiple flows in a single session.
  • Proceed deliberately: Allow screens to load fully before interacting; unintentional clicks get recorded.
  • Use two simulators: One for recording (including login), one for running tests, since the login state can reset between runs.
  • Configure feature flags beforehand: Set flags on the experiment portal before recording so mocks match the intended state.

The human-in-the-loop is essential

We explicitly advise against pushing AI-generated tests directly to CI. The workflow accelerates test creation. However, human review ensures:

  • Assertions are meaningful.
  • Tests are not flaky.
  • Code follows team standards.
  • Edge cases and error scenarios are covered.

Key takeaways

As we reflect on our journey, several critical insights have emerged:

  • Leverage AutoTrack’s data: User journey recordings are rich enough to drive automated test generation when combined with the right tooling and prompts.
  • Streamlined workflow: The “Record → Generate → Review” process significantly reduces the need for manual coding, though human oversight remains essential to ensure quality and reliability.
  • Integration with existing systems: By aligning with our current testing infrastructure, like the local API mocking server, instrumentation server, and build system, we avoided the need to develop new systems, thereby speeding up adoption.
  • Establish clear guidelines: Providing explicit instructions on what to add, replace, and validate ensures that teams can utilize AI-generated tests safely and effectively.

In conclusion, the Mobile UI Testing AI Workflow is now available to our iOS teams, enhancing our testing capabilities and efficiency.

Join us

Grab is a leading superapp in Southeast Asia, operating across the deliveries, mobility, and digital financial services sectors, serving over 900 cities in eight Southeast Asian countries: Cambodia, Indonesia, Malaysia, Myanmar, the Philippines, Singapore, Thailand, and Vietnam. Grab enables millions of people every day to order food or groceries, send packages, hail a ride or taxi, pay for online purchases or access services such as lending and insurance, all through a single app. We operate supermarkets in Malaysia under Jaya Grocer and Everrise, which enables us to bring the convenience of on-demand grocery delivery to more consumers in the country. As part of our financial services offerings, we also provide digital banking services through GXS Bank in Singapore and GXBank in Malaysia. Grab was founded in 2012 with the mission to drive Southeast Asia forward by creating economic empowerment for everyone. Grab strives to serve a triple bottom line. We aim to simultaneously deliver financial performance for our shareholders and have a positive social impact, which includes economic empowerment for millions of people in the region, while mitigating our environmental footprint.

Powered by technology and driven by heart, our mission is to drive Southeast Asia forward by creating economic empowerment for everyone. If this mission speaks to you, join our team today!

Winter 2025 SOC 1 report is now available with 184 services in scope

Post Syndicated from Tushar Jain original https://aws.amazon.com/blogs/security/winter-2025-soc-1-report-is-now-available-with-184-services-in-scope/

Amazon Web Services (AWS) is pleased to announce that the Winter 2025 System and Organization Controls (SOC) 1 report is now available. The report covers 184 services over the 12-month period from January 1, 2025 – December 31, 2025, giving customers a full year of assurance. This report demonstrates our continuous commitment to adhering to the heightened expectations of cloud service providers.

Customers can download the Winter 2025 SOC 1 report through AWS Artifact, a self-service portal for on-demand access to AWS compliance reports. Sign in to AWS Artifact in the AWS Management Console, or learn more at Getting Started with AWS Artifact.

AWS strives to continuously bring services into the scope of its compliance programs to help customers meet their architectural and regulatory needs. You can view the current list of services in scope on our Services in Scope page. As an AWS customer, you can reach out to your AWS account team if you have any questions or feedback about SOC compliance.

To learn more about AWS compliance and security programs, see AWS Compliance Programs. As always, we value feedback and questions; reach out to the AWS Compliance team through the Contact Us page.

If you have feedback about this post, submit comments in the Comments section below.

Tushar Jain

Tushar Jain
Tushar is a Compliance Program Manager at AWS where he leads multiple security and privacy initiatives Tushar holds a Master of Business Administration from Indian Institute of Management Shillong, India and a Bachelor of Technology in electronics and telecommunication engineering from Marathwada University, India. He has over 14 years of experience in information security and holds CISM, CCSK and CSXF certifications.

Michael Murphy

Michael Murphy
Michael is a Compliance Program Manager at AWS where he leads multiple security and privacy initiatives. Michael has over 14 years of experience in information security and holds a master’s degree and a bachelor’s degree in computer engineering from Stevens Institute of Technology. He also holds CISSP, CRISC, CISA, and CISM certifications.

Atulsing Patil

Atulsing Patil
Atulsing is a Compliance Program Manager at AWS and has over 28 years of consulting experience in information technology and information security management. Atulsing holds a Master of Science in Electronics degree and professional certifications such as CCSP, CISSP, CISM, CDPSE, ISO 42001 Lead Auditor, ISO 27001 Lead Auditor, HITRUST CSF, Archer Certified Consultant, and AWS CCP.

Nathan Samuel

Nathan Samuel
Nathan is a Compliance Program Manager at AWS where he leads multiple security and privacy initiatives. Nathan has a Bachelor of Commerce degree from the University of the Witwatersrand, South Africa, and has over 21 years of experience in security assurance. He holds the CISA, CRISC, CGEIT, CISM, CDPSE, and Certified Internal Auditor certifications.

Jeff Cheung

Jeff Cheung
Jeff is a Compliance Program Manager at AWS where he leads multiple security and privacy initiatives across business lines. Jeff has Bachelors degrees in Information Systems, and Economics from SUNY Stony Brook, and has over 20 years of experience in information security and assurance. Jeff has held professional certifications such as CISA, CISM, and PCI-QSA.

Noah Miller

Noah Miller
Noah is a Compliance Program Manager at AWS and leads multiple security and privacy initiatives. Noah has 7 years of experience in information security. He has a master’s degree in Cybersecurity Risk Management and a bachelor’s degree in Informatics from Indiana University.

Will Black
Will Black

Will is a Compliance Program Manager at Amazon Web Services where he leads multiple security and compliance initiatives. Will has 10 years of experience in compliance and security assurance and holds a degree in Management Information Systems from Temple University. Additionally, he is a PCI Internal Security Assessor (ISA) for AWS and holds the CCSK and ISO 27001 Lead Implementer certifications.
Allen Beam
Allen Beam

Allen is a Compliance Program Manager at Amazon Web Services supporting third-party security and privacy compliance initiatives. He has over 10 years of experience in external IT security audits, security control design and implementation, and audit readiness and control deficiency remediation. He has a Bachelor’s Degree in Economics and Finance from James Madison University.
Ziv Wand
Ziv Wand

Ziv is a Compliance Program Manager at AWS and leads multiple security and privacy initiatives. Ziv has over 6 years of experience in information security assurance, external IT security audits, security control design and implementation, and audit readiness. He holds a Bachelor of Science in Management Information Systems from Binghamton University.
Shalini Mishra
Shalini Mishra

Shalini is a Compliance Program Manager at AWS. She has over 5 years of experience leading end-to-end compliance programs across ISO, SOC, and cloud security frameworks, with deep expertise in third-party risk management and enterprise governance. Shalini holds a Master of Science degree in Information Systems and a CRISC certification.

Ask the Prometheus docs with Kapa.ai

Post Syndicated from Arthur Silva Sens (@ArthurSens) original https://prometheus.io/blog/2026/04/22/ask-the-prometheus-docs-with-kapa-ai/

Prometheus documentation now includes a new Kapa.ai integration. This is available as part of the partnership between CNCF and Kapa.ai, which helps CNCF projects make their documentation and knowledge more accessible.

You can now use the Ask AI entry on prometheus.io to ask questions in natural language and get answers grounded in Prometheus documentation. For the Prometheus team, it is also a useful way to understand what people are trying to learn from the docs and where the docs still need work.

The Ask AI option is available directly from the docs search box:

Prometheus docs search field showing the Ask AI option

How this helps users

This makes the docs easier to use in a few different ways. You can ask full questions instead of guessing the exact search keywords, and you can describe a problem in your own words even if you do not know the Prometheus terminology yet.

It can also be helpful if English is not your first language, since you can often ask in your preferred language instead of translating your question into English keywords first. And because the answers are grounded in the docs, you also get links back to the relevant pages to keep exploring.

Try it on prometheus.io

The next time you are reading the Prometheus docs, open search and click Ask AI.

Once you ask a question, Kapa responds with an answer grounded in the Prometheus docs and links back to the relevant documentation:

Prometheus Docs AI answering a question about installing Prometheus with links to the docs

Why we are adding it

For the Prometheus team, this is not only a way to answer questions faster. It is also a feedback loop for improving the docs.

Kapa shows us what people ask and how confidently those questions can be answered from the existing documentation. That helps us identify missing topics, unclear explanations, and places where the right content exists but is still hard to find.

Looking at these questions over time gives us a practical way to spot recurring themes and prioritize documentation improvements:

Kapa question insights showing user questions, confidence levels, and topic tags

If Kapa gives you a useful answer, great. If it does not, that also helps us improve the docs.

Ask something simple. Ask something specific. Ask something you think should already be obvious from the docs.

From now on, asking questions is also a great way of helping the Prometheus community!

NOTE: Conversations using the Kapa integration are recorded and anonym-ised.
For more information, please read https://www.kapa.ai/security

Fedora Verified: a proposal to recognize Fedora contributor status

Post Syndicated from jzb original https://lwn.net/Articles/1068861/

The Fedora Project has been wrestling with the question of who should be able to vote in
Fedora elections
recently, with project membership being a major topic at
the Fedora Council face-to-face
held in early February. Now the
project is considering a new contributor status, “Fedora Verified”,
and is looking
to get input
on the idea from the community.

What are the proposed benefits? The primary motivation behind
“Fedora Verified” is to build trust-based recognition that grants
elevated, privileged rights within the project. Most notably, this
status would determine eligibility for strategic governance
activities, such as:

  • Voting in Fedora community elections.
  • Running for leadership or decision-making roles within the project
    (i.e., Fedora Council, FESCo, Mindshare Committee, EPEL Steering
    Committee).
  • (Potential, unplanned) Accessing specific shared project resources
    or educational opportunities (e.g., Red Hat training credits).

The blog post includes a list of proposed baseline metrics for
“Verified” status as well as open questions to be decided. A survey
on the topic
will be open until May 5.

The collective thoughts of the interwebz