Post Syndicated from The Atlantic original https://www.youtube.com/watch?v=09AfA9V_JkE
The Rise of Political Polarization With Senator John Fetterman | The Atlantic Festival 2024
Post Syndicated from The Atlantic original https://www.youtube.com/watch?v=b28GYZSlGEY
Metasploit Weekly Wrap-Up 09/20/2024
Post Syndicated from Christopher Granleese original https://blog.rapid7.com/2024/09/20/metasploit-weekly-wrap-up-09-20-2024/
New module content (3)
update-motd.d Persistence
Author: Julien Voisin
Type: Exploit
Pull request: #19454 contributed by jvoisin
Path: linux/local/motd_persistence
Description: This adds a post module to keep persistence on a Linux target by writing a motd bash script triggered with root privileges every time a user logs into the system through SSH.
WordPress LiteSpeed Cache plugin cookie theft
Authors: Rafie Muhammad and jheysel-r7
Type: Exploit
Pull request: #19457 contributed by jheysel-r7
Path: multi/http/wp_litespeed_cookie_theft
AttackerKB reference: CVE-2024-44000
Description: This adds an exploit module for a WordPress Plugin called LiteSpeed (CVE-2024-44000). On the vulnerable plugin, when the Debug Logs are enabled, it is possible to leak authentication cookies of logged in users, the msf module will use the stolen cookies to upload and execute a plugin able to spawn a meterpreter session.
Windows Kernel Time of Check Time of Use LPE in AuthzBasepCopyoutInternalSecurityAttributes
Authors: jheysel-r7 and tykawaii98
Type: Exploit
Pull request: #19345 contributed by jheysel-r7
Path: windows/local/cve_2024_30088_authz_basep
AttackerKB reference: CVE-2024-30038
Description: This adds a Windows LPE post module that exploits CVE-2024-30088. Once the exploit is executed through a running meterpreter session, it will open another one with NT AUTHORITY/SYSTEM privileges.
Enhancements and features (3)
- #19414 from cdelafuente-r7 – Adds some missing constants for the Kerberos LoginScanner as defined in the documentation. This also defines the default
connection_timeoutvalue in#set_sane_defaultsas defined here. - #19443 from jvoisin – Removes some redundant code from
lib/msf/core/payload/php.rb. - #19445 from jvoisin – Makes minor improvements of
lib/msf/core/payload/php.rb.
Bugs fixed (1)
- #19449 from zeroSteiner – This fixes an issue in the exploit for CVE-2022-0995 where it would crash with an exception while printing a message regarding why it failed.
Documentation added (1)
- #19452 from zeroSteiner – This improves the Metasploit’s documentation explaining how to setup a Meterpreter handler over Ngrok port-forwarding.
You can always find more documentation on our docsite at docs.metasploit.com.
Get it
As always, you can update to the latest Metasploit Framework with msfupdate
and you can get more details on the changes since the last blog post from
GitHub:
If you are a git user, you can clone the Metasploit Framework repo (master branch) for the latest.
To install fresh without using git, you can use the open-source-only Nightly Installers or the
commercial edition Metasploit Pro

pcp: pmcd network daemon review (SUSE Security Team Blog)
Post Syndicated from jzb original https://lwn.net/Articles/991091/
The SUSE Security Team Blog has a detailed review of the Performance Co-Pilot (PCP) 6.2.1 release:
The rather complex PCP software suite was difficult to judge just from
a cursory look, so we decided to take a closer look especially at
PCP’s networking logic at a later time. This report contains two CVEs
and some non-CVE related findings we also gathered during the
follow-up review.
CVE-2024-45769,
a flaw that could allow an attacker to send crafted data to crash
pcmd, and CVE-2024-45770,
which could allow a full local root exploit from the pcp user to root,
have been addressed in the 6.3.1
release of PCP.
Automate detection and response to website defacement with Amazon CloudWatch Synthetics
Post Syndicated from Agus Komang original https://aws.amazon.com/blogs/security/automate-detection-and-response-to-website-defacement-with-amazon-cloudwatch-synthetics/
Website defacement occurs when threat actors gain unauthorized access to a website, most commonly a public website, and replace content on the site with their own messages. In this blog post, we show you how to detect website defacement, and then automate both defacement verification and your defacement response by using Amazon CloudWatch Synthetics visual monitoring canaries. Canaries are configurable scripts that run on a schedule and compare screenshots taken during a canary run with screenshots taken during a baseline canary run. If the discrepancy between the two screenshots exceeds a threshold percentage, the canary fails. We will show you how to quickly deploy a maintenance page through AWS WAF after you verify the defacement.
Common causes of defacement include unauthorized access, SQL injection, cross-site scripting (XSS), or malware. You can use AWS services such as AWS WAF, Amazon Route 53, and Amazon GuardDuty to put additional mechanisms in place to help improve your security posture.
Solution overview
The architectural diagram in Figure 1 shows a typical web application where users access the application by using Amazon CloudFront protected by AWS WAF.

Figure 1: Defacement detection and response with CloudWatch Synthetics
As shown in the diagram, the solution consists of two parts: 1) visual monitoring for defacement detection, and 2) automation of the verification and defacement response.
Part 1: Visual monitoring for defacement detection
Defacement detection uses CloudWatch Synthetics visual monitoring canaries to perform visual monitoring. You can create canaries in CloudWatch Synthetics that periodically take a screenshot of the monitored URLs. Because the canaries only need network access to the monitored URLs, you can implement this solution without affecting the application or modifying its code. For more details on how to create CloudWatch Synthetics visual monitoring canaries, see Visual monitoring of applications with Amazon CloudWatch Synthetics.
You can use the CloudWatch Synthetics visual monitoring blueprint to compare screenshots taken during a canary run with screenshots taken during a baseline canary run. This solution is suitable for static a target=”_blank” hrefs where a discrepancy between the two screenshots that exceeds a threshold percentage could indicate a possible defacement attempt, causing the canary to trigger a failure event.
The threshold percentage is defined by the visual variance that occurs when the current screenshot differs from the baseline screenshot that was captured during the first run of the canary. To reduce false positives, you can adjust the threshold for detecting visual variance.
In the following script, we updated the visual variance to 5% in the visual monitoring blueprint:
Figure 2 shows the first baseline screenshot of a webpage with visual variance set to 5%.

Figure 2: Image taken during a baseline canary run
Figure 3 shows the visual variance of a defaced webpage. In this case, the visual variance was set to 5% in the script, and the visual variance detected was 30.92%.

Figure 3: Failed canary run due to differences from the baseline screenshot
Figure 4 shows a webpage with dynamic content that triggered a false positive because the visual monitoring canary was unable to differentiate between real dynamic content and variation from the baseline. In this case, the visual variance was set to 5% in the script, and the visual variance detected was 5.25%.

Figure 4: Dynamic content in Feedback form that triggered canary failure
You can select the dynamic content to exclude it from the visual comparison for subsequent canary runs. To exclude the dynamic content, edit the baseline screenshot in CloudWatch Synthetics. Using a simple click-drag, you can select the area to exclude from visual comparison for subsequent canary runs, as shown in Figure 5.

Figure 5: Exclusion of dynamic content
If your applications have additional areas with dynamic content, you can select more than one area to exclude from comparison.
Figure 6 shows a successful canary run after exclusion of the area that contains the dynamic content.

Figure 6: Canary succeeded after the exclusion of dynamic content
You can automate the defacement response by using Amazon EventBridge rules to trigger Amazon Simple Notification Service (Amazon SNS) when a canary run fails. By using the publish-subscribe pattern, you can customize and add on the response functions based on your organization’s needs.
The following shows the event pattern script in EventBridge. Make sure to update the canary name with the name of the CloudWatch Synthetics visual monitoring canary that you created earlier to serve as the event source.
 // Event patterns in EventBridge to get event source from canary

{
  "source": ["aws.synthetics"],
  "detail-type": ["Synthetics Canary TestRun Failure"],
  "detail": {
    "canary-name": ["<replace-with-canary-name>"]
  }
}
When the event pattern matches the rules that you configured in EventBridge, the Amazon SNS topic triggers the approval flow, as shown in Figure 7. This begins automation of the verification and defacement response, which we describe in the next section.

Figure 7: Amazon SNS topic triggered when the event pattern matches
Part 2: Automation of the verification and defacement response
Figure 8 outlines how to automate the verification and defacement response. When alerts are received upon detection of defacement, the notified team can choose to verify the defacement. This defacement monitor uses CloudWatch Synthetics while maintaining the flexibility to configure and verify threshold settings through manual verification. If you are confident in your thresholds, you can bypass the approval flow and directly block site traffic by using an AWS WAF rule during a defacement attempt.

Figure 8: Defacement detection and response with CloudWatch Synthetics
As shown in the diagram, this is what the traffic flow looks like during a defacement:
- The canary from the CloudWatch Synthetics visual monitor identifies defacement through visual variance against the baseline screenshot taken during the first canary run and emits an event.
- If the emitted event matches the rules configured in EventBridge, Amazon SNS is triggered. This triggers the subscribed AWS Lambda function that sends a Slack notification with the event details asking for approval.
- The notified team receives a Slack message about the defacement and makes an approval decision.
- If approval is granted, an AWS WAF rule is added to block traffic and a maintenance page is served to users.
- The user that accessed the origin is shown a maintenance page served by AWS WAF.
Although this example shows the use of Slack as an approval mechanism, you can use the communication mechanism of your choice.
Conclusion
In this post, you learned how to use CloudWatch Synthetics to monitor for defacement and display a maintenance page through AWS WAF and CloudFront while you work on recovering the service. You also learned how to use manual approval to identify the optimal threshold and exclude the area that contains dynamic content to reduce false positives.
Although most web applications already use CloudFront and AWS WAF, you can integrate this solution to your existing environment without affecting the application or modifying its code. This solution helps detect potential defacement, providing you with an additional layer of protection for your environment.
We recommend that you explore the capabilities of CloudWatch Synthetics monitoring to detect and use the capabilities of the cloud through services such as EventBridge, Amazon SNS, and Lambda to enable automation. This can help you proactively protect your application against defacement attempts.
If you have feedback about this post, submit comments in the Comments section below. If you have questions about this post, contact AWS Support.
Marion Jones | Why Failure Isn’t Forever | Talks at Google
Post Syndicated from Talks at Google original https://www.youtube.com/watch?v=YRlGvdK63vo
Consolidate Power
Post Syndicated from The Atlantic original https://www.youtube.com/watch?v=2V0TKCIZQQo
Clever Social Engineering Attack Using Captchas
Post Syndicated from Bruce Schneier original https://www.schneier.com/blog/archives/2024/09/clever-social-engineering-attack-using-captchas.html
This is really interesting.
It’s a phishing attack targeting GitHub users, tricking them to solve a fake Captcha that actually runs a script that is copied to the command line.
Clever.
The Future of Global and Domestic Democracy With Hakeem Jeffries | The Atlantic Festival 2024
Post Syndicated from The Atlantic original https://www.youtube.com/watch?v=gfasBmiyKHA
Don’t Waste Money on Marketing BS! #Wifi6 #Wifi7 #HomeNetworking #SmartHomeTech
Post Syndicated from Crosstalk Solutions original https://www.youtube.com/watch?v=3wauN54Ni3o
Kellyanne Conway on the Stakes of the 2024 Presidential Election | The Atlantic Festival 2024
Post Syndicated from The Atlantic original https://www.youtube.com/watch?v=1y0pXfIBqD0
The Race to Net-Zero Emissions by 2050 With Jennifer M. Granholm | The Atlantic Festival 2024
Post Syndicated from The Atlantic original https://www.youtube.com/watch?v=Urcso_oDYp8
Janet Yellen on the State of the U.S. Economy With Ron Brownstein | The Atlantic Festival 2024
Post Syndicated from The Atlantic original https://www.youtube.com/watch?v=RDZybvrgt70
Supermicro AOC-A100-m2CM NVIDIA ConnectX-6 Dx OCP NIC 3.0 Review
Post Syndicated from Rohit Kumar original https://www.servethehome.com/supermicro-aoc-a100-m2cm-nvidia-connectx-6-dx-ocp-nic-3-0-review/
In our Supermicro AOC-A100-m2CM mini-review we see what this NVIDIA ConnectX-6 Dx dual 100GBE offers and how it performs
The post Supermicro AOC-A100-m2CM NVIDIA ConnectX-6 Dx OCP NIC 3.0 Review appeared first on ServeTheHome.
Мила ваканция… Къде си, когато най ми трябваш?
Post Syndicated from original https://www.toest.bg/mila-vakantsia-kude-si-kogato-nay-mi-tryabvash/

Ежедневието ни като възрастни най-често ни идва късо. Не остава време за почивка, освен за неизбежния сън, нямаме достатъчно време за семейството си и за нещата, които ни занимават извън служебните и ежедневните задължения. Да не говорим за време за себе си.
За децата не е много по-различно: надпреварите в училище са безкрайни, а натоварването през учебната година – неимоверно. Часове, домашни, курсове и уроци, тренировки, състезания – от септември до юни. За някои ученици и след това.
Къде е времето за приятелства, за хармония, за семеен живот с най-важното общо между нас – емоционалното, което ни свързва отвъд роднинството? Кога и как в тази въртележка можем да създаваме общи спомени, които да искаме един ден да предадем и нататък?
В България имаме дълга, дори прекалено дълга лятна ваканция, с която добиваме известна популярност. Тазгодишният доклад, който сравнява продължителността на ваканциите в страните от Европейския съюз, онагледява точно това – България е една от малкото страни, в които учебната година започва толкова късно, но за сметка на това пък е в групата на страните с най-непропорционално разпределение на ваканциите през учебната година.
От години вече се говори усилено за реформа на образователната система. Уви, конкретни стъпки се предприемат на парче и без дългосрочен план. Вместо да откриваме топлата вода с опипване, бихме могли да почерпим идеи от положителния опит на други държави при разделяне на учебното време, разпределяне на материала за изучаване, въвеждане на микроетапи в учебната година. Това би я направило много по-компактна и регламентирана както за децата, така и за учителите.
Колко е важно да има ваканция?
Ежедневно по 6, 7, дори 8 учебни часа. Писане на купища домашни – за училище, за курсовете, за уроците. В събота и неделя може би по час-два повече сън, но и подготовка за поредната контролна работа. Всичко това води до стрес и претоварване. Ваканция не е просто весела дума от детска песничка и представа за морски вълни, тя е задължителното време за рестарт, от което се нуждаем всички. Особено децата.
Тялото ни не е създадено да издържа на постоянен висок стрес. Продължителното физическо и психическо натоварване води до физически и психосоматични оплаквания, най-честите от които са нарушения на съня, раздразнимост, стомашни неразположения, болки в гърба.
Почивката е грижа. Тя ни кара да се чувстваме по-добре и е изключително важна за здравето ни. Също така важно е колко често почиваме, защото колкото по-уморени сме, толкова по-невъзможно става да си отпочинем.
Едно от най-куриозните изследвания на тема почивки е на проф. Джонатан Ливав от Колумбийския университет. Заедно с колегите си той проучва каква е вероятността искането за пускане под гаранция да бъде одобрено от съдията. И стига до заключението, че ако сте сред първите трима, които биват обсъждани в началото на работния ден или след обедната почивка, то имате два до шест пъти по-голям шанс да бъдете пуснати под гаранция.
Как почиват другите?
Германия
Член 25 от Споразумението между провинциите относно общата структура на училищното дело и отговорността на провинциите по образователните въпроси регулира продължителността на всички ваканции през учебната година. Ваканцията трябва да е 75 работни дни, с уточнението, че в Германия за работен ден се брои и събота, но тя не е учебен ден, затова тези 75 дни отговарят на 12,5 седмици. Поради големината на държавата и поради това, че с образованието се разпореждат провинциите, лятната ваканция може да се мести. Но не произволно, а стриктно по календар, какъвто има разписан до 2030 г. за всички провинции.
Шестседмичната лятна ваканция е задължителна. В много училища за първите две и последните две от тези шест седмици има възможност срещу изключително достъпно заплащане децата в началния курс, чиито родители не могат да си позволят толкова дълга ваканция, да посещават лятно училище. Всяка година учениците имат и две седмици есенна ваканция, две седмици коледна ваканция, във все повече провинции има една седмица ски ваканция и една до две седмици великденска ваканция. Общо: около 13 седмици ваканция.
От Полша ни пише Николай Б., чиято дъщеря тази година е в VI клас:
Учебната година в Полша започва на 1 септември и трае до предпоследната седмица на юни. Това, което определено е различно от България, е междусрочната ваканция, т.нар. Ferie. Тази ваканция, която е скоро след зимната и е всъщност по-дълга, трае винаги две седмици и има четири различни начални дати в зависимост от областите в държавата. Иначе казано, между 15 януари и 25 февруари в няколко области учениците (и студентите) имат двуседмична ваканция. Предполагам, че това разделение е по чисто практически причини, защото сигурно ще си е главоболие, ако всички ученици и студенти в страната останат без занимание за две седмици. Особено за родителите на по-малките. Затова всичко е организирано по области и датите са зададени за години напред – има готов календар за тази ваканция до 2030 г.
Иначе има няколко църковни празника, които са почивни: 6 януари – Тримата влъхви, 19 юни – Божието тяло. Светските почивни дни са: 11 ноември – Денят на независимостта, 1 май – Денят на труда, 3 май – Денят на конституцията. Често ако 1 и 3 май попаднат в една работна седмица, цялата седмица става почивна за децата.
Така в Полша лятната ваканция е 10 седмици, следвана от зимната, която е две седмици, след която идва междусрочната от две седмици, после великденска от една седмица. Общо приблизително: 14 седмици ваканция.
Приближаваме се още повече до България и сме в Румъния.
Корина има дъщеря в гимназиална възраст и ми изпраща календара за предстоящата учебна година. Тя започва през втората седмица на септември и продължава до предпоследната седмица на юни. Разделена е на 5 модула както ги нарича, всеки от които завършва с едноседмична ваканция. Зимната ваканция е изключение – тя е двуседмична. Тази цикличност, която дава голяма сигурност и обозримост на учебния процес, включва и разделение на учебния материал на тези части. Сигурно е страхотно да развиеш още като ученик умението да планираш и да боравиш с времето си и с работата, определена за това време.
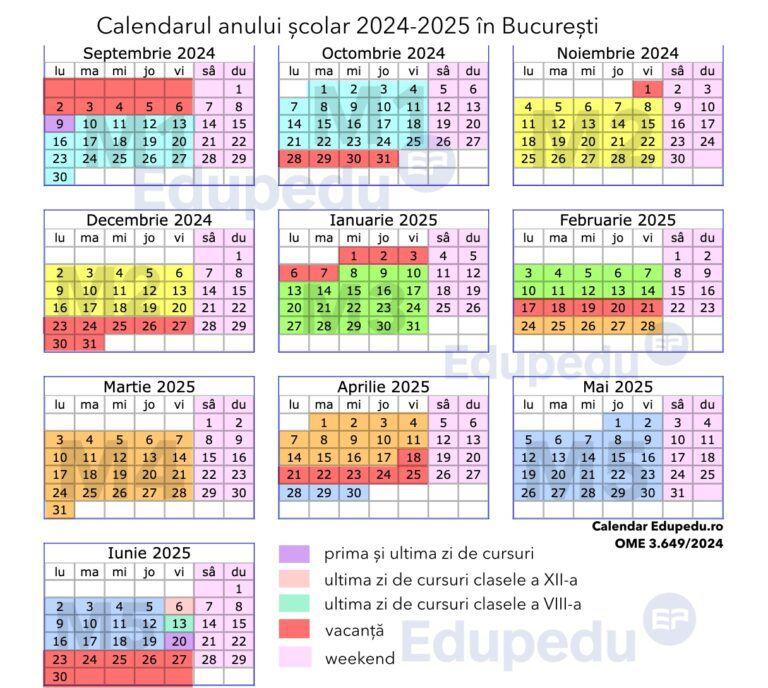
Започваме да броим:
- 11 седмици лятна ваканция
- 5 седмици междумодулни ваканции
Общо: 16 седмици ваканция!
И се оказва, че дори не е трябвало да обикалям толкова далече, защото в България имаме може би най-чудесния и практичен (да не говорим за полезен) пример. Той е на Френския лицей в София, от чийто календар е видна следната учебна година:
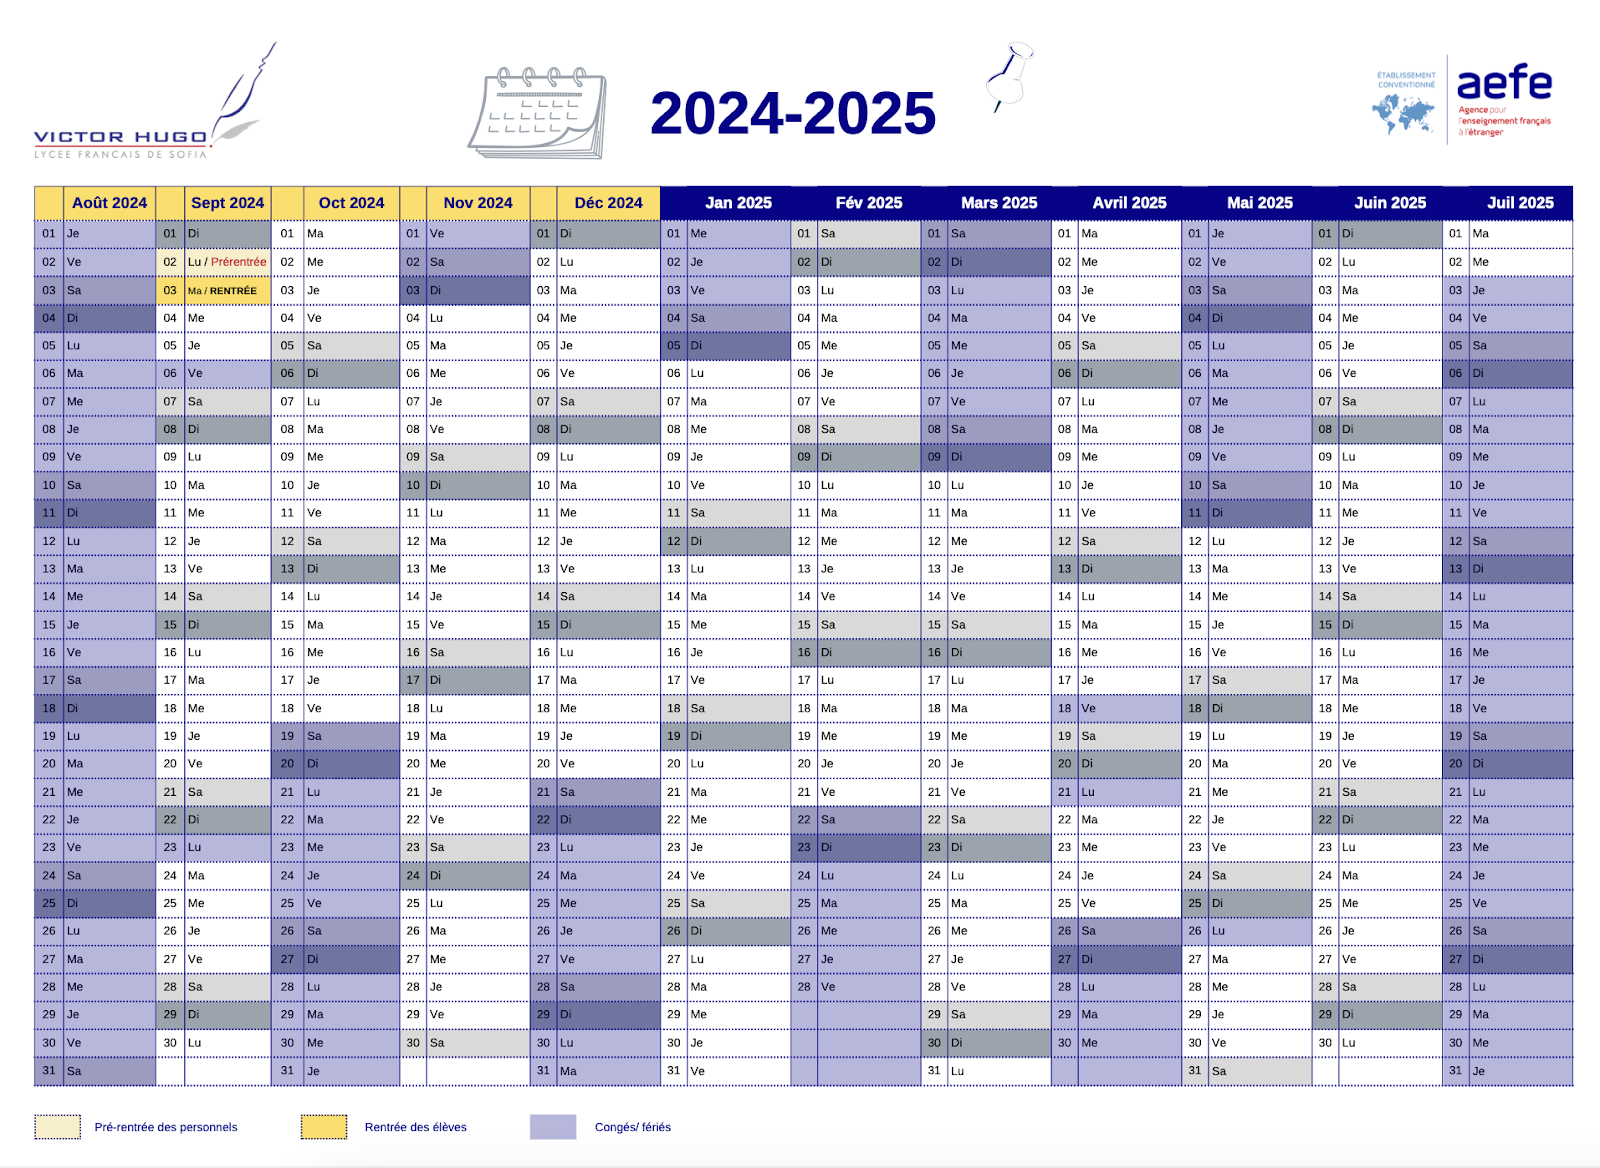
На всеки 8 учебни седмици има две седмици ваканция. Лятната ваканция е два месеца (9 седмици). Общо: 17 седмици ваканция!
Говорих с родител, чиито деца посещават Френския лицей, и не можех да скрия завистта си. Регулиран учебен процес, целодневен режим, но обозрим и ясен. С начало и край. Разбит на смилаеми времеви периоди, които завършват със заслужена почивка за цялото семейство. Защото каквото и да си говорим, учебното време е натоварващо не само за учениците, но и за всички покрай тях.
Как е тук?
При всички добри примери и научни доказателства колко е важно да редуваме натоварване и разтоварване, е истинска загадка защо в Министерството на образованието все още не са чували за това. И защо за поредна година календарът на ученическите ваканции изглежда, меко казано, нечовешки. Нека за финал разгледаме и него.
В края на юли тази година в МОН все още не бяха готови с календара за предстоящата учебна година – 2024/2025. Изключително демократично отвориха обществено обсъждане, което не доведе до много по-логично решение от първоначалното.
Така крайният вариант е:
- начало на учебната година: 16 септември (след 11-,13- или 15-седмична лятна ваканция в зависимост от етапа на обучение);
- есенна „ваканция“ от два учебни дни – 31 октомври и 1 ноември;
- коледна ваканция от почти две седмици (но не цели, защото в онзи висящ първи петък на 2025 г. ще бъдат постигнати чудеса).
- междусрочна „ваканция“ в сряда;
- едноседмична пролетна ваканция в началото на април.
За учещите до 30 юни това са: 11 + 2 + 1 = 14 седмици ваканция
За учещите до 15 юни това са: 13 + 2 + 1 = 16 седмици ваканция
За учещите до 1 юни това са: 15 + 2 + 1 = 18 седмици ваканция
В цялото си проучване не намерих държава, която описва почивните събота и неделя като част от учебния календар. Говори се за работни/учебни/празнични/ваканционни дни. Министерството на образованието говори винаги за „ваканция“, пък била тя и само в сряда. Затова и спорадичните ден или два без учебен процес не съм ги преброила в горната извадка.
От изключителна важност за участниците в образователния процес се оказаха тези 36 (пример за горен курс) учебни седмици, от които се състои учебната година. Във всяка от тях има разпределен материал. Не дай боже да отпадне някой ден (или седмица!) – започва се едно препускане, наваксване, неусвояване. На гърба на учители и ученици. Защото цялата ваканция е натъпкана в лятото и не е оставена и минимална резерва.
Даже няма да започваме разговора как учениците са просто изложени на образователен процес, без да бъдат истинска страна в него. Без умения за планиране, без дори бегло усещане за преминаване от етап в етап. Защото ако във вторник сме получили срочната си оценка, в петък просто минаваме нататък.
А основната цел на образователния процес е продуктивността. Това е усещането, че сме свършили нещо – овладели сме ново умение, приложили сме ново знание. Когато обаче се движим напрегнато в постоянна въртележка от седмици без никакъв друг стимул освен заветната оценка, тогава не говорим за продуктивност.
Fake work е термин от работния свят и означава дейност, която изглежда и се усеща като работа, но не води до напредък или постигане на цел. Да, може цял ден да четете и да пишете имейли, да стоите в срещи, да четете рапорти и документация, но всичко това да не води до реален резултат.
Нещо такова е усещането и за учебната година в България. Бързане, струпване на много материал в малко време, натоварване от сутрин до вечер, често и през нощта, когато не можеш да спиш. Без усещане за завършеност и за преодоляване на препятствие. Защото всъщност се въртиш в колело като хамстер и просто ти се вие свят. И нямаш друг изход, освен да чакаш лятната ваканция.
Светът се променя с бясна скорост. Професиите, в които ще се развиват поколенията, започващи днес образователния си път, все още не са измислени. Подготвена ли е нашата образователна система, за да отговори на тези предизвикателства? Какво може и трябва да се промени? А как?
Веднъж месечно в рубриката „Възможното образование“ ще говорим за промяната – такава, каквато искаме да я видим, за добрите примери и за посоките, в които може би е добре да обърне поглед българската образователна система.
[$] The 6.12 merge window begins
Post Syndicated from corbet original https://lwn.net/Articles/990750/
As of this writing, 6,778 non-merge changesets have been pulled into the
mainline kernel for the 6.12 release — over half of the work that had been
staged in linux-next prior to the opening of the merge window. There has
been a lot of refactoring and cleanup work this time around, but also some
significant changes. Read on for a summary of the first half of the 6.12
merge window.
Removing uncertainty through “what-if” capacity planning
Post Syndicated from Curt Robords original https://blog.cloudflare.com/scenario-planner
Infrastructure planning for a network serving more than 81 million requests at peak and which is globally distributed across more than 330 cities in 120+ countries is complex. The capacity planning team at Cloudflare ensures there is enough capacity in place all over the world so that our customers have one less thing to worry about – our infrastructure, which should just work. Through our processes, the team puts careful consideration into “what-ifs”. What if something unexpected happens and one of our data centers fails? What if one of our largest customers triples, or quadruples their request count? Across a gamut of scenarios like these, the team works to understand where traffic will be served from and how the Cloudflare customer experience may change.
This blog post gives a look behind the curtain of how these scenarios are modeled at Cloudflare, and why it’s so critical for our customers.
Scenario planning and our customers
Cloudflare customers rely on the data centers that Cloudflare has deployed all over the world, placing us within 50 ms of approximately 95% of the Internet-connected population globally. But round-trip time to our end users means little if those data centers don’t have the capacity to serve requests. Cloudflare has invested deeply into systems that are working around the clock to optimize the requests flowing through our network because we know that failures happen all the time: the Internet can be a volatile place. See our blog post from August 2024 on how we handle this volatility in real time on our backbone, and our blog post from late 2023 about how another system, Traffic Manager, actively works in and between data centers, moving traffic to optimize the customer experience around constraints in our data centers. Both of these systems do a fantastic job in real time, but there is still a gap — what about over the long term?
Most of the volatility that the above systems are built to manage is resolved within shorter time scales than which we build plans for. (There are, of course, some failures that are exceptions.) Most scenarios we model still need to take into account the state of our data centers in the future, as well as what actions systems like Traffic Manager will take during those periods. But before getting into those constraints, it’s important to note how capacity planning measures things: in units of CPU Time, defined as the time that each request takes in the CPU. This is done for the same reasons that Traffic Manager uses CPU Time, in that it enables the team to 1) use a common unit across different types of customer workloads and 2) speak a common language with other teams and systems (like Traffic Manager). The same reasoning the Traffic Manager team cited in their own blog post is equally applicable for capacity planning:
…using requests per second as a metric isn’t accurate enough when actually moving traffic. The reason for this is that different customers have different resource costs to our service; a website served mainly from cache with the WAF deactivated is much cheaper CPU wise than a site with all WAF rules enabled and caching disabled. So we record the time that each request takes in the CPU. We can then aggregate the CPU time across each plan to find the CPU time usage per plan. We record the CPU time in ms, and take a per second value, resulting in a unit of milliseconds per second.
This is important for customers for the same reason that the Traffic Manager team cited in their blog post as well: we can correlate CPU time to performance, specifically latency.
Now that we know our unit of measurement is CPU time, we need to set up our models with the new constraints associated with the change that we’re trying to model. Specifically, there are a subset of constraints that we are particularly interested in because we know that they have the ability to impact our customers by impacting the availability of CPU in a data center. These are split into two main inputs in our models: Supply and Demand. We can think of these as “what-if” questions, such as the following examples:
Demand what-ifs
-
What if a new customer onboards to Cloudflare with a significant volume of requests and/or bytes?
-
What if an existing customer increased its volume of requests and/or bytes by some multiplier (i.e. 2x, 3x, nx), at peak, for the next three months?
-
What if the growth rate, in number of requests and bytes, of all of our data centers worldwide increased from X to Y two months from now, indefinitely?
-
What if the growth rate, in number of requests and bytes, of data center facility A increased from X to Y one month from now?
-
What if traffic egressing from Cloudflare to a last-mile network shifted from one location (such as Boston) to another (such as New York City) next week?
Supply what-ifs
-
What if data center facility A lost some or all of its available servers two months from now?
-
What if we added X servers to data center facility A today?
-
What if some or all of our connectivity to other ASNs (12,500 Networks/nearly 300 Tbps) failed now?
Output
For any one of these, or a combination of them, in our model’s output, we aim to provide answers to the following:
-
What will the overall capacity picture look like over time?
-
Where will the traffic go?
-
How will this impact our costs?
-
Will we need to deploy additional servers to handle the increased load?
Given these sets of questions and outputs, manually creating a model to answer each of these questions, or a combination of these questions, quickly becomes an operational burden for any team. This is what led us to launch “Scenario Planner”.
Scenario Planner
In August 2024, the infrastructure team finished building “Scenario Planner”, a system that enables anyone at Cloudflare to simulate “what-ifs”. This provides our team the opportunity to quickly model hypothetical changes to our demand and supply metrics across time and in any of Cloudflare’s data centers. The core functionality of the system has to do with the same questions we need to answer in the manual models discussed above. After we enter the changes we want to model, Scenario Planner converts from units that are commonly associated with each question to our common unit of measurement: CPU Time. These inputs are then used to model the updated capacity across all of our data centers, including how demand may be distributed in cases where capacity constraints may start impacting performance in a particular location. As we know, if that happens then it triggers Traffic Manager to serve some portion of those requests from a nearby location to minimize impact on customers and user experience.
Updated demand questions with inputs
-
Question: What if a new customer onboards to Cloudflare with a significant volume of requests?
-
Input: The new customer’s expected volume, geographic distribution, and timeframe of requests, converted to a count of virtual CPUs
-
Calculation(s): Scenario Planner converts from server count to CPU Time, and distributes the new demand across the regions selected according to the aggregate distribution of all customer usage.
-
Question: What if an existing customer increased its volume of requests and/or bytes by some multiplier (i.e. 2x, 3x, nx), at peak, for the next three months?
-
Input: Select the customer name, the multiplier, and the timeframe
-
Calculation(s): Scenario Planner already has how the selected customer’s traffic is distributed across all data centers globally, so this involves simply multiplying that value by the multiplier selected by the user
-
Question: What if the growth rate, in number of requests and bytes, of all of our data centers worldwide increased from X to Y two months from now, indefinitely?
-
Input: Enter a new global growth rate and timeframe
-
Calculation(s): Scenario Planner distributes this growth across all data centers globally according to their current growth rate. In other words, the global growth is an aggregation of all individual data center’s growth rates, and to apply a new “Global” growth rate, the system scales up each of the individual data center’s growth rates commensurate with the current distribution of growth.
-
Question: What if the growth rate, in number of requests and bytes, of data center facility A increased from X to Y one month from now?
-
Input: Select a data center facility, enter a new growth rate for that data center and the timeframe to apply that change across.
-
Calculation(s): Scenario Planner passes the new growth rate for the data center to the backend simulator, across the timeline specified by the user
Updated supply questions with inputs
-
Question: What if data center facility A lost some or all of its available servers two months from now?
-
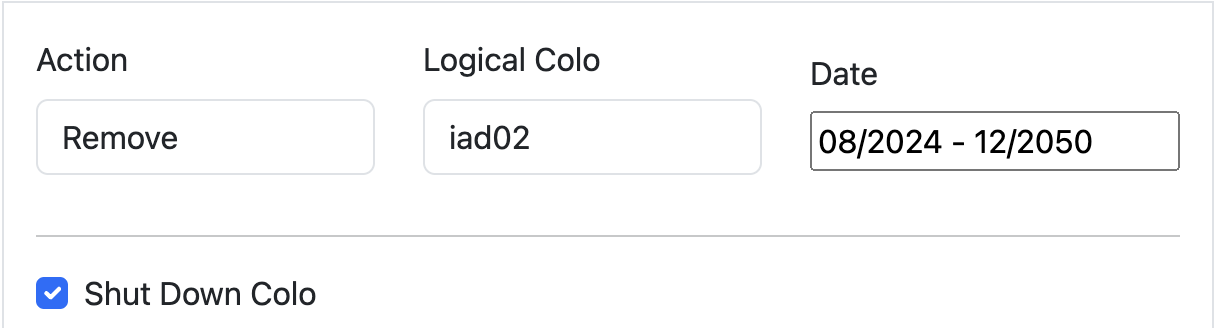
Input: Select a data center, and enter the number of servers to remove, or select to remove all servers in that location, as well as the timeframe for when those servers will not be available
-
Calculation(s): Scenario Planner converts the server count entered (including all servers in a given location) to CPU Time before passing to the backend
-
Question: What if we added X servers to data center facility A today?
-
Input: Select a data center, and enter the number of servers to add, as well as the timeline for when those servers will first go live
-
Calculation(s): Scenario Planner converts the server count entered (including all servers in a given location) to CPU Time before passing to the backend
We made it simple for internal users to understand the impact of those changes because Scenario Planner outputs the same views that everyone who has seen our heatmaps and visual representations of our capacity status is familiar with. There are two main outputs the system provides: a heatmap and an “Expected Failovers” view. Below, we explore what these are, with some examples.
Heatmap
Capacity planning evaluates its success on its ability to predict demand: we generally produce a weekly, monthly, and quarterly forecast of 12 months to three years worth of demand, and nearly all of our infrastructure decisions are based on the output of this forecast. Scenario Planner provides a view of the results of those forecasts that are implemented via a heatmap: it shows our current state, as well as future planned server additions that are scheduled based on the forecast.
Here is an example of our heatmap, showing some of our largest data centers in Eastern North America (ENAM). Ashburn is showing as yellow, briefly, because our capacity planning threshold for adding more server capacity to our data centers is 65% utilization (based on CPU time supply and demand): this gives the Cloudflare teams time to procure additional servers, ship them, install them, and bring them live before customers will be impacted and systems like Traffic Manager would begin triggering. The little cloud icons indicate planned upgrades of varying sizes to get ahead of forecasted future demand well ahead of time to avoid customer performance degradation.
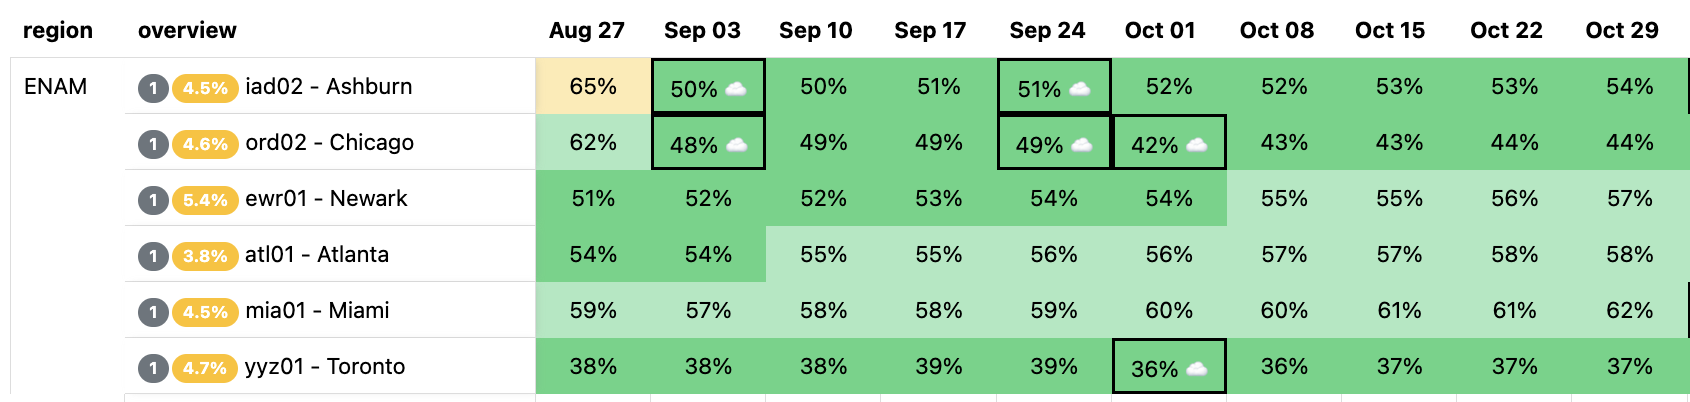
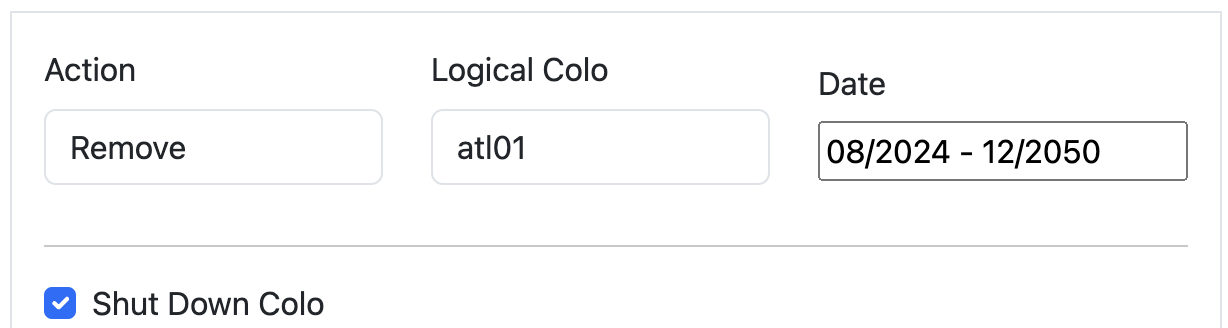
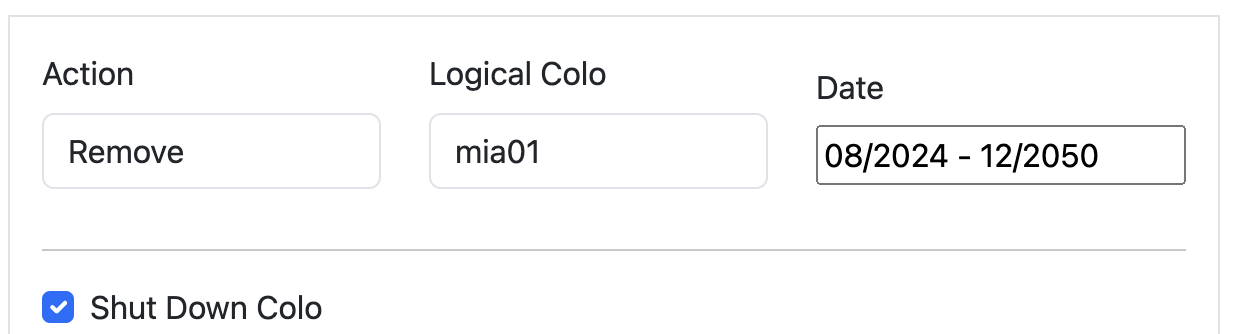
The question Scenario Planner answers then is how this view changes with a hypothetical scenario: What if our Ashburn, Miami, and Atlanta facilities shut down completely? This is unlikely to happen, but we would expect to see enormous impact on the remaining largest facilities in ENAM. We’ll simulate all three of these failing at the same time, taking them offline indefinitely:
This results in a view of our capacity through the rest of the year in the remaining large data centers in ENAM — capacity is clearly constrained: Traffic Manager will be working hard to mitigate any impact to customer performance if this were to happen. Our capacity view in the heatmap is capped at 75%: this is because Traffic Manager typically engages around this level of CPU utilization. Beyond 75%, Cloudflare customers may begin to experience increased latency, though this is dependent on the product and workload, and is in reality much more dynamic.
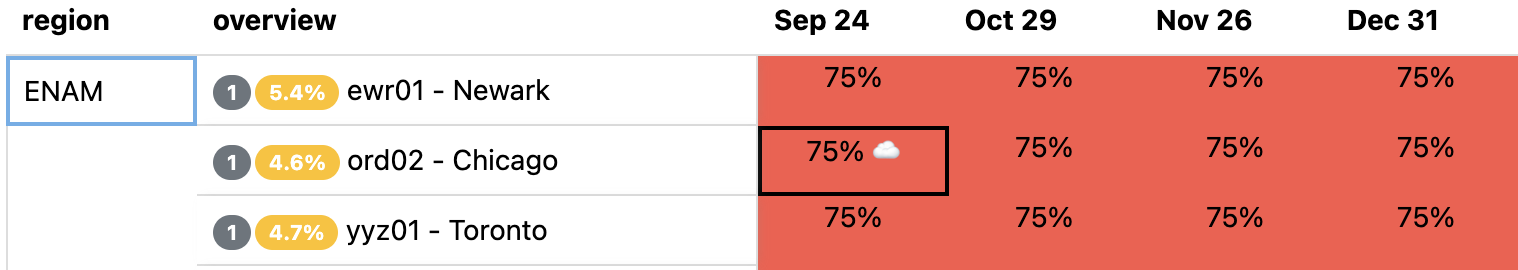
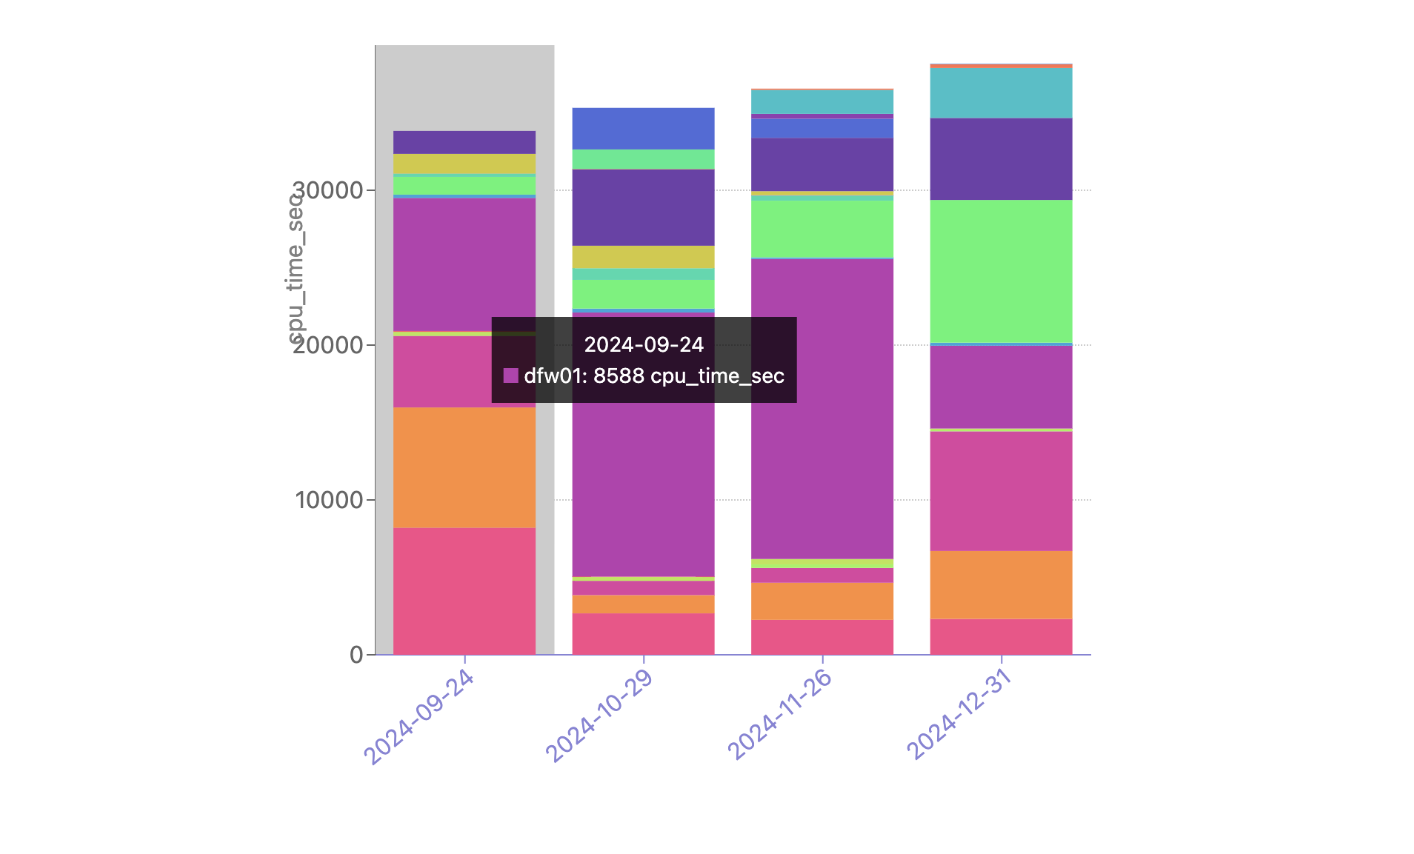
This outcome in the heatmap is not unexpected. But now we typically get a follow-up question: clearly this traffic won’t fit in just Newark, Chicago, and Toronto, so where do all these requests get served from? Enter the failover simulator: Capacity Planning has been simulating how Traffic Manager may work in the long term for quite a while, and for Scenario Planner, it was simple to extend this functionality to answer exactly this question.
There is currently no traffic being moved by Traffic Manager from these data centers, but our simulation shows a significant portion of the Atlanta CPU time being served from our DFW/Dallas data center as well as Newark (bottom pink), and Chicago (orange) through the rest of the year, during this hypothetical failure. With Scenario Planner, Capacity Planning can take this information and simulate multiple failures all over the world to understand the impact to customers, taking action to ensure that customers trusting Cloudflare with their web properties can expect high performance even in instances of major data center failures.
Planning with uncertainty
Capacity planning a large global network comes with plenty of uncertainties. Scenario Planner is one example of the work the Capacity Planning team is doing to ensure that the millions of web properties our customers entrust to Cloudflare can expect consistent, top tier performance all over the world.
The Capacity Planning team is hiring — check out the Cloudflare careers page and search for open roles on the Capacity Planning team.
Cloudflare incident on September 17, 2024
Post Syndicated from Joe Abley original https://blog.cloudflare.com/cloudflare-incident-on-september-17-2024
On September 17, 2024, during routine maintenance, Cloudflare inadvertently stopped announcing fifteen IPv4 prefixes, affecting some Business plan websites for approximately one hour. During this time, IPv4 traffic for these customers would not have reached Cloudflare, and users attempting to connect to websites assigned addresses within those prefixes would have received errors.
We’re very sorry for this outage.
This outage was the result of an internal software error and not the result of an attack. In this blog post, we’re going to talk about what the failure was, why it occurred, and what we’re doing to make sure this doesn’t happen again.
Background
Cloudflare assembled a dedicated Addressing team in 2019 to simplify the ways that IP addresses are used across Cloudflare products and services. The team builds and maintains systems that help Cloudflare conserve and manage its own network resources. The Addressing team also manages periodic changes to the assignment of IP addresses across infrastructure and services at Cloudflare. In this case, our goal was to reduce the number of IPv4 addresses used for customer websites, allowing us to free up addresses for other purposes, like deploying infrastructure in new locations. Since IPv4 addresses are a finite resource and are becoming more scarce over time, we carry out these kinds of “renumbering” exercises quite regularly.
Renumbering in Cloudflare is carried out using internal processes that move websites between sets of IP addresses. A set of IP addresses that no longer has websites associated with it is no longer needed, and can be retired. Once that has happened, the associated addresses are free to be used elsewhere.
Back in July 2024, a batch of Business plan websites were moved from their original set of IPv4 addresses to a new, smaller set, appropriate to the forecast requirements of that particular plan. On September 17, after confirming that all of the websites using those addresses had been successfully renumbered, the next step was to be carried out: detach the IPv4 prefixes associated with those addresses from Cloudflare’s network and to withdraw them from service. That last part was to be achieved by removing those IPv4 prefixes from the Internet’s global routing table using the Border Gateway Protocol (BGP), so that traffic to those addresses is no longer routed towards Cloudflare. The prefixes concerned would then be ready to be deployed for other purposes.
What was released and how did it break?
When we migrated customer websites out of their existing assigned address space in July, we used a one time migration template that cycles through all the websites associated with the old IP addresses and moves them to new ones. This calls a function that updates the IP assignment mechanism to synchronize the IP address-to-website mapping.
A couple of months prior to the July migration, the relevant function code was updated as part of a separate project related to legacy SSL configurations. That update contained a fix that replaced legacy code to synchronize two address pools with a call to an existing synchronization function. The update was reviewed, approved, merged, and released.
Unfortunately, the fix had consequences for the subsequent renumbering work. Upon closer inspection (we’ve done some very close post-incident inspection), a side effect of the change was to suppress updates in cases where there was no linked reference to a legacy SSL certificate. Since not all websites use legacy certificates, the effect was that not all websites were renumbered — 1,661 customer websites remained linked to old addresses in the address pools that were intended to be withdrawn. This was not noticed during the renumbering work in July, which had concluded with the assumption that every website linked to the old addresses had been renumbered, and that assumption was not checked.
At 2024-09-17 17:51 UTC, fifteen IPv4 prefixes corresponding to the addresses that were thought to be safely unused were withdrawn using BGP. Cloudflare operates a global network with hundreds of data centers, and there was some variation in the precise time when the prefixes were withdrawn from particular parts of the world. In the following ten minutes, we observed an aggregate 10 Gbps drop in traffic to the 1,661 affected websites network-wide.
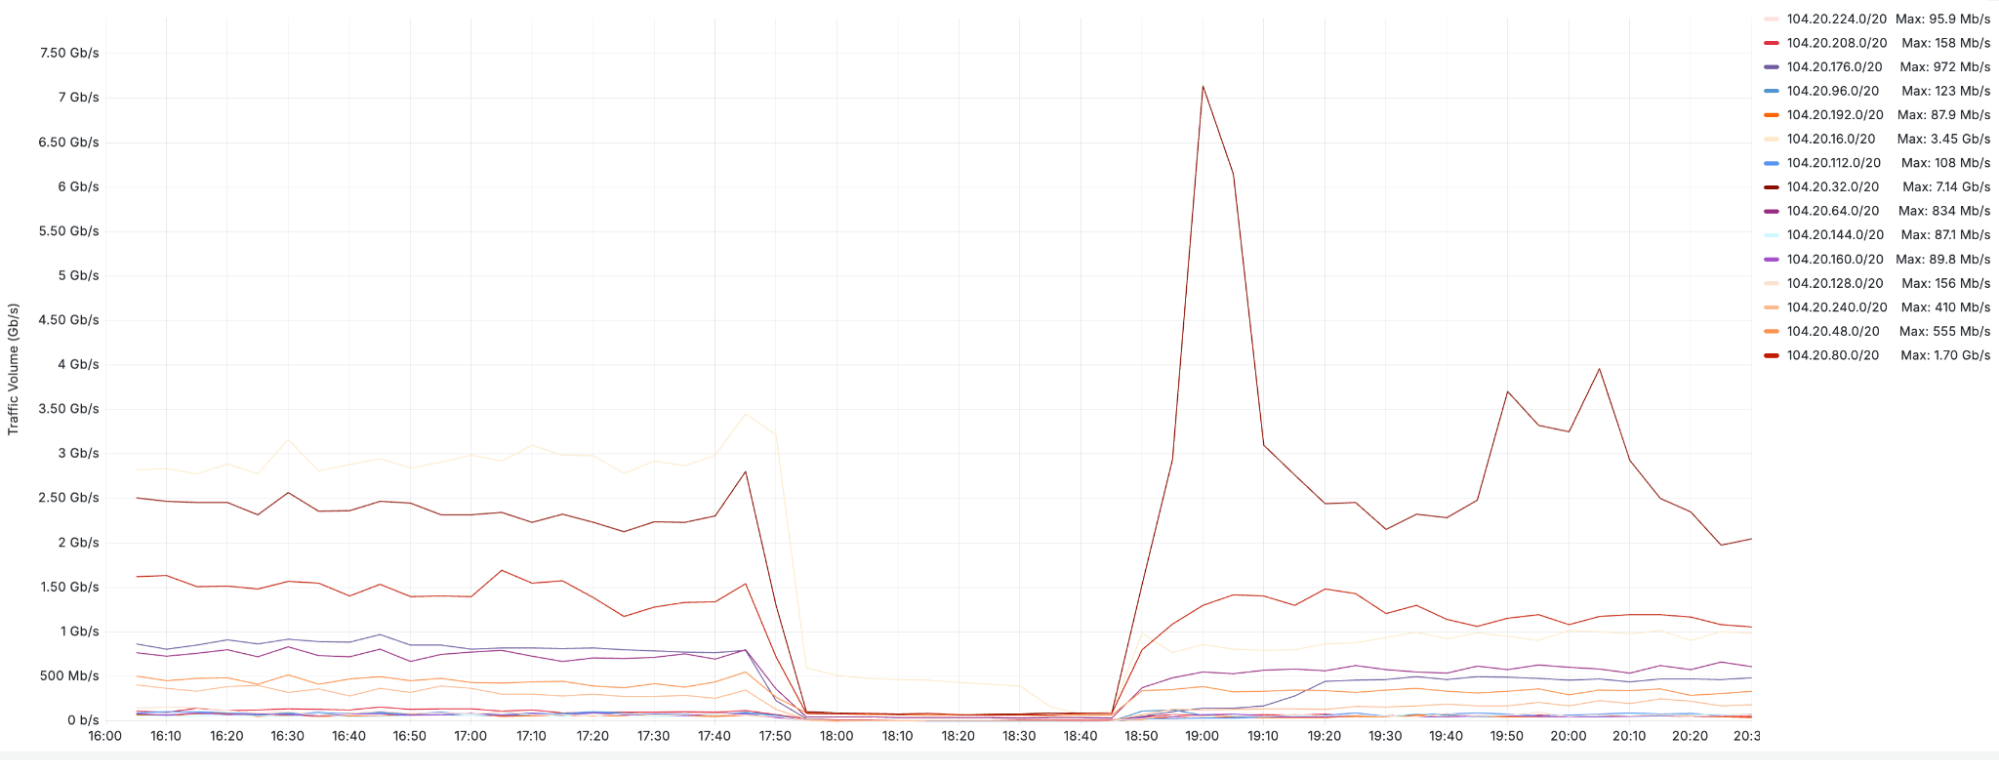
The graph above shows traffic volume (in bits per second) for each individual prefix that was affected by the incident.
Incident timeline and impact
All timestamps are UTC on 2024-09-17.
At 17:41, the Addressing engineering team initiated the release that disabled prefixes in production.
At 17:51, BGP announcements began to be withdrawn and traffic to Cloudflare on the impacted prefixes started to drop.
At 17:57, the SRE team noticed alerts triggered by an increase in unreachable IP address space and began investigating. The investigation ended shortly afterwards, since it is generally expected that IP addresses will become unreachable when they are being removed from service, and consequently the alerts did not seem to indicate an abnormal situation.
At 18:36, Cloudflare received escalations from two customers, and an incident was declared. A limited deployment window was quickly implemented once the severity of the incident was assessed.
At 18:46, Addressing team engineers confirmed that the change introduced in the renumbering release triggered the incident and began preparing the rollback procedure to revert changes.
At 18:50, the release was rolled back, prefixes were re-announced in BGP to the Internet, and traffic began flowing back through Cloudflare.
At 18:50:27, the affected routes were restored and prefixes began receiving traffic again.
There was no impact to IPv6 traffic. 1,661 customer websites that were associated with addresses in the withdrawn IPv4 prefixes were affected. There was no impact to other customers or services.
How did we fix it?
The immediate fix to the problem was to roll back the release that was determined to be the proximal cause. Since all approved changes have tested roll back procedures, this is often a pragmatic first step to fix whatever has just been found to be broken. In this case, as in many, it was an effective way to resolve the immediate impact and return things to normal.
Identifying the root cause took more effort. The code mentioned above that had been modified earlier this year is quite old, and part of a legacy system that the Addressing team has been working on moving away from since the team’s inception. Much of the engineering effort during that time has been on building the modern replacement, rather than line-level dives into the legacy code.
We have since fixed the specific bug that triggered this incident. However, to address the more general problem of relying on old code that is not as well understood as the code in modern systems, we will do more. Sometimes software has bugs, and sometimes software is old, and these are not useful excuses; they are just the way things are. It’s our job to maintain the agility and confidence in our release processes while living in this reality, maintaining the level of safety and stability that our customers and their customers rely on.
What are we doing to prevent this from happening again?
We take incidents like this seriously, and we recognise the impact that this incident had. Though this specific bug has been resolved, we have identified several steps we can take to mitigate the risk of a similar problem occurring in the future. We are implementing the following plan as a result of this incident:
Test: The Addressing Team is adding tests that check for the existence of outstanding assignments of websites to IP addresses as part of future renumbering exercises. These tests will verify that there are no remaining websites that inadvertently depend on the old addresses being in service. The changes that prompted this incident made incorrect assumptions that all websites had been renumbered. In the future, we will avoid making assumptions like those, and instead do explicit checks to make sure.
Process: The Addressing team is improving the processes associated with the withdrawal of Cloudflare-owned prefixes, regardless of whether the withdrawal is associated with a renumbering event, to include automated and manual verification of traffic levels associated with the addresses that are intended to be withdrawn. Where traffic is attached to a service that provides more detailed logging, service-specific request logs will be checked for signs that the addresses thought to be unused are not associated with active traffic.
Implementation: The Addressing Team is reviewing every use of stored procedures and functions associated with legacy systems. Where there is doubt, functionality will be re-implemented with present-day standards of documentation and test coverage.
We are sorry for the disruption this incident caused for our customers. We are actively making these improvements to ensure improved stability moving forward and to prevent this problem from happening again.
Comic for 2024.09.20 – Dr Bizkit, Speech Therapist
Post Syndicated from Explosm.net original https://explosm.net/comics/dr-bizkit-speech-therapist
New Cyanide and Happiness Comic
OpenSSH 9.9 released
Post Syndicated from daroc original https://lwn.net/Articles/991028/
The OpenSSH project has released version 9.9. This version includes support for the
new post-quantum cryptography standard from NIST.
The release also includes
the next step in the deprecation of DSA keys — they are now disabled by default at compile time,
and are expected to be removed entirely in early 2025. The release also contains the normal mixture of bug fixes and small usability improvements.