Post Syndicated from The History Guy: History Deserves to Be Remembered original https://www.youtube.com/watch?v=fdbGzPAUaEE
New Chrome Zero-Day
Post Syndicated from Bruce Schneier original https://www.schneier.com/blog/archives/2024/09/new-chrome-zero-day.html
According to Microsoft researchers, North Korean hackers have been using a Chrome zero-day exploit to steal cryptocurrency.
Experience AI at UNESCO’s Digital Learning Week
Post Syndicated from Ben Garside original https://www.raspberrypi.org/blog/experience-ai-unescos-digital-learning-week/
Last week, we were honoured to attend UNESCO’s Digital Learning Week conference to present our free Experience AI resources and how they can help teachers demystify AI for their learners.

The conference drew a worldwide audience in-person and online to hear about the work educators and policy makers are doing to support teachers’ use of AI tools in their teaching and learning. Speaker after speaker reiterated that the shared goal of our work is to support learners to become critical consumers and responsible creators of AI systems.
In this blog, we share how our conference talk demonstrated the use of Experience AI for pursuing this globally shared goal, and how the Experience AI resources align with UNESCO’s newly launched AI competency framework for students.
Presenting the design principles behind Experience AI
Our talk about Experience AI, our learning programme developed with Google DeepMind, focused on the research-informed approach we are taking in our resource development. Specifically, we spoke about three key design principles that we embed in the Experience AI resources:
Firstly, using AI and machine learning to solve problems requires learners and educators to think differently to traditional computational thinking and use a data-driven approach instead, as laid out in the research around computational thinking 2.0.
Secondly, every word we use in our teaching about AI is important to help young people form accurate mental models about how AI systems work. In particular, we focused our examples around the need to avoid anthropomorphising language when we describe AI systems. Especially given that some developers produce AI systems with the aim to make them appear human-like in their design and outputs, it’s important that young people understand that AI systems are in fact built and designed by humans.

Thirdly we described how we used the SEAME framework we adapted from work by Jane Waite (Raspberry Pi Foundation) and Paul Curzon (Queen Mary University, London) to categorise hundreds of AI education resources and inform the design of our Experience AI resources. The framework offers a common language for educators when assessing the content of resources, and when supporting learners to understand the different aspects of AI systems.
By presenting our design principles, we aimed to give educators, policy makers, and attendees from non-governmental organisations practical recommendations and actionable considerations for designing learning materials on AI literacy.
How Experience AI aligns with UNESCO’s new AI competency framework for students
At Digital Learning Week, UNESCO launched two AI competency frameworks:
- A framework for students, intended to help teachers around the world with integrating AI tools in activities to engage their learners
- A framework for teachers, “defining the knowledge, skills, and values teachers must master in the age of AI”
AI competency framework for students
We have had the chance to map the Experience AI resources to UNESCO’s AI framework for students at a high level, finding that the resources cover 10 of the 12 areas of the framework (see image below).

For instance, throughout the Experience AI resources runs a thread of promoting “citizenship in the AI era”: the social and ethical aspects of AI technologies are highlighted in all the lessons and activities. In this way, they provide students with the foundational knowledge of how AI systems work, and where they may work badly. Using the resources, educators can teach their learners core AI and machine learning concepts and make these concepts concrete through practical activities where learners create their own models and critically evaluate their outputs. Importantly, by learning with Experience AI, students not only learn to be responsible users of AI tools, but also to consider fairness, accountability, transparency, and privacy when they create AI models.
Teacher competency framework for AI
UNESCO’s AI competency framework for teachers outlines 15 competencies across 5 dimensions (see image below). We enjoyed listening to the launch panel members talk about the strong ambitions of the framework as well as the realities of teachers’ global and local challenges. The three key messages of the panel were:
- AI will not replace the expertise of classroom teachers
- Supporting educators to build AI competencies is a shared responsibility
- Individual countries’ education systems have different needs in terms of educator support
All three messages resonate strongly with the work we’re doing at the Raspberry Pi Foundation. Supporting all educators is a fundamental part of our resource development. For example, Experience AI offers everything a teacher with no technical background needs to deliver the lessons, including lesson plans, videos, worksheets and slide decks. We also provide a free online training course on understanding AI for educators. And in our work with partner organisations around the world, we adapt and translate Experience AI resources so they are culturally relevant, and we organise locally delivered teacher professional development.

The teachers’ competency framework is meant as guidance for educators, policy makers, training providers, and application developers to support teachers in using AI effectively, and in helping their learners gain AI literacy skills. We will certainly consult the document as we develop our training and professional development resources for teachers further.
Towards AI literacy for all young people
Across this year’s UNESCO’s Digital Learning Week, we saw that the role of AI in education took centre stage across the presentations and the informal conversations among attendees. It was a privilege to present our work and see how well Experience AI was received, with attendees recognising that our design principles align with the values and principles in UNESCO’s new AI competency frameworks.

We look forward to continuing this international conversation about AI literacy and working in aligned ways to support all young people to develop a foundational understanding of AI technologies.
The post Experience AI at UNESCO’s Digital Learning Week appeared first on Raspberry Pi Foundation.
The Wandering Officer
Post Syndicated from The Atlantic original https://www.youtube.com/watch?v=jsl4WW8kDKs
Monitoring Zabbix Security Advisories
Post Syndicated from Brian van Baekel original https://blog.zabbix.com/monitoring-zabbix-security-advisories/28672/
Zabbix plays a crucial role in monitoring all kinds of “things” – IoT devices, domains, cloud infrastructures and more. It can also be integrated with third-party solutions – for example, with Oxidized for configuration backup monitoring. Given the nature of Zabbix, it usually contains a lot of confidential information as well as (more importantly) some kind of elevated access to network elements while being used by operators, engineers, and customers. This requires that Zabbix as a product should be as secure as possible.
Zabbix has upped their security game and is actively working with HackerOne to take full advantage of the reach of their global community by providing a bug bounty program. And though it doesn’t happen too often, from time to time a security issue arises in Zabbix or one of its dependencies, warranting the release of a Security Advisory.
Table of Contents
The issue
Zabbix typically releases a Security Advisory and might even assign a CVE to the issue. Cool, that is what we expect from reputable software developers. They even inform their customers with support contracts before publishing the advisory, in order to allow them to patch installations beforehand.
Unfortunately, if you don’t have a support contract you’re expected to find out about these security advisories on your own, either by monitoring the Security Advisory page or by monitoring the published CVEs for Zabbix. NIST has a public API that can be used and that works well, but the issue with CVE’s is that they are often incomplete and thus useless. For example, CVE-2024-22119 contains far less information than the advisory.
Currently, Zabbix does not publish an API for their Security Advisories. There is the public tracker which contains all entries and can be queried via API, but because it is unstructured text, it is really hard to parse.
The solution
We want to automatically be notified of new security advisories, and the only data source that contains all data in a structured way is the Zabbix Security Advisory page. However, structured doesn’t mean easily parseable – in fact, it is just raw HTML. We could try to solve this issue in Zabbix, but the easier solution in this case is to scrape the page and generate a JSON file which then can be parsed by Zabbix to achieve our goal, which is automated notifications of new advisories.
Webscraping
We’ve chosen to scrape the Zabbix site using Rust, utilizing the Scraper crate to parse the HTML and flesh out the relevant parts we want. Without going into too much detail, the interesting information is stored in 2 tables, one with the table-simple class applied and one with the table-vertical class applied. Using CSS selectors (which is what the Scraper crate requires), we can retrieve the information we want.
This information is then stored in a struct, which gets added to a hashmap. The result is stored in a vector, which is added to a struct, which eventually is used to generate the JSON we require. Phew.
The resulting JSON is easily parseable by Zabbix:
{
  "last_updated": {
    "secs": ,
    "nanos": ,
  },
  "reports": [
    _list of reports_
  ]
}
The ‘reports’ array contains one entry per advisory, and each entry has the following layout. Unsurprisingly, this closely matches the information that is available on the Zabbix Security Advisory page:
    {
      "_zbxref_": {
        "zbxref": "_zbxref_",
        "cveref": "CVE-XXXX-XXXX",
        "score": X.X,
        "synopsis": "_synopsis_",
        "description": "_description_",
        "vectors": "_vectors_",
        "resolution": "_resolution_",
        "workaround": "_workaround_",
        "acknowledgement": "_acknowledgement_",
        "components": [
          _list of components_,
          _list of components_
        ],
        "affected_version": [
          {
            "affected": "_version_",
            "fixed": "_version_"
          }
        ]
      }
    }
Now, we could provide you with the code of the scraping tool and wish you good luck with making sure the tool runs every X hours and somehow, somewhere stores the resulting JSON for Zabbix to parse. That would be the easy way out, right?
Instead, we’ve chosen to host the Rust program as an AWS Lambda function, triggered every 2 hours by the AWS EventBridge Scheduler and with some code added to the Rust program (function?) to upload the resulting JSON to an AWS S3 bucket. This chain of AWS products not only makes sure that our cloud bill increases, but also guarantees we don’t have to host (and maintain!) anything ourselves.
The result? Just one HTTP GET away…
Template
TL;DR: Download the template here.
Now that the data is available in JSON, it’s fairly easy to parse it using Zabbix. Using the HTTP Agent data collection, we download the JSON from AWS. The URI is stored in the {$ZBX_ADVISORY_URI} macro, which allows for easy modification. By default, it points to the JSON file hosted on AWS S3. This retrieval is done by the Retrieve the Zabbix Security Advisories item, which acts as the source for every other operation. It retrieves the JSON every hour, and with the JSON being generated every 2 hours, the maximum delay between Zabbix publishing a new advisory and you getting it into Zabbix is 3 hours.
The retrieve the Zabbix Security Advisories item acts as a master item for the Last Updated item. This item uses a JSONPath preprocessing step to flesh out the information we want: $.last_updated.secs. The resulting data is stored as unixtime so that we mere mortals can easily read when the last update of the JSON file was performed.
A trigger is configured for this item to ensure that the JSON file isn’t too old. The trigger JSON Feed is out of date has the following expression:
last(/Zabbix Security Advisories/zbx_sec.last_updated)>{$ZBX_ADVISORY_UPDATE_INTERVAL}*{$ZBX_ADVISORY_UPDATE_THRESHOLD}
By default, {$ZBX_ADVISORY_UPDATE_INTERVAL} is set to 2 hours (which is the interval the file gets updated by our tool) and {$ZBX_ADVISORY_UPDATE_THRESHOLD} is set to 3. So, when the JSON file hasn’t been updated within the last 6 hours, this trigger will trigger.
The item Number of advisories uses the same principle, where a JSONPath preprocessing step is used to flesh out the information we want: $.reports. However, as $.reports is an array, we can use functions on it. In this case .length(), which returns an integer. This number is used in the associated trigger A new Zabbix Security Advisory has been published, which simply triggers when the value changes.
This is all very cool, but the JSON has a lot more information, including details about each report. In order to get these details into Zabbix, we use a discovery rule to ‘loop’ through the JSON and create items based on what we’ve discovered: Discover Advisories. This rule uses (again) a JSONPath preprocessing step to get the details we want: $.reports[*][*]. Based on the resulting data (which is a single report in this case), 2 LLD Macros are assigned: {#ZBXREF} – based on the JSONpath $.zbxref and {{#CVEREF} – based on the JSONpath $.cveref.
For each discovered report, 8 items are created. They all work using the same principle, so I will only describe one: Advisory {#ZBXREF} / {#CVEREF} – Acknowledgement. This item uses the master item Zabbix Security Advisories, just like all other items described so far. JSONPath is once again used to get the information we want. The expression $.reports[*][“{#ZBXREF}”].acknowledgement.first() provides exactly what we need, where we combine a LLD macro ({#ZBXREF}) and a JSONpath function (.first()) to first ‘select’ the correct advisory in the JSON and then retrieve the value.
All other 7 items work like this, and there is only one exception: Advisory {#ZBXREF} / {#CVEREF} – Components. The ‘components’ value in the JSON file is actually an array with 1 or more items, describing which components might be affected. But we cannot store arrays in Zabbix, so we use another preprocessing step to convert the array into a string. A few lines of Javascript is all we need:
components = JSON.parse(value);
return components.toString();
First, we parse the JSON input (‘value’) into an array, only to apply the javascript .toString() function on it. The toString method of arrays calls join() internally, which joins the array and returns one string containing each array element separated by commas, which is exactly what we want: a string, separated by commas.
To make working with these advisories easier, each item has the component tag applied, with the value zabbix_security. If the item belongs to an advisory, the advisory tag is added with the value of {#ZBXREF} (which is the advisory number/name). That way, we can easily filter on all Zabbix Security items, filter on all items for a single advisory, and (to make things even better) the type tag is also applied, with the actual type being ‘workaround’ or ‘description.’ This allows for filtering on all Zabbix Security items, of the type ‘score’ (et cetera) to easily gain insight into the different advisories and their score, synopsis, description, components, et cetera.
Dashboard
The tags on the items allow for filtering, but with Zabbix 7.0 we can use all great new nifty features, such as the Item Navigator widget combined with the Item Value widget. Let’s take a look at what configuring such a dashboard might look like if you set up the Item Navigator widget as follows:
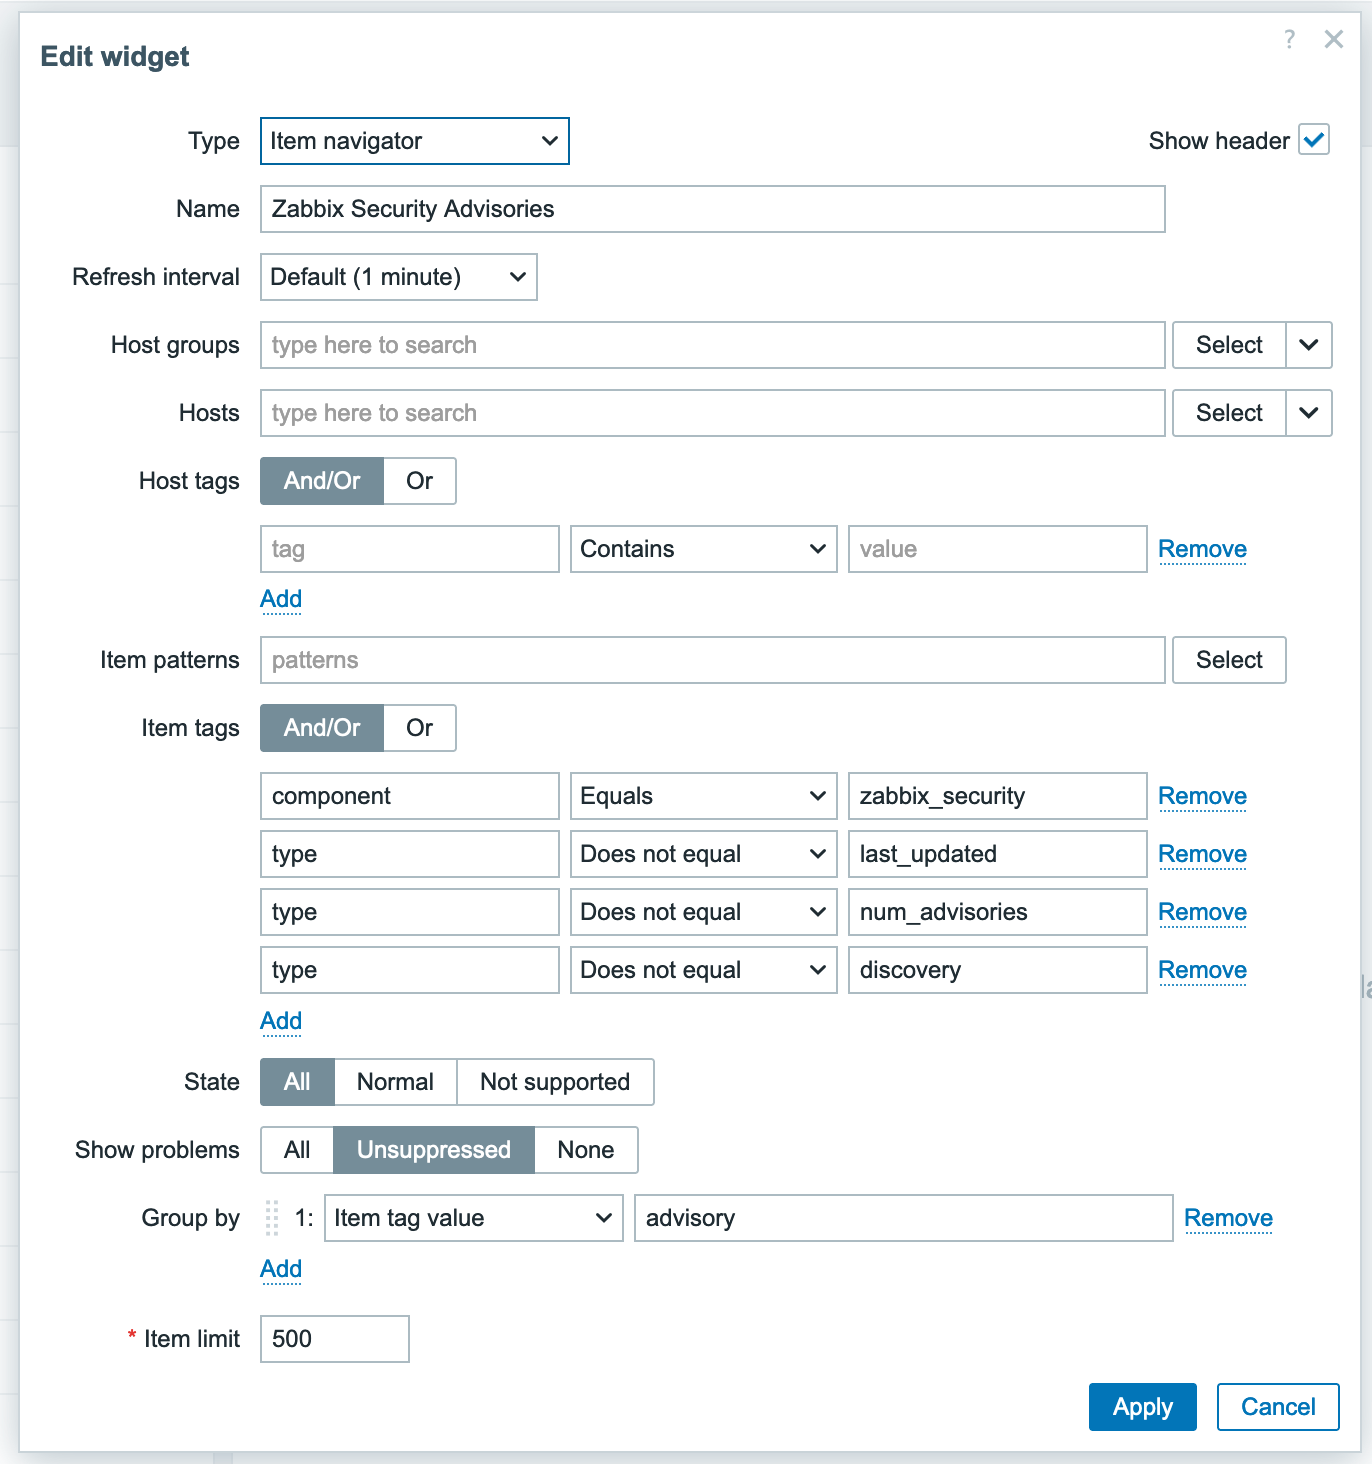
And then ‘link’ the Item Value widget to it:
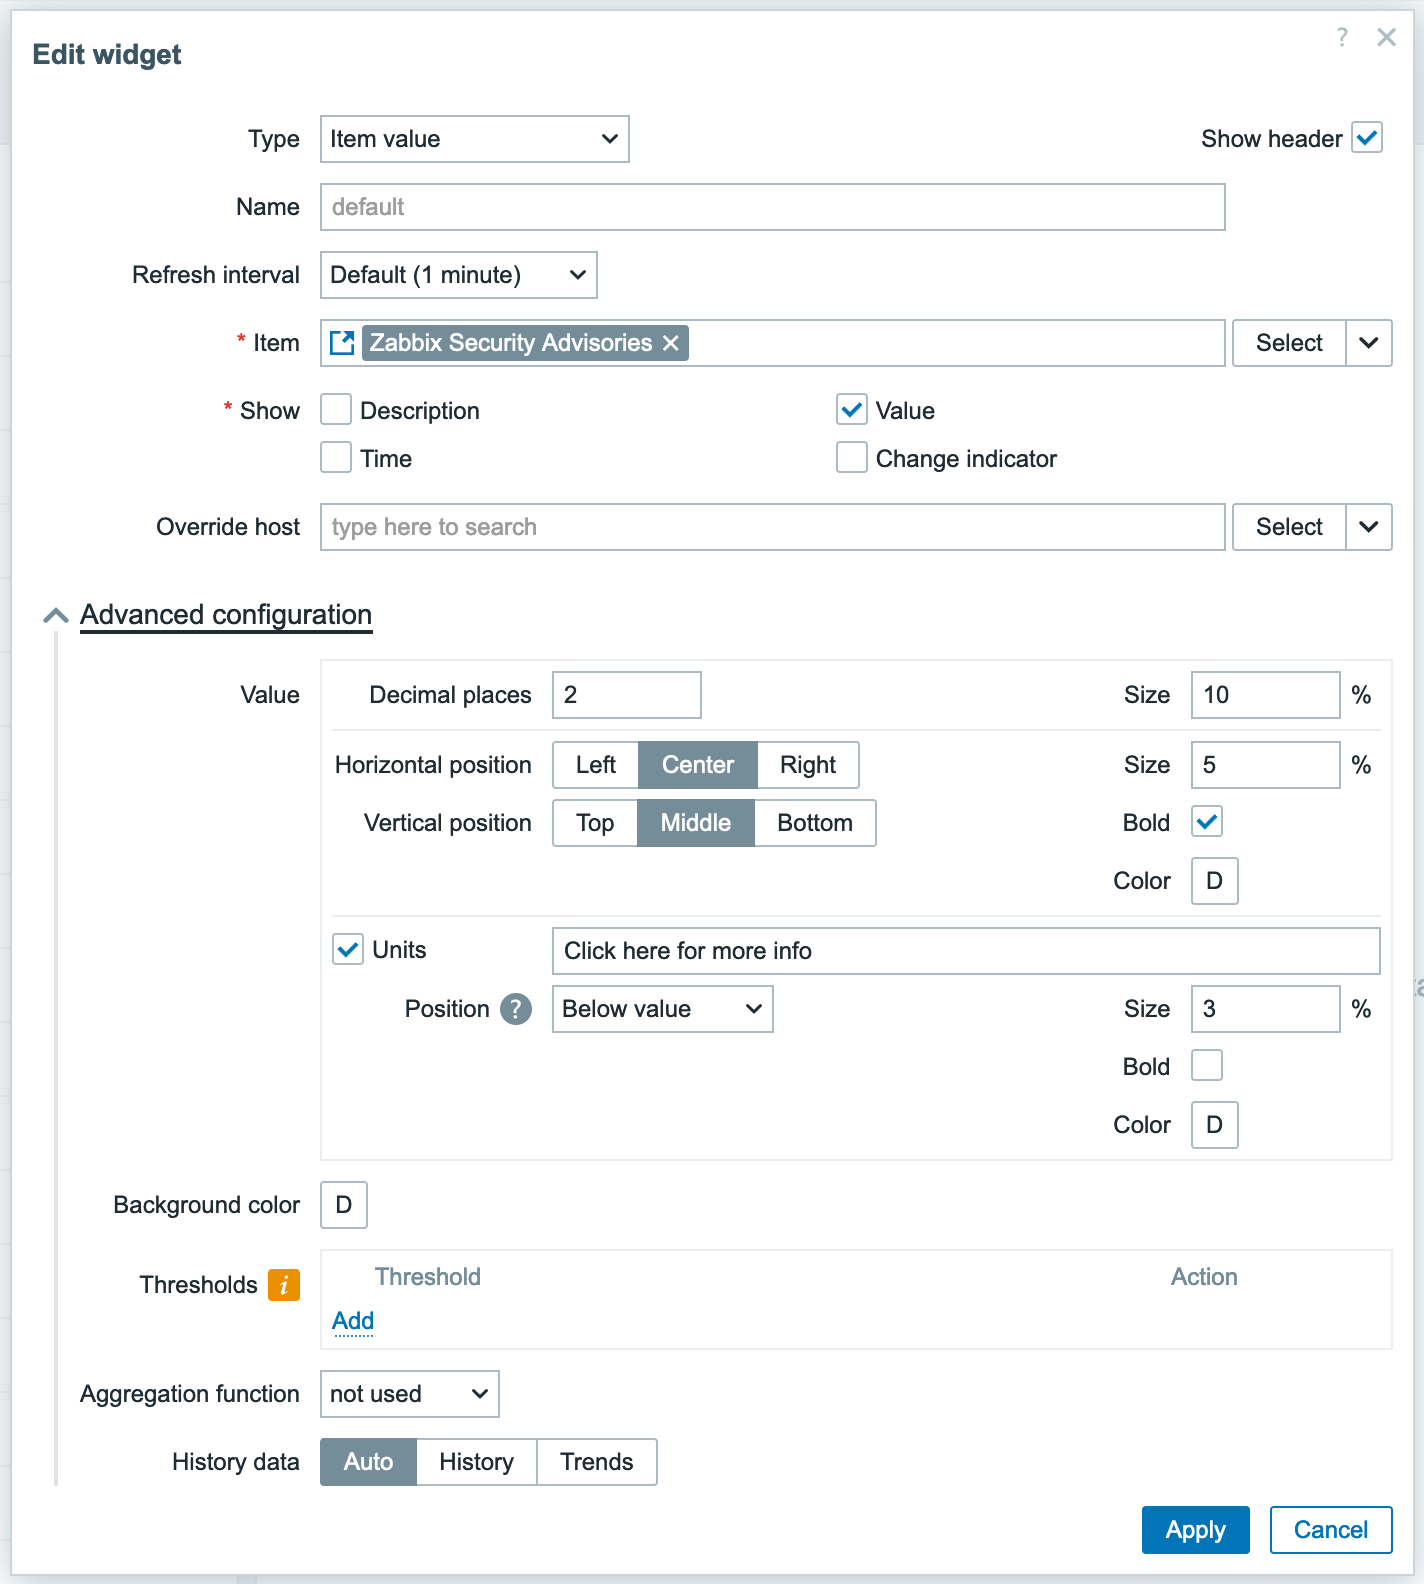
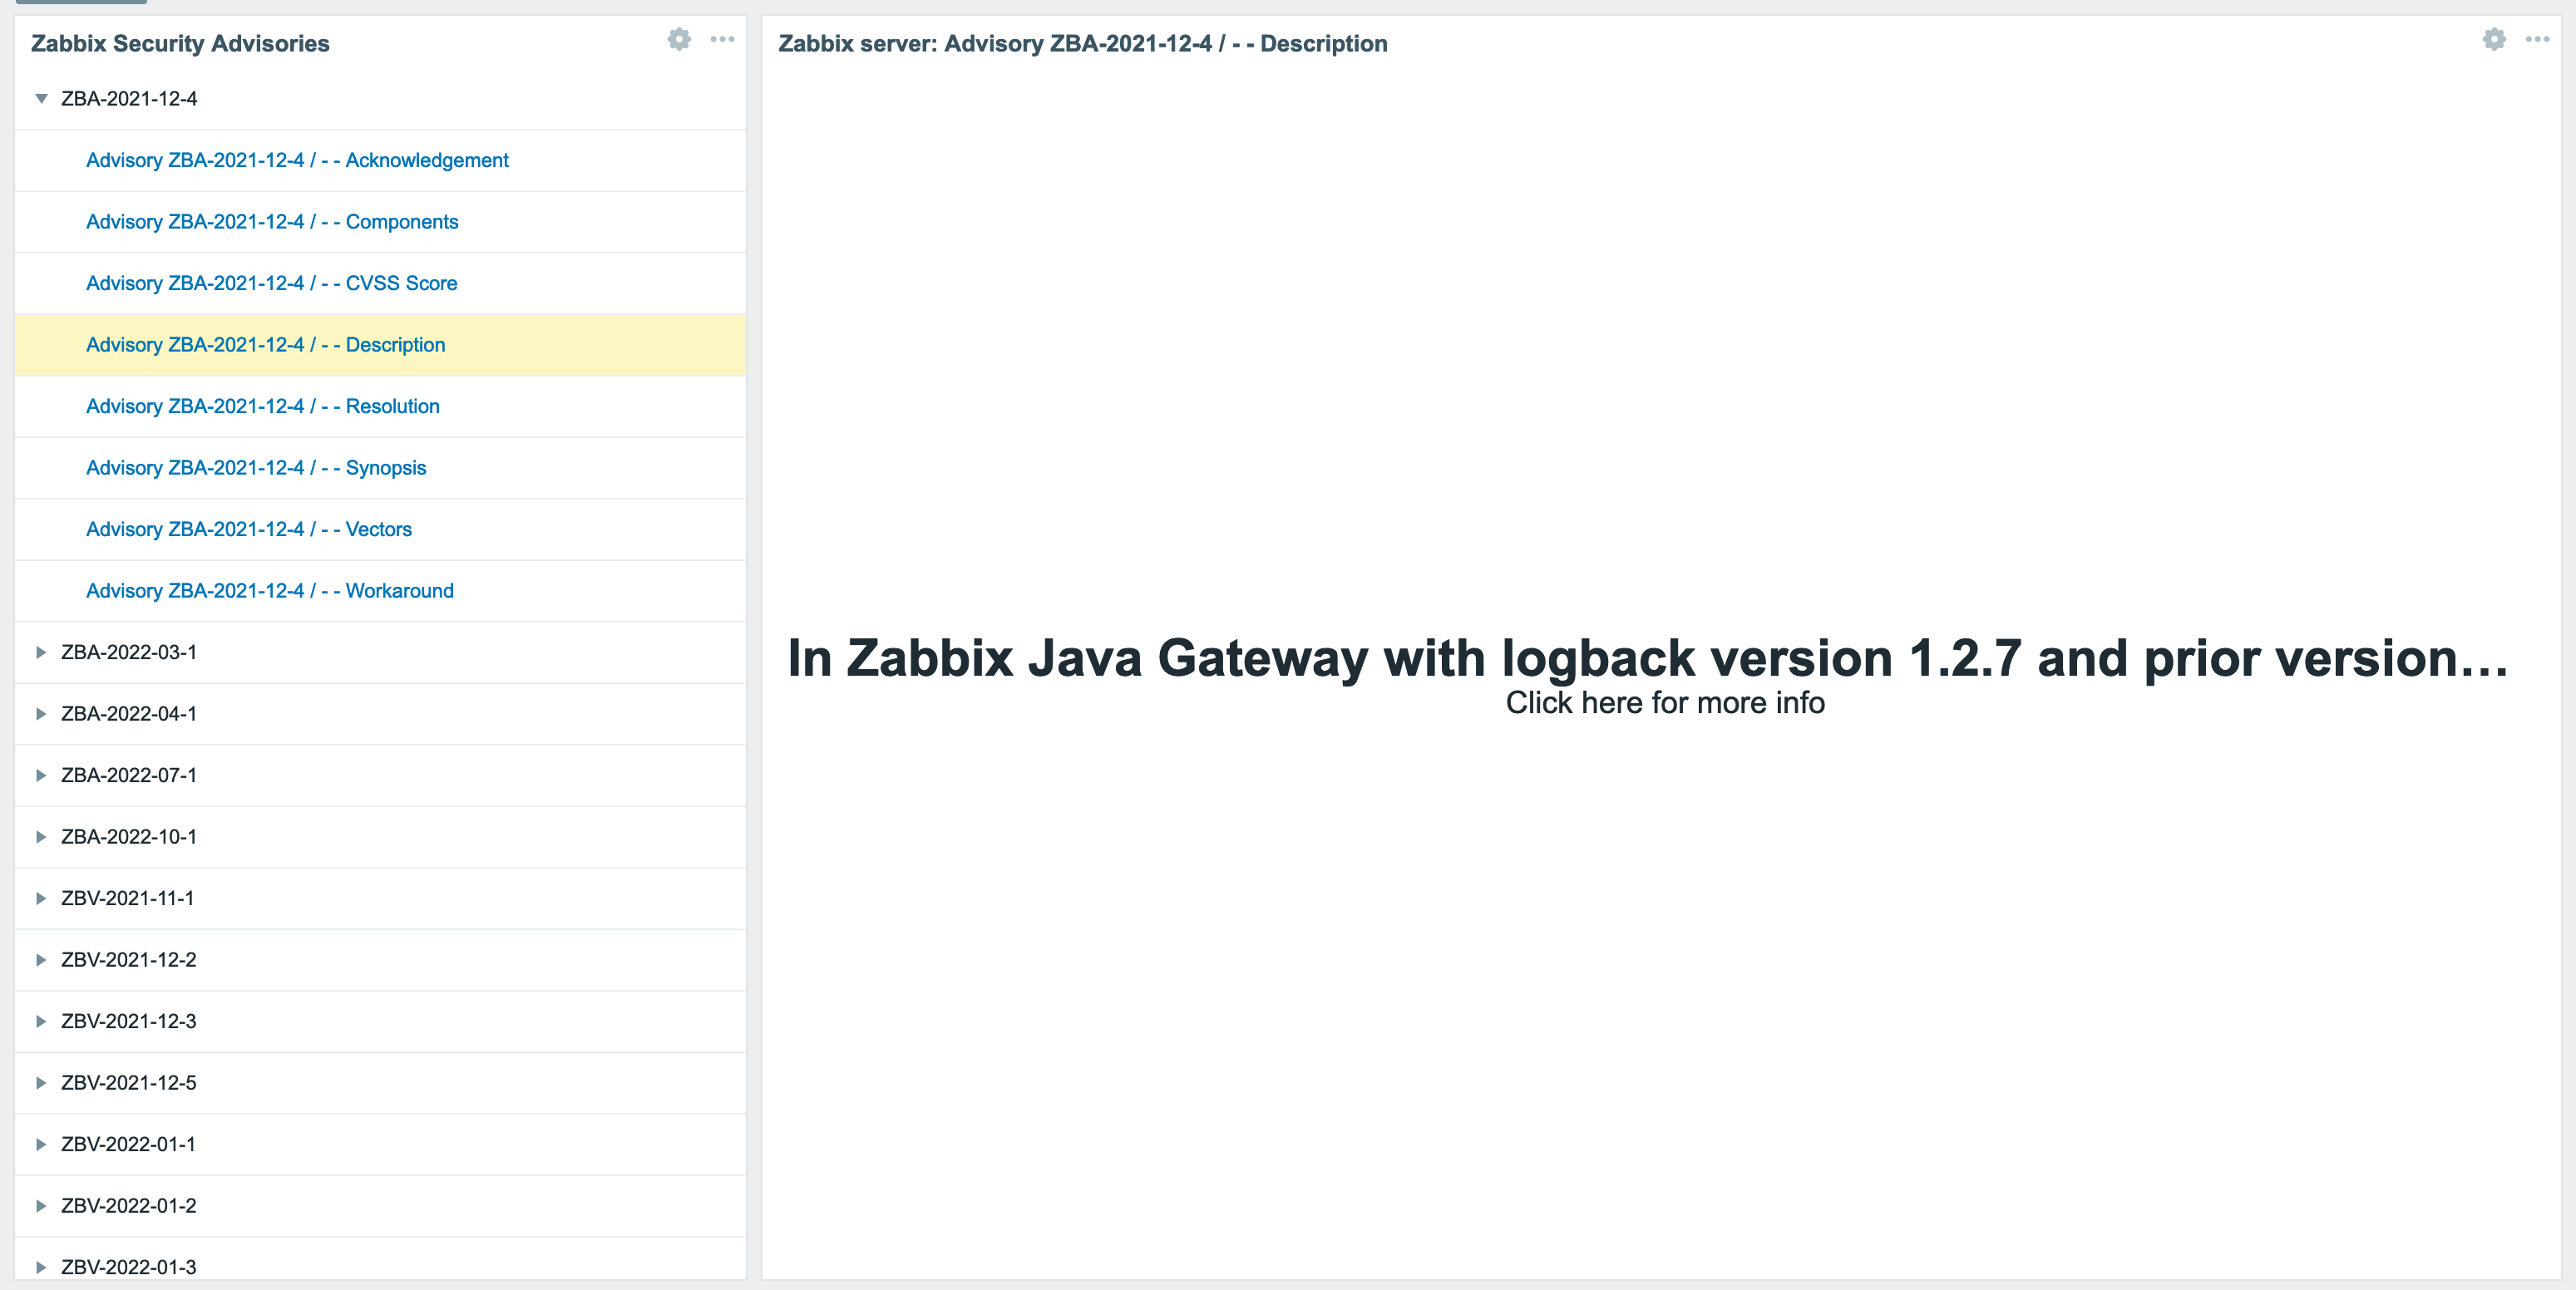
You should get a somewhat decent dashboard. It isn’t perfect (given that the Item Value widget only seems to be able to display a single line of text) but it’s something.
Disclaimer
Though we use this functionality ourselves, this all comes without any guarantee. The technology used to retrieve data (screen scraping) is mediocre at best and could break at any moment if and when Zabbix changes the layout of their page.
The post Monitoring Zabbix Security Advisories appeared first on Zabbix Blog.
Shoe Rationing in WWII
Post Syndicated from The History Guy: History Deserves to Be Remembered original https://www.youtube.com/watch?v=SYRpscDOqmc
Unveiling the process: The creation of our powerful campaign builder
Post Syndicated from Grab Tech original https://engineering.grab.com/the-creation-of-our-powerful-campaign-builder
In a previous blog, we introduced Trident, Grab’s internal marketing campaign platform. Trident empowers our marketing team to configure If This, Then That (IFTTT) logic and processes real-time events based on that.
While we mainly covered how we scaled up the system to handle large volumes of real-time events, we did not explain the implementation of the event processing mechanism. This blog will fill up this missing piece. We will walk you through the various processing mechanisms supported in Trident and how they were built.
Base building block: Treatment
In our system, we use the term “treatment” to refer to the core unit of a full IFTTT data structure. A treatment is an amalgamation of three key elements – an event, conditions (which are optional), and actions. For example, consider a promotional campaign that offers “100 GrabPoints for completing a ride paid with GrabPay Credit”. This campaign can be transformed into a treatment in which the event is “ride completion”, the condition is “payment made using GrabPay Credit”, and the action is “awarding 100 GrabPoints”.
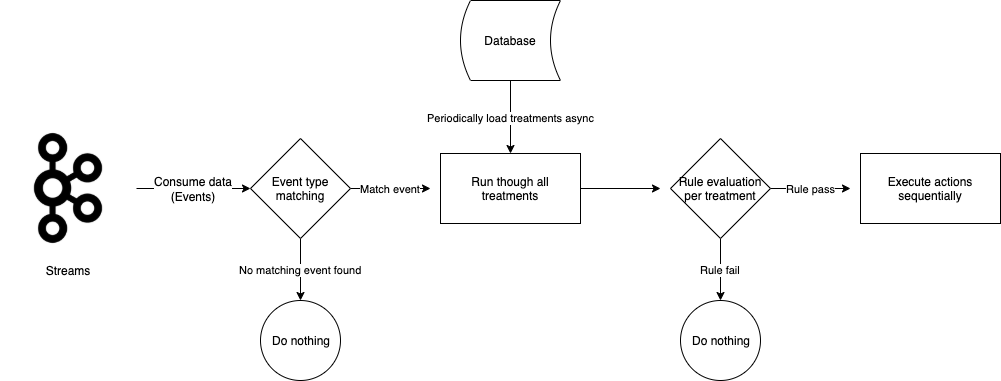
Data generated across various Kafka streams by multiple services within Grab forms the crux of events and conditions for a treatment. Trident processes these Kafka streams, treating each data object as an event for the treatments. It evaluates the set conditions against the data received from these events. If all conditions are met, Trident then executes the actions.
When the Trident user interface (UI) was first established, campaign creators had to grasp the treatment concept and configure the treatments accordingly. As we improved the UI, it became more user-friendly.
Building on top of treatment
Campaigns can be more complex than the example we provided earlier. In such scenarios, a single campaign may need transformation into several treatments. All these individual treatments are categorised under what we refer to as a “treatment group”. In this section, we discuss features that we have developed to manage such intricate campaigns.
Counter
Let’s say we have a marketing campaign that “rewards users after they complete 4 rides”. For this requirement, it’s necessary for us to keep track of the number of rides each user has completed. To make this possible, we developed a capability known as counter.
On the backend, a single counter setup translates into two treatments.
Treatment 1:
- Event:
onRideCompleted - Condition: N/A
- Action:
incrementUserStats
Treatment 2:
- Event:
onProfileUpdate - Condition:
Ride Count == 4 - Action:
awardReward
In this feature, we introduce a new event, onProfileUpdate. The incrementUserStats action in Treatment 1 triggers the onProfileUpdate event following the update of the user counter. This allows Treatment 2 to consume the event and perform subsequent evaluations.
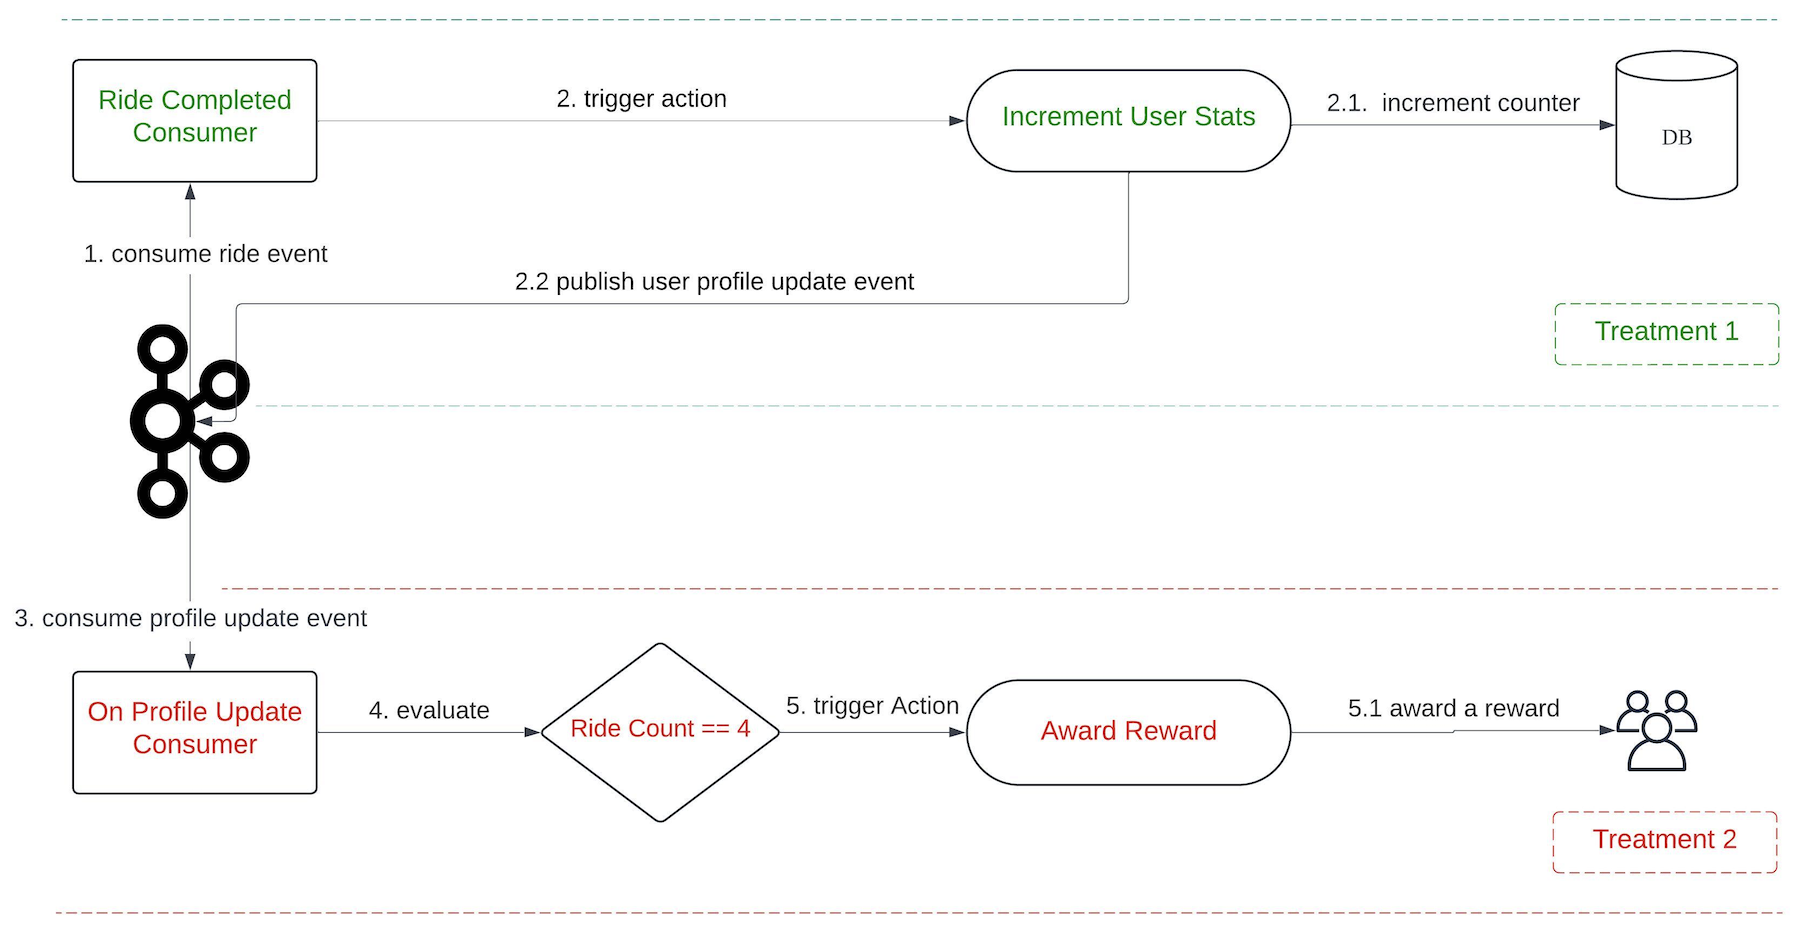
When the onRideCompleted event is consumed, Treatment 1 is evaluated which then executes the incrementUserStat action. This action increments the user’s ride counter in the database, gets the latest counter value, and publishes an onProfileUpdate event to Kafka.
There are also other consumers that listen to onProfileUpdate events. When this event is consumed, Treatment 2 is evaluated. This process involves verifying whether the Ride Count equals to 4. If the condition is satisfied, the awardReward action is triggered.
This feature is not limited to counting the number of event occurrences only. It’s also capable of tallying the total amount of transactions, among other things.
Delay
Another feature available on Trident is a delay function. This feature is particularly beneficial in situations where we want to time our actions based on user behaviour. For example, we might want to give a ride voucher to a user three hours after they’ve ordered a ride to a theme park. The intention for this is to offer them a voucher they can use for their return trip.
On the backend, a delay setup translates into two treatments. Given the above scenario, the treatments are as follows:
Treatment 1:
- Event:
onRideCompleted - Condition:
Dropoff Location == Universal Studio - Action:
scheduleDelayedEvent
Treatment 2:
- Event:
onDelayedEvent - Condition: N/A
- Action:
awardReward
We introduce a new event, onDelayedEvent, which Treatment 1 triggers during the scheduleDelayedEvent action. This is made possible by using Simple Queue Service (SQS), given its built-in capability to publish an event with a delay.
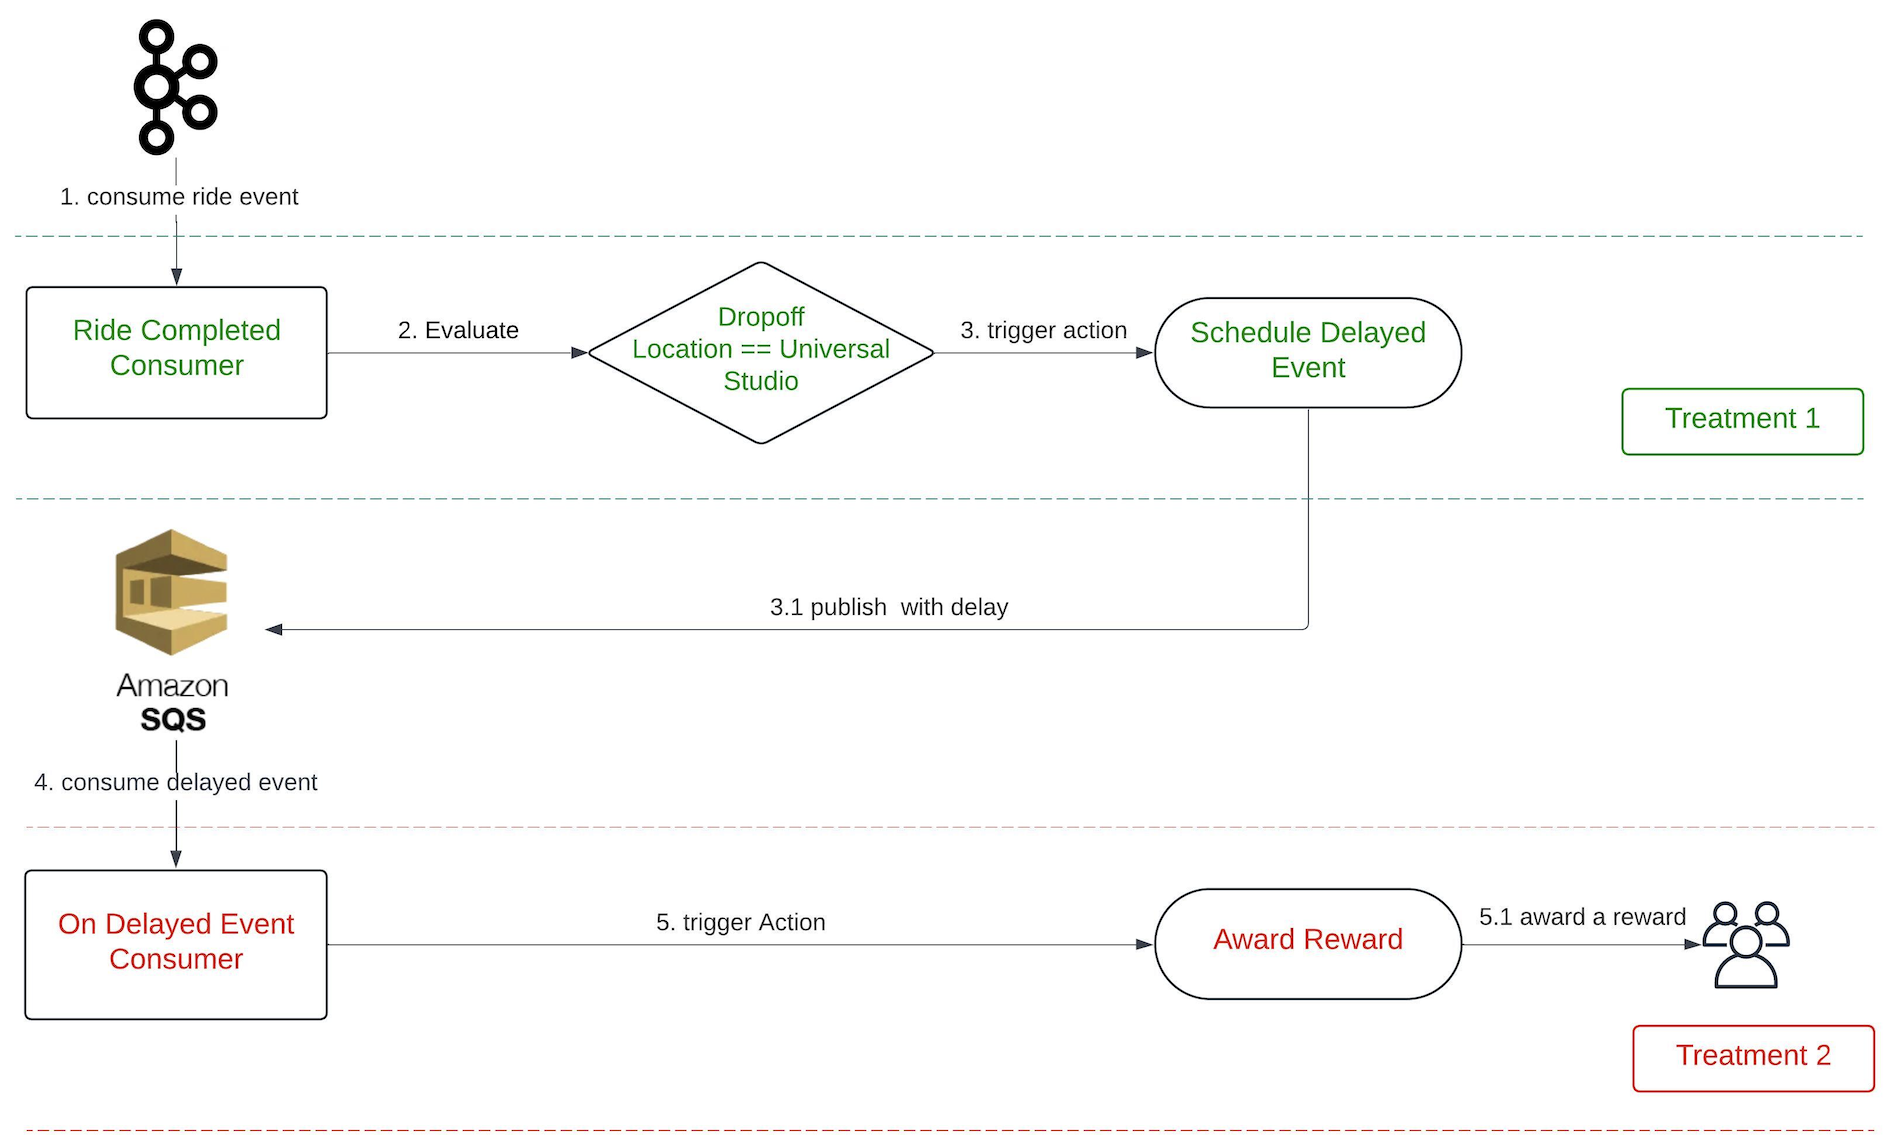
The maximum delay that SQS supports is 15 minutes; meanwhile, our platform allows for a delay of up to x hours. To address this limitation, we publish the event multiple times upon receiving the message, extending the delay by another 15 minutes each time, until it reaches the desired delay of x hours.
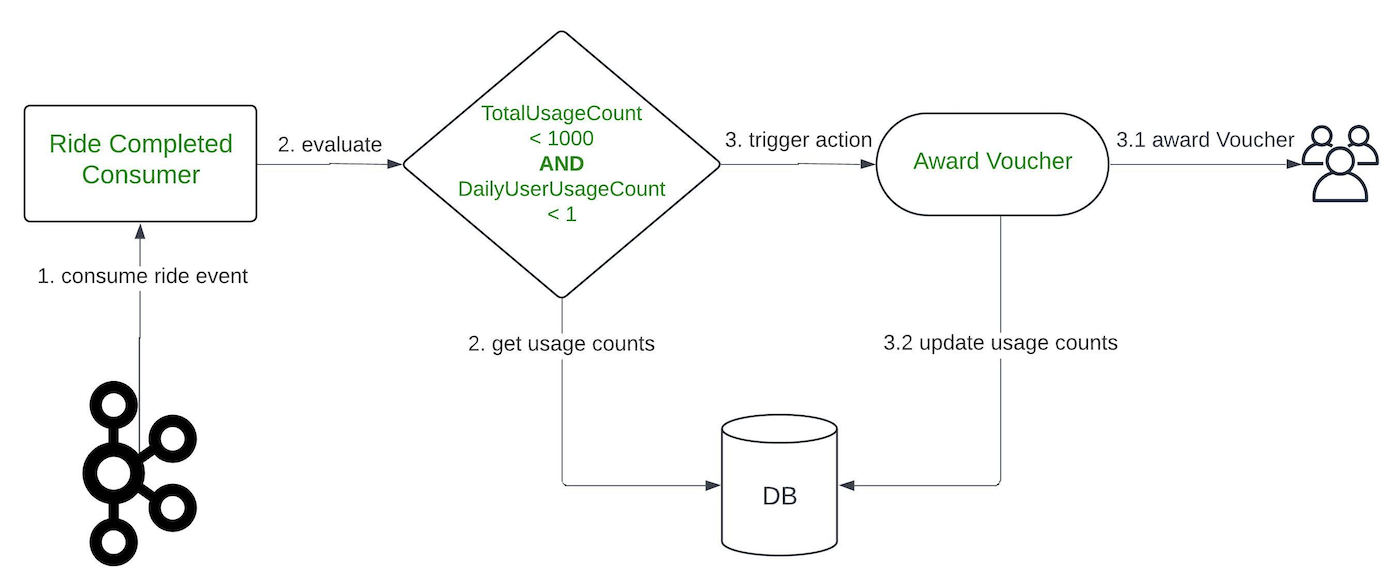
Limit
The Limit feature is used to restrict the number of actions for a specific campaign or user within that campaign. This feature can be applied on a daily basis or for the full duration of the campaign.
For instance, we can use the Limit feature to distribute 1000 vouchers to users who have completed a ride and restrict it to only one voucher for one user per day. This ensures a controlled distribution of rewards and prevents a user from excessively using the benefits of a campaign.
In the backend, a limit setup translates into conditions within a single treatment. Given the above scenario, the treatment would be as follows:
- Event:
onRideCompleted - Condition:
TotalUsageCount <= 1000 AND DailyUserUsageCount <= 1 - Action:
awardReward
Similar to the Counter feature, it’s necessary for us to keep track of the number of completed rides for each user in the database.
A better campaign builder
As our campaigns grew more and more complex, the treatment creation quickly became overwhelming. A complex logic flow often required the creation of many treatments, which was cumbersome and error-prone. The need for a more visual and simpler campaign builder UI became evident.
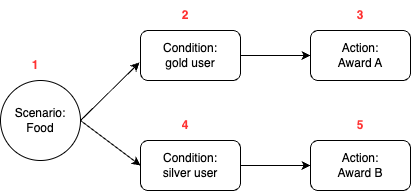
Our design team came up with a flow-chart-like UI. Figure 5, 6, and 7 show examples of how certain imaginary campaign setup would look like in the new UI.
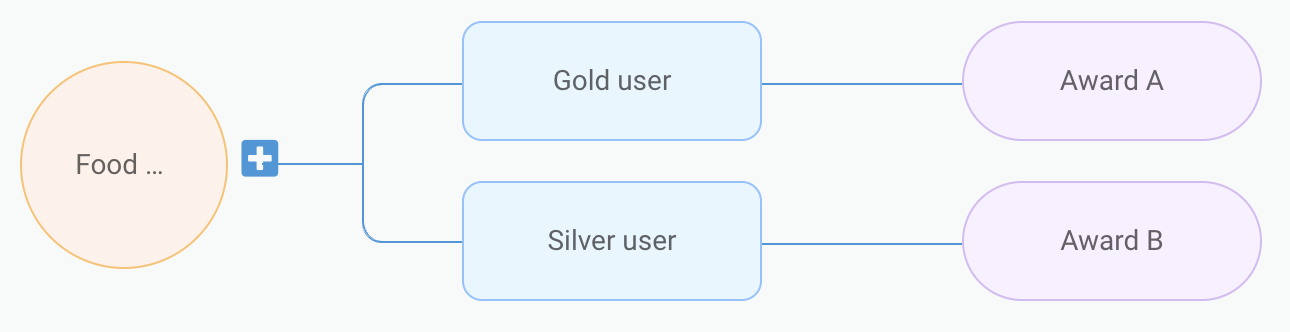
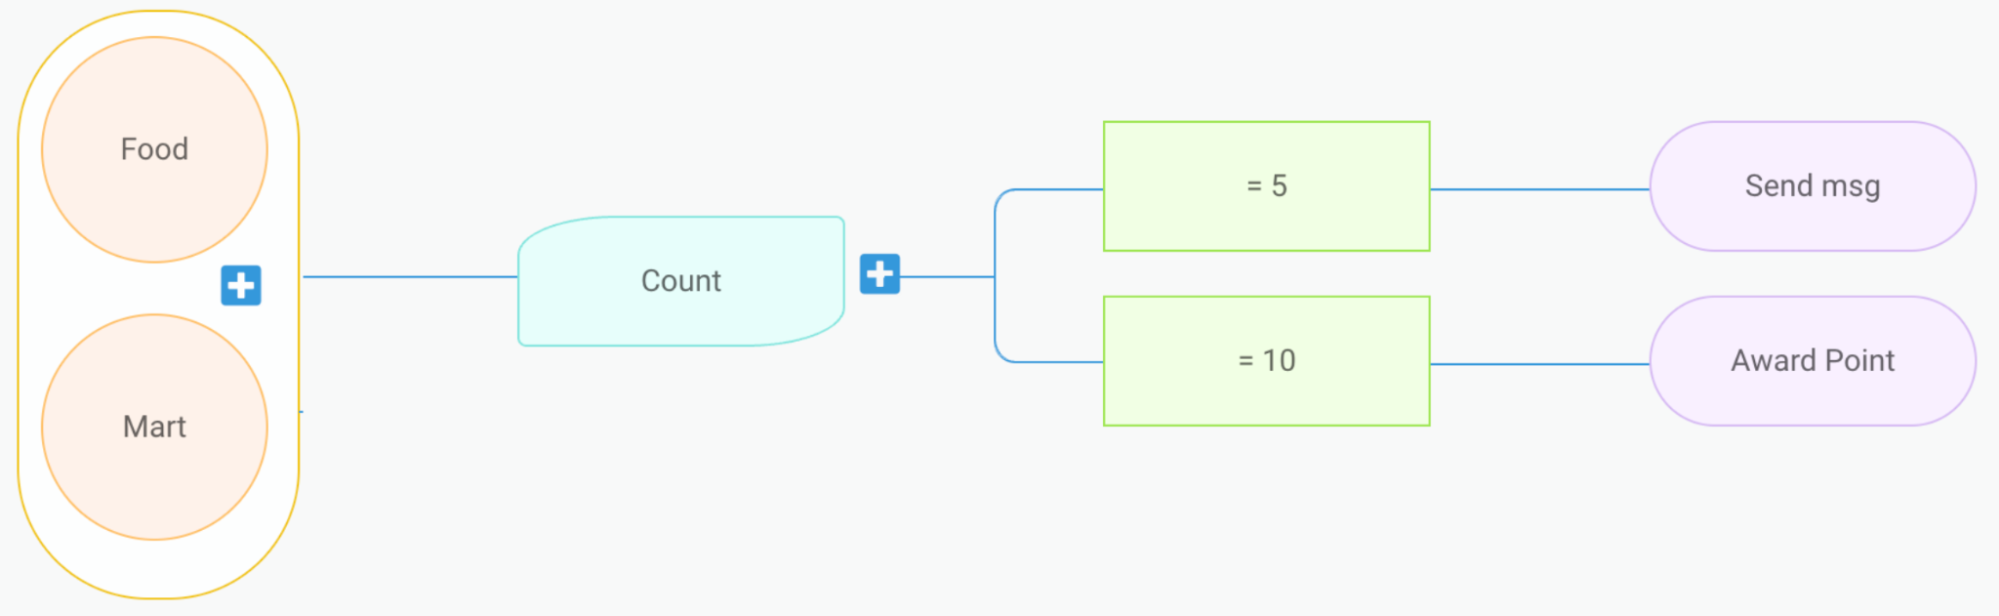

The campaign setup in the new UI can be naturally stored as a node tree structure. The following is how the example in figure 5 would look like in JSON format. We assign each node a unique number ID, and store a map of the ID to node content.
{
  "1": {
    "type": "scenario",
    "data": { "eventType": "foodOrderComplete"  },
    "children": ["2", "3"]
  },
  "2": {
    "type": "condition",
    "data": { "lhs": "var.user.tier", "operator": "eq", "rhs": "gold" },
    "children": ["4"]
  },
  "3": {
    "type": "condition",
    "data": { "lhs": "var.user.tier", "operator": "eq", "rhs": "silver" },
    "children": ["5"]
  },
  "4": {
    "type": "action",
    "data": {
      "type": "awardReward",
      "payload": { "rewardID": "ID-of-A"  }
    }
  },
  "5": {
    "type": "action",
    "data": {
      "type": "awardReward",
      "payload": { "rewardID": "ID-of-B"  }
    }
  }
}
Conversion to treatments
The question then arises, how do we execute this node tree as treatments? This requires a conversion process. We then developed the following algorithm for converting the node tree into equivalent treatments:
// convertToTreatments is the main function
func convertToTreatments(rootNode) -> []Treatment:
  output = []

  for each scenario in rootNode.scenarios:
    // traverse down each branch
    context = createConversionContext(scenario)
    for child in rootNode.children:
      treatments = convertHelper(context, child)
      output.append(treatments)

  return output

// convertHelper is a recursive helper function
func convertHelper(context, node) -> []Treatment:
  output = []
  f = getNodeConverterFunc(node.type)
  treatments, updatedContext = f(context, node)

  output.append(treatments)

  for child in rootNode.children:
    treatments = convertHelper(updatedContext, child)
    output.append(treatments)

  return output
The getNodeConverterFunc will return different handler functions according to the node type. Each handler function will either update the conversion context, create treatments, or both.
| Node type | Logic |
|---|---|
| condition | Add conditions into the context and return the updated context. |
| action | Return a treatment with the event type, condition from the context, and the action itself. |
| delay | Return a treatment with the event type, condition from the context, and a scheduleDelayedEvent action. |
| count | Return a treatment with the event type, condition from the context, and an incrementUserStats action. |
| count condition | Form a condition with the count key from the context, and return an updated context with the condition. |
It is important to note that treatments cannot always be reverted to their original node tree structure. This is because different node trees might be converted into the same set of treatments.
The following is an example where two different node trees setups correspond to the same set of treatments:
- Food order complete -> if gold user -> then award A
- Food order complete -> if silver user -> then award B
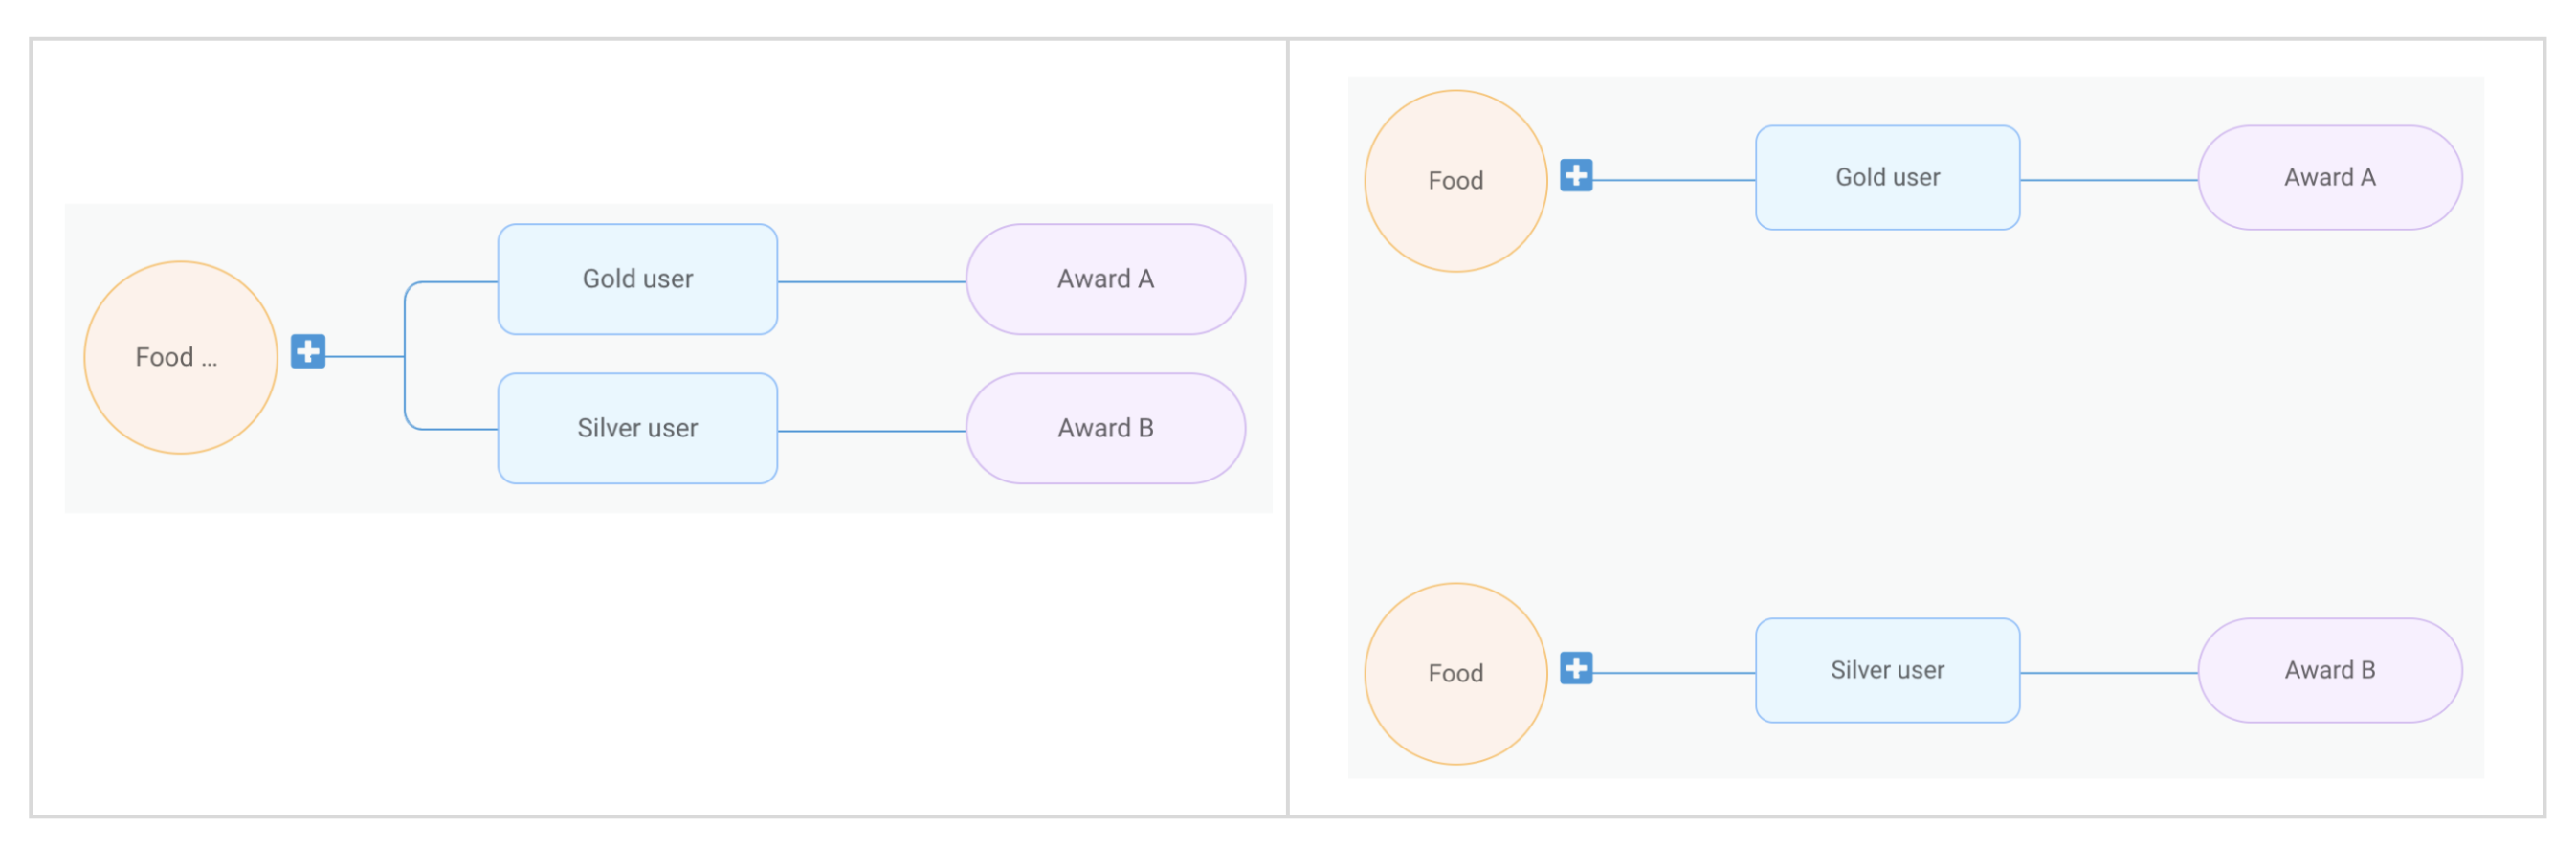
Therefore, we need to store both the campaign node tree JSON and treatments, along with the mapping between the nodes and the treatments. Campaigns are executed using treatments, but displayed using the node tree JSON.
How we handle campaign updates
There are instances where a marketing user updates a campaign after its creation. For such cases we need to identify:
- Which existing treatments should be removed.
- Which existing treatments should be updated.
- What new treatments should be added.
We can do this by using the node-treatment mapping information we stored. The following is the pseudocode for this process:
func howToUpdateTreatments(oldTreatments []Treatment, newTreatments []Treatment):
  treatmentsUpdate = map[int]Treatment // treatment ID -> updated treatment
  treatmentsRemove = []int // list of treatment IDs
  treatmentsAdd = []Treatment // list of new treatments to be created

  matchedOldTreamentIDs = set()

  for newTreatment in newTreatments:
    matched = false

    // see whether the nodes match any old treatment
    for oldTreatment in oldTreatments:
      // two treatments are considered matched if their linked node IDs are identical
      if isSame(oldTreatment.nodeIDs, newTreatment.nodeIDs):
        matched = true
        treatmentsUpdate[oldTreament.ID] = newTreatment
        matchedOldTreamentIDs.Add(oldTreatment.ID)
        break

    // if no match, that means it is a new treatment we need to create
    if not matched:
      treatmentsAdd.Append(newTreatment)

  // all the non-matched old treatments should be deleted
  for oldTreatment in oldTreatments:
    if not matchedOldTreamentIDs.contains(oldTreatment.ID):
      treatmentsRemove.Append(oldTreatment.ID)

  return treatmentsAdd, treatmentsUpdate, treatmentsRemove
For a visual illustration, let’s consider a campaign that initially resembles the one shown in figure 10. The node IDs are highlighted in red.
This campaign will generate two treatments.
| ID | Treatment | Linked node IDs |
|---|---|---|
| 1 | Event: food order complete Condition: gold user Action: award A |
1, 2, 3 |
| 2 | Event: food order complete Condition: silver user Action: award B |
1, 4, 5 |
After creation, the campaign creator updates the upper condition branch, deletes the lower branch, and creates a new branch. Note that after node deletion, the deleted node ID will not be reused.
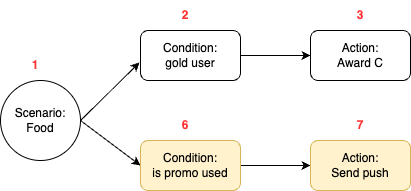
According to our logic in figure 11, the following update will be performed:
- Update action for treatment 1 to “award C”.
- Delete treatment 2
- Create a new treatment: food -> is promo used -> send push
Conclusion
This article reveals the workings of Trident, our bespoke marketing campaign platform. By exploring the core concept of a “treatment” and additional features like Counter, Delay and Limit, we illustrated the flexibility and sophistication of our system.
We’ve explained changes to the Trident UI that have made campaign creation more intuitive. Transforming campaign setups into executable treatments while preserving the visual representation ensures seamless campaign execution and adaptation.
Our devotion to improving Trident aims to empower our marketing team to design engaging and dynamic campaigns, ultimately providing excellent experiences to our users.
Join us
Grab is the leading superapp platform in Southeast Asia, providing everyday services that matter to consumers. More than just a ride-hailing and food delivery app, Grab offers a wide range of on-demand services in the region, including mobility, food, package and grocery delivery services, mobile payments, and financial services across 700 cities in eight countries.
Powered by technology and driven by heart, our mission is to drive Southeast Asia forward by creating economic empowerment for everyone. If this mission speaks to you, join our team today!
More NPM packages on Cloudflare Workers: Combining polyfills and native code to support Node.js APIs
Post Syndicated from James M Snell original https://blog.cloudflare.com/more-npm-packages-on-cloudflare-workers-combining-polyfills-and-native-code
Today, we are excited to announce a preview of improved Node.js compatibility for Workers and Pages. Broader compatibility lets you use more NPM packages and take advantage of the JavaScript ecosystem when writing your Workers.
Our newest version of Node.js compatibility combines the best features of our previous efforts. Cloudflare Workers have supported Node.js in some form for quite a while. We first announced polyfill support in 2021, and later built-in support for parts of the Node.js API that has expanded over time.
The latest changes make it even better:
-
You can use far more NPM packages on Workers.
-
You can use packages that do not use the
node: prefix to import Node.js APIs -
You can use more Node.js APIs on Workers, including most methods on
async_hooks,buffer,dns,os, andevents. Many more, such asfsorprocessare importable with mocked methods.
To give it a try, add the following flag to wrangler.toml, and deploy your Worker with Wrangler:
compatibility_flags = ["nodejs_compat_v2"]
Packages that could not be imported with nodejs_compat, even as a dependency of another package, will now load. This includes popular packages such as body-parser, jsonwebtoken, pg, got, passport, md5, mongodb, knex, mailparser, csv-stringify, cookie-signature, stream-slice, and many more.
This behavior will soon become the default for all Workers with the existing nodejs_compat compatibility flag enabled, and a compatibility date of 2024-09-23 or later. As you experiment with improved Node.js compatibility, share your feedback by opening an issue on GitHub.
Workerd is not Node.js
To understand the latest changes, let’s start with a brief overview of how the Workers runtime differs from Node.js.
Node.js was built primarily for services run directly on a host OS and pioneered server-side JavaScript. Because of this, it includes functionality necessary to interact with the host machine, such as process or fs, and a variety of utility modules, such as crypto.
Cloudflare Workers run on an open source JavaScript/Wasm runtime called workerd. While both Node.js and workerd are built on V8, workerd is designed to run untrusted code in shared processes, exposes bindings for interoperability with other Cloudflare services, including JavaScript-native RPC, and uses web-standard APIs whenever possible.
Cloudflare helped establish WinterCG, the Web-interoperable Runtimes Community Group to improve interoperability of JavaScript runtimes, both with each other and with the web platform. You can build many applications using only web-standard APIs, but what about when you want to import dependencies from NPM that rely on Node.js APIs?
For example, if you attempt to import pg, a PostgreSQL driver, without Node.js compatibility turned on…
import pg from 'pg'You will see the following error when you run wrangler dev to build your Worker:
✘ [ERROR] Could not resolve "events"
    ../node_modules/.pnpm/[email protected]/node_modules/pg-cloudflare/dist/index.js:1:29:
      1 │ import { EventEmitter } from 'events';
        ╵                              ~~~~~~~~
  The package "events" wasn't found on the file system but is built into node.
This happens because the pg package imports the events module from Node.js, which is not provided by workerd by default.
How can we enable this?
Our first approach – build-time polyfills
Polyfills are code that add functionality to a runtime that does not natively support it. They are often added to provide modern JavaScript functionality to older browsers, but can be used for server-side runtimes as well.
In 2022, we added functionality to Wrangler that injected polyfill implementations of some Node.js APIs into your Worker if you set node_compat = true in your wrangler.toml. For instance, the following code would work with this flag, but not without:
import EventEmitter from 'events';
import { inherits } from 'util';
These polyfills are essentially just additional JavaScript code added to your Worker by Wrangler when deploying the Worker. This behavior is enabled by @esbuild-plugins/node-globals-polyfill which in itself uses rollup-plugin-node-polyfills.
This allows you to import and use some NPM packages, such as pg. However, many modules cannot be polyfilled with fast enough code or cannot be polyfilled at all.
For instance, Buffer is a common Node.js API used to handle binary data. Polyfills exist for it, but JavaScript is often not optimized for the operations it performs under the hood, such as copy, concat, substring searches, or transcoding. While it is possible to implement in pure JavaScript, it could be far faster if the underlying runtime could use primitives from different languages. Similar limitations exist for other popular APIs such as Crypto, AsyncLocalStorage, and Stream.
Our second approach – native support for some Node.js APIs in the Workers runtime
In 2023, we started adding a subset of Node.js APIs directly to the Workers runtime. You can enable these APIs by adding the nodejs_compat compatibility flag to your Worker, but you cannot use polyfills with node_compat = true at the same time.
Also, when importing Node.js APIs, you must use the node: prefix:
import { Buffer } from 'node:buffer';Since these Node.js APIs are built directly into the Workers runtime, they can be written in C++, which allows them to be faster than JavaScript polyfills. APIs like AsyncLocalStorage, which cannot be polyfilled without safety or performance issues, can be provided natively.
Requiring the node: prefix made imports more explicit and aligns with modern Node.js conventions. Unfortunately, existing NPM packages may import modules without node:. For instance, revisiting the example above, if you import the popular package pg in a Worker with the nodejs_compat flag, you still see the following error:
✘ [ERROR] Could not resolve "events"
    ../node_modules/.pnpm/[email protected]/node_modules/pg-cloudflare/dist/index.js:1:29:
      1 │ import { EventEmitter } from 'events';
        ╵                              ~~~~~~~~
  The package "events" wasn't found on the file system but is built into node.
Many NPM packages still didn’t work in Workers, even if you enabled the nodejs_compat compatibility flag. You had to choose between a smaller set of performant APIs, exposed in a way that many NPM packages couldn’t access, or a larger set of incomplete and less performant APIs. And APIs like process that are exposed as globals in Node.js could still only be accessed by importing them as modules.
The new approach: a hybrid model
What if we could have the best of both worlds, and it just worked?
-
A subset of Node.js APIs implemented directly in the Workers Runtime
-
Polyfills for the majority of other Node.js APIs
-
No
node: prefix required -
One simple way to opt-in
Improved Node.js compatibility does just that.
Let’s take a look at two lines of code that look similar, but now act differently under the hood when nodejs_compat_v2 is enabled:
import { Buffer } from 'buffer';  // natively implemented
import { isIP } from 'net'; // polyfilled
The first line imports Buffer from a JavaScript module in workerd that is backed by C++ code. Various other Node.js modules are similarly implemented in a combination of Typescript and C++, including AsyncLocalStorage and Crypto. This allows for highly performant code that matches Node.js behavior.
Note that the node: prefix is not needed when importing buffer, but the code would also work with node:buffer.
The second line imports net which Wrangler automatically polyfills using a library called unenv. Polyfills and built-in runtime APIs now work together.
Previously, when you set node_compat = true, Wrangler added polyfills for every Node.js API that it was able to, even if neither your Worker nor its dependencies used that API. When you enable the nodejs_compat_v2 compatibility flag, Wrangler only adds polyfills for Node.js APIs that your Worker or its dependencies actually use. This results in small Worker sizes, even with polyfills.
For some Node.js APIs, there is not yet native support in the Workers runtime nor a polyfill implementation. In these cases, unenv “mocks” the interface. This means it adds the module and its methods to your Worker, but calling methods of the module will either do nothing or will throw an error with a message like:
[unenv] <method name> is not implemented yet!
This is more important than it might seem. Because if a Node.js API is “mocked”, NPM packages that depend on it can still be imported. Consider the following code:
// Package name: my-module

import fs from "fs";

export function foo(path) {
  const data = fs.readFileSync(path, 'utf8');
  return data;
}

export function bar() {
  return "baz";
}
import { bar } from "my-module"

bar(); // returns "baz"
foo(); // throws readFileSync is not implemented yet!
Previously, even with the existing nodejs_compat compatibility flag enabled, attempting to import my-module would fail at build time, because the fs module could not be resolved. Now, the fs module can be resolved, methods that do not rely on an unimplemented Node.js API work, and methods that do throw a more specific error – a runtime error that a specific Node.js API method is not yet supported, rather than a build-time error that the module could not be resolved.
This is what enables some packages to transition from “doesn’t even load on Workers” to, “loads, but with some unsupported methods”.
Still missing an API from Node.js? Module aliasing to the rescue
Let’s say you need an NPM package to work on Workers that relies on a Node.js API that isn’t yet implemented in the Workers runtime or as a polyfill in unenv. You can use module aliasing to implement just enough of that API to make things work.
For example, let’s say the NPM package you need to work calls fs.readFile. You can alias the fs module by adding the following to your Worker’s wrangler.toml:
[alias]

"fs" = "./fs-polyfill"
Then, in the fs-polyfill.js file, you can define your own implementation of any methods of the fs module:
export function readFile() {
  console.log("readFile was called");
  // ...
}
Now, the following code, which previously threw the error message “[unenv] readFile is not implemented yet!”, runs without errors:
import { readFile } from 'fs';

export default {
  async fetch(request, env, ctx) {
    readFile();
    return new Response('Hello World!');
  },
};
You can also use module aliasing to provide an implementation of an NPM package that does not work on Workers, even if you only rely on that NPM package indirectly, as a dependency of one of your Worker’s dependencies.
For example, some NPM packages, such as cross-fetch, depend on node-fetch, a package that provided a polyfill of the fetch() API before it was built into Node.js. The node-fetch package isn’t needed in Workers, because the fetch() API is provided by the Workers runtime. And node-fetch doesn’t work on Workers, because it relies on currently unsupported Node.js APIs from the http and https modules.
You can alias all imports of node-fetch to instead point directly to the fetch() API that is built into the Workers runtime using the popular nolyfill package:
[alias]

"node-fetch" = "./fetch-nolyfill"
All your replacement module needs to do in this case is to re-export the fetch API that is built into the Workers runtime:
export default fetch;Contributing back to unenv
Cloudflare is actively contributing to unenv. We think unenv is solving the problem of cross-runtime compatibility the right way — it adds only the necessary polyfills to your application, based on what APIs you use and what runtime you target. The project supports a variety of runtimes beyond workerd and is already used by other popular projects including Nuxt and Nitro. We want to thank Pooya Parsa and the unenv maintainers and encourage others in the ecosystem to adopt or contribute.
The path forward
Currently, you can enable improved Node.js compatibility by setting the nodejs_compat_v2 flag in wrangler.toml. We plan to make the new behavior the default when using the nodejs_compat flag on September 23rd. This will require updating your compatibility_date.
We are excited about the changes coming to Node.js compatibility, and encourage you to try it today. See the documentation on how to opt-in for your Workers, and please send feedback and report bugs by opening an issue. Doing so will help us identify any gaps in support and ensure that as much of the Node.js ecosystem as possible runs on Workers.
Answering your pinball questions – Williams Aztec Q&A
Post Syndicated from Technology Connextras original https://www.youtube.com/watch?v=P3Y4d2aHnNE
Redox OS 0.9.0
Post Syndicated from jzb original https://lwn.net/Articles/989517/
Version
0.9.0 of Redox OS,
an open-source, Unix-like operating system written in
Rust, has been released. Notable changes in this release include
performance and stability improvements, better management of physical
and virtual memory, bootloader improvements, and more. It also brings
support for RustPython, Perl 5, Simple HTTP Server, the addition of
several applications including GNU Nano, Helix, and the COSMIC
Files, Editor, and Terminal applications. See the changelog
section of the announcement for a full list of changes in the release.
Publish and enrich real-time financial data feeds using Amazon MSK and Amazon Managed Service for Apache Flink
Post Syndicated from Rana Dutt original https://aws.amazon.com/blogs/big-data/publish-and-enrich-real-time-financial-data-feeds-using-amazon-msk-and-amazon-managed-service-for-apache-flink/
Financial data feeds are real-time streams of stock quotes, commodity prices, options trades, or other real-time financial data. Companies involved with capital markets such as hedge funds, investment banks, and brokerages use these feeds to inform investment decisions.
Financial data feed providers are increasingly being asked by their customers to deliver the feed directly to them through the AWS Cloud. That’s because their customers already have infrastructure on AWS to store and process the data and want to consume it with minimal effort and latency. In addition, the AWS Cloud’s cost-effectiveness enables even small and mid-size companies to become financial data providers. They can deliver and monetize data feeds that they have enriched with their own valuable information.
An enriched data feed can combine data from multiple sources, including financial news feeds, to add information such as stock splits, corporate mergers, volume alerts, and moving average crossovers to a basic feed.
In this post, we demonstrate how you can publish an enriched real-time data feed on AWS using Amazon Managed Streaming for Kafka (Amazon MSK) and Amazon Managed Service for Apache Flink. You can apply this architecture pattern to various use cases within the capital markets industry; we discuss some of those use cases in this post.
Apache Kafka is a high-throughput, low-latency distributed event streaming platform. Financial exchanges such as Nasdaq and NYSE are increasingly turning to Kafka to deliver their data feeds because of its exceptional capabilities in handling high-volume, high-velocity data streams.
Amazon MSK is a fully managed service that makes it easy for you to build and run applications on AWS that use Kafka to process streaming data.
Apache Flink is an opensource distributed processing engine, offering powerful programming interfaces for both stream and batch processing, with first-class support for stateful processing, event time semantics, checkpointing, snapshots and rollback. Apache Flink supports multiple programming languages, Java, Python, Scala, SQL, and multiple APIs with different level of abstraction, which can be used interchangeably in the same application.
Amazon Managed Service for Apache Flink is a fully managed, serverless experience in running Apache Flink applications. Customers can easily build real time Flink applications using any of Flink’s languages and APIs.
In this post, we use a real-time stock quotes feed from financial data provider Alpaca and add an indicator when the price moves above or below a certain threshold. The code provided in the GitHub repo allows you to deploy the solution to your AWS account. This solution was built by AWS Partner NETSOL Technologies.
Solution overview
In this solution, we deploy an Apache Flink application that enriches the raw data feed, an MSK cluster that contains the messages streams for both the raw and enriched feeds, and an Amazon OpenSearch Service cluster that acts as a persistent data store for querying the data. In a separate virtual private cloud (VPC) that acts as the customer’s VPC, we also deploy an Amazon EC2 instance running a Kafka client that consumes the enriched data feed. The following diagram illustrates this architecture.

Figure 1 – Solution architecture
The following is a step-by-step breakdown of the solution:
- The EC2 instance in your VPC is running a Python application that fetches stock quotes from your data provider through an API. In this case, we use Alpaca’s API.
- The application sends these quotes using Kafka client library to your kafka topic on MSK cluster. The kafka topic stores the raw quotes.
- The Apache Flink application takes the Kafka message stream and enriches it by adding an indicator whenever the stock price rises or declines 5% or more from the previous business day’s closing price.
- The Apache Flink application then sends the enriched data to a separate Kafka topic on your MSK cluster.
- The Apache Flink application also sends the enriched data stream to Amazon OpenSearch using a Flink connector for OpenSearch. Amazon Opensearch stores the data, and OpenSearch Dashboards allows applications to query the data at any point in the future.
- Your customer is running a Kafka consumer application on an EC2 instance in a separate VPC in their own AWS account. This application uses AWS PrivateLink to consume the enriched data feed securely, in real time.
- All Kafka user names and passwords are encrypted and stored in AWS Secrets Manager. The SASL/SCRAM authentication protocol used here makes sure all data to and from the MSK cluster is encrypted in transit. Amazon MSK encrypts all data at rest in the MSK cluster by default.
The deployment process consists of the following high-level steps:
- Launch the Amazon MSK cluster, Apache Flink application, Amazon OpenSearch Service domain, and Kafka producer EC2 instance in the producer AWS account. This step usually completes within 45 minutes.
- Set up multi-VPC connectivity and SASL/SCRAM authentication for the MSK cluster. This step can take up to 30 minutes.
- Launch the VPC and Kafka consumer EC2 instance in the consumer account. This step takes about 10 minutes.
Prerequisites
To deploy this solution, complete the following prerequisite steps:
- Create an AWS account if you don’t already have one and log in. We refer to this as the producer account.
- Create an AWS Identity and Access Management (IAM) user with full admin permissions. For instructions, refer to Create an IAM user.
- Sign out and sign back in to the AWS Management Console as this IAM admin user.
- Create an EC2 key pair named my-ec2-keypair in the producer account. If you already have an EC2 key pair, you can skip this step.
- Follow the instructions in ALPACA_README to sign up for a free Basic account at Alpaca to get your Alpaca API key and secret key. Alpaca will provide the real-time stock quotes for our input data feed.
- Install the AWS Command Line Interface (AWS CLI) on your local development machine and create a profile for the admin user. For instructions, see Set up the AWS Command Line Interface (AWS CLI).
- Install the latest version of the AWS Cloud Development Kit (AWS CDK) globally:
Deploy the Amazon MSK cluster
These steps create a new provider VPC and launch the Amazon MSK cluster there. You also deploy the Apache Flink application and launch a new EC2 instance to run the application that fetches the raw stock quotes.
- On your development machine, clone the GitHub repo and install the Python packages:
- Set the following environment variables to specify your producer AWS account number and AWS Region:
- Run the following commands to create your
config.pyfile: - Run the following commands to create your
alpaca.conffile: - Edit the
alpaca.conffile and replaceyour_api_keyandyour_secret_keywith your Alpaca API key. - Bootstrap the environment for the producer account:
- Using your editor or integrated development environment (IDE), edit the
config.pyfile:- Update the
mskCrossAccountIdparameter with your AWS producer account number. - If you have an existing EC2 key pair, update the producerEc2KeyPairName parameter with the name of your key pair.
- Update the
- View the
dataFeedMsk/parameters.pyfile:- If you are deploying in a Region other than us-east-1, update the Availability Zone IDs
az1andaz2accordingly. For example, the Availability Zones forus-west-2wouldus-west-2aandus-west-2b. - Make sure that the
enableSaslScramClientAuth,enableClusterConfig, andenableClusterPolicyparameters in theparameters.pyfile are set to False.
- If you are deploying in a Region other than us-east-1, update the Availability Zone IDs
- Make sure you are in the directory where the
app1.pyfile is located. Then deploy as follows: - Check that you now have an Amazon Simple Storage Service (Amazon S3) bucket whose name starts with
awsblog-dev-artifactscontaining a folder with some Python scripts and the Apache Flink application JAR file.
Deploy multi-VPC connectivity and SASL/SCRAM
Complete the following steps to deploy multi-VPC connectivity and SASL/SCRAM authentication for the MSK cluster:
- Set the
enableSaslScramClientAuth,enableClusterConfig, andenableClusterPolicyparameters in theconfig.pyfile to True. - Make sure you’re in the directory where the
config.pyfile is located and deploy the multi-VPC connectivity and SASL/SCRAM authentication for the MSK cluster:
cdk deploy --all --app "python app1.py" --profile {your_profile_name}
This step can take up to 30 minutes.
- To check the results, navigate to your MSK cluster on the Amazon MSK console, and choose the Properties
You should see PrivateLink turned on, and SASL/SCRAM as the authentication type.

- Copy the MSK cluster ARN.
- Edit your
config.pyfile and enter the ARN as the value for themskClusterArnparameter, then save the updated file.
Deploy the data feed consumer
Complete the steps in this section to create an EC2 instance in a new consumer account to run the Kafka consumer application. The application will connect to the MSK cluster through PrivateLink and SASL/SCRAM.
- Navigate to Parameter Store, a capability of AWS Systems Manager, in your producer account.
- Copy the value of the blogAws-dev-mskConsumerPwd-ssmParamStore parameter and update the mskConsumerPwdParamStoreValue parameter in the config.py file.
- Check the value of the parameter named blogAws-dev-getAzIdsParamStore and make a note of these two values.
- Create another AWS account for the Kafka consumer if you don’t already have one, and log in.
- Create an IAM user with admin permissions.
- Log out and log back in to the console using this IAM admin user.
- Make sure you are in the same Region as the Region you used in the producer account. Then create a new EC2 key pair named, for example,
my-ec2-consumer-keypair, in this consumer account. - Update the value of consumerEc2KeyPairName in your
config.pyfile with the name of the key pair you just created. - Open the AWS Resource Access Manager (AWS RAM) console in your consumer account.
- Compare the Availability Zone IDs from the Systems Manager parameter store with the Availability Zone IDs shown on the AWS RAM console.
- Identify the corresponding Availability Zone names for the matching Availability Zone IDs.
- Open the parameters.py file in the dataFeedMsk folder and insert these Availability Zone names into the variables crossAccountAz1 and crossAccountAz2. For example, in Parameter Store, if the values are “use1-az4” and “use1-az6”, then, when you switch to the consumer account’s AWS RAM console and compare, you may find that these values correspond to the Availability Zone names “us-east-1a” and “us-east-1b”. In that case, you need to update the parameters.py file with these Availability Zone names by setting crossAccountAz1 to “us-east-1a” and crossAccountAz2 to “us-east-1b”.
- Set the following environment variables, specifying your consumer AWS account ID:
- Bootstrap the consumer account environment. You need to add specific policies to the AWS CDK role in this case.
You now need to grant the consumer account access to the MSK cluster.
- On the console, copy the consumer AWS account number to your clipboard.
- Sign out and sign back in to your producer AWS account.
- On the Amazon MSK console, navigate to your MSK cluster.
- Choose Properties and scroll down to Security settings.
- Choose Edit cluster policy and add the consumer account root to the Principal section as follows, then save the changes:
- Create the IAM role that needs to be attached to the EC2 consumer instance:
- Deploy the consumer account infrastructure, including the VPC, consumer EC2 instance, security groups, and connectivity to the MSK cluster:
Run the applications and view the data
Now that we have the infrastructure up, we can produce a raw stock quotes feed from the producer EC2 instance to the MSK cluster, enrich it using the Apache Flink application, and consume the enriched feed from the consumer application through PrivateLink. For this post, we use the Flink DataStream Java API for the stock data feed processing and enrichment. We also use Flink aggregations and windowing capabilities to identify insights in a certain time window.
Run the managed Flink application
Complete the following steps to run the managed Flink application:
- In your producer account, open the Amazon Managed Service for Apache Flink console and navigate to your application.
- To run the application, choose Run, select Run with latest snapshot, and choose Run.

- When the application changes to the Running state, choose Open Apache Flink dashboard.

You should see your application under Running Jobs.

Run the Kafka producer application
Complete the following steps to run the Kafka producer application:
- On the Amazon EC2 console, locate the IP address of the producer EC2 instance named
awsblog-dev-app-kafkaProducerEC2Instance. - Connect to the instance using SSH and run the following commands:
You need to start the script during market open hours. This will run the script that creates a connection to the Alpaca API. You should see lines of output showing that it is making the connection and subscribing to the given ticker symbols.
View the enriched data feed in OpenSearch Dashboards
Complete the following steps to create an index pattern to view the enriched data in your OpenSearch dashboard:
- To find the master user name for OpenSearch, open the
config.pyfile and locate the value assigned to the openSearchMasterUsername parameter. - Open Secrets Manager and click on awsblog-dev-app-openSearchSecrets secret to retrieve the password for OpenSearch.
- Navigate to your OpenSearch console and find the URL to your OpenSearch dashboard by clicking on the domain name for your OpenSearch cluster. Click on the URL and sign in using your master user name and password.
- In the OpenSearch navigation bar on the left, select Dashboards Management under the Management section.
- Choose Index patterns, then choose Create index pattern.
- Enter
amzn*in the Index pattern name field to match the AMZN ticker, then choose Next step.

- Select timestamp under Time field and choose Create index pattern.
- Choose Discover in the OpenSearch Dashboards navigation pane.
- With amzn selected on the index pattern dropdown, select the fields to view the enriched quotes data.

The indicator field has been added to the raw data by Amazon Managed Service for Apache Flink to indicate whether the current price direction is neutral, bullish, or bearish.

Run the Kafka consumer application
To run the consumer application to consume the data feed, you first need to get the multi-VPC brokers URL for the MSK cluster in the producer account.
- On the Amazon MSK console, navigate to your MSK cluster and choose View client information.
- Copy the value of the Private endpoint (multi-VPC).

- SSH to your consumer EC2 instance and run the following commands:

You should then see lines of output for the enriched data feed like the following:
In the output above, no significant changes are happening to the stock prices, so the indicator shows “Neutral”. The Flink application determines the appropriate sentiment based on the stock price movement.
Additional financial services use cases
In this post, we demonstrated how to build a solution that enriches a raw stock quotes feed and identifies stock movement patterns using Amazon MSK and Amazon Managed Service for Apache Flink. Amazon Managed Service for Apache Flink offers various features such as snapshot, checkpointing, and a recently launched Rollback API. These features allow you to build resilient real-time streaming applications.
You can apply this approach to a variety of other use cases in the capital markets domain. In this section, we discuss other cases in which you can use the same architectural patterns.
Real-time data visualization
Using real-time feeds to create charts of stocks is the most common use case for real-time market data in the cloud. You can ingest raw stock prices from data providers or exchanges into an MSK topic and use Amazon Managed Service for Apache Flink to display the high price, low price, and volume over a period of time. This is known as aggregates and is the foundation for displaying candlestick bar graphs. You can also use Flink to determine stock price ranges over time.

Stock implied volatility
Implied volatility (IV) is a measure of the market’s expectation of how much a stock’s price is likely to fluctuate in the future. IV is forward-looking and derived from the current market price of an option. It is also used to price new options contracts and is sometimes referred to as the stock market’s fear gauge because it tends to spike higher during market stress or uncertainty. With Amazon Managed Service for Apache Flink, you can consume data from a securities feed that will provide current stock prices and combine this with an options feed that provides contract values and strike prices to calculate the implied volatility.
Technical indicator engine
Technical indicators are used to analyze stock price and volume behavior, provide trading signals, and identify market opportunities, which can help in the decision-making process of trading. Although implied volatility is a technical indicator, there are many other indicators. There can be simple indicators such as “Simple Moving Average” that represent a measure of trend in a specific stock price based on the average of price over a period of time. There are also more complex indicators such as Relative Strength Index (RSI) that measures the momentum of a stock’s price movement. RSI is a mathematical formula that uses the exponential moving average of upward movements and downward movements.
Market alert engine
Graphs and technical indicators aren’t the only tools that you can use to make investment decisions. Alternative data sources are important, such as ticker symbol changes, stock splits, dividend payments, and others. Investors also act on recent news about the company, its competitors, employees, and other potential company-related information. You can use the compute capacity provided by Amazon Managed Service for Apache Flink to ingest, filter, transform, and correlate the different data sources to the stock prices and create an alert engine that can recommend investment actions based on these alternate data sources. Examples can range from invoking an action if dividend prices increase or decrease to using generative artificial intelligence (AI) to summarize several correlated news items from different sources into a single alert about an event.
Market surveillance
Market surveillance is the monitoring and investigation of unfair or illegal trading practices in the stock markets to maintain fair and orderly markets. Both private companies and government agencies conduct market surveillance to uphold rules and protect investors.
You can use Amazon Managed Service for Apache Flink streaming analytics as a powerful surveillance tool. Streaming analytics can detect even subtle instances of market manipulation in real time. By integrating market data feeds with external data sources, such as company merger announcements, news feeds, and social media, streaming analytics can quickly identify potential attempts at market manipulation. This allows regulators to be alerted in real time, enabling them to take prompt action even before the manipulation can fully unfold.
Markets risk management
In fast-paced capital markets, end-of-day risk measurement is insufficient. Firms need real-time risk monitoring to stay competitive. Financial institutions can use Amazon Managed Service for Apache Flink to compute intraday value-at-risk (VaR) in real time. By ingesting market data and portfolio changes, Amazon Managed Service for Apache Flink provides a low-latency, high-performance solution for continuous VaR calculations.
This allows financial institutions to proactively manage risk by quickly identifying and mitigating intraday exposures, rather than reacting to past events. The ability to stream risk analytics empowers firms to optimize portfolios and stay resilient in volatile markets.
Clean up
It’s always a good practice to clean up all the resources you created as part of this post to avoid any additional cost. To clean up your resources, complete the following steps:
- Delete the CloudFormation stacks from the consumer account.
- Delete the CloudFormation stacks from the provider account.
Conclusion
In this post, we showed you how to provide a real-time financial data feed that can be consumed by your customers using Amazon MSK and Amazon Managed Service for Apache Flink. We used Amazon Managed Service for Apache Flink to enrich a raw data feed and deliver it to Amazon OpenSearch. Using this solution as a template, you can aggregate multiple source feeds, use Flink to calculate in real time any technical indicator, display data and volatility, or create an alert engine. You can add value for your customers by inserting additional financial information within your feed in real time.
We hope you found this post helpful and encourage you to try out this solution to solve interesting financial industry challenges.
About the Authors
 Rana Dutt is a Principal Solutions Architect at Amazon Web Services. He has a background in architecting scalable software platforms for financial services, healthcare, and telecom companies, and is passionate about helping customers build on AWS.
 Amar Surjit is a Senior Solutions Architect at Amazon Web Services (AWS), where he specializes in data analytics and streaming services. He advises AWS customers on architectural best practices, helping them design reliable, secure, efficient, and cost-effective real-time analytics data systems. Amar works closely with customers to create innovative cloud-based solutions that address their unique business challenges and accelerate their transformation journeys.
 Diego Soares is a Principal Solutions Architect at AWS with over 20 years of experience in the IT industry. He has a background in infrastructure, security, and networking. Prior to joining AWS in 2021, Diego worked for Cisco, supporting financial services customers for over 15 years. He works with large financial institutions to help them achieve their business goals with AWS. Diego is passionate about how technology solves business challenges and provides beneficial outcomes by developing complex solution architectures.
CVE-2024-40766: Critical Improper Access Control Vulnerability Affecting SonicWall Devices
Post Syndicated from Rapid7 original https://blog.rapid7.com/2024/09/09/etr-cve-2024-40766-critical-improper-access-control-vulnerability-affecting-sonicwall-devices/

On August 22, 2024, security firm SonicWall published an advisory on CVE-2024-40766, a critical improper access control vulnerability affecting SonicOS, the operating system that runs on the company’s physical and virtual firewalls. While CVE-2024-40766 was not known to be exploited in the wild at the time it was initially disclosed, the SonicWall advisory was later updated to note that “this vulnerability is potentially being exploited in the wild.”
As of September 9, 2024, Rapid7 is aware of several recent incidents (both external and Rapid7-observed) in which SonicWall SSLVPN accounts were targeted or compromised, including by ransomware groups; evidence linking CVE-2024-40766 to these incidents is still circumstantial, but given adversary interest in the software in general, Rapid7 strongly recommends remediating on an emergency basis. Vulnerabilities like CVE-2024-40766 are frequently used for initial access to victim environments.
SonicWall’s advisory indicates CVE-2024-40766 is an improper access control vulnerability “in the SonicWall SonicOS management access and SSLVPN, potentially leading to unauthorized resource access and in specific conditions, causing the firewall to crash.” The vulnerability was added to the U.S. Cybersecurity and Infrastructure Security Agency’s (CISA) list of known exploited vulnerabilities (KEV) on September 9, 2024.
Mitigation guidance
Per the vendor advisory, CVE-2024-40766 affects SonicWall Gen 5 and Gen 6 devices, as well as Gen 7 devices running SonicOS 7.0.1-5035 and older versions.
Affected versions and platforms include:
- SOHO (Gen 5): 5.9.2.14-12o and older versions affected
- Gen6 Firewalls: 6.5.4.14-109n and older versions affected (see the advisory for a full list of affected devices)
- Gen7 Firewalls: SonicOS build version 7.0.1-5035 and older versions affected, but SonicWall recommends installing the latest firmware (see the advisory for a full list of affected devices)
SonicWall recommends restricting firewall management access to trusted sources and/or ensuring firewall WAN management is not accessible from the public internet. They similarly recommend that SSLVPN access is limited to trusted sources, and/or disabling SSLVPN access from the internet.
Rapid7 customers
Our InsightVM engineering team is investigating options for coverage of CVE-2024-40766. We will update this blog with further information no later than 10 AM ET on Tuesday, September 10.
Olympians on growth mindset and achieving success
Post Syndicated from Talks at Google original https://www.youtube.com/watch?v=5AuR1KiJk2Y
Supermicro ARS-111GL-NHR NVIDIA GH200 Grace Hopper 1U Server Review
Post Syndicated from Patrick Kennedy original https://www.servethehome.com/supermicro-ars-111gl-nhr-nvidia-gh200-grace-hopper-1u-server-review-arm/
We review the Supermicro ARS-111GL-NHR, a 1U air-cooled NVIDIA GH200 server, and show why Grace Hopper is super cool
The post Supermicro ARS-111GL-NHR NVIDIA GH200 Grace Hopper 1U Server Review appeared first on ServeTheHome.
Първо пътуване с електронен билет в Пловдив
Post Syndicated from Йовко Ламбрев original https://yovko.net/e-tickets-plovdiv/

Първата четвърт на 21-ви век почти отминава, но… вече и в Пловдив става възможно човек да си купи електронен билет за градския транспорт и да го използва. Проверено и потвърдено! Е, засега само по един маршрут – автобус 25.
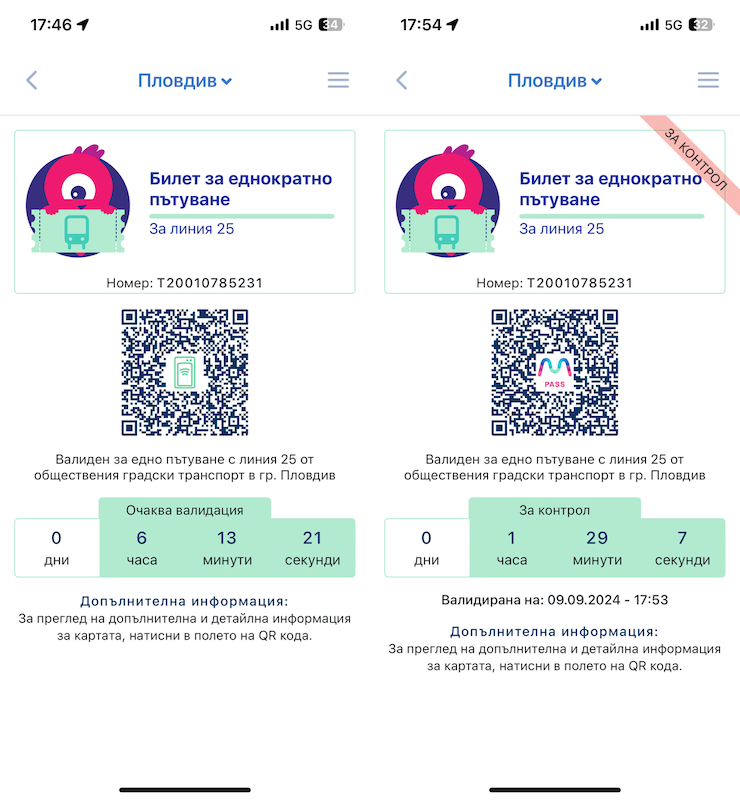
Приложението MPass е семпло, изглежда доста добре и е лесно за ползване, което е важно. След регистрацията си купих билет за еднократно пътуване срещу 1 лев, който платих с дебитна карта (Revolut) без никакви проблеми. Изненадата беше, че е валиден до края на денонощието (по-точно в рамките на работното време на градския транспорт), но в интерес на истината това е разписано зад бутон Детайли на всеки билет. Там пише също и че трябва да е купен поне минута, преди да се качим на автобуса и да се опитаме да го валидираме. Та не си купувайте билети oт днес за следващия ден – ще „изветреят“ преди да ги използвате.
На същото място пише, че валидирането на билета става като поставите смартфона си с QR-кода на билета на разстояние 10-15cm (около една педя) под валидатора. Това е полезно знание, защото QR-кода очевидно трябва да се сканира оптично, а на самия валидатор не личи къде му е сензора. Логично е да отдолу, но ако телефонът е поставен твърде близо, разчитането на QR-кода няма да се получи. Аз успях от втори опит, виждайки светлината на скенера върху дисплея на телефона си, която подсказа колко да го отдалеча и как да го поставя. Не бях прочел това предварително като купувах билета, а шофьорът, разбира се, не знаеше – само промърмори, че не разбирал от електронни неща. Всъщност не е и негова работа, но в първоначалния период на въвеждане на нова система е добре да има някоя табелка, стрелкичка, пиктограма… за всички ще е по-лесно. Но у нас продължава да е в сила методологията „Оправяй се!“.
След валидиране на устройството в автобуса, билетът се маркира с червена лентичка с надпис "За контрол".
И още една особеност. С един акаунт човек може да се логне на няколко устройства (вкл. в браузър) – аз си купих билета, докато бях в офиса на компютъра си, а не през мобилното приложение. Билетът обаче остава в браузъра/устройството, с което е купен, а аз възнамерявах да го ползвам от смартфона си (в автобуса). Няма драма, билетът може да се премести (макар и само веднъж!) – с допълнителна стъпка, която изисква човек да има достъп до електронната си поща, където да получи един код. Иначе и това е лесно и бързо.
С две думи, нещата засега изглеждат доста обещаващо. Остава всичко това да стане възможно и в останалите линии и автобуси от пловдивския градски транспорт. Да се появят и по-удобни варианти на билети. И разбира се, този град да се сдобие с обществен транспорт, на който да може да се разчита.
P. S. Възможно е и да не се ползва приложението, а да се плати директно с карта (през валидатора), но понеже не съм редовен ползвател на градския транспорт, а и автобус 25 не е сред тези, които ползвам обичайно… не съм тествал тази опция.
Първо пътуване с електронен билет в Пловдив
Post Syndicated from Йовко Ламбрев original https://yovko.net/e-tickets-plovdiv/
Първата четвърт на 21-ви век почти отминава, но… вече и в Пловдив става възможно човек да си купи електронен билет за градския транспорт и да го използва. Проверено и потвърдено! Е, засега само по един маршрут – автобус 25.
Приложението MPass е семпло, изглежда доста добре и е лесно за ползване, което е важно. След регистрацията си купих билет за еднократно пътуване срещу 1 лев, който платих с дебитна карта (Revolut) без никакви проблеми. Изненадата беше, че е валиден до края на денонощието (по-точно в рамките на работното време на градския транспорт), но в интерес на истината това е разписано зад бутон Детайли на всеки билет. Там пише също и че трябва да е купен поне минута, преди да се качим на автобуса и да се опитаме да го валидираме. Та не си купувайте билети за следващия ден – няма да можете да ги ползвате.
На същото място пише, че валидирането на билета става като поставите смартфона си, с QR-кода на билета на разстояние около една педя (10-15cm) под валидатора. Това е полезна информация, защото QR-кода очевидно следва да се сканира оптично, а на самия валидатор не личи къде му е сензора. Логично е да отдолу, но ако телефонът е поставен твърде близо, разчитането на QR-кода няма да се получи. Аз успях от втори опит, виждайки светлината на скенера върху дисплея на телефона си, която подсказа колко да го отдалеча и как да го поставя. Не бях прочел това предварително като купувах билета, а шофьорът, разбира се, не знаеше – само промърмори, че не разбирал от електронни неща. Всъщност не е и негова работа, но в първоначалния период на въвеждане на нова система е добре да има някоя табелка, стрелкичка, пиктограма… за всички ще е по-лесно. У нас продължава да е в сила методологията „Оправяй се!“.
След валидиране на устройството в автобуса билетът се маркира с червена лентичка с надпис "За контрол".
И още една особеност. С един акаунт човек може да се логне на няколко устройства (вкл. в браузър) – аз си купих билета, докато бях в офиса на компютъра си, а не през мобилното приложение. Билетът обаче остава в браузъра/устройството, с което е купен, а аз възнамерявах да го ползвам от смартфона си (в автобуса). Няма драма, билетът може да се премести (само веднъж!) – с допълнителна стъпка, която изисква човек да има достъп до електронната си поща, където да получи и използва един код. Иначе и това е лесно и бързо.
С две думи, нещата засега изглеждат доста обещаващо. Остава всичко това да стане възможно и във всички останали линии и автобуси от пловдивския градски транспорт. И разбира се, този град да се сдобие с обществен транспорт, на който да може да се разчита.
[$] Attracting and retaining Debian contributors
Post Syndicated from jake original https://lwn.net/Articles/987548/
Many projects struggle with attracting and retaining contributors; Debian
is no different in that regard. At DebConf24, Carlos Henrique Lima
Melara and Lucas Kanashiro gave a presentation about efforts that the
Brazilian Debian community has made to increase participation. Their ideas
and the lessons
learned can be applied more widely, both for other Debian communities and
for other projects.
AWS Weekly Roundup: Amazon DynamoDB, AWS AppSync, Storage Browser for Amazon S3, and more (September 9, 2024)
Post Syndicated from Danilo Poccia original https://aws.amazon.com/blogs/aws/aws-weekly-roundup-amazon-dynamodb-aws-appsync-storage-browser-for-amazon-s3-and-more-september-9-2024/
Last week, the latest AWS Heroes arrived! AWS Heroes are amazing technical experts who generously share their insights, best practices, and innovative solutions to help others.
The AWS GenAI Lofts are in full swing with San Francisco and São Paulo open now, and London, Paris, and Seoul coming in the next couple of months. Here’s an insider view from a workshop in San Francisco last week.

Last week’s launches
Here are the launches that got my attention.
Storage Browser for Amazon S3 (alpha release) – An open source Amplify UI React component that you can add to your web applications to provide your end users with a simple interface for data stored in S3. The component uses the new ListCallerAccessGrants API to list all S3 buckets, prefixes, and objects they can access, as defined by their S3 Access Grants.
AWS Network Load Balancer – Now supports a configurable TCP idle timeout. For more information, see this Networking & Content Devliery Blog post.
AWS Gateway Load Balancer – Also supports a configurable TCP idle timeout. More info is available in this blog post.
Amazon ECS – Now supports AWS Graviton-based Spot compute with AWS Fargate. This allows to run fault-tolerant Arm-based applications with up to 70% lower costs compared to on-demand.
Zone Groups for Availability Zones in AWS Regions – We are working on extending the Zone Group construct to Availability Zones (AZs) with a consistent naming format across all AWS Regions.
Amazon Managed Service for Apache Flink – Now supports Apache Flink 1.20. You can upgrade to benefit from bug fixes, performance improvements, and new functionality added by the Flink community.
AWS Glue – Now provides job queuing. If quotas or limits are insufficient to start a Glue job, AWS Glue will now automatically queue the job and wait for limits to free up.
Amazon DynamoDB – Now supports Attribute-Based Access Control (ABAC) for tables and indexes (limited preview). ABAC is an authorization strategy that defines access permissions based on tags attached to users, roles, and AWS resources. Read more in this Database Blog post.
Amazon Bedrock – Stability AI’s top text-to-image models (Stable Image Ultra, Stable Diffusion 3 Large, and Stable Image Core) are now available to generate high-quality visuals with speed and precision.
Amazon Bedrock Agents – Now supports Anthropic Claude 3.5 Sonnet, including Anthropic recommended tool use for function calling which can improve developer and end user experience.
Amazon Sagemaker Studio – You can now use Amazon EMR Serverless directly from your Studio Notebooks to interactively query, explore and visualize data, and run Apache Spark jobs.
Amazon SageMaker – Introducing sagemaker-core, a new Python SDK that provides an object-oriented interface for interacting with SageMaker resources such as TrainingJob, Model, and Endpoint resource classes.
AWS AppSync – Improves monitoring by including DEBUG and INFO logging levels for its GraphQL APIs. You now have more granular control over log verbosity to make it easier to troubleshoot your APIs while optimizing readability and costs.
Amazon WorkSpaces Pools – You can now bring your Windows 10 or 11 licenses and provide a consistent desktop experience when switching between on-premise and virtual desktops.
Amazon SES – A new enhanced onboarding experience to help discover and activate key SES features, including recommendations for optimal setup and the option to enable the Virtual Deliverability Manager to enhance email deliverability.
Amazon Redshift – Now the Amazon Redshift Data API support session reuse to retain the context of a session from one query execution to another, reducing connection setup latency on repeated queries to the same data warehouse.
For a full list of AWS announcements, be sure to keep an eye on the What’s New at AWS page.
Other AWS news
Here are some additional projects, blog posts, and news items that you might find interesting:
Amazon Q Developer Code Challenge – At the 2024 AWS Summit in Sydney, we put two teams (one using Amazon Q Developer, one not) in a battle of coding prowess, starting with basic math and string manipulation, up to including complex algorithms and intricate ciphers. Here are the results.

AWS named as a Leader in the first Gartner Magic Quadrant for AI Code Assistants – It’s great to see how new technologies make the whole software development lifecycle easier and increase developer productivity.
Build powerful RAG pipelines with LlamaIndex and Amazon Bedrock – A deep dive tutorial that covers simple and advanced use cases.
Evaluating prompts at scale with Prompt Management and Prompt Flows for Amazon Bedrock – To implement an automated prompt evaluation system to streamline prompt development and improve the overall quality of AI-generated content.
Amazon Redshift data ingestion options – An overview of the available ingestion methods and how they work for different use cases.

Upcoming AWS events
Check your calendars and sign up for upcoming AWS events:
AWS Summits – Join free online and in-person events that bring the cloud computing community together to connect, collaborate, and learn about AWS. AWS Summits for this year are coming to an end. There are two more left that you can still register: Toronto (September 11), and Ottawa (October 9).
AWS Community Days – Join community-led conferences that feature technical discussions, workshops, and hands-on labs driven by expert AWS users and industry leaders from around the world. Upcoming AWS Community Days are in the SF Bay Area (September 13), where our own Antje Barth is a keynote speaker, Argentina (September 14), Armenia (September 14), and DACH (in Munich on September 17).
AWS GenAI Lofts – Collaborative spaces and immersive experiences that showcase AWS’s cloud and AI expertise, while providing startups and developers with hands-on access to AI products and services, exclusive sessions with industry leaders, and valuable networking opportunities with investors and peers. Find a GenAI Loft location near you and don’t forget to register.
Browse all upcoming AWS-led in-person and virtual events here.
That’s all for this week. Check back next Monday for another Weekly Roundup!
— Danilo
This post is part of our Weekly Roundup series. Check back each week for a quick roundup of interesting news and announcements from AWS!
Multiple Vulnerabilities in Veeam Backup & Replication
Post Syndicated from Rapid7 original https://blog.rapid7.com/2024/09/09/etr-multiple-vulnerabilities-in-veeam-backup-and-replication/

On Wednesday, September 4, 2024, backup and recovery software provider Veeam released their September security bulletin disclosing various vulnerabilities in Veeam products. One of the higher-severity vulnerabilities included in the bulletin is CVE-2024-40711, a critical unauthenticated remote code execution issue affecting Veeam’s popular Backup & Replication solution. Notably, upon initial disclosure, the Veeam advisory listed the CVSS score for CVE-2024-40711 as “high” rather than “critical” — as of Monday, September 9, however, the CVSS score is listed as 9.8, which confirms exploitation is fully unauthenticated.
Five other CVEs were also disclosed in Backup & Replication, including several that allow users who have been assigned low-privileged roles to alter multi-factor authentication (MFA) settings, achieve remote code execution as a service account, and extract sensitive data (e.g., credentials, passwords). Other vulnerabilities in the bulletin affect additional Veeam offerings — notably, there are also two critical vulnerabilities in Veeam Service Provider Console.
While CVE-2024-40711 has received attention from security media and community members, we are not aware of any known exploitation as of Monday, September 9, 2024. Veeam Backup & Replication has a large deployment footprint, however, and several previous vulnerabilities affecting the software have been exploited in the wild, including by ransomware groups. It is possible that one or more of these vulnerabilities may be used to facilitate extortion attacks. More than 20% of Rapid7 incident response cases in 2024 so far have involved Veeam being accessed or exploited in some manner, typically once an adversary has already established a foothold in the target environment.
Mitigation guidance
The following vulnerabilities affect Veeam Backup & Replication 12.1.2.172 and all earlier version 12 builds, per the vendor advisory:
- CVE-2024-40711: Unauthenticated remote code execution (CVSS 9.8)
- CVE-2024-40713: Allows a low-privileged user to alter MFA settings and bypass MFA (CVSS 8.8)
- CVE-2024-40710: Covers multiple issues, per the advisory, including one that allows for remote code execution as the service account and enables extraction of saved credentials and passwords (CVSS 8.8)
- CVE-2024-39718: Allows a low-privileged user to remotely remove files on the system with permissions equivalent to those of the service account (CVSS 8.1)
- CVE-2024-40714: A vulnerability in TLS certificate validation allows an attacker on the same network to intercept sensitive credentials during restore operations (CVSS 8.3)
- CVE-2024-40712: A path traversal vulnerability allows an attacker with a low-privileged account and local access to the system to perform local privilege escalation (CVSS 7.8)
Veeam Backup & Replication customers should update to the latest version of the software (12.2 build 12.2.0.334) immediately, without waiting for a regular patch cycle to occur. Unsupported software versions were not tested but, per the vendor, should be considered vulnerable.
Other CVEs in Veeam’s September 4 security bulletin affect Veeam Agent for Linux, Veeam ONE, Veeam Service Provider Console, Veeam Backup for Nutanix AHV, and Veeam Backup for Oracle Linux Virtualization Manager and Red Hat Virtualization.
Rapid7 customers
InsightVM and Nexpose customers will be able to assess their exposure to the Veeam Backup & Replication CVEs listed in this blog with vulnerability checks expected to be available in today’s (Monday, September 9) content release.
Adams: Linux’s bedtime routine
Post Syndicated from corbet original https://lwn.net/Articles/989489/
Jacob Adams wanders into
the kernel’s hibernation code:
How does Linux move from an awake machine to a hibernating one? How
does it then manage to restore all state? These questions led me to
read way too much C in trying to figure out how this particular
hardware/software boundary is navigated.