Post Syndicated from Explosm.net original https://explosm.net/comics/how-tall-are-you
New Cyanide and Happiness Comic
Post Syndicated from Explosm.net original https://explosm.net/comics/how-tall-are-you
New Cyanide and Happiness Comic
Post Syndicated from Mathangi Ramesh original https://aws.amazon.com/blogs/security/cloud-infrastructure-entitlement-management-in-aws/
Customers use Amazon Web Services (AWS) to securely build, deploy, and scale their applications. As your organization grows, you want to streamline permissions management towards least privilege for your identities and resources. At AWS, we see two customer personas working towards least privilege permissions: security teams and developers. Security teams want to centrally inspect permissions across their organizations to identify and remediate access-related risks, such as excessive permissions, anomalous access to resources or compliance of identities. Developers want policy verification tools that help them set effective permissions and maintain least privilege as they build their applications.
Customers are increasingly turning to cloud infrastructure entitlement management (CIEM) solutions to guide their permissions management strategies. CIEM solutions are designed to identify, manage, and mitigate risks associated with access privileges granted to identities and resources in cloud environments. While the specific pillars of CIEM vary, four fundamental capabilities are widely recognized: rightsizing permissions, detecting anomalies, visualization, and compliance reporting. AWS provides these capabilities through services such as AWS Identity and Access Management (IAM) Access Analyzer, Amazon GuardDuty, Amazon Detective, AWS Audit Manager, and AWS Security Hub. I explore these services in this blog post.
Customers primarily explore CIEM solutions to rightsize their existing permissions by identifying and remediating identities with excessive permissions that pose potential security risks. In AWS, IAM Access Analyzer is a powerful tool designed to assist you in achieving this goal. IAM Access Analyzer guides you to set, verify, and refine permissions.
After IAM Access Analyzer is set up, it continuously monitors AWS Identity and Access Management (IAM) users and roles within your organization and offers granular visibility into overly permissive identities. This empowers your security team to centrally review and identify instances of unused access, enabling them to take proactive measures to refine access and mitigate risks.
While most CIEM solutions prioritize tools for security teams, it’s essential to also help developers make sure that their policies adhere to security best practices before deployment. IAM Access Analyzer provides developers with policy validation and custom policy checks to make sure their policies are functional and secure. Now, they can use policy recommendations to refine unused access, making sure that identities have only the permissions required for their intended functions.
Security teams use anomaly detection capabilities to identify unexpected events, observations, or activities that deviate from the baseline behavior of an identity. In AWS, Amazon GuardDuty supports anomaly detection in an identity’s usage patterns, such as unusual sign-in attempts, unauthorized access attempts, or suspicious API calls made using compromised credentials.
By using machine learning and threat intelligence, GuardDuty can establish baselines for normal behavior and flag deviations that might indicate potential threats or compromised identities. When establishing CIEM capabilities, your security team can use GuardDuty to identify threat and anomalous behavior pertaining to their identities.
With visualization, you have two goals. The first is to centrally inspect the security posture of identities, and the second is to comprehensively understand how identities are connected to various resources within your AWS environment. IAM Access Analyzer provides a dashboard to centrally review identities. The dashboard helps security teams gain visibility into the effective use of permissions at scale and identify top accounts that need attention. By reviewing the dashboard, you can pinpoint areas that need focus by analyzing accounts with the highest number of findings and the most commonly occurring issues such as unused roles.
Amazon Detective helps you to visually review individual identities in AWS. When GuardDuty identifies a threat, Detective generates a visual representation of identities and their relationships with resources, such as Amazon Elastic Compute Cloud (Amazon EC2) instances, Amazon Simple Storage Service (Amazon S3) buckets, or AWS Lambda functions. This graphical view provides a clear understanding of the access patterns associated with each identity. Detective visualizes access patterns, highlighting unusual or anomalous activities related to identities. This can include unauthorized access attempts, suspicious API calls, or unexpected resource interactions. You can depend on Detective to generate a visual representation of the relationship between identities and resources.
Security teams work with auditors to assess whether identities, resources, and permissions adhere to the organization’s compliance requirements. AWS Audit Manager automates evidence collection to help you meet compliance reporting and audit needs. These automated evidence packages include reporting on identities. Specifically, you can use Audit Manager to analyze IAM policies and roles to identify potential misconfigurations, excessive permissions, or deviations from best practices.
Audit Manager provides detailed compliance reports that highlight non-compliant identities or access controls, allowing your auditors and security teams to take corrective actions and support ongoing adherence to regulatory and organizational standards. In addition to monitoring and reporting, Audit Manager offers guidance to remediate certain types of non-compliant identities or access controls, reducing the burden on security teams and supporting timely resolution of identified issues.
While customers appreciate the diverse capabilities AWS offers across various services, they also seek a unified and consolidated view that brings together data from these different sources. AWS Security Hub addresses this need by providing a single pane of glass that enables you to gain a holistic understanding of your security posture. Security Hub acts as a centralized hub, consuming findings from multiple AWS services and presenting a comprehensive view of how identities are being managed and used across the organization.
CIEM solutions are designed to identify, manage, and mitigate risks associated with access privileges granted to identities and resources in cloud environments. The AWS services mentioned in this post can help you achieve your CIEM goals. If you want to explore CIEM capabilities in AWS, use the services mentioned in this post or see the following resources.
If you have feedback about this post, submit comments in the Comments section below. If you have questions about this post, contact AWS Support.
Post Syndicated from jzb original https://lwn.net/Articles/984502/
Markdown editors are a dime a dozen. Cheaper than that, actually,
since many of them are open‑source software. Despite the sheer number of
options, finding an editor that has all of the features that one might want can
be tricky. For some users, Zettlr
might the right tool. It is a What You See is What You
Mean (WYSIWYM) editor that stores its work locally as plain Markdown
files. The project is billed as a “one-stop publication
“, and is suitable for writing anything from blog posts to
workbench
academic papers, maintaining a personal journal, or keeping notes in a Zettlekasten. It
is simple to get started with, but rewards deeper exploration and
customization.
Post Syndicated from David Victoria original https://aws.amazon.com/blogs/big-data/organize-content-across-business-units-with-enterprise-wide-data-governance-using-amazon-datazone-domain-units-and-authorization-policies/
Amazon DataZone has announced a set of new data governance capabilities—domain units and authorization policies—that enable you to create business unit-level or team-level organization and manage policies according to your business needs. With the addition of domain units, users can organize, create, search, and find data assets and projects associated with business units or teams. With authorization policies, those domain unit users can set access policies for creating projects and glossaries, and using compute resources within Amazon DataZone.
As an Amazon DataZone administrator, you can now create domain units (such as Sales or Marketing) under the top-level domain and assign domain unit owners to further manage the data team’s structure. Amazon DataZone users can log in to the portal to browse and search the catalog by domain units, and subscribe to data produced by specific business units. Additionally, authorization policies can be configured for a domain unit permitting actions such as who can create projects, metadata forms, and glossaries within their domain units. Authorized portal users can then log in to the Amazon DataZone portal and create entities such as projects and create metadata forms using the authorized projects.
Amazon DataZone enables you to discover, access, share, and govern data at scale across organizational boundaries, reducing the undifferentiated heavy lifting of making data and analytics tools accessible to everyone in the organization. With Amazon DataZone, data users like data engineers, data scientists, and data analysts can share and access data across AWS accounts using a unified data portal, allowing them to discover, use, and collaborate on this data across their teams and organizations. Additionally, data owners and data stewards can make data discovery simpler by adding business context to data while balancing access governance to the data in the UI.
In this post, we discuss common approaches to structuring domain units, use cases that customers in the healthcare and life sciences (HCLS) industry encounter, and how to get started with the new domain units and authorization policies features from Amazon DataZone.
Domains are top-level entities that encompass multiple domain units as sub-entities, each with specific policies. Organizations can adopt different approaches when defining and structuring domains and domain units. Some strategies align these units with data domains, whereas others follow organizational structures or lines of business. In this section, we explore a few examples of domains, domain units, and how to organize data assets and products within these constructs.
Domain units can be built using the organizational structure, lines of businesses, or use cases. For example, HCLS organizations typically have a range of domains that encompass various aspects of their operations and services. Customers are using domains and domain units to improve searchability and findability of data assets within an organized tree-like structure, and enable individual organizational units to control their own authorization policies.
One of the core benefits of organizing entities as domain units is to enable search and self-service access across various domain units. The following are some common domain units within the HCLS sector:
The following are common domains and domain units that apply across industries:
For example, one of our customers, AWS Data Platform, uses Amazon DataZone to provide secure, trusted, convenient, and fast access to AWS business data.
“At AWS, our vision is to provide customers with reliable, secure, and self-service access to exabyte-scale data while ensuring data governance and compliance. With Amazon DataZone domain units, we are able to organize a vast and growing number of datasets to align with the organizational structure of the customers my teams serve internally. This simplifies data discovery and helps us organize business units’ data in a hierarchical manner for data-driven decision-making at AWS. Amazon DataZone authorization policies coupled with domain units enable a powerful yet flexible way of decentralizing data governance and helps tailor access policies to individual business units. With these features, we are able to reduce the undifferentiated heavy lift while building and managing data products.”
– Arnaud Mauvais, Director of Software Development at AWS.
The term data domain is crucial within the realm of data governance. It signifies a distinct field or classification of data that an organization oversees and regulates. Data domains form a foundational pillar in data governance frameworks. The concept of data domains plays a pivotal role in data governance, empowering organizations to systematically structure, administer, and harness their data assets. This strategic approach aligns data resources with business goals, fostering informed decision-making processes.
You can either define each data domain as a top-level domain or define a top-level data domain (for example, Organization) with several child domain units, such as:
Amazon DataZone domain units provide you with a robust and flexible data governance solution tailored to your organizational structure. These domain units empower individual business lines or teams to establish their own authorization policies, enabling self-service governance over critical actions such as publishing data assets and utilizing compute resources within Amazon DataZone. The authorization policies enabled by domain units allow you to grant granular access rights to users and groups, empowering them to manage domain units, project memberships, and creation of content such as projects, metadata forms, glossaries and custom asset types.
Domain governance authorization policies help organizations maintain data privacy, confidentiality, and integrity by controlling and limiting access to sensitive or critical data. They also support data-driven decision-making by making sure authorized users have appropriate access to the information they need to perform their duties. Similarly, authorization policies can help organizations govern the management of organizational domains, collaboration, and metadata. These policies can help define roles like data governance owner, data product owners, and data stewards.
Additionally, these policies facilitate metadata management, glossary administration, and domain ownership, so data governance practices are aligned with the specific needs and requirements of each business line or team. By using domain units and their associated authorization policies, organizations can decentralize data governance responsibilities while maintaining a consistent and controlled approach to data asset and metadata management. This distributed governance model promotes ownership and accountability within individual business lines, fostering a culture of data stewardship and enabling more agile and responsive data management practices.
Amazon DataZone domain units help customers in various industries securely and efficiently govern their data, collaborate on important data management initiatives, and help in complying with relevant regulations. These capabilities are particularly valuable for customers in industries with strict data privacy and security requirements, such as HCLS, financial services, and the public sector. Amazon DataZone domain units enable you to maintain control over your data while facilitating seamless collaboration and helping you adhere to regulations like Health Insurance Portability and Accountability Act (HIPAA), General Data Protection Regulation (GDPR), and others specific to your industry.
The following are key benefits of Amazon DataZone domain units for HCLS customers:
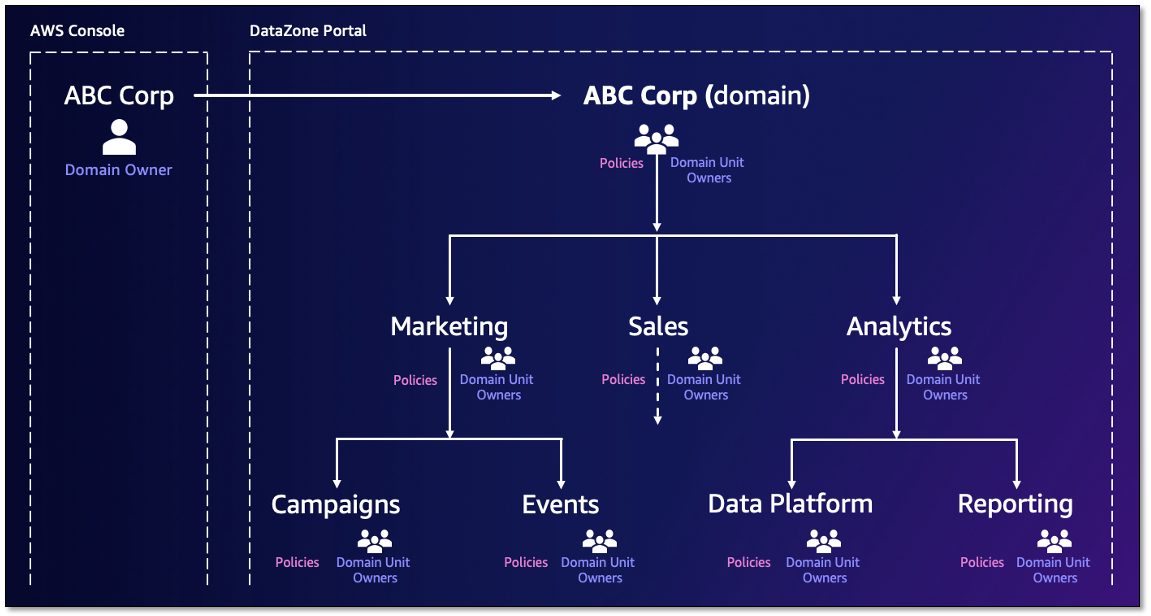
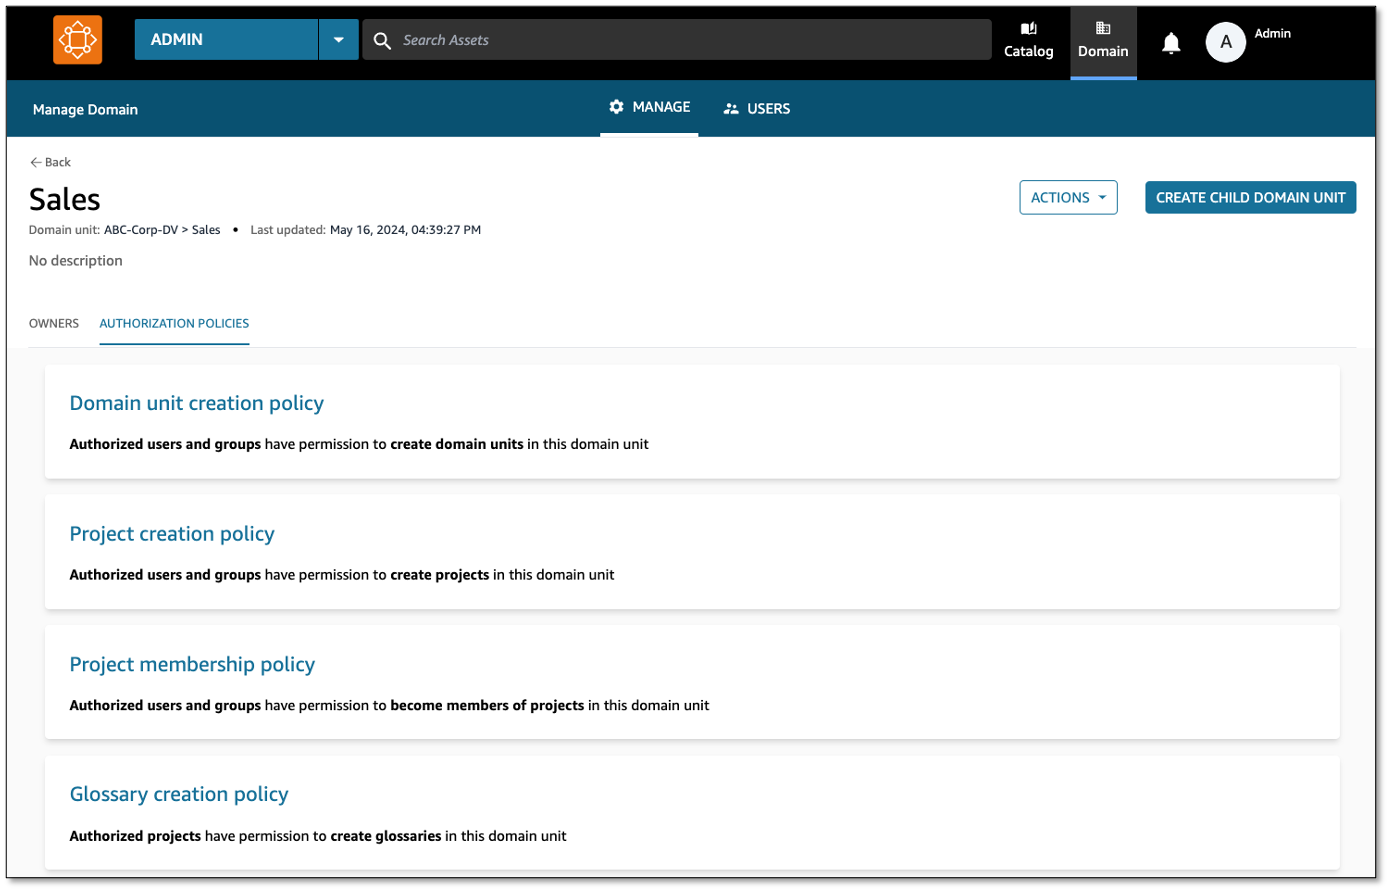
On the AWS Management Console, the administrator (AWS account user) creates the Amazon DataZone domain. As the creator of the domain, they can choose to add other single sign-on (SSO) and AWS Identity and Access Management (IAM) users as owners to manage the domain. Under the domain, domain units (such as Sales, Marketing, and Finance) can be created to reflect a hierarchy that aligns with the organization’s data ecosystem. Ownership of these domain units can be assigned to business leaders, who may expand a hierarchy representing their data teams and later set policies that enable users and projects to perform specific actions. With the domain structure in place, you can organize your assets under appropriate domain units. The organization of assets to domain units starts with projects being assigned to a domain unit at time of creation and assets then being cataloged within the project. Catalog consumers then browse the domain hierarchy to find assets related to specific business functions. They can also search for assets using a domain unit as a search facet.
Domain units set the foundation for how authorization policies permit users to perform actions in Amazon DataZone, such as who can create and join projects. Amazon DataZone creates a set of managed authorization policies for every domain unit, and domain unit owners create grants within a policy to users and projects.
There are two Amazon DataZone entities that have policies created on them. The first is a domain unit where the owners can decide who may perform actions such as creating domains, projects, joining projects, creating metadata forms, and so on. The policies have an option to cascade the grant down through child domain units. These policies are managed through the Amazon DataZone portal, and their grants can be applied to two principal types:
The second Amazon DataZone entity is a blueprint (defines the tools and services for Amazon DataZone environments), where a data platform user (AWS account user) who owns the Amazon DataZone blueprint can decide which projects use their resources through environment profile creation on the Amazon DataZone portal. There are two approaches to specify which projects can use the blueprint to create an environment profile:
These policies can be managed through the console and Amazon DataZone portal.
The following figure is an example domain structure for the ABC Corp domain. Domain units are created under the ABC Corp domain with domain unit owners assigned. Authorization policies are applied for each domain unit and dictate the actions users and projects can perform.
For more information about Amazon DataZone components, refer to Amazon DataZone terminology and concepts.
In the following sections, we walk through the steps to get started with the data management governance capabilities in Amazon DataZone.
With Amazon DataZone, administrators log in to the console and create an Amazon DataZone domain. Additional domain unit owners can be added to help manage the domain. For more information, refer to Managing Amazon DataZone domains and user access.
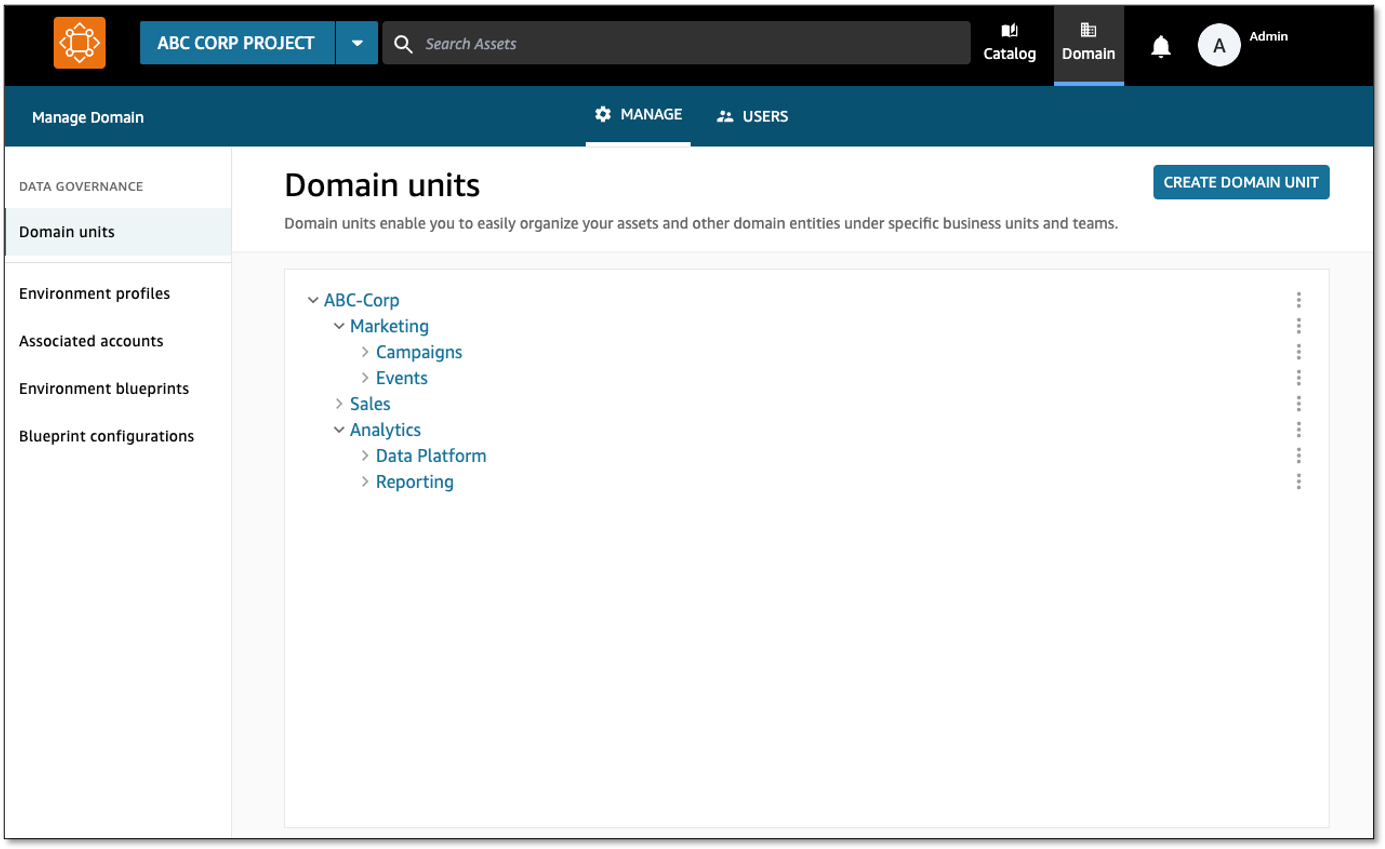
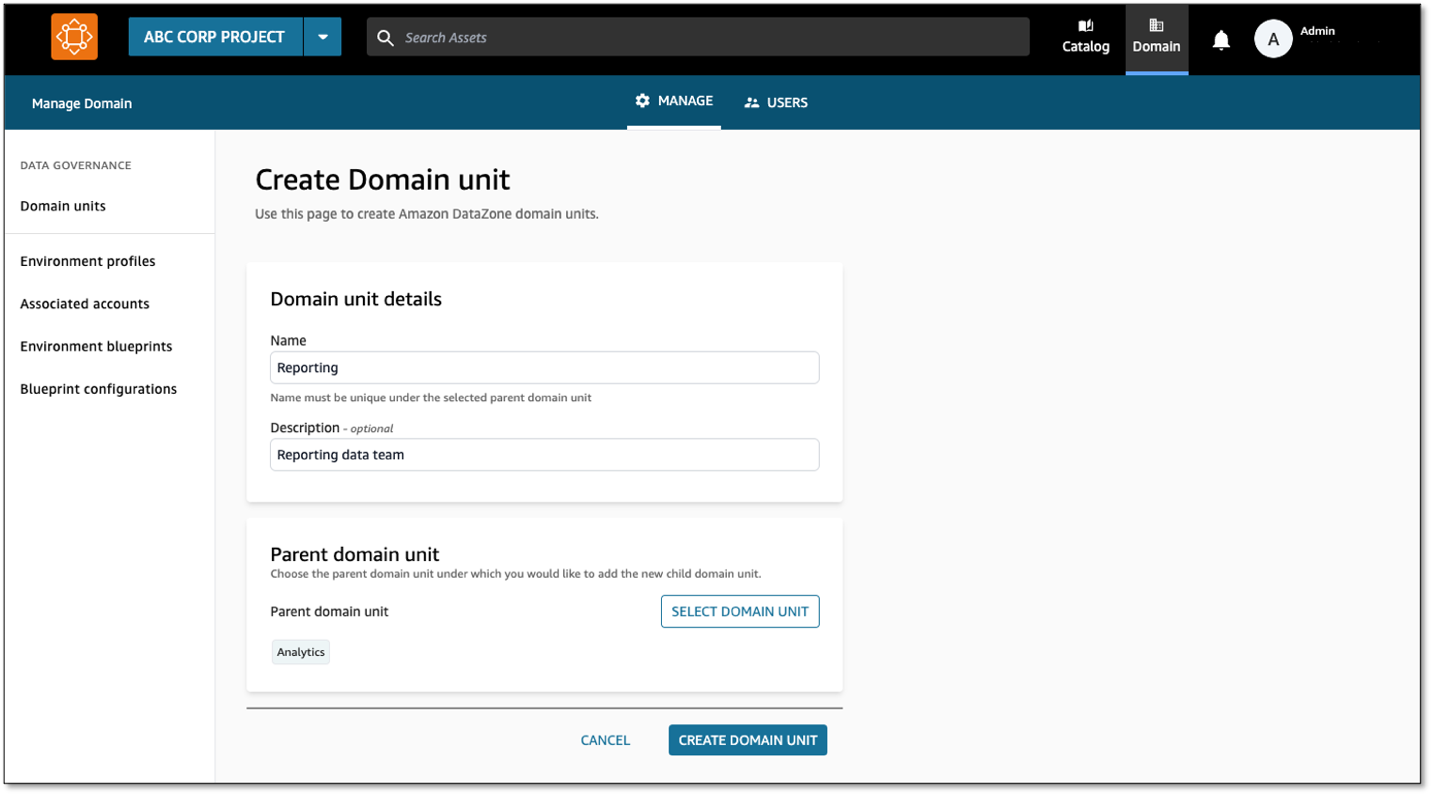
To create a domain unit, complete the following steps:
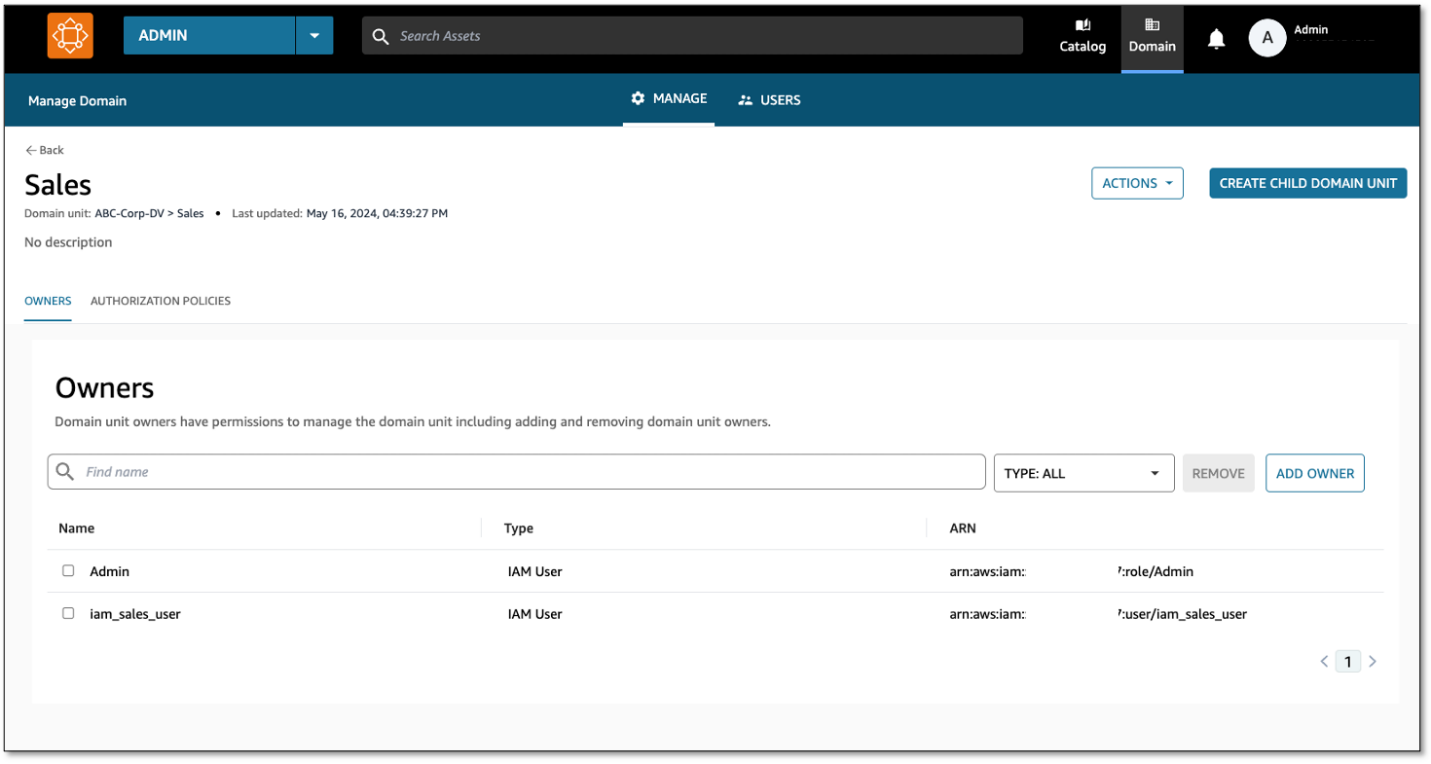
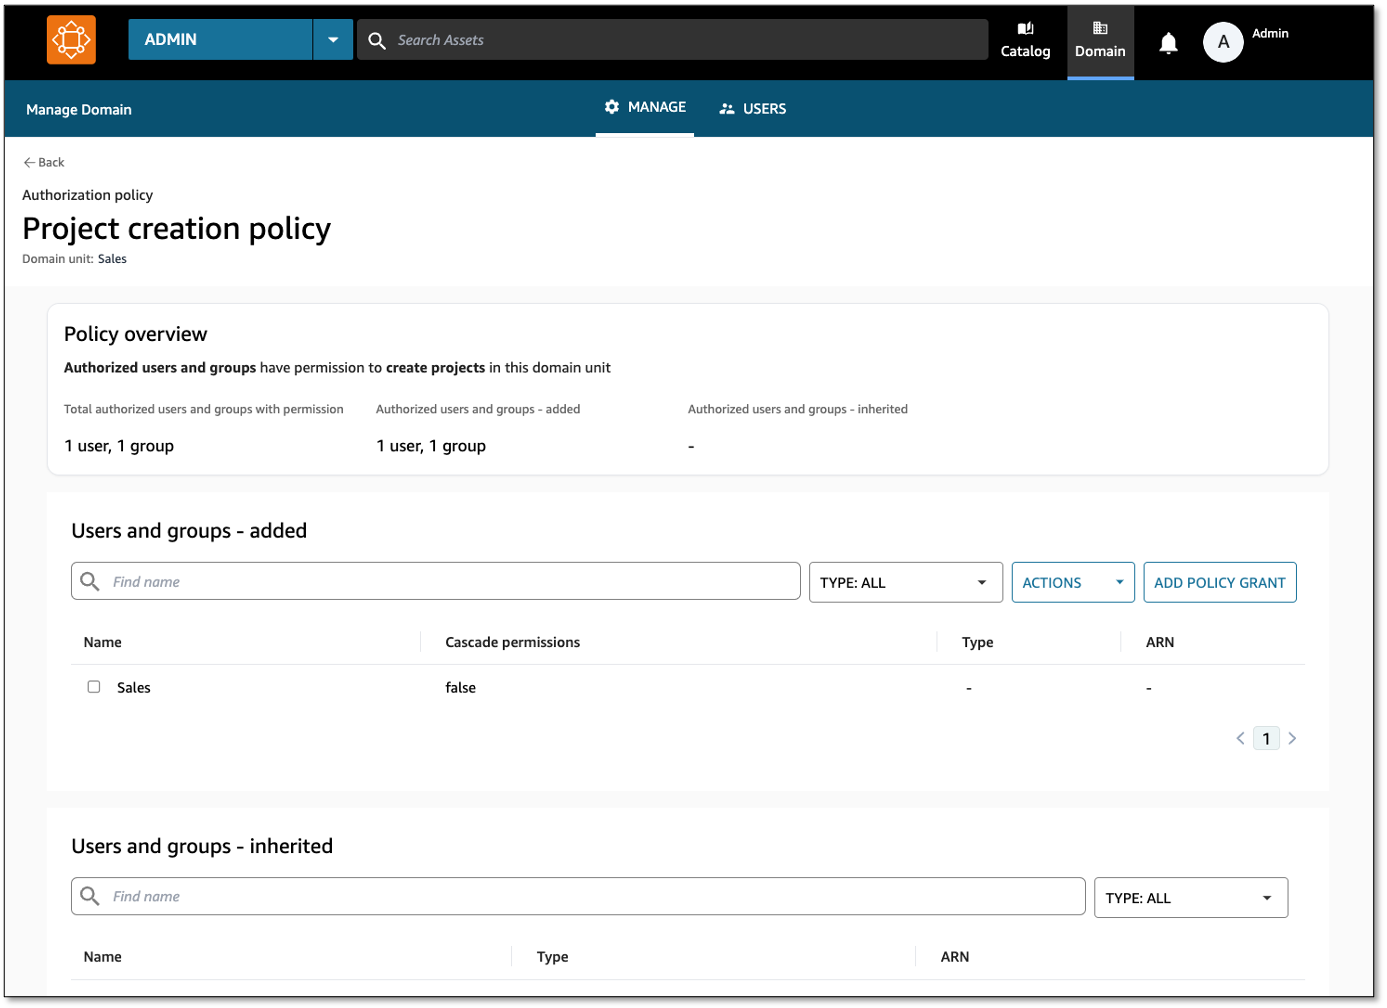
Amazon DataZone managed authorization policies are available for every domain unit, and domain unit owners can grant access through that policy to users and projects. Policies are either user-based (granted to users) or project-based (granted to projects).
With this, a Sales team member can log in to the data portal and create projects under the Sales domain.
In this post, we discussed common approaches to structuring domain units, use cases that customers in the HCLS industry encounter, and how to get started with the new domain units and authorization policies features from Amazon DataZone.
Domain units provide clean separation between data areas, making the discoverability of data efficient for users. Authorization policies, in combination with domain units, provide the governance layer controlling access to the data and provide control over how the data is cataloged. Together, Amazon DataZone domain units and authorization policies make organization and governance possible across your data.
Amazon DataZone domain units and authorization policies are available in all AWS Regions where Amazon DataZone is available. To learn more, refer to Working with domain units.
 David Victoria is a Senior Technical Product Manager with Amazon DataZone at AWS. He focuses on improving administration and governance capabilities needed for customers to support their analytics systems. He is passionate about helping customers realize the most value from their data in a secure, governed manner. Outside of work, he enjoys hiking, traveling, and making his newborn baby laugh.
 Nora O Sullivan is a Senior Solutions Architect at AWS. She focuses on helping HCLS customers choose the right AWS services for their data and analytics needs so they can derive value from their data. Outside of work, she enjoys golfing and discovering new wines and authors.
 Navneet Srivastava, a Principal Specialist and Analytics Strategy Leader, develops strategic plans for building an end-to-end analytical strategy for large biopharma, healthcare, and life sciences organizations. Navneet is responsible for helping life sciences organizations and healthcare companies deploy data governance and analytical applications, electronic medical records, devices, and AI/ML-based applications while educating customers about how to build secure, scalable, and cost-effective AWS solutions. His expertise spans across data analytics, data governance, AI, ML, big data, and healthcare-related technologies.
Post Syndicated from Channy Yun (윤석찬) original https://aws.amazon.com/blogs/aws/how-aws-powered-prime-day-2024-for-record-breaking-sales/
The last Amazon Prime Day 2024 (July 17-18) was Amazon’s biggest Prime Day shopping event ever, with record sales and more items sold during the two-day event than any previous Prime Day event. Prime members shopped for millions of deals and saved billions across more than 35 categories globally.
I live in South Korea, but luckily I was staying in Seattle to attend the AWS Heroes Summit during Prime Day 2024. I signed up for a Prime membership and used Rufus, my new AI-powered conversational shopping assistant, to search for items quickly and easily. Prime members in the U.S. like me chose to consolidate their deliveries on millions of orders during Prime Day, saving an estimated 10 million trips. This consolidation results in lower carbon emissions on average.

We know from Jeff’s annual blog post that AWS runs the Amazon website and mobile app that makes these short-term, large scale global events feasible. (check out his 2016, 2017, 2019, 2020, 2021, 2022, and 2023 posts for a look back). Today I want to share top numbers from AWS that made my amazing shopping experience possible.
Prime Day 2024 – all the numbers
Here are some of the most interesting and/or mind-blowing metrics:
Amazon EC2 – Since many of Amazon.com services such as Rufus and Search use AWS artificial intelligence (AI) chips under the hood, Amazon deployed a cluster of over 80,000 Inferentia and Trainium chips for Prime Day. During Prime Day 2024, Amazon used over 250K AWS Graviton chips to power more than 5,800 distinct Amazon.com services (double that of 2023).
Amazon EBS – In support of Prime Day, Amazon provisioned 264 PiB of Amazon EBS storage in 2024, a 62 percent increase compared to 2023. When compared to the day before Prime Day 2024, Amazon.com performance on Amazon EBS jumped by 5.6 trillion read/write I/O operations during the event, or an increase of 64 percent compared to Prime Day 2023. Also, when compared to the day before Prime Day 2024, Amazon.com transferred an incremental 444 petabytes of data during the event, or an increase of 81 percent compared to Prime Day 2023.

Amazon Aurora – On Prime Day, 6,311 database instances running the PostgreSQL-compatible and MySQL-compatible editions of Amazon Aurora processed more than 376 billion transactions, stored 2,978 terabytes of data, and transferred 913 terabytes of data.
Amazon DynamoDB – DynamoDB powers multiple high-traffic Amazon properties and systems including Alexa, the Amazon.com sites, and all Amazon fulfillment centers. Over the course of Prime Day, these sources made tens of trillions of calls to the DynamoDB API. DynamoDB maintained high availability while delivering single-digit millisecond responses and peaking at 146 million requests per second.
Amazon ElastiCache – ElastiCache served more than quadrillion requests on a single day with a peak of over 1 trillion requests per minute.
Amazon QuickSight – Over the course of Prime Day 2024, one Amazon QuickSight dashboard used by Prime Day teams saw 107K unique hits, 1300+ unique visitors, and delivered over 1.6M queries.
Amazon SageMaker – SageMaker processed more than 145B inference requests during Prime Day.
Amazon Simple Email Service (Amazon SES) – SES sent 30 percent more emails for Amazon.com during Prime Day 2024 vs 2023, delivering 99.23 percent of those emails to customers.
Amazon GuardDuty – During Prime Day 2024, Amazon GuardDuty monitored nearly 6 trillion log events per hour, a 31.9% increase from the previous year’s Prime Day.
AWS CloudTrail – CloudTrail processed over 976 billion events in support of Prime Day 2024.
Amazon CloudFront – CloudFront handled a peak load of over 500 million HTTP requests per minute, for a total of over 1.3 trillion HTTP requests during Prime Day 2024, a 30 percent increase in total requests compared to Prime Day 2023.
Prepare to Scale
As Jeff noted in every year, rigorous preparation is key to the success of Prime Day and our other large-scale events. For example, 733 AWS Fault Injection Service experiments were run to test resilience and ensure Amazon.com remains highly available on Prime Day.
If you are preparing for a similar business-critical events, product launches, and migrations, I strongly recommend that you take advantage of newly-branded AWS Countdown, a support program designed for your project lifecycle to assess operational readiness, identify and mitigate risks, and plan capacity, using proven playbooks developed by AWS experts. For example, with additional help from AWS Countdown, Legal Zoom successfully migrated 450 servers with minimal issues and continues to leverage AWS Countdown Premium to streamline and expedite the launch of SaaS applications.
We look forward to seeing what other records will be broken next year!
Post Syndicated from Seun Akinyosoye original https://aws.amazon.com/blogs/big-data/use-aws-glue-to-streamline-sftp-data-processing/
In today’s data-driven world, seamless integration and transformation of data across diverse sources into actionable insights is paramount. AWS Glue is a serverless data integration service that helps analytics users to discover, prepare, move, and integrate data from multiple sources for analytics, machine learning (ML), and application development. With AWS Glue, you can discover and connect to hundreds of diverse data sources and manage your data in a centralized data catalog. It enables you to visually create, run, and monitor extract, transform, and load (ETL) pipelines to load data into your data lakes.
In this blog post, we explore how to use the SFTP Connector for AWS Glue from the AWS Marketplace to efficiently process data from Secure File Transfer Protocol (SFTP) servers into Amazon Simple Storage Service (Amazon S3), further empowering your data analytics and insights.
The SFTP connector for AWS Glue simplifies the process of connecting AWS Glue jobs to extract data from SFTP storage and to load data into SFTP storage. This connector provides comprehensive access to SFTP storage, facilitating cloud ETL processes for operational reporting, backup and disaster recovery, data governance, and more.
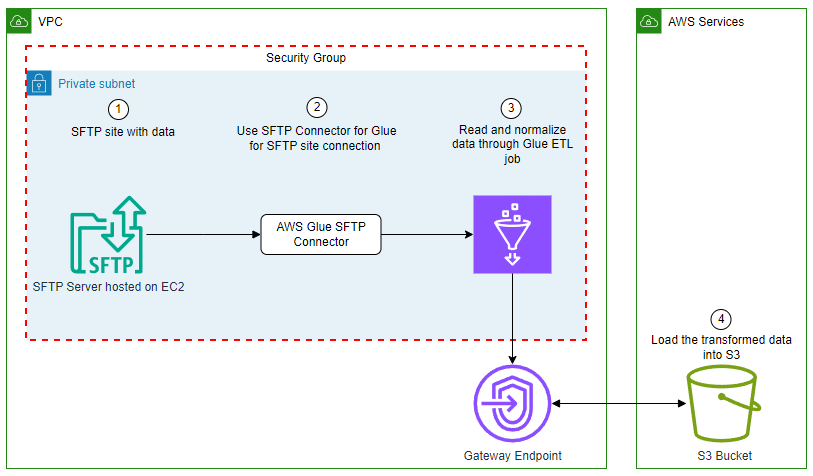
In this example, you use AWS Glue Studio to connect to an SFTP server, then enrich that data and upload it to Amazon S3. The SFTP connector is used to manage the connection to the SFTP server. You will load the event data from the SFTP site, join it to the venue data stored on Amazon S3, apply transformations, and store the data in Amazon S3. The event and venue files are from the TICKIT dataset.
The TICKIT dataset tracks sales activity for the fictional TICKIT website, where users buy and sell tickets online for sporting events, shows, and concerts. In this dataset, analysts can identify ticket movement over time, success rates for sellers, and best-selling events, venues, and seasons.
For this example, you use AWS Glue Studio to develop a visual ETL pipeline. This pipeline will read data from an SFTP server, perform transformations, and then load the transformed data into Amazon S3. The following diagram illustrates this architecture.
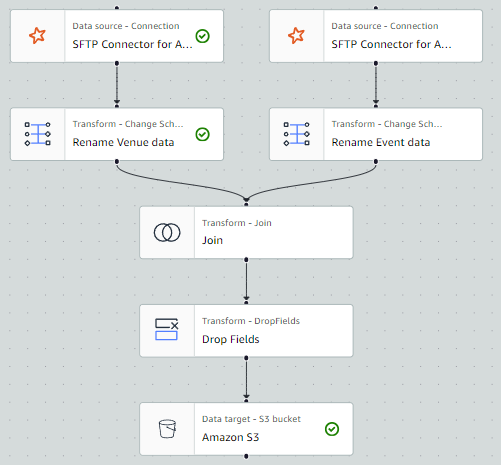
By the end of this post, your visual ETL job will resemble the following screenshot.
For this solution, you need the following:
tickit-use1-<accountnumber>.Load the allevents_pipe.txt file and venue_pipe.txt file from the TICKIT dataset to your SFTP server.
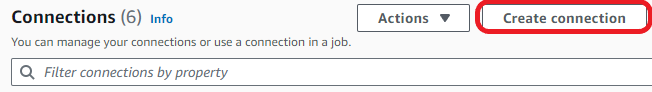
An AWS Glue connection is a Data Catalog object that stores connection information, such as URI strings and location to credentials that are stored in a Secrets Manager secret.
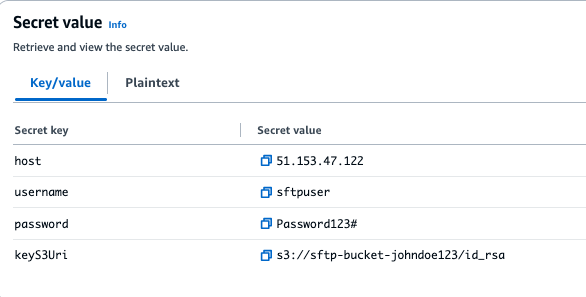
To store the SFTP server username and password in Secrets Manager, complete the following steps:
153.47.122) as the Secret value, then choose Add row.Note: Secret Value is the full S3 path where the SFTP server key file is stored. For example:s3://sftp-bucket-johndoe123/id_rsa.
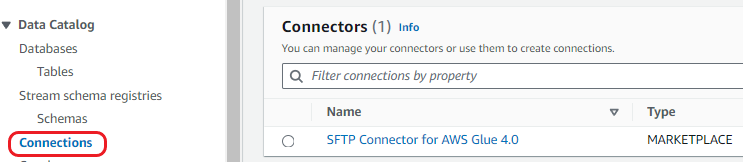
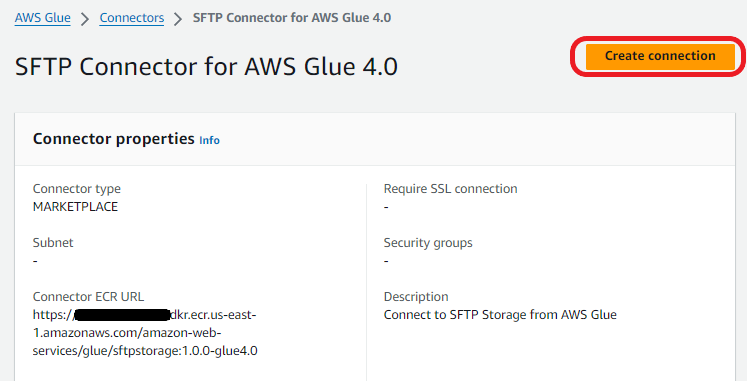
Complete the following steps to create your connection to the SFTP server.
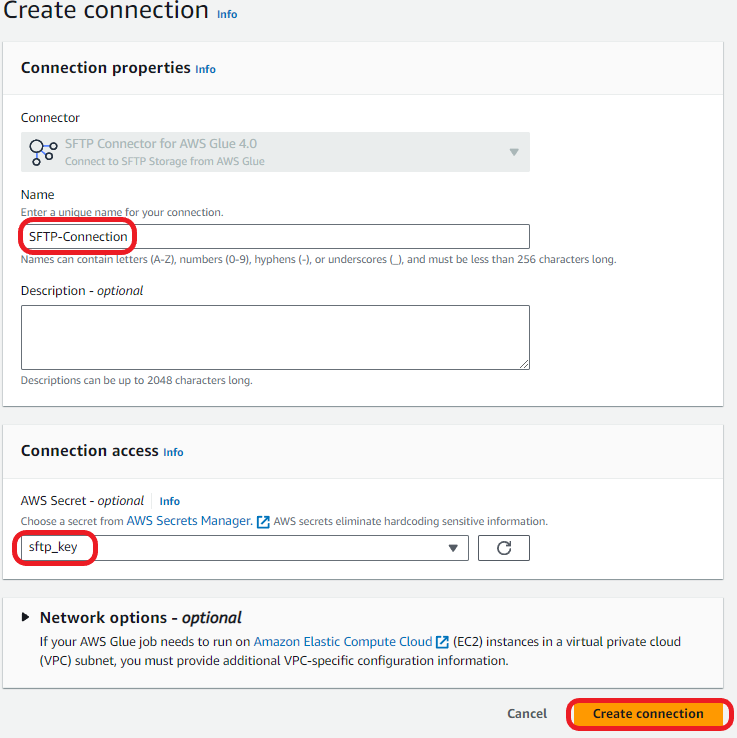
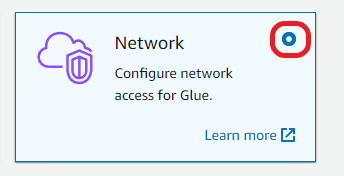
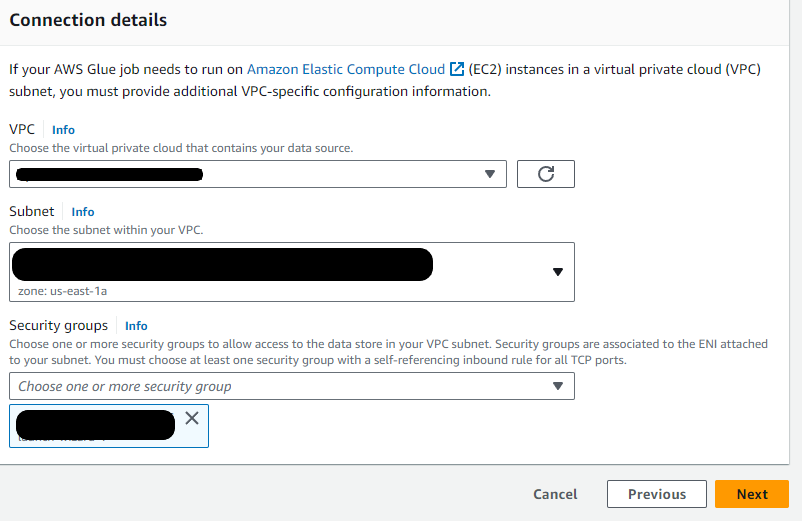
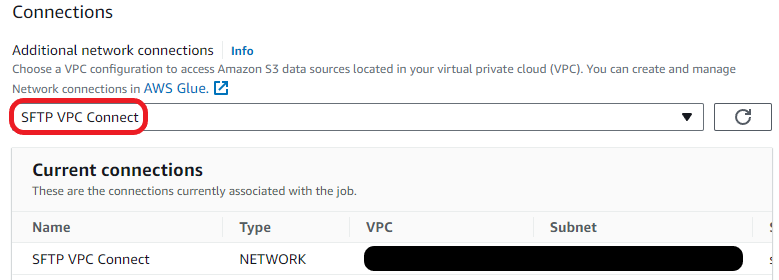
A data connection is used to establish network connectivity between the VPC and the AWS Glue job. To create the VPC connection, complete the following steps.
Now that we completed the prerequisites, we are going to setup the AWS Glue Studio job for this solution. We will create a glue studio job, add events and venue data from the SFTP server, carry out data transformations and load transformed data to s3.
Create your AWS Glue Studio job:
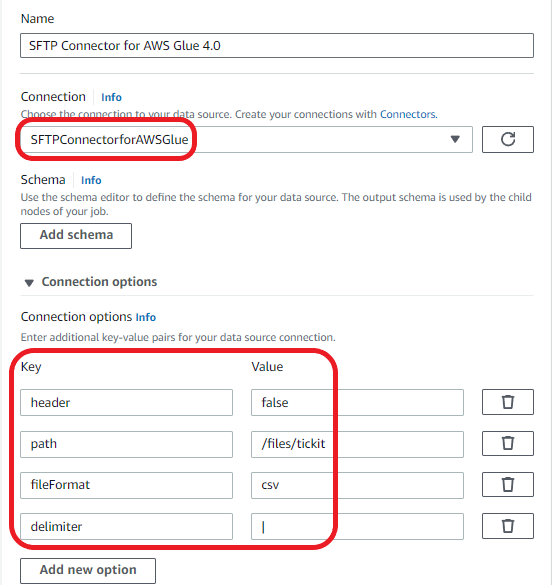
Add the events data from the SFTP server as your first data set:
| Key | Value |
| header | false |
| path | /files (this should be the path to the event file in your SFTP server) |
| fileFormat | csv |
| delimiter | | |
Rename the columns of the Event dataset:
eventide_venueidcatiddateideventnamestarttime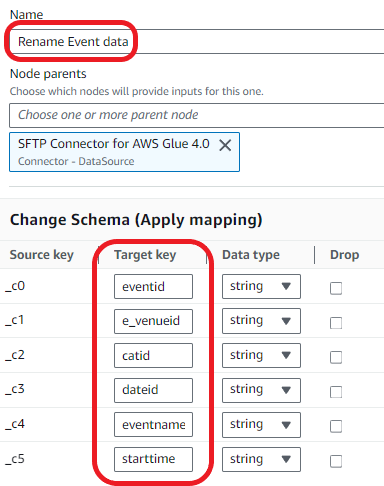
Add the venue_pipe.txt file from the SFTP site:
| Key | Value |
| header | false |
| path | /files (this should be the path to the venue file in your SFTP site) |
| fileFormat | csv |
| delimiter | | |
Rename the columns of the venue dataset:
venueidvenuenamevenuecityvenuestatevenueseats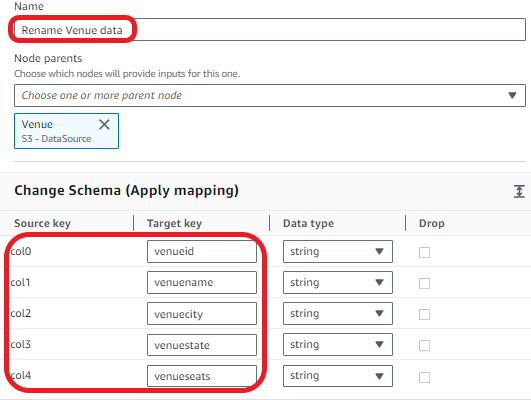
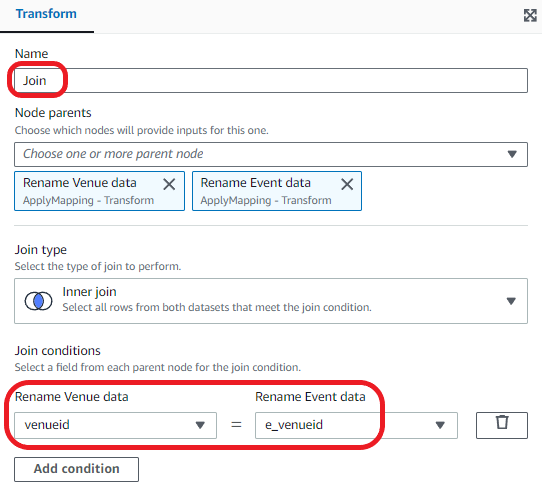
Join the venue and event datasets.
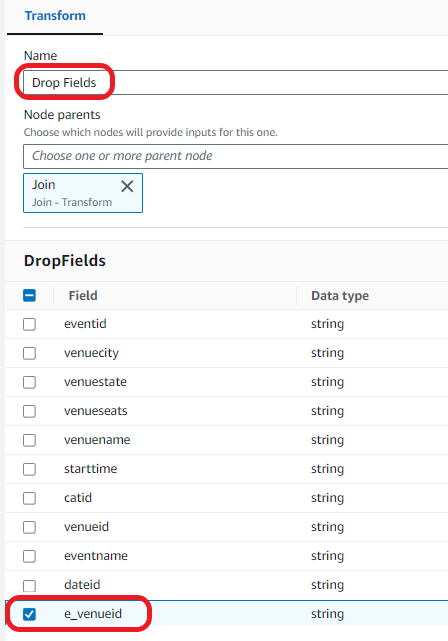
Drop the duplicate field:
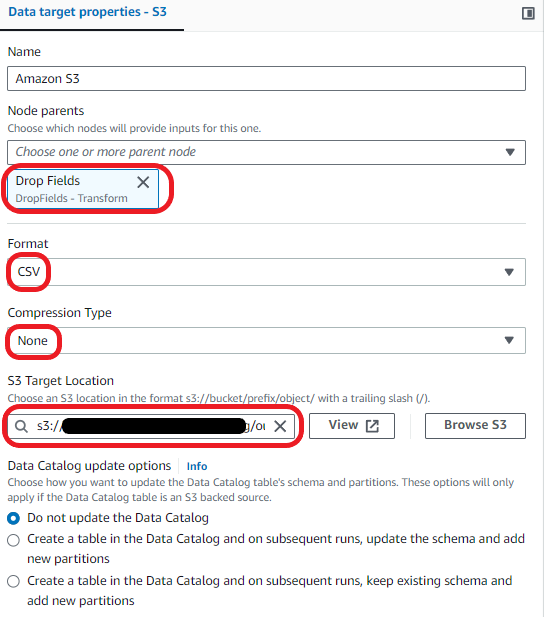
Load the data into your S3 bucket:
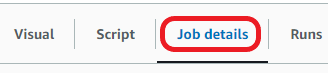
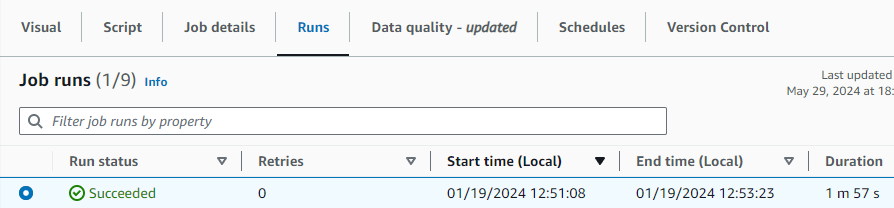
You can now save and run your AWS Glue visual ETL Job. Run the job and then go to the Runs tab to monitor its progress. After the job has completed, the Run status will change to Succeeded. The data will be in the target S3 bucket.
To avoid incurring additional charges caused by resources created as part of this post, make sure you delete the items created in the AWS Account for this post:
In this blog post, we demonstrated how to use the SFTP connector for AWS Glue to streamline the processing of data from SFTP servers into Amazon S3. This integration plays a pivotal role in enhancing your data analytics capabilities by offering an efficient and straightforward method to bring together disparate data sources. Whether your goal is to analyze SFTP server data for actionable insights, bolster your reporting mechanisms, or enrich your business intelligence tools, this connector ensures a more streamlined and cost-effective approach to achieving your data objectives.
For further details on the SFTP connector, see the SFTP Connector for Glue documentation.
 Sean Bjurstrom is a Technical Account Manager in ISV accounts at Amazon Web Services, where he specializes in Analytics technologies and draws on his background in consulting to support customers on their analytics and cloud journeys. Sean is passionate about helping businesses harness the power of data to drive innovation and growth. Outside of work, he enjoys running and has participated in several marathons.
 Seun Akinyosoye is a Sr. Technical Account Manager supporting public sector customer at Amazon Web Services. Seun has a background in analytics, data engineering which he uses to help customers achieve their outcomes and goals. Outside of work Seun enjoys spending time with his family, reading, traveling and supporting his favorite sports teams.
 Vinod Jayendra is a Enterprise Support Lead in ISV accounts at Amazon Web Services, where he helps customers in solving their architectural, operational, and cost optimization challenges. With a particular focus on Serverless technologies, he draws from his extensive background in application development to deliver top-tier solutions. Beyond work, he finds joy in quality family time, embarking on biking adventures, and coaching youth sports team.
 Kamen Sharlandjiev is a Sr. Big Data and ETL Solutions Architect, MWAA and AWS Glue ETL expert. He’s on a mission to make life easier for customers who are facing complex data integration and orchestration challenges. His secret weapon? Fully managed AWS services that can get the job done with minimal effort. Follow Kamen on LinkedIn to keep up to date with the latest MWAA and AWS Glue features and news!
 Chris Scull is a Solutions Architect dealing in orchestration tools and modern cloud technologies. With two years of experience at AWS, Chris has developed an interest in Amazon Managed Workflows for Apache Airflow, which allows for efficient data processing and workflow management. Additionally, he is passionate about exploring the capabilities of GenAI with Bedrock, a platform for building generative AI applications on AWS.
 Shengjie Luo is a Big data architect of Amazon Cloud Technology professional service team. Responsible for solutions consulting, architecture and delivery of AWS based data warehouse and data lake, and good at server-less computing, data migration, cloud data integration, data warehouse planning, data service architecture design and implementation.
 Qiushuang Feng is a Solutions Architect at AWS, responsible for Enterprise customers’ technical architecture design, consulting, and design optimization on AWS Cloud services. Before joining AWS, Qiushuang worked in IT companies such as IBM and Oracle, and accumulated rich practical experience in development and analytics.
Post Syndicated from Eric Smith original https://www.servethehome.com/marvell-structera-a-and-x-cxl-expansion-displayed-at-fms-2024-arm/
At FMS 2024, we saw the Marvell Structera X 2404, a 4-channel DDR4 CXL memory expansion device that can support up to 12 DIMMs each
The post Marvell Structera X CXL Expansion Displayed at FMS 2024 appeared first on ServeTheHome.
Post Syndicated from BeardedTinker original https://www.youtube.com/watch?v=v5ONKtjm-HQ
Post Syndicated from Jeimy Ruiz original https://github.blog/engineering/engineering-principles/the-ultimate-guide-to-developer-happiness/
In today’s rapidly evolving landscape, where AI is reshaping industries and transforming workflows, the role of developers has never been more critical. As business leaders, fostering an environment where developers feel valued, motivated, and empowered is essential to harnessing their full potential and keeping your business profitable and innovative.
In this blog post, we’ll explore actionable tips and strategies to supercharge developer happiness, ensuring your team remains productive, engaged, and ahead of the AI curve. We’ll walk you through ways to secure your code with AI, how to increase productivity with a strong developer experience, and, of course, invite you to join us at GitHub Universe 2024 to see the very best of the latest AI tooling in action.
Developer experience is more than just a buzzword—it’s a critical factor in driving productivity and collaboration within software development teams. A seamless developer experience allows developers to get into the flow state more easily, where their productivity and creativity can peak. This flow state—characterized by uninterrupted concentration and a deep sense of involvement in the task—is crucial for tackling complex coding challenges.
This work environment needs to be built intentionally, and the research backs it up. Developers who carve out time for deep work enjoy 50% more productivity, while those that get work they find engaging are 30% more productive.
How does this impact businesses? Well, because a developer that can significantly reduce their context-switching and mental load can also produce code faster and at a higher quality.
When developers understand their code, they’re 42% more productive. When developers are able to get faster turnaround times, they are 20% more innovative. These are tangible, individual benefits that in turn directly impact the output of developer teams.
Now is the time for leaders to invest in creating a great developer experience. By prioritizing the developer experience, you’re setting your team up to harness the full potential of the latest AI and platform engineering advances, ensuring your business stays ahead of the curve. Curious to learn more? Then dive into how a great developer experience fuels productivity with our latest research.
Historically, developers and security teams have found themselves at odds due to competing business goals. Shifting security left incorporates security earlier in the software development lifecycle, but in practice it has primarily shifted responsibility to developers without necessarily giving them the required expertise.
This, combined with the context switching inherent in development work, makes addressing security concerns particularly challenging. With AI, developers now have powerful tools at their disposal to enhance code security. AI can:
These three improvements make it easier for developers to integrate robust security measures without sacrificing productivity, and transform the relationship between developers and security teams into a collaborative partnership.
Introducing a new security tool doesn’t have to be a daunting task either. By following a few simple steps, organizations can ensure a smooth transition and broad adoption.
AI-powered security tools not only enhance the efficiency and effectiveness of AppSec, but also empower developers to take a proactive role in securing their code. This shift not only improves overall security posture, but also fosters a culture of shared responsibility and continuous learning, ultimately leading to more secure and resilient applications.
Organizations that take AI a step further and customize their AI tools are poised to lead the pack.
Large language models (LLMs) are trained on vast amounts of text data and can perform a variety of natural language processing tasks like translation, summarization, question-answering, and text generation. Customizing a pre-trained LLM goes beyond mere training—it involves adapting the model to perform specific tasks relevant to the organization’s needs. This level of customization helps developers maintain their flow state and significantly boost productivity and efficiency.
Customization techniques like retrieval-augmented generation (RAG), in-context learning, and fine-tuning enable LLMs to deliver more accurate and contextually appropriate responses:
By implementing these customization strategies, businesses can unlock the full potential of their AI tools. Customized LLMs not only improve developer productivity—they also enhance the quality and relevance of AI-generated content.
Fostering collaboration doesn’t just make software development faster, it also helps teams build better products and boost job satisfaction. By making your repository as collaborative as possible, you’ll optimize success. This includes focusing on:
When you signal to your team that you value their career growth and exposure to learning opportunities, it can boost happiness and job satisfaction, leading to increased productivity, collaboration, and better problem solving.
Encouraging your developer teams to attend conferences like GitHub Universe 2024 is a strategic investment in their professional growth and your business’ success. Our global developer event provides an unparalleled platform for the best in software development to gather and expand their knowledge, stay updated on the latest AI-powered tools, and bring fresh ideas back to their teams.
Here are a few highlights of what you and your team can expect:
Get your tickets today. You can take advantage of our group discount and get four tickets for the price of three. (That’s a 25% savings!)
If you’re flying solo, you can also use our Early Bird discount and save 20% off one in-person ticket, only until September 3.
Incorporating these five business strategies can transform your development process and increase developer happiness. By investing in these areas, you empower your team, foster a culture of continuous learning, and position your organization for success in the rapidly evolving tech landscape.
The post The ultimate guide to developer happiness appeared first on The GitHub Blog.
Post Syndicated from daroc original https://lwn.net/Articles/984599/
The
PostgreSQL project has
released beta
versions of PostgreSQL 17 containing several interesting security and usability
improvements, alongside the usual performance improvements and bug fixes. If the
release proceeds according to the usual timeline, the full release of version 17
is expected in September or October.
The most important changes are in what PostgreSQL does when a database
supervisor has their credentials revoked, and added
support for incremental database backups.
Post Syndicated from daroc original https://lwn.net/Articles/985484/
Lix, the fork of Nix that LWN covered in July, has made its second release since forking. This one includes substantial changes to the backend code, including removing a dependency on Bison, and getting a change to the Nix language back upstream.
The general theme of Lix 2.91 is to perform another wave of
refactorings and design improvements in preparation for our evolution
plans.Nevertheless, there are a few exciting user facing changes[.]
Post Syndicated from David Belson original https://blog.cloudflare.com/http-requests-on-cloudflare-radar
Historically, traffic graphs on Cloudflare Radar have displayed two metrics: total traffic and HTTP traffic. These graphs show normalized traffic volumes measured in bytes, derived from aggregated NetFlow data. (NetFlow is a protocol used to collect metadata about IP traffic flows traversing network devices.) Today, we’re adding an additional metric that reflects the number of HTTP requests, normalized over the same time period. By comparing bytes with requests, readers can gain additional insights into traffic patterns and user behavior. Below, we review how this new data has been incorporated into Radar, and explore HTTP request traffic in more detail.
Note that while we refer to “HTTP request traffic” in this post and on Radar, the term encompasses requests made in the clear over HTTP and over encrypted connections using HTTPS – the latter accounts for ~95% of all requests to Cloudflare during July 2024.
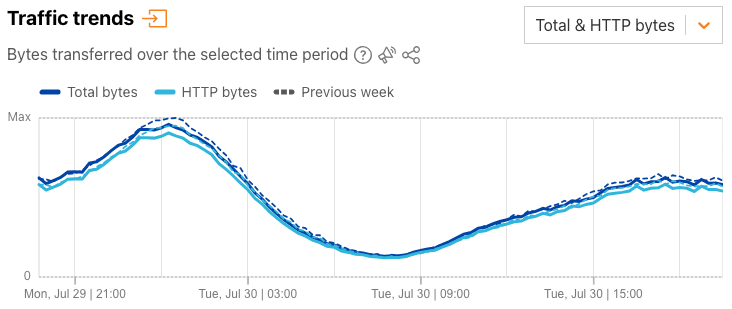
Graphs including HTTP request-based traffic data have been added to the Overview and Traffic sections on Cloudflare Radar. On the Overview page, the “Traffic trends” graph now includes a drop-down selector at the upper right, where you can choose between “Total & HTTP bytes” and “HTTP requests & bytes”. We explore the distinction between these further in the following sections.
The default “Total & HTTP bytes” selection displays a time series graph, showing total bytes and HTTP bytes traffic over time, as Radar has done for several years now.
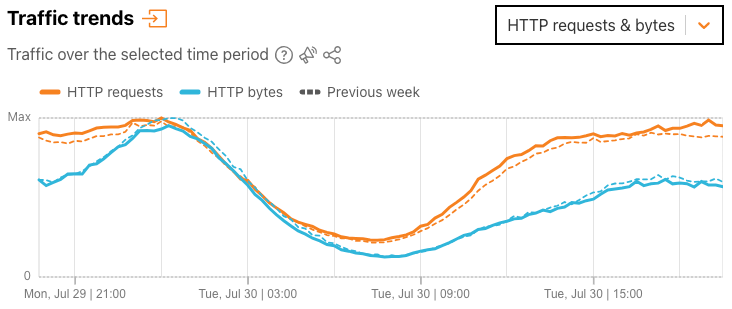
Selecting “HTTP requests & bytes” from the dropdown switches the view to a time series graph that HTTP requests traffic and HTTP bytes traffic over time. In both graphs, users can click on a metric in the legend to deselect it and remove it from the graph. These (de)selections are maintained when a user chooses to download or save a graph.
In addition, we’ve added a “Protocols” summary next to the graph that shows the share of bytes over the selected time period that HTTP accounts for, and the remaining aggregate share associated with the protocols used by other non-HTTP Cloudflare services (such as DNS, WARP, etc.). For most locations or ASNs, HTTP traffic will comprise the majority share of bytes-based traffic.
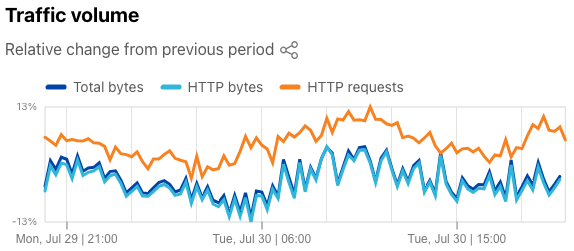
On Radar’s Traffic page, we have added the HTTP requests metric to the “Traffic volume” graph at the top of the page, allowing you to see how request volume has changed during the selected time period as compared to the previous period, in addition to the changes in the bytes-based metrics.
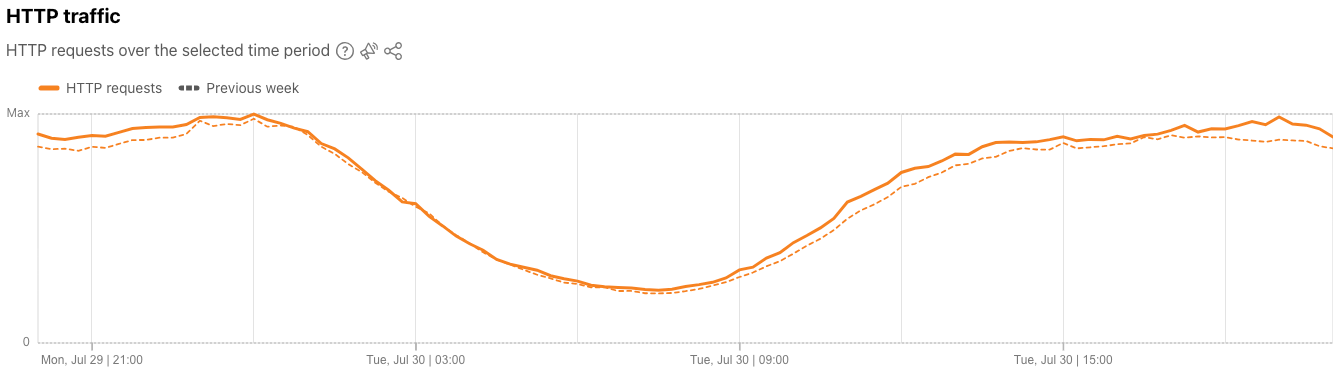
A new standalone request-based “HTTP traffic” graph was also added to the Traffic page, just below the bytes-based “Traffic trends” graph. This new graph shows normalized HTTP request traffic volume across the selected time period, and by default, also compares it with the previous time period.
Similar to other Radar graphs, these new HTTP request-based graphs can also be downloaded, copied to the clipboard, or embedded in other websites – just click on the share icon.
As always, the underlying data is also available through the Radar API. The “HTTP requests Time Series” API endpoint returns normalized HTTP request time series data across the specified time period for the requested location or autonomous system (ASN).
An HTTP GET request is a message sent from a client (such as your web browser) to a web server (such as one operated by Cloudflare), asking for a particular resource (file). In addition to returning the requested resource, which could range from a single-pixel GIF accounting for just a few bytes, to an API call that returns a few kilobytes of data, to a multi-gigabyte software package, the Web server also returns a set of headers, which can include information about the content type, the last time the resource was modified, cookie information, cacheability, and more. While GET requests account for the overwhelming majority of HTTP request traffic, such traffic also includes other HTTP request methods including HEAD, POST, PUT, and more.
Cloudflare temporarily logs HTTP requests received by our network, including associated header information and “metadata” about the request, such as the bot score computed for the request and the associated cache status. Request logs for a customer’s web properties are available for them to download, and after processing and analysis, this data is also presented in the Analytics section of the Cloudflare dashboard. The HTTP request data now available on Radar is based on a sample of this log data, aggregated across Cloudflare’s global customer base.
Cloudflare Radar already has HTTP data, so why add more? One key reason for analyzing and including HTTP request traffic is resilience. Having multiple sources of truth with respect to HTTP traffic allows us to better and more quickly distinguish between real events (such as an Internet disruption in a given country or network) and data pipeline issues.
While bytes-based metrics provide a reasonable proxy into human (user) behavior, especially with respect to activity surrounding Internet disruptions, request-based metrics provide an even better perspective. A lot of HTTP traffic involves relatively small responses – especially API traffic, which now accounts for 60% of all traffic. Furthermore, response sizes can vary widely, ranging from a single-pixel GIF accounting for just a few bytes, to an API call that returns a few kilobytes of data, to a multi-gigabyte software package
To that end, the scope of user activity may be insufficiently reflected by a bytes-based metric, or buried in the noise, whereas request activity provides a cleaner signal and a more direct proxy for user activity. This is especially important as we examine the restoration of connectivity after an Internet disruption, attempting to ascertain when activity has returned to “expected” pre-disruption levels.
Finally, incorporating request-based traffic insights into Radar is simply extending the way that the data is already being used on the site. All of the graphs, maps, and tables presented on Radar’s Adoption & Usage page, are based on analysis of HTTP request traffic, making use of information contained within request headers (such as HTTP version or user agent) or characteristics of the underlying connection (such as IP version).
The current “HTTP traffic” view aggregates the bytes associated with HTTP requests to Cloudflare’s content delivery (CDN) services from the selected location or autonomous system (ASN). “Total traffic” aggregates this HTTP traffic along with the traffic associated with other Cloudflare services, including our 1.1.1.1 DNS resolver, authoritative DNS, WARP, and Spectrum, among others. (While Spectrum, WARP, and 1.1.1.1 also carry HTTP traffic, the share of HTTP traffic carried by these services is opaque to Radar, and isn’t accounted for as part of the HTTP traffic calculations.)
The bytes associated with a given request include the size of the request, the size of the headers associated with the response, and the size of the response itself. As noted above, the size of a file returned in response to a request can vary widely, depending on what was requested. The shape of the HTTP requests and HTTP bytes lines may be quite similar, but the potential variability in response sizes (in aggregate) can cause the lines to diverge, sometimes significantly so. For example, if an application regularly makes background requests to check for updates, the availability and subsequent download of a large file containing a software update would cause a spike in the HTTP bytes line, while the HTTP requests pattern remained consistent.
As another example, consider the graph below, capturing HTTP requests and bytes traffic trends for Portugal during the first week of August. HTTP bytes traffic initially grows each day between 06:00 and 09:00 UTC (07:00 – 10:00 local summer time), increases much more slowly until around 19:00 UTC (20:00 local summer time), and then increases rapidly before peaking around 21:00 UTC (22:00 local time). This suggests that content consumed during the workday is lighter in terms of bytes (such as API traffic, as discussed above), while evening traffic is more byte-heavy (possibly due to increased consumption of media content). In contrast, after starting to increase around 06:00 UTC (07:00 local summer time), request traffic generally sees three successively higher peaks each day – occurring around 10:00, 14:00, and 21:00 UTC respectively (11:00, 15:00, and 22:00 local summer time). These peaks are most pronounced on weekdays, but are still apparent on weekend days as well, suggesting regular patterns of user activity at those times.
It is important to remember that in looking at the “HTTP requests & bytes” graphs on Radar that they are showing two different metrics, and as such, only their shape over time is comparable, not their relative sizes. (As both metrics are normalized on a 0 to 1 (Max) scale, the lines on the graph are scaled relative to the maximum normalized value of each metric, including the previous period.)
The addition of HTTP request metrics to Cloudflare Radar brings additional visibility to traffic trends at a global, location, and network level, complementing the existing bytes-based HTTP traffic metrics. Derived from traffic to customer web properties, these new metrics can be found on Radar’s Overview and Traffic pages.
In addition to HTTP traffic trends, visit Cloudflare Radar for additional insights around Internet disruptions, routing issues, attacks, domain popularity, and Internet quality. Follow us on social media at @CloudflareRadar (X), noc.social/@cloudflareradar (Mastodon), and radar.cloudflare.com (Bluesky), or contact us via email.
Post Syndicated from Pat Patterson original https://www.backblaze.com/blog/how-to-build-your-own-llm-with-backblaze-b2-jupyter-notebook/

Last month, Backblaze Principal Storage Cloud Storyteller, Andy Klein, and I presented a webinar, Leveraging your Cloud Storage Data in AI/ML Apps and Services, in which we explored the various ways AI/ML applications use and store data. In addition to sharing insights from our customers who leverage Backblaze B2 Cloud Object Storage for their AI/ML needs, we also demonstrated a simple AI use case: a retrieval-augmented generation (RAG) chatbot answering questions based on custom context downloaded from a private Backblaze B2 Bucket. After the webinar, I posted the demo source code to a GitHub repository: https://github.com/backblaze-b2-samples/ai-rag-examples.
In this blog post, I’ll recap a little of the webinar, and explain how you can use the demo source code as a basis for your own experiments with RAG and large language models (LLMs).
You might be asking yourself, why build a chatbot when multiple online services, such as ChatGPT, are just a click away? It’s a good question. The main motivation is privacy. Suppose you want your chatbot to use confidential data in generating its responses. By running an LLM on your own machine, whether on-premises or on a virtual machine (VM) under your control in a public cloud provider’s infrastructure, you eliminate the risks of that data surfacing in response to a question from a user outside your organization.
In the webinar, I showed two Python apps running on a GPU-equipped VM at Vultr, one of Backblaze’s compute partners. The first app used the GPT4All Python SDK to create a very simple conversational chatbot running a local instance of a large language model (LLM), which it used in answering general questions. Here’s an example from the webinar:
Ask me a question: What were the causes of the First World War?
The causes of the First World War are complex and varied, but some key factors include nationalism, imperialism, militarism, alliances between nations, and the assassination of Archduke Franz Ferdinand. Nationalism led to tensions between ethnic groups and their respective governments, while imperialism saw countries competing for territories and resources around the world. Militarism also played a role as many European powers built up large armies and navies in preparation for potential conflicts. The complex web of alliances between nations meant that any conflict could quickly escalate into a latIer war, and the assassination of Archduke Franz Ferdinand by a Serbian nationalist was the spark that ignited the powder keg of tensions already present in Europe at the time.
Now, I’m not a history scholar, but that looks like a pretty good answer to me! (History scholars, you are welcome to correct me.)
The second app used the Langchain framework to implement a more elaborate chatbot, again running on my own machine at Vultr, that used PDF data downloaded from a private bucket in Backblaze B2 as context for answering questions. As much as I love our webinar attendees, I didn’t want to share genuinely confidential data with them, so I used our Backblaze B2 Cloud Storage documentation as context. The chatbot was configured to use that context, and only that context, in answering questions. From the webinar:
Ask me a question about Backblaze 82: What's the difference between the master application key and a standard application key?
The master application key provides complete access to your account with all capabilities, access to all buckets, and has no file prefix restrictions or expiration. On the other hand, a standard application key is limited to the level of access that a user needs and can be specific to a bucket.
Ask me a question about Backblaze B2: What were the causes of the First World War?
The exact cause of the First World War is not mentioned in these documents.
The chatbot provides a comprehensive, accurate answer to the question on Backblaze application keys, but doesn’t answer the question on the causes of the First World War, since it was configured to use only the supplied context in generating its response.
During the webinar’s question-and-answer session, an attendee posed an excellent question: “Can you ask [the chatbot] follow-up questions where it can use previous discussions to build a proper answer based on content?” I responded, “Yes, absolutely; I’ll extend the demo to do exactly that before I post it to GitHub.” What follows are instructions for building a simple RAG chatbot, and then extending it to include message history.
After the webinar, I rewrote both demo apps as Jupyter notebooks, which allowed me to add commentary to the code. I’ll provide you with edited highlights here, but you can find all of the details in the RAG demo notebook.
The first section of the notebook focuses on downloading PDF data from the private Backblaze B2 Bucket into a vector database, a storage mechanism particularly well suited for use with RAG. This process involves retrieving each PDF, splitting it into uniformly sized segments, and loading the segments into the database. The database stores each segment as a vector with many dimensions—we’re talking hundreds, or even thousands. The vector database can then vectorize a new piece of text—say a question from a user—and very quickly retrieve a list of matching segments.
Since this process can take significant time—about four minutes on my MacBook Pro M1 for the 225 PDF files I used, totaling 58MB of data—the notebook also shows you how to archive the resulting vector data to Backblaze B2 for safekeeping and retrieve it when running the chatbot later.
The vector database provides a “retriever” interface that takes a string as input, performs a similarity search on the vectors in the database, and outputs a list of matching documents. Given the vector database, it’s easy to obtain its retriever:
retriever = vectorstore.as_retriever()The prompt template I used in the webinar provides the basic instructions for the LLM: use this context to answer the user’s question, and don’t go making things up!
prompt_template = """Use the following pieces of context to answer the question at the end.
    If you don't know the answer, just say that you don't know, don't try to make up an answer.

    {context}

    Question: {question}
    Helpful Answer:"""

prompt = PromptTemplate(
    template=prompt_template, input_variables=["context", "question"]
)
The RAG demo app creates a local instance of an LLM, using GPT4All with Nous Hermes 2 Mistral DPO, a fast chat-based model. Here’s an abbreviated version of the code:
model = GPT4All(
    model='Nous-Hermes-2-Mistral-7B-DPO.Q4_0.gguf',
    max_tokens=4096,
    device='gpu'
)
LangChain, as its name suggests, allows you to combine these components into a chain that can accept the user’s question and generate a response.
chain = (
        {"context": retriever, "question": RunnablePassthrough()}
        | prompt
        | model
        | StrOutputParser()
)
As mentioned above, the retriever takes the user’s question as input and returns a list of matching documents. The user’s question is also passed through the first step, and, in the second step, the prompt template combines the context with the user’s question to form the input to the LLM. If we were to peek inside the chain as it was processing the question about application keys, the prompt’s output would look something like this:
Use the following pieces of context to answer the question at the end. If you don't know the answer, just say that you don't know, don't try to make up an answer.

<Text of first matching document>

<Text of second matching document>

Question: What's the difference between the master application key and a standard application key?

Helpful Answer:
This is the basis of RAG: building an LLM prompt that contains the information required to generate an answer, then using the LLM to distill that prompt into an answer. The final step of the chain transforms the data structure emitted by the LLM into a simple string for display.
Now that we have a chain, we can ask it a question. Again, abbreviated from the sample code:
question = 'What is the difference between the master application key and a standard application key?'
answer = chain.invoke(question)
The first step of extending the chatbot is to give the LLM new instructions, similar to its previous prompt template, but including the message history:
prompt_template = """Use the following pieces of context and the message history to answer the question at the end. If you don't know the answer, just say that you don't know, don't try to make up an answer.

Context: {context}

History: {history}

Question: {question}

Helpful Answer:"""

prompt = PromptTemplate(
    template=prompt_template, input_variables=["context", "question", "history"]
)
The chain must be modified slightly to accommodate the message history:
chain = (
    {
        "context": (
                itemgetter("question")
                | retriever
        ),
        "question": itemgetter("question"),
        "history": itemgetter("history")
    }
    | prompt
    | model
    | StrOutputParser()
)
Now, we define a very simple in-memory message store that uses a session_id parameter to manage multiple simultaneous conversations:
store = {}

def get_session_history(session_id: str) -> BaseChatMessageHistory:
    if session_id not in store:
        store[session_id] = InMemoryChatMessageHistory()
    return store[session_id]
LangChain provides a wrapper, RunnableWithMessageHistory, that combines the message store with the above chain to create a new chain with message history capability:
with_message_history = RunnableWithMessageHistory(
    chain,
    get_session_history,
    input_messages_key="question",
    history_messages_key="history",
)
Now we can feed a series of related questions into the new chain:
questions = [
    'What is the difference between the master application key and a standard application key?',
    'Which one would I use to work with a single bucket?',
    'Can you tell me anything more about this topic?'
]

for question in questions:
    print(f'\n{question}\n')
    answer = with_message_history.invoke(
        {"question": question},
        config={"configurable": {"session_id": "abc123"}},
    )
    print(f'{answer}\n')
I have to admit, I was pleasantly surprised by the results:
What is the difference between the master application key and a standard application key?
A master application key grants broad access privileges, while a standard application key is limited to the level of access that a user needs.
Which one would I use to work with a single bucket?
You would use a standard application key to work with a single bucket as it has limited access and only grants permissions needed for specific tasks, unlike the master application key which provides broad access privileges.
Can you tell me anything more about this topic?
Sure! The master application key is typically used by developers during development or testing phases to grant full access to all resources in a Backblaze B2 account, while the standard application key provides limited permissions and should be used for production environments where security is paramount.
Processing this series of questions on my MacBook Pro M1 with no GPU-acceleration took three minutes and 25 seconds, and just 52 seconds with its 16-core GPU. For comparison, I spun up a VM at Ori, another Backblaze partner offering GPU VM instances, with an Nvidia L4 Tensor Core GPU and 24GB of VRAM. The only code change required was to set the LLM device to ‘cuda’ to select the Nvidia GPU. The Ori VM answered those same questions in just 18 seconds.

One of the reasons I refactored the demo apps was that notebooks allow an interactive, experimental approach. You can run the code in a cell, make a change, then re-run it to see the outcome. The RAG demo repository includes instructions for running the notebooks, and both the GPT4All and LangChain SDKs can run LLMs on machines with or without a GPU. Use the code as a starting point for your own exploration of AI, and let us know how you get on in the comments!
The post How to Build Your Own LLM with Backblaze B2 + Jupyter Notebook appeared first on Backblaze Blog | Cloud Storage & Cloud Backup
Post Syndicated from corbet original https://lwn.net/Articles/985482/
Version 6.4 of the Incus container manager is out.
This release builds upon the recently added OCI support from Incus
6.3, making it even easier to run application containers. It also
adds a number of useful new features for clustered and larger
environments with more control on the virtual CPU used when live
migrating VMs and finer grained resource constraints within
projects.
See this
announcement for details.
Post Syndicated from corbet original https://lwn.net/Articles/985481/
Security updates have been issued by Debian (kernel and roundcube), Fedora (microcode_ctl, pypy, python2.7, and python3.6), Oracle (389-ds-base, httpd, kernel, kernel-container, and linux-firmware), Red Hat (kernel-rt), SUSE (firefox, kubernetes1.23, libqt5-qtbase, openssl-1_1, python-gunicorn, python-Twisted, python-urllib3, and qt6-base), and Ubuntu (linux-aws-5.15, linux-gkeop-5.15, linux-ibm, linux-ibm-5.15, linux-raspi, linux-azure, linux-azure-5.15, linux-azure-fde, linux-azure-fde-5.15, linux-oem-6.8, linux-oracle-5.15, and qemu).
Post Syndicated from David Belson original https://blog.cloudflare.com/http-requests-on-cloudflare-radar

Historically, traffic graphs on Cloudflare Radar have displayed two metrics: total traffic and HTTP traffic. These graphs show normalized traffic volumes measured in bytes, derived from aggregated NetFlow data. (NetFlow is a protocol used to collect metadata about IP traffic flows traversing network devices.) Today, we’re adding another metric that reflects the number of HTTP requests, normalized over the same time period. By comparing bytes with requests, readers can gain additional insights into traffic patterns and user behavior. Below, we review how this new data has been incorporated into Radar, and explore HTTP request traffic in more detail.
Note that while we refer to “HTTP request traffic” in this post and on Radar, the term encompasses requests made in the clear over HTTP and over encrypted connections using HTTPS – the latter accounts for ~95% of all requests to Cloudflare during July 2024.
Graphs including HTTP request-based traffic data have been added to the Overview and Traffic sections on Cloudflare Radar. On the Overview page, the “Traffic trends” graph now includes a drop-down selector at the upper right, where you can choose between “Total & HTTP bytes” and “HTTP requests & bytes”. We explore the distinction between these further in the following sections.

The default “Total & HTTP bytes” selection displays a time series graph, showing total bytes and HTTP bytes traffic over time, as Radar has done for several years now.
Selecting “HTTP requests & bytes” from the dropdown switches the view to a time series graph that HTTP requests traffic and HTTP bytes traffic over time. In both graphs, users can click on a metric in the legend to deselect it and remove it from the graph. These (de)selections are maintained when a user chooses to download or save a graph.
In addition, we’ve added a “Protocols” summary next to the graph that shows the share of bytes over the selected time period that HTTP accounts for, and the remaining aggregate share associated with the protocols used by other non-HTTP Cloudflare services (such as DNS, WARP, etc.). For most locations or ASNs, HTTP traffic will comprise the majority share of bytes-based traffic.

On Radar’s Traffic page, we have added the HTTP requests metric to the “Traffic volume” graph at the top of the page, allowing you to see how request volume has changed during the selected time period as compared to the previous period, in addition to the changes in the bytes-based metrics.
A new standalone request-based “HTTP traffic” graph was also added to the Traffic page, just below the bytes-based “Traffic trends” graph. This new graph shows normalized HTTP request traffic volume across the selected time period, and by default, also compares it with the previous time period.
Similar to other Radar graphs, these new HTTP request-based graphs can also be downloaded, copied to the clipboard, or embedded in other websites – just click on the share icon.
As always, the underlying data is also available through the Radar API. The “HTTP requests Time Series” API endpoint returns normalized HTTP request time series data across the specified time period for the requested location or autonomous system (ASN).
An HTTP GET request is a message sent from a client (such as your web browser) to a web server (such as one operated by Cloudflare), asking for a particular resource (file). In addition to returning the requested resource, which could range from a single-pixel GIF accounting for just a few bytes, to an API call that returns a few kilobytes of data, to a multi-gigabyte software package, the Web server also returns a set of headers, which can include information about the content type, the last time the resource was modified, cookie information, cacheability, and more. While GET requests account for the overwhelming majority of HTTP request traffic, such traffic also includes other HTTP request methods including HEAD, POST, PUT, and more.
Cloudflare temporarily logs HTTP requests received by our network, including associated header information and “metadata” about the request, such as the bot score computed for the request and the associated cache status. Request logs for a customer’s web properties are available for them to download, and after processing and analysis, this data is also presented in the Analytics section of the Cloudflare dashboard. The HTTP request data now available on Radar is based on a sample of this log data, aggregated across Cloudflare’s global customer base.
Cloudflare Radar already has HTTP data, so why add more? One key reason for analyzing and including HTTP request traffic is resilience. Having multiple sources of truth with respect to HTTP traffic allows us to better and more quickly distinguish between real events (such as an Internet disruption in a given country or network) and data pipeline issues.
While bytes-based metrics provide a reasonable proxy into human (user) behavior, especially with respect to activity surrounding Internet disruptions, request-based metrics provide an even better perspective. A lot of HTTP traffic involves relatively small responses – especially API traffic, which now accounts for 60% of all traffic. Furthermore, response sizes can vary widely, ranging from a single-pixel GIF accounting for just a few bytes, to an API call that returns a few kilobytes of data, to a multi-gigabyte software package
To that end, the scope of user activity may be insufficiently reflected by a bytes-based metric, or buried in the noise, whereas request activity provides a cleaner signal and a more direct proxy for user activity. This is especially important as we examine the restoration of connectivity after an Internet disruption, attempting to ascertain when activity has returned to “expected” pre-disruption levels.
Finally, incorporating request-based traffic insights into Radar is simply extending the way that the data is already being used on the site. All the graphs, maps, and tables presented on Radar’s Adoption & Usage page, are based on analysis of HTTP request traffic, making use of information contained within request headers (such as HTTP version or user agent) or characteristics of the underlying connection (such as IP version).
The current “HTTP traffic” view aggregates the bytes associated with HTTP requests to Cloudflare’s content delivery (CDN) services from the selected location or autonomous system (ASN). “Total traffic” aggregates this HTTP traffic along with the traffic associated with other Cloudflare services, including our 1.1.1.1 DNS resolver, authoritative DNS, WARP, and Spectrum, among others. (While Spectrum, WARP, and 1.1.1.1 also carry HTTP traffic, the share of HTTP traffic carried by these services is opaque to Radar, and isn’t accounted for as part of the HTTP traffic calculations.)
The bytes associated with a given request include the size of the request, the size of the headers associated with the response, and the size of the response itself. As noted above, the size of a file returned in response to a request can vary widely, depending on what was requested. The shape of the HTTP requests and HTTP bytes lines may be quite similar, but the potential variability in response sizes (in aggregate) can cause the lines to diverge, sometimes significantly so. For example, if an application regularly makes background requests to check for updates, the availability and subsequent download of a large file containing a software update would cause a spike in the HTTP bytes line, while the HTTP requests pattern remained consistent.
As another example, consider the graph below, capturing HTTP requests and bytes traffic trends for Portugal during the first week of August. HTTP bytes traffic initially grows each day between 06:00 and 09:00 UTC (07:00 – 10:00 local summer time), increases much more slowly until around 19:00 UTC (20:00 local summer time), and then increases rapidly before peaking around 21:00 UTC (22:00 local time). This suggests that content consumed during the workday is lighter in terms of bytes (such as API traffic, as discussed above), while evening traffic is more byte-heavy (possibly due to increased consumption of media content). In contrast, after starting to increase around 06:00 UTC (07:00 local summer time), request traffic generally sees three successively higher peaks each day – occurring around 10:00, 14:00, and 21:00 UTC respectively (11:00, 15:00, and 22:00 local summer time). These peaks are most pronounced on weekdays, but are still apparent on weekend days as well, suggesting regular patterns of user activity at those times.
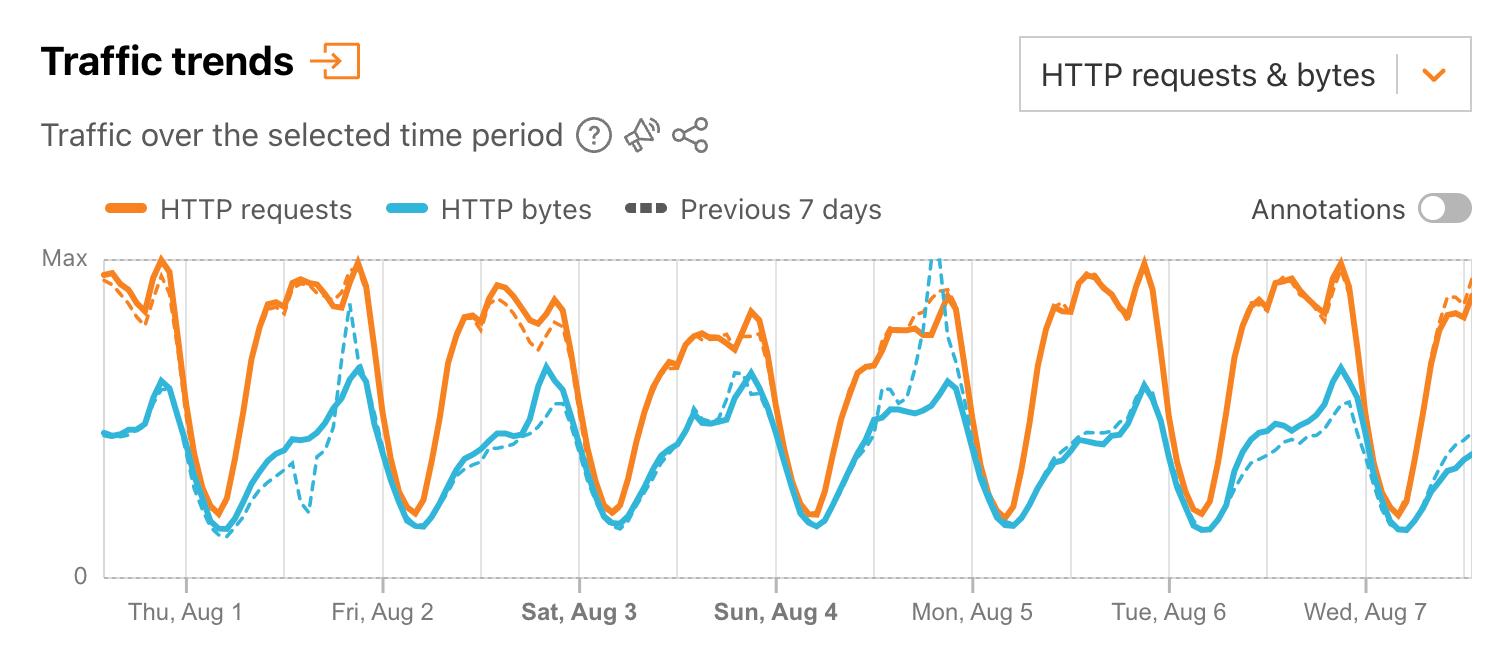
It is important to remember that in looking at the “HTTP requests & bytes” graphs on Radar that they are showing two different metrics, and as such, only their shape over time is comparable, not their relative sizes. (As both metrics are normalized on a 0 to 1 (Max) scale, the lines on the graph are scaled relative to the maximum normalized value of each metric, including the previous period.)
The addition of HTTP request metrics to Cloudflare Radar brings additional visibility to traffic trends at a global, location, and network level, complementing the existing bytes-based HTTP traffic metrics. Derived from traffic to customer web properties, these new metrics can be found on Radar’s Overview and Traffic pages.
In addition to HTTP traffic trends, visit Cloudflare Radar for additional insights around Internet disruptions, routing issues, attacks, domain popularity, and Internet quality. Follow us on social media at @CloudflareRadar (X), noc.social/@cloudflareradar (Mastodon), and radar.cloudflare.com (Bluesky), or contact us via email.
Post Syndicated from Bruce Schneier original https://www.schneier.com/blog/archives/2024/08/on-the-voynich-manuscript.html
Really interesting article on the ancient-manuscript scholars who are applying their techniques to the Voynich Manuscript.
No one has been able to understand the writing yet, but there are some new understandings:
Davis presented her findings at the medieval-studies conference and published them in 2020 in the journal Manuscript Studies. She had hardly solved the Voynich, but she’d opened it to new kinds of investigation. If five scribes had come together to write it, the manuscript was probably the work of a community, rather than of a single deranged mind or con artist. Why the community used its own language, or code, remains a mystery. Whether it was a cloister of alchemists, or mad monks, or a group like the medieval Béguines—a secluded order of Christian women—required more study. But the marks of frequent use signaled that the manuscript served some routine, perhaps daily function.
Davis’s work brought like-minded scholars out of hiding. In just the past few years, a Yale linguist named Claire Bowern had begun performing sophisticated analyses of the text, building on the efforts of earlier scholars and on methods Bowern had used with undocumented Indigenous languages in Australia. At the University of Malta, computer scientists were figuring out how to analyze the Voynich with tools for natural-language processing. Researchers found that the manuscript’s roughly 38,000 words—and 9,000-word vocabulary—had many of the statistical hallmarks of actual language. The Voynich’s most common word, whatever it meant, appeared roughly twice as often as the second-most-common word and three times as often as the third-commonest, and so on—a touchstone of natural language known as Zipf’s law. The mix of word lengths and the ratio of unique words to total words were similarly language-like. Certain words, moreover, seemed to follow one another in predictable order, a possible sign of grammar.
Finally, each of the text’s sections—as defined by the drawings of plants, stars, bathing women, and so on—had different sets of overrepresented words, just as one would expect in a real book whose chapters focused on different subjects.
Spelling was the chief aberration. The Voynich alphabet—if that’s what it was—appeared to have a conventional 20-odd letters. But compared with known languages, too many of those letters repeated in the same order, both within words and across neighboring words, like a children’s rhyme. In some places, the spellings of adjacent words so converged that a single word repeated two or three times in a row. A rough English equivalent might be something akin to “She sells sea shells by the sea shore.” Another possibility, Bowern told me, was something like pig Latin, or the Yiddishism—known as “shm-reduplication”—that begets phrases such as fancy shmancy and rules shmules.
Post Syndicated from The Atlantic original https://www.youtube.com/watch?v=g27l1BYoP7o
Post Syndicated from Matt Granger original https://www.youtube.com/watch?v=ZwP19SB43Lk
Post Syndicated from Explosm.net original https://explosm.net/comics/tv-shows
New Cyanide and Happiness Comic