Post Syndicated from The Atlantic original https://www.youtube.com/shorts/s1KPPb7bOSU
Everything we launched during Agents Week
Post Syndicated from Shelley Jones original https://blog.cloudflare.com/agents-week-review-august-2026/
At the beginning of Agents Week, Rita shared that agents represent the next evolution of computing: not only as a new application of AI but also as a new class of software that’s shaping how people interact with technology, and how software interacts with the Internet. Over the last year or so, we set out to explore what this shift means for developers and customers building AI-native apps and the infrastructure needed to support them. As agents become more capable and autonomous, the challenges extend beyond the models themselves — to identity, communication, orchestration, memory, observability, and security.
Over the past week we’ve shared how we’re bringing those pieces together across the Cloudflare platform to serve an Agentic Internet. Each day we presented new tools, products, and ideas toward building for an Internet where humans and agents cooperate instead of collide.
Monday, August 3
Monday focused on the foundations for building and running intelligent, autonomous apps — the runtime and infrastructure agents rely on.
Tuesday, August 4
Tuesday introduced the Agent Development Lifecycle (ADLC) and the primitives that take agentic software from prototype to production.
Wednesday, August 5
Wednesday extended Zero Trust from users and devices to agents themselves — and we shared how we’re running it internally at Cloudflare.
Thursday, August 6
Thursday defined the Agentic Internet, and how website owners, publishers, and agents can all contribute to an Internet that works for people and agents alike.
Friday, August 7
Friday put a lens on what’s actually happening: what agents are really doing on the web, where AI is running in your apps, who’s contributing to the ecosystems, and new tools for analyzing Internet data.
Agents Week is done, but we aren’t
Five days on, the answer to Rita’s question of “What does your agent need from an Agent Cloud?” is starting to take shape. It needs an execution layer and primitives to run on, a development lifecycle that increasingly writes itself, secure access for the people and agents doing the work, an Agentic Internet, and the humans and communities keeping all of it grounded. There's plenty still to come, but the shape of what’s next is becoming clearer: an Internet that natively supports the humans it was built for and the agents now acting on their behalf.
Our work doesn’t stop here. Keep an eye on our changelog for the latest updates. And if you’re building any part of this with us, we’d love to hear from you! Come find us on X or Discord.
2026 AWS CyberVadis report now available for due diligence on third-party suppliers
Post Syndicated from Tariro Dongo original https://aws.amazon.com/blogs/security/2026-aws-cybervadis-report-now-available-for-due-diligence-on-third-party-suppliers/
We’re excited to announce that Amazon Web Services (AWS) has completed theCyberVadis assessment of its security posture with the highest score (Mature) in all assessed areas. This demonstrates our continued commitment to meet the heightened expectations for cloud service providers. Customers can now use the 2026 AWS CyberVadis report and scorecard to reduce their supplier due-diligence burden.
With the increasing adoption of cloud products and services across multiple sectors and industries, AWS is a critical component of customers’ third-party environments. Regulated customers, such as those in the financial services sector, are held to high standards by regulators and auditors when it comes to exercising effective due diligence on third parties.
Many customers use third-party risk management services such as CyberVadis to better manage risks from their evolving third-party environments and drive operational efficiencies. In support of these efforts, AWS has completed its annual CyberVadis security posture assessment, conducted by CyberVadis security analysts.
CyberVadis is a comprehensive third-party risk assessment process that combines the speed and scalability of automation with the certainty of analyst validation. CyberVadis assessments employ a dynamic and comprehensive approach to third-party risk assessment, replacing outdated static spreadsheets and the need for annual AWS assessment access requests. This cloud-based solution provides advanced capabilities by integrating AWS responses with analytics and sophisticated risk models to deliver an in-depth view of the security posture of AWS.
CyberVadis’s risk assessment methodology evaluates 20 topics covering the entire cybersecurity life cycle across four phases: Identify, Protect, Detect, and React. These topics include Data Privacy, Access Management, and Infrastructure Security. The assessment criteria are based on international information security standards, including ISO 2700x, NIST Cybersecurity Framework, Cybersecurity for ICS, PCI DSS, NIS2 and GDPR.
Customers can use CyberVadis results to map the assessment of AWS to commonly used industry frameworks and standards to instantly gain visibility into controls coverage.
AWS customers can download the complete 2026 AWS Assessment Report directly through CyberVadis’s portal using their own account, or through AWS Artifact.
To learn more about our other compliance and security programs, see AWS Compliance Programs.
As an AWS customer, you can reach out to your AWS account team if you have any questions or feedback.
If you have feedback about this post, submit comments in the Comments section below.
How a team at Epic Games tuned Amazon OpenSearch Service for Fortnite analytics
Post Syndicated from Jon Evans original https://aws.amazon.com/blogs/big-data/how-a-team-at-epic-games-tuned-amazon-opensearch-service-for-fortnite-analytics/
Since the launch of Fortnite in 2017, Epic Games has reached hundreds of millions of players worldwide. Fortnite runs on Amazon Web Services (AWS), and takes advantage of services such as Amazon OpenSearch Service to power certain internal analytics and drive decision making at scale.
Amazon OpenSearch Service has been helpful in understanding the game ecosystem. OpenSearch Service powers two types of use cases: search workloads and analytics workloads. A team at Epic Games had a use case for storing and analyzing a sliding window of game event data. This involves supporting complex queries and multilayered aggregations that feed analytical results into other internal systems, helping them power an evolving player experience. At the scale of a game like Fortnite with a large player base, these queries run against a significant volume of incoming data.
These insights help identify emerging gameplay trends, understand how players engage with new content, and reveal more about the Fortnite ecosystem. They inform live operation decisions and help surface relevant content to players based on aggregated activity across the community.
As Epic Games’ infrastructure handles billions of telemetry events, the team identified opportunities to optimize their OpenSearch Service cluster for better performance and cost efficiency. This post details how Epic Games partnered with AWS to transform their OpenSearch Service deployment, achieving significant improvements in query latency and resource utilization while reducing operational costs.
The challenge
Epic Games runs an OpenSearch Service domain that handles continuous high-volume writes alongside CPU-intensive batch aggregation jobs. Ideally, these aggregation jobs would run more frequently to keep analytics fresh. Shorter job intervals mean fresher data for identifying gameplay trends, detecting anomalies, and informing live operations decisions. But the existing configuration couldn’t support this without scaling the domain beyond what the workload justified, driving up costs. Epic Games worked with AWS to identify where improvements could be made, focusing on areas such as hardware utilization, sharding strategy, index mappings, and query behavior.
Observations
The cluster was running on r7g memory-optimized data nodes, with 48 vCPUs and 384 GiB of memory per node. Of each node’s available memory, only a fraction (32 GiB) was allocated to Java Virtual Machine (JVM) heap, set at the maximum recommended for compressed oops. The remainder (off-heap memory) was used for the filesystem cache and the operating system. System memory was not fully utilized across the data nodes (Figure 1).

Figure 1: System memory utilization across data nodes
As shown in the preceding figure, utilization stays well below 100% throughout the observation period, confirming that much of the off-heap memory allocated to these nodes goes unused. The excess capacity could be safely exchanged for additional compute resources.
JVM memory pressure is shown in Figure 2, and the correlating garbage collection metrics (both count and time) are shown in Figure 3.
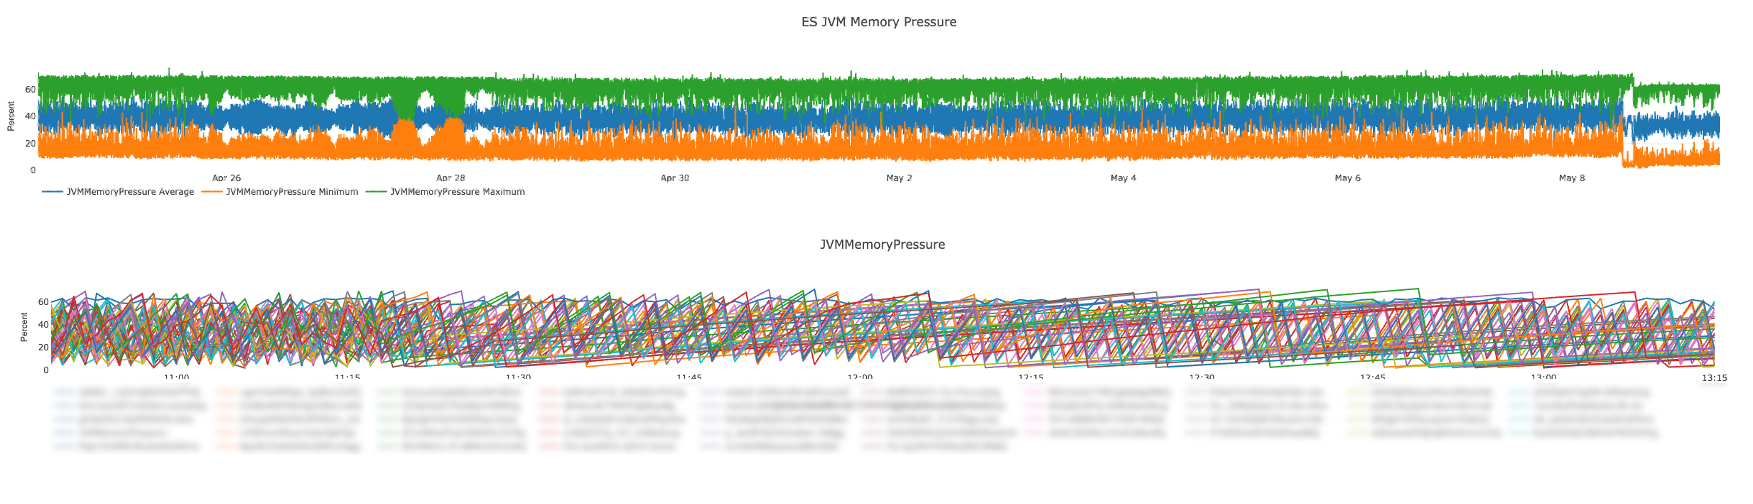
Figure 2: JVM memory pressure
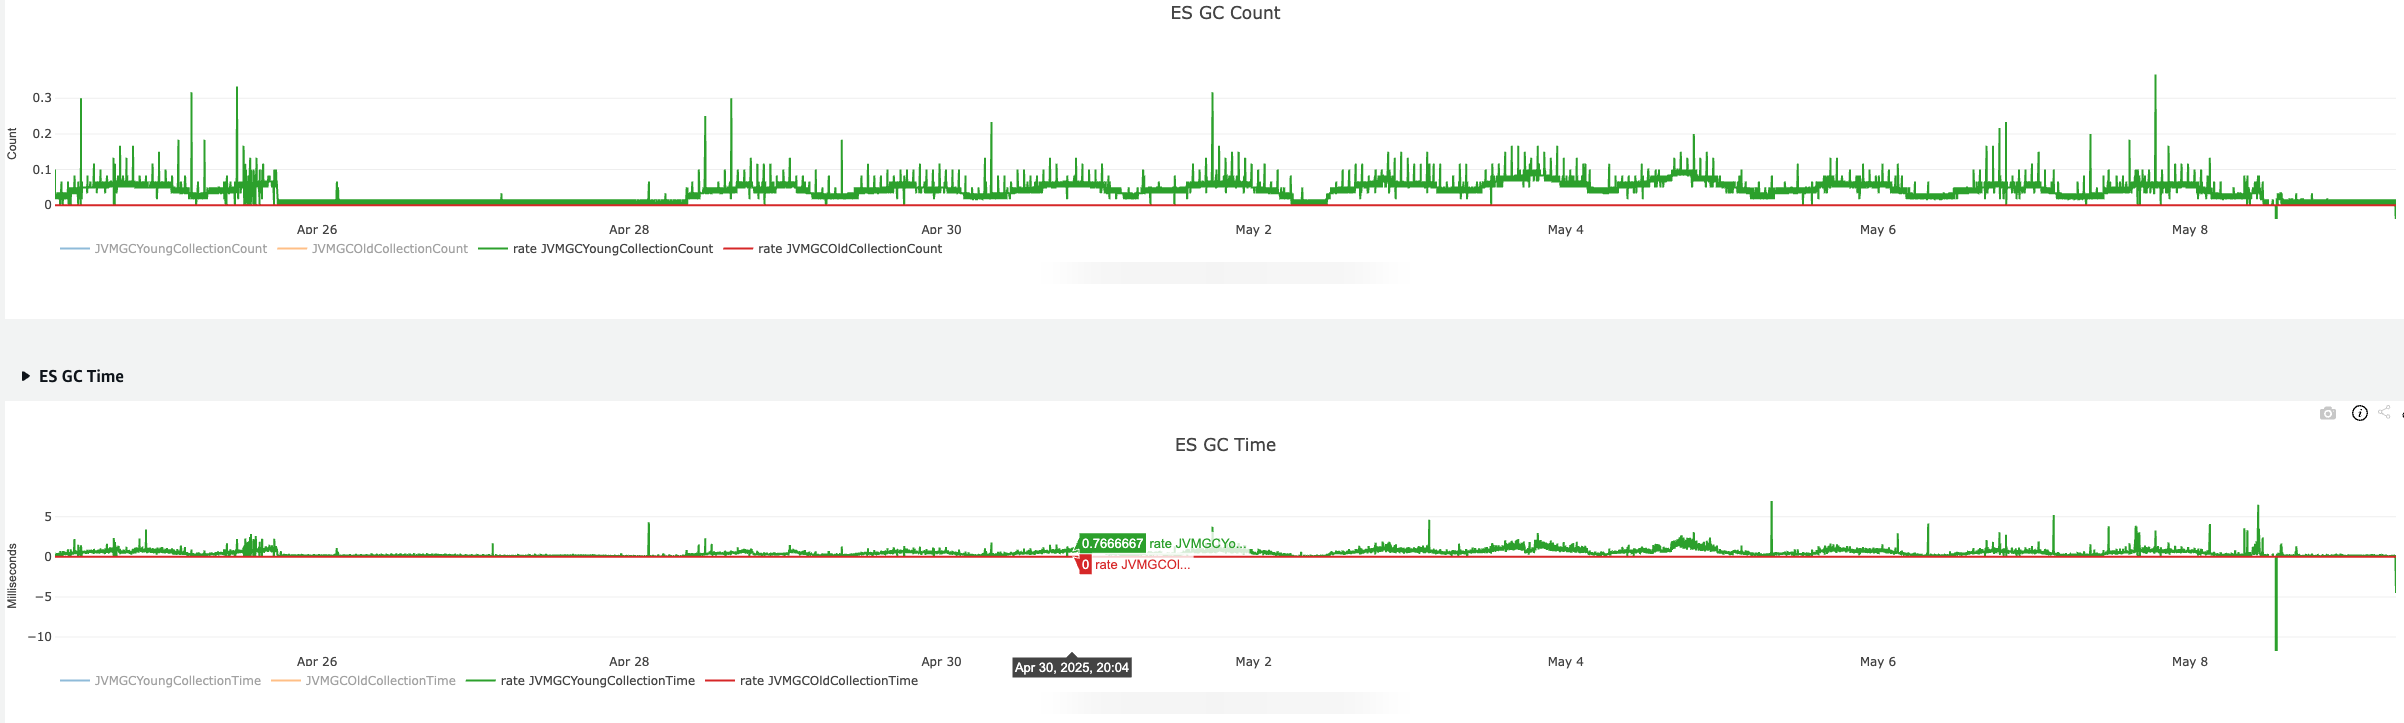
Figure 3: JVM garbage collection metrics, count (top) and time (bottom)
These charts show that JVM memory pressure remains below critical thresholds, and both garbage collection count and time are low and stable, indicating healthy JVM utilization across the domain.
While cluster-level CPU metrics appeared healthy at first glance (Figure 4), zooming into node-level metrics revealed clear node hotspots. The root cause of the node hotspots was the cluster’s sharding strategy.

Figure 4: Cluster-level CPU utilization
The cluster had data nodes distributed across multiple Availability Zones. Each index used a set number of primary shards with replicas, rolling over after shards reached a certain size. At first glance, the configuration appeared well-balanced, with shard copies distributed across Availability Zones and each node holding a manageable share of the data.
However, the primary shard count was lower than the total data node count. This meant that searches targeting the latest data, which is the most common access pattern, would only execute across a subset of available nodes. As a result, some nodes developed consistent CPU-based hotspots while the rest remained underutilized (Figure 5).

Figure 5: Node-level CPU utilization showing hotspots
As shown in the preceding figure, some nodes reach as high as 90 percent CPU utilization while several others remain under 20 percent, highlighting the uneven distribution of query execution across the cluster.
Recommendations and implementation
Based on these observations, AWS worked together with Epic Games on a set of targeted optimizations spanning hardware selection, sharding strategy, index mappings, and query behavior. The following sections detail each recommendation and how it was implemented.
Right-sizing the cluster
Because aggregation queries are CPU-intensive by nature and the cluster’s JVM memory pressure was well within acceptable ranges, AWS recommended migrating from memory-optimized r7g instances to compute-optimized c7g instances. The c7g family offers a higher ratio of vCPU to RAM, which is better suited for workloads where processing power rather than memory capacity is the binding constraint.
The proposed architecture called for a larger number of c7g nodes than the existing r7g count. This migration achieved approximately 33 percent more aggregate CPU capacity across the cluster while operating with two-thirds of the original memory. The net effect was a meaningful cost reduction of approximately 10 percent, delivering more processing power at lower cost by aligning the instance profile with the actual nature of the workload (Table 1).
| R7g (Before) | c7g (After) | Net Impact | |
| Instance Family | Memory Optimized | Compute Optimized | Better CPU-to-RAM alignment for aggregation workloads |
| vCPUs per Node | Same | Same | Same per-node CPU. More nodes = higher aggregate CPU |
| Memory per Node | Higher | Lower | Reduced unused memory; JVM heap unchanged |
| Aggregate CPU | Baseline | +33% more total vCPUs | Distributed more evenly across higher node count |
| Cost | Baseline | ~10% reduction | More performance per dollar spent |
Table 1: Instance migration comparison, r7g compared to c7g
Sharding strategy
To support the new cluster sizing, the Epic Games team changed the sharding strategy so that the number of primary shards matches the data node count, with 1 replica. This distributes both the write-heavy load and the batch aggregation search query load evenly on all the available data nodes.
The team employed ISM (Index State Management) policies to manage shard sizing through rollover, targeting shard sizes within recommended bounds using min_primary_shard_size. This kept shard counts bounded and predictable, providing a clear scaling pattern: adjust the node count, then update the ISM policy accordingly.
After implementation, node-level CPU utilization showed a much more even distribution (Figure 6).
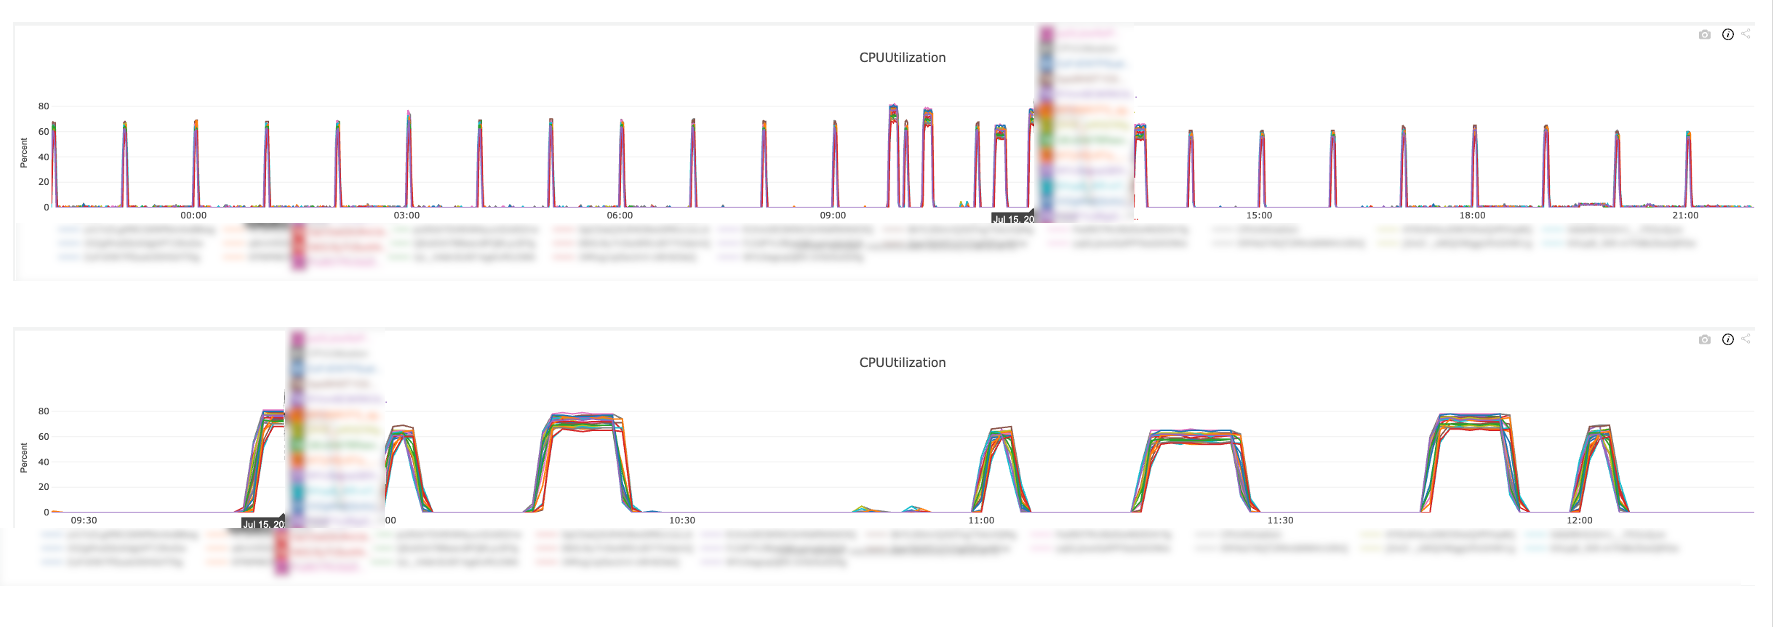
Figure 6: Node-level CPU utilization after sharding optimization
As shown in Figure 6, all nodes in the domain are working at similar CPU utilization levels, confirming that data and traffic are well distributed across the cluster with no node hotspots.
Mapping optimization
The index mappings had both text and keyword field types enabled on many fields, even though access patterns showed those fields were only used for aggregation, sorting, or filter context, and never for full-text match queries. Removing the redundant text field type reduced storage overhead and improved query performance by eliminating unnecessary analysis at index time.
For high-cardinality string fields, the murmur3 field type does a compute-once-and-store optimization for cardinality aggregation. Instead of hashing keyword values at query time, murmur3 computes the hash once at index time and stores it as a numeric doc_value, so the aggregation can skip the expensive string hashing step at query time (the cardinality estimate itself is still computed at query time).
The following example illustrates the mapping changes:
| Before: | After: |
These mapping changes reduced overall storage, lowered shard count (which reduced CPU requirements), and reduced cluster manager node state size.
Index optimization
Additional index-level optimizations were applied to improve query performance and reduce overhead. Index sorting was configured to default to the primary date field, which improves performance for time-based access patterns by aligning the physical data layout with the most common query order. The ISM policy was updated to force merge indices down to 1 segment after rollover, reducing segment overhead on read-only indices. Finally, the refresh interval was tuned to balance indexing throughput with search freshness.
Upgrading from OpenSearch Service 2.17 to 3.1
The domain was upgraded from OpenSearch Service 2.17 to 3.1, which reduced error counts and improved throughput at the Amazon OpenSearch Ingestion pipeline level. The performance gains were notable: p99 latency on sum aggregations dropped by 40–50 percent after the upgrade alone, and large 96-hour cardinality aggregations saw p95 drop over 40 percent. General query performance improved across all query types, and thread pool pressure was reduced significantly, leading to far fewer 429 errors (Figure 7).

Figure 7: Query performance before and after the OpenSearch Service 3.1 upgrade
Upgrading from Graviton 3 to Graviton 4
The instance types were upgraded from c7g (Graviton 3) to c8g (Graviton 4). The performance gains were immediate:
- p99 on all queries: 380 ms to 250 ms.
- p95 on all queries: 245 ms to 230 ms.
- p90 on all queries: 225 ms to 200 ms.
- p50 on all queries: 100 ms to 70 ms.
Date-windowed cardinality queries saw their p99 halved from 220 ms to 98 ms, with sum-based aggregations experiencing similar gains. Overall throughput increased by 16 percent.
Tiered caching
With the upgrade to OpenSearch Service 3.1, the team enabled tiered caching. Tiered caching extends the default on-heap request cache with a disk-based tier. When items are evicted from the on-heap cache, they spill into a larger disk cache on the node’s local SSD rather than being discarded. This allows the cluster to retain cached results for a much larger set of queries without increasing JVM heap usage.
The batch aggregation jobs in Epic Games’ workload issue repeated queries over overlapping time windows. The on-heap cache alone was too small to retain results across successive job runs, so expensive aggregations were recomputed each time. With the disk tier enabled, results from longer time-window aggregations (such as the 96-hour cardinality queries) persisted between runs. This produced more consistent and faster results on some of the larger aggregation queries, particularly those spanning longer time windows.
Results summary
The following table summarizes the impact of each optimization.
| Optimization Strategy | Impact |
| Right-sizing (r7g to c7g) | 33% more CPU, 10% cost reduction |
| Sharding rebalance | Eliminated CPU hotspots across nodes |
| Mapping optimization | Reduced storage, shard count, and cluster state size |
| OpenSearch Service 2.17 to 3.1 | p99 sum aggs reduced 40-50%, fewer 429 errors |
| Graviton 3 to Graviton 4 | p99 380 ms to 250 ms, 16% higher throughput |
| Tiered caching | More consistent results on large aggregation queries |
Table 2: Results summary
Conclusion
By optimizing their OpenSearch Service deployment, a team at Epic Games reduced p99 query latency from 380 ms to 250 ms, increased throughput by 16 percent, and lowered costs by 10 percent. These gains came from aligning instance types, sharding strategy, mappings, and engine versions with the workload’s actual demands.
To learn more about optimizing Amazon OpenSearch Service for your workloads, see Best practices for Amazon OpenSearch Service. For details on supported instance types, see Supported instance types in Amazon OpenSearch Service.
About the authors
AI-powered cost optimization agent for Amazon Kinesis Data Streams
Post Syndicated from Masudur Rahaman Sayem original https://aws.amazon.com/blogs/big-data/ai-powered-cost-optimization-agent-for-amazon-kinesis-data-streams/
Customers running multiple Amazon Kinesis Data Streams often struggle to estimate the cost impact of switching between capacity modes. As accounts grow to tens or hundreds of streams, manually reviewing Amazon CloudWatch metrics for each stream and comparing pricing across Provisioned, On-demand Standard, and On-demand Advantage becomes impractical. Teams often stay on their current mode, unsure whether switching would save money or cost more, leaving potential savings unquantified. On-demand Advantage is an account-level setting that unlocks additional capabilities and a different pricing structure for on-demand streams in an AWS Region. However, without a clear, data-driven comparison, the decision to enable it remains difficult to justify.
In this post, we show you how to deploy an AI-powered agent built on Amazon Bedrock. The agent automatically analyzes every Kinesis Data Stream in your account and compares costs across all three capacity modes. It tells you exactly which streams to move to On-demand and whether your account qualifies for On-demand Advantage pricing, all on a daily or weekly schedule with zero manual intervention. As we showed in Kinesis On-demand Advantage saves 60%+ on streaming costs, choosing the right mode can save over 60 percent on streaming costs. This agent automates that analysis for you.
What is the Kinesis Mode Optimizer Agent?
The Kinesis Mode Optimizer Agent is an open source, serverless solution that uses Amazon Bedrock AgentCore, a platform to build, connect, and optimize agents at scale, with any framework or model. The agent autonomously analyzes your Kinesis Data Streams usage. It collects 7 days of Amazon CloudWatch metrics for every stream in the Region and discovers Enhanced Fan-Out (EFO) consumers. It then computes a three-way cost comparison (On-demand Standard, On-demand Advantage, Provisioned) and generates per-stream recommendations along with an account-level On-demand Advantage assessment.
The agent strongly prefers on-demand modes for their operational simplicity (automatic scaling, no capacity planning, and no throttling risk).
Results are stored as both a visual HTML report and machine-readable JSON in Amazon Simple Storage Service (Amazon S3).
Architecture
The solution uses the following architecture:
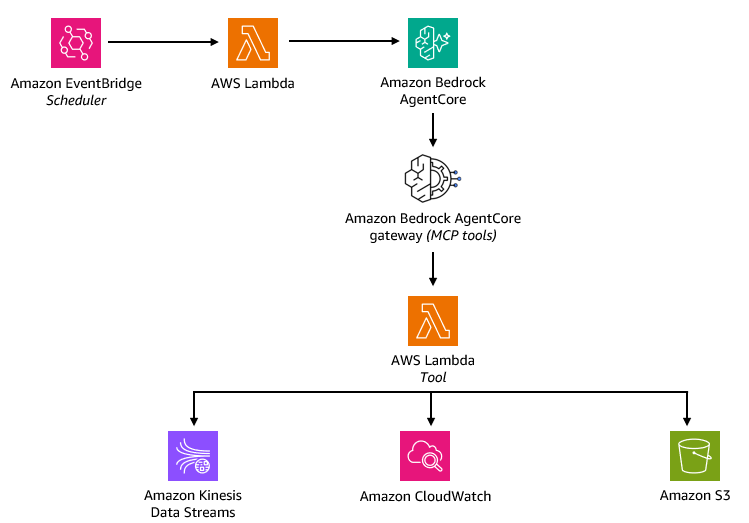
Figure 1: Architecture of the Kinesis Mode Optimizer Agent
The architecture flow includes the following steps:
- Amazon EventBridge Schedule triggers the Scheduler Lambda, an AWS Lambda function, on your configured cadence (daily, weekly, or custom cron).
- Scheduler Lambda invokes the Amazon Bedrock AgentCore harness with the instruction to analyze streams and generate a report.
- Amazon Bedrock AgentCore Gateway, a capability of Amazon Bedrock AgentCore powered by Claude Sonnet, interprets the request and routes it to the appropriate Model Context Protocol (MCP) tools exposed by the Tool Lambda.
- Tool Lambda performs the heavy lifting, fanning out to three downstream services:
- Kinesis Data Streams – Lists streams in the Region, describes each stream (shard count, mode, retention), and discovers Enhanced Fan-Out consumers per stream.
- CloudWatch – Pulls 7 days of metrics per stream (IncomingBytes, OutgoingBytes, throttle events) and computes three-way cost comparison.
- Amazon S3 – Generates per-stream recommendations and an account-level Advantage assessment, then stores the final HTML and JSON reports.
- Amazon Bedrock AgentCore harness summarizes the findings and returns them to the caller.
The entire stack is deployed using AWS Cloud Development Kit (AWS CDK) with a single cdk deploy command.
Prerequisites
Before you begin, verify that you have the following:
- AWS CDK –
npm install -g aws-cdk. - Python 3.12+.
- aws-cdk-lib >= 2.251.0 – for AgentCore L2 constructs.
- AWS Command Line Interface (AWS CLI) configured with credentials that have permissions to deploy the required resources.
- Amazon Bedrock model access – verify you have access to Claude Sonnet 4.5 (or your chosen model) in the target Region. Check in the Amazon Bedrock console under Model access.
Walkthrough
In the following sections, you deploy the Kinesis Data Streams Mode Optimizer Agent and test it against your Kinesis streams.
Step 1: Clone the repository
Step 2: Install CDK dependencies
Step 3: Set your target Region
The stack deploys to whatever Region is set in AWS_DEFAULT_REGION. Set it before running any CDK commands:
Step 4: Bootstrap CDK (first time per account/Region)
Step 5: Deploy
Optionally customize the schedule and bucket name:
Step 6: Test the agent
You can test the agent with the AWS CLI:
Step 7: View reports
Reports are stored in Amazon S3 at:
The HTML report includes a per-stream action table with priority indicators, detailed cost breakdowns, and the account-level Advantage recommendation.
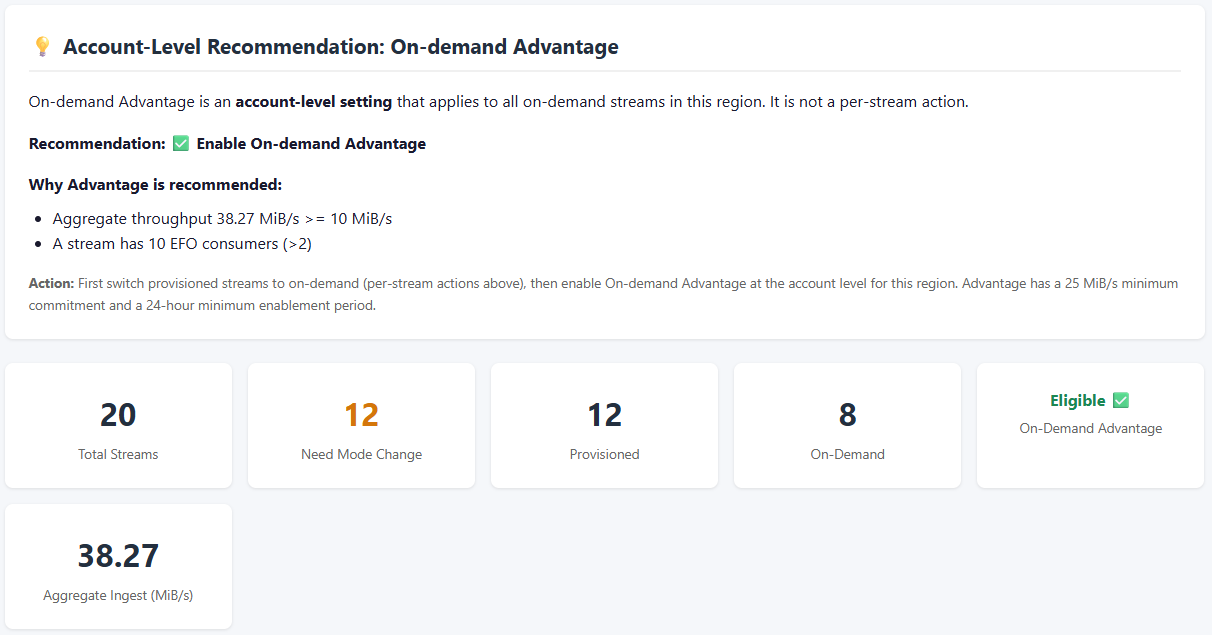
Figure 2: Sample HTML report with the per-stream action table
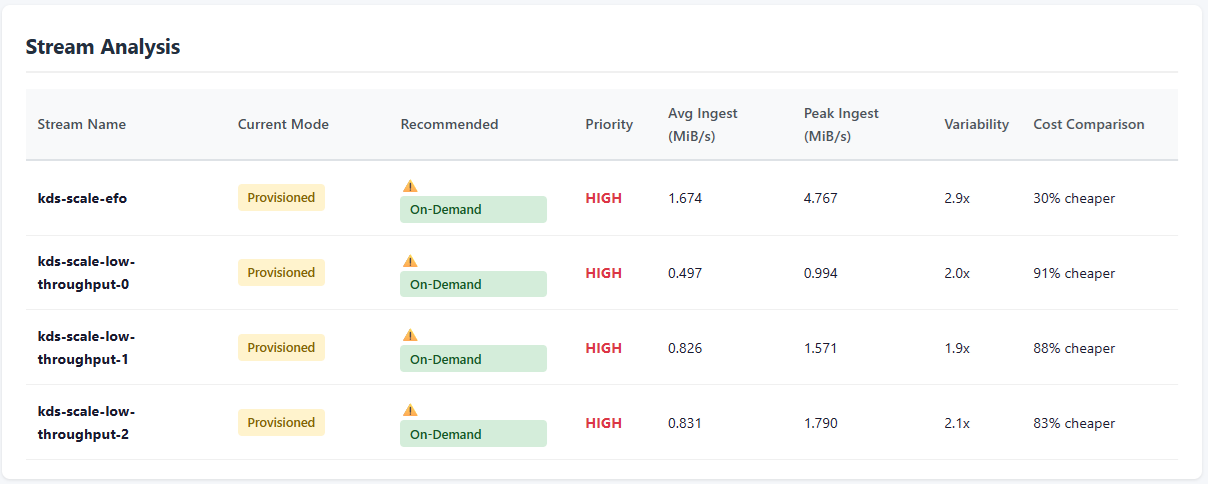
Figure 3: Account-level On-demand Advantage recommendation in the sample report output
Multi-Region deployment
The agent is Region-specific. When deployed to a Region, it analyzes only the streams in that Region. To cover multiple Regions, change the environment variable and repeat the deployment:
Each deployment is independent, with its own agent, Amazon S3 bucket, and schedule.
Clean up
To remove the stack from a Region:
Note: The Amazon S3 bucket has a RemovalPolicy.RETAIN setting and isn’t deleted with the stack. Delete it manually if you no longer need the reports.
Conclusion
In this post, you deployed an AI-powered agent that autonomously analyzes your Amazon Kinesis Data Streams and recommends the optimal capacity mode for each stream. The agent alleviates the manual effort of reviewing CloudWatch metrics across dozens or hundreds of streams and produces actionable, cost-aware recommendations on a recurring schedule.
By shifting from manual capacity reviews to autonomous, scheduled optimization, you gain three key benefits. First, you can reduce streaming costs by identifying streams that should switch modes. Second, you alleviate throttling risk by catching under-provisioned streams before they impact performance. Third, you free your team from repetitive operational work. All of this is achievable with a single cdk deploy.
To get started, clone the sample-kinesis-optimizer-agent repository and deploy it to your account today.
About the authors
Panduit E36G18L PDU Review A Sweet Managed and Switched by Outlet PDU
Post Syndicated from Eric Smith original https://www.servethehome.com/panduit-e36g18l-pdu-review-a-sweet-managed-and-switched-by-outlet-pdu/
We test the Panduit E36G18L PDU and see what this metered and switched by outlet zero U PDU offers including its combination outlets
The post Panduit E36G18L PDU Review A Sweet Managed and Switched by Outlet PDU appeared first on ServeTheHome.
This $379 Router Might Be All Your RV Needs
Post Syndicated from Crosstalk Solutions original https://www.youtube.com/watch?v=zngl3yg6Szc
S9 E30: Elon Musk, Twitter & Qatar World Cup: Last Week Tonight with John Oliver
Post Syndicated from LastWeekTonight original https://www.youtube.com/watch?v=14xmIVd1I78
AWS Weekly Roundup: AWS Heroes Summit, Web Search on Amazon Bedrock, Dogwood, Kiro Crew, and more (August 10, 2026)
Post Syndicated from Channy Yun (윤석찬) original https://aws.amazon.com/blogs/aws/aws-weekly-roundup-aws-heroes-summit-web-search-on-amazon-bedrock-dogwood-kiro-crew-and-more-august-10-2026/
Last week, we brought together AWS Heroes from around the world to connect, collaborate, and celebrate the builders who go above and beyond for the AWS community.
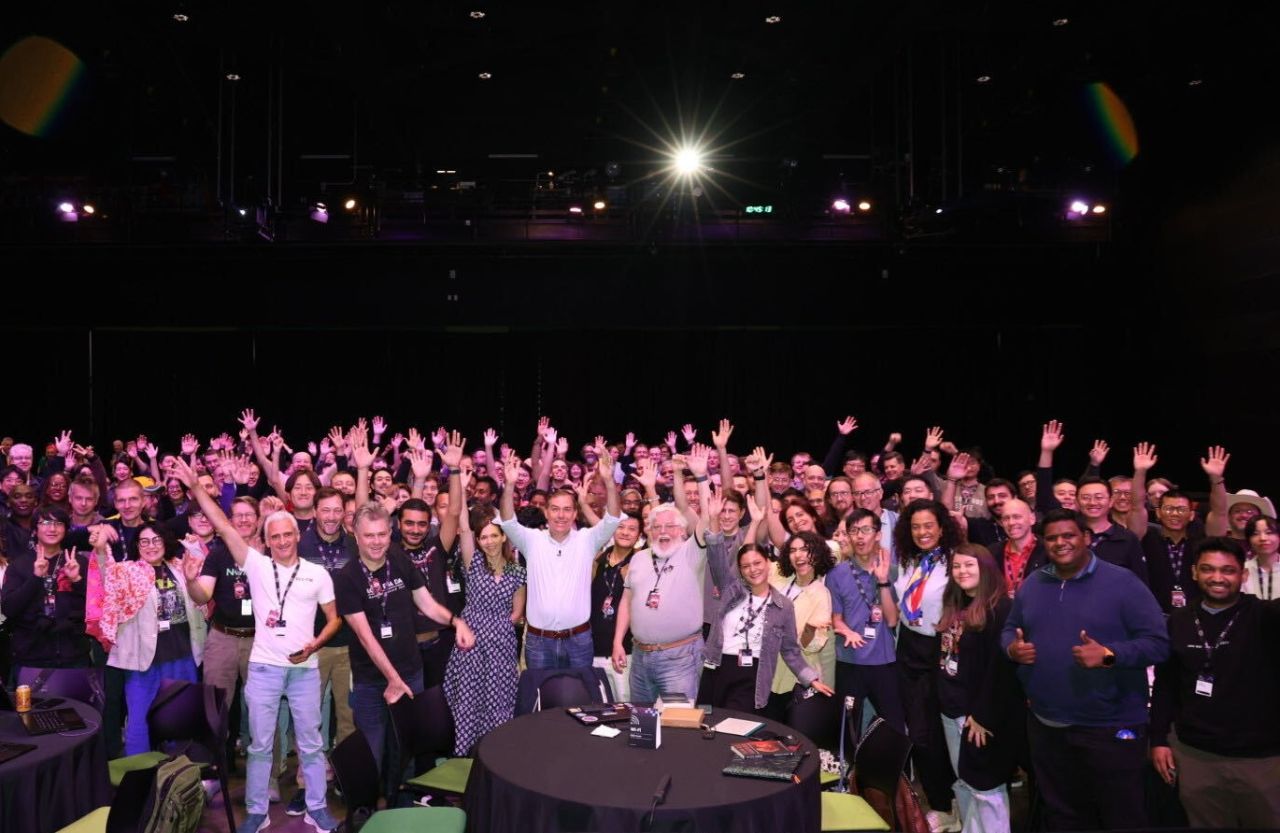
The AWS Heroes Summit, an invite-only annual gathering, brings global experts specializing in fields like AI, serverless, and containers together for direct collaboration, technical deep-dives, and feedback sessions with internal AWS product and service teams.
Day 1 started with an inspiring fireside chat from AWS CEO Matt Garman. From an insightful AMA with James Hamilton on Day 2 to breakout sessions from various product teams that sparked new ideas, our AWS Heroes excelled at sharing knowledge, lifting each other up, and turning conversations into collaborations. To learn more, read the attendee feedback on LinkedIn.
Last week’s launches
Here are some launches that got my attention:
- Web Search on Amazon Bedrock: Amazon Bedrock now enables OpenAI models (GPT-5.4, GPT-5.5, and GPT-5.6 Sol/Terra/Luna) to browse and retrieve information from the internet, allowing AI applications to access up-to-date information beyond their training data. This capability opens new possibilities for building AI agents and applications that can answer questions using real-time web content while maintaining data residency within your secured AWS environment with zero data egress. To get started, visit the AI blog post and the Amazon Bedrock User Guide.
- Runtime Instances on Amazon Bedrock AgentCore: You can now deploy and run AI agents on dedicated runtime instances through Amazon Bedrock AgentCore, providing more control over agent execution environments with predictable performance and cost. To get started, visit Sébastien’s blog post and AgentCore documentation.
- Vector search for Amazon DynamoDB: You can store and query vector embeddings alongside your existing data in DynamoDB without managing a separate vector database. DynamoDB already supports storing memory for AI agents, and with vector search you can now add semantic retrieval over that memory for agentic grounding, with predictable performance. To learn more, visit Esra’s blog post and Amazon DynamoDB Developer Guide.
- AWS Transform continuous modernization now generally available: This capability helps engineering teams analyze and remediate technical debt across source code repositories at scale. You can modernize mainframe and legacy workloads with an ongoing, automated approach rather than a one-time migration event. To learn more, visit Micah’s preview blog post. You can also try the AWS Transform Kiro Power and agent plugins.
- Up to 3,000 Mbps for AWS Lambda function bandwidth: AWS Lambda functions now support increased network bandwidth, enabling data-intensive workloads and faster communication between Lambda functions and other AWS services. This feature enables functions outside a VPC that are configured with 2 GB of memory or more to access network bandwidth that scales proportionally, from 625 Mbps at 2 GB up to 3,000 Mbps at 10 GB.
For a full list of AWS announcements, be sure to keep an eye on the What’s New with AWS page.
Other AWS news
Here are some additional projects and news items that you may find interesting:
- Introducing Dogwood: Runtime Verification for AI Agents: AWS open-sourced Dogwood, a purpose-built governance language for AI agents to support Cedar policies and add temporal conditions. Powering Dogwood, Amazon Bedrock AgentCore introduced temporal policies whose decisions depend on the history of an agent’s actions within a session, not on the current request alone.
- AWS supports Agent Plugins: An Open Standard for Portable Agent Extensions: AWS announced support for Agent Plugins, an open source, vendor-neutral specification that gives AI agent extensions a common packaging format so you can package an extension once and ship it to any client, including Kiro, VS Code, Cursor, or any tool that implements the spec.
- Introducing Kiro Crew: Kiro Crew is a persistent, self-evolving workspace that keeps work moving, online or off, enabling collaborative multi-agent development workflows within the Kiro IDE. It’s built for engineering work that goes beyond a single chat session, and spans repos, tools, and days. You can run several efforts in parallel or hand work to subagents that report back, so nothing waits in line.
For a full list of AWS blog posts, be sure to keep an eye on the AWS Blogs page.
Learn more about AWS, browse and join upcoming AWS-led in-person and virtual events, startup events, and developer-focused events including AWS Summits and AWS Community Days. Join the AWS Builder Center to connect with builders, share solutions, and access content that supports your development.
That is all for this week. Check back next Monday for another Weekly Roundup!
— Channy
Trump & the DOJ #lastweektonight
Post Syndicated from LastWeekTonight original https://www.youtube.com/shorts/QEXdQcn7iDQ
[$] Even more formal verification for BPF
Post Syndicated from daroc original https://lwn.net/Articles/1087069/
BPF offers useful safety guarantees, but Kumar Kartikeya Dwivedi wants BPF
programs to be even safer. At the 2026
Linux Storage, Filesystem,
Memory-Management, and BPF Summit, he led a session
(slides)
discussing the possibility
of adding domain-specific invariants to BPF programs. It was not a discussion
intended to lead to the implementation of any particular kernel feature, but
rather an overview of why additional formal verification might be needed, and
how it could work with the existing BPF ecosystem.
Low-latency, high-throughput SQS event processing with AWS Lambda provisioned mode
Post Syndicated from Ben Freiberg original https://aws.amazon.com/blogs/compute/low-latency-high-throughput-sqs-event-processing-with-aws-lambda-provisioned-mode/
Customers building event-driven applications on AWS rely on Amazon Simple Queue Service (Amazon SQS) and AWS Lambda event source mappings (ESMs) to process millions of events every day. The fully managed polling infrastructure of ESMs eliminates the need to write and maintain custom code. You can focus on business logic while Lambda handles scaling, batching, and error handling automatically.
As workloads grow, many customers need to meet demanding requirements for low-latency message processing, high-concurrency execution, and high-throughput event processing. Use cases such as real-time payment processing, fraud detection, IoT telemetry pipelines, and flash-sale order fulfillment require the ESM to scale rapidly and sustain peak performance without queue backlog.
To address these needs, AWS launched provisioned mode for SQS event source mappings. Provisioned mode gives you direct control over the number of event pollers assigned to your ESM for predictable and rapid scaling. With Provisioned mode, you can configure event pollers up to 10,000, supporting concurrency of up to 100,000 concurrent Lambda executions and throughput of 10 GB/s. You can process up to a million events per second.
Provisioned mode is also available for Apache Kafka event source mappings including Amazon Managed Streaming for Apache Kafka (Amazon MSK) and self-managed Kafka.
How SQS event source mappings work
When you configure an SQS queue as an event source for a Lambda function, Lambda automatically creates an ESM resource. The ESM manages a fleet of internal event pollers that continuously poll the SQS queue, retrieve messages, and invoke your Lambda function with batches of events.
In default ESM mode, Lambda automatically manages the number of event pollers based on queue depth and processing throughput. The system starts with five pollers and scales up as the queue backlog builds, supporting up to 1,250 concurrent invocations. This automatic scaling works well for the majority of event processing workloads. However, the scale-up rate in default mode (approximately 300 additional concurrent executions per minute) can leave latency-sensitive workloads with growing queue backlogs during sudden traffic spikes.
What is provisioned mode?
Provisioned mode gives you explicit control over the minimum and maximum number of event pollers assigned to your ESM. Instead of relying solely on automatic scaling, you define:
MinimumPollers: the number of event pollers always active and ready to process messages (range: 2–200).MaximumPollers: the upper bound on event pollers the ESM can scale to (range: 2–10,000).
These pollers remain active and continuously poll your SQS queue, eliminating cold-start delays in the polling infrastructure. When traffic spikes arrive, your ESM already has capacity allocated to handle the burst.
Default mode vs. provisioned mode
| Attribute | Default mode | Provisioned mode |
| Minimum event pollers | 2 | 2 |
| Maximum event pollers | 5 | 10,000 |
| Maximum concurrent executions | Up to 1250 | Up to 100,000 |
| Maximum throughput | N/A | 10 GB/s |
| Scale-up rate | ~300 concurrency/min | ~1,000 concurrency/min |
| Poller control | Lambda controlled | Min/Max configurable by you |
| Billing | Included in Lambda pricing | Event poller unit (EPU) hours |
| Best for | Majority of workloads | Spiky, latency-sensitive, high-throughput workloads |
Activating provisioned mode for ESM
You can configure provisioned mode when creating a new ESM or updating an existing one. The following examples show configuration using the AWS CLI, AWS Serverless Application Model (SAM), and AWS CloudFormation.
AWS CLI
Create a new ESM with provisioned mode:
Update an existing ESM to enable provisioned mode:
AWS SAM template
AWS CloudFormation
Provisioned mode for SQS ESM in action
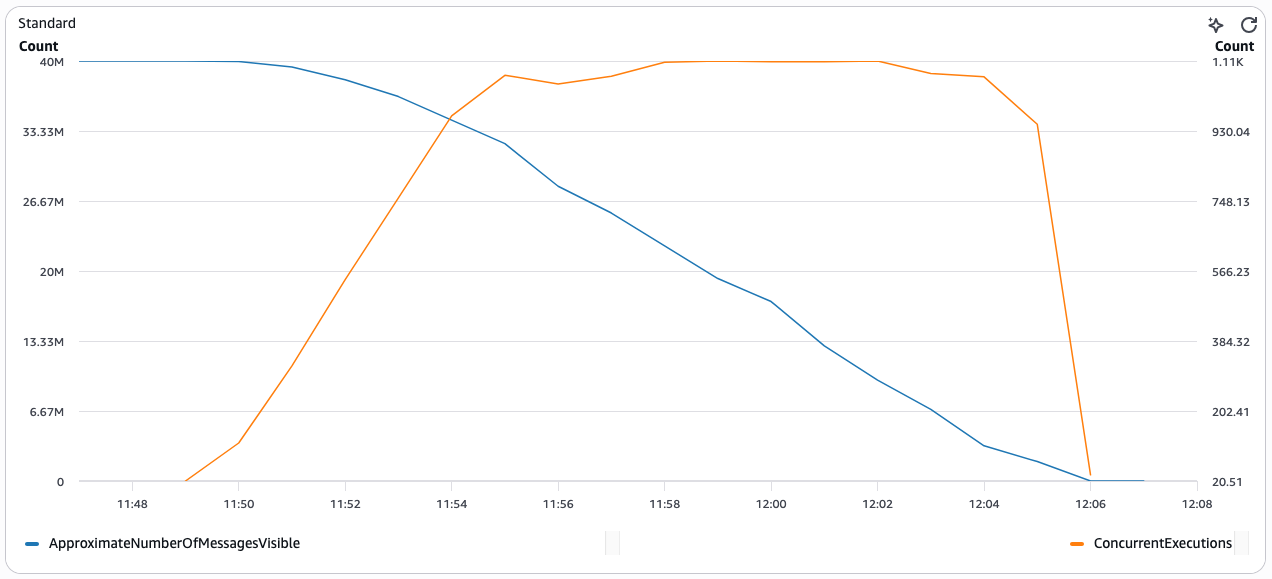
To see the performance profile with provisioned mode for SQS, deploy a Lambda function that has an SQS queue as its trigger. Use the reference pattern on Serverless Land or follow the Creating and configuring an Amazon SQS event source mapping guide to configure provisioned mode for your SQS event source mapping. In the following scenarios, a producer writes 40 million messages, each with a 1 KB payload size, to an SQS queue. Batch size is set to 10, with function duration at about 200 ms.
Scenario 1: Baseline (default mode)
The following chart shows the relationship between ApproximateNumberOfMessagesVisible (blue) and ConcurrentExecutions (orange) over time for the baseline scenario using default mode with no provisioned pollers. With provisioned mode disabled, Lambda takes approximately 17 minutes to drain the backlog of 40 million messages. It takes about 6 minutes to reach the maximum concurrent executions.
Scenario 2: Configuring minimum event pollers and auto-scaling
To optimize the ESM throughput for these kinds of workloads and reduce the time to drain the message backlog, set the minimum event pollers to a higher than default value. In this scenario, the minimum pollers are set to 100 and maximum pollers are set to 1000.
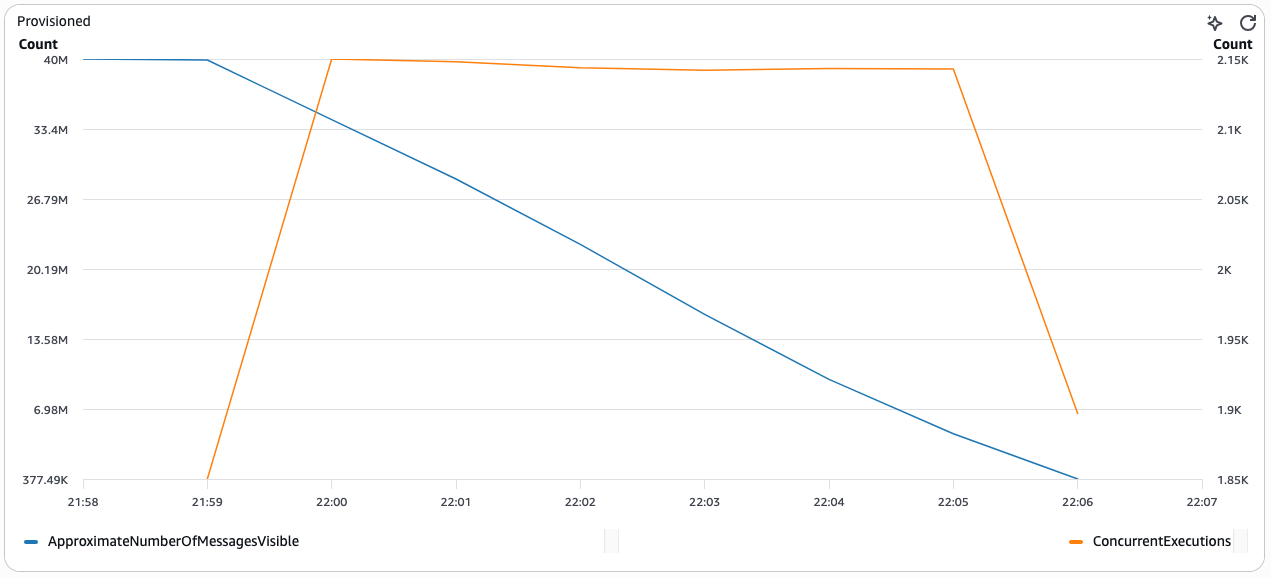
Lambda drains the backlog of 40 million messages in approximately 7 minutes. This is more than 55% faster than the baseline without provisioned mode. It takes only about 1 minute to reach maximum concurrent executions.
Scenario 3: Default minimum event pollers and auto-scaling
In some cases, the workload might not be as performance-sensitive. With the same volume of 40M messages in your SQS queue, activate provisioned mode for ESM. Start with the default minimum event pollers (set to 2) and let Lambda automatically scale the event pollers based on incoming traffic.
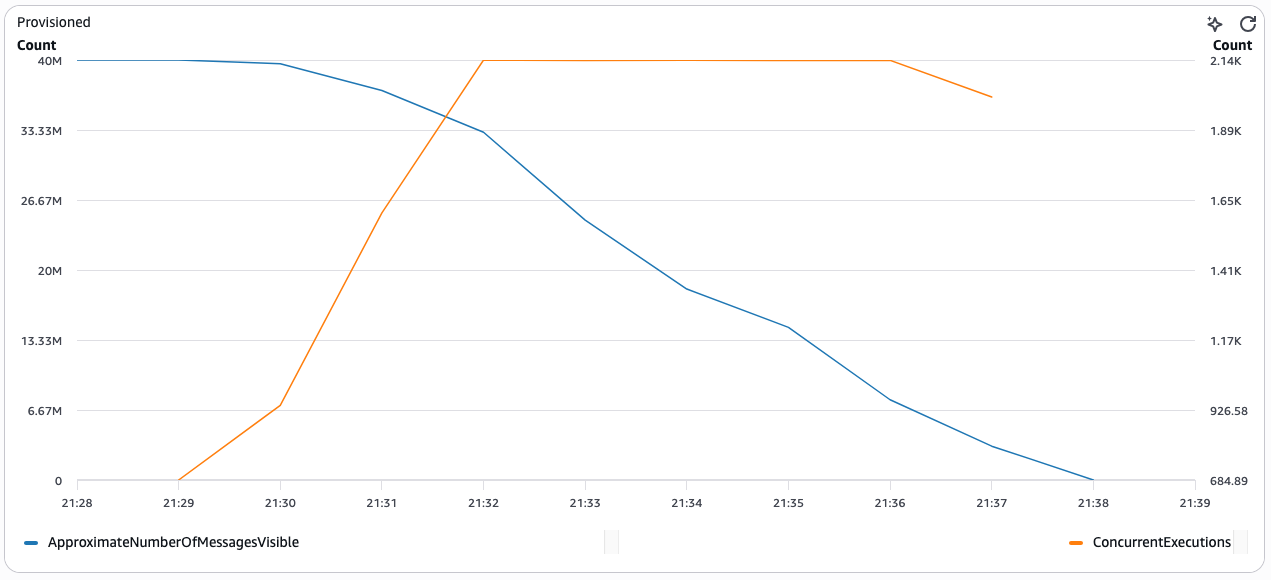
With this configuration, Lambda drains the backlog in approximately 9 minutes. This is still more than 45% faster than the baseline without provisioned mode. It takes about 3 minutes to reach maximum concurrent executions.
Best practices for configuring provisioned pollers
When configuring provisioned mode, keep the following recommendations in mind:
Right-size your minimum pollers
Each event poller supports up to 10 concurrent Lambda invocations and approximately 1 MB/s throughput. Use this formula to estimate your minimum poller count:
MinimumPollers = max(TargetConcurrency / 10, TargetThroughputMBps / 1)
For example, if your workload requires 500 concurrent executions and 200 MB/s throughput, set MinimumPollers to at least 200. To estimate the number of event pollers required to verify optimal message processing performance when using provisioned mode for SQS ESM, follow the steps described in determining the required event pollers.
Set maximum pollers for burst capacity
Set MaximumPollers to handle your peak traffic scenario. The ESM scales between your minimum and maximum based on queue depth. A good starting point is 2–5x your minimum pollers.
Align with Lambda concurrency limits
Provisioned pollers invoke your Lambda function concurrently. Verify that your account’s concurrent execution quota accommodates the maximum concurrency your pollers can drive:
MaxConcurrency = MaximumPollers × 10
If you set MaximumPollers to 5,000, your account needs at least 50,000 concurrent execution capacity. Request a quota increase through the Lambda quotas page if needed.
Start conservatively and iterate
Begin with a lower MinimumPollers value and monitor the CloudWatch metrics described in the following section. Increase the minimum if you observe queue depth growth during traffic spikes, or decrease it if pollers remain underutilized during off-peak hours.
Use FIFO queues for ordered workloads
When processing order-sensitive workloads, use FIFO queues with high-throughput mode activated. Provisioned mode works with both SQS standard and FIFO queue types.
Set up dead-letter queues
Configure dead-letter queues to manage messages that fail processing after multiple attempts.
Adjust batch size as needed
The batch size parameter remains adjustable, with a default value of 10 messages and a maximum of 10,000 messages for standard queues.
Cost considerations
Provisioned mode billing is based on event poller unit (EPU) hours. You pay for the number of provisioned pollers allocated, regardless of whether they are actively processing messages. See AWS Lambda pricing for details. Key optimization strategies are:
- Match minimum pollers to your sustained baseline traffic to avoid over-provisioning during low-traffic periods.
- Use maximum pollers for burst capacity as you only pay for pollers that scale up while they are active.
Monitoring provisioned mode with CloudWatch
Lambda publishes the following CloudWatch metrics for provisioned mode ESMs:
| Metric | Description |
| ProvisionedPollers | Current number of provisioned event pollers allocated |
| ConcurrentExecutions | Number of concurrent Lambda invocations driven by the ESM |
| ApproximateNumberOfMessagesVisible | SQS queue depth (from SQS metrics) |
| Duration | Function execution time per invocation |
Set CloudWatch alarms on ApproximateNumberOfMessagesVisible to detect queue backlogs, and on ProvisionedPollers to track the number of provisioned pollers. To understand how your ESM processes messages at each stage, from polling through invocation to completion, opt in to the EventCount metric group. This provides detailed metrics including PolledEventCount, FilteredOutEventCount, InvokedEventCount, FailedInvokeEventCount, and DeletedEventCount.
Conclusion
Provisioned mode for SQS event source mappings gives you control over scaling behavior for your most demanding workloads. By configuring minimum and maximum event pollers, you achieve predictable low-latency processing, scale to 100,000 concurrent executions, and sustain throughput of up to a million events per second, without waiting for automatic scale-up.
Dedicated pollers deliver predictable, low-latency performance. This makes them well-suited for workloads like real-time financial transactions, high-volume IoT data ingestion, or flash sale order processing. You can achieve 3x faster scaling compared to default mode. Combined with CloudWatch observability and flexible configuration through CLI, SAM, and CloudFormation, provisioned mode integrates into your existing deployment workflows.
To get started, explore the provisioned mode configuration guide for SQS event source mappings. Deploy the sample application from the Serverless Land reference pattern. To request a concurrent execution quota increase for high-throughput workloads, visit the Lambda quotas page.
Django moves to an annual release cycle
Post Syndicated from jzb original https://lwn.net/Articles/1088059/
The Django Python web-framework
project has announced
that it has accepted an annual
release cycle proposal. This means that the project is moving from a somewhat
complicated schedule that interspersed short-lived feature releases and
long-term-support (LTS) releases to a simpler annual cycle where each release is
supported for three years.
Every feature release gets three years of support: one year of mainstream
bugfixes, then two years of security and data-loss fixes. The “LTS” label is
retired — every feature release now carries that same, unique commitment.No more LTS gap: no racing a deadline to jump two years of changes at
once. Upgrade one year at a time, whenever suits you within the support
window. Three versions are supported at any time, giving third-party packages a
clear, rolling target.
This will take effect with the upcoming Django 2028 release, expected in
January 2028.
Security updates for Monday
Post Syndicated from jzb original https://lwn.net/Articles/1088057/
Security updates have been issued by AlmaLinux (firefox, gpsd-minimal, kernel, libarchive, libgcrypt, and LibRaw), Debian (bind9, ca-certificates, chromium, dnsdist, icinga2, kitty, libheif, openjdk-21, pdns, pdns-recursor, thunderbird, and xen), Fedora (bird, erlang, kernel, mingw-glib2, nghttp2, p11-kit, perl, perl-Devel-Cover, perl-PAR-Packer, pgadmin4, polymake, python-nh3, python-wsgidav, python3.12, rabbitmq-server, rust-ammonia, seamonkey, and udisks2), Mageia (python-starlette), Oracle (gnutls, kernel, and LibRaw), Red Hat (container-tools:rhel8), Slackware (wpa_supplicant), and SUSE (azure-storage-azcopy, bouncycastle, ffmpeg-4, fuse-overlayfs, gleam, gstreamer-plugins-bad, libssh2-1, libssh2_org, libwireshark19, libXfont2-2, perl-Mojo-JWT, perl-Mojolicious, podman, python310, python313-Django4, and tekton-cli).
Serving the most critical missions: Cloudflare for Government achieves FedRAMP Class D (High) Certified status
Post Syndicated from Wesley Evans original https://blog.cloudflare.com/fedramp-class-d-certification/
We believe the Internet must be a force for good, and that it requires a foundation of trust. Nowhere is that trust more critical than in public service. Government agencies are the stewards of a nation’s most sensitive data. They protect national security, critical infrastructure, and the personal information of every citizen.
Cloudflare’s mission is to help build a better Internet. A key part of that mission is giving public sector agencies the best technology to stay secure, fast, and reliable. That means meeting the highest possible standards.
Today, we are proud to announce a major milestone: Cloudflare for Government has achieved FedRAMP Class D (High) certification status. We are honored to take this step with our sponsoring agency, the National Institute of Standards and Technology, whose global mission demands the highest level of security.
We are also very excited to announce that we are using the new systems we developed for FedRAMP High as the foundation of our commitment to pursuing U.S. Department of Defense Impact Level 4 (DoD IL4) authorization. IL4 is the department’s cybersecurity standard for systems handling controlled, unclassified data. We are confident that bringing our global network to this space will change the pace of innovation in the defense community.
What is FedRAMP, and why does being “certified” matter?
The Federal Risk and Authorization Management Program (FedRAMP) is a U.S. government-wide program that provides a rigorous, standardized approach to security assessment, authorization, and continuous monitoring for cloud products and services.
Think of FedRAMP as the gold standard for security in the U.S. government. Achieving "certified" status is a formal milestone. It means a federal agency has vetted our capabilities, sponsored our full authorization, and had that authorization verified by the FedRAMP Program Management Office.
We achieved FedRAMP Moderate authorization in 2022, but moving from Moderate to High is not an incremental step. It is a substantial increase in both complexity of the requirements we have to meet and the impact of what would happen if we were to have a breach of those controls. For instance:
- FedRAMP Class C (Moderate) is for systems where a compromise could have a serious adverse effect. Think of offerings like the National Park Service’s admission system.
- FedRAMP Class D (High) is for the nation's most sensitive unclassified data. This is data related to law enforcement, emergency services, financial systems, and national security. A compromise here could be catastrophic, potentially leading to a loss of life or threatening the economic or national security of the country.
One unified platform running on one global network
For years, the standard approach for technology companies serving the public sector and the defense community was to build a separate, isolated, and often pared-down version of their commercial platform. The intention was good, but the result was often technology islands: isolated environments that frequently lagged years behind the pace of innovation. Federal agencies and contractors have been forced to choose between modern features and stringent compliance.
We made a fundamentally different architectural decision on day one. Cloudflare operates a single, global network, with the same software stack running in every one of our data centers worldwide. We have built our FedRAMP High offering on those same machines, running the same services, using software-defined regionality. Instead of an isolated environment, Cloudflare for Government – FedRAMP High is built with the same network that powers Cloudflare today. Achieving FedRAMP High certification is a powerful validation of that core principle.
So how do we meet the stringent data residency and handling requirements for FedRAMP High on a global network? The key is our Data Localization Suite. It allows us to apply precise, software-defined controls to how and where data is processed and stored. For our FedRAMP High services, we can ensure that all traffic inspection and processing occurs exclusively within our U.S. data centers.
Federal agencies don't have to settle for a watered-down version of our platform. Within the United States, they get the exact same cutting-edge technologies as our most innovative enterprise customers. Federal agencies will get our latest Zero Trust security tools, our industry-leading application performance, and our newest developer product features when they are released.
When we began the FedRAMP process, we designed our systems with FedRAMP High and DoD IL4 controls in mind. We are excited that the same systems that power our global network and FedRAMP High will be the backbone of our DoD IL4 offering. For the defense community, this means that the pace of innovation in response to modern threats is no longer constrained by the pace of release-isolated government clouds.
The future of public sector modernization
Our investment in FedRAMP High isn't just about achieving a compliance certification. It’s about helping to build a better Internet that includes the most critical applications on the planet. Now that we have achieved FedRAMP High authorization, we hope to help federal agencies move to a modern Zero Trust security architecture, protect their infrastructure from the most sophisticated DDoS attacks, and deliver faster, more resilient digital services.
Cloudflare is proud to work with agencies across the U.S. government, including the Department of State and the Department of Commerce, among many others. This milestone deepens that commitment.
To learn more about what this means for the public sector, please visit our Cloudflare for Government page.
The Internet Is More Image-Focused Than Ever
Post Syndicated from The Atlantic original https://www.youtube.com/watch?v=8HInU_0UhOk
The 28th Infantry Dvision and the Battle of Fismette: 1918
Post Syndicated from The History Guy: History Deserves to Be Remembered original https://www.youtube.com/watch?v=mNPOI4_xpCA
Automate SageMaker HyperPod incident triage and root-cause-analysis with AWS DevOps Agent
Post Syndicated from Tomonori Shimomura original https://aws.amazon.com/blogs/devops/automate-sagemaker-hyperpod-incident-triage-and-root-cause-analysis-with-aws-devops-agent/
Introduction
Large-scale machine learning workloads: training, fine-tuning, and inference run on clusters of hundreds to thousands of GPU instances for days or weeks at a stretch. Keeping operational visibility across a fleet of this size is a constant challenge: hardware health events, node lifecycle transitions, capacity fluctuations, and workload-level issues appear in the event stream around the clock, including nights and weekends.
Amazon SageMaker HyperPod is a purpose-built managed cluster service that lets you run distributed model training, fine-tuning, and inference across hundreds of accelerated instances. It provides built-in resiliency that automatically detects and replaces faulty hardware, so long-running jobs can continue with minimal interruption.
For teams operating these clusters, the scale still creates a fundamental tension: you need continuous visibility into your fleet, but you can’t afford to keep engineers watching the event stream 24/7.
What HyperPod resiliency already handles
SageMaker HyperPod’s built-in resiliency layer automatically detects and self-heals instance-level GPU failures. When the Health Monitoring Agent (HMA) identifies a bad GPU, the HyperPod resiliency layer drains, reboots, or replaces the node depending on the error type, and the job resumes without human intervention. This is exactly what you want: routine hardware failures are handled automatically so your training runs keep going.
This solution does not replace HMA or any part of HyperPod’s resiliency. It adds an autonomous investigation layer on top, using the cluster events and health signals that HMA and HyperPod already produce as its input.
Operational conditions where a human still wants to be in the loop
With that self-healing in place, there are operational conditions where a human still wants to be in the loop or decide:
- Configuration issues: a lifecycle-script change you made, a misconfigured mount, or a networking/security change that causes provisioning failures on every new node.
- Capacity conditions: a replacement waiting on capacity in the pool, where the operator needs to know recovery is in flight and can decide whether to intervene.
- Recurring hardware faults: each fault self-heals correctly, but the same GPU error signature recurring across three or more replacements on one instance group in a week is a pattern worth surfacing to an operator as a single signal.
- Workload-level conditions: Pods stuck in CrashLoopBackOff for hours, nodes sitting NotReady, or GPU allocation chronically low.
Without automation, these conditions push operators into round-the-clock manual triage: correlating events across the SageMaker control plane, Amazon EKS, and Amazon CloudWatch, and deciding whether HyperPod is still recovering or needs a hand.
Opportunity: AWS DevOps Agent as a 24/7 companion
AWS DevOps Agent provides an autonomous incident-response platform that can be taught a domain’s operational model through custom skills. By wiring your HyperPod cluster into DevOps Agent, you get a 24/7 companion that complements HyperPod’s self-healing. It watches for the operational conditions that still need a human decision, triaging them, root-causing them, and delivering a clear verdict with recommended actions.
By design, DevOps Agent is configured to run in observe-and-report mode for this integration – it is not granted SSM, SSH, or action-taking permissions against your cluster or its nodes. The agent reads cluster events, control-plane state, Kubernetes objects, and CloudWatch logs to reconstruct what happened; every corrective action (node reboots, replacements, drains) continues to be performed by HyperPod’s own resiliency layer or by an operator responding to the emailed verdict. This read-only boundary is deliberate: it keeps the agent’s blast radius zero while still delivering the correlation and triage value.
In this post, you will learn how to connect any SageMaker HyperPod cluster (either the EKS or Slurm Orchestrator option) to AWS DevOps Agent. Conditions are auto-detected, triaged, root-caused from cluster state and CloudWatch logs, and emailed as a clear verdict. You will also see how the solution can be extended to detect additional conditions specific to your workloads.
Solution Overview
What this solution delivers
This solution wires any SageMaker HyperPod cluster into AWS DevOps Agent so that operational conditions calling for a human decision are auto-detected, triaged, root-caused, and delivered as a human-readable verdict email. Specifically, you get:
- Autodetection of HyperPod conditions that complement resiliency self-healing, from the live SageMaker event stream and a periodic Kubernetes-state audit.
- Triage + root-cause analysis by the DevOps Agent, taught HyperPod’s operational model via two custom skills. It reconstructs the incident timeline and decides whether HyperPod is still recovering or needs an operator.
- Human-readable verdict emails: Monitor (recovery in flight, here’s the ETA), Escalate (you need to act, here’s why and what to do), or Resolved (auto-recovery closed the loop). Noise is filtered out.
- Extensibility: customize what conditions are detected (by modifying the periodic-audit Lambda) and how the agent reasons about them (by editing the plain-English skills).
The following screenshot shows the DevOps Agent incident response dashboard with example verdict emails for three common fault types:
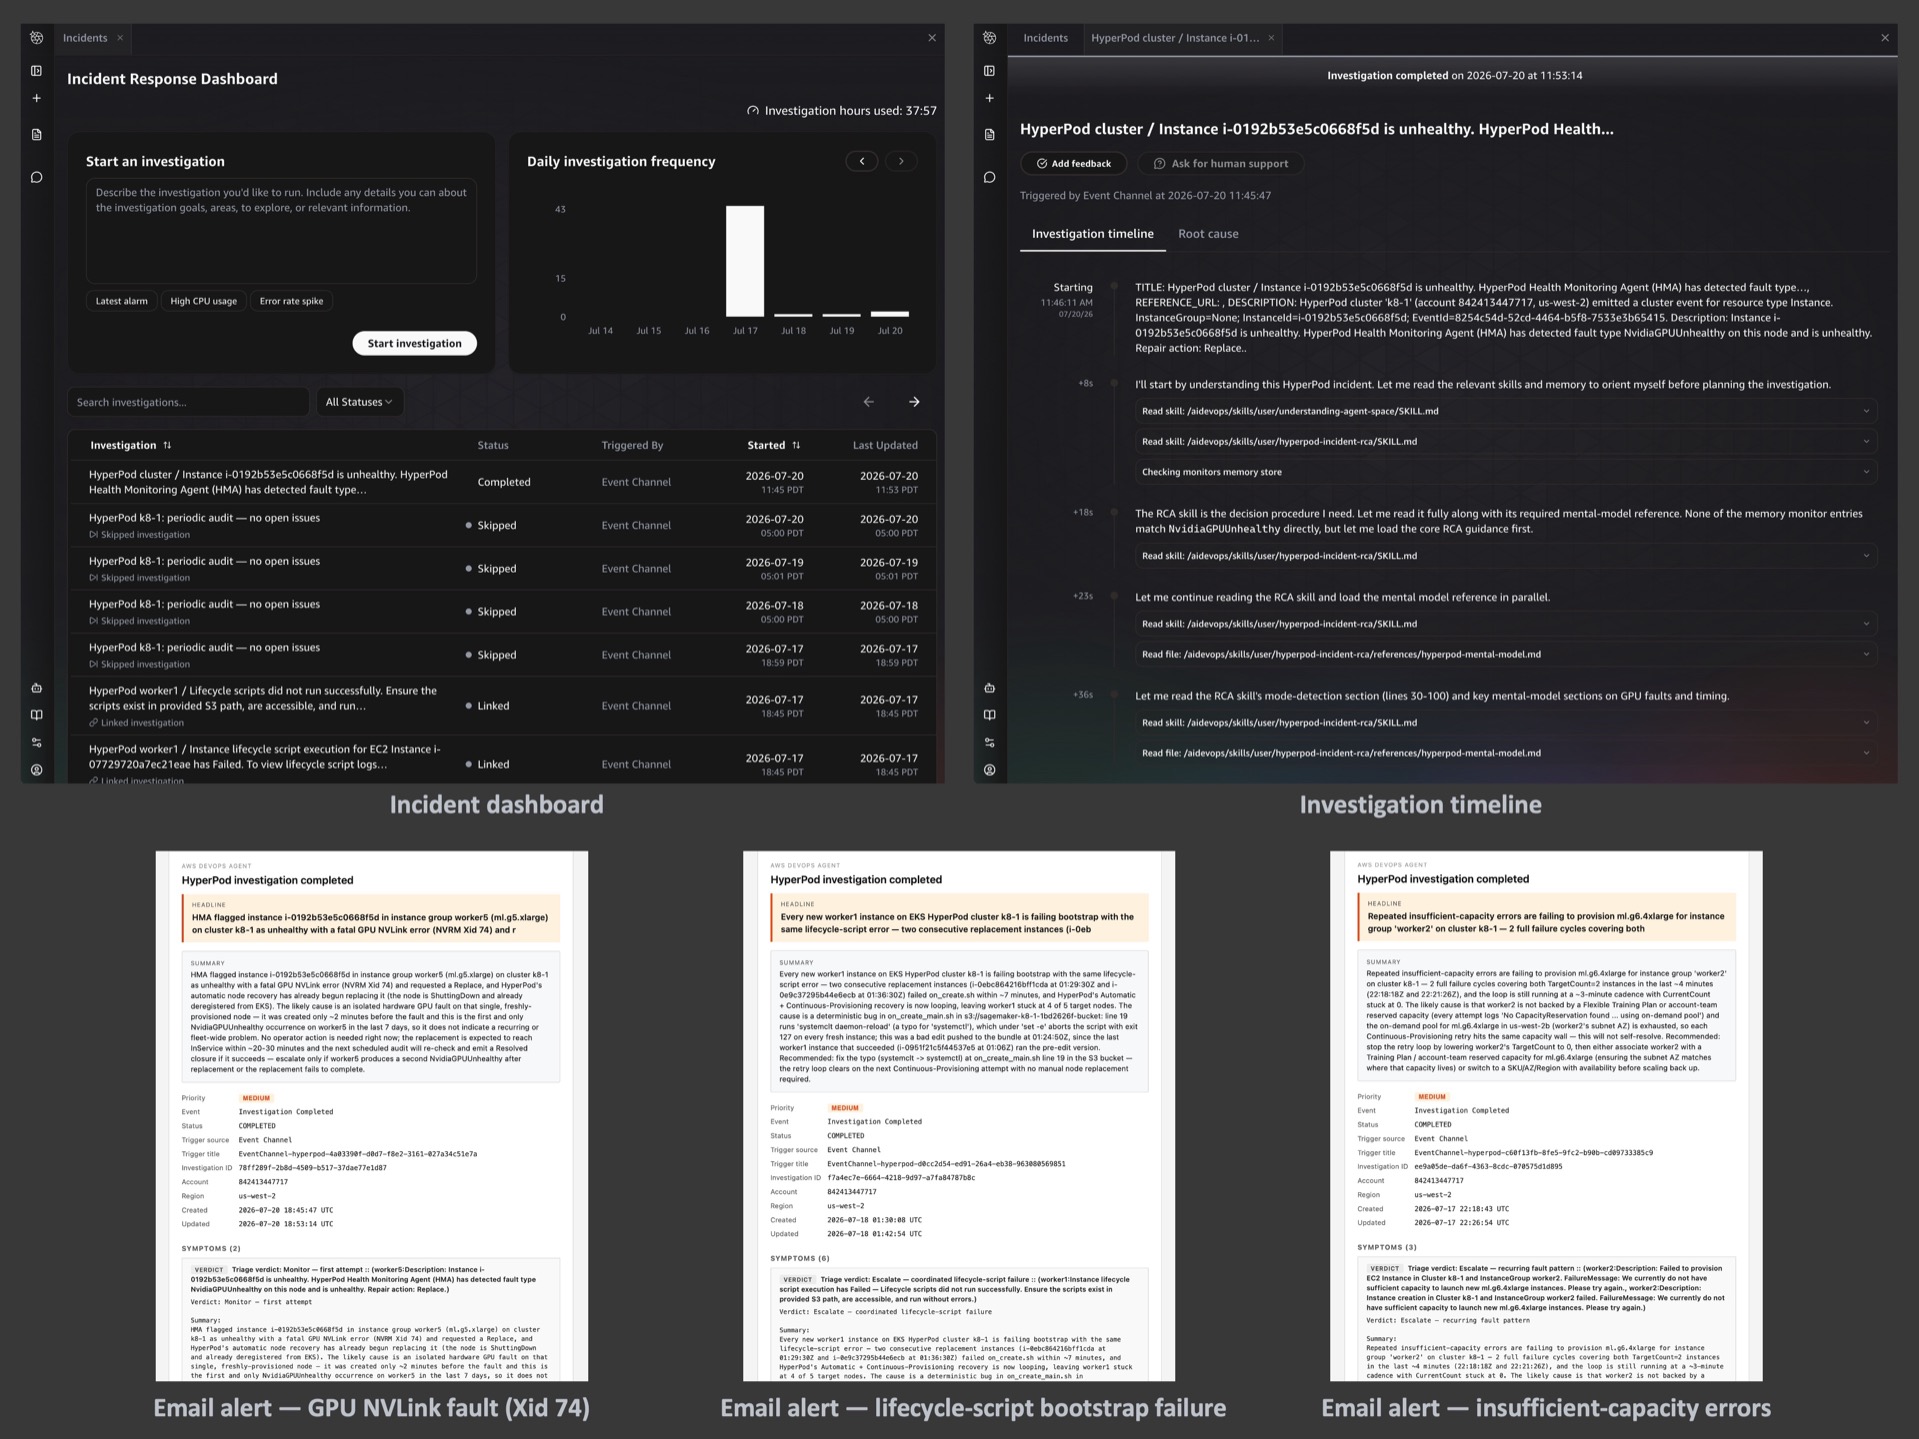
DevOps Agent incident response dashboard showing investigation list and timeline, with three email verdict examples for GPU NVLink fault, lifecycle-script bootstrap failure, and insufficient-capacity errors
Architecture
The whole solution deploys one AWS CloudFormation stack per cluster. Two event paths feed the DevOps Agent, and one path carries its verdicts back out to you.
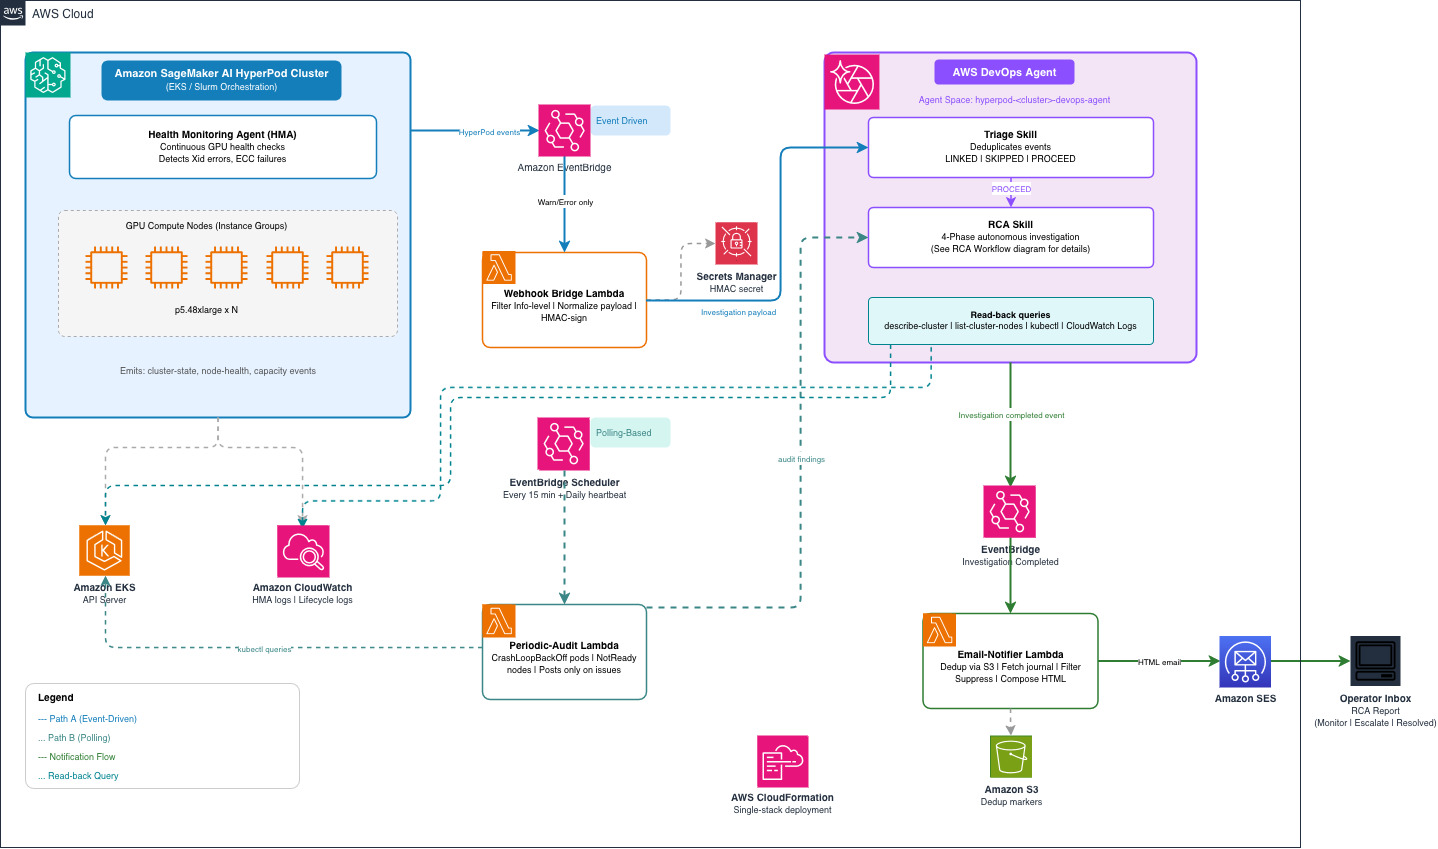
Architecture diagram showing the event flow from HyperPod Health Monitoring Agent through EventBridge to DevOps Agent and email notification
This architecture shows a 1:1 relationship between a HyperPod cluster and a DevOps Agent space, and the deployment instructions in this post follow that model. If you need to associate multiple clusters with a single Agent Space, you can customize the CloudFormation template and the ClusterFilter parameter to widen the allowlist of cluster names forwarded by the webhook bridge.
Event flow
- Event-driven issue detection: HyperPod emits cluster-state, node-health, and capacity events to Amazon EventBridge. The webhook bridge Lambda drops routine Info-level noise, maps the rest into a DevOps Agent investigation payload, signs it with HMAC-SHA256 using a shared secret stored in AWS Secrets Manager, and POSTs it to the agent’s generic webhook.
- Polling-based issue detection: A periodic-audit Lambda checks Kubernetes state (CrashLoopBackOff pods, NotReady nodes) every 15 minutes and fires only when it finds a real issue, plus a daily heartbeat confirming the pipeline is alive. On a healthy cluster, nothing is POSTed, so no investigation runs and no cost is incurred.
- Investigation: DevOps Agent receives the payload and runs two custom skills: the triage skill decides whether to link (duplicate), skip (noise), or proceed (investigate). The RCA skill reconstructs the timeline using describe-cluster, list-cluster-nodes, list-cluster-events, kubectl, and CloudWatch logs (HMA health monitoring, lifecycle scripts), then classifies the incident as Suppress, Monitor, Escalate, or Resolved.
- Notification: An Amazon Lambda function sends notification emails via Amazon SES. It listens on the
aws.aidevopsevent stream for investigation completions, reads the verdict from the agent’s journal, and sends an email with the headline, what happened, likely cause, and recommended action. Suppress verdicts are filtered to avoid noise on healthy clusters.
Getting started
For a step-by-step walkthrough to deploy this solution, visit the DevOps Agent Integration guide. Once you have the solution running, the following sections explain how to customize detection, reasoning, and notifications for your environment.
Prerequisites
- An AWS account with AWS CLI v2 configured for the target region.
- An existing SageMaker HyperPod cluster (EKS or Slurm orchestrator).
- IAM permissions to create roles, deploy CloudFormation, manage Secrets Manager, and call devops-agent:* and eks:CreateAccessEntry.
- For email notifications: a verified Amazon SES sender identity. You can verify an email address in the Amazon SES console or with the AWS CLI. After running the command below, the address owner will receive a verification email and must click the confirmation link:
Recipients must also be verified if your SES account is still in sandbox mode.
Deploying with CloudFormation
The solution deploys as a single CloudFormation stack. Clone the awsome-distributed-ai repository, create a params.json with your cluster name and email settings, and run:
This provisions the Agent Space with read-only EKS access (auto-discovered from the cluster’s orchestrator ARN), the EventBridge rule and webhook bridge Lambda, the periodic-audit scheduler, and the email notifier. For Slurm-orchestrated clusters, the EKS access step is skipped automatically.
The webhook bridge — mapping HyperPod events to DevOps Agent
An EventBridge rule captures HyperPod events and invokes a Lambda function. The Lambda forwards all Warn and Error level events, normalizing each into a DevOps Agent investigation payload. It extracts the failure message, instance group, and event metadata, then signs it with HMAC using a shared secret stored in AWS Secrets Manager, and POSTs it to the agent’s generic webhook endpoint. Info-level events are dropped at the bridge to avoid creating investigations for routine status updates.
A cluster allowlist parameter lets you scope which HyperPod clusters trigger investigations, useful when multiple clusters share the same account and region.
How the skills are defined — teaching the agent HyperPod’s operational model
AWS DevOps Agent skills are plain-English instructions that teach the agent how to reason about a domain. This solution includes two complementary skills:
Triage skill — LINKED / SKIPPED / PROCEED (view the skill document)
The triage skill runs first on every incoming task. It decides whether to link the event to an existing investigation, skip it, or proceed to a full investigation.
- Why triage matters — a concrete example: When a single node fails, HyperPod’s replacement process emits multiple events in quick succession: “lost orchestration-ready status,” “provisioning started,” “capacity request initiated.” Without triage, each event would spawn a separate investigation. The triage skill recognizes these events belong to the same incident (same instance group + overlapping time window) and links them, so only one investigation runs. This saves investigation compute and avoids duplicate emails.
- When to SKIP: When a node is already being replaced and a follow-up “lost orchestration-ready status” event arrives with a generic “Request to service failed” message, the triage skill recognizes that a replacement is already in progress for that instance group and skips the event. No new investigation is created for what is simply a progress update of an existing recovery.
RCA skill — timeline reconstruction and verdict (view the skill document)
When triage produces PROCEED, the RCA skill takes over. It reads cluster state, events, and logs, reconstructs an incident timeline, and classifies the situation into one of four verdicts:
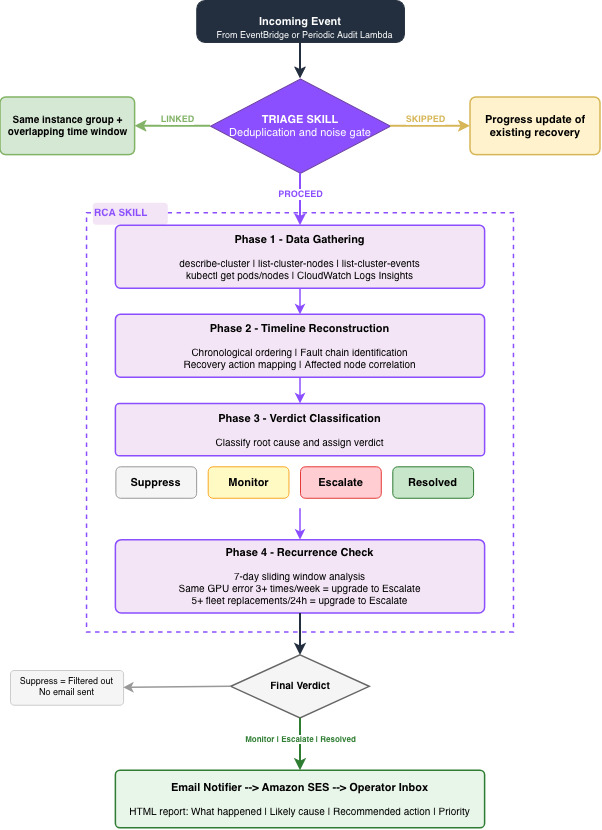
RCA Flowchart showing the four phases of root-cause analysis: data gathering, timeline reconstruction, classification, and recurrence check
- Phase 1 — Data gathering: The skill reads describe-cluster, list-cluster-nodes, list-cluster-events, and CloudWatch log streams (HMA health monitoring, lifecycle scripts) to collect the raw facts.
- Phase 2 — Timeline reconstruction: It orders events chronologically and identifies the fault chain: what triggered what, which nodes were affected, and what recovery actions HyperPod took.
- Phase 3 — Classification: Based on the timeline, recurrence statistics, and HyperPod’s resiliency behavior, it assigns a verdict:
- Suppress — a non-issue (for example, a transient event that has already resolved).
-
- Monitor — recovery is in flight; here’s the expected resolution window.
-
- Escalate — you need to act; here’s the root cause and recommended action.
- Resolved — auto-recovery closed the loop; no action needed.
- Phase 4 — Recurrence check: The skill computes sliding-window statistics over the one week cluster event history. When thresholds are crossed, the verdict escalates to alert the operator of a systemic pattern. For example, the same GPU error signature on the same instance group three or more times in a week, or five or more replacements fleet-wide in 24 hours.
The verdict is written to the agent’s investigation journal along with a human-readable report containing what happened, the likely cause, and recommended operator actions.
The periodic-audit Lambda — Kubernetes state monitoring
The periodic-audit Lambda fires every 15 minutes and inspects Kubernetes Pod/Node state directly (via the EKS API server). It checks for:
- Pods in CrashLoopBackOff (default: flagged when restart count reaches five and the last crash is within 15 minutes)
- NotReady nodes (default: flagged when a node has been NotReady for at least 15 minutes and at least 10% of nodes are affected)
Namespace-aware filtering controls which pods are checked:
- Pods in
kube-publicandkube-node-leaseare ignored entirely by default.
- Pods in
kube-system,aws-hyperpod, andamazon-cloudwatchare tagged as system-workload issues (distinct from user-workload issues in the verdict).
All thresholds and namespace lists are configurable via the CloudFormation stack parameters.
The Lambda POSTs a webhook event to DevOps Agent only when a real issue is found. On a healthy cluster, nothing is POSTed, so no investigation runs and no cost is incurred. A separate daily heartbeat schedule confirms the monitoring pipeline itself is alive. The heartbeat is visible in the DevOps Agent console but deliberately not emailed on healthy runs — so silence in your inbox means the cluster is healthy, not that the pipeline is broken.
Note: HyperPod infrastructure faults (node health, capacity errors, lifecycle-script failures) are handled event-driven by the webhook bridge. They come from the native HyperPod event stream in EventBridge. The periodic audit deliberately does not duplicate that path; it only covers Kubernetes workload state, which is not in the HyperPod event stream.
Closing the loop — the email notifier
An EventBridge rule on the aws.aidevops event stream captures investigation lifecycle events. The email-notifier Lambda processes these events through the following steps:
- Event filtering: Only “Investigation Completed” events are processed (one email per investigation lifecycle). The event payload contains the agent_space_id, task_id, and execution_id.
- Dedup: The Lambda checks an S3 marker at
s3://<bucket>/emailed/<execution_id>. If present, this investigation has already been emailed and the event is dropped. This prevents duplicate emails when the same completion event is re-emitted. - Fetching the investigation context: The Lambda calls two DevOps Agent APIs:
get_backlog_task(agentSpaceId, taskId)— retrieves the task metadata (title, priority, timestamps).list_journal_records(agentSpaceId, executionId)— retrieves the investigation’s findings, symptoms, and investigation gaps from the agent’s journal.
- Suppress-verdict filtering: If the investigation produced a Suppress verdict or no findings at all, no email is sent.
- Email composition: The Lambda composes a single HTML email from the journal records: a short headline followed by a one-paragraph summary covering what happened, the likely cause, and the recommended action.
- Send via SES: The formatted email is sent to the configured recipients. After successful delivery, the S3 dedup marker is written.
The operator also has access to the full investigation in the DevOps Agent web console (see following “Viewing investigations” section).
Viewing investigations in the DevOps Agent console
For readers new to AWS DevOps Agent, here’s how to navigate to your investigations:
- Open the AWS DevOps Agent console.
- Select your Agent Space (named
hyperpod-<cluster-name>-devops-agentby default). - From the Launch web app drop-down, choose an option to open the DevOps Agent web app.
- Select Incidents from the left navigation pane to open the Incident Response Dashboard. It lists all investigations with their subject, status, and timestamp.
- Select any investigation to see its full timeline, journal records, and the verdict report.
Asking the agent directly — the DevOps Agent Chat UI
Beyond the automated emails, you don’t have to wait for the next investigation to get answers about your cluster. You can open the DevOps Agent’s AI chat at any time and ask follow-up questions in plain English. The agent answers from the live cluster state, the investigation history, and the skills it has been taught.
For example:
- “I got an email about a GPU failure in my cluster. Did it get resolved now with HyperPod’s resiliency?” — The agent checks the current cluster state, confirms whether the replacement succeeded, and provides a timeline of what happened (HMA detection → replacement initiated → node back in service), along with anything to watch for.
- “Are there unhealthy Pods on my cluster?” — The agent inspects the Kubernetes state and reports any CrashLoopBackOff pods or NotReady nodes.
- “I just triggered scaling up. Check if it is progressing well.” — The agent looks at the cluster’s current node counts vs. target counts and reports whether provisioning is on track.
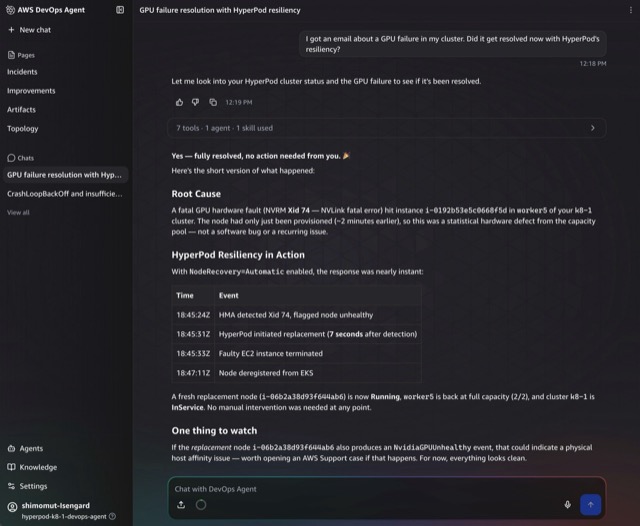
AWS DevOps Agent chat interface showing a natural language query about cluster health
The chat conversations are stored per Agent Space, so you can revisit past interactions alongside the automated investigations. This makes the Agent Space a single pane of glass for both automated incident response and ad-hoc troubleshooting of your HyperPod cluster.
Extending the solution — detection vs. reasoning
The solution has two extension points, which serve different purposes:
- Extending detection (what conditions are caught):
- Event-driven path: The webhook bridge Lambda drops Info-level events and forwards all
WarnandErrorlevel HyperPod events to DevOps Agent. This typically does not need modification. It already catches all actionable events. - Polling-based path: The periodic-audit Lambda checks Kubernetes state. To detect additional conditions (for example, GPU allocation below a threshold or specific Pod labels stuck in error states), add that logic to the Lambda code.
- Event-driven path: The webhook bridge Lambda drops Info-level events and forwards all
- Extending reasoning (how the agent investigates and classifies): edit the plain-English skill definitions. For example, you can teach the RCA skill new classification rules, add domain-specific context about your workload’s expected behavior, or adjust the recurrence thresholds.
Detection is code; reasoning is natural language. Both are in the repo and designed to be customized independently.
Investigation feedback
After each investigation completes, a Feedback button appears in the DevOps Agent console. Clicking it opens the Investigation feedback dialog, where you can:
- Rate whether the root cause was correct
- Indicate whether human steering was needed during the investigation
- Provide written feedback explaining what could be improved
This structured feedback is stored per investigation. An auto-learning mechanism that uses this feedback to improve future investigations is actively being developed.
DevOps Agent APIs used by this solution
For readers interested in the programmatic integration, here are the key DevOps Agent APIs this solution calls:
| Component | API | Purpose |
| Webhook provisioner (deployment) | register_service | Register the generic webhook service with DevOps Agent |
| Webhook provisioner (deployment) | associate_service | Associate the webhook with the Agent Space |
| Skill uploader (deployment) | list_assets | Check if a skill already exists |
| Skill uploader (deployment) | create_asset / update_asset | Upload or update the triage and RCA skill definitions |
| Email notifier (runtime) | get_backlog_task | Retrieve task metadata (title, priority, timestamps) |
| Email notifier (runtime) | list_journal_records | Retrieve findings, symptoms, and gaps from the investigation journal |
| Teardown | disassociate_service / deregister_service / delete_asset | Clean up on stack deletion |
Cleaning up
To remove all resources created by this solution, run:
This deletes the CloudFormation stack, removes the Agent Space, EKS access entries, secrets, and email configuration.
Additionally, if you no longer need the prerequisite resources, you can revert their setup, for example, deleting the verified Amazon SES email address identities you created for notifications.
Cost considerations
This solution is designed to be near-zero cost on a healthy cluster and scales proportionally with fault volume. Cost scales with fault volume, not node count directly. At large scale (100+ nodes), the triage skill becomes critical. A single hardware fault can generate 5-10 correlated EventBridge events, most of which are filtered by the webhook bridge Lambda before reaching the agent. Where triage adds value is linking and deduplicating across similar faults that affect multiple instances, or repeated faults on the same instance over time, consolidating them into a single investigation instead of many. As an example, a 500-node training cluster might see 20-50 investigations per month after filtering and deduplication.
- Filtering and triage are your cost savers at scale. The webhook bridge filters correlated events from a single node failure (5-10 EventBridge events reduced to 1 forwarded event), eliminating redundant investigations at the source. Triage then links similar faults across multiple instances into a single investigation. For example, if 5 nodes hit the same GPU error in a window, triage consolidates them into 1 investigation instead of 5 (saving 4 × $4 = $16). The bigger the cluster, the more both layers save.
- Investigation duration grows sub-linearly. A 1000-node cluster investigation doesn’t take 100x longer than a 10-node one. The agent queries describe-cluster and list-cluster-events once regardless of size. The data returned is bigger, but the API call count is similar.
- CloudWatch Logs queries are the variable. On large clusters, the agent may query more HMA log streams, which takes longer agent-seconds AND incurs CloudWatch Logs Insights charges on your account (not part of DevOps Agent pricing).
DevOps Agent (the primary cost driver): Estimates based on 2 accelerator instances in a cluster
| Component | Pricing | Your cluster estimate |
| Investigations | $0.0083/agent-second | ~$4/investigation (at 8 min avg) |
| Chat (on-demand SRE tasks) | $0.0083/agent-second | ~$0.25/chat query (at 30 sec avg) |
| Daily heartbeat | $0.0083/agent-second | ~$1-2/day (short investigation confirming health) |
On a healthy cluster with no faults, only the daily heartbeat fires, approximately $30-60/month in DevOps Agent time. On a cluster experiencing 5 real faults per week (typical for a large GPU fleet), expect ~20 investigations/month × $4 each = $80/month in investigation costs.
Free tier and credits:
New DevOps Agent customers receive a 2-month free trial (20 hours of investigations, 20 hours of chat per month). Enterprise Support customers receive monthly credits equal to 75% of their AWS Support charge toward DevOps Agent usage.
Supporting infrastructure (secondary costs):
| Component | Monthly Cost Estimates |
| Lambda invocations | ~96/day (15-min audit) + event-driven = well within free tier |
| S3 (skills + dedup markers) | < $0.01 (a few MB total) |
| Secrets Manager (1 secret) | $0.40 |
| EventBridge rules | Negligible (per-event pricing) |
| SES emails | $0.10/1000 emails — at most 1 per investigation |
| CloudWatch Logs (Lambda) | < $1 (minimal log volume) |
Total estimated monthly cost:
| Scenario | DevOps Agent | Infrastructure | Total |
| Healthy cluster (no faults) | ~$30-60 (heartbeat only) | < $2 | ~$32-62/month |
| Moderate faults (5/week) | ~$80-120 | < $2 | ~$82-122/month |
| Heavy faults (20/week) | ~$320-400 | < $5 | ~$325-405/month |
How cluster size impacts cost
| Factor | Small cluster (1-10 nodes) | Large cluster (100-1000 nodes) |
| Fault frequency | Rare (maybe 1-2/week) | Constant (NVIDIA reports ~1 fault/2-3 hours at 10K GPU scale) |
| Events per fault | Few (1 node replacement = 3-5 events) | More (cascading replacements, capacity queuing) |
| Investigation duration | Shorter (less state to read, fewer events in timeline) | Longer (more nodes to describe, more events to correlate, larger CloudWatch log groups to query) |
| Triage value | Low (few duplicates) | High (one fault generates many correlated events — triage links them into 1 investigation) |
| Periodic audit | Fast (few pods/nodes to check) | Slower (more K8s state to inspect) |
| Cluster Size | Faults/month | Investigations | Est. Agent Cost |
| 1-10 nodes (your test) | 2-5 | 2-5 + heartbeat | $8-20/mo + ~$30 heartbeat |
| 10-50 nodes (typical prod) | 5-20 | 5-15 (triage dedup) | $20-60/mo + ~$30 heartbeat |
| 100-500 nodes (large training) | 50-200 | 20-50 (heavy triage) | $80-200/mo + ~$45 heartbeat |
| 1000+ nodes (frontier) | 200-700 | 50-100 (massive dedup) | $200-500/mo + ~$60 heartbeat |
Cost control levers:
- Disable the periodic audit (EnablePeriodicAudit: false) to eliminate the heartbeat cost. Live event bridging still works.
- Triage (LINK/SKIP decisions) runs at task creation time. No investigation cost is billed for deduplicated or skipped events.
- Suppress verdicts filter email notifications but the investigation still runs. If you want to eliminate that cost, tune your EventBridge rule to drop more event types at the bridge level.
Comparison to manual monitoring:
Without automation, each fault requires an on-call engineer to manually correlate events across CloudWatch, EKS, and the SageMaker console, typically 30-45 minutes of triage before they even know whether HyperPod is self-healing or needs intervention. This solution delivers a root-caused verdict in minutes at ~$4 per investigation, while providing 24/7 coverage without human wake-ups. The cost savings compound with cluster scale: at 20 faults per month, that’s 10-15 hours of engineering triage replaced by automated verdicts.
Conclusion
In this post, we showed how to build an end-to-end agentic incident-response pipeline for SageMaker HyperPod using AWS DevOps Agent. The solution complements HyperPod’s built-in resiliency by watching for the operational conditions where a human still wants to be in the loop: configuration issues affecting provisioning, capacity-bound recoveries, recurring hardware fault patterns, and workload-level conditions. It delivers clear, root-caused verdicts to the operator’s inbox.
The broader takeaway is a reusable pattern: teaching an AI agent a domain’s operational model through plain-English skills, so it can distinguish “the system is recovering on its own” from “this needs a human decision.” This pattern applies beyond HyperPod to any event-driven AWS service where operational conditions benefit from automated correlation and triage.
What’s next
To deploy the solution, follow the step-by-step instructions in the DevOps Agent Integration guide on the AI on SageMaker HyperPod site. Once it’s running, you can customize it for your environment:
- Adjust the CloudFormation parameters: tune the periodic-audit schedule, CrashLoopBackOff thresholds, NotReady node percentages, namespace filtering, and email recipients. No code changes required.
- Extend detection: modify the periodic-audit Lambda to check for additional Kubernetes conditions specific to your workloads (for example, GPU allocation below a threshold, specific Pod labels stuck in error states).
- Extend reasoning: edit the triage or RCA skill definitions to adjust classification rules, add domain context about your expected cluster behavior, or tune the recurrence thresholds.
- Add notification channels: connect Slack or PagerDuty via DevOps Agent’s built-in integrations or via a sibling EventBridge rule on the same
aws.aidevopsevent stream.
The skills are plain English. Iterate on them the same way you’d iterate on a runbook.
About the authors
Scaling organizational knowledge in Kiro with Amazon Bedrock Knowledge Bases, LangChain, and MCP
Post Syndicated from Sakshi Singh original https://aws.amazon.com/blogs/devops/scaling-organizational-knowledge-in-kiro-with-amazon-bedrock-knowledge-bases-langchain-and-mcp/
“A pull request comes back with a single comment: “This doesn’t follow our circuit breaker pattern. Check the Architectural Decision Record .”
You know the architecture decision record exists somewhere. You open your team’s wiki, search “circuit breaker,” scroll past six irrelevant results, find the document, read through it, switch back to your editor, and fix the code. Fifteen minutes are gone. Not because the problem was hard, but because the knowledge lived in one place and the code lived in another.
This plays out multiple times a day across engineering teams. Developers face several recurring challenges when working with organizational knowledge:
- Context switching – Retrieving coding standards, API specs, or architecture decisions means leaving the editor to search wikis, shared drives, or documentation portals
- Knowledge fragmentation – Team knowledge lives across multiple systems, making it difficult to find the right document at the right time
- Onboarding friction – New team members spend days navigating unfamiliar documentation structures before becoming productive
- Stale compliance – Code reviews catch standards violations after the fact, instead of surfacing the correct pattern during development
The documentation exists and is well structured. But it is not accessible from where development happens.
In this post, we show how to connect Amazon Bedrock Knowledge Bases to Kiro through the Model Context Protocol (MCP), enabling developers to query team documentation directly from their editor and get cited answers quickly. Kiro is an agentic IDE that uses MCP to connect developers to external knowledge sources beyond the local workspace. Whether you already have a Knowledge Base or are building one from scratch, setup typically takes a few minutes.
Why MCP with Knowledge Bases When Kiro Already Has Steering and Agent Skills
Kiro provides several built-in mechanisms to give context to the agent:
- Steering files (.kiro/steering/*.md) deliver static instructions and project-level context. They can be included, conditionally matched by file pattern, or manually referenced. Ideal for coding standards, team conventions, and project-specific rules that fit in a few files.
- Agent Skills (.kiro/skills/) offer reusable instructions that users activate to guide agent behavior for specific workflows like code reviews, testing strategies, or deployment procedures.
- File references (#File, #Folder) provide explicit references to local workspace files for point-in-time context.
The MCP with Knowledge Bases approach is complementary, not a replacement. Use Steering for the ten rules every commit must follow. Use Agent Skills for workflow guidance. Use MCP with Knowledge Bases when your organization maintains hundreds of Architectural Decision Records, API specs, runbooks, security guidelines, and onboarding documents. No developer can internalize all of it. Semantic search surfaces the right answer at the right moment.
Together these serve distinct roles: Steering governs Kiro’s behavior, Knowledge Bases hold your organization’s collective knowledge, and MCP provides the connective layer that makes that knowledge accessible to Kiro on demand.
Solution overview
Amazon Bedrock Knowledge Bases has powered RAG workloads for multiple teams since well before Kiro launched. If your team already has a Knowledge Base, you have completed the foundational setup: documents curated, vectors indexed, knowledge layer built. What follows is a five-minute integration that brings all of it into the editor.
The question is not whether to start from scratch. It is simpler than that: how do you bring what you already have into Kiro?
In this integration, the awslabs.bedrock-kb-retrieval-mcp-server bridges the gap between Kiro and your Knowledge Base, translating natural language queries into vector search operations and returning cited passages directly in the editor.
The answer is a single configuration file and an MCP server that takes less than few minutes to connect.
The use cases that change daily workflows
Before we dive into the how, consider what becomes possible when your Knowledge Base lives inside your editor:
Coding standards enforcement in real time. A developer asks Kiro: “What’s our error handling pattern?” and gets back the exact custom error class structure your team agreed on six months ago, complete with the code snippet from your standards document.
API specifications at your fingertips. Instead of opening a browser tab to check authentication requirements, a developer types: “What authentication does the Orders API require?” and immediately sees the JWT scope requirements, header format, and rate limits pulled directly from your OpenAPI spec stored in the Knowledge Base.
Architecture decisions with full context. When someone needs to understand why a decision was made, not just what was decided, they ask Kiro. The Architectural Decision Record comes back with the rationale, the alternatives considered, and the tradeoffs, all cited with source documents.
Kiro CLI in CI/CD. Run headless queries against your Knowledge Base in pipelines. Validate that generated code matches team patterns. Automate compliance checks against your security guidelines during pull request reviews.
Two paths: bring what you have or start fresh
You already have a Knowledge Base
If your team already uses Amazon Bedrock Knowledge Bases, whether it was built for a chatbot, an internal search tool, or a customer-facing assistant, you don’t need to rebuild anything. Your existing Knowledge Base works with Kiro out of the box.
Here’s the approach:
- Tag your existing Knowledge Base with
mcp-multirag-kb=true. This is how the MCP server discovers it. - Configure the MCP server in Kiro (covered in the next section). Your documents, your embeddings, your vector store, all stay exactly where they are.
The official awslabs.bedrock-kb-retrieval-mcp-server auto-discovers Knowledge Bases with that tag. If you have multiple Knowledge Bases (one for API docs, another for architecture decisions, a third for runbooks), tag them all. Kiro can query across your tagged Knowledge Bases.
You don’t have a Knowledge Base yet
If you’re starting fresh, the accompanying sample repository provides a complete AWS CDK application that deploys everything you need: an Amazon S3 bucket for your documents, an Amazon OpenSearch Serverless collection for vector search, and an Amazon Bedrock Knowledge Base that ties it together. The setup script handles deployment in few minutes.
For the full infrastructure deployment walkthrough, including CDK stack details, document ingestion, and monitoring setup, see the repository README.
After the setup script completes, you see the following output confirming the deployment and providing next steps:
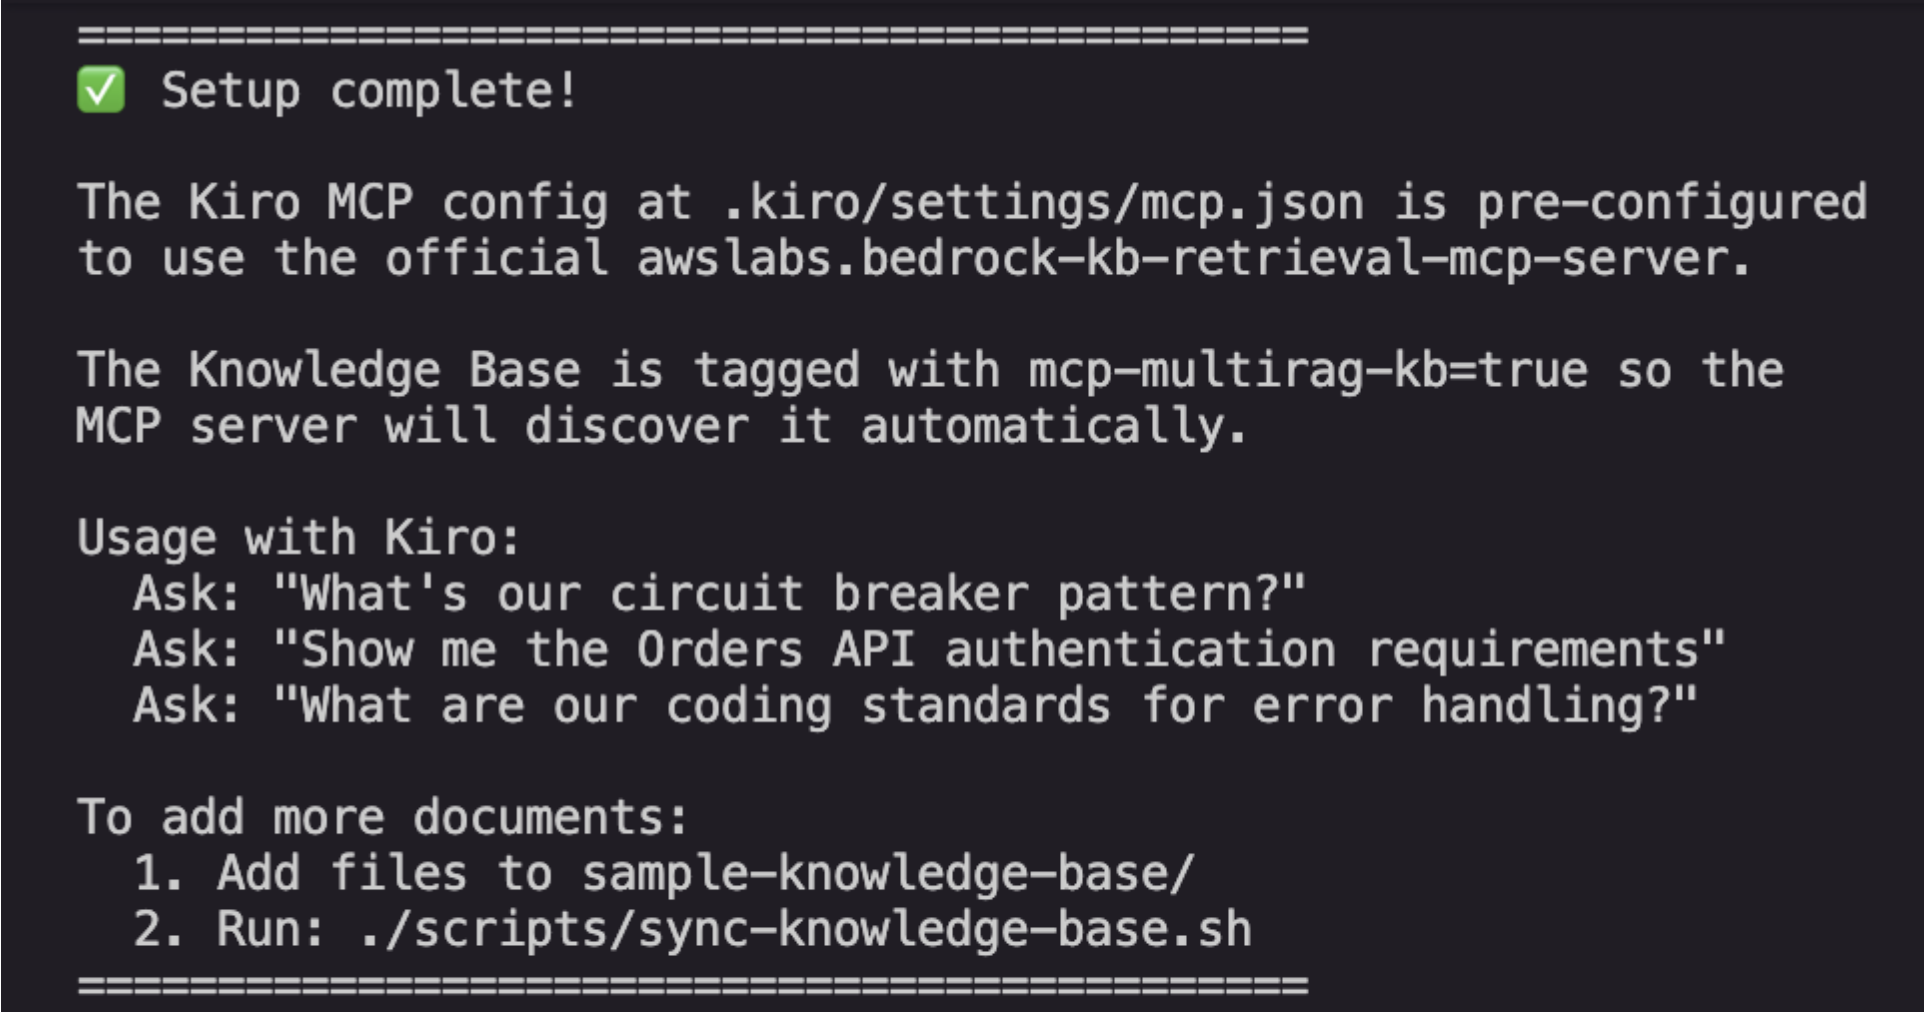
Figure 1: Setup script completion output. The script confirms the MCP config is ready, the Knowledge Base tag is set for auto-discovery, and provides sample queries to test immediately.
How it works
The Model Context Protocol (MCP) is what connects Kiro to your Knowledge Base. It acts as a bridge: Kiro connects via MCP on one side, Amazon Bedrock Knowledge Bases uses its Retrieve API on the other, and the MCP server translates between them.
The Architecture Diagram in Repository shows the end-to-end integration.

When you ask Kiro a question, the following sequence occurs:
- Developer asks a question – You type a natural language query in Kiro (IDE or CLI).
- MCP request – Kiro sends your query to the MCP server running as a local child process over stdio.
- Retrieve API call – The MCP server calls the Amazon Bedrock Knowledge Bases Retrieve API (not RetrieveAndGenerate).
- Vector search – Amazon Bedrock embeds your query using Amazon Titan Text Embeddings v2 and searches the Amazon OpenSearch Serverless vector store.
- Ranked chunks returned – The MCP server receives ranked document chunks with relevance scores and passes them back to Kiro.
- Kiro generates the response – Kiro’s own LLM synthesizes the retrieved chunks into a cited answer and presents it directly in your editor.
The official MCP server handles retrieval only. Kiro handles the generation, which means the quality of the response benefits from Kiro’s full conversation context and reasoning capabilities.You get cited answers directly in your editor, no context switching required.
Prerequisites
You need the following to connect the MCP server to Kiro:
- Kiro IDE or CLI installed on your machine
- uv package manager (provides
uvxfor running the server without installation) - AWS CLI v2 configured with credentials that have
bedrock:Retrievepermissions - An existing Amazon Bedrock Knowledge Bases (or deploy one using the sample repository)
Connect your Knowledge Base to Kiro
Create or update .kiro/settings/mcp.json in your project root
{
  "mcpServers": {
    "awslabs.bedrock-kb-retrieval-mcp-server": {
      "command": "uvx",
      "args": ["awslabs.bedrock-kb-retrieval-mcp-server@latest"],
      "env": {
        "AWS_PROFILE": "default",
        "AWS_REGION": "<YOUR_REGION>",
        "FASTMCP_LOG_LEVEL": "ERROR",
        "KB_INCLUSION_TAG_KEY": "mcp-multirag-kb",
        "BEDROCK_KB_RERANKING_ENABLED": "false"
      },
      "disabled": false,
      "autoApprove": []
    }
  }
}
Replace <YOUR_REGION> with the region where your Knowledge Base lives.
– BEDROCK_KB_RERANKING_ENABLED controls whether the server applies Amazon Bedrock’s reranking model to re-score retrieved chunks by relevance before returning them. Set to “true” to enable reranking for higher-quality results at the cost of additional latency and reranking model charges. The default is “false”, which returns results ranked by vector similarity only.
– Note on permissions: Kiro inherits the same AWS permissions as the profile specified in AWS_PROFILE. The MCP server runs as your local process, so it uses your configured credentials directly. If your profile has broad permissions, Kiro can exercise all of them. For production Knowledge Bases, use a profile with least-privilege access – bedrock:Retrieve is sufficient for read-only queries.
Key settings:
- command: “
uvx” runs the server without installing anything permanently. It downloads, executes, and cleans up automatically. KB_INCLUSION_TAG_KEYtells the server to auto-discover any Knowledge Bases tagged withmcp-multirag-kb=true.autoApproveis empty by default. Add “ListKnowledgeBases” and “QueryKnowledgeBases” to skip confirmation prompts for read-only queries. Both tools are read-only — they retrieve data from your Knowledge Base without modifying it, so auto-approving them is appropriate for read-only workflows.
Restart Kiro. The MCP server connects and discovers your tagged Knowledge Bases automatically.
What this looks like in practice
Same pull request. Same reviewer comment about the circuit breaker pattern. But this time, you do not open a browser. You ask Kiro:
"What's our circuit breaker pattern?"
Kiro calls the MCP server, queries the Knowledge Base, and returns the result directly in your editor:
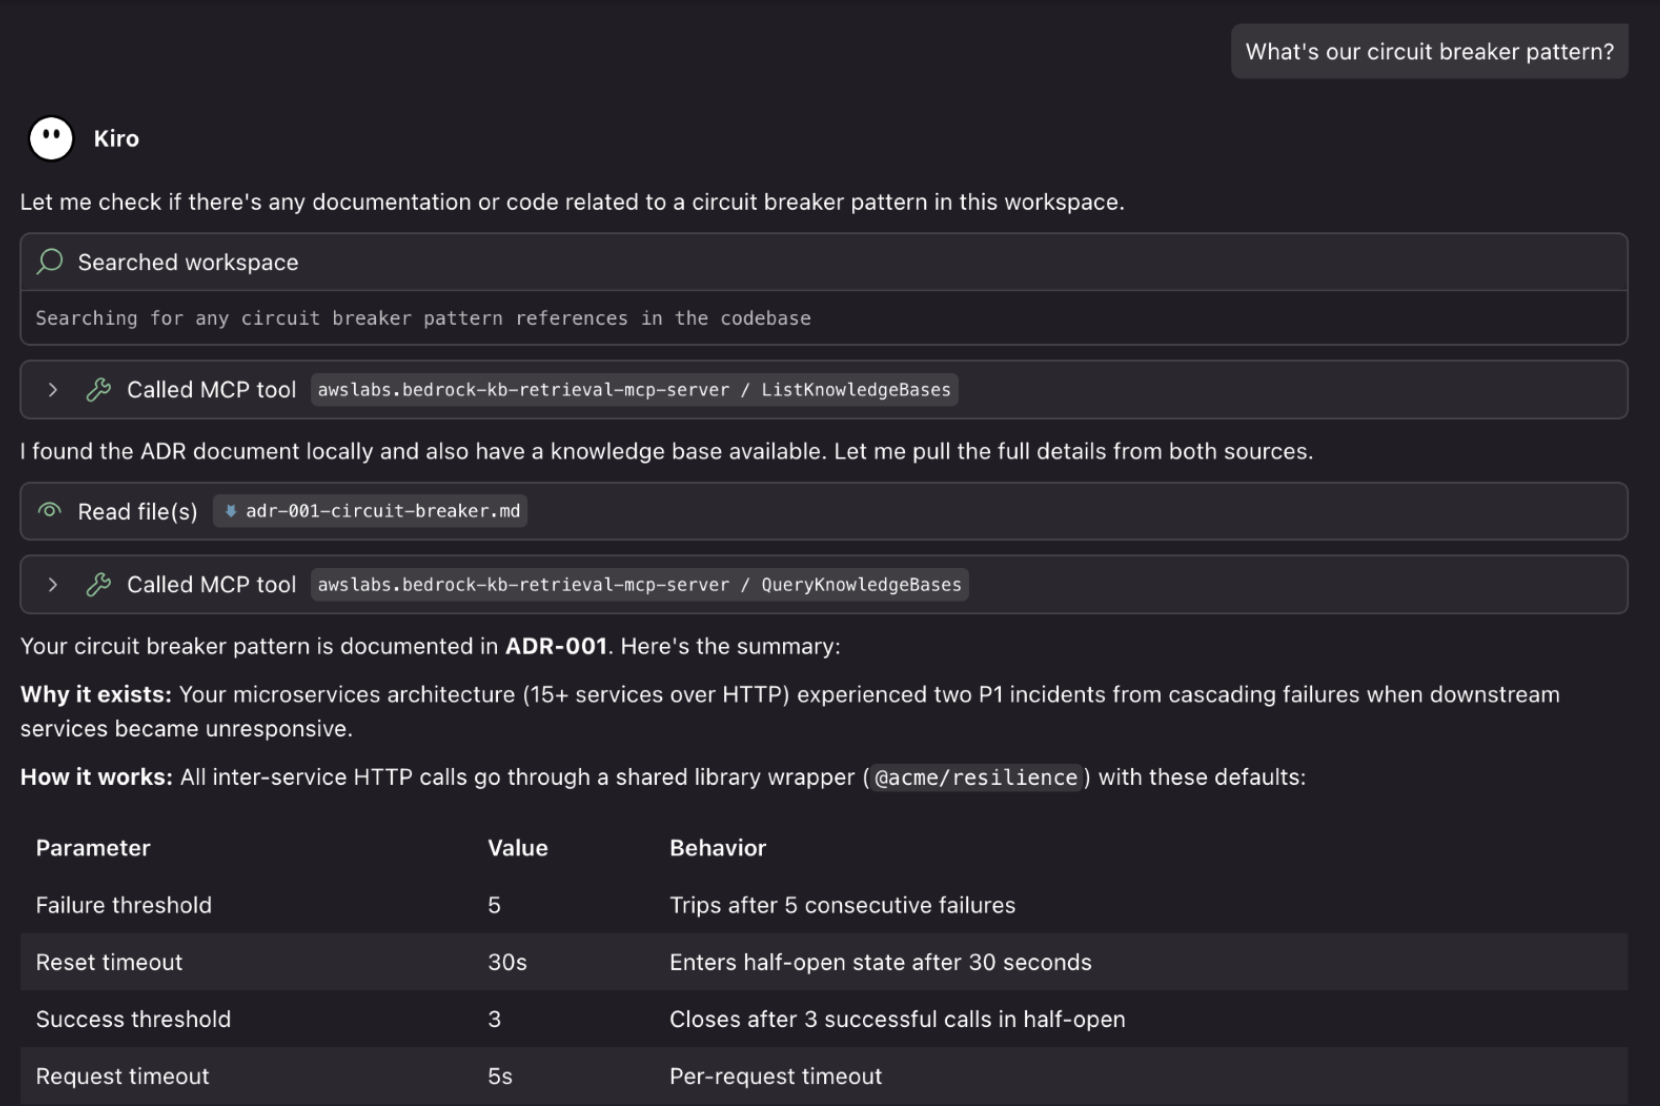
Figure 2: Kiro querying the Knowledge Base for the circuit breaker pattern. It calls ListKnowledgeBases to discover tagged Knowledge Bases, reads the local ADR file, and calls QueryKnowledgeBases to return the full parameter table from ADR-001 with source attribution.
The response includes the architecture decision record, the specific parameters (failure threshold, reset timeout, success threshold), and the source file reference. You fix your code quickly — no context switch, no browser tab, no searching.
Example: Querying API specifications
A developer types: "What authentication does the Orders API require?"
Kiro returns:
All requests require a valid JWT in the Authorization: Bearer <token> header. Tokens are issued by the Auth Service and must include the orders:read or orders:write scope.
 Source: api-spec-orders.md
Example: Discovering documentation gaps
A teammate asks Kiro: "What security headers should our APIs return?"
The MCP server queries the Knowledge Base and returns the security guidelines document, which covers authentication, input validation, and secrets management — but does not mention HTTP response security headers. Kiro recognizes this gap in the retrieved content and, using its own workspace context (Kiro can read local files like security-guidelines.md independently of the MCP server), recommends the headers that should be added based on the existing security posture documented elsewhere.
Figure 3: Kiro querying security guidelines from the Knowledge Base. The MCP server returns the existing security posture (JWT handling, input validation, secrets management), and Kiro identifies the missing HTTP response security headers section, recommending additions based on the documented security context.
This illustrates how Kiro combines Knowledge Base retrieval with its native workspace awareness. The MCP server handles the retrieval; Kiro handles the reasoning across all available context.
The LangChain alternative: a cloud-agnostic approach with more control
The official MCP server covers most use cases. For advanced scenarios – provider portability (swap between Amazon Bedrock, OpenAI, or local models), server-side RAG with built-in relevance filtering, or custom LCEL chain composition, see the LangChain alternative section in the repository README.
You can run both servers simultaneously. Kiro selects the right tool based on your query.
Figure 4: Both MCP servers running simultaneously. Kiro calls `ask_knowledge_base` on the LangChain server and `ListKnowledgeBases` on the official server in parallel, then falls back to `QueryKnowledgeBases` to retrieve the full security guidelines for API authentication from the kiro-dev-knowledge-base.
For the complete LangChain setup, including provider swapping (OpenAI, Ollama, local models) and LCEL chain details, see the LangChain alternative section in the repository.
The Architecture Diagram for Langchain alternative in Repository shows the end-to-end integration.

Best practices for your Knowledge Base content
The quality of answers depends on the quality of your documents:
- Write Markdown with clear headings. The 512-token chunking works best with self-contained sections under each heading.
- Include code examples. Developers use returned snippets immediately. An error handling standard with a code sample is ten times more useful than one without.
- Use consistent naming. If your API is called “Orders API” in one document and “Order Service” in another, retrieval suffers.
- Keep documents current. Stale docs erode trust faster than missing docs. Set a quarterly review cadence.
Kiro CLI: Knowledge Base queries in your terminal and CI/CD
The same MCP configuration works for both Kiro IDE and Kiro CLI:
# Interactive
 kiro-cli chat
 # Headless (for scripts and pipelines)
 kiro-cli chat --no-interactive --trust-tools=read \
 "What's our circuit breaker pattern?"
The --no-interactive runs without a session, and – --trust-tools=read auto-approves read-only tool calls (like QueryKnowledgeBases) without prompting. Headless mode requires the KIRO_API_KEY environment variable. To generate an API key, follow the steps in the Kiro Documentation.
Use headless mode in CI/CD pipelines to validate generated code against team standards, or in onboarding scripts that walk new developers through your architecture decisions.
Cleanup
The MCP server is an open-source tool; costs apply to the underlying AWS resources (Amazon OpenSearch Serverless, Amazon S3 storage, and Amazon Bedrock API calls). The primary ongoing cost is Amazon OpenSearch Serverless, which charges for OCU (OpenSearch Compute Unit) capacity even when idle. Amazon S3 storage and Amazon Bedrock API calls are pay-per-use. For detailed pricing, see the Amazon S3 Pricing page and Amazon Bedrock Pricing page. Destroy resources when you’re done experimenting:
cd kiro-bedrock-kb-mcp/infrastructure
npx cdk destroy --all
For detailed cleanup instructions, see the repository README.
Conclusion
In this blog post, we showed how to connect Amazon Bedrock Knowledge Bases to Kiro through MCP, turning organizational documentation into an in-editor knowledge assistant. This integration addresses the challenges outlined at the beginning of this post:
- No more context switching – Developers query coding standards, API specs, and architecture decisions without leaving their editor
- Unified knowledge access – A single MCP configuration connects to multiple Knowledge Bases, regardless of where the original documents live
- Faster onboarding – New team members get cited answers to questions quickly, without navigating unfamiliar documentation systems
- Proactive standards enforcement — Team standards surface during development rather than after a code review catches a violation.
Two paths to get started:
- Existing Knowledge Base – Tag it with
mcp-multirag-kb=true, add the MCP configuration to Kiro, and start querying after few minutes. - Starting fresh – Deploy the sample infrastructure using the repository, upload your team documents, and connect.
Your documentation already held the answers. Now developers get them quickly, without leaving their workflow.
About the author
Python Now Has a Post-Quantum Encryption Library
Post Syndicated from Bruce Schneier original https://www.schneier.com/blog/archives/2026/08/python-now-has-a-post-quantum-encryption-library.html
Post-quantum cryptography is now one pip-install away for the entire Python ecosystem. With funding from the Sovereign Tech Agency, we implemented support for ML-KEM, the NIST-standard key-establishment primitive, and ML-DSA, the NIST-standard digital-signature primitive, in pyca/cryptography.
Remember, the reason to do this now is because there’s no emergency. And because you will make your systems crypto agile, which is always a good idea.