Post Syndicated from Explosm.net original http://explosm.net/comics/6025/
New Cyanide and Happiness Comic
Post Syndicated from Explosm.net original http://explosm.net/comics/6025/
New Cyanide and Happiness Comic
Post Syndicated from original https://xkcd.com/2540/

Post Syndicated from Home Assistant original https://www.youtube.com/watch?v=LFQOFDCfdWk
Post Syndicated from Pranaya Anshu original https://aws.amazon.com/blogs/compute/implementing-interruption-tolerance-in-amazon-ec2-spot-with-aws-fault-injection-simulator/
This post is written by Steve Cole, WW SA Leader for EC2 Spot, and David Bermeo, Senior Product Manager for EC2.
On October 20, 2021, AWS released new functionality to the Amazon Fault Injection Simulator that supports triggering the interruption of Amazon EC2 Spot Instances. This functionality lets you test the fault tolerance of your software by interrupting instances on command. The triggered interruption will be preceded with a Rebalance Recommendation (RBR) and Instance Termination Notification (ITN) so that you can fully test your applications as if an actual Spot interruption had occurred.
In this post, we’ll provide two examples of how easy it has now become to simulate Spot interruptions and validate the fault-tolerance of an application or service. We will demonstrate testing an application through the console and a service via CLI.
Whether you are building a Spot-capable product or service from scratch or evaluating the Spot compatibility of existing software, the first step in testing is identifying whether or not the software is tolerant of being interrupted.
In the past, one way this was accomplished was with an AWS open-source tool called the Amazon EC2 Metadata Mock. This tool let customers simulate a Spot interruption as if it had been delivered through the Instance Metadata Service (IMDS), which then let customers test how their code responded to an RBR or an ITN. However, this model wasn’t a direct plug-and-play solution with how an actual Spot interruption would occur, since the signal wasn’t coming from AWS. In particular, the method didn’t provide the centralized notifications available through Amazon EventBridge or Amazon CloudWatch Events that enabled off-instance activities like launching AWS Lambda functions or other orchestration work when an RBR or ITN was received.
Now, Fault Injection Simulator has removed the need for custom logic, since it lets RBR and ITN signals be delivered via the standard IMDS and event services simultaneously.
Let’s walk through the process in the AWS Management Console. We’ll identify an instance that’s hosting a perpetually-running queue worker that checks the IMDS before pulling messages from Amazon Simple Queue Service (SQS). It will be part of a service stack that is scaled in and out based on the queue depth. Our goal is to make sure that the IMDS is being polled properly so that no new messages are pulled once an ITN is received. The typical processing time of a message with this example is 30 seconds, so we can wait for an ITN (which provides a two minute warning) and need not act on an RBR.
First, we go to the Fault Injection Simulator in the AWS Management Console to create an experiment.
At the experiment creation screen, we start by creating an optional name (recommended for console use) and a description, and then selecting an IAM Role. If this is the first time that you’ve used Fault Injection Simulator, then you’ll need to create an IAM Role per the directions in the FIS IAM permissions documentation. I’ve named the role that we created ‘FIS.’ After that, I’ll select an action (interrupt) and identify a target (the instance).
First, I name the action. The Action type I want is to interrupt the Spot Instance: aws:ec2:send-spot-instance-interruptions. In the Action parameters, we are given the option to set the duration. The minimum value here is two minutes, below which you will receive an error since Spot Instances will always receive a two minute warning. The advantage here is that, by setting the durationBeforeInterruption to a value above two minutes, you will get the RBR (an optional point for you to respond) and ITN (the actual two minute warning) at different points in time, and this lets you respond to one or both.
The target instance that we launched is depicted in the following screenshot. It is a Spot Instance that was launched as a persistent request with its interruption action set to ‘stop’ instead of ‘terminate.’ The option to stop a Spot Instance, introduced in 2020, will let us restart the instance, log in and retrieve logs, update code, and perform other work necessary to implement Spot interruption handling.
Now that an action has been defined, we configure the target. We have the option of naming the target, which we’ve done here to match the Name tagged on the EC2 instance ‘qWorker’. The target method we want to use here is Resource ID, and then we can either type or select the desired instance from a drop-down list. Selection mode will be ‘all’, as there is only one instance. If we were using tags, which we will in the next example, then we’d be able to select a count of instances, up to five, instead of just one.
Once you’ve saved the Action, the Target, and the Experiment, then you’ll be able to begin the experiment by selecting the ‘Start from the Action’ menu at the top right of the screen.
After the experiment starts, you’ll be able to observe its state by refreshing the screen. Generally, the process will take just seconds, and you should be greeted by the Completed state, as seen in the following screenshot.
In the following screenshot, having opened an interruption log group created in CloudWatch Event Logs, we can see the JSON of the RBR.
Two minutes later, we see the ITN in the same log group.
Another two minutes after the ITN, we can see the EC2 instance is in the process of stopping (or terminating, if you elect).
Shortly after the stop is issued by EC2, we can see the instance stopped. It would now be possible to restart the instance and view logs, make code changes, or do whatever you find necessary before testing again.
Now that our experiment succeeded in interrupting our Spot Instance, we can evaluate the performance of the code running on the instance. It should have completed the processing of any messages already retrieved at the ITN, and it should have not pulled any new messages afterward.
This experiment can be saved for later use, but it will require selecting the specific instance each time that it’s run. We can also re-use the experiment template by using tags instead of an instance ID, as we’ll show in the next example. This shouldn’t prove troublesome for infrequent experiments, and especially those run through the console. Or, as we did in our example, you can set the instance interruption behavior to stop (versus terminate) and re-use the experiment as long as that particular instance continues to exist. When the experiments get more frequent, it might be advantageous to automate the process, possibly as part of the test phase of a CI/CD pipeline. Doing this is programmatically possible through the AWS CLI or SDK.
Once the developers of our product validate the single-instance fault tolerance, indicating that the target workload is capable of running on Spot Instances, then the next logical step is to deploy the product as a service on multiple instances. This will allow for more comprehensive testing of the service as a whole, and it is a key process in collecting valuable information, such as performance data, response times, error rates, and other metrics to be used in the monitoring of the service. Once data has been collected on a non-interrupted deployment, it is then possible to use the Spot interruption action of the Fault Injection Simulator to observe how well the service can handle RBR and ITN while running, and to see how those events influence the metrics collected previously.
When testing a service, whether it is launched as instances in an Amazon EC2 Auto Scaling group, or it is part of one of the AWS container services, such as Amazon Elastic Container Service (Amazon ECS) or the Amazon Elastic Kubernetes Service (EKS), EC2 Fleet, Amazon EMR, or across any instances with descriptive tagging, you now have the ability to trigger Spot interruptions to as many as five instances in a single Fault Injection Simulator experiment.
We’ll use tags, as opposed to instance IDs, to identify candidates for interruption to interrupt multiple Spot Instances simultaneously. We can further refine the candidate targets with one or more filters in our experiment, for example targeting only running instances if you perform an action repeatedly.
In the following example, we will be interrupting three instances in an Auto Scaling group that is backing a self-managed EKS node group. We already know the software will behave as desired from our previous engineering tests. Our goal here is to see how quickly EKS can launch replacement tasks and identify how the service as a whole responds during the event. In our experiment, we will identify instances that contain the tag aws:autoscaling:groupName with a value of “spotEKS”.
The key benefit here is that we don’t need a list of instance IDs in our experiment. Therefore, this is a re-usable experiment that can be incorporated into test automation without needing to make specific selections from previous steps like collecting instance IDs from the target Auto Scaling group.
We start by creating a file that describes our experiment in JSON rather than through the console:
{
    "description": "interrupt multiple random instances in ASG",
    "targets": {
        "spotEKS": {
            "resourceType": "aws:ec2:spot-instance",
            "resourceTags": {
                "aws:autoscaling:groupName": "spotEKS"
            },
            "selectionMode": "COUNT(3)"
        }
    },
    "actions": {
        "interrupt": {
            "actionId": "aws:ec2:send-spot-instance-interruptions",
            "description": "interrupt multiple instances",
            "parameters": {
                "durationBeforeInterruption": "PT4M"
            },
            "targets": {
            "SpotInstances": "spotEKS"
            }
        }
    },
    "stopConditions": [
        {
            "source": "none"
        }
    ],
    "roleArn": "arn:aws:iam::xxxxxxxxxxxx:role/FIS",
    "tags": {
        "Name": "multi-instance"
    }
}
Then we upload the experiment template to Fault Injection Simulator from the command-line.
aws fis create-experiment-template --cli-input-json file://experiment.json
The response we receive returns our template along with an ID, which we’ll need to execute the experiment.
{
    "experimentTemplate": {
        "id": "EXT3SHtpk1N4qmsn",
        ...
    }
}
We then execute the experiment from the command-line using the ID that we were given at template creation.
aws fis start-experiment --experiment-template-id EXT3SHtpk1N4qmsn
We then receive confirmation that the experiment has started.
{
    "experiment": {
        "id": "EXPaFhEaX8GusfztyY",
        "experimentTemplateId": "EXT3SHtpk1N4qmsn",
        "state": {
            "status": "initiating",
            "reason": "Experiment is initiating."
        },
        ...
    }
}
To check the status of the experiment as it runs, which for interrupting Spot Instances is quite fast, we can query the experiment ID for success or failure messages as follows:
aws fis get-experiment --id EXPaFhEaX8GusfztyY
And finally, we can confirm the results of our experiment by listing our instances through EC2. Here we use the following command-line before and after execution to generate pre- and post-experiment output:
aws ec2 describe-instances --filters\
 Name='tag:aws:autoscaling:groupName',Values='spotEKS'\
 Name='instance-state-name',Values='running'\
 | jq .Reservations[].Instances[].InstanceId | sort
We can then compare this to identify which instances were interrupted and which were launched as replacements.
< "i-003c8d95c7b6e3c63"
< "i-03aa172262c16840a"
< "i-02572fa37a61dc319"
---
> "i-04a13406d11a38ca6"
> "i-02723d957dc243981"
> "i-05ced3f71736b5c95"
In the previous examples, we have demonstrated through the console and command-line how you can use the Spot interruption action in the Fault Injection Simulator to ascertain how your software and service will behave when encountering a Spot interruption. Simulating Spot interruptions will help assess the fault-tolerance of your software and can assess the impact of interruptions in a running service. The addition of events can enable more tooling, and being able to simulate both ITNs and RBRs, along with the Capacity Rebalance feature of Auto scaling groups, now matches the end-to-end experience of an actual AWS interruption. Get started on simulating Spot interruptions in the console.
Post Syndicated from Talia Nassi original https://aws.amazon.com/blogs/compute/token-based-authentication-for-ios-applications-with-amazon-sns/
This post is co-written by Karen Hong, Software Development Engineer, AWS Messaging.
To use Amazon SNS to send mobile push notifications, you must provide a set of credentials for connecting to the supported push notification service (see prerequisites for push). For the Apple Push Notification service (APNs), SNS now supports using token-based authentication (.p8), in addition to the existing certificate-based method.
You can now use a .p8 file to create or update a platform application resource through the SNS console or programmatically. You can publish messages (directly or from a topic) to platform application endpoints configured for token-based authentication.
In this tutorial, you set up an example iOS application. You retrieve information from your Apple developer account and learn how to register a new signing key. Next, you use the SNS console to set up a platform application and a platform endpoint. Finally, you test the setup and watch a push notification arrive on your device.
Token-based authentication has several benefits compared to using certificates. The first is that you can use the same signing key from multiple provider servers (iOS,VoIP, and MacOS), and you can use one signing key to distribute notifications for all of your company’s application environments (sandbox, production). In contrast, a certificate is only associated with a particular subset of these channels.
A pain point for customers using certificate-based authentication is the need to renew certificates annually, an inconvenient procedure which can lead to production issues when forgotten. Your signing key for token-based authentication, on the other hand, does not expire.
Token-based authentication improves the security of your certificates. Unlike certificate-based authentication, the credential does not transfer. Hence, it is less likely to be compromised. You establish trust through encrypted tokens that are frequently regenerated. SNS manages the creation and management of these tokens.
You configure APNs platform applications for use with both .p8 and .p12 certificates, but only 1 authentication method is active at any given time.
To use token-based authentication, you must set up your application.
Prerequisites: An Apple developer account
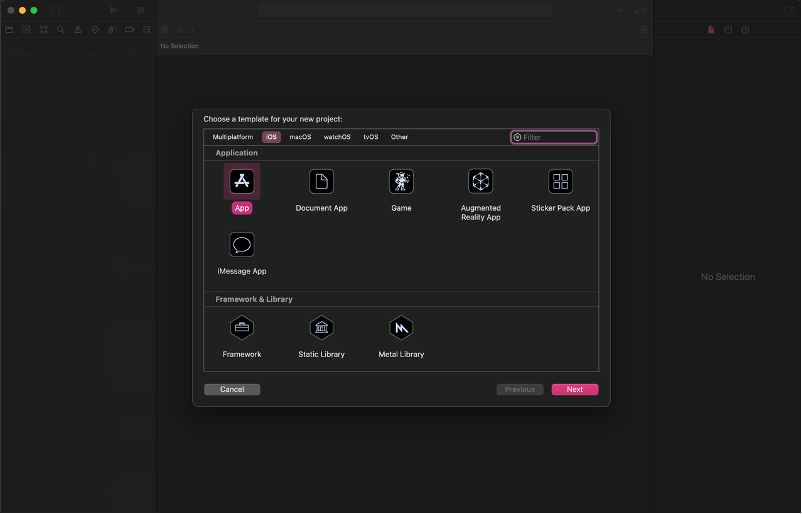
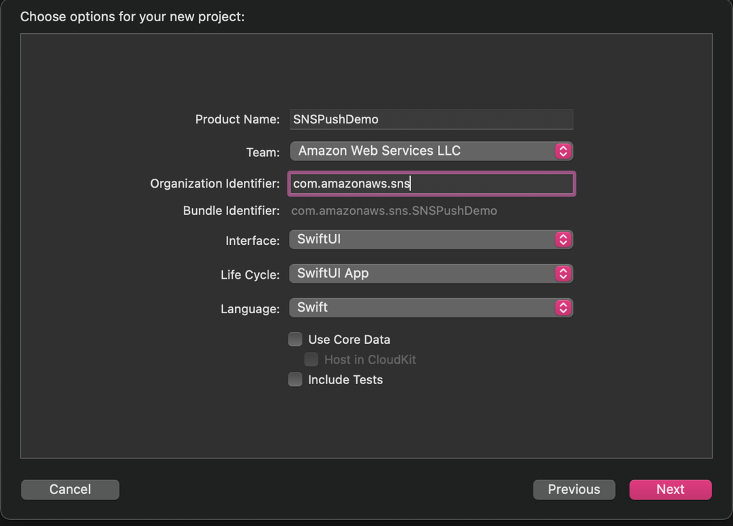

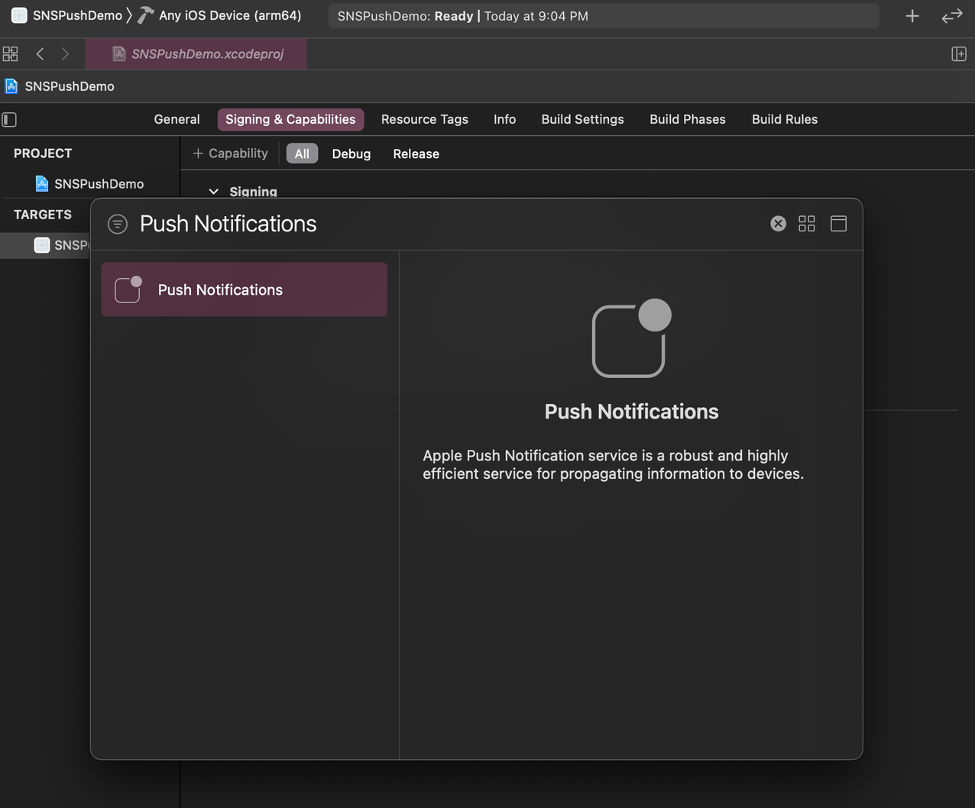
SNSPushDemoApp.swift , add the following code to print the device token and receive push notifications.
import SwiftUI

@main
struct SNSPushDemoApp: App {

    @UIApplicationDelegateAdaptor private var appDelegate: AppDelegate

    var body: some Scene {
        WindowGroup {
            ContentView()
        }
    }
}

class AppDelegate: NSObject, UIApplicationDelegate, UNUserNotificationCenterDelegate {

    func application(_ application: UIApplication,
                     didFinishLaunchingWithOptions launchOptions: [UIApplication.LaunchOptionsKey : Any]? = nil) -> Bool {
        UNUserNotificationCenter.current().delegate = self
        return true
    }

    func application(_ application: UIApplication,
                     didRegisterForRemoteNotificationsWithDeviceToken deviceToken: Data) {
        let tokenParts = deviceToken.map { data in String(format: "%02.2hhx", data) }
        let token = tokenParts.joined()
        print("Device Token: \(token)")
    };

    func application(_ application: UIApplication, didFailToRegisterForRemoteNotificationsWithError error: Error) {
       print(error.localizedDescription)
    }

    func userNotificationCenter(_ center: UNUserNotificationCenter, willPresent notification: UNNotification, withCompletionHandler completionHandler: @escaping (UNNotificationPresentationOptions) -> Void) {
        completionHandler([.banner, .badge, .sound])
    }
}
ContentView.swift, add the code to request authorization for push notifications and register for notifications.
import SwiftUI

struct ContentView: View {
    init() {
        requestPushAuthorization();
    }

    var body: some View {
        Button("Register") {
            registerForNotifications();
        }
    }
}

struct ContentView_Previews: PreviewProvider {
    static var previews: some View {
        ContentView()
    }
}

func requestPushAuthorization() {
    UNUserNotificationCenter.current().requestAuthorization(options: [.alert, .badge, .sound]) { success, error in
        if success {
            print("Push notifications allowed")
        } else if let error = error {
            print(error.localizedDescription)
        }
    }
}

func registerForNotifications() {
    UIApplication.shared.registerForRemoteNotifications()
}
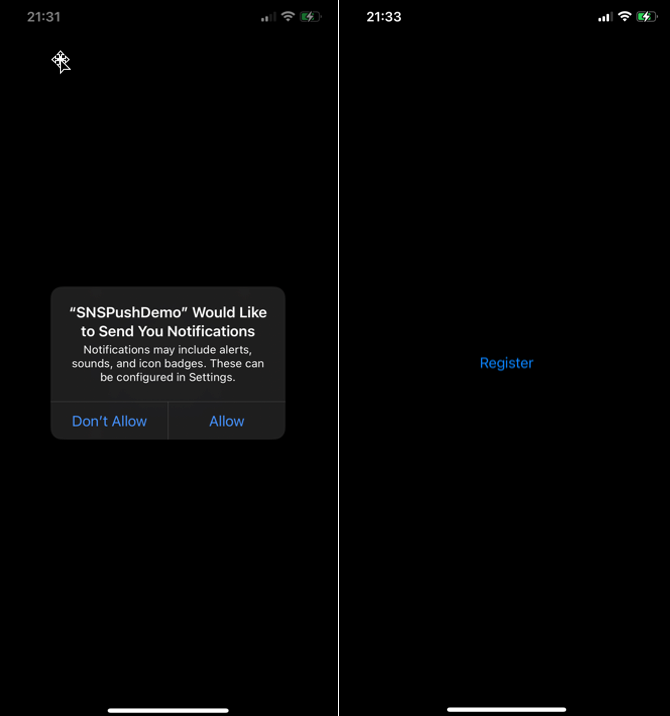

After setting up your application, you retrieve your Apple resources from your Apple developer account. There are four pieces of information you need from your Apple Developer Account: Bundle ID, Team ID, Signing Key, and Signing Key ID.
The signing key and signing key ID are credentials that you manage through your Apple Developer Account. You can register a new key by selecting the Keys tab under the Certificates, Identifiers & Profiles menu. Your Apple developer account provides the signing key in the form of a text file with a .p8 extension.
Find the team ID under Membership Details. The bundle ID is the unique identifier that you set up when creating your application. Find this value in the Identifiers section under the Certificates, Identifiers & Profiles menu.
Amazon SNS uses a token constructed from the team ID, signing key, and signing key ID to authenticate with APNs for every push notification that you send. Amazon SNS manages tokens on your behalf and renews them when necessary (within an hour). The request header includes the bundle ID and helps identify where the notification goes.
In order to implement APNs token-based authentication, you must have:
To create a new platform application:
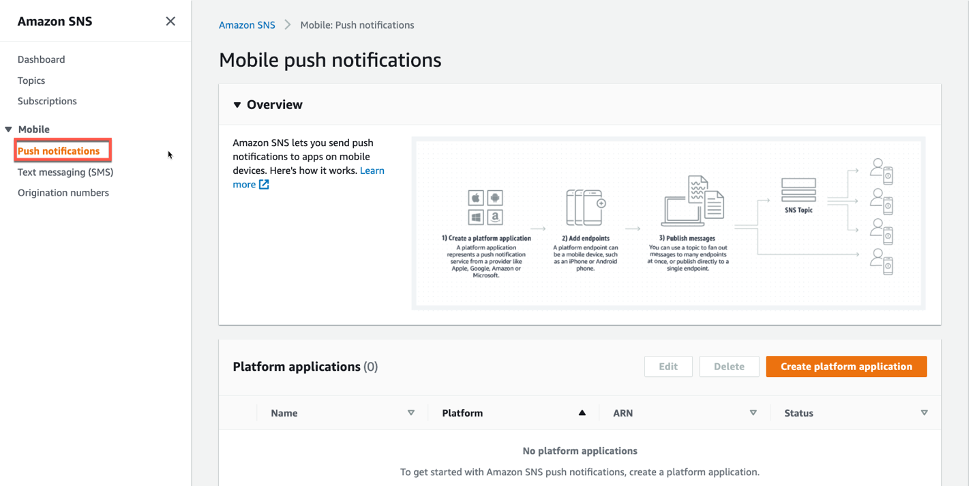

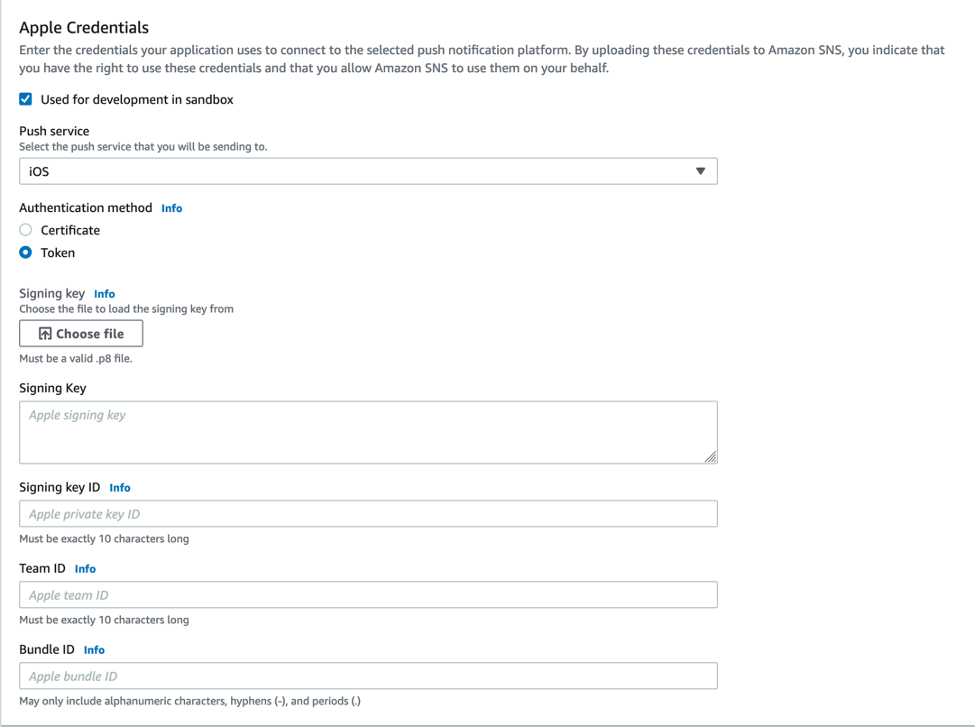
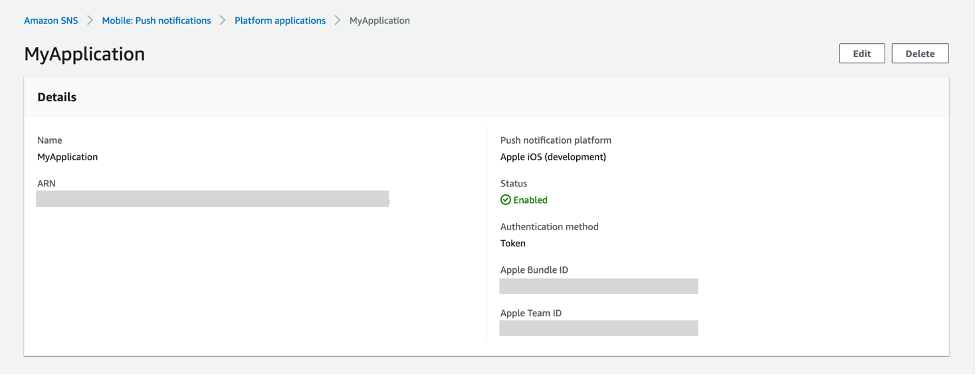
A platform application stores credentials, sending configuration, and other settings but does not contain an exact sending destination. Create a platform endpoint resource to store the information to allow SNS to target push notifications to the proper application on the correct mobile device.
Any iOS application that is capable of receiving push notifications must register with APNs. Upon successful registration, APNs returns a device token that uniquely identifies an instance of an app. SNS needs this device token in order to send to that app. Each platform endpoint belongs to a specific platform application and uses the credentials and settings set in the platform application to complete the sending.
In this tutorial, you create the platform endpoint manually through the SNS console. In a real system, upon receiving the device token, you programmatically call SNS from your application server to create or update your platform endpoints.
These are the steps to create a new platform endpoint:

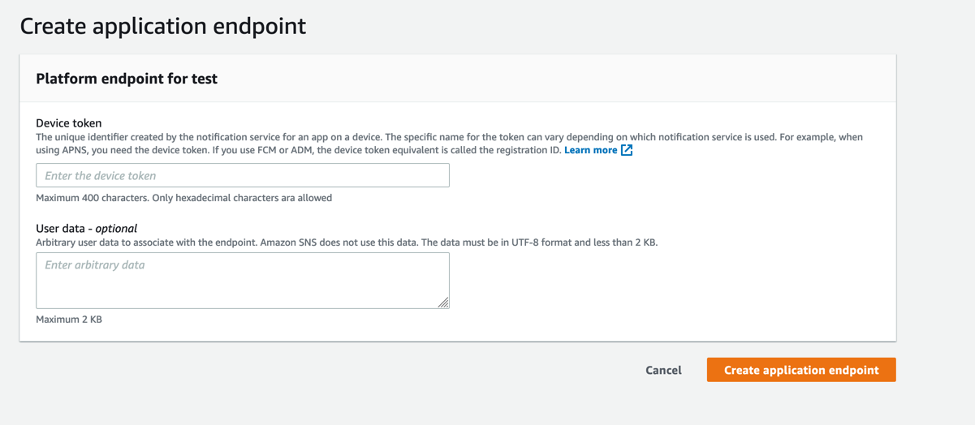
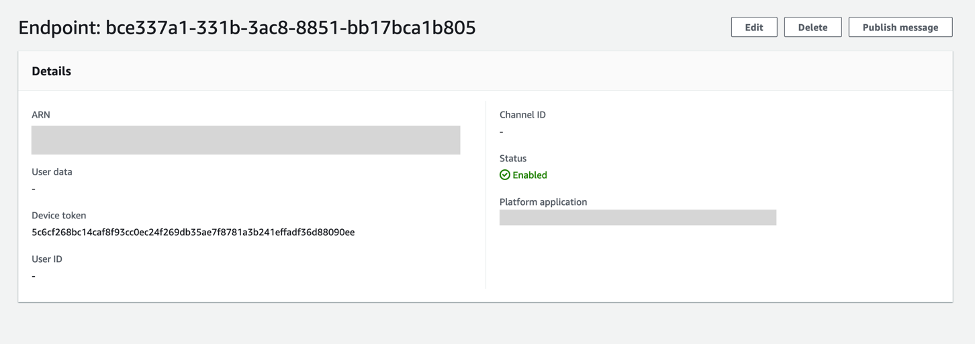
In this section, you test a push notification from your device.
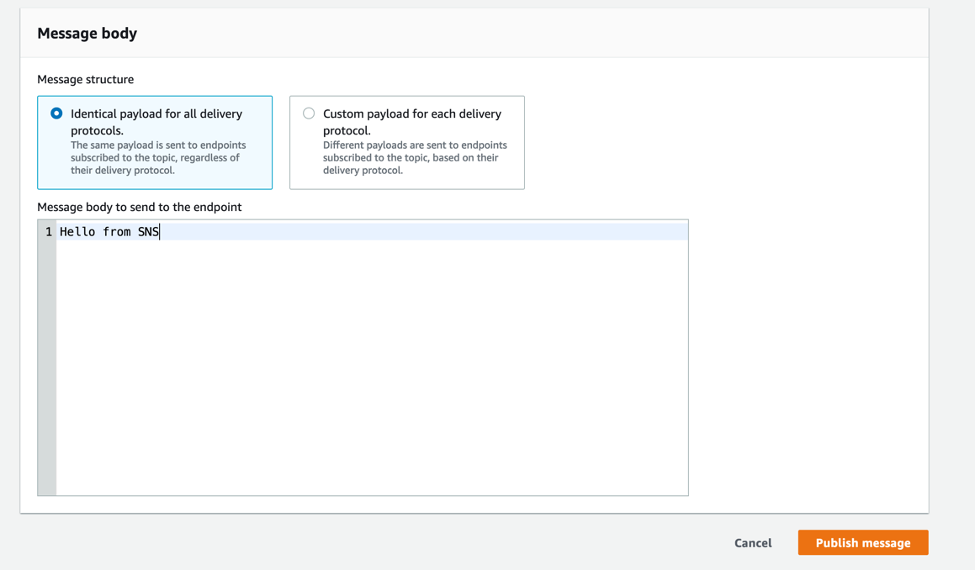
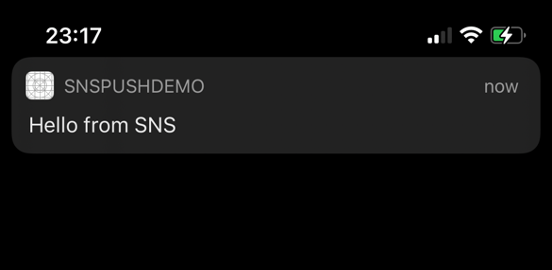
Developers sending mobile push notifications can now use a .p8 key to authenticate an Apple device endpoint. Token-based authentication is more secure, and reduces operational burden of renewing the certificates every year. In this post, you learn how to set up your iOS application for mobile push using token-based authentication, by creating and configuring a new platform endpoint in the Amazon SNS console.
To learn more about APNs token-based authentication with Amazon SNS, visit the Amazon SNS Developer Guide. For more serverless content, visit Serverless Land.
Post Syndicated from Venkata Sistla original https://aws.amazon.com/blogs/big-data/create-a-serverless-event-driven-workflow-to-ingest-and-process-microsoft-data-with-aws-glue-and-amazon-eventbridge/
Microsoft SharePoint is a document management system for storing files, organizing documents, and sharing and editing documents in collaboration with others. Your organization may want to ingest SharePoint data into your data lake, combine the SharePoint data with other data that’s available in the data lake, and use it for reporting and analytics purposes. AWS Glue is a serverless data integration service that makes it easy to discover, prepare, and combine data for analytics, machine learning, and application development. AWS Glue provides all the capabilities needed for data integration so that you can start analyzing your data and putting it to use in minutes instead of months.
Organizations often manage their data on SharePoint in the form of files and lists, and you can use this data for easier discovery, better auditing, and compliance. SharePoint as a data source is not a typical relational database and the data is mostly semi structured, which is why it’s often difficult to join the SharePoint data with other relational data sources. This post shows how to ingest and process SharePoint lists and files with AWS Glue and Amazon EventBridge, which enables you to join other data that is available in your data lake. We use SharePoint REST APIs with a standard open data protocol (OData) syntax. OData advocates a standard way of implementing REST APIs that allows for SQL-like querying capabilities. OData helps you focus on your business logic while building RESTful APIs without having to worry about the various approaches to define request and response headers, query options, and so on.
Unlike a traditional relational database, SharePoint data may or may not change frequently, and it’s difficult to predict the frequency at which your SharePoint server generates new data, which makes it difficult to plan and schedule data processing pipelines efficiently. Running data processing frequently can be expensive, whereas scheduling pipelines to run infrequently can deliver cold data. Similarly, triggering pipelines from an external process can increase complexity, cost, and job startup time.
AWS Glue supports event-driven workflows, a capability that lets developers start AWS Glue workflows based on events delivered by EventBridge. The main reason to choose EventBridge in this architecture is because it allows you to process events, update the target tables, and make information available to consume in near-real time. Because frequency of data change in SharePoint is unpredictable, using EventBridge to capture events as they arrive enables you to run the data processing pipeline only when new data is available.
To get started, you simply create a new AWS Glue trigger of type EVENT and place it as the first trigger in your workflow. You can optionally specify a batching condition. Without event batching, the AWS Glue workflow is triggered every time an EventBridge rule matches, which may result in multiple concurrent workflows running. AWS Glue protects you by setting default limits that restrict the number of concurrent runs of a workflow. You can increase the required limits by opening a support case. Event batching allows you to configure the number of events to buffer or the maximum elapsed time before firing the particular trigger. When the batching condition is met, a workflow run is started. For example, you can trigger your workflow when 100 files are uploaded in Amazon Simple Storage Service (Amazon S3) or 5 minutes after the first upload. We recommend configuring event batching to avoid too many concurrent workflows, and optimize resource usage and cost.
To illustrate this solution better, consider the following use case for a wine manufacturing and distribution company that operates across multiple countries. They currently host all their transactional system’s data on a data lake in Amazon S3. They also use SharePoint lists to capture feedback and comments on wine quality and composition from their suppliers and other stakeholders. The supply chain team wants to join their transactional data with the wine quality comments in SharePoint data to improve their wine quality and manage their production issues better. They want to capture those comments from the SharePoint server within an hour and publish that data to a wine quality dashboard in Amazon QuickSight. With an event-driven approach to ingest and process their SharePoint data, the supply chain team can consume the data in less than an hour.
In this post, we walk through a solution to set up an AWS Glue job to ingest SharePoint lists and files into an S3 bucket and an AWS Glue workflow that listens to S3 PutObject data events captured by AWS CloudTrail. This workflow is configured with an event-based trigger to run when an AWS Glue ingest job adds new files into the S3 bucket. The following diagram illustrates the architecture.
To make it simple to deploy, we captured the entire solution in an AWS CloudFormation template that enables you to automatically ingest SharePoint data into Amazon S3. SharePoint uses ClientID and TenantID credentials for authentication and uses Oauth2 for authorization.
The template helps you perform the following steps:
For this walkthrough, you should have the following prerequisites:
Before launching the CloudFormation stack, you need to set up your SharePoint server authentication details, namely, TenantID, Tenant, ClientID, ClientSecret, and the SharePoint URL in AWS Systems Manager Parameter Store of the account you’re deploying in. This makes sure that no authentication details are stored in the code and they’re fetched in real time from Parameter Store when the solution is running.
To create your AWS Systems Manager parameters, complete the following steps:

/DATALAKE/GlueIngest/SharePoint/tenant./DataLake/GlueIngest/SharePoint/tenant/DataLake/GlueIngest/SharePoint/tenant_id/DataLake/GlueIngest/SharePoint/client_id/list/DataLake/GlueIngest/SharePoint/client_secret/list/DataLake/GlueIngest/SharePoint/client_id/file/DataLake/GlueIngest/SharePoint/client_secret/file/DataLake/GlueIngest/SharePoint/url/list/DataLake/GlueIngest/SharePoint/url/fileFor a quick start of this solution, you can deploy the provided CloudFormation stack. This creates all the required resources in your account.
The CloudFormation template generates the following resources:
PutObject API call data in a specific bucket.NotifyEvent API for an AWS Glue workflow.To launch the CloudFormation stack, complete the following steps:
It takes a few minutes for the stack creation to complete; you can follow the progress on the Events tab.
You can run the ingest AWS Glue job either on a schedule or on demand. As the job successfully finishes and ingests data into the raw prefix of the S3 bucket, the AWS Glue workflow runs and transforms the ingested raw CSV files into Parquet files and loads them into the transformed prefix.
The CloudFormation template created an EventBridge rule to forward S3 PutObject API events to AWS Glue. Let’s review the configuration of the EventBridge rule:
s3_file_upload_trigger_rule-<CloudFormation-stack-name>.The event pattern shows that this rule is triggered when an S3 object is uploaded to s3://<bucket_name>/data/SharePoint/tablename_raw/. CloudTrail captures the PutObject API calls made and relays them as events to EventBridge.
To test the workflow, we run the ingest-glue-job-SharePoint-file job using the following steps:
ingest-glue-job-SharePoint-file job.You can now see the CSV files in the raw prefix of your S3 bucket.
Now the workflow should be triggered.
RUNNING state.When the workflow run status changes to Completed, let’s check the converted files in your S3 bucket.
You can see the Parquet files under s3://<bucket_name>/data/SharePoint/tablename_transformed/.
Congratulations! Your workflow ran successfully based on S3 events triggered by uploading files to your bucket. You can verify everything works as expected by running a query against the generated table using Amazon Athena.
Let’s analyze a sample red wine dataset. The following screenshot shows a SharePoint list that contains various readings that relate to the characteristics of the wine and an associated wine category. This is populated by various wine tasters from multiple countries.
The following screenshot shows a supplier dataset from the data lake with wine categories ordered per supplier.
We process the red wine dataset using this solution and use Athena to query the red wine data and supplier data where wine quality is greater than or equal to 7.
We can visualize the processed dataset using QuickSight.
To avoid incurring unnecessary charges, you can use the AWS CloudFormation console to delete the stack that you deployed. This removes all the resources you created when deploying the solution.
Event-driven architectures provide access to near-real-time information and help you make business decisions on fresh data. In this post, we demonstrated how to ingest and process SharePoint data using AWS serverless services like AWS Glue and EventBridge. We saw how to configure a rule in EventBridge to forward events to AWS Glue. You can use this pattern for your analytical use cases, such as joining SharePoint data with other data in your lake to generate insights, or auditing SharePoint data and compliance requirements.
 Venkata Sistla is a Big Data & Analytics Consultant on the AWS Professional Services team. He specializes in building data processing capabilities and helping customers remove constraints that prevent them from leveraging their data to develop business insights.
Post Syndicated from Netflix Technology Blog original https://netflixtechblog.com/bringing-av1-streaming-to-netflix-members-tvs-b7fc88e42320
by Liwei Guo, Ashwin Kumar Gopi Valliammal, Raymond Tam, Chris Pham, Agata Opalach, Weibo Ni
AV1 is the first high-efficiency video codec format with a royalty-free license from Alliance of Open Media (AOMedia), made possible by wide-ranging industry commitment of expertise and resources. Netflix is proud to be a founding member of AOMedia and a key contributor to the development of AV1. The specification of AV1 was published in 2018. Since then, we have been working hard to bring AV1 streaming to Netflix members.
In February 2020, Netflix started streaming AV1 to the Android mobile app. The Android launch leveraged the open-source software decoder dav1d built by the VideoLAN, VLC, and FFmpeg communities and sponsored by AOMedia. We were very pleased to see that AV1 streaming improved members’ viewing experience, particularly under challenging network conditions.
While software decoders enable AV1 playback for more powerful devices, a majority of Netflix members enjoy their favorite shows on TVs. AV1 playback on TV platforms relies on hardware solutions, which generally take longer to be deployed.
Throughout 2020 the industry made impressive progress on AV1 hardware solutions. Semiconductor companies announced decoder SoCs for a range of consumer electronics applications. TV manufacturers released TVs ready for AV1 streaming. Netflix has also partnered with YouTube to develop an open-source solution for an AV1 decoder on game consoles that utilizes the additional power of GPUs. It is amazing to witness the rapid growth of the ecosystem in such a short time.
Today we are excited to announce that Netflix has started streaming AV1 to TVs. With this advanced encoding format, we are confident that Netflix can deliver an even more amazing experience to our members. In this techblog, we share some details about our efforts for this launch as well as the benefits we foresee for our members.
Launching a new streaming format on TV platforms is not an easy job. In this section, we list a number of challenges we faced for this launch and share how they have been solved. As you will see, our “highly aligned, loosely coupled” culture played a key role in the success of this cross-functional project. The high alignment guides all teams to work towards the same goals, while the loose coupling keeps each team agile and fast paced.
AV1 targets a wide range of applications with numerous encoding tools defined in the specification. This leads to unlimited possibilities of encoding recipes and we needed to find the one that works best for Netflix streaming.
Netflix serves movies and TV shows. Production teams spend tremendous effort creating this art, and it is critical that we faithfully preserve the original creative intent when streaming to our members. To achieve this goal, the Encoding Technologies team made the following design decisions about AV1 encoding recipes:
We have a stream analyzer embedded in our encoding pipeline which ensures that all deployed Netflix AV1 streams are spec-compliant. TVs with an AV1 decoder also need to have decoding capabilities that meet the spec requirement to guarantee smooth playback of AV1 streams.
To evaluate decoder capabilities on these devices, the Encoding Technologies team crafted a set of special certification streams. These streams use the same production encoding recipes so they are representative of production streams, but have the addition of extreme cases to stress test the decoder. For example, some streams have a peak bitrate close to the upper limit allowed by the spec. The Client and UI Engineering team built a certification test with these streams to analyze both the device logs as well as the pictures rendered on the screen. Any issues observed in the test are flagged on a report, and if a gap in the decoding capability was identified, we worked with vendors to bring the decoder up to specification.
Video encoding is essentially a search problem — the encoder searches the parameter space allowed by all encoding tools and finds the one that yields the best result. With a larger encoding tool set than previous codecs, it was no surprise that AV1 encoding takes more CPU hours. At the scale that Netflix operates, it is imperative that we use our computational resources efficiently; maximizing the impact of the CPU usage is a key part of AV1 encoding, as is the case with every other codec format.
The Encoding Technologies team took a first stab at this problem by fine-tuning the encoding recipe. To do so, the team evaluated different tools provided by the encoder, with the goal of optimizing the tradeoff between compression efficiency and computational efficiency. With multiple iterations, the team arrived at a recipe that significantly speeds up the encoding with negligible compression efficiency changes.
Besides speeding up the encoder, the total CPU hours could also be reduced if we can use compute resources more efficiently. The Performance Engineering team specializes in optimizing resource utilization at Netflix. Encoding Technologies teamed up with Performance Engineering to analyze the CPU usage pattern of AV1 encoding and based on our findings, Performance Engineering recommended an improved CPU scheduling strategy. This strategy improves encoding throughput by right-sizing jobs based on instance types.
Even with the above improvements, encoding the entire catalog still takes time. One aspect of the Netflix catalog is that not all titles are equally popular. Some titles (e.g., La Casa de Papel) have more viewing than others, and thus AV1 streams of these titles can reach more members. To maximize the impact of AV1 encoding while minimizing associated costs, the Data Science and Engineering team devised a catalog rollout strategy for AV1 that took into consideration title popularity and a number of other factors.
With this launch, AV1 streaming reaches tens of millions of Netflix members. Having a suite of tools that can provide summarized metrics for these streaming sessions is critical to the success of Netflix AV1 streaming.
The Data Science and Engineering team built a number of dashboards for AV1 streaming, covering a wide range of metrics from streaming quality of experience (“QoE”) to device performance. These dashboards allow us to monitor and analyze trends over time as members stream AV1. Additionally, the Data Science and Engineering team built a dedicated AV1 alerting system which detects early signs of issues in key metrics and automatically sends alerts to teams for further investigation. Given AV1 streaming is at a relatively early stage, these tools help us be extra careful to avoid any negative member experience.
We compared AV1 to other codecs over thousands of Netflix titles, and saw significant compression efficiency improvements from AV1. While the result of this offline analysis was very exciting, what really matters to us is our members’ streaming experience.
To evaluate how the improved compression efficiency from AV1 impacts the quality of experience (QoE) of member streaming, A/B testing was conducted before the launch. Netflix encodes content into multiple formats and selects the best format for a given streaming session by considering factors such as device capabilities and content selection. Therefore, multiple A/B tests were created to compare AV1 with each of the applicable codec formats. In each of these tests, members with eligible TVs were randomly allocated to one of two cells, “control” and “treatment”. Those allocated to the “treatment” cell received AV1 streams while those allocated to the “control” cell received streams of the same codec format as before.
In all of these A/B tests, we observed improvements across many metrics for members in the “treatment” cell, in-line with our expectations:
Our initial launch includes a number of AV1 capable TVs as well as TVs connected with PS4 Pro. We are working with external partners to enable more and more devices for AV1 streaming. Another exciting direction we are exploring is AV1 with HDR. Again, the teams at Netflix are committed to delivering the best picture quality possible to our members. Stay tuned!
This is a collective effort with contributions from many of our colleagues at Netflix. We would like to thank

If you are passionate about video technologies and interested in what we are doing at Netflix, come and chat with us! The Encoding Technologies team currently has a number of openings, and we can’t wait to have more stunning engineers joining us.
Senior Software Engineer, Encoding Technologies
Senior Software Engineer, Video & Image Encoding
Senior Software Engineer, Media Systems
Bringing AV1 Streaming to Netflix Members’ TVs was originally published in Netflix TechBlog on Medium, where people are continuing the conversation by highlighting and responding to this story.
Post Syndicated from original https://lwn.net/Articles/875367/rss
The Julia programming language has
it roots in high-performance scientific computing, so it is no surprise
that it has facilities for concurrent processing. Those features are not
well-known outside of the Julia community, though, so it is interesting to
see the different types of parallel and concurrent computation that the
language supports. In addition, the upcoming release of Julia
version 1.7 brings an improvement to the language’s
concurrent-computation palette,
in the form of “task
migration”.
Post Syndicated from Dr. Yannick Misteli original https://aws.amazon.com/blogs/big-data/how-roche-democratized-access-to-data-with-google-sheets-and-amazon-redshift-data-api/
This post was co-written with Dr. Yannick Misteli, João Antunes, and Krzysztof Wisniewski from the Roche global Platform and ML engineering team as the lead authors.
Roche is a Swiss multinational healthcare company that operates worldwide. Roche is the largest pharmaceutical company in the world and the leading provider of cancer treatments globally.
In this post, Roche’s global Platform and machine learning (ML) engineering team discuss how they used Amazon Redshift data API to democratize access to the data in their Amazon Redshift data warehouse with Google Sheets (gSheets).
Go-To-Market (GTM) is the domain that lets Roche understand customers and create and deliver valuable services that meet their needs. This lets them get a better understanding of the health ecosystem and provide better services for patients, doctors, and hospitals. It extends beyond health care professionals (HCPs) to a larger Healthcare ecosystem consisting of patients, communities, health authorities, payers, providers, academia, competitors, etc. Data and analytics are essential to supporting our internal and external stakeholders in their decision-making processes through actionable insights.
For this mission, Roche embraced the modern data stack and built a scalable solution in the cloud.
Driving true data democratization requires not only providing business leaders with polished dashboards or data scientists with SQL access, but also addressing the requirements of business users that need the data. For this purpose, most business users (such as Analysts) leverage Excel—or gSheet in the case of Roche—for data analysis.
Providing access to data in Amazon Redshift to these gSheets users is a non-trivial problem. Without a powerful and flexible tool that lets data consumers use self-service analytics, most organizations will not realize the promise of the modern data stack. To solve this problem, we want to empower every data analyst who doesn’t have an SQL skillset with a means by which they can easily access and manipulate data in the applications that they are most familiar with.
The Roche GTM organization uses the Redshift Data API to simplify the integration between gSheets and Amazon Redshift, and thus facilitate the data needs of their business users for analytical processing and querying. The Amazon Redshift Data API lets you painlessly access data from Amazon Redshift with all types of traditional, cloud-native, and containerized, serverless web service-based applications and event-driven applications. Data API simplifies data access, ingest, and egress from languages supported with AWS SDK, such as Python, Go, Java, Node.js, PHP, Ruby, and C++ so that you can focus on building applications as opposed to managing infrastructure. The process they developed using Amazon Redshift Data API has significantly lowered the barrier for entry for new users without needing any data warehousing experience.
In this post, you will learn how to integrate Amazon Redshift with gSheets to pull data sets directly back into gSheets. These mechanisms are facilitated through the use of the Amazon Redshift Data API and Google Apps Script. Google Apps Script is a programmatic way of manipulating and extending gSheets and the data that they contain.
It is possible to include publicly available JS libraries such as JQuery-builder provided that Apps Script is natively a cloud-based Javascript platform.
The JQuery builder library facilitates the creation of standard SQL queries via a simple-to-use graphical user interface. The Redshift Data API can be used to retrieve the data directly to gSheets with a query in place. The following diagram illustrates the overall process from a technical standpoint:
Even though AppsScript is, in fact, Javascript, the AWS-provided SDKs for the browser (NodeJS and React) cannot be used on the Google platform, as they require specific properties that are native to the underlying infrastructure. It is possible to authenticate and access AWS resources through the available API calls. Here is an example of how to achieve that.
You can use an access key ID and a secret access key to authenticate the requests to AWS by using the code in the link example above. We recommend following the least privilege principle when granting access to this programmatic user, or assuming a role with temporary credentials. Since each user will require a different set of permissions on the Redshift objects—database, schema, and table—each user will have their own user access credentials. These credentials are safely stored under the AWS Secrets Manager service. Therefore, the programmatic user needs a set of permissions that enable them to retrieve secrets from the AWS Secrets Manager and execute queries against the Redshift Data API.
In this section, you will learn how to pull existing data back into a new gSheets Document. This section will not cover how to parse the data from the JQuery-builder library, as it is not within the main scope of the article.


In the scripts above, there is a direct integration between AWS Secrets Manager and Google Apps Script. The scripts above can extract the currently-authenticated user’s Google email address. Using this value and a set of annotated tags, the script can appropriately pull the user’s credentials securely to authenticate the requests made to the Amazon Redshift cluster. Follow these steps to set up a new user in an existing Amazon Redshift cluster. Once the user has been created, follow these steps for creating a new AWS Secrets Manager secret for your cluster. Make sure that the appropriate tag is applied with the key of “email” along with the corresponding user’s Google email address. Here is a sample configuration that is used for creating Redshift groups, users, and data shares via the Redshift Data API:
Providing access to live data that is hosted in Redshift directly to the business users and enabling true self-service decrease the burden on platform teams to provide data extracts or other mechanisms to deliver up-to-date information. Additionally, by not having different files and versions of data circulating, the business risk of reporting different key figures or KPI can be reduced, and an overall process efficiency can be achieved.
The initial success of this add-on in GTM led to the extension of this to a broader audience, where we are hoping to serve hundreds of users with all of the internal and public data in the future.
In this post, you learned how to create new Amazon Redshift tables and pull existing Redshift tables into a Google Sheet for business users to easily integrate with and manipulate data. This integration was seamless and demonstrated how easy the Amazon Redshift Data API makes integration with external applications, such as Google Sheets with Amazon Redshift. The outlined use-cases above are just a few examples of how the Amazon Redshift Data API can be applied and used to simplify interactions between users and Amazon Redshift clusters.
 Dr. Yannick Misteli is leading cloud platform and ML engineering teams in global product strategy (GPS) at Roche. He is passionate about infrastructure and operationalizing data-driven solutions, and he has broad experience in driving business value creation through data analytics.
 João Antunes is a Data Engineer in the Global Product Strategy (GPS) team at Roche. He has a track record of deploying Big Data batch and streaming solutions for the telco, finance, and pharma industries.
Krzysztof Wisniewski is a back-end JavaScript developer in the Global Product Strategy (GPS) team at Roche. He is passionate about full-stack development from the front-end through the back-end to databases.
 Matt Noyce is a Senior Cloud Application Architect at AWS. He works together primarily with Life Sciences and Healthcare customers to architect and build solutions on AWS for their business needs.
 Debu Panda, a Principal Product Manager at AWS, is an industry leader in analytics, application platform, and database technologies, and has more than 25 years of experience in the IT world. Debu has published numerous articles on analytics, enterprise Java, and databases and has presented at multiple conferences such as re:Invent, Oracle Open World, and Java One. He is lead author of the EJB 3 in Action (Manning Publications 2007, 2014) and Middleware Management (Packt).
Post Syndicated from Crosstalk Solutions original https://www.youtube.com/watch?v=7VDpPwV6kS0
Post Syndicated from Sudarshan Roy original https://aws.amazon.com/blogs/architecture/migrating-to-an-amazon-redshift-cloud-data-warehouse-from-microsoft-aps/
Before cloud data warehouses (CDWs), many organizations used hyper-converged infrastructure (HCI) for data analytics. HCIs pack storage, compute, networking, and management capabilities into a single “box” that you can plug into your data centers. However, because of its legacy architecture, an HCI is limited in how much it can scale storage and compute and continue to perform well and be cost-effective. Using an HCI can impact your business’s agility because you need to plan in advance, follow traditional purchase models, and maintain unused capacity and its associated costs. Additionally, HCIs are often proprietary and do not offer the same portability, customization, and integration options as with open-standards-based systems. Because of their proprietary nature, migrating HCIs to a CDW can present technical hurdles, which can impact your ability to realize the full potential of your data.
One of these hurdles includes using AWS Schema Conversion Tool (AWS SCT). AWS SCT is used to migrate data warehouses, and it supports several conversions. However, when you migrate Microsoft’s Analytics Platform System (APS) SQL Server Parallel Data Warehouse (PDW) platform using only AWS SCT, it results in connection errors due to the lack of server-side cursor support in Microsoft APS. In this blog post, we show you three approaches that use AWS SCT combined with other AWS services to migrate Microsoft’s Analytics Platform System (APS) SQL Server Parallel Data Warehouse (PDW) HCI platform to Amazon Redshift. These solutions will help you overcome elasticity, scalability, and agility constraints associated with proprietary HCI analytics platforms and future proof your analytics investment.
Though using AWS SCT only will result in server-side cursor errors, you can pair it with other AWS services to migrate your data warehouses to AWS. AWS SCT converts source database schema and code objects, including views, stored procedures, and functions, to be compatible with a target database. It highlights objects that require manual intervention. You can also scan your application source code for embedded SQL statements as part of database-schema conversion project. During this process, AWS SCT optimizes cloud-native code by converting legacy Oracle and SQL Server functions to their equivalent AWS service. This helps you modernize applications simultaneously. Once conversion is complete, AWS SCT can also migrate data.
Figure 1 shows a standard AWS SCT implementation architecture.
The next section shows you how to pair AWS SCT with other AWS services to migrate a Microsoft APS PDW to Amazon Redshift CDW. We prove you a base approach and two extensions to use for data warehouses with larger datasets and longer release outage windows.
The base approach uses Amazon Elastic Compute Cloud (Amazon EC2) to host a SQL Server in a symmetric multi-processing (SMP) architecture that is supported by AWS SCT, as opposed to Microsoft’s APS PDW’s massively parallel processing (MPP) architecture. By changing the warehouse’s architecture from MPP to SMP and using AWS SCT, you’ll avoid server-side cursor support errors.
Here’s how you’ll set up the base approach (Figure 2):
The base approach overcomes server-side issues you would have during a direct migration. However, many organizations host terabytes (TB) of data. To migrate such a large dataset, you’ll need to adjust your approach.
The following sections extend the base approach. They still use the base approach to convert the schema and procedures, but the dataset is handled via separate processes.
Note: AWS Snowball Edge is a Region-specific service. Verify that the service is available in your Region before planning your migration. See Regional Table to verify availability.
Snowball Edge lets you transfer large datasets to the cloud at faster-than-network speeds. Each Snowball Edge device can hold up to 100 TB and uses 256-bit encryption and an industry-standard Trusted Platform Module to ensure security and full chain-of-custody for your data. Furthermore, higher volumes can be transferred by clustering 5–10 devices for increased durability and storage.
Extension 1 enhances the base approach to allow you to transfer large datasets (Figure 3) while simultaneously setting up an SMP SQL Server on Amazon EC2 for delta transfers. Here’s how you’ll set it up:
Note: Where sequence numbers overlap in the diagram is a suggestion to possible parallel execution
Extension 1 transfers initial load and later applies delta load. This adds time to the project because of longer cutover release schedules. Additionally, you’ll need to plan for multiple separate outages, Snowball lead times, and release management timelines.
Note that not all analytics systems are classified as business-critical systems, so they can withstand a longer outage, typically 1-2 days. This gives you an opportunity to use AWS DataSync as an additional extension to complete initial and delta load in a single release window.
DataSync speeds up data transfer between on-premises environments and AWS. It uses a purpose-built network protocol and a parallel, multi-threaded architecture to accelerate your transfers.
Figure 4 shows the solution extension, which works as follows:
Note: where sequence numbers overlap in the diagram is a suggestion to possible parallel execution
Transfer rates for DataSync depend on the amount of data, I/O, and network bandwidth available. A single DataSync agent can fully utilize a 10 gigabit per second (Gbps) AWS Direct Connect link to copy data from on-premises to AWS. As such, depending on initial load size, transfer window calculations must be done prior to finalizing transfer windows.
The approach and its extensions mentioned in this blog post provide mechanisms to migrate your Microsoft APS workloads to an Amazon Redshift CDW. They enable elasticity, scalability, and agility for your workload to future proof your analytics investment.
Post Syndicated from Crosstalk Solutions original https://www.youtube.com/watch?v=7v6DMbiPGmU
Post Syndicated from Talks at Google original https://www.youtube.com/watch?v=-PEXveXzV-k
Post Syndicated from Caitlin Condon original https://blog.rapid7.com/2021/11/09/opportunistic-exploitation-of-zoho-manageengine-and-sitecore-cves/

Over the weekend of November 6, 2021, Rapid7’s Incident Response (IR) and Managed Detection and Response (MDR) teams began seeing opportunistic exploitation of two unrelated CVEs:
Attackers appear to be targeting vulnerabilities with attacks that drop webshells and install coin miners on vulnerable targets. The majority of the compromises Rapid7’s services teams have seen are the result of vulnerable Sitecore instances. Both CVEs are patched; ManageEngine ADSelfService Plus and Sitecore XP customers should prioritize fixes on an urgent basis, without waiting for regularly scheduled patch cycles.
The following attacker behavior detections are available to InsightIDR and MDR customers and will alert security teams to webshells and powershell activity related to this attack:
InsightVM and Nexpose customers can assess their exposure to Zoho ManageEngine CVE-2021-40539 with a remote vulnerability check. Rapid7 vulnerability researchers have a full technical analysis of this vulnerability available here. Our research teams are investigating the feasibility of adding a vulnerability check for Sitecore XP CVE-2021-42237. A technical analysis of this vulnerability is available here.
Post Syndicated from Jeremy Milk original https://www.backblaze.com/blog/ransomware-takeaways-q3-2021/
While the first half of 2021 saw disruptive, high-profile attacks, Q3 saw attention and intervention at the highest levels. Last quarter, cybercriminals found themselves in the sights of government and law enforcement agencies as they responded to the vulnerabilities the earlier attacks revealed. Despite these increased efforts, the ransomware threat remains, simply because the rewards continue to outweigh the risks for bad actors.
If you’re responsible for protecting company data, ransomware news is certainly on your radar. In this series of posts, we aim to keep you updated on evolving trends as we see them to help inform your IT decision-making. Here are five key takeaways from our monitoring over Q3 2021.
No surprises here. Ransomware operators continued to carry out attacks—against Howard University, Accenture, and the fashion brand Guess, to name a few. In August, the FBI’s Cyber Division and the Cybersecurity and Infrastructure Security Agency (CISA) reported an increase in attacks on holidays and weekends and alerted businesses to be more vigilant as we approach major holidays. Then, in early September, the FBI also noticed an uptick in attacks on the food and agriculture sector. The warnings proved out, and in late September, we saw a number of attacks against farming cooperatives in Iowa and Minnesota. While the attacks were smaller in scale compared to those earlier in the year, the reporting speaks to the fact that ransomware is definitely not a fad that’s on a downswing.
Heads of state and government agencies took action in response to the ransomware threat last quarter. In September, the U.S. Treasury Department updated an Advisory that discourages private companies from making ransomware payments, and outlines mitigating factors it would consider when determining a response to sanctions violations. The Advisory makes clear that the Treasury will expect companies to do more to proactively protect themselves, and may be less forgiving to those who pay ransoms without doing so.
Earlier in July, the TSA also issued a Security Directive that requires pipeline owners and operators to implement specific security measures against ransomware, develop recovery plans, and conduct a cybersecurity architecture review. The moves demonstrate all the more that the government doesn’t take the ransomware threat lightly, and may continue to escalate actions.
Two major ransomware syndicates, REvil and Darkside, went dark days after President Joe Biden’s July warning to Russian President Vladimir Putin to rein in ransomware operations. We now see this was but a pause. However, the rapid shuttering does suggest executive branch action can make a difference, in one country or another.
Keep in mind, though, that the ransomware operators themselves are just one part of the larger ransomware economy (detailed in the infographic at the bottom of the post). Two other players within the ransomware economy faced increased pressure this past quarter—currency exchanges and cyber insurance carriers.
In messages with Bloomberg News, the BlackMatter syndicate pointed out its rules of engagement, saying hospitals, defense, and governments are off limits. But, sectors that are off limits to some are targets for others. While some syndicates work to define a code of conduct for criminality, victims continue to suffer. According to a Ponemon survey of 597 health care organizations, ransomware attacks have a significant impact on patient care. Respondents reported longer length of stay (71%), delays in procedures and tests (70%), increase in patient transfers or facility diversions (65%), and an increase in complications from medical procedures (36%) and mortality rates (22%).
It’s not surprising that ransomware operators would steal from their own, but that doesn’t make it any less comical to hear low-level ransomware affiliates complaining of “lousy partner programs” hawked by ransomware gangs “you cannot trust.” ZDNet reports that the REvil group has been accused of coding a “backdoor” into their affiliate product that allows the group to barge into negotiations and take the keep all for themselves. It’s a dog-eat-dog world out there.
This quarter, the good news is that ransomware has caught the attention of the people who can take steps to curb it. Government recommendations to strengthen ransomware protection make investing the time and effort easier to justify, especially when it comes to your cloud strategy. If there’s anything this quarter taught us, it’s that ransomware protection should be priority number one.

If you want to share this infographic on your site, copy the code below and paste into a Custom HTML block.
<div><div><strong>The Ransomware Economy</strong></div><a href="https://www.backblaze.com/blog/ransomware-takeaways-q3-2021/"><img src="https://www.backblaze.com/blog/wp-content/uploads/2021/11/The-Ransomware-Economy-Q3-2021-scaled.jpg" border="0" alt="diagram of the players and elements involved in spreading ransomware" title="diagram of the players and elements involved in spreading ransomware" /></a></div>The post Ransomware Takeaways: Q3 2021 appeared first on Backblaze Blog | Cloud Storage & Cloud Backup.
Post Syndicated from James Beswick original https://aws.amazon.com/blogs/compute/creating-static-custom-domain-endpoints-with-amazon-mq-for-rabbitmq/
This post is written by Nate Bachmeier, Senior Solutions Architect, Wallace Printz, Senior Solutions Architect, Christian Mueller, Principal Solutions Architect.
Many cloud-native application architectures take advantage of the point-to-point and publish-subscribe, or “pub-sub”, model of message-based communication between application components. Not only is this architecture generally more resilient to failure because of the loose coupling and because message processing failures can be retried, it is also more efficient because individual application components can independently scale up or down to maintain message processing SLAs, compared to monolithic application architectures.
Synchronous (REST-based) systems are tightly coupled. A problem in a synchronous downstream dependency has immediate impact on the upstream callers. Retries from upstream callers can fan out and amplify problems.
For applications requiring messaging protocols including JMS, NMS, AMQP, STOMP, MQTT, and WebSocket, Amazon provides Amazon MQ. This is a managed message broker service for Apache ActiveMQ and RabbitMQ that makes it easier to set up and operate message brokers in the cloud.
Amazon MQ provides two managed broker deployment connection options: public brokers and private brokers. Public brokers receive internet-accessible IP addresses while private brokers receive only private IP addresses from the corresponding CIDR range in their VPC subnet. In some cases, for security purposes, customers may prefer to place brokers in a private subnet, but also allow access to the brokers through a persistent public endpoint, such as a subdomain of their corporate domain like ‘mq.example.com’.
This blog explains how to provision private Amazon MQ brokers behind a secure public load balancer endpoint using an example subdomain.
AmazonMQ also supports ActiveMQ – to learn more, read Creating static custom domain endpoints with Amazon MQ to simplify broker modification and scaling.
There are several reasons one might want to deploy this architecture beyond the security aspects. First, human-readable URLs are easier for people to parse when reviewing operations and troubleshooting, such as deploying updates to ‘mq-dev.example.com’ before ‘mq-prod.example.com’. Additionally, maintaining static URLs for your brokers helps reduce the necessity of modifying client code when performing maintenance on the brokers.
The following diagram shows the solutions architecture. This blog post assumes some familiarity with AWS networking fundamentals, such as VPCs, subnets, load balancers, and Amazon Route 53. For additional information on these topics, see the Elastic Load Balancing documentation.
To build this architecture, you build the network segmentation first, then add the Amazon MQ brokers, and finally the network routing. You need a VPC, one private subnet per Availability Zone, and one public subnet for your bastion host (if desired).
This demonstration VPC uses the 10.0.0.0/16 CIDR range. Additionally, you must create a custom security group for your brokers. You must set up this security group to allow traffic from your Network Load Balancer to the RabbitMQ brokers.
This example does not use this VPC for other workloads so it allows all incoming traffic that originates within the VPC (which includes the NLB) through to the brokers on the AMQP port of 5671 and the web console port of 443.
With the network segmentation set up, add the Amazon MQ brokers:
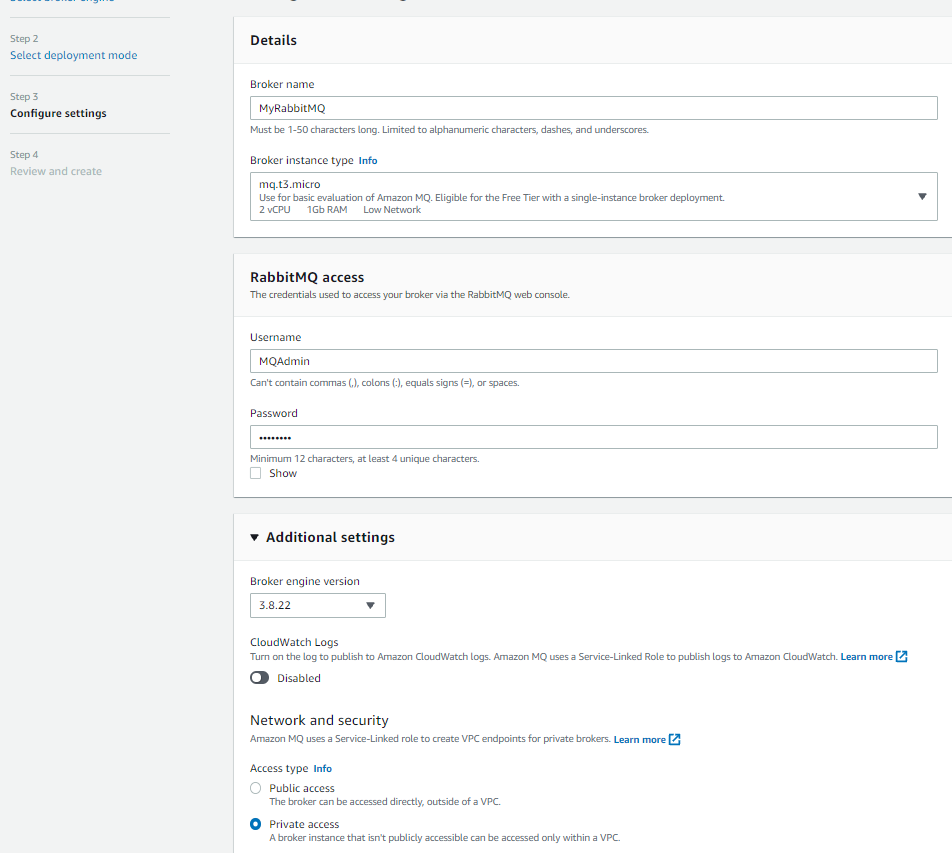
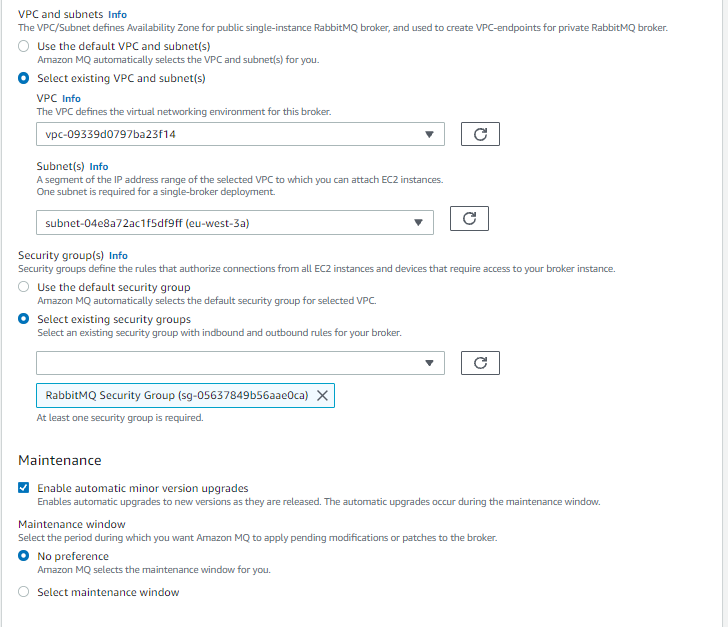
Before configuring the NLB’s target groups, you must look up the broker’s IP address. Unlike Amazon MQ for Apache ActiveMQ, RabbitMQ does not show its private IP addresses, though you can reliably find its VPC endpoints using DNS. Amazon MQ creates one VPC endpoint in each subnet with a static address that won’t change until you delete the broker.
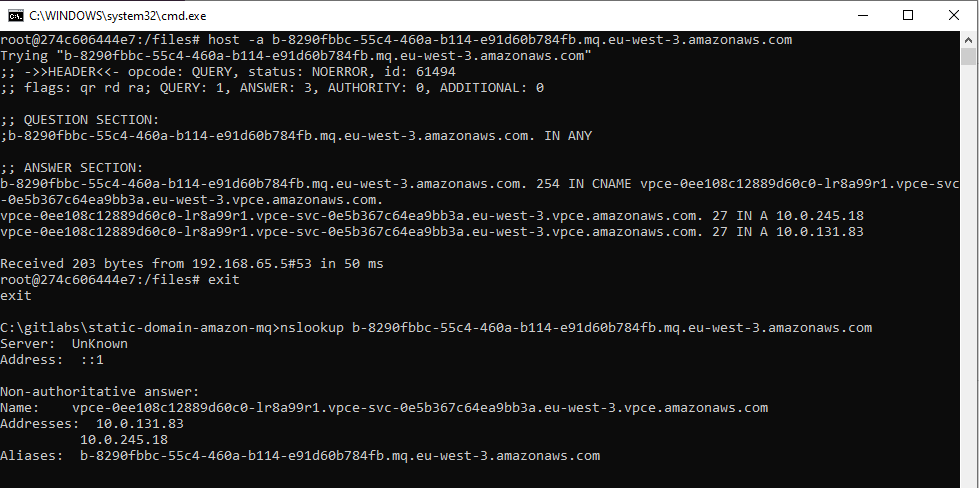
The next step in the build process is to configure the load balancer’s target group. You use the private IP addresses of the brokers as targets for the NLB. Create a Target Group, select the target type as IP, and make sure to choose the TLS protocol and for each required port, as well as the VPC your brokers reside in.
It is important to configure the health check settings so traffic is only routed to active brokers. Select the TCP protocol and override the health check port to 443 Rabbit MQ’s console port. Also, configure the healthy threshold to 2 with a 10-second check interval so the NLB detects faulty hosts within 20 seconds.
Be sure not to use RabbitMQ’s AMQP port as the target group health check port. The NLB may not be able to recognize the host as healthy on that port. It is better to use the broker’s web console port.
Add the VPC endpoint addresses as NLB targets. The NLB routes traffic across the endpoints and provides networking reliability if an AZ is offline. Finally, configure the health checks to use the web console (TCP port 443).
Next, you create a Network Load Balancer. This is an internet-facing load balancer with TLS listeners on port 5671 (AMQP), routing traffic to the brokers’ VPC and private subnets. You select the target group you created, selecting TLS for the connection between the NLB and the brokers. To allow clients to connect to the NLB securely, select an ACM certificate for the subdomain registered in Route 53 (for example ‘mq.example.com’).
To learn about ACM certificate provisioning, read more about the process here. Make sure that the ACM certificate is provisioned in the same Region as the NLB or the certificate is not shown in the dropdown menu.
The NLB is globally accessible and this may be overly permissive for some workloads. You can restrict incoming traffic to specific IP ranges on the NLB’s public subnet by using network access control list (NACL) configuration:
Finally, configure Route 53 to serve traffic at the subdomain of your choice to the NLB:
Now callers can use the friendly name in the RabbitMQ connection string. This capability improves the developer experience and reduces operational cost when rebuilding the cluster. Since you added multiple VPC endpoints (one per subnet) into the NLB’s target group, the solution has Multi-AZ redundancy.
The entire process can be tested using any RabbitMQ client process. One approach is to launch the official Docker image and connect with the native client. The service documentation also provides sample code for authenticating, publishing, and subscribing to RabbitMQ channels.
To log in to the broker’s RabbitMQ web console, there are three options. Due to the security group rules, only traffic originating from inside the VPC is allowed to the brokers:
In this post, you build a highly available Amazon MQ broker in a private subnet. You layer security by placing the brokers behind a highly scalable Network Load Balancer. You configure routing from a single custom subdomain URL to multiple brokers with a built-in health check.
For more serverless learning resources, visit Serverless Land.
Post Syndicated from original https://lwn.net/Articles/875531/rss
Security updates have been issued by Arch Linux (firefox, grafana, jenkins, opera, and thunderbird), Debian (botan1.10 and ckeditor), openSUSE (chromium, kernel, qemu, and rubygem-activerecord-5_1), SUSE (qemu and rubygem-activerecord-5_1), and Ubuntu (docker.io, kernel, linux, linux-aws, linux-aws-5.11, linux-azure, linux-azure-5.11, linux-gcp, linux-gcp-5.11, linux-hwe-5.11, linux-kvm, linux-oem-5.13, linux-oracle, linux-oracle-5.11, linux, linux-aws, linux-aws-5.4, linux-azure, linux-azure-5.4, linux-gcp, linux-gcp-5.4, linux-gke, linux-gkeop, linux-gkeop-5.4, linux-hwe-5.4, linux-ibm, linux-kvm, and linux, linux-aws, linux-aws-hwe, linux-azure, linux-azure-4.15, linux-dell300x, linux-gcp-4.15, linux-hwe, linux-kvm, linux-oracle, linux-raspi2, linux-snapdragon).
Post Syndicated from Eitan Sela original https://aws.amazon.com/blogs/architecture/running-a-cost-effective-nlp-pipeline-on-serverless-infrastructure-at-scale/
Amenity Analytics develops enterprise natural language processing (NLP) platforms for the finance, insurance, and media industries that extract critical insights from mountains of documents. We provide a scalable way for businesses to get a human-level understanding of information from text.
In this blog post, we will show how Amenity Analytics improved the continuous integration (CI) pipeline speed by 15x. We hope that this example can help other customers achieve high scalability using AWS Step Functions Express.
Amenity Analytics’ models are developed using both a test-driven development (TDD) and a behavior-driven development (BDD) approach. We verify the model accuracy throughout the model lifecycle—from creation to production, and on to maintenance.
One of the actions in the Amenity Analytics model development cycle is backtesting. It is an important part of our CI process. This process consists of two steps running in parallel:
The backtesting process utilizes hundreds of thousands of annotated examples in each “code build.” To accomplish this, we initially used the AWS Step Functions default workflow. AWS Step Functions is a low-code visual workflow service used to orchestrate AWS services, automate business processes, and build serverless applications. Workflows manage failures, retries, parallelization, service integrations, and observability.
We found that Step Functions standard workflow has a bucket of 5,000 state transitions with a refill rate of 1,500. Each annotated example has ~10 state transitions. This creates millions of state transitions per code build. Since state transitions are limited and couldn’t be increased to our desired amount, we often faced delays and timeouts. Developers had to coordinate their work with each other, which inevitably slowed down the entire development cycle.
To resolve these challenges, we migrated from Step Functions standard workflows to Step Functions Express workflows, which have no limits on state transitions. In addition, we changed the way each step in the pipeline is initiated, from an async call to a sync API call.
When a model developer merges their new changes, the CI process starts the backtesting for all existing models.

Figure 1. Step Functions Express workflow solution
Step Functions Express supports only sync calls. Therefore, we replaced the previous async Amazon Simple Notification Service (SNS) and Amazon SQS, with sync calls to API Gateway.
Figure 2 shows the workflow for a single document in Step Function Express:

Figure 2. Workflow for a single document
For our base NLP analysis, we use Spacy. Figure 3 shows how we used it in Step Functions Express:

Figure 3. Base NLP analysis for a single document
Our backtesting migration was deployed on August 10, and unit testing migration on September 14. After the first migration, the CI was limited by the unit tests, which took ~25 minutes. When the second migration was deployed, the process time was reduced to ~6 minutes (P95).

Figure 4. Process time reduced from 50 minutes to 6 minutes
By migrating from standard Step Functions to Step Functions Express, Amenity Analytics increased processing speed 15x. A complete pipeline that used to take ~45 minutes with standard Step Functions, now takes ~3 minutes using Step Functions Express. This migration removed the need for users to coordinate workflow processes to create a build. Unit testing (TDD) went from ~25 mins to ~30 seconds. Backtesting (BDD) went from taking more than 1 hour to ~6 minutes.
Switching to Step Functions Express allows us to focus on delivering business value faster. We will continue to explore how AWS services can help us drive more value to our users.
For further reading:
Post Syndicated from Sam Adams original https://blog.rapid7.com/2021/11/09/insightidr-was-xdr-before-xdr-was-even-a-thing-an-origin-story/

An origin story explains who you are and why. Spiderman has one. So do you.
Rapid7 began building InsightIDR in 2013. It was the year Yahoo’s epic data breach exposed the names, dates of birth, passwords, and security questions and answers of 3 billion users.
Back then, security professionals simply wanted data. If somebody could just ingest it all and send it, they’d take it from there. So the market focused on vast quantities of data — data first, most of it noisy and useless. Rapid7 went a different way: detections first.
We studied how the bad guys attacked networks and figured out what we needed to find them (with the help of our friends on the Metasploit project). Then we wrote and tested those detections, assembled a library, and enabled users to tune the detections to their environments. It sounds so easy now, in this short paragraph, but of course it wasn’t.
At last, in 2015, we sat down with industry analysts right before launch. Questions flew.
“You’re calling it InsightIDR? What does IDR stand for?”
Incident. Detection. Response.
And that’s when the tongue-lashing started. It went something like this: “Incident Detection and Response is a market category, not a product! You need 10 different products to actually do that! It’s too broad! You’re trying to do too much!”
And then the coup de grace: “Your product name is stupid.”
When you’re trying to be disruptive, the scariest thing is quiet indifference. Any big reaction is great, even if you get called wrong. So we thought maybe we were onto something.
At that time, modern workers were leaving more ways to find them online: LinkedIn, Facebook, Gmail. Attackers found them. We all became targets. There were 4 billion data records taken in 2016, nearly all because of stolen passwords or weak, guessable ones. Of course, intruders masquerading as employees were not caught by traditional monitoring. While it’s a fine idea to set password policy and train employees in security hygiene, we decided to study human nature rather than try to change it.
At the heart of what we were doing was a new way of tracking activity, and condensing noisy data into meaningful events. With User and Entity Behavior Analytics (UEBA), InsightIDR continuously baselines “normal” user behavior so it spots anomalies, risks, and ultimately malicious behavior fast, helping you break the attack chain.
But UEBA is only part of a detection and response platform. So we added traditional SIEM capabilities like our proprietary data lake technology (that has allowed us to avoid the ingestion-based pricing that plagues the market), file integrity monitoring and compliance dashboards and reports.
We also added some not-so-traditional capabilities like Attacker Behavior Analytics and Endpoint Detection and Response. EDR was ready for its own disruption. EDR vendors continue to be focused on agent data collection. But we decided years ago that detection engineering and curation — zeroing in on evil — is the way to do EDR.
In 2017, we added security orchestration and automation to the Insight platform. XDR is all about analyst efficiency and for that you need more and more automation. Next, our own Network Sensor and full SOAR capabilities took even more burden off analysts. The visibility triad was soon complete when we added network detection and response.
Some time the following year, the founder and CTO of Palo Alto Networks coined the acronym “XDR” to explain the “symphony” that great cybersecurity would require. (Hey, at least we had a name for it now.)
Then, in 2021, three things happened.
First, Rapid7 acquired Velociraptor, an open-source platform focused on endpoint monitoring, digital forensics, and incident response. (We’ve been committed to open source since 2009, when we acquired Metasploit, now the world’s most used penetration testing network with a community of collaborators 300,000 strong.)
Second, with perimeters so stretched they broke, we acquired IntSights. Customers now benefit from unrivaled internal and external threat intelligence, covering the clear, deep, and dark web. We’ll compare InsightIDR’s high-fidelity alerts and signal-to-noise ratio to anyone’s.
Third and finally, XDR became all the buzz. Seriously, not a day, a conference, or a trade pub goes by. The buzz includes debate about the exact definition of XDR, speculation that it’s more buzz than bona fide, and concern that XDR could move very quickly through the Gartner Hype Cycle straight to the “Trough of Disillusionment.”
In a recent survey of customers in the Rapid7 Voice program (a group that provides input as we develop new ideas) 42% said they’re using InsightIDR to achieve XDR outcomes right now. I listened to one say he’s always surprised at the buzz and debate at conferences: don’t you know you can already do this stuff? I do this stuff!
By the way, he’s working entirely alone, a one-man show for a NASDAQ-listed global company in the health sector (a pretty hot target these days). Can XDR help with the industry’s skills gap problem, now in its fifth year? That’s for another blog.
For now, please download our eBook: “4 Ways XDR Levels Up Security Programs.” It’s a speedy education that comes from long experience. Happy reading.
Post Syndicated from The History Guy: History Deserves to Be Remembered original https://www.youtube.com/watch?v=bQWKAl7LkHs
By continuing to use the site, you agree to the use of cookies. more information
The cookie settings on this website are set to "allow cookies" to give you the best browsing experience possible. If you continue to use this website without changing your cookie settings or you click "Accept" below then you are consenting to this.