How Ruparupa gained updated insights with an Amazon S3 data lake, AWS Glue, Apache Hudi, and Amazon QuickSight

Post Syndicated from Adrianus Kurnadi original https://aws.amazon.com/blogs/big-data/how-ruparupa-gained-updated-insights-with-an-amazon-s3-data-lake-aws-glue-apache-hudi-and-amazon-quicksight/

This post is co-written with Olivia Michele and Dariswan Janweri P. at Ruparupa.

Ruparupa was built by PT. Omni Digitama Internusa with the vision to cultivate synergy and create a seamless digital ecosystem within Kawan Lama Group that touches and enhances the lives of many.

Ruparupa is the first digital platform built by Kawan Lama Group to give the best shopping experience for household, furniture, and lifestyle needs. Ruparupa’s goal is to help you live a better life, shown by the meaning of the word ruparupa, which means “everything.” We believe that everyone deserves the best, and home is where everything starts.

In this post, we show how Ruparupa implemented an incrementally updated data lake to get insights into their business using Amazon Simple Storage Service (Amazon S3), AWS Glue, Apache Hudi, and Amazon QuickSight. We also discuss the benefits Ruparupa gained after the implementation.

The data lake implemented by Ruparupa uses Amazon S3 as the storage platform, AWS Database Migration Service (AWS DMS) as the ingestion tool, AWS Glue as the ETL (extract, transform, and load) tool, and QuickSight for analytic dashboards.

Amazon S3 is an object storage service with very high scalability, durability, and security, which makes it an ideal storage layer for a data lake. AWS DMS is a database migration tool that supports many relational database management services, and also supports Amazon S3.

An AWS Glue ETL job, using the Apache Hudi connector, updates the S3 data lake hourly with incremental data. The AWS Glue job can transform the raw data in Amazon S3 to Parquet format, which is optimized for analytic queries. The AWS Glue Data Catalog stores the metadata, and Amazon Athena (a serverless query engine) is used to query data in Amazon S3.

AWS Secrets Manager is an AWS service that can be used to store sensitive data, enabling users to keep data such as database credentials out of source code. In this implementation, Secrets Manager is used to store the configuration of the Apache Hudi job for various tables.

Data analytic challenges

As an ecommerce company, Ruparupa produces a lot of data from their ecommerce website, their inventory systems, and distribution and finance applications. The data can be structured data from existing systems, and can also be unstructured or semi-structured data from their customer interactions. This data contains insights that, if unlocked, can help management make decisions to help increase sales and optimize cost.

Before implementing a data lake on AWS, Ruparupa had no infrastructure capable of processing the volume and variety of data formats in a short time. Data had to be manually processed by data analysts, and data mining took a long time. Because of the fast growth of data, it took 1–1.5 hours just to ingest data, which was hundreds of thousands of rows.

The manual process caused inconsistent data cleansing. After the data had been cleansed, some processes were often missing, and all the data had to go through another process of data cleansing.

This long processing time reduced the analytic team’s productivity. The analytic team could only produce weekly and monthly reports. This delay in report frequency impacted delivering important insights to management, and they couldn’t move fast enough to anticipate changes in their business.

The method used to create analytic dashboards was manual and could only produce a few routine reports. The audience of these few reports was limited—a maximum of 20 people from management. Other business units in Kawan Lama Group only consumed weekly reports that were prepared manually. Even the weekly reports couldn’t cover all important metrics, because some metrics were only available in monthly reports.

Initial solution for a real-time dashboard

The following diagram illustrates the initial solution Ruparupa implemented.

Initial solution architecture

Ruparupa started a data initiative within the organization to create a single source of truth within the company. Previously, business users could only get the sales data from the day before, and they didn’t have any visibility to current sales activities in their stores and websites.

To gain trust from business users, we wanted to provide the most updated data in an interactive QuickSight dashboard. We used an AWS DMS replication task to stream real-time change data capture (CDC) updates to an Amazon Aurora MySQL-Compatible Edition database, and built a QuickSight dashboard to replace the static presentation deck.

This pilot dashboard was accepted extremely well by the users, who now had visibility to their current data. However, the data source for the dashboard still resided in an Aurora MySQL database and only covered a single data domain.

The initial design had some additional challenges:

  • Diverse data source – The data source in an ecommerce platform consists of structured, semi-structured, and unstructured data, which requires flexible data storage. The initial data warehouse design in Ruparupa only stored transactional data, and data from other systems including user interaction data wasn’t consolidated yet.
  • Cost and scalability – Ruparupa wanted to build a future-proof data platform solution that could scale up to terabytes of data in the most cost-effective way.

The initial design also had some benefits:

  • Data updates – Data inside the initial data warehouse was delayed by 1 day. This was an improvement over the weekly report, but still not fast enough to make quicker decisions.

This solution only served as a temporary solution; we needed a more complete analytics solution that could serve more complex and larger data sources, faster, and cost-effectively.

Real-time data lake solution

To fulfill their requirements, Ruparupa introduced a mutable data lake, as shown in the following diagram.

Real time data lake solutions architecture

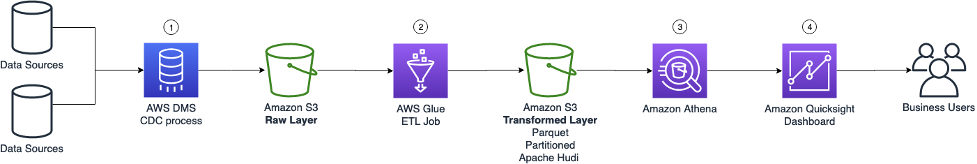
Let’s look at each main component in more detail.

AWS DMS CDC process

To get the real-time data from the source, we streamed the database CDC log using AWS DMS (component 1 in the architecture diagram). The CDC records consist of all inserts, updates, and deletes from the source database. This raw data is stored in the raw layer of the S3 data lake.

An S3 lifecycle policy is used to manage data retention, where the older data is moved to Amazon S3 Glacier.

AWS Glue ETL job

The second S3 data lake layer is the transformed layer, where the data is transformed to an optimized format that is ready for user query. The files are transformed to Parquet columnar format with snappy compression and table partitioning to optimize SQL queries from Athena.

In order to create a mutable data lake that can merge changes from the data source, we introduced an Apache Hudi data lake framework. With Apache Hudi, we can perform upserts and deletes on the transformed layer to keep the data consistent in a reliable manner. With a Hudi data lake, Ruparupa can create a single source of truth for all our data sources quickly and easily. The Hudi framework takes care of the underlying metadata of the updates, making it simple to implement across hundreds of tables in the data lake. We only need to configure the writer output to create a copy-on-write table depending on the access requirements. For the writer, we use an AWS Glue job writer combined with an AWS Glue Hudi connector frrom AWS Marketplace. The additional library from the connector helps AWS Glue understand how to write to Hudi.

An AWS Glue ETL job is used to get the changes from the raw layer and merge the changes in the transformed layer (component 2 in the architecture diagram). With AWS Glue, we are able to create a PySpark job to get the data, and we use the AWS Glue Connector for Apache Hudi to simplify the Hudi library import to the AWS Glue job. With AWS Glue, all the changes from AWS DMS can be merged easily to the Hudi data lake. The jobs are scheduled every hour using a built-in scheduler in AWS Glue.

Secrets Manager is used to store all the related parameters that are required to run the job. Instead of making one transformation job for each table, Ruparupa creates a single generic job that can transform multiple tables by using several parameters. The parameters that give details about the table structure are stored in Secrets Manager and can be retrieved using the name of the table as key. With these custom parameters, Ruparupa doesn’t need to create a job for every table—we can utilize a single job that can ingest the data for all different tables by passing the name of the table to the job.

All the metadata of the tables is stored in the AWS Glue Data Catalog, including the Hudi tables. This catalog is used by the AWS Glue ETL job, Athena query engine, and QuickSight dashboard.

Athena queries

Users can then query the latest data for their report using Athena (component 3 in the architecture diagram). Athena is serverless, so there is no infrastructure to provision or maintain. We can immediately use SQL to query the data lake to create a report or ingest the data to the dashboard.

QuickSight dashboard

Business users can use a QuickSight dashboard to query the data lake (component 4 in the architecture diagram). The existing dashboard is modified to get data from Athena, replacing the previous database. New dashboards were also created to fulfill continuously evolving needs for insights from multiple business units.

QuickSight is also used to notify certain parties when a value is reaching a certain threshold. An email alert is sent to an external notification and messaging platform so it can reach the end-user.

Business results

The data lake implementation in Ruparupa took around 3 months, with an additional month for data validation, before it was considered ready for production. With this solution, management can get the latest information view of their current state up to the last 1 hour. Previously, they could only generate weekly reports—now insights are available 168 times faster.

The QuickSight dashboard, which can be updated automatically, shortens the time required by the analytic team. The QuickSight dashboard now has more content—not only is transactional data reported, but also other metrics like new SKU, operation escalation for free services to customers, and monitoring SLA. Since April 2021 when Ruparupa started their QuickSight pilot, the number of dashboards has increased to around 70 based on requests from business users.

Ruparupa has hired new personnel to join the data analytic team to explore new possibilities and new use cases. The analytic team has grown from just one person to seven to handle new analytic use cases:

  • Merchandising
  • Operations
  • Store manager performance measurement
  • Insights of trending SKUs

Kawan Lama Group also has offline stores besides the ecommerce platform managed by Ruparupa. With the new dashboard, it’s easier to compare transaction data from online and offline stores because they now use the same platform.

The new dashboards also can be consumed by a broader audience, including other business units in Kawan Lama Group. The total users consuming the dashboard increased from just 20 users from management to around 180 users (9 times increase).

Since the implementation, other business units in Kawan Lama Group have increased their trust in the S3 data lake platform implemented by Ruparupa, because the data is more up to date and they can drill down to the SKU level to validate that the data is correct. Other business units can now act faster after an event like a marketing campaign. This data lake implementation has helped increase sales revenue in various business units in Kawan Lama Group.

Conclusion

Implementing a real-time data lake using Amazon S3, Apache Hudi, AWS Glue, Athena, and QuickSight gave Ruparupa the following benefits:

  • Yielded faster insights (hourly compared to weekly)
  • Unlocked new insights
  • Enabled more people in more business units to consume the dashboard
  • Helped business units in Kawan Lama Group act faster and increase sales revenue

If you’re interested in gaining similar benefits, check out Build a Data Lake Foundation with AWS Glue and Amazon S3.

You can also learn how to get started with QuickSight in the Getting Started guide.

Last but not least, you can learn about running Apache Hudi on AWS Glue in Writing to Apache Hudi tables using AWS Glue Custom Connector.


About the Authors

Olivia Michele is a Data Scientist Lead at Ruparupa, where she has worked in a variety of data roles over the past 5 years, including building and integrating Ruparupa data systems with AWS to improve user experience with data and reporting tools. She is passionate about turning raw information into valuable actionable insights and delivering value to the company.

Dariswan Janweri P. is a Data Engineer at Ruparupa. He considers challenges or problems as interesting riddles and finds satisfaction in solving them, and even more satisfaction by being able to help his colleagues and friends, “two birds one stone.” He is excited to be a major player in Indonesia’s technology transformation.

Adrianus Budiardjo Kurnadi is a Senior Solutions Architect at Amazon Web Services Indonesia. He has a strong passion for databases and machine learning, and works closely with the Indonesian machine learning community to introduce them to various AWS Machine Learning services. In his spare time, he enjoys singing in a choir, reading, and playing with his two children.

Nico Anandito is an Analytics Specialist Solutions Architect at Amazon Web Services Indonesia. He has years of experience working in data integration, data warehouses, and big data implementation in multiple industries. He is certified in AWS data analytics and holds a master’s degree in the data management field of computer science.

Improve collaboration between teams by using AWS CDK constructs

Post Syndicated from Joerg Woehrle original https://aws.amazon.com/blogs/devops/improve-collaboration-between-teams-by-using-aws-cdk-constructs/

There are different ways to organize teams to deliver great software products. There are companies that give the end-to-end responsibility for a product to a single team, like Amazon’s Two-Pizza teams, and there are companies where multiple teams split the responsibility between infrastructure (or platform) teams and application development teams. This post provides guidance on how collaboration efficiency can be improved in the case of a split-team approach with the help of the AWS Cloud Development Kit (CDK).

The AWS CDK is an open-source software development framework to define your cloud application resources. You do this by using familiar programming languages like TypeScript, Python, Java, C# or Go. It allows you to mix code to define your application’s infrastructure, traditionally expressed through infrastructure as code tools like AWS CloudFormation or HashiCorp Terraform, with code to bundle, compile, and package your application.

This is great for autonomous teams with end-to-end responsibility, as it helps them to keep all code related to that product in a single place and single programming language. There is no need to separate application code into a different repository than infrastructure code with a single team, but what about the split-team model?

Larger enterprises commonly split the responsibility between infrastructure (or platform) teams and application development teams. We’ll see how to use the AWS CDK to ensure team independence and agility even with multiple teams involved. We’ll have a look at the different responsibilities of the participating teams and their produced artifacts, and we’ll also discuss how to make the teams work together in a frictionless way.

This blog post assumes a basic level of knowledge on the AWS CDK and its concepts. Additionally, a very high level understanding of event driven architectures is required.

Team Topologies

Let’s first have a quick look at the different team topologies and each team’s responsibilities.

One-Team Approach

In this blog post we will focus on the split-team approach described below. However, it’s still helpful to understand what we mean by “One-Team” Approach: A single team owns an application from end-to-end. This cross-functional team decides on its own on the features to implement next, which technologies to use and how to build and deploy the resulting infrastructure and application code. The team’s responsibility is infrastructure, application code, its deployment and operations of the developed service.

If you’re interested in how to structure your AWS CDK application in a such an environment have a look at our colleague Alex Pulver’s blog post Recommended AWS CDK project structure for Python applications.

Split-Team Approach

In reality we see many customers who have separate teams for application development and infrastructure development and deployment.

Infrastructure Team

What I call the infrastructure team is also known as the platform or operations team. It configures, deploys, and operates the shared infrastructure which other teams consume to run their applications on. This can be things like an Amazon SQS queue, an Amazon Elastic Container Service (Amazon ECS) cluster as well as the CI/CD pipelines used to bring new versions of the applications into production.
It is the infrastructure team’s responsibility to get the application package developed by the Application Team deployed and running on AWS, as well as provide operational support for the application.

Application Team

Traditionally the application team just provides the application’s package (for example, a JAR file or an npm package) and it’s the infrastructure team’s responsibility to figure out how to deploy, configure, and run it on AWS. However, this traditional setup often leads to bottlenecks, as the infrastructure team will have to support many different applications developed by multiple teams. Additionally, the infrastructure team often has little knowledge of the internals of those applications. This often leads to solutions which are not optimized for the problem at hand: If the infrastructure team only offers a handful of options to run services on, the application team can’t use options optimized for their workload.

This is why we extend the traditional responsibilities of the application team in this blog post. The team provides the application and additionally the description of the infrastructure required to run the application. With “infrastructure required” we mean the AWS services used to run the application. This infrastructure description needs to be written in a format which can be consumed by the infrastructure team.

While we understand that this shift of responsibility adds additional tasks to the application team, we think that in the long term it is worth the effort. This can be the starting point to introduce DevOps concepts into the organization. However, the concepts described in this blog post are still valid even if you decide that you don’t want to add this responsibility to your application teams. The boundary of who is delivering what would then just move more into the direction of the infrastructure team.

To be successful with the given approach, the two teams need to agree on a common format on how to hand over the application, its infrastructure definition, and how to bring it to production. The AWS CDK with its concept of Constructs provides a perfect means for that.

Primer: AWS CDK Constructs

In this section we take a look at the concepts the AWS CDK provides for structuring our code base and how these concepts can be used to fit a CDK project into your team topology.

Constructs

Constructs are the basic building block of an AWS CDK application. An AWS CDK application is composed of multiple constructs which in the end define how and what is deployed by AWS CloudFormation.

The AWS CDK ships with constructs created to deploy AWS services. However, it is important to understand that you are not limited to the out-of-the-box constructs provided by the AWS CDK. The true power of AWS CDK is the possibility to create your own abstractions on top of the default constructs to create solutions for your specific requirement. To achieve this you write, publish, and consume your own, custom constructs. They codify your specific requirements, create an additional level of abstraction and allow other teams to consume and use your construct.

We will use a custom construct to separate the responsibilities between the the application and the infrastructure team. The application team will release a construct which describes the infrastructure along with its configuration required to run the application code. The infrastructure team will consume this construct to deploy and operate the workload on AWS.

How to use the AWS CDK in a Split-Team Setup

Let’s now have a look at how we can use the AWS CDK to split the responsibilities between the application and infrastructure team. I’ll introduce a sample scenario and then illustrate what each team’s responsibility is within this scenario.

Scenario

Our fictitious application development team writes an AWS Lambda function which gets deployed to AWS. Messages in an Amazon SQS queue will invoke the function. Let’s say the function will process orders (whatever this means in detail is irrelevant for the example) and each order is represented by a message in the queue.

The application development team has full flexibility when it comes to creating the AWS Lambda function. They can decide which runtime to use or how much memory to configure. The SQS queue which the function will act upon is created by the infrastructure team. The application team does not have to know how the messages end up in the queue.

With that we can have a look at a sample implementation split between the teams.

Application Team

The application team is responsible for two distinct artifacts: the application code (for example, a Java jar file or an npm module) and the AWS CDK construct used to deploy the required infrastructure on AWS to run the application (an AWS Lambda Function along with its configuration).

The lifecycles of these artifacts differ: the application code changes more frequently than the infrastructure it runs in. That’s why we want to keep the artifacts separate. With that each of the artifacts can be released at its own pace and only if it was changed.

In order to achieve these separate lifecycles, it is important to notice that a release of the application artifact needs to be completely independent from the release of the CDK construct. This fits our approach of separate teams compared to the standard CDK way of building and packaging application code within the CDK construct.

But how will this be done in our example solution? The team will build and publish an application artifact which does not contain anything related to CDK.
When a CDK Stack with this construct is synthesized it will download the pre-built artifact with a given version number from AWS CodeArtifact and use it to create the input zip file for a Lambda function. There is no build of the application package happening during the CDK synth.

With the separation of construct and application code, we need to find a way to tell the CDK construct which specific version of the application code it should fetch from CodeArtifact. We will pass this information to the construct via a property of its constructor.

For dependencies on infrastructure outside of the responsibility of the application team, I follow the pattern of dependency injection. Those dependencies, for example a shared VPC or an Amazon SQS queue, are passed into the construct from the infrastructure team.

Let’s have a look at an example. We pass in the external dependency on an SQS Queue, along with details on the desired appPackageVersion and its CodeArtifact details:

export interface OrderProcessingAppConstructProps {
    queue: aws_sqs.Queue,
    appPackageVersion: string,
    codeArtifactDetails: {
        account: string,
        repository: string,
        domain: string
    }
}

export class OrderProcessingAppConstruct extends Construct {

    constructor(scope: Construct, id: string, props: OrderProcessingAppConstructProps) {
        super(scope, id);

        const lambdaFunction = new lambda.Function(this, 'OrderProcessingLambda', {
            code: lambda.Code.fromDockerBuild(path.join(__dirname, '..', 'bundling'), {
                buildArgs: {
                    'PACKAGE_VERSION' : props.appPackageVersion,
                    'CODE_ARTIFACT_ACCOUNT' : props.codeArtifactDetails.account,
                    'CODE_ARTIFACT_REPOSITORY' : props.codeArtifactDetails.repository,
                    'CODE_ARTIFACT_DOMAIN' : props.codeArtifactDetails.domain
                }
            }),
            runtime: lambda.Runtime.NODEJS_16_X,
            handler: 'node_modules/order-processing-app/dist/index.lambdaHandler'
        });
        const eventSource = new SqsEventSource(props.queue);
        lambdaFunction.addEventSource(eventSource);
    }
}

Note the code lambda.Code.fromDockerBuild(...): We use AWS CDK’s functionality to bundle the code of our Lambda function via a Docker build. The only things which happen inside of the provided Dockerfile are:

  • the login into the AWS CodeArtifact repository which holds the pre-built application code’s package
  • the download and installation of the application code’s artifact from AWS CodeArtifact (in this case via npm)

If you are interested in more details on how you can build, bundle and deploy your AWS CDK assets I highly recommend a blog post by my colleague Cory Hall: Building, bundling, and deploying applications with the AWS CDK. It goes into much more detail than what we are covering here.

Looking at the example Dockerfile we can see the two steps described above:

FROM public.ecr.aws/sam/build-nodejs16.x:latest

ARG PACKAGE_VERSION
ARG CODE_ARTIFACT_AWS_REGION
ARG CODE_ARTIFACT_ACCOUNT
ARG CODE_ARTIFACT_REPOSITORY

RUN aws codeartifact login --tool npm --repository $CODE_ARTIFACT_REPOSITORY --domain $CODE_ARTIFACT_DOMAIN --domain-owner $CODE_ARTIFACT_ACCOUNT --region $CODE_ARTIFACT_AWS_REGION
RUN npm install order-processing-app@$PACKAGE_VERSION --prefix /asset

Please note the following:

  • we use --prefix /asset with our npm install command. This tells npm to install the dependencies into the folder which CDK will mount into the container. All files which should go into the output of the docker build need to be placed here.
  • the aws codeartifact login command requires credentials with the appropriate permissions to proceed. In case you run this on for example AWS CodeBuild or inside of a CDK Pipeline you need to make sure that the used role has the appropriate policies attached.

Infrastructure Team

The infrastructure team consumes the AWS CDK construct published by the application team. They own the AWS CDK Stack which composes the whole application. Possibly this will only be one of several Stacks owned by the Infrastructure team. Other Stacks might create shared infrastructure (like VPCs, networking) and other applications.

Within the stack for our application the infrastructure team consumes and instantiates the application team’s construct, passes any dependencies into it and then deploys the stack by whatever means they see fit (e.g. through AWS CodePipeline, GitHub Actions or any other form of continuous delivery/deployment).

The dependency on the application team’s construct is manifested in the package.json of the infrastructure team’s CDK app:

{
  "name": "order-processing-infra-app",
  ...
  "dependencies": {
    ...
    "order-app-construct" : "1.1.0",
    ...
  }
  ...
}

Within the created CDK Stack we see the dependency version for the application package as well as how the infrastructure team passes in additional information (like e.g. the queue to use):

export class OrderProcessingInfraStack extends cdk.Stack {
  constructor(scope: Construct, id: string, props?: cdk.StackProps) {
    super(scope, id, props);   

    const orderProcessingQueue = new Queue(this, 'order-processing-queue');

    new OrderProcessingAppConstruct(this, 'order-processing-app', {
       appPackageVersion: "2.0.36",
       queue: orderProcessingQueue,
       codeArtifactDetails: { ... }
     });
  }
}

Propagating New Releases

We now have the responsibilities of each team sorted out along with the artifacts owned by each team. But how do we propagate a change done by the application team all the way to production? Or asked differently: how can we invoke the infrastructure team’s CI/CD pipeline with the updated artifact versions of the application team?

We will need to update the infrastructure team’s dependencies on the application teams artifacts whenever a new version of either the application package or the AWS CDK construct is published. With the dependencies updated we can then start the release pipeline.

One approach is to listen and react to events published by AWS CodeArtifact via Amazon EventBridge. On each release AWS CodeArtifact will publish an event to Amazon EventBridge. We can listen to that event, extract the version number of the new release from its payload and start a workflow to update either our dependency on the CDK construct (e.g. in the package.json of our CDK application) or a update the appPackageVersion which the infrastructure team passes into the consumed construct.

Here’s how a release of a new app version flows through the system:

A release of the application package triggers a change and deployment of the infrastructure team's CDK Stack

Figure 1 – A release of the application package triggers a change and deployment of the infrastructure team’s CDK Stack

  1. The application team publishes a new app version into AWS CodeArtifact
  2. CodeArtifact triggers an event on Amazon EventBridge
  3. The infrastructure team listens to this event
  4. The infrastructure team updates its CDK stack to include the latest appPackageVersion
  5. The infrastructure team’s CDK Stack gets deployed

And very similar the release of a new version of the CDK Construct:

A release of the application team's CDK construct triggers a change and deployment of the infrastructure team's CDK Stack

Figure 2 – A release of the application team’s CDK construct triggers a change and deployment of the infrastructure team’s CDK Stack

  1. The application team publishes a new CDK construct version into AWS CodeArtifact
  2. CodeArtifact triggers an event on Amazon EventBridge
  3. The infrastructure team listens to this event
  4. The infrastructure team updates its dependency to the latest CDK construct
  5. The infrastructure team’s CDK Stack gets deployed

We will not go into the details on how such a workflow could look like, because it’s most likely highly custom for each team (think of different tools used for code repositories, CI/CD). However, here are some ideas on how it can be accomplished:

Updating the CDK Construct dependency

To update the dependency version of the CDK construct the infrastructure team’s package.json (or other files used for dependency tracking like pom.xml) needs to be updated. You can build automation to checkout the source code and issue a command like npm install sample-app-construct@NEW_VERSION (where NEW_VERSION is the value read from the EventBridge event payload). You then automatically create a pull request to incorporate this change into your main branch. For a sample on what this looks like see the blog post Keeping up with your dependencies: building a feedback loop for shared librares.

Updating the appPackageVersion

To update the appPackageVersion used inside of the infrastructure team’s CDK Stack you can either follow the same approach outlined above, or you can use CDK’s capability to read from an AWS Systems Manager (SSM) Parameter Store parameter. With that you wouldn’t put the value for appPackageVersion into source control, but rather read it from SSM Parameter Store. There is a how-to for this in the AWS CDK documentation: Get a value from the Systems Manager Parameter Store. You then start the infrastructure team’s pipeline based on the event of a change in the parameter.

To have a clear understanding of what is deployed at any given time and in order to see the used parameter value in CloudFormation I’d recommend using the option described at Reading Systems Manager values at synthesis time.

Conclusion

You’ve seen how the AWS Cloud Development Kit and its Construct concept can help to ensure team independence and agility even though multiple teams (in our case an application development team and an infrastructure team) work together to bring a new version of an application into production. To do so you have put the application team in charge of not only their application code, but also of the parts of the infrastructure they use to run their application on. This is still in line with the discussed split-team approach as all shared infrastructure as well as the final deployment is in control of the infrastructure team and is only consumed by the application team’s construct.

About the Authors

Picture of the author Joerg Woehrle As a Solutions Architect Jörg works with manufacturing customers in Germany. Before he joined AWS in 2019 he held various roles like Developer, DevOps Engineer and SRE. With that Jörg enjoys building and automating things and fell in love with the AWS Cloud Development Kit.
Picture of the author Mohamed Othman Mo joined AWS in 2020 as a Technical Account Manager, bringing with him 7 years of hands-on AWS DevOps experience and 6 year as System operation admin. He is a member of two Technical Field Communities in AWS (Cloud Operation and Builder Experience), focusing on supporting customers with CI/CD pipelines and AI for DevOps to ensure they have the right solutions that fit their business needs.

How to use granular geographic match rules with AWS WAF

Post Syndicated from Mohit Mysore original https://aws.amazon.com/blogs/security/how-to-use-granular-geographic-match-rules-with-aws-waf/

In November 2022, AWS introduced support for granular geographic (geo) match conditions in AWS WAF. This blog post demonstrates how you can use this new feature to customize your AWS WAF implementation and improve the security posture of your protected application.

AWS WAF provides inline inspection of inbound traffic at the application layer. You can use AWS WAF to detect and filter common web exploits and bots that could affect application availability or security, or consume excessive resources. Inbound traffic is inspected against web access control list (web ACL) rules. A web ACL rule consists of rule statements that instruct AWS WAF on how to inspect a web request.

The AWS WAF geographic match rule statement functionality allows you to restrict application access based on the location of your viewers. This feature is crucial for use cases like licensing and legal regulations that limit the delivery of your applications outside of specific geographic areas.

AWS recently released a new feature that you can use to build precise geographic rules based on International Organization for Standardization (ISO) 3166 country and area codes. With this release, you can now manage access at the ISO 3166 region level. This capability is available across AWS Regions where AWS WAF is offered and for all AWS WAF supported services. In this post, you will learn how to use this new feature with Amazon CloudFront and Elastic Load Balancing (ELB) origin types.

Summary of concepts

Before we discuss use cases and setup instructions, make sure that you are familiar with the following AWS services and concepts:

  • Amazon CloudFront: CloudFront is a web service that gives businesses and web application developers a cost-effective way to distribute content with low latency and high data transfer speeds.
  • Amazon Simple Storage Service (Amazon S3): Amazon S3 is an object storage service built to store and retrieve large amounts of data from anywhere.
  • Application Load Balancer: Application Load Balancer operates at the request level (layer 7), routing traffic to targets—Amazon Elastic Compute Cloud (Amazon EC2) instances, IP addresses, and Lambda functions—based on the content of the request.
  • AWS WAF labels: Labels contain metadata that can be added to web requests when a rule is matched. Labels can alter the behavior or default action of managed rules.
  • ISO (International Organization for Standardization) 3166 codes: ISO codes are internationally recognized codes that designate for every country and most of the dependent areas a two- or three-letter combination. Each code consists of two parts, separated by a hyphen. For example, in the code AU-QLD, AU is the ISO 3166 alpha-2 code for Australia, and QLD is the subdivision code of the state or territory—in this case, Queensland.

How granular geo labels work

Previously, geo match statements in AWS WAF were used to allow or block access to applications based on country of origin of web requests. With updated geographic match rule statements, you can control access at the region level.

In a web ACL rule with a geo match statement, AWS WAF determines the country and region of a request based on its IP address. After inspection, AWS WAF adds labels to each request to indicate the ISO 3166 country and region codes. You can use labels generated in the geo match statement to create a label match rule statement to control access.

AWS WAF generates two types of labels based on origin IP or a forwarded IP configuration that is defined in the AWS WAF geo match rule. These labels are the country and region labels.

By default, AWS WAF uses the IP address of the web request’s origin. You can instruct AWS WAF to use an IP address from an alternate request header, like X-Forwarded-For, by enabling forwarded IP configuration in the rule statement settings. For example, the country label for the United States with origin IP and forwarded IP configuration are awswaf:clientip:geo:country:US and awswaf:forwardedip:geo:country:US, respectively. Similarly, the region labels for a request originating in Oregon (US) with origin and forwarded IP configuration are awswaf:clientip:geo:region:US-OR and awswaf:forwardedip:geo:region:US-OR, respectively.

To demonstrate this AWS WAF feature, we will outline two distinct use cases.

Use case 1: Restrict content for copyright compliance using AWS WAF and CloudFront

Licensing agreements might prevent you from distributing content in some geographical locations, regions, states, or entire countries. You can deploy the following setup to geo-block content in specific regions to help meet these requirements.

In this example, we will use an AWS WAF web ACL that is applied to a CloudFront distribution with an S3 bucket origin. The web ACL contains a geo match rule to tag requests from Australia with labels, followed by a label match rule to block requests from the Queensland region. All other requests with source IP originating from Australia are allowed.

To configure the AWS WAF web ACL rule for granular geo restriction

  1. Follow the steps to create an Amazon S3 bucket and CloudFront distribution with the S3 bucket as origin.
  2. After the CloudFront distribution is created, open the AWS WAF console.
  3. In the navigation pane, choose Web ACLs, select Global (CloudFront) from the dropdown list, and then choose Create web ACL.
  4. For Name, enter a name to identify this web ACL.
  5. For Resource type, choose the CloudFront distribution that you created in step 1, and then choose Add.
  6. Choose Next.
  7. Choose Add rules, and then choose Add my own rules and rule groups.
  8. For Name, enter a name to identify this rule.
  9. For Rule type, choose Regular rule.
  10. Configure a rule statement for a request that matches the statement Originates from a Country and select the Australia (AU) country code from the dropdown list.
  11. Set the IP inspection configuration parameter to Source IP address.
  12. Under Action, choose Count, and then choose Add Rule.
  13. Create a new rule by following the same actions as in step 7 and enter a name to identify the rule.
  14. For Rule type, choose Regular rule.
  15. Configure a rule statement for a request that matches the statement Has a Label and enter awswaf:clientip:geo:region:AU-QLD for the match key.
  16. Set the action to Block and choose Add rule.
  17. For Actions, keep the default action of Allow.
  18. For Amazon CloudWatch metrics, select the AWS WAF rules that you created in steps 8 and 14.
  19. For Request sampling options, choose Enable sampled requests, and then choose Next.
  20. Review and create the web ACL rule.

After the web ACL is created, you should see the web ACL configuration, as shown in the following figures. Figure 1 shows the geo match rule configuration.

Figure 1: Web ACL rule configuration

Figure 1: Web ACL rule configuration

Figure 2 shows the Queensland regional geo restriction.

Figure 2: Queensland regional geo restriction - web ACL configuration<

Figure 2: Queensland regional geo restriction – web ACL configuration<

The setup is now complete—you have a web ACL with two regular rules. The first rule matches requests that originate from Australia and adds geographic labels automatically. The label match rule statement inspects requests with Queensland granular geo labels and blocks them. To understand where requests are originating from, you can configure logging on the AWS WAF web ACL.

You can test this setup by making requests from Queensland, Australia, to the DNS name of the CloudFront distribution to invoke a block. CloudFront will return a 403 error, similar to the following example.

$ curl -IL https://abcdd123456789.cloudfront.net
HTTP/2 403 
server: CloudFront
date: Tue, 21 Feb 2023 22:06:25 GMT
content-type: text/html
content-length: 919
x-cache: Error from cloudfront
via: 1.1 abcdd123456789.cloudfront.net (CloudFront)
x-amz-cf-pop: SYD1-C1

As shown in these test results, requests originating from Queensland, Australia, are blocked.

Use case 2: Allow incoming traffic from specific regions with AWS WAF and Application Load Balancer

We recently had a customer ask us how to allow traffic from only one region, and deny the traffic from other regions within a country. You might have similar requirements, and the following section will explain how to achieve that. In the example, we will show you how to allow only visitors from Washington state, while disabling traffic from the rest of the US.

This example uses an AWS WAF web ACL applied to an application load balancer in the US East (N. Virginia) Region with an Amazon EC2 instance as the target. The web ACL contains a geo match rule to tag requests from the US with labels. After we enable forwarded IP configuration, we will inspect the X-Forwarded-For header to determine the origin IP of web requests. Next, we will add a label match rule to allow requests from the Washington region. All other requests from the United States are blocked.

To configure the AWS WAF web ACL rule for granular geo restriction

  1. Follow the steps to create an internet-facing application load balancer in the US East (N. Virginia) Region.
  2. After the application load balancer is created, open the AWS WAF console.
  3. In the navigation pane, choose Web ACLs, and then choose Create web ACL in the US east (N. Virginia) Region.
  4. For Name, enter a name to identify this web ACL.
  5. For Resource type, choose the application load balancer that you created in step 1 of this section, and then choose Add.
  6. Choose Next.
  7. Choose Add rules, and then choose Add my own rules and rule groups.
  8. For Name, enter a name to identify this rule.
  9. For Rule type, choose Regular rule.
  10. Configure a rule statement for a request that matches the statement Originates from a Country in, and then select the United States (US) country code from the dropdown list.
  11. Set the IP inspection configuration parameter to IP address in Header.
  12. Enter the Header field name as X-Forwarded-For.
  13. For Match, choose Fallback for missing IP address. Web requests without a valid IP address in the header will be treated as a match and will be allowed.
  14. Under Action, choose Count, and then choose Add Rule.
  15. Create a new rule by following the same actions as in step 7 of this section, and enter a name to identify the rule.
  16. For Rule type, choose Regular rule.
  17. Configure a rule statement for a request that matches the statement Has a Label, and for the match key, enter awswaf:forwardedip:geo:region:US-WA.
  18. Set the action to Allow and add choose Add Rule.
  19. For Default web ACL action for requests that don’t match any rules, set the Action to Block.
  20. For Amazon CloudWatch metrics, select the AWS WAF rules that you created in steps 8 and 14 of this section.
  21. For Request sampling options, choose Enable sampled requests, and then choose Next.
  22. Review and create the web ACL rule.

After the web ACL is created, you should see the web ACL configuration, as shown in the following figures. Figure 3 shows the geo match rule

Figure 3: Geo match rule

Figure 3: Geo match rule

Figure 4 shows the Washington regional geo restriction.

Figure 4: Washington regional geo restriction - web ACL configuration

Figure 4: Washington regional geo restriction – web ACL configuration

The following is a JSON representation of the rule:

{
  "Name": "WashingtonRegionAllow",
  "Priority": 1,
  "Statement": {
    "LabelMatchStatement": {
      "Scope": "LABEL",
      "Key": "awswaf:forwardedip:geo:region:US-WA"
    }
  },
  "Action": {
    "Allow": {}
  },
  "VisibilityConfig": {
    "SampledRequestsEnabled": true,
    "CloudWatchMetricsEnabled": true,
    "MetricName": "USRegionalRestriction"
  }
}

The setup is now complete—you have a web ACL with two regular rules. The first rule matches requests that originate from the US after inspecting the origin IP in the X-Forwarded-For header, and adds geographic labels. The label match rule statement inspects requests with the Washington region granular geo labels and allows these requests.

If a user makes a web request from outside of the Washington region, the request will be blocked and a HTTP 403 error response will be returned, similar to the following.

curl -IL https://GeoBlock-1234567890.us-east-1.elb.amazonaws.com
HTTP/1.1 403 Forbidden
Server: awselb/2.0
Date: Tue, 21 Feb 2023 22:07:54 GMT
Content-Type: text/html
Content-Length: 118
Connection: keep-alive

Conclusion

AWS WAF now supports the ability to restrict traffic based on granular geographic labels. This gives you further control based on geographic location within a country.

In this post, we demonstrated two different use cases that show how this feature can be applied with CloudFront distributions and application load balancers. Note that, apart from CloudFront and application load balancers, this feature is supported by other origin types that are supported by AWS WAF, such as Amazon API Gateway and Amazon Cognito.

If you have feedback about this post, submit comments in the Comments section below. If you have questions about this post, start a new thread on the AWS WAF re:Post or contact AWS Support.

Want more AWS Security news? Follow us on Twitter.

Mohit Mysore

Mohit Mysore

Mohit is a Technical Account Manager with over 5 years of experience working with AWS Customers. He is passionate about network and system administration. Outside work, He likes to travel, watch soccer and F1 and spend time with his family.

Enabling Microsoft Defender Credential Guard on Amazon EC2

Post Syndicated from Sheila Busser original https://aws.amazon.com/blogs/compute/enabling-microsoft-defender-credential-guard-on-amazon-ec2/

This blog post is written by Jason Nicholls, Principal Solutions Architect AWS.

In this post we show you how to enable that Windows Defender Credential Guard (Credential Guard) on Amazon Elastic Compute Cloud (Amazon EC2) running Microsoft Windows Server. Credential Guard, when enabled on Amazon EC2 Windows Instances protects sensitive user login information from being extracted from the Operating System (OS) memory.

Microsoft Windows stores credential material such as authentication tokens in the Local Security Authority (LSA), a process in the Microsoft Windows operating system that is responsible for enforcing the security policy of the system. Traditionally these credentials are stored in LSA’s process memory accessible to the rest of the OS, making it possible for a privileged user to extract these credentials. The use of complex passwords, limiting privileged account use, and training users not to use the same password across multiple systems are steps that limit the use of credentials extracted from the LSA, but customers want to isolate these credentials from other rest of the OS.

With Credential Guard enabled, the LSA is isolated by Windows virtualization-based security (VBS). VBS is a suite of Windows security mechanisms that use hardware virtualization features to create an isolated compute environment to store user credentials referred to as the isolated LSA. The isolated LSA is inaccessible to the rest of the OS.

Prerequisites

Credential Guard requires a virtualization technology that supports Virtualization-based Security (VBS) and Unified Extensible Firmware Interface (UEFI) Secure Boot. Optionally, Credential Guard can leverage a Trusted Platform Module (TPM) to further secure credentials. In this walk-through we will use NitroTPM, a virtual TPM 2.0-compliant (ISO/IEC 11889:2015) module for your Amazon EC2 instances to enhance the security of the isolated LSA.

Launch your instance

A list of Windows Amazon Machine Image (AMI)s preconfigured to enable UEFI Secure Boot is available in our “Launch an instance with UEFI Secure Boot support ” guide. You can verify that your AMI supports UEFI Secure Boot and NitroTPM using the AWS Command Line Interface (AWS CLI) describe-images command as follows:

aws ec2 describe-images --image-ids ami-0123456789

When UEFI Secure Boot and NitroTPM are enabled for the AMI, “TpmSupport“: “v2.0“, and “BootMode”: “uefi” appear in the output respectively, such as in the following example.

{
   "Images": [
      {
         ...
         "BootMode": "uefi",
         "TpmSupport": "v2.0"
      }
   ]
}

Before launching the AMI verify that the instance type you want to launch supports UEFI boot mode and uses the Nitro System by using the DescribeInstanceTypes API call. Using the AWS CLI and calling describe-instance-types as follows:

aws ec2 describe-instance-types --instance-types [INSTANCE_TYPE] --region [REGION]

Where INSTANCE_TYPE is a supported instance type as defined in the documentation, an example is c5.large and REGION is a supported AWS Region.

The output of the command should display nitro as the hypervisor and list uefi as a supported boot mode. For example:

{
   "InstanceTypes": [
   {
      ...
      "Hypervisor": "nitro",
      ...
      "SupportedBootModes": [
                "legacy-bios",
                "uefi"
      ]
   }
}

Use the Amazon EC2 console or AWS Command Line Interface (AWS CLI) to launch an Amazon EC2 instance which has “uefi” boot mode enabled. Administrator access to the Amazon EC2 instance is required to enable Credential Guard.

Walkthrough:

Enabling Credential Guard with Amazon EC2 Launch an Amazon EC2 Windows Instance

Launch an Amazon EC2 Windows Instance using a Windows AMI preconfigured to enable UEFI Secure Boot with Microsoft Windows Secure Boot Keys on an instance type that supports UEFI Secure Boot.

You can use the launch wizard in the Amazon EC2 console or run-instances command via the AWS CLI to launch an instance that can support Credential Guard. You need a compatible AMI ID for launching your instance which is unique for each AWS Region. You can use the following link to discover and launch instances with compatible Amazon-provided AMIs in the Amazon EC2 console:

Enable Credential Guard on the launched Instance

Now that you know how to create an AMI with UEFI Secure Boot support enabled, let’s create a Windows instance and configure Credential Guard.

Credential Guard can be enabled either by using Group Policies, the Windows Registry, or the Windows Defender Device Guard and Windows Defender Credential Guard hardware readiness tool (DG-Readiness tool). In this post we will show you how to enable Credential Guard using the Windows Registry and via the DG-Readiness tool.

Option 1: Enabling Credential Guard via the Windows Registry

Start the Amazon EC2 instance using an AMI that has the BootMode set to “uefi“. Windows AMI must be preconfigured to enable UEFI Secure Boot with Microsoft Windows Secure Boot keys as we defined earlier. Once you’re connected to the instance use the Windows System Information tool to check that Credential Guard isn’t running on the instance:

  1. Select Start, type msinfo32.exe, and then select System Information.
  2. Select System Summary on the left.
  3. Confirm that Virtualization-based security is Not Enabled.

Figure 1 Overview of System Information in WindowsFigure 1 Overview of System Information in Windows

Figure 2 System Information confirming that Credential Guard is Not Enabled

Figure 2 System Information confirming that Credential Guard is Not Enabled

4. Open the Windows Command Shell by selecting Start, type cmd.exe, and then press Enter.

5. Run the following commands from the Windows Command Shell to enable Credential Guard using the Windows Registry:

REG ADD "HKLM\System\CurrentControlSet\Control\DeviceGuard" /v EnableVirtualizationBasedSecurity /t REG_DWORD /d 1 /f

REG ADD "HKLM\System\CurrentControlSet\Control\DeviceGuard" /v RequirePlatformSecurityFeatures /t REG_DWORD /d 1 /f

REG ADD "HKLM\System\CurrentControlSet\Control\LSA" /v LsaCfgFlags /t REG_DWORD /d 2 /f

REG ADD "HKLM\SYSTEM\CurrentControlSet\Control\DeviceGuard\Capabilities\" /v "HyperVEnabled" /t REG_DWORD /d 1 /f

Figure 3 Update the Windows Registry to enable Credential GuardFigure 3 Update the Windows Registry to enable Credential Guard

6. Once the changes have been made, reboot the instance.

7. When the instance is back up, reconnect to the instance and select Start, type msinfo32.exe, and then select System Information.

8. Select System Summary on the left.

9. Note that Virtualisation-based security is now changed to Running, and that Secure Boot and Credential Guard are enabled.

Figure 4 Overview of System Information showing Credential Guard is EnabledFigure 4 Overview of System Information showing Credential Guard is Enabled

Figure 5 System Information shows Credential Guard is now EnabledFigure 5 System Information shows Credential Guard is now Enabled

Option 2: Enabling Credential Guard via the DG-Readiness tool

Option 1 requires a remote desktop session to your Windows Instance. Option 2 is run via PowerShell which can either be done in a remote desktop session as described here or via a remote PowerShell session.

Start the Amazon EC2 instance using an AMI that has the BootMode set to “uefi“. Windows AMI must be preconfigured to enable UEFI Secure Boot with Microsoft Windows Secure Boot keys as we defined earlier. Once you’re connected to the instance start a PowerShell session:

  1. Select Start, type PowerShell, and then click Windows PowerShell.

Figure 6 Start PowerShell via the Start BarFigure 6 Start PowerShell via the Start Bar

      2. Download the DG-Readiness tool by running the command:

wget https://download.microsoft.com/download/B/D/8/BD821B1F-05F2-4A7E-AA03-DF6C4F687B07/dgreadiness_v3.6.zip -outfile dgreadiness.zip

Figure 7 Download the DG-Readiness toolFigure 7 Download the DG-Readiness tool

  1. Uncompress the downloaded zip file using the Expand-Archive function within PowerShell
Expand-Archive -Path C:\Users\Administrator\dgreadiness.zip -DestinationPath C:\dgreadiness
  1. Move the DG-Readiness tool to the current folder

copy C:\dgreadiness\dgreadiness_v3.6\DG_Readiness_Tool_v3.6.ps1 .\

Figure 8 Copy the DG-Readiness tool to the current folderFigure 8 Copy the DG-Readiness tool to the current folder

  1. Confirm that Credential Guard is disabled by running the DG-Readiness tool with the -Ready option, as follows:
DG_Readiness_Tool_v3.6.ps1 -Ready

Figure 9 Using the DG-Readiness tool to confirm Credential Guard is not enabledFigure 9 Using the DG-Readiness tool to confirm Credential Guard is not enabled

  1. Enable Credential Guard using the -Enable -CG options as follows:
DG_Readiness_Tool_v3.6.ps1 -Enable -CG
  1. Reboot the instance
  2. Reconnect to the instance after the reboot and confirm that Credential Guard is now running by running the command:
DG_Readiness_Tool_v3.6.ps1 -Ready

Figure 10 DG Readiness Tool shows Credential Guard is enabled and runningFigure 10 DG Readiness Tool shows Credential Guard is enabled and running

Conclusion

With support for Windows Defender Credential Guard on Amazon EC2 Windows Instances customers can create an isolated compute environment that is inaccessible to the rest of the OS. Credential Guard requires UEFI Secure Boot support. Credential Guard can leverage NitroTPM to further secure credentials.

To learn more about the support of Credential Guard visit documentation.

Let’s Architect! Architecture tools

Post Syndicated from Luca Mezzalira original https://aws.amazon.com/blogs/architecture/lets-architect-architecture-tools/

Tools, such as diagramming software, low-code applications, and frameworks, make it possible to experiment quickly. They are essential in today’s fast-paced and technology-driven world. From improving efficiency and accuracy, to enhancing collaboration and creativity, a well-defined set of tools can make a significant impact on the quality and success of a project in the area of software architecture.

As an architect, you can take advantage of a wide range of resources to help you build solutions that meet the needs of your organization. For example, with tools in the likes of the Amazon Web Services (AWS) Solutions Library and Serverless Land, you can boost your knowledge and productivity while working on event-driven architectures, microservices, and stateless computing.

In this Let’s Architect! edition, we explore how to incorporate these patterns into your architecture, and which tools to leverage to build solutions that are scalable, secure, and cost-effective.

How AWS Application Composer helps your team build great apps

In this re:Invent 2022 session, Chase Douglas, Principal Engineer at AWS, speaks about AWS Application Composer, a newly launched service.

This service has the potential to change the way architects design solutions—without writing a single line of code! The service is user-friendly, intuitive, and requires no prior coding experience. It allows users to scaffold a serverless architecture, defining a CloudFormation template visually with drag-and-drop. A detailed AWS Compute Blog post takes readers through the process of using AWS Application Composer.

Take me to this re:Invent 2022 video!

How an architecture can be designed with AWS Application Composer

How an architecture can be designed with AWS Application Composer

AWS design + build tools

When migrating to the cloud, we suggest referencing these four tried-and-true AWS resources that can be used to design and build projects.

  1. AWS Workshops are created by AWS teams to provide opportunities for hands-on learning to develop practical skills. Workshops are available in multiple categories and for skill levels 100-400.
  2. AWS Architecture Center contains a collection of best practices and architectural patterns for designing and deploying cloud-based solutions using AWS services. Furthermore, it includes detailed architecture diagrams, whitepapers, case studies, and other resources that provide a wealth of information on how to design and implement cloud solutions.
  3. Serverless Land (an Amazon property) brings together various patterns, workflows, code snippets, and blog posts pertaining to AWS serverless architectures.
  4. AWS Solutions Library provides customers with templates, tools, and automated workflows to easily deploy, operate, and manage common use cases on the AWS Cloud.
Inside event-driven architectures designed by David Boyne on Serverless Land

Inside event-driven architectures designed by David Boyne on Serverless Land

The Well-Architected way

In this session, the AWS Well-Architected provides guidance on how to implement the architectural models reported in the AWS Well-Architected Framework within your organization at scale.

Discover a customer story and understand how to use the features of the AWS Well-Architected Tool and APIs to receive recommendations based on your workload and measure your architectural metrics. In the Framework whitepaper, you can explore the six pillars of Well-Architected (operational excellence, security, reliability, performance efficiency, cost optimization, and sustainability) and best practices to achieve them.

Understanding the key design pillars can help architects make informed design decisions, leading to more robust and efficient solutions. This knowledge also enables architects to identify potential problems early on in the design process and find appropriate patterns to address those issues.

Take me to the Well-Architected video!

Discover how the AWS Well-Architected Framework can help you design scalable, maintainable, and reusable solutions

Discover how the AWS Well-Architected Framework can help you design scalable, maintainable, and reusable solutions

See you next time!

Thanks for exploring architecture tools and resources with us!

Join us next time when we’ll talk about data mesh architecture!

To find all the posts from this series, check out the Let’s Architect! page of the AWS Architecture Blog.

Go Wild with Wildcards in the Backblaze B2 Command Line Tool 3.7.1

Post Syndicated from Pat Patterson original https://www.backblaze.com/blog/go-wild-with-wildcards-in-backblaze-b2-command-line-tool-3-7-1/

File transfer tools such as Cyberduck, FileZilla Pro, and Transmit implement a graphical user interface (GUI), which allows users to manage and transfer files across local storage and any number of services, including cloud object stores such as Backblaze B2 Cloud Storage. Some tasks, however, require a little more power and flexibility than a GUI can provide. This is where a command line interface (CLI) shines. A CLI typically provides finer control over operations than a GUI tool, and makes it straightforward to automate repetitive tasks. We recently released version 3.7.0 (and then, shortly thereafter, version 3.7.1) of the Backblaze B2 Command Line Tool, alongside version 1.19.0 of the underlying Backblaze B2 Python SDK. Let’s take a look at the highlights in the new releases, and why you might want to use the Backblaze B2 CLI rather than the AWS equivalent.

Battle of the CLI’s: Backblaze B2 vs. AWS

As you almost certainly already know, Backblaze B2 has an S3-compatible API in addition to its original API, now known as the B2 Native API. In most cases, we recommend using the S3-compatible API, since a rich ecosystem of S3 tools and knowledge has evolved over the years.

While the AWS CLI works perfectly well with Backblaze B2, and we explain how to use it in our B2 Developer Quick-Start Guide, it’s slightly clunky. The AWS CLI allows you to set your access key id and secret access key via either environment variables or a configuration file, but you must override the default endpoint on the command line with every command, like this:

% aws --endpoint-url https://s3.us-west-004.backblazeb2.com s3api list-buckets

This is very tiresome if you’re working interactively at the command line! In contrast, the B2 CLI retrieves the correct endpoint from Backblaze B2 when it authenticates, so the command line is much more concise:

% b2 list-buckets

Additionally, the CLI provides fine-grain access to Backblaze B2-specific functionality, such as application key management and replication.

Automating Common Tasks with the B2 Command Line Tool

If you’re already familiar with CLI tools, feel free to skip to the next section.

Imagine you’ve uploaded a large number of WAV files to a Backblaze B2 Bucket for transcoding into .mp3 format. Once the transcoding is complete, and you’ve reviewed a sample of the .mp3 files, you decide that you can delete the .wav files. You can do this in a GUI tool, opening the bucket, navigating to the correct location, sorting the files by extension, selecting all of the .wav files, and deleting them. However, the CLI can do this in a single command:

% b2 rm --withWildcard --recursive my-bucket 'audio/*.wav'

If you want to be sure you’re deleting the correct files, you can add the --dryRun option to show the files that would be deleted, rather than actually deleting them:

% b2 rm --dryRun --withWildcard --recursive my-bucket 'audio/*.wav'
audio/aardvark.wav
audio/barracuda.wav
...
audio/yak.wav
audio/zebra.wav

You can find a complete list of the CLI’s commands and their options in the documentation.

Let’s take a look at what’s new in the latest release of the Backblaze B2 CLI.

Major Changes in B2 Command Line Tool Version 3.7.0

New rm command

The most significant addition in 3.7.0 is a whole new command: rm. As you might expect, rm removes files. The CLI has always included the low-level delete-file-version command (to delete a single file version) but you had to call that multiple times and combine it with other commands to remove all versions of a file, or to remove all files with a given prefix.

The new rm command is significantly more powerful, allowing you to delete all versions of a file in a single command:

% b2 rm --versions --withWildcard --recursive my-bucket images/san-mateo.png

Let’s unpack that command:

  • %: represents the command shell’s prompt. (You don’t type this.)
  • b2: the B2 CLI executable.
  • rm: the command we’re running.
  • --versions: apply the command to all versions. Omitting this option applies the command to just the most recent version.
  • --withWildcard: treat the folderName argument as a pattern to match the file name.
  • --recursive: descend into all folders. (This is required with –withWildcard.)
  • my-bucket: the bucket name.
  • images/san-mateo.png: the file to be deleted. There are no wildcard characters in the pattern, so the file name must match exactly. Note: there is no leading ‘/’ in Backblaze B2 file names.

As mentioned above, the --dryRun argument allows you to see what files would be deleted, without actually deleting them. Here it is with the ‘*’ wildcard to apply the command to all versions of the .png files in /images. Note the use of quotes to avoid the command shell expanding the wildcard:

% b2 rm --dryRun --versions --withWildcard --recursive my-bucket 'images/*.png'
images/amsterdam.png
images/sacramento.png

DANGER ZONE: by omitting --withWildcard and the folderName argument, you can delete all of the files in a bucket. We strongly recommend you use --dryRun first, to check that you will be deleting the correct files.

% b2 rm --dryRun --versions –recursive my-bucket
index.html
images/amsterdam.png
images/phoenix.jpeg
images/sacramento.png
stylesheets/style.css

New --withWildcard option for the ls command

The ls command gains the --withWildcard option. It operates identically as described above. In fact, b2 rm --dryRun --withWildcard --recursive executes the exact same code as b2 ls --withWildcard --recursive. For example:

% b2 ls --withWildcard --recursive my-bucket 'images/*.png'
images/amsterdam.png
images/sacramento.png

You can combine --withWildcard with any of the existing options for ls, for example --long:

% b2 ls --long --withWildcard --recursive my-bucket 'images/*.png'
4_z71d55dummyid381234ed0c1b_f108f1dummyid163b_d2dummyid_m165048_c004
_v0402014_t0016_u01dummyid48198 upload 2023-02-09 16:50:48 714686 images/amsterdam.png
4_z71d55dummyid381234ed0c1b_f1149bdummyid1141_d2dummyid_m165048_c004
_v0402010_t0048_u01dummyid48908 upload 2023-02-09 16:50:48 549261 images/sacramento.png

New --incrementalMode option for upload-file and sync

The new --incrementalMode option saves time and bandwidth when working with files that grow over time, such as log files, by only uploading the changes since the last upload. When you use the --incrementalMode option with upload-file or sync, the B2 CLI looks for an existing file in the bucket with the b2FileName that you supplied, and notes both its length and SHA-1 digest. Let’s call that length l. The CLI then calculates the SHA-1 digest of the first l bytes of the local file. If the digests match, then the CLI can instruct Backblaze B2 to create a new file comprising the existing file and the remaining bytes of the local file.

That was a bit complicated, so let’s look at a concrete example. My web server appends log data to a file, access.log. I’ll see how big it is, get its SHA-1 digest, and upload it to a B2 Bucket:

% ls -l access.log
-rw-r--r-- 1 ppatterson staff 5525849 Feb 9 15:55 access.log

% sha1sum access.log
ff46904e56c7f9083a4074ea3d92f9be2186bc2b access.log

The upload-file command outputs all of the file’s metadata, but we’ll focus on the SHA-1 digest, file info, and size.

% b2 upload-file my-bucket access.log access.log
...
{
...
"contentSha1": "ff46904e56c7f9083a4074ea3d92f9be2186bc2b",
...
"fileInfo": {
"src_last_modified_millis": "1675986940381"
},
...
"size": 5525849,
...
}

As you might expect, the digest and size match those of the local file.

Time passes, and our log file grows. I’ll first upload it as a different file, so that we can see the default behavior when the B2 Cloud Storage file is simply replaced:

% ls -l access.log
-rw-r--r-- 1 ppatterson staff 11047145 Feb 9 15:57 access.log

% sha1sum access.log
7c97866ff59330b67aa96d7a481578d62e030788 access.log

% b2 upload-file my-bucket access.log new-access.log
{
...
"contentSha1": "7c97866ff59330b67aa96d7a481578d62e030788",
...
"fileInfo": {
"src_last_modified_millis": "1675987069538"
},
...
"size": 11047145,
...
}

Everything is as we might expect—the CLI uploaded 11,047,145 bytes to create a new file, which is 5,521,296 bytes bigger than the initial upload.

Now I’ll use the --incrementalMode option to replace the first Backblaze B2 file:

% b2 upload-file --quiet my-bucket access.log access.log
...
{
...
"contentSha1": "none",
...
"fileInfo": {
"large_file_sha1": "7c97866ff59330b67aa96d7a481578d62e030788",
"plan_id": "ea6b099b48e7eb7fce01aba18dbfdd72b56eb0c2",
"src_last_modified_millis": "1675987069538"
},
...
"size": 11047145,
...
}

The digest is exactly the same, but it has moved from contentSha1 to fileInfo.large_file_sha1, indicating that the file was uploaded as separate parts, resulting in a large file. The CLI didn’t need to upload the initial 5,525,849 bytes of the local file; it instead instructed Backblaze B2 to combine the existing file with the final 5,521,296 bytes of the local file to create a new version of the file.

There are several more new features and fixes to existing functionality in version 3.7.0—make sure to check out the B2 CLI changelog for a complete list.

Major Changes in B2 Python SDK 1.19.0

Most of the changes in the B2 Python SDK support the new features in the B2 CLI, such as adding wildcard matching to the Bucket.ls operation and adding support for incremental upload and sync. Again, you can inspect the B2 Python SDK changelog for a comprehensive list.

Get to Grips with B2 Command Line Tool Version 3.7.0 3.7.1

Whether you’re working on Windows, Mac or Linux, it’s straightforward to install or update the B2 CLI; full instructions are provided in the Backblaze B2 documentation.

Note that the latest version is now 3.7.1. The only changes from 3.7.0 are a handful of corrections to help text and that the Mac binary is no longer provided, due to shortcomings in the Mac version of PyInstaller. Instead, we provide the Mac version of the CLI via the Homebrew package manager.

The post Go Wild with Wildcards in the Backblaze B2 Command Line Tool 3.7.1 appeared first on Backblaze Blog | Cloud Storage & Cloud Backup.

Dell PowerEdge Gets Edgy with XR8000 XR7620 and XR5610 Servers

Post Syndicated from Cliff Robinson original https://www.servethehome.com/dell-poweredge-gets-edgy-with-xr8000-xr7620-and-xr5610-servers/

Dell announces new Intel Xeon Edge Enhanced processors with Intel vRAN Boost and new Dell PowerEdge XR8000, XR7000 and XR5000 edge systems

The post Dell PowerEdge Gets Edgy with XR8000 XR7620 and XR5610 Servers appeared first on ServeTheHome.

The Next Generation of Managed Detection and Response is Here

Post Syndicated from Jake Godgart original https://blog.rapid7.com/2023/02/22/the-next-generation-of-managed-detection-and-response-is-here/

The Next Generation of Managed Detection and Response is Here

Humans are great at adapting to change—but objectively the pace of technological change has been way, way too fast.  

Security teams manage an average of 76 different tools. Breaches have gone from “s#&@!” to “inevitable.”  That’s why we built  Managed Threat Complete to address the reality of today’s threat environment. By 2025, Gartner says 50% of organizations will decide to partner with an MDR (Managed Detection and Response) service for 24×7 monitoring.

Now, one move can consolidate and rebalance your work

Managed Threat Complete: It’s always-on MDR plus unlimited vulnerability management with a single subscription.

Combine these two historically siloed pieces of a security program, and you have a complete picture of your risk profile and threat landscape. Since the service  combines proactive, responsive, and strategic support of your program, it gets smarter and more resilient over time: a continuously-improving, virtuous cycle.

Most importantly, Managed Threat Complete lets you prove you’re building measurable capacity to be effective at detection and response—and improve the definitions of success that matter most to you. We call it the R-factor, and it measures:

  • How ready you are to react to your sprawling attack surface
  • How responsive you can be when something inevitably gets through
  • How effectively you’re able to remediate after the fact
  • How you measure your results and show provable outcomes
The Next Generation of Managed Detection and Response is Here

Forrester Consulting did the math on Rapid7 MDR, and you win

Forrester’s June 2022 Total Economic Impact™ study commissioned by Rapid7 found that Rapid7 MDR produced extraordinary results:

  • 5.5x ROI over 3 years
  • <3 month payback
  • 90% reduction in the likelihood of a breach

While your team methodically reduces your risks with unlimited VRM scanning, Managed Threat Complete gives you a full team of SOC experts dealing with threats in your environment using advanced XDR technology. And that means really responding, remediating, and making your organization safe and secure—no matter what.

It’s MDR so different, think of it as MDR 2.0.

Typical MDR vendors will simply alert a CISO to a problem. If you’re breached, they’ll tell you to hire an outside Incident Response firm to take it the rest of the way.  Managed Threat Complete gives you unlimited Incident Response (the same level you’d get with an IR retainer) included, with DFIR professionals already embedded on your team.

Typical MDR vendors charge by data ingestion and retention. We prioritize visibility into your environment so our analysts can detect and respond without compromise.

Typical MDR vendors take a black box approach to their technology. But with Managed Threat Complete, we give customers unlimited access to our cloud-native XDR technology, sprawling detections library, all of it. See transparently into what your Rapid7 MDR partners are doing. Run your own investigations and threat hunting. Log in once a day or once a year, it’s at your fingertips.

Managed Threat Complete delivers a holistic approach to risk and threat management, so you can consolidate costs and be ready for whatever comes next.

Managed Threat Complete

Focus on proactive, strategic work, while our team delivers 24/7/365, end-to-end detection and response.

LEARN MORE

No more Flatpak (by default) in Ubuntu Flavors

Post Syndicated from original https://lwn.net/Articles/924078/

The Ubuntu Flavors
offerings (Kubuntu and the like) have decided
that the way to improve the user experience is to put more emphasis on the
Snap package format.

Going forward, the Flatpak package as well as the packages to
integrate Flatpak into the respective software center will no
longer be installed by default in the next release due in April
2023, Lunar Lobster. Users who have used Flatpak will not be
affected on upgrade, as flavors are including a special migration
that takes this into account. Those who haven’t interacted with
Flatpak will be presented with software from the Ubuntu
repositories and the Snap Store.

Security updates for Wednesday

Post Syndicated from original https://lwn.net/Articles/924070/

Security updates have been issued by Debian (amanda, apr-util, and tiff), Fedora (apptainer, git, gssntlmssp, OpenImageIO, openssl, webkit2gtk3, xorg-x11-server, and xorg-x11-server-Xwayland), Oracle (firefox and thunderbird), Red Hat (python3), SUSE (gnutls, php7, and python-Django), and Ubuntu (chromium-browser, libxpm, and mariadb-10.3, mariadb-10.6).

Maintaining Code Quality with Amazon CodeCatalyst Reports

Post Syndicated from Imtranur Rahman original https://aws.amazon.com/blogs/devops/maintaining-code-quality-with-amazon-codecatalyst-reports/

Amazon CodeCatalyst reports contain details about tests that occur during a workflow run. You can create tests such as unit tests, integration tests, configuration tests, and functional tests. You can use a test report to help troubleshoot a problem during a workflow.

Introduction

In prior posts in this series, I discussed reading The Unicorn Project, by Gene Kim, and how the main character, Maxine, struggles with a complicated Software Development Lifecycle (SDLC) after joining a new team. One of the challenges she encounters is the difficulties in shipping secure, functioning code without an automated testing mechanism. To quote Gene Kim, “Without automated testing, the more code we write, the more money it takes for us to test.”

Software Developers know that shipping vulnerable or non-functioning code to a production environment is to be avoided at all costs; the monetary impact is high and the toll it takes on team morale can be even greater. During the SDLC, developers need a way to easily identify and troubleshoot errors in their code.

In this post, I will focus on how developers can seamlessly run tests as a part of workflow actions as well as configure unit test and code coverage reports with Amazon CodeCatalyst. I will also outline how developers can access these reports to gain insights into their code quality.

Prerequisites

If you would like to follow along with this walkthrough, you will need to:

Walkthrough

As with the previous posts in the CodeCatalyst series, I am going to use the Modern Three-tier Web Application blueprint. Blueprints provide sample code and CI/CD workflows to help you get started easily across different combinations of programming languages and architectures. To follow along, you can re-use a project you created previously, or you can refer to a previous post that walks through creating a project using the Three-tier blueprint.

Once the project is deployed, CodeCatalyst opens the project overview. This view shows the content of the README file from the project’s source repository, workflow runs, pull requests, etc. The source repository and workflow are created for me by the project blueprint. To view the source code, I select Code → Source Repositories from the left-hand navigation bar. Then, I select the repository name link from the list of source repositories.

Figure 1. List of source repositories including Mythical Mysfits source code.

Figure 1. List of source repositories including Mythical Mysfits source code.

From here I can view details such as the number of branches, workflows, commits, pull requests and source code of this repo. In this walkthrough, I’m focused on the testing capabilities of CodeCatalyst. The project already includes unit tests that were created by the blueprint so I will start there.

From the Files list, navigate to web → src → components→ __tests__ → TheGrid.spec.js. This file contains the front-end unit tests which simply check if the strings “Good”, “Neutral”, “Evil” and “Lawful”, “Neutral”, “Chaotic” have rendered on the web page. Take a moment to examine the code. I will use these tests throughout the walkthrough.

Figure 2. Unit test for the front-end that test strings have been rendered properly.

Figure 2. Unit test for the front-end that test strings have been rendered properly. 

Next, I navigate to the  workflow that executes the unit tests. From the left-hand navigation bar, select CI/CD → Workflows. Then, find ApplicationDeploymentPipeline, expand Recent runs and select  Run-xxxxx . The Visual tab shows a graphical representation of the underlying YAML file that makes up this workflow. It also provides details on what started the workflow run, when it started,  how long it took to complete, the source repository and whether it succeeded.

Figure 3. The Deployment workflow open in the visual designer.

Figure 3. The Deployment workflow open in the visual designer.

Workflows are comprised of a source and one or more actions. I examined test reports for the back-end in a prior post. Therefore, I will focus on the front-end tests here. Select the build_and_test_frontend action to view logs on what the action ran, its configuration details, and the reports it generated. I’m specifically interested in the Unit Test and Code Coverage reports under the Reports tab:

Figure 4. Reports tab showing line and branch coverage.

Figure 4. Reports tab showing line and branch coverage.

Select the report unitTests.xml (you may need to scroll). Here, you can see an overview of this specific report with metrics like pass rate, duration, test suites, and the test cases for those suites:

Figure 5. Detailed report for the front-end tests

Figure 5. Detailed report for the front-end tests.

This report has passed all checks.  To make this report more interesting, I’ll intentionally edit the unit test to make it fail. First, navigate back to the source repository and open web → src → components→ __tests__→TheGrid.spec.js. This test case is looking for the string “Good” so change it to say “Best” instead and commit the changes.

Figure 6. Front-End Unit Test Code Change.

Figure 6. Front-End Unit Test Code Change.

This will automatically start a new workflow run. Navigating back to CI/CD →  Workflows, you can see a new workflow run is in progress (takes ~7 minutes to complete).

Once complete, you can see that the build_and_test_frontend action failed. Opening the unitTests.xml report again, you can see that the report status is in a Failed state. Notice that the minimum pass rate for this test is 100%, meaning that if any test case in this unit test ever fails, the build fails completely.

There are ways to configure these minimums which will be explored when looking at Code Coverage reports. To see more details on the error message in this report, select the failed test case.

Figure 7. Failed Test Case Error Message.

Figure 7. Failed Test Case Error Message.

As expected, this indicates that the test was looking for the string “Good” but instead, it found the string “Best”. Before continuing, I return to the TheGrid.spec.js file and change the string back to “Good”.

CodeCatalyst also allows me to specify code and branch coverage criteria. Coverage is a metric that can help you understand how much of your source was tested. This ensures source code is properly tested before shipping to a production environment. Coverage is not configured for the front-end, so I will examine the coverage of the back-end.

I select Reports on the left-hand navigation bar, and open the report called backend-coverage.xml. You can see details such as line coverage, number of lines covered, specific files that were scanned, etc.

Figure 8. Code Coverage Report Succeeded.

Figure 8. Code Coverage Report Succeeded.

The Line coverage minimum is set to 70% but the current coverage is 80%, so it succeeds. I want to push the team to continue improving, so I will edit the workflow to raise the minimum threshold to 90%. Navigating back to CI/CD → Workflows → ApplicationDeploymentPipeline, select the Edit button. On the Visual tab, select build_backend. On the Outputs tab, scroll down to Success Criteria and change Line Coverage to 90%.

Figure 9. Configuring Code Coverage Success Criteria.

Figure 9. Configuring Code Coverage Success Criteria.

On the top-right, select Commit. This will push the changes to the repository and start a new workflow run. Once the run has finished, navigate back to the Code Coverage report. This time, you can see it reporting a failure to meet the minimum threshold for Line coverage.

Figure 10. Code Coverage Report Failed.

There are other success criteria options available to experiment with. To learn more about success criteria, see Configuring success criteria for tests.

Cleanup

If you have been following along with this workflow, you should delete the resources you deployed so you do not continue to incur charges. First, delete the two stacks that CDK deployed using the AWS CloudFormation console in the AWS account you associated when you launched the blueprint. These stacks will have names like mysfitsXXXXXWebStack and mysfitsXXXXXAppStack. Second, delete the project from CodeCatalyst by navigating to Project settings and choosing Delete project.

Summary

In this post, I demonstrated how Amazon CodeCatalyst can help developers quickly configure test cases, run unit/code coverage tests, and generate reports using CodeCatalyst’s workflow actions. You can use these reports to adhere to your code testing strategy as a software development team. I also outlined how you can use success criteria to influence the outcome of a build in your workflow.  In the next post, I will demonstrate how to configure CodeCatalyst workflows and integrate Software Composition Analysis (SCA) reports. Stay tuned!

About the authors:

Imtranur Rahman

Imtranur Rahman is an experienced Sr. Solutions Architect in WWPS team with 14+ years of experience. Imtranur works with large AWS Global SI partners and helps them build their cloud strategy and broad adoption of Amazon’s cloud computing platform.Imtranur specializes in Containers, Dev/SecOps, GitOps, microservices based applications, hybrid application solutions, application modernization and loves innovating on behalf of his customers. He is highly customer obsessed and takes pride in providing the best solutions through his extensive expertise.

Wasay Mabood

Wasay is a Partner Solutions Architect based out of New York. He works primarily with AWS Partners on migration, training, and compliance efforts but also dabbles in web development. When he’s not working with customers, he enjoys window-shopping, lounging around at home, and experimenting with new ideas.

A Device to Turn Traffic Lights Green

Post Syndicated from Bruce Schneier original https://www.schneier.com/blog/archives/2023/02/a-device-to-turn-traffic-lights-green.html

Here’s a story about a hacker who reprogrammed a device called “Flipper Zero” to mimic Opticom transmitters—to turn traffic lights in his path green.

As mentioned earlier, the Flipper Zero has a built-in sub-GHz radio that lets the device receive data (or transmit it, with the right firmware in approved regions) on the same wireless frequencies as keyfobs and other devices. Most traffic preemption devices intended for emergency traffic redirection don’t actually transmit signals over RF. Instead, they use optical technology to beam infrared light from vehicles to static receivers mounted on traffic light poles.

Perhaps the most well-known branding for these types of devices is called Opticom. Essentially, the tech works by detecting a specific pattern of infrared light emitted by the Mobile Infrared Transmitter (MIRT) installed in a police car, fire truck, or ambulance when the MIRT is switched on. When the receiver detects the light, the traffic system then initiates a signal change as the emergency vehicle approaches an intersection, safely redirecting the traffic flow so that the emergency vehicle can pass through the intersection as if it were regular traffic and potentially avoid a collision.

This seems easy to do, but it’s also very illegal. It’s called “impersonating an emergency vehicle,” and it comes with hefty penalties if you’re caught.

Supporting beginner programmers in primary school using TIPP&SEE

Post Syndicated from Bobby Whyte original https://www.raspberrypi.org/blog/teaching-programming-in-primary-school-tippsee/

Every young learner needs a successful start to their learning journey in the primary computing classroom. One aspect of this for teachers is to introduce programming to their learners in a structured way. As computing education is introduced in more schools, the need for research-informed strategies and approaches to support beginner programmers is growing. Over recent years, researchers have proposed various strategies to guide teachers and students, such as the block model, PRIMM, and, in the case of this month’s seminar, TIPP&SEE.

A young person smiles while using a laptop.
We need to give all learners a successful start in the primary computing classroom.

We are committed to make computing and creating with digital technologies accessible to all young people, including through our work with educators and researchers. In our current online research seminar series, we focus on computing education for primary-aged children (K–5, ages 5 to 11). In the series’ second seminar, we were delighted to welcome Dr Jean Salac, researcher in the Code & Cognition Lab at the University of Washington.

Dr Jean Salac
Dr Jean Salac

Jean’s work sits across computing education and human-computer interaction, with an emphasis on justice-focused computing for youth. She talked to the seminar attendees about her work on developing strategies to support primary school students learning to program in Scratch. Specifically, Jean described an approach called TIPP&SEE and how teachers can use it to guide their learners through programming activities.

What is TIPP&SEE?

TIPP&SEE is a metacognitive approach for programming in Scratch. The purpose of metacognitive strategies is to help students become more aware of their own learning processes.

The TIPP&SEE learning strategy is a sequence of steps named Title, Instructions, Purpose, Play, Sprites, Events, Explore.
The stages of the TIPP&SEE approach

TIPP&SEE scaffolds students as they learn from example Scratch projects: TIPP (Title, Instructions, Purpose, Play) is a scaffold to read and run a Scratch project, while SEE (Sprites, Events, Explore) is a scaffold to examine projects more deeply and begin to adapt them. 

Using, modifying and creating

TIPP&SEE is inspired by the work of Irene Lee and colleagues who proposed a progressive three-stage approach called Use-Modify-Create. Following that approach, learners move from reading pre-existing programs (“not mine”) to adapting and creating their own programs (“mine”) and gradually increase ownership of their learning.

A diagram of the Use-Create-Modify learning strategy for programming, which involves moving from exploring existing programs to writing your own.
TIPP&SEE builds on the Use-Modify-Create progression.

Proponents of scaffolded approaches like Use-Modify-Create argue that engaging learners in cycles of using existing programs (e.g. worked examples) before they move to adapting and creating new programs encourages ownership and agency in learning. TIPP&SEE builds on this model by providing additional scaffolding measures to support learners.

Impact of TIPP&SEE

Jean presented some promising results from her research on the use of TIPP&SEE in classrooms. In one study, fourth-grade learners (age 9 to 10) were randomly assigned to one of two groups: (i) Use-Modify-Create only (the control group) or (ii) Use-Modify-Create with TIPP&SEE. Jean found that, compared to learners in the control group, learners in the TIPP&SEE group:

  • Were more thorough, and completed more tasks
  • Wrote longer scripts during open-ended tasks
  • Used more learned blocks during open-ended tasks
A graph showing that learners using TIPP&SEE outperformed learners using only Use-Modify-Create in a research study.
The TIPP&SEE group performed better than the control group in assessments

In another study, Jean compared how learners in the TIPP&SEE and control groups performed on several cognitive tests. She found that, in the TIPP&SEE group, students with learning difficulties performed as well as students without learning difficulties. In other words, in the TIPP&SEE group the performance gap was much narrower than in the control group. In our seminar, Jean argued that this indicates the TIPP&SEE scaffolding provides much-needed support to diverse groups of students.

Using TIPP&SEE in the classroom

TIPP&SEE is a multi-step strategy where learners start by looking at the surface elements of a program, and then move on to examining the underlying code. In the TIPP phase, learners first read the title and instructions of a Scratch project, identify its purpose, and then play the project to see what it does.

The TIPP&SEE learning strategy is a sequence of steps named Title, Instructions, Purpose, Play, Sprites, Events, Explore.

In the second phase, SEE, learners look inside the Scratch project to click on sprites and predict what each script is doing. They then make changes to the Scratch code and see how the project’s output changes. By changing parameters, learners can observe which part of the output changes as a result and then reason how each block functions. This practice is called deliberate tinkering because it encourages learners to observe changes while executing programs multiple times with different parameters.

The TIPP&SEE learning strategy is a sequence of steps named Title, Instructions, Purpose, Play, Sprites, Events, Explore.

You can read more of Jean’s research on TIPP&SEE on her website. There’s also a video on how TIPP&SEE can be used, and free lesson resources based on TIPP&SEE are available in Elementary Computing for ALL and Scratch Encore.

Learning about learning in computing education

Jean’s talk highlighted the need for computing to be inclusive and to give equitable access to all learners. The field of computing education is still in its infancy, though our understanding of how young people learn about computing is growing. We ourselves work to deepen our understanding of how young people learn through computing and digital making experiences.

In our own research, we have been investigating similar teaching approaches for programming, including the use of the PRIMM approach in the UK, so we were very interested to learn about different approaches and country contexts. We are grateful to Dr Jean Salac for sharing her work with researchers and teachers alike. Watch the recording of Jean’s seminar to hear more:

Free support for teaching programming and more to primary school learners

If you are looking for more free resources to help you structure your computing lessons:

Join our next seminar

In the next seminar of our online series on primary computing, I will be presenting my research on integrated computing and literacy activities. Sign up now to join us for this session on Tues 7 March:

As always, the seminars will take place online on the first Tuesday of the month at 17:00–18:30 UK time. Hope to see you there!

The post Supporting beginner programmers in primary school using TIPP&SEE appeared first on Raspberry Pi.

Съжители по неволя

Post Syndicated from Йовко Ламбрев original https://www.toest.bg/sazhiteli-po-nevolia/

Съжители по неволя

Да го наречем Иван. Някога, преди поне десетилетие и две смени на собствеността, е живял в къщата, която купихме със семейството ми през 2016-та. Оттогава не минава и месец, в който да не го издирват вкъщи от НАП или от Общината за неплатени данъци. Търсят го и частни съдебни изпълнители, банки и мобилни оператори, на които е длъжник. Лепят предупредителни бележки на нашата врата.

Иван не е единствен. Заедно с него на нашия адрес „живее“… нека я наречем Мария. Нея също я издирват периодично за неплатени данъци и задължения. Тя има и син, който също се води, че живее у нас.

Тази история, макар с герои с подменени имена, е съвсем реална. И за съжаление, много често срещана.

Нежелани съжители по документи имат много български семейства

заради несъвършенства на системата за адресна регистрация у нас, наследени с години.

Всяко лице е длъжно в срок от 30 дни да заяви промяната на настоящия си адрес.

Това гласи чл. 99, ал. 1 от Закона за гражданската регистрация. Дотук добре, но от небрежност или съвсем умишлено много хора като Иван и Мария не декларират актуалния си адрес пред държавата. На теория това се санкционира, но в действителност трудно се установява. Отделно, че администрацията не полага никакви усилия да установява и санкционира такива нарушения. Вместо това продължава безполезно да издирва длъжниците си там, където те очевидно отдавна не живеят. И така – години наред.

Ако Иван и Мария не искат да бъдат намирани лесно, те нямат особена причина да променят завареното си положение. То им дава възможност да се крият от кредиторите си и да бавят плащания на сметки и данъци. А в същото време да имат напълно валидна адресна регистрация от времето, когато са били собственици, наематели или ползватели на дадено жилище.

На новите собственици на това жилище обаче те не само причиняват неудобството да получават нежелана кореспонденция и да бъдат посещавани от призовкари, съдебни изпълнители или колекторски фирми. В по-крайната хипотеза – при твърде много лица, регистрирани на един адрес – напълно е възможно на новия собственик на жилището, негов роднина или наемател

да бъде отказано извършване на адресна регистрация

поради нарушаване на чл. 92, ал. 10 от ЗГР, а именно надвишаване на двукратния брой на лицата, които обичайно могат да обитават съответното жилище. Този брой се изчислява спрямо жилищната площ, като „на едно лице се падат не по-малко от 10 кв.м“, указва законът.

Дори когато Иван и Мария си подновяват личната карта, те трябва само да препотвърдят постоянния си адрес – без нужда да доказват, че все още имат правото да се водят на него. Този адрес се подава автоматично от Единната система за гражданска регистрация и административно обслужване на населението (ЕСГРАОН), която отговаря за поддържането на регистъра на населението.

Ако поискате от служителите в съответното териториално звено на ЕСГРАОН да премахнат „мъртвите души“ от вашия имот, ще ви отговорят, че това не е в техните правомощия. И всъщност по закон е така. Право да разпоредят заличаване на адресната регистрация на лица, нарушили изискванията на ЗГР, имат общинските и районните кметове.

И ето го решението.

То е сравнително бързо и не изисква кой знае какви усилия от ваша страна. Всичко, което е необходимо да направите, е да опишете случая си в свободен текст и да го адресирате до кмета на общината, в която се намира вашият имот (или до районния кмет, ако става дума за голям град). Може да се опитате да подадете документа и чрез Системата за сигурно електронно връчване.

В това писмо трябва да поискате назначаване на комисия за проверка по чл. 99б от ЗГР, да приложите списък на членовете на своето домакинство или на наемателите си и да поискате всички извън този списък да бъдат отписани от вашия адрес. Вероятно в Общината ще ви поискат и копие от нотариалния акт за собственост върху имота.

След завеждането на вашата молба с входящ номер кметът има тридневен срок да назначи комисия за исканата от вас проверка. Самата проверка пък следва да бъде извършена в седемдневен срок от назначаването на комисията и накрая да приключи с писмен протокол. Ако кметът не се задейства, ЗГР ви дава правото да сезирате и областния управител.

В общия случай вашата молба ще провокира посещение от кварталния полицай, който ще бъде натоварен със задачата да провери сигнала и да потвърди кой в действителност живее на този адрес. Междувременно служба ГРАО в Общината ще се опита да издири въпросните лица (на адресите на техни преки роднини) и да ги предупреди, че трябва да актуализират адресната си регистрация. Независимо дали ще го сторят, в тридневен срок след приключване на проверката

кметът е длъжен да разпореди заличаване на адресните регистрации, които са в нарушение на закона.

Тази заповед подлежи на обжалване от засегнатите лица, но то не спира изпълнението ѝ.

Това, уви, не означава автоматично, че нежеланата кореспонденция и посещенията от хора, издирващи вашите Иван или Мария, веднага ще секнат. Но постепенно тази набрана инерция ще започне да намалява. И в крайна сметка Иван и Мария в някакъв момент ще бъдат принудени от обстоятелствата да се регистрират на друг адрес.

The collective thoughts of the interwebz