Post Syndicated from Michael Chan original https://aws.amazon.com/blogs/security/how-to-monitor-and-query-iam-resources-at-scale-part-2/
In this post, we continue with our recommendations for using AWS Identity and Access Management (IAM) APIs. In part 1 of this two-part series, we described how you could create IAM resources and use them soon after for authorization decisions. We also described options for monitoring and responding to IAM resource changes for entire accounts. Now, in part 2 of this post, we’ll cover the API throttling behavior of IAM and AWS Security Token Service (AWS STS) and how you can effectively plan your usage of these APIs. We’ll also cover the features of IAM that enable you to right-size the permissions granted to principals in your organization and assess external access to your resources.
Increase your usage of IAM APIs
If you’re a developer or a security engineer, you might find yourself writing more and more automation that interacts with IAM APIs. Other engineers, teams, or applications might also call the IAM APIs within the same account or cross-account. Over time, anyone calling the APIs in your account incrementally increases the number of requests per second. If so, IAM might send a “Rate exceeded” error that indicates you have exceeded a certain threshold of API calls per second. This is called API throttling.
Understand IAM API throttling
API throttling occurs when you exceed the call rate limits for an API. AWS uses API throttling to limit requests to a service. Like many AWS services, IAM limits API requests to maintain the performance of the service, and to ensure fair usage across customers. IAM and AWS STS independently implement a token bucket algorithm for throttling, in which a bucket of virtual tokens is refilled every second. Each token represents a non-throttled API call that you can make. The number of tokens that a bucket holds and the refill rate depends on the API. For each IAM API, a number of token buckets might apply.
We refer to this simply as rate-limiting criteria. Essentially, there are several rate-limiting criteria that are considered when evaluating whether a customer is generating more traffic than the service allows. The following are some examples of these criteria:
- The account where the API is called
- The account for read or write APIs (depending on whether the API is a read or write operation)
- The account from which AssumeRole was called prior to the API call (for example, third-party cross-account calls)
- The account from which AssumeRole was called prior to the API call for read APIs
- The API and organization where the API is called
Understand STS API throttling
Although IAM has criteria pertaining to the account from which AssumeRole was called, IAM has its own API rate limits that are distinct from AWS STS. Therefore, the preceding criteria are IAM-specific and are separate from the throttling that can occur if you call STS APIs. IAM is also a global service, and the limits are not Region-aware. In contrast, while STS has a single global endpoint, every Region has its own STS endpoint with its own limits.
The STS rate-limiting criteria pertain to each account and endpoint for API calls. For example, if you call the AssumeRole API against the sts.ap-northeast-1.amazonaws.com endpoint, STS will evaluate the rate-limiting criteria associated with that account and the ap-northeast-1 endpoint. Other STS API requests that you perform under the same account and endpoint will also count towards these criteria. However, if you make a request from the same account to a different regional endpoint or the global endpoint, that request will count against different criteria.
Note: AWS recommends that you use the STS regional endpoints instead of the STS global endpoint. Regional endpoints have several benefits, including redundancy and reduced latency. To learn more about other benefits, see Managing AWS STS in an AWS Region.
How multiple criteria affect throttling
The preceding examples show the different ways that IAM and STS can independently limit requests. Limits might be applied at the account level and across read or write APIs. More than one rate-limiting criterion is typically associated with an API call, with each request counted against each rate-limiting criterion independently. This means that if the requests-per-second exceeds the applicable criteria, then API throttling occurs and returns a rate-limiting error.
How to address IAM and STS API throttling
In this section, we’ll walk you through some strategies to reduce IAM and STS API throttling.
Query for top callers
With AWS CloudTrail Lake, your organization can aggregate, store, and query events recorded by CloudTrail for auditing, security investigation, and operational troubleshooting. To monitor API throttling, you can run a simple query that identifies the top callers of IAM and STS.
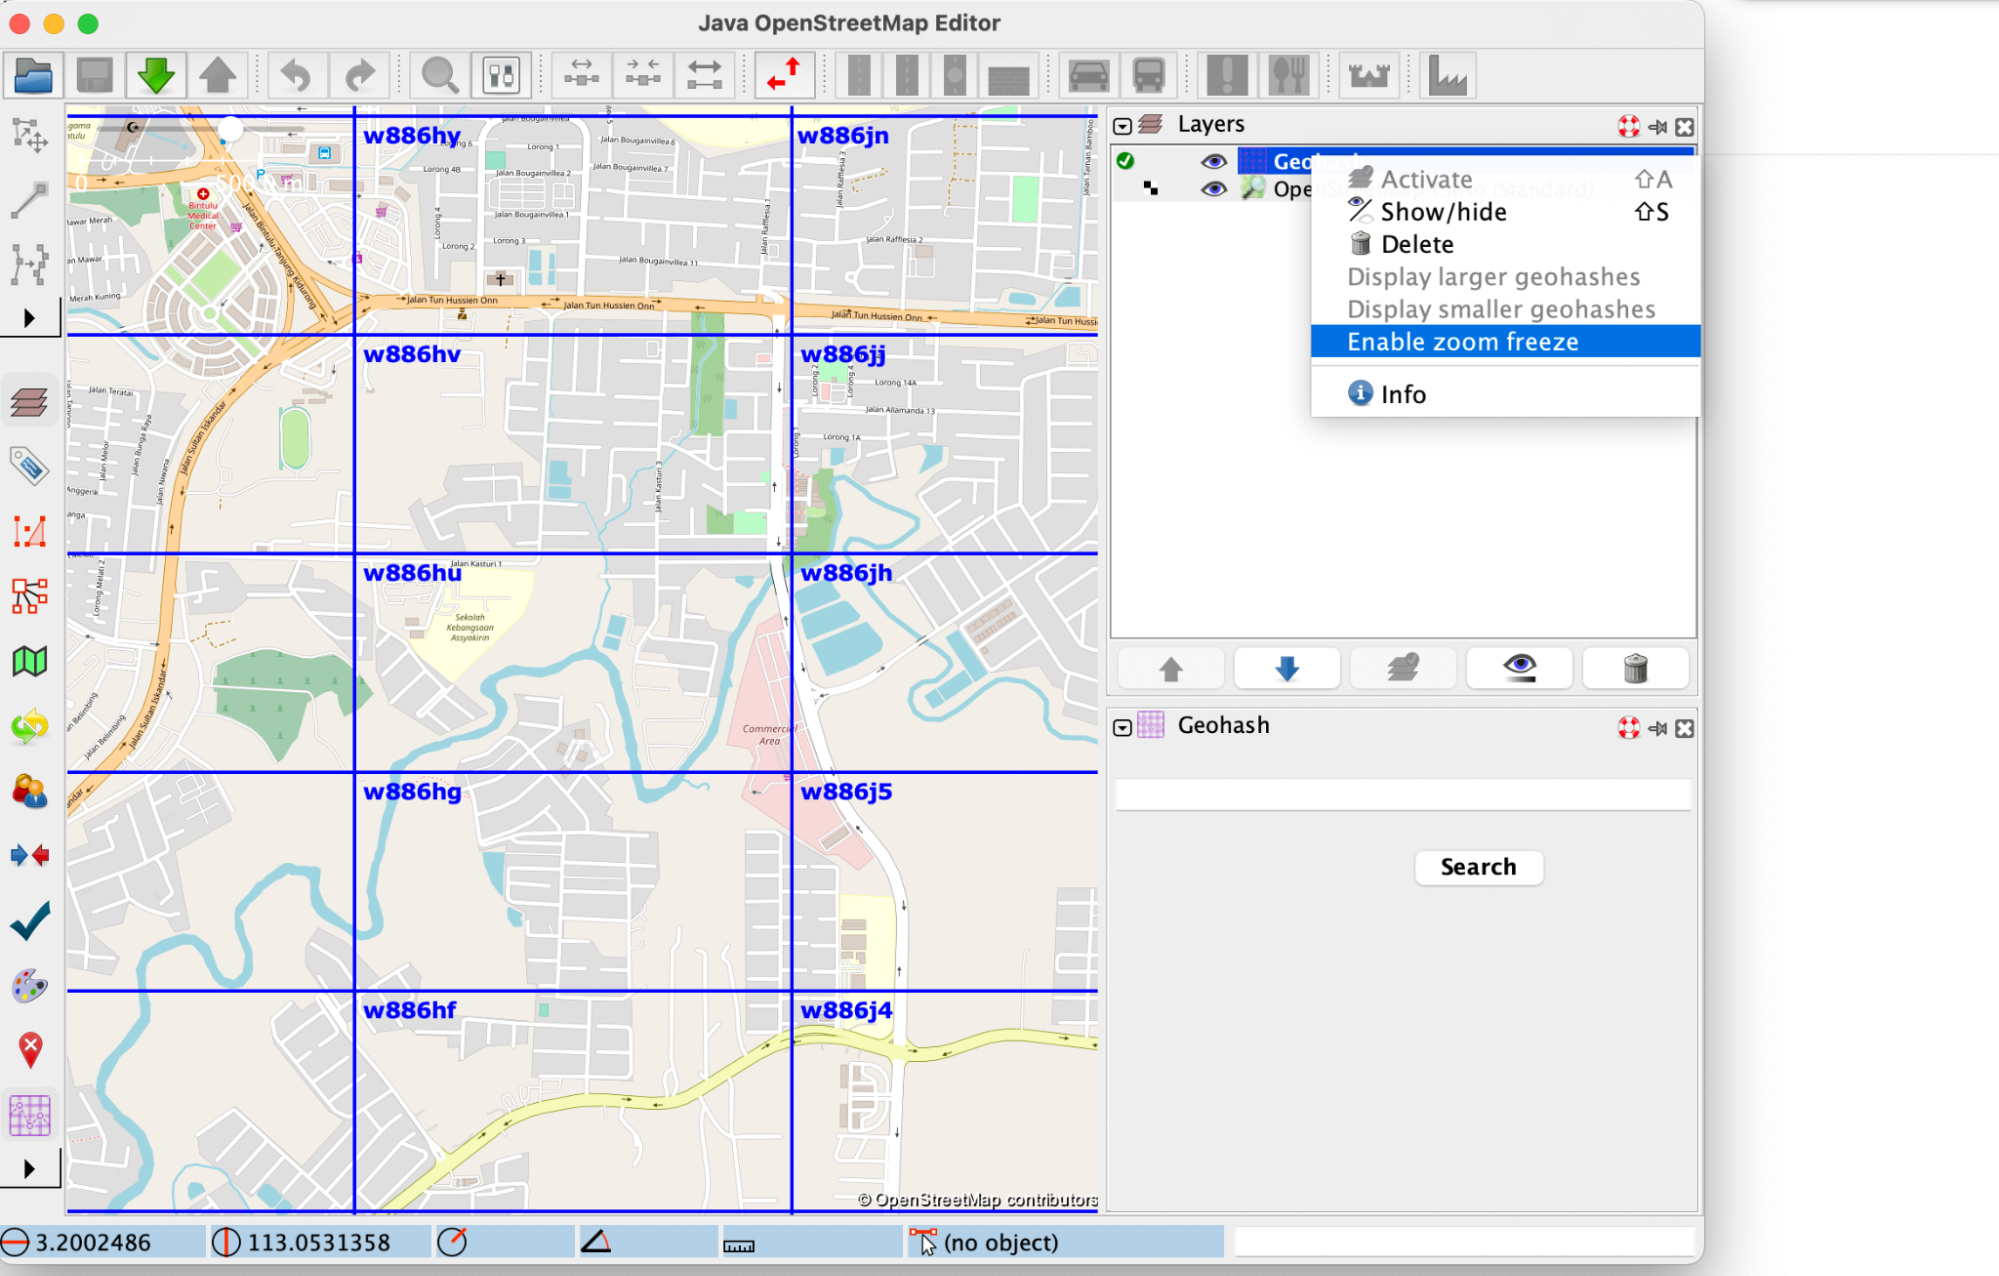
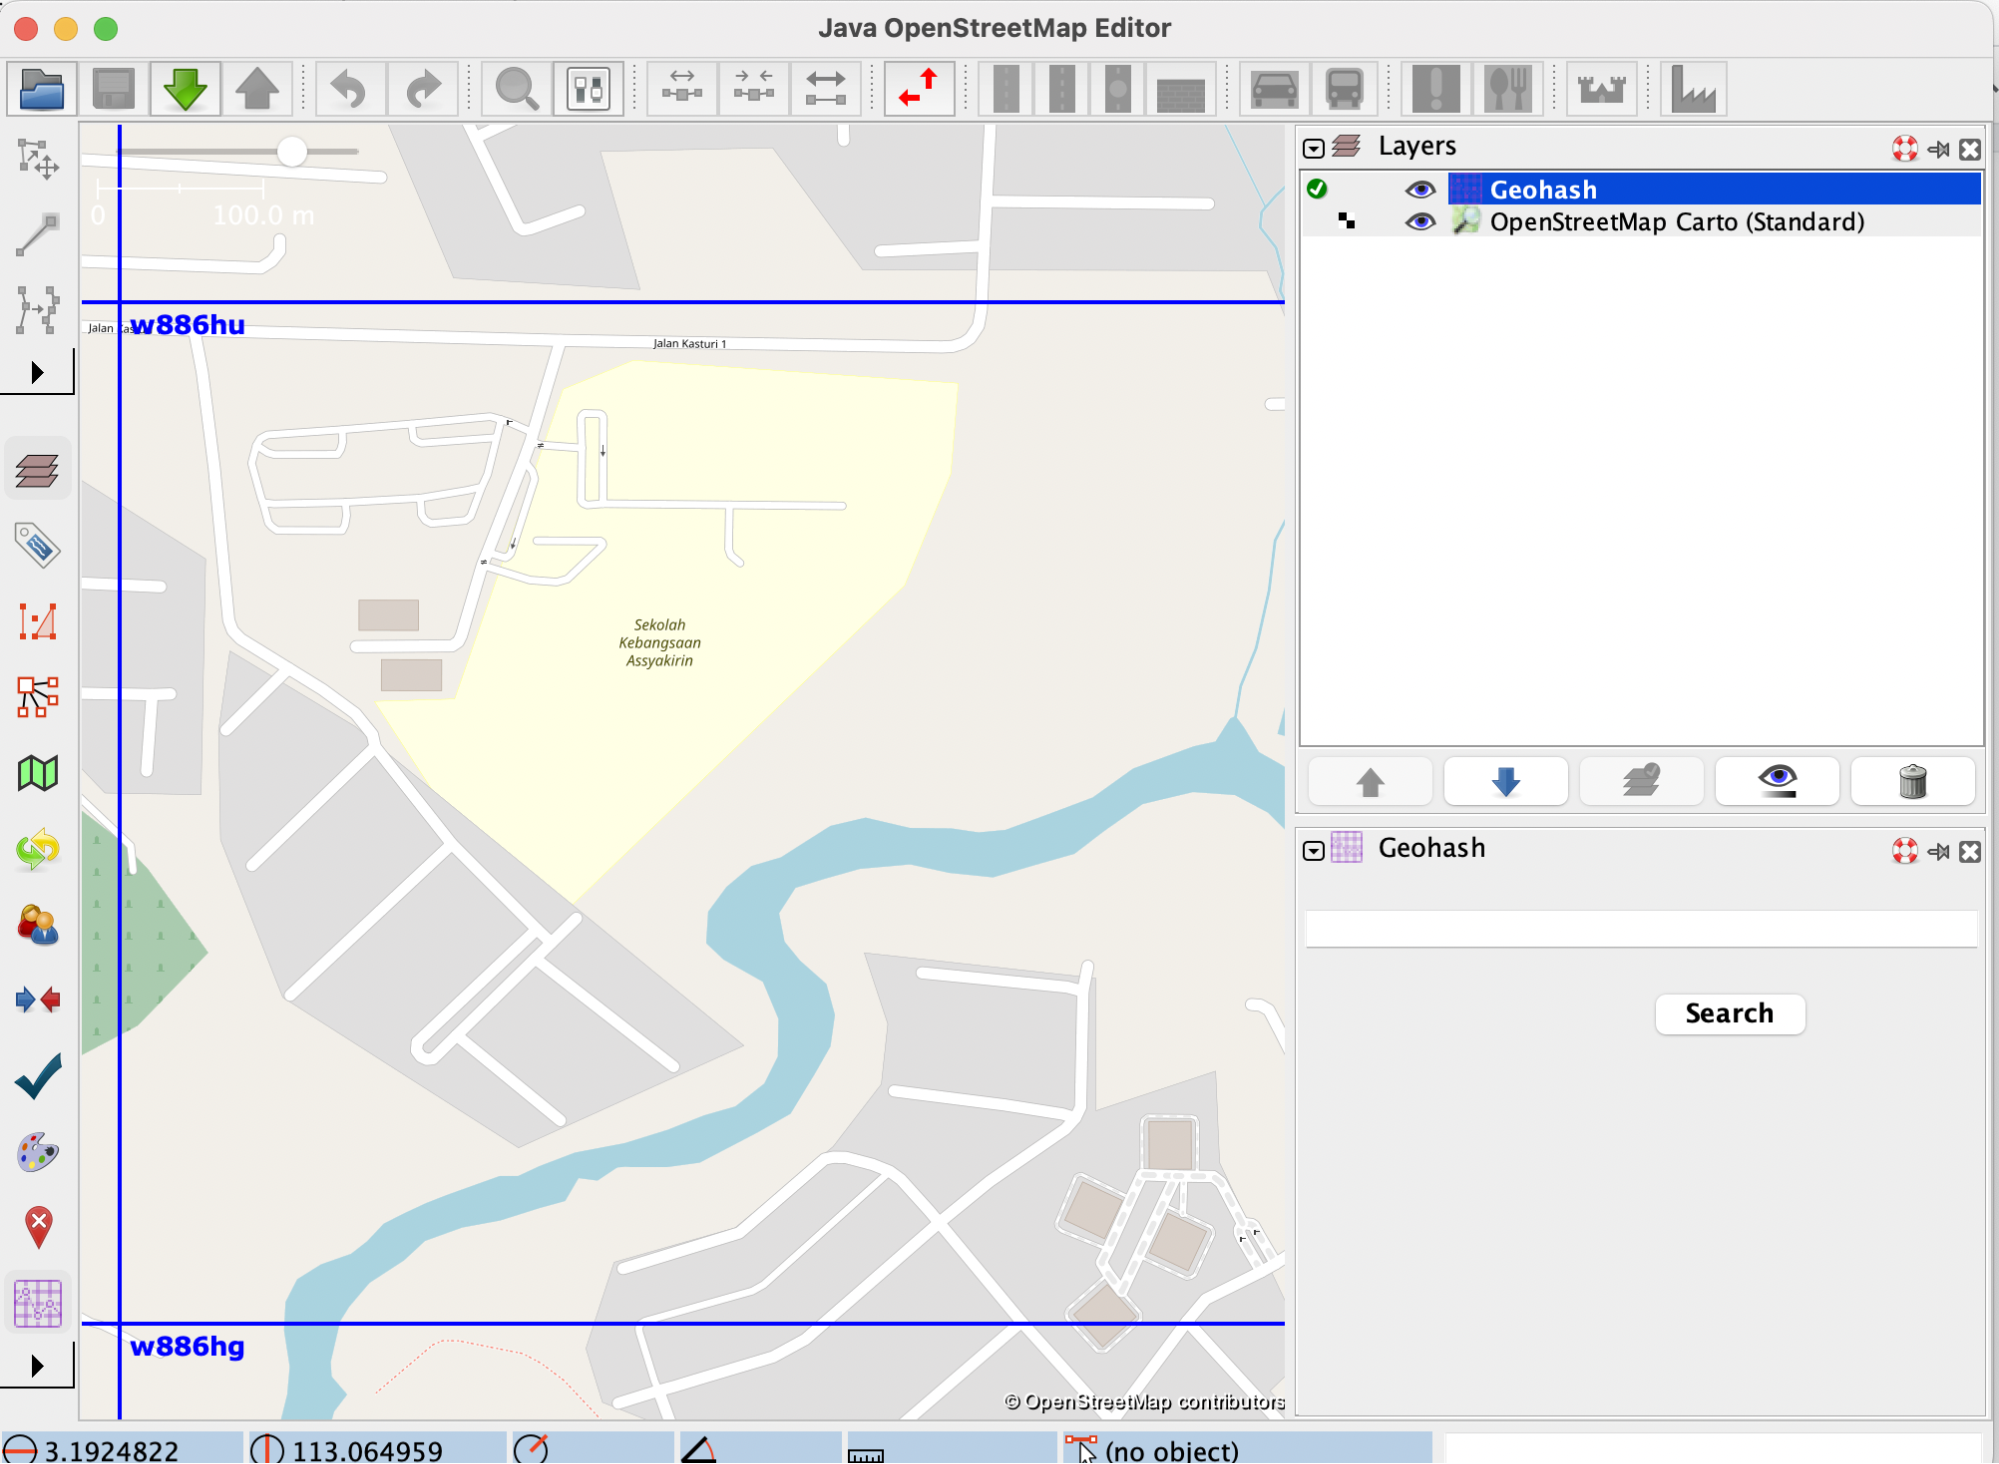
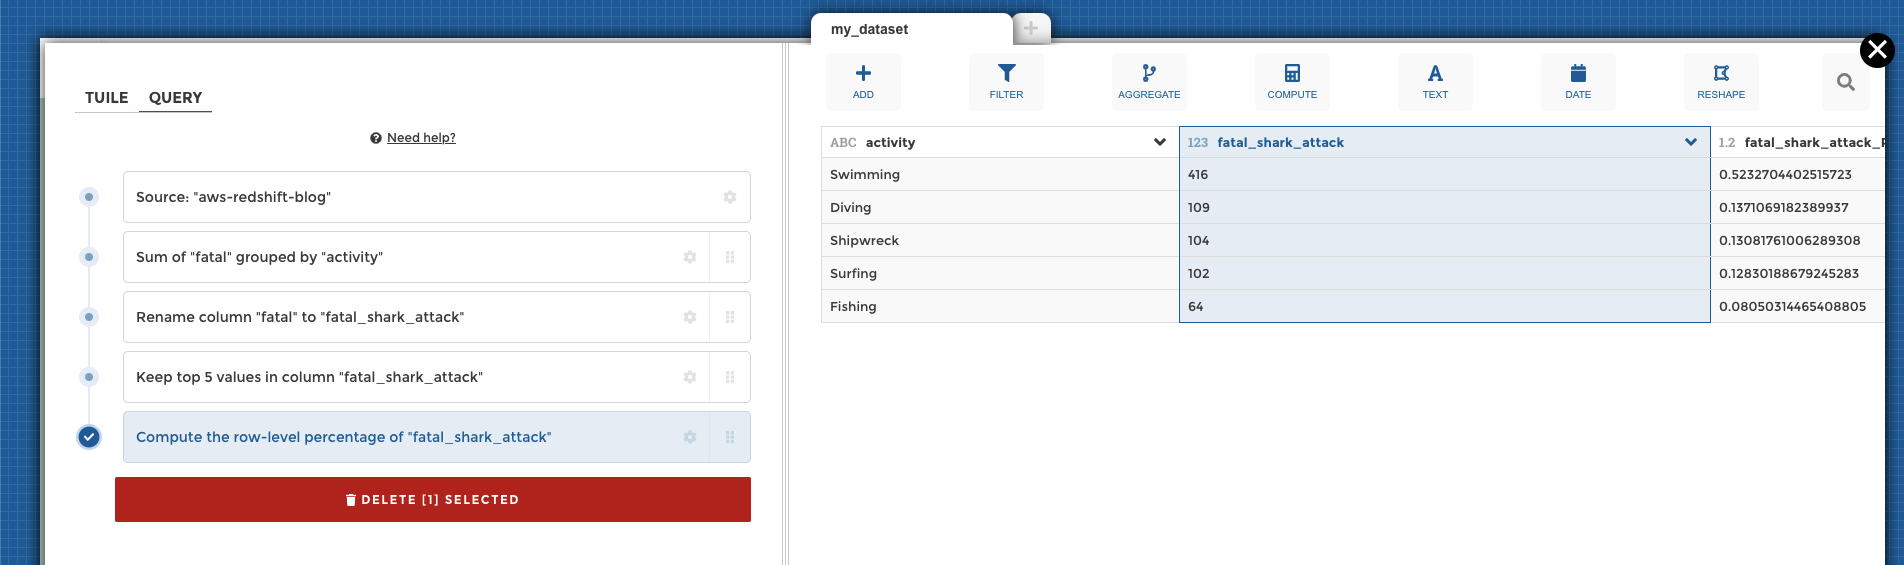
For example, you can make a SQL-based query in the CloudTrail console to identify the top callers of IAM, as shown in Figure 1. This query includes the API count, API event name, and more that are made to IAM (shown under eventSource). In this example, the top result is a call to GetServiceLastAccessedDetails, which occurred 163 times. The result includes the account ID and principal ID that made those requests.
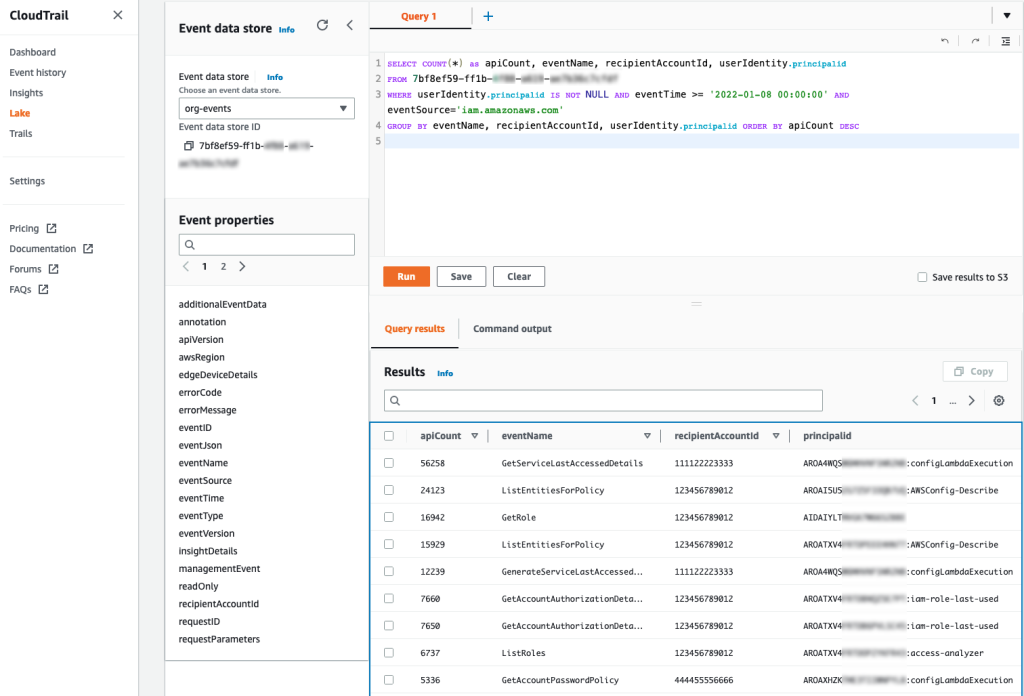
Figure 1: Example AWS CloudTrail Lake query
You can enable AWS CloudTrail Lake for all accounts in your organization. For more information, see Announcing AWS CloudTrail Lake – a managed audit and security Lake. For sample queries, including top IAM actions by principal, see cloud-trail-lake-query-samples in our aws-samples GitHub repository.
Know when you exceed API call rate limits
To reduce call throttling, you need to know when you exceed a rate limit. You can identify when you are being throttled by catching the RateLimitExceeded exception in your API calls. Or, you can send your application logs to Amazon CloudWatch Logs and then configure a metric filter to record each time that throttling occurs, for later analysis or notification. Ideally, you should do this across your applications, and log this information centrally so that you can investigate whether calls from a specific account (such as your central monitoring account) are affecting API availability across your other accounts by exceeding a rate-limiting criterion in those accounts.
Call your APIs with a less aggressive retry strategy
In the AWS SDKs, you can use the existing retry library and provide a custom base for the initial sleep done between API calls. For example, you can set a custom configuration for the backoff or edit the defaults directly. The default SDK_DEFAULT_THROTTLED_BASE_DELAY is 500 milliseconds (ms) in the relevant Java SDK file, but if you’re experiencing throttling consistently, we recommend a minimum 1000 ms for the throttled base delay. You can change this value or implement a custom configuration through the PredefinedBackoffStrategies.SDKDefaultBackoffStrategy() class, which is referenced in the same file. As another example, in the Javascript SDK, you can edit the base retry of the retryDelayOptions configuration in the AWS.Config class, as described in the documentation.
The difference between making these changes and using the SDK defaults is that the custom base provides a less aggressive retry. You shouldn’t retry multiple requests that are throttled during the same one-second window. If the API has other applicable rate-limiting criteria, you can potentially exceed those limits as well, preventing other calls in your account from performing requests. Lastly, be careful that you don’t implement your own retry or backoff logic on top of the SDK retry or backoff logic because this could make throttling worse — instead, you should override the SDK defaults.
Reduce the number of requests by using max items
For some APIs, you can increase the number of items returned by a single API call. Consider the example of the GetServiceLastAccessedDetails API. This API returns a lot of data, but the results are truncated by default to 100 items, ordered alphabetically by the service namespace. If the number of items returned is greater than 100, then the results are paginated, and you need to make multiple requests to retrieve the paginated results individually. But if you increase the value of the MaxItems parameter, you can decrease the number of requests that you need to make to obtain paginated results.
AWS has hundreds of services, so you should set the value of the MaxItems parameter no higher than your application can handle (the response size could be large). At the time of our testing, the results were no longer truncated when this value was 300. For this particular API, IAM might return fewer results, even when more results are available. This means that your code still needs to check whether the results are paginated and make an additional request if paginated results are available.
Consistent use of the MaxItems parameter across AWS APIs can help reduce your total number of API requests. The MaxItems parameter is also available through the GetOrganizationsAccessReport operation, which defaults to 100 items but offers a maximum of 1000 items, with the same caveat that fewer results might be returned, so check for paginated results.
Smooth your high burst traffic
In the table from part 1 of this post, we stated that you should evaluate IAM resources every 24 hours. However, if you use a simple script to perform this check, you could initiate a throttling event. Consider the following fictional example:
As a member of ExampleCorp’s Security team, you are working on a task to evaluate the company’s IAM resources through some custom evaluation scripts. The scripts run in a central security account. ExampleCorp has 1000 accounts. You write automation that assumes a role in every account to run the GetAccountAuthorizationDetails API call. Everything works fine during development on a few accounts, but you later build a dashboard to graph the data. To get the results faster for the dashboard, you update your code to run concurrently every hour. But after this change, you notice that many requests result in the throttling error “Rate exceeded.” Other security teams see “Rate exceeded” errors in their application logs, too.
Can you guess what happened? When you tried to make the requests faster, you used concurrency to make the requests run in parallel. By initiating this large number of requests simultaneously, you exceeded the rate-limiting criteria for the security account from which the sts:AssumeRole action was called prior to the GetAccountAuthorizationDetails API call.
To address scenarios like this, we recommend that you set your own client-side limitations when you need to make a large number of API requests. You can spread these calls out so that they happen sequentially and avoid large spikes. For example, if you run checks every 24 hours, make sure that the calls don’t happen at exactly midnight. Figure 2 shows two different ways to distribute API volume over time:
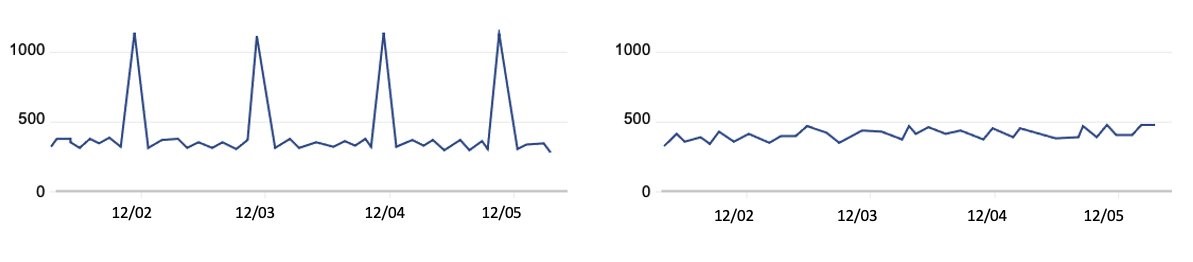
Figure 2: Call volume that periodically spikes compared to evenly-distributed call volume
The graph on the left represents a large, recurring API call volume, with calls occurring at roughly the same time each day—such as 1000 requests at midnight every 24 hours. However, if you intend to make these 1000 requests consistently every 24 hours, you can spread them out over the 24-hour period. This means that you could make about 41 requests every hour, so that 41 accounts are queried at 00:00 UTC, another 41 the next hour, and so on. By using this strategy, you can make these requests blend into your other traffic, as shown in the graph on the right, rather than create large spikes. In summary, your automation scheduler should avoid large spikes and distribute API requests evenly over the 24-hour period. Using queues such as those provided by Amazon Simple Queue Service (Amazon SQS) can also help, and when errors are identified, you can put them in a dead letter queue to try again later.
Some IAM APIs have rate-limiting criteria for API requests made from the account from which the AssumeRole was called prior to the call. We recommend that you serially iterate over the accounts in your organization to avoid throttling. To continue with our example, you should iterate the 41 accounts one-by-one each hour, rather than running 41 calls at once, to reduce spikes in your request rates.
Recommendations specific to STS
You can adjust how you use AWS STS to reduce your number of API calls. When you write code that calls the AssumeRole API, you can reuse the returned credentials for future requests because the credentials might still be valid. Imagine that you have an event-driven application running in a central account that assumes a role in a target account and does an API call for each event that occurs in that account. You should consider reusing the credentials returned by the AssumeRole call for each subsequent call in the target account, especially if calls in the central accounts are being throttled. You can do this for AssumeRole calls because there is no service-side limit to the number of credentials that you can create and use. Whether it’s one credential or many, you need to use and store these carefully. You can also adjust the role session duration, which determines how long the role’s credentials are valid. This value can be up to 12 hours, depending on the maximum session duration configured on the role. If you reuse short-term credentials or adjust the session duration, make sure that you evaluate these changes from a security perspective as you optimize your use of STS to reduce API call volume.
Use case #3: Pare down permissions for least-privileged access
Let’s assume that you want to evaluate your organization’s IAM resources with some custom evaluation scripts. AWS has native functionality that can reduce your need for a custom solution. Let’s take a look at some of these that can help you accomplish these goals.
Identify unintended external sharing
To identify whether resources in your accounts, such as IAM roles and S3 buckets, have been shared with external entities, you can use IAM Access Analyzer instead of writing your own checks. With IAM Access Analyzer, you can identify whether resources are accessible outside your account or even your entire organization. Not only can you identify these resources on-demand, but IAM Access Analyzer proactively re-analyzes resources when their policies change, and reports new findings. This can help you feel confident that you will be notified of new external sharing of supported resources, so that you can act quickly to investigate. For more details, see the IAM Access Analyzer user guide.
Right-size permissions
You can also use IAM Access Analyzer to help right-size the permissions policies for key roles in your accounts. IAM Access Analyzer has a policy generation feature that allows you to generate a policy by analyzing your CloudTrail logs to identify actions used from over 140 services. You can compare this generated policy with the existing policy to see if permissions are unused, and if so, remove them.
You can perform policy generation through the API or the IAM console. For example, you can use the console to navigate to the role that you want to analyze, and then choose Generate policy to start analyzing the actions used over a specified period. Actions that are missing from the generated policy are permissions that can be potentially removed from the existing policy, after you confirm your changes with those who administer the IAM role. To learn more about generating policies based on CloudTrail activity, see IAM Access Analyzer makes it easier to implement least privilege permissions by generating IAM policies based on access activity.
Conclusion
In this two-part series, you learned more about how to use IAM so that you can test and query IAM more efficiently. In this post, you learned about the rate-limiting criteria for IAM and STS, to help you address API throttling when increasing your usage of these services. You also learned how IAM Access Analyzer helps you identify unintended resource sharing while also generating policies that serve as a baseline for principals in your account. In part 1, you learned how to quickly create IAM resources and use them when refining permissions. You also learned how to get information about IAM resources and respond to IAM changes through the various services integrated with IAM. Lastly, when calling IAM directly, you learned about bulk APIs, which help you efficiently retrieve the state of your principals and policies. We hope these posts give you valuable insights about IAM to help you better monitor, review, and secure access to your AWS cloud environment!
If you have feedback about this post, submit comments in the Comments section below. If you have questions about this post, start a new thread on the Security, Identity, & Compliance re:Post or contact AWS Support.
Want more AWS Security news? Follow us on Twitter.


 Bindhu Chinnadurai is a Senior Partner Solutions Architect in AWS based out of London, United Kingdom. She has spent 18+ years working in everything for large scale enterprise environments. Currently she engages with AWS partner to help customers migrate their workloads to AWS with focus on scalability, resiliency, performance and sustainability. Her expertise is DevSecOps.
 Sarathi Balakrishnan was the Global Partner Solutions Architect, specializing in Data, Analytics and AI/ML at AWS. He worked closely with AWS partner globally to build solutions and platforms on AWS to accelerate customers’ business outcomes with state-of-the-art cloud technologies and achieve more in their cloud explorations. He helped with solution architecture, technical guidance, and best practices to build cloud-native solutions. He joined AWS with over 20 years of large enterprise experience in agriculture, insurance, health care and life science, marketing and advertisement industries to develop and implement data and AI strategies.


 Nan Zhu is the engineering lead of the platform team in SafeGraph. He leads the team to build a broad range of infrastructure and internal toolings to improve the reliability, efficiency and productivity of the SafeGraph engineering process, e.g. internal Spark ecosystem, metrics store and CI/CD for large mono repos, etc. He is also involved in multiple open source projects like Apache Spark, Apache Iceberg, Gluten, etc.
 Dave Thibault is a Sr. Solutions Architect serving AWS’s independent software vendor (ISV) customers. He’s passionate about building with serverless technologies, machine learning, and accelerating his AWS customers’ business success. Prior to joining AWS, Dave spent 17 years in life sciences companies doing IT and informatics for research, development, and clinical manufacturing groups. He also enjoys snowboarding, plein air oil painting, and spending time with his family.