Post Syndicated from Vijay Menon original https://aws.amazon.com/blogs/architecture/field-notes-setting-up-disaster-recovery-in-a-different-seismic-zone-using-aws-outposts/
Recovering your mission-critical workloads from outages is essential for business continuity and providing services to customers with little or no interruption. That’s why many customers replicate their mission-critical workloads in multiple places using a Disaster Recovery (DR) strategy suited for their needs.
With AWS, a customer can achieve this by deploying multi Availability Zone High-Availability setup or a multi-region setup by replicating critical components of an application to another region. Depending on the RPO and RTO of the mission-critical workload, the requirement for disaster recovery ranges from simple backup and restore, to multi-site, active-active, setup. In this blog post, I explain how AWS Outposts can be used for DR on AWS.
In many geographies, it is possible to set up your disaster recovery for a workload running in one AWS Region to another AWS Region in the same country (for example in US between us-east-1 and us-west-2). For countries where there is only one AWS Region, it’s possible to set up disaster recovery in another country where AWS Region is present. This method can be designed for the continuity, resumption and recovery of critical business processes at an agreed level and limits the impact on people, processes and infrastructure (including IT). Other reasons include to minimize the operational, financial, legal, reputational and other material consequences arising from such events.
However, for mission-critical workloads handling critical user data (PII, PHI or financial data), countries like India and Canada have regulations which mandate to have a disaster recovery setup at a “safe distance” within the same country. This ensures compliance with any data sovereignty or data localization requirements mandated by the regulators. “Safe distance” means the distance between the DR site and the primary site is such that the business can continue to operate in the event of any natural disaster or industrial events affecting the primary site. Depending on the geography, this safe distance could be 50KM or more. These regulations limit the options customers have to use another AWS Region in another country as a disaster recovery site of their primary workload running on AWS.
In this blog post, I describe an architecture using AWS Outposts which helps set up disaster recovery on AWS within the same country at a distance that can meet the requirements set by regulators. This architecture also helps customers to comply with various data sovereignty regulations in a given country. Another advantage of this architecture is the homogeneity of the primary and disaster recovery site. Your existing IT teams can set up and operate the disaster recovery site using familiar AWS tools and technology in a homogenous environment.
Prerequisites
Readers of this blog post should be familiar with basic networking concepts like WAN connectivity, BGP and the following AWS services:
- Amazon EC2
- Amazon VPC
- AWS Outposts
- AWS Transit Gateway
- AWS Managed VPN
- AWS Direct Connect
- AWS Marketplace Amazon Machine Images (AMI) for Network Infrastructure
Architecture Overview
I explain the architecture using an example customer scenario in India, where a customer is using AWS Mumbai Region for their mission-critical workload. This workload needs a DR setup to comply with local regulation and the DR setup needs to be in a different seismic zone than the one for Mumbai. Also, because of the nature of the regulated business, the user/sensitive data needs to be stored within India.
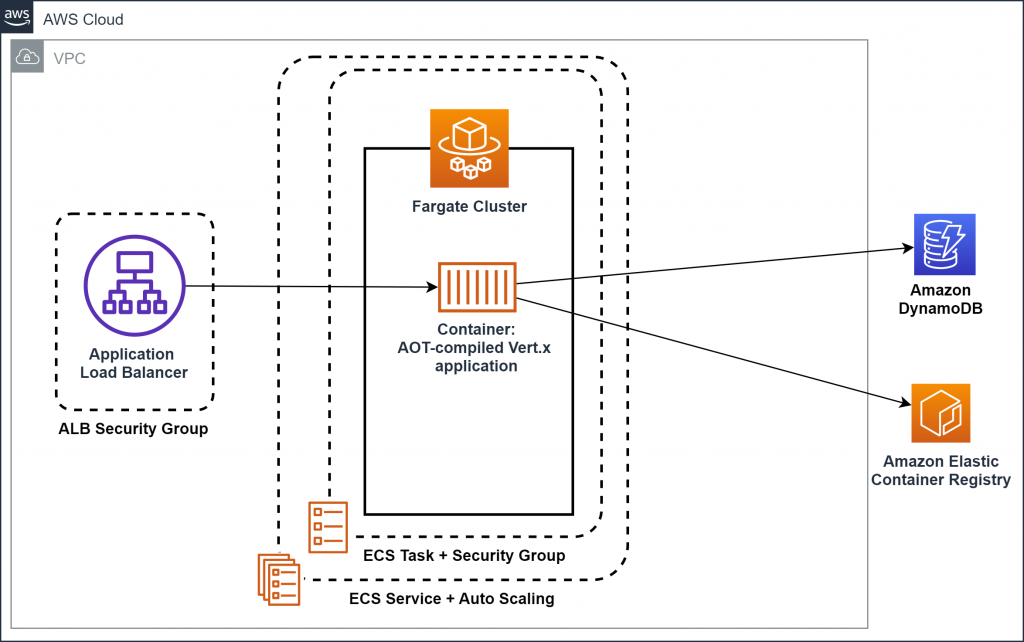
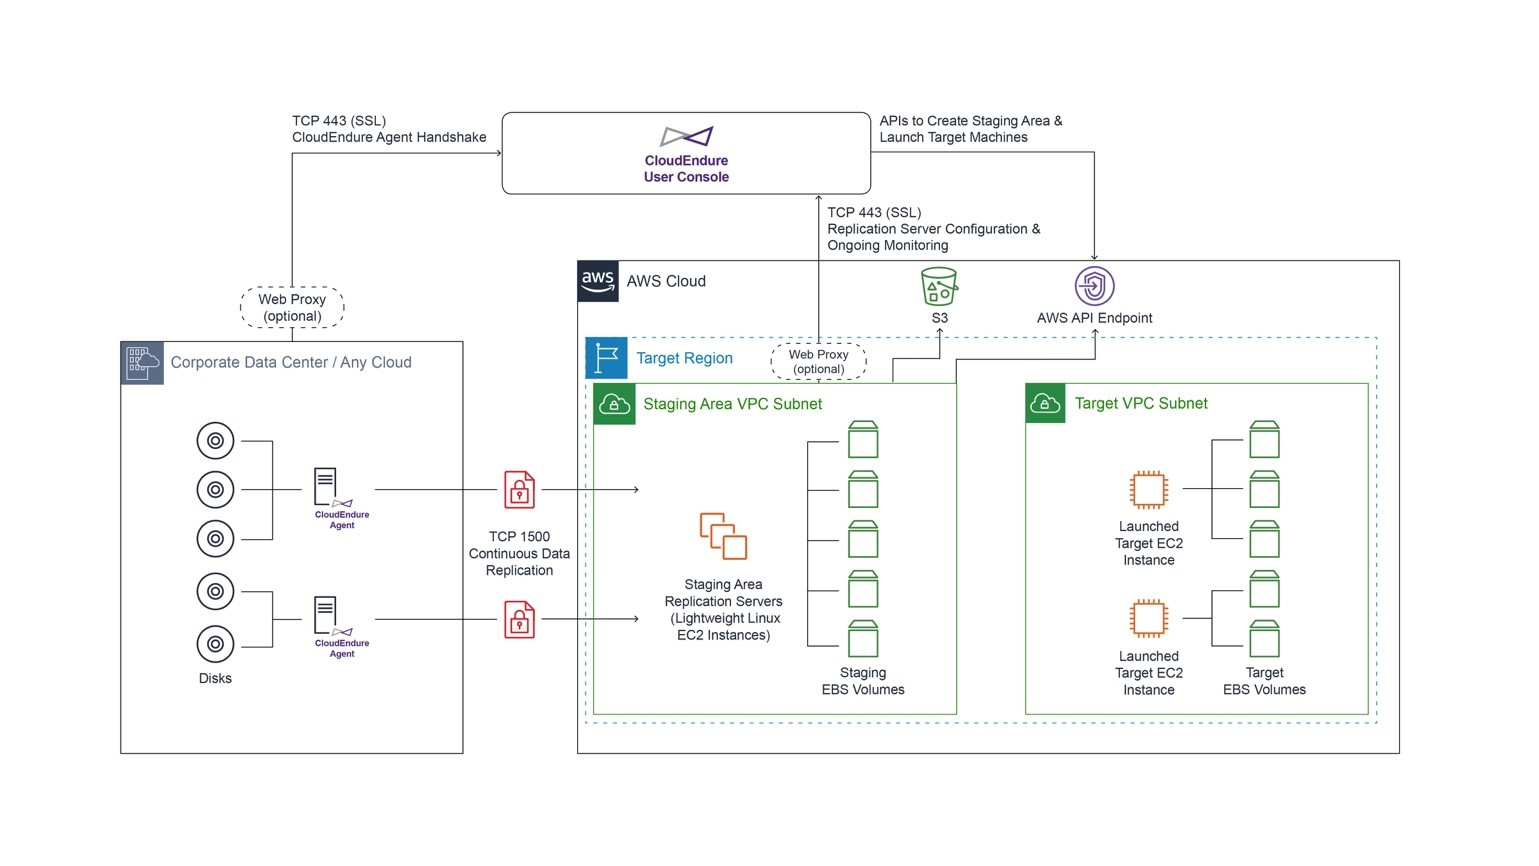
Following is the architecture diagram showing the logical setup.
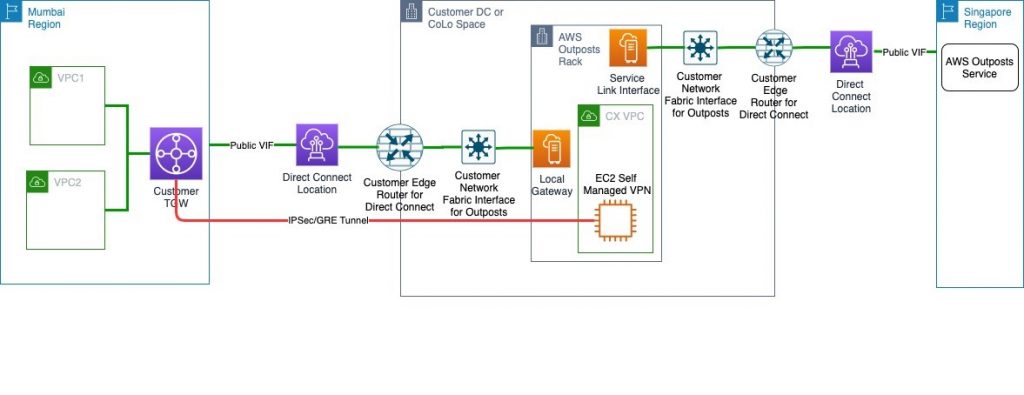
This solution is similar to a typical AWS Outposts use case where a customer orders the Outposts to be installed in their own Data Centre (DC) or a CoLocation site (Colo). It will follow the shared responsibility model described in AWS Outposts documentation.
The only difference is that the AWS Outpost parent Region will be the closest Region other than AWS Mumbai, in this case Singapore. Customers will then provision an AWS Direct Connect public VIF locally for a Service Link to the Singapore Region. This ensures that the control plane stays available via the AWS Singapore Region even if there is an outage in AWS Mumbai Region affecting control plane availability. You can then launch and manage AWS Outposts supported resources in the AWS Outposts rack.
For data plane traffic, which should not go out of the country, the following options are available:
- Provision a self-managed Virtual Private Network (VPN) between an EC2 instances running router AMI in a subnet of AWS Outposts and AWS Transit Gateway (TGW) in the primary Region.
- Provision a self-managed Virtual Private Network (VPN) between an EC2 instances running router AMI in a subnet of AWS Outposts and Virtual Private Gateway (VGW) in the primary Region.
Note: The Primary Region in this example is AWS Mumbai Region. This VPN will be provisioned via Local Gateway and DX public VIF. This ensures that data plane traffic will not traverse any network out of the country (India) to comply with data localization mandated by the regulators.
Architecture Walkthrough
- Make sure your data center (DC) or the choice of collocate facility (Colo) meets the requirements for AWS Outposts.
- Create an Outpost and order Outpost capacity as described in the documentation. Make sure that you do this step while logged into AWS Outposts console of the AWS Singapore Region.
- Provision connectivity between AWS Outposts and network of your DC/Colo as mentioned in AWS Outpost documentation. This includes setting up VLANs for service links and Local Gateway (LGW).
- Provision an AWS Direct Connect connection and public VIF between your DC/Colo and the primary Region via the closest AWS Direct Connect location.
- For the WAN connectivity between your DC/Colo and AWS Direct Connect location you can choose any telco provider of your choice or work with one of AWS Direct Connect partners.
- This public VIF will be used to attach AWS Outposts to its parent Region in Singapore over AWS Outposts service link. It will also be used to establish an IPsec GRE tunnel between AWS Outposts subnet and a TGW or VGW for data plane traffic (explained in subsequent steps).
- Alternatively, you can provision separate Direct Connect connection and public VIFs for Service Link and data plane traffic for better segregation between the two. You will have to provision sufficient bandwidth on Direct Connect connection for the Service Link traffic as well as the Data Plane traffic (like data replication between primary Region and AWS outposts).
- For an optimal experience and resiliency, AWS recommends that you use dual 1Gbps connections to the AWS Region. This connectivity can also be achieved over Internet transit; however, I recommend using AWS Direct Connect because it provides private connectivity between AWS and your DC/Colo environment, which in many cases can reduce your network costs, increase bandwidth throughput, and provide a more consistent network experience than Internet-based connections.
- Create a subnet in AWS Outposts and launch an EC2 instance running a router AMI of your choice from AWS Marketplace in this subnet. This EC2 instance is used to establish the IPsec GRE tunnel to the TGW or VGW in primary Region.
- Choose an EC2 instance which can support your bandwidth requirement as per the AMI provider and disable source/destination check for this EC2 instance.
- Assign an Elastic IP address to this EC2 instance from the customer-owned pool provisioned for your AWS Outposts.
- Add rules in security group of these EC2 instances to allow ISAKMP (UDP 500), NAT Traversal (UDP 4500), and ESP (IP Protocol 50) from VGW or TGW endpoint public IP addresses.
- NAT (Network Address Translation) the EIP assigned in step 5 to a public IP address at your edge router connecting to AWS Direct connect or internet transit. This public IP will be used as the customer gateway to establish IPsec GRE tunnel to the primary Region.
- Create a customer gateway using the public IP address used to NAT the EC2 instances step 7. Follow the steps in similar process found at Create a Customer Gateway.
- Create a VPN attachment for the transit gateway using the customer gateway created in step 8. This VPN must be a dynamic route-based VPN. For steps, review Transit Gateway VPN Attachments. If you are connecting the customer gateway to VPC using VGW in primary Region then follow the steps mentioned at How do I create a secure connection between my office network and Amazon Virtual Private Cloud?.
- Configure the customer gateway (EC2 instance running a router AMI in AWS Outposts subnet) side for VPN connectivity. You can base this configuration suggested by AWS during the creation of VPN in step 9. This suggested sample configuration can be downloaded from AWS console post VPN setup as discussed in this document.
- Modify the route table of AWS outpost Subnets to point to the EC2 instance launched in step 5 as the target for any destination in your VPCs in the primary Region, which is AWS Mumbai in this example.
At this point, you will have end-to-end connectivity between VPCs in a primary Region and resources in an AWS Outposts. This connectivity can now be used to replicate data from your primary site to AWS Outposts for DR purposes. This keeps the setup compliant with any internal or external data localization requirements.
Conclusion
In this blog post, I described an architecture using AWS Outposts for Disaster Recovery on AWS in countries without a second AWS Region. To set up disaster recovery, your existing IT teams can set up and operate the disaster recovery site using the familiar AWS tools and technology in a homogeneous environment. To learn more about AWS Outposts, refer to the documentation and FAQ.