Many organizations are establishing enterprise data warehouses, data lakes, or a modern data architecture on AWS to build data-driven products. As the organization grows, the number of publishers and subscribers to data and the volume of data keeps increasing. Additionally, different varieties of datasets are introduced (structured, semistructured, and unstructured). This can lead to metadata management issues, and the following questions:
“Can I trust this data?”
“Where does this data (lineage) come from?”
“How accurate is this data?”
“What does this column mean in my business terminology?”
“Who is the owner of this data?”
“When was the data last refreshed?”
“How can I classify the data (PII, non-PII, and so on) and build data governance?”
Metadata conveys both technical and business context to help you understand your data better and use it appropriately. It provides two primary types of information about data assets:
Technical metadata – Information about the structure of the data, such as schema and how the data is populated
Business metadata – Information in business terms, such as table and column description, owner, and data profile
Metadata management becomes a key element to allow users (data analysts, data scientists, data engineers, and data owners) to discover and locate the right data assets to address business requirements and perform data governance. Some common features of metadata management are:
Search and discovery – Data schemas, fields, tags, usage information
Access control – Access control, groups, users, policies
Data lineage – Pipeline runs, queries, transformation logic
Compliance – Taxonomy of data privacy, compliance annotation types
Classification – Classify different datasets and data elements
Data quality – Data quality rule definitions, run results, data profiles
These features can help organizations build standard metadata management processes, which can help remove redundancy and inconsistency in data assets, and allow users to collaborate and build richer data products quickly.
In this two-part series, we discuss how to deploy DataHub on AWS using managed services with the AWS Cloud Development Kit (AWS CDK), populate technical metadata from the AWS Glue Data Catalog and Amazon Redshift into DataHub, and augment data with a business glossary and visualize data lineage of AWS Glue jobs.
In this post, we focus on the first step: deploying DataHub on AWS using managed services with the AWS CDK. This will allow organizations to launch DataHub using AWS managed services and begin the journey of metadata management.
Why DataHub?
DataHub is one of the most popular open-source metadata management platforms. It enables end-to-end discovery, data observability, and data governance. It has a rich set of features, including metadata ingestion (automated or programmatic), search and discovery, data lineage, data governance, and many more. It provides an extensible framework and supports federated data governance.
DataHub offers out-of-the-box support to ingest metadata from different sources like Amazon Redshift, the AWS Glue Data Catalog, Snowflake, and many more.
Overview of solution
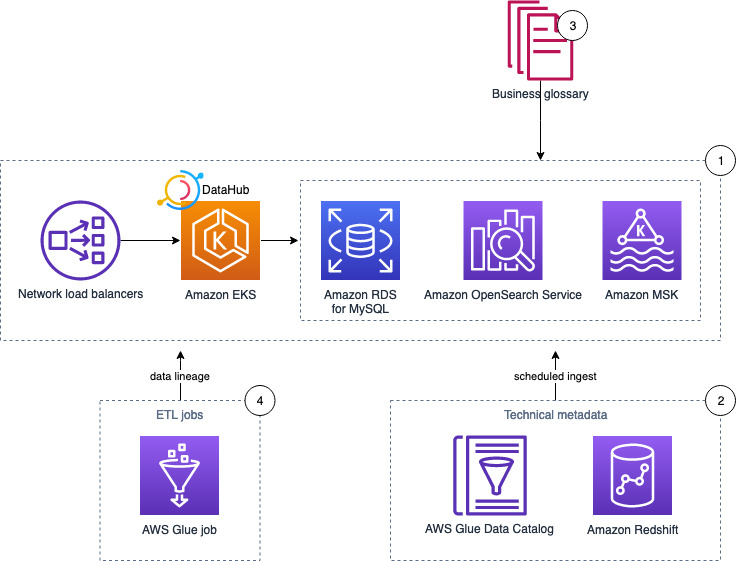
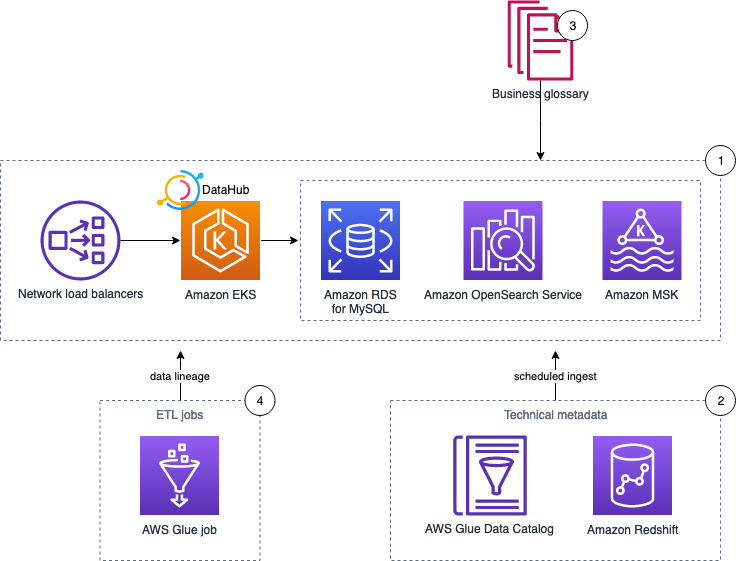
The following diagram illustrates the solution architecture and its components:
The solution pulls technical metadata from AWS Glue and Amazon Redshift to DataHub.
We enrich the technical metadata with a business glossary.
Finally, we run an AWS Glue job to transform the data and observe the data lineage in DataHub.
In the following sections, we demonstrate how to deploy DataHub and provision different AWS managed services.
Prerequisites
We need kubectl, Helm, and the AWS Command Line Interface (AWS CLI) to set up DataHub in an AWS environment. We can complete all the steps either from a local desktop or using AWS Cloud9. If you’re using AWS Cloud9, follow the instructions in the next section to spin up an AWS Cloud9 environment, otherwise skip to the next step.
Set up AWS Cloud9
To get started, you need an AWS account, preferably free from any production workloads. AWS Cloud9 is a cloud-based IDE that lets you write, run, and debug your code with just a browser. AWS Cloud9 comes preconfigured with many of the dependencies we require for this post, such as git, npm, and the AWS CDK.
Create an AWS Cloud9 environment from the AWS Management Console with an instance type of t3.small or larger. Provide the required name, and leave the remaining default values. After your environment is created, you should have access to a terminal window.
To install kubectl in AWS Cloud9, use the following instructions. AWS Cloud9 normally manages AWS Identity and Access Management (IAM) credentials dynamically. This isn’t currently compatible with Amazon EKS IAM authentication, so we disable it and rely on the IAM role instead.
After installation, make sure aws --version is pointing to version 2, or close the terminal and create a new terminal session.
Create a service-linked role
OpenSearch Service uses IAM service-linked roles. A service-linked role is a unique type of IAM role that is linked directly to OpenSearch Service. Service-linked roles are predefined by OpenSearch Service and include all the permissions that the service requires to call other AWS services on your behalf. To create a service-linked role for OpenSearch Service, issue the following command:
aws iam create-service-linked-role --aws-service-name es.amazonaws.com
Install the AWS CDK Toolkit v2
Install AWS CDK v2 with the following code:
npm install -g aws-cdk@latest
In case of any error, use the following code:
npm install -g aws-cdk@latest –force
Provision different AWS managed services
In this section, we walk through the steps to provision different AWS managed services.
Clone the GitHub repository
Clone the GitHub repo with the following code:
git clone https://github.com/aws-samples/deploy-datahub-using-aws-managed-services-ingest-metadata.git
cd deploy-datahub-using-aws-managed-services-ingest-metadata
Initialize the AWS CDK stack
To initialize the AWS CDK stack, change the ACCOUNT_ID and REGION values in the cdk.json file.
Then run the following code, providing your account ID and Region:
python3 -m venv .venv
source .venv/bin/activate
python3 -m pip install -r requirements.txt
# Execute the below command once per account, if you have never executed this before
cdk bootstrap aws://<account_id>/<aws_region>
# Synthesize CloudFormation
cdk synth
Deploy the AWS CDK stack
Deploy the AWS CDK stack with the following code:
# To keep confirmation prompts, remove --require-approval never
cdk deploy --all --require-approval never
Now that the deployment is complete, we need to assemble all the credentials and hostnames for different components.
Check AWS CloudFormation output
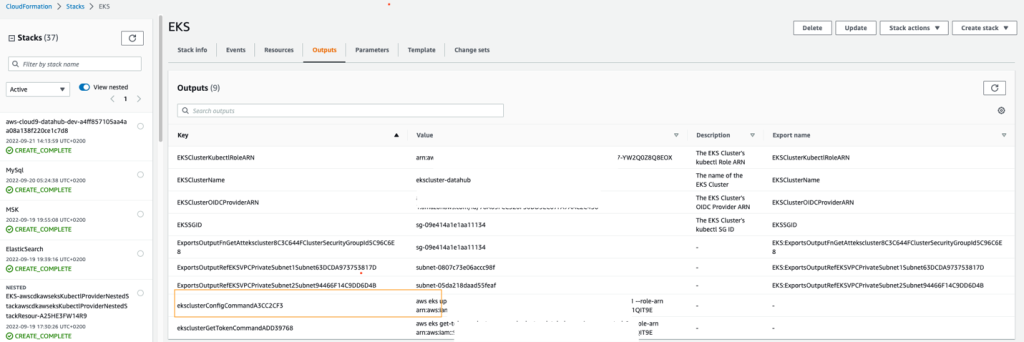
We created different AWS CloudFormation stacks when we ran the AWS CDK stack. We need the values from the stack outputs to use in the next steps.
On the AWS CloudFormation console, navigate to the EKS stack.
Get the following command on the Outputs tab(key:eksclusterConfigCommandXXX), and then run it:
Modify the following config files and replace the value of the MSK broker, MySQL hostname, and OpenSearch Service domain:
Edit the values for values.yaml (in the charts/datahub folder on GitHub):
kafka->bootstrap->server with kafka bootstrap server
kafka->zookeeper->server with zookeeper details
elasticserach->host with ES domain name
sql->datasource->host with MySQL host name
sql->datasource -> hostforMySqlClient with MySQL host name
sql->datasource -> url with MySQL host name
Edit the values for values.yaml (in charts/prerequisites folder on GitHub):
kafka->bootstrap->server with kafka bootstrap server
Now you can deploy the following two Helm charts to spin up the DataHub front end and backend components to the EKS cluster:
If you want to use a newer Helm chart, replace the following chart values from your existing values.yaml:
elasticsearchSetupJob
global : graph_service_impl
global : elasticsearch
global :kafka
global :sql
If the installation fails, debug with the following commands to check the status of the different pods:
#Confirm kubectl points to the EKS cluster:
kubectl config current-context
#Get Status of Pods
kubectl get pods
# If any service has error from above command, then execute below command for the error service.
kubectl logs -f <error-pod-name>
After you identify the issue from the log and fix it manually, set up DataHub with following Helm upgrade command:
After the DataHub setup is successful, run the following command to get DataHub’s front end URL that uses port 9002:
kubectl get svc
Access the DataHub URL in a browser with HTTP and use the default user name and password as datahub to log in to the URL http://<id>.<region>.elb.amazonaws.com:9002/.
Note that this isn’t recommended for production deployment. We strongly recommend changing the default user name and password or configuring single sign-on (SSO) via OpenID Connect. For more information, refer to Adding Users to DataHub. Additionally, expose the endpoint by setting up an ingress controller with a custom domain name. Follow the instructions in AWS setup guide to meet your networking requirements.
Clean up
The clean-up instructions are provided in the Part 2 of this series.
Conclusion
In this post, we demonstrated how to deploy DataHub using AWS managed services. Part 2 of this series will focus on search and discover of data assets stored in your data lake (via the AWS Glue Data Catalog) and data warehouse in Amazon Redshift.
About the Authors
Debadatta Mohapatra is an AWS Data Lab Architect. He has extensive experience across big data, data science, and IoT, across consulting and industrials. He is an advocate of cloud-native data platforms and the value they can drive for customers across industries.
Corvus Lee is a Solutions Architect for AWS Data Lab. He enjoys all kinds of data-related discussions, and helps customers build MVPs using AWS databases, analytics, and machine learning services.
Suraj Bang is a Sr Solutions Architect at AWS. Suraj helps AWS customers in this role on their Analytics, Database and Machine Learning use cases, architects a solution to solve their business problems and helps them build a scalable prototype.
This post is co-written with Dr. Quan Hoang Nguyen, CTO at Fantom Foundation.
Here at Fantom Foundation (Fantom), we have developed a high performance, highly scalable, and secure smart contract platform. It’s designed to overcome limitations of the previous generation of blockchain platforms. The Fantom platform is permissionless, decentralized, and open source. The majority of decentralized applications (dApps) hosted on the Fantom platform lack an analytics page that provides information to the users. Therefore, we would like to build a data platform that supports a web interface that will be made public. This will allow users to search for a smart contract address. The application then displays key metrics for that smart contract. Such an analytics platform can give insights and trends for applications deployed on the platform to the users, while the developers can continue to focus on improving their dApps.
AWS Data Lab offers accelerated, joint-engineering engagements between customers and AWS technical resources to create tangible deliverables that accelerate data and analytics modernization initiatives. Data Lab has three offerings: the Build Lab, the Design Lab, and a Resident Architect. The Build Lab is a 2–5 day intensive build with a technical customer team. The Design Lab is a half-day to 2-day engagement for customers who need a real-world architecture recommendation based on AWS expertise, but aren’t yet ready to build. Both engagements are hosted either online or at an in-person AWS Data Lab hub. The Resident Architect provides AWS customers with technical and strategic guidance in refining, implementing, and accelerating their data strategy and solutions over a 6-month engagement.
In this post, we share the experience of our engagement with AWS Data Lab to accelerate the initiative of developing a data pipeline from an idea to a solution. Over 4 weeks, we conducted technical design sessions, reviewed architecture options, and built the proof of concept data pipeline.
Use case review
The process started with us engaging with our AWS Account team to submit a nomination for the data lab. This followed by a call with the AWS Data Lab team to assess the suitability of requirements against the program. After the Build Lab was scheduled, an AWS Data Lab Architect engaged with us to conduct a series of pre-lab calls to finalize the scope, architecture, goals, and success criteria for the lab. The scope was to design a data pipeline that would ingest and store historical and real-time on-chain transactions data, and build a data pipeline to generate key metrics. Once ingested, data should be transformed, stored, and exposed via REST-based APIs and consumed by a web UI to display key metrics. For this Build Lab, we choose to ingest data for Spooky, which is a decentralized exchange (DEX) deployed on the Fantom platform and had the largest Total Value Locked (TVL) at that time. Key metrics such number of wallets that have interacted with the dApp over time, number of tokens and their value exchanged for the dApp over time, and number of transactions for the dApp over time were selected to visualize through a web-based UI.
We explored several architecture options and picked one for the lab that aligned closely with our end goal. The total historical data for the selected smart contract was approximately 1 GB since deployment of dApp on the Fantom platform. We used FTMScan, which allows us to explore and search on the Fantom platform for transactions, to estimate the rate of transfer transactions to be approximately three to four per minute. This allowed us to design an architecture for the lab that can handle this data ingestion rate. We agreed to use an existing application known as the data producer that was developed internally by the Fantom team to ingest on-chain transactions in real time. On checking transactions’ payload size, it was found to not exceed 100 kb for each transaction, which gave us the measure of number of files that will be created once ingested through the data producer application. A decision was made to ingest the past 45 days of historic transactions to populate the platform with enough data to visualize key metrics. Because the feature of backdating exists within the data producer application, we agreed to use that. The Data Lab Architect also advised us to consider using AWS Database Migration Service (AWS DMS) to ingest historic transactions data post lab. As a last step, we decided to build a React-based webpage with Material-UI that allows users to enter a smart contract address and choose the time interval, and the app fetches the necessary data to show the metrics value.
Solution overview
We collectively agreed to incorporate the following design principles for the data lab architecture:
Simplified data pipelines
Decentralized data architecture
Minimize latency as much as possible
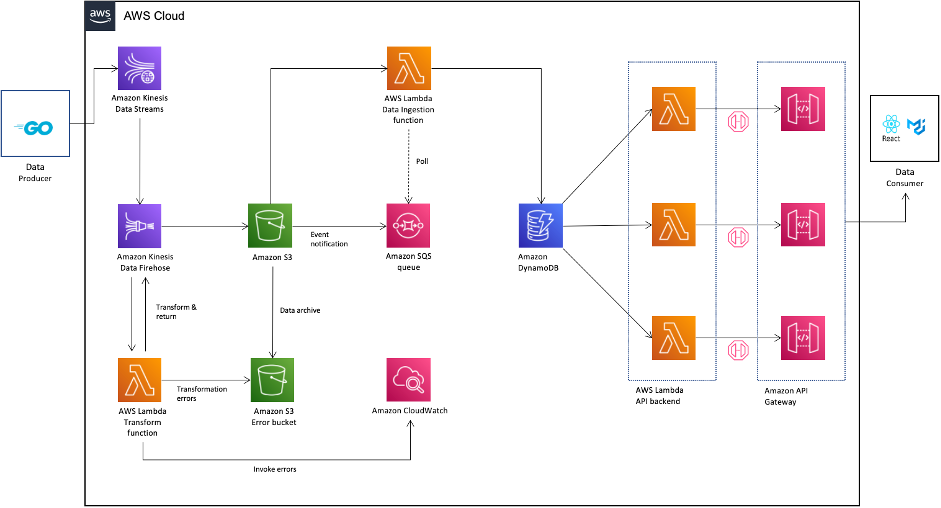
The following diagram illustrates the architecture that we built in the lab.
We collectively defined the following success criteria for the Build Lab:
End-to-end data streaming pipeline to ingest on-chain transactions
Historical data ingestion of the selected smart contract
Data storage and processing of on-chain transactions
REST-based APIs to provide time-based metrics for the three defined use cases
A sample web UI to display aggregated metrics for the smart contract
Prior to the Build Lab
As a prerequisite for the lab, we configured the data producer application to use the AWS Software Development Kit (AWS SDK) and PUTRecords API operation to send transactions data to an Amazon Simple Storage Service (Amazon S3) bucket. For the Build Lab, we built additional logic within the application to ingest historic transactions data together with real-time transactions data. As a last step, we verified that transactions data was captured and ingested into a test S3 bucket.
AWS services used in the lab
We used the following AWS services as part of the lab:
AWS Identity and Access Management (IAM) – We created multiple IAM roles with appropriate trust relationships and necessary permissions that can be used by multiple services to read and write on-chain transactions data and generated logs.
Amazon S3 – We created an S3 bucket to store the incoming transactions data as JSON-based files. We created a separate S3 bucket to store incoming transaction data that failed to be transformed and will be reprocessed later.
Amazon Kinesis Data Streams – We created a new Kinesis data stream in on-demand mode, which automatically scales based on data ingestion patterns and provides hands-free capacity management. This stream was used by the data producer application to ingest historical and real-time on-chain transactions. We discussed having the ability to manage and predict cost, and therefore were advised to use the provisioned mode when reliable estimates were available for throughput requirements. We were also advised to continue to use on-demand mode until the data traffic patterns were unpredictable.
Amazon Kinesis Data Firehose – We created a Firehose delivery stream to transform the incoming data and writes it to the S3 bucket. To minimize latency, we set the delivery stream buffer size to 1 MiB and buffer interval to 60 seconds. This would ensure a file is written to the S3 bucket when either of the two conditions are satisfied regardless of the order. Transactions data written to the S3 bucket was in JSON Lines format.
Amazon Simple Queue Service (Amazon SQS) – We set up an SQS queue of the type Standard and an access policy for that SQS queue to allow incoming messages generated from S3 bucket event notifications.
Amazon DynamoDB – In order to pick a data store for on-chain transactions, we needed a service that can store transactions payload of unstructured data with varying schemas, provides the ability to cache query results, and is a managed service. We picked DynamoDB for those reasons. We created a single DynamoDB table that holds the incoming transactions data. After analyzing the access query patterns, we decided to use the address field of the smart contract as the partition key and the timestamp field as the sort key. The table was created with auto scaling of read and write capacity modes because the actual usage requirements would be hard to predict at that time.
A Python-based Lambda function to perform transformations on the incoming data from the data producer application to flatten the JSON structure, convert the Unix-based epoch timestamp to a date/time value, and convert hex-based string values to a decimal value representing the number of tokens.
A second Lambda function to parse incoming SQS queue messages. This message contained values for bucket_name and object_key, which holds the reference to a newly created object within the S3 bucket. The Lambda function logic included parsing of this value to obtain the reference to the S3 object, get the contents of the object, read it into a data frame object using the AWS SDK for pandas (awswrangler) library, convert it into a Pandas data frame object, and use the put_df API call to write a Pandas data frame object as an item into a DynamoDB table. We choose to use Pandas due to familiarity with the library and functions required to perform data transform operations.
Three separate Lambda functions that contains the logic to query the DynamoDB table and retrieve items to aggregate and calculate metrics values. This calculated metrics value within the Lambda function was formatted as an HTTP response to expose as REST-based APIs.
Amazon API Gateway – We created a REST based API endpoint that uses Lambda proxy integration to pass a smart contract address and time-based interval in minutes as a query string parameter to the backend Lambda function. The response from the Lambda function was a metrics value. We also enabled cross-origin resource sharing (CORS) support within API Gateway to successfully query from the web UI that resides in a different domain.
Amazon CloudWatch – We used a Lambda function in-built mechanism to send function metrics to CloudWatch. Lambda functions come with a CloudWatch Logs log group and a log stream for each instance of your function. The Lambda runtime environment sends details of each invocation to the log stream, and relays logs and other output from your function’s code.
Iterative development approach
Across 4 days of the Build Lab, we undertook iterative development. We started by developing the foundational layer and iteratively added extra features through testing and data validation. This allowed us to develop confidence of the solution being built as we tested the output of the metrics through a web-based UI and verified with the actual data. As errors got discovered, we deleted the entire dataset and reran all the jobs to verify results and resolve those errors.
Lab outcomes
In 4 days, we built an end-to-end streaming pipeline ingesting 45 days of historical data and real-time on-chain transactions data for the selected Spooky smart contract. We also developed three REST-based APIs for the selected metrics and a sample web UI that allows users to insert a smart contract address, choose a time frequency, and visualize the metrics values. In a follow-up call, our AWS Data Lab Architect shared post-lab guidance around the next steps required to productionize the solution:
Scaling of the proof of concept to handle larger data volumes
Security best practices to protect the data while at rest and in transit
Best practices for data modeling and storage
Building an automated resilience technique to handle failed processing of the transactions data
Incorporating high availability and disaster recovery solutions to handle incoming data requests, including adding of the caching layer
Conclusion
Through a short engagement and small team, we accelerated this project from an idea to a solution. This experience gave us the opportunity to explore AWS services and their analytical capabilities in-depth. As a next step, we will continue to take advantage of AWS teams to enhance the solution built during this lab to make it ready for the production deployment.
Dr. Quan Hoang Nguyen is currently a CTO at Fantom Foundation. His interests include DLT, blockchain technologies, visual analytics, compiler optimization, and transactional memory. He has experience in R&D at the University of Sydney, IBM, Capital Markets CRC, Smarts – NASDAQ, and National ICT Australia (NICTA).
Ankit Patira is a Data Lab Architect at AWS based in Melbourne, Australia.
This whitepaper is intended for customers that are looking to store and process controlled goods information in the AWS Cloud, and is particularly useful for leadership, security, risk, and compliance teams that need to understand CGP requirements and guidance.
The whitepaper summarizes CGP requirements and guidance related to the protection of controlled goods information, and gives CGP-regulated customers information they can use to commence their due diligence and assess how to implement the appropriate programs for their use of AWS Cloud services.
This document is our first that is specific to Canadian regulatory requirements and joins other guides related to specific regulatory regimes around the world. As the regulatory environment continues to evolve, we’ll provide further updates on the AWS Security Blog and the AWS Compliance page. You can find more information on cloud-related regulatory compliance at the AWS Compliance Center. You can also reach out to your AWS account manager for help finding the resources you need.
If you have feedback about this blog post, submit comments in the Comments section below. You can also start a new thread on re:Post to get answers from the community.
Want more AWS Security news? Follow us on Twitter.
AWS Glue includes crawlers, a capability that make discovering datasets simpler by scanning data in Amazon Simple Storage Service (Amazon S3) and relational databases, extracting their schema, and automatically populating the AWS Glue Data Catalog, which keeps the metadata current. This reduces the time to insight by making newly ingested data quickly available for analysis with your preferred analytics and machine learning (ML) tools.
Previously, you could reduce crawler cost by using Amazon S3 Event Notifications to incrementally crawl changes on Data Catalog tables created by crawler. Today, we’re extending this support to crawling and updating Data Catalog tables that are created by non-crawler methods, such as using data pipelines. This crawler feature can be useful for several use cases, such as following:
You currently have a data pipeline to create AWS Glue Data Catalog tables and want to offload detection of partition information from the data pipeline to a scheduled crawler
You have an S3 bucket with event notifications enabled and want to continuously catalog new changes and prevent creation of new tables in case of ill-formatted files that break the partition detection
You have manually created Data Catalog tables and want to run incremental crawls on new file additions instead of running full crawls due to long crawl times
To accomplish incremental crawling, you can configure Amazon S3 Event Notifications to be sent to an Amazon Simple Queue Service (Amazon SQS) queue. You can then use the SQS queue as a source to identify changes and can schedule or run an AWS Glue crawler with Data Catalog tables as a target. With each run of the crawler, the SQS queue is inspected for new events. If no new events are found, the crawler stops. If events are found in the queue, the crawler inspects their respective folders, processes through built-in classifiers (for CSV, JSON, AVRO, XML, and so on), and determines the changes. The crawler then updates the Data Catalog with new information, such as newly added or deleted partitions or columns. This feature reduces the cost and time to crawl large and frequently changing Amazon S3 data.
This post shows how to create an AWS Glue crawler that supports Amazon S3 event notification on existing Data Catalog tables using the new crawler UI and an AWS CloudFormation template.
Overview of solution
To demonstrate how the new AWS Glue crawler performs incremental updates, we use the Toronto parking tickets dataset—specifically data about parking tickets issued in the city of Toronto between 2019–2020. The goal is to create a manual dataset as well as its associated metadata tables in AWS Glue, followed by an event-based crawler that detects and implements changes to the manually created datasets and catalogs.
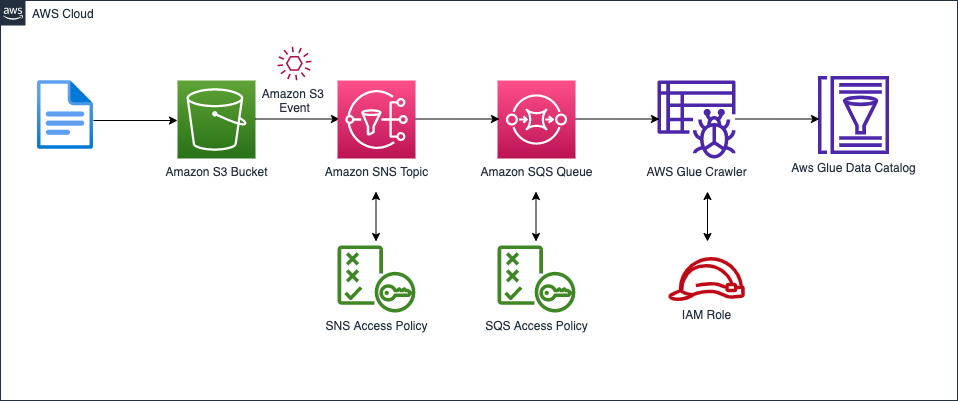
As mentioned before, instead of crawling all the subfolders on Amazon S3, we use an Amazon S3 event-based approach. This helps improve the crawl time by using Amazon S3 events to identify the changes between two crawls by listing all the files from the subfolder that triggered the event instead of listing the full Amazon S3 target. To accomplish this, we create an S3 bucket, an event-based crawler, an Amazon Simple Storage Service (Amazon SNS) topic, and an SQS queue. The following diagram illustrates our solution architecture.
Prerequisites
For this walkthrough, you should have the following prerequisites:
If the AWS account you use to follow this post uses Lake Formation to manage permissions on the AWS Glue Data Catalog, make sure that you log in as a user with access to create databases and tables. For more information, refer to Implicit Lake Formation permissions.
Launch your CloudFormation stack
To create your resources for this use case, complete the following steps:
Launch your CloudFormation stack in us-east-1:
For Stack name, enter a name for your stack .
For paramBucketName, enter a name for your S3 bucket (with your account number).
Choose Next.
Select I acknowledge that AWS CloudFormation might create IAM resources with custom names.
Choose Create stack.
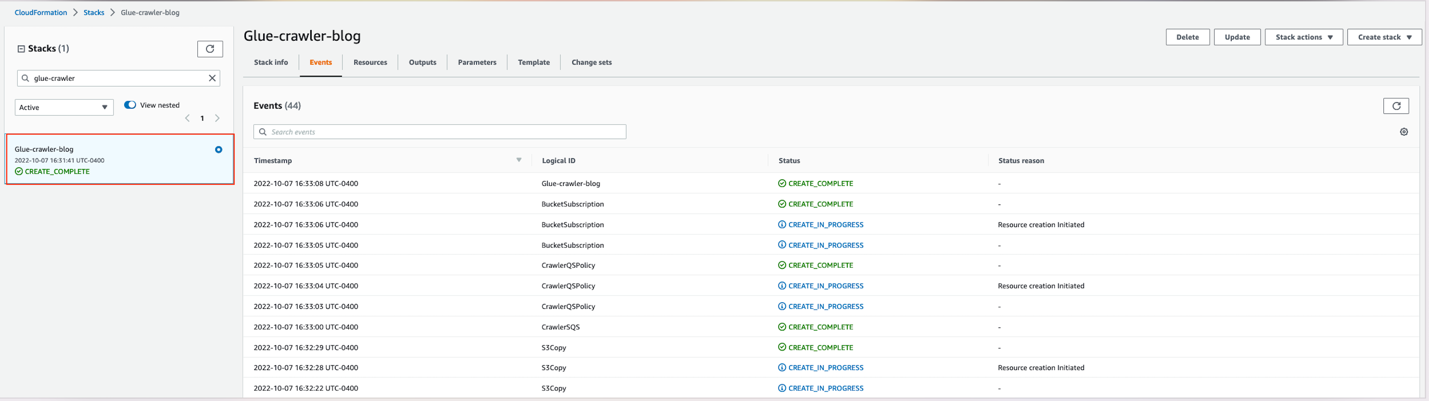
Wait for the stack formation to finish provisioning the requisite resources. When you see the CREATE_COMPLETE status, you can proceed to the next steps.
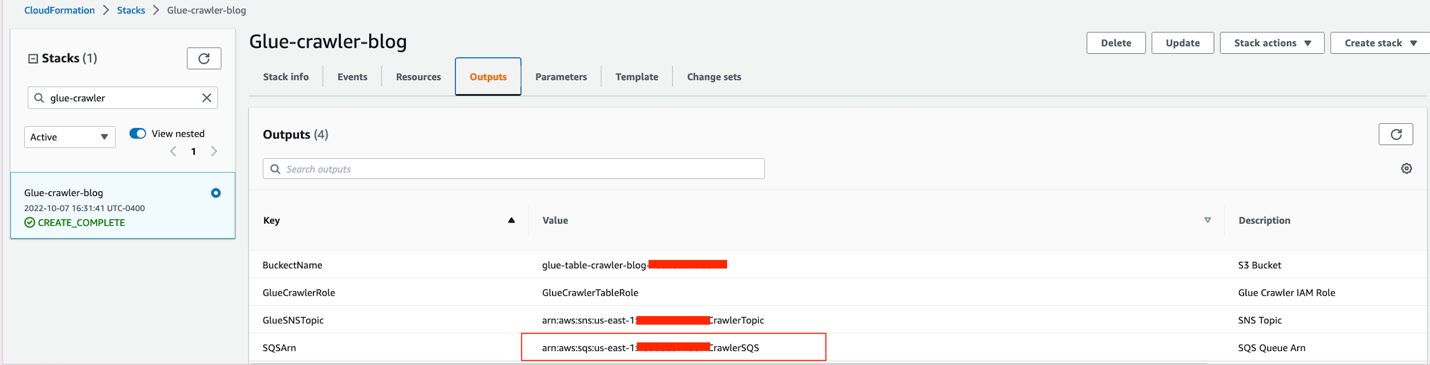
Additionally, note down the ARN of the SQS queue to use at a later point.
Query your Data Catalog
Next, we use Amazon Athena to confirm that the manual tables have been created in the Data Catalog, as part of the CloudFormation template.
On the Athena console, choose Launch query editor.
For Data source, choose AwsDataCatalog.
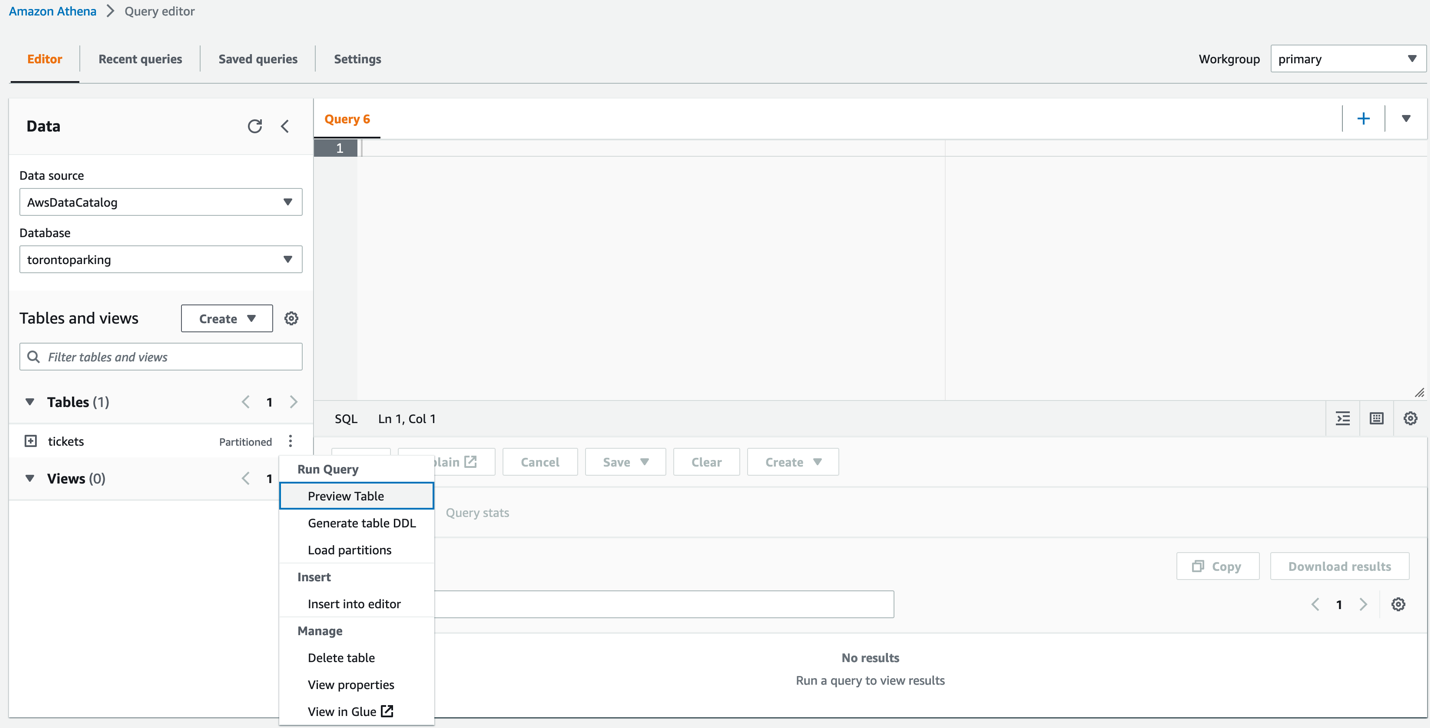
For Database, choose torontoparking. The tickets table should appear in the Tables section. Now you can query the table to see its contents.
You can write your own query, or choose Preview Table on the options menu. This writes a simple SQL query to show us the first 10 rows.
Choose Run to run the query.
As we can see in the query results, the database and table for 2019 parking ticket data have been created and partitioned.
Create the Amazon S3 event crawler
The next step is to create the crawler that detects and crawls only on incrementally updated tables.
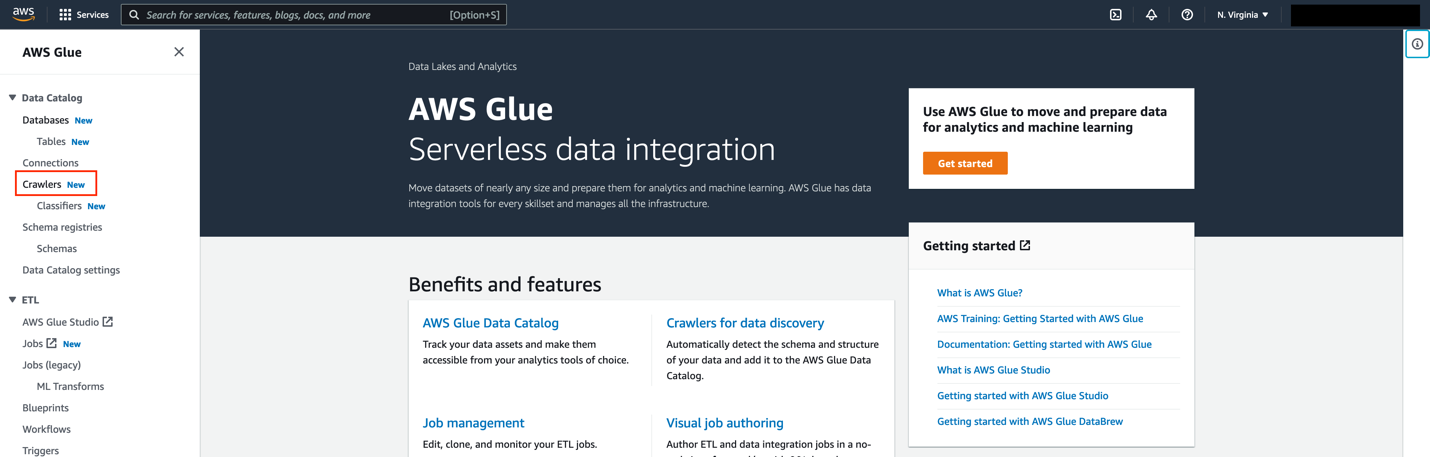
On the AWS Glue console, choose Crawlers in the navigation pane.
Choose Create crawler.
For Name, enter a name.
Choose Next. Now we need to select the data source for the crawler.
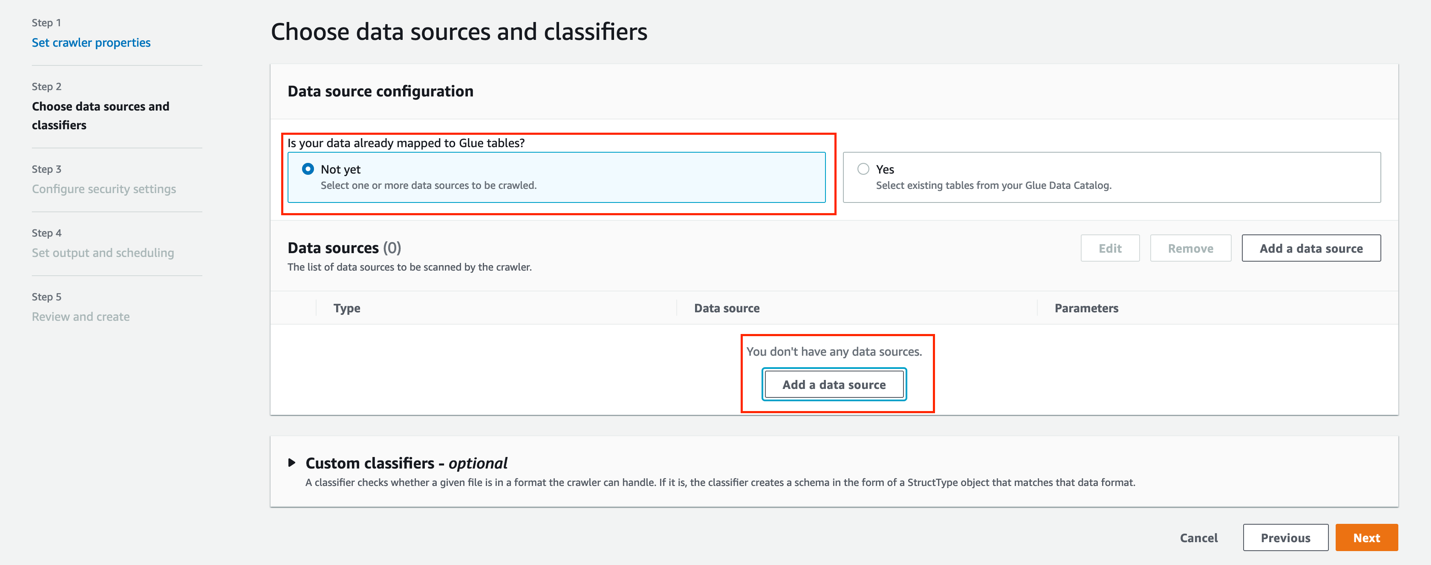
Select Yes to indicate that our data is already mapped to our AWS Glue Data Catalog.
Choose Add tables.
For Database, choose torontoparking and for Tables, choose tickets.
Select Crawl based on events.
For Include SQS ARN, enter the ARN you saved from the CloudFormation stack outputs.
Choose Confirm. You should now see the table populated under Glue tables, with the parameter set as Recrawl by event.
Choose Next.
For Existing IAM role, choose the IAM role created by the CloudFormation template (GlueCrawlerTableRole).
Choose Next.
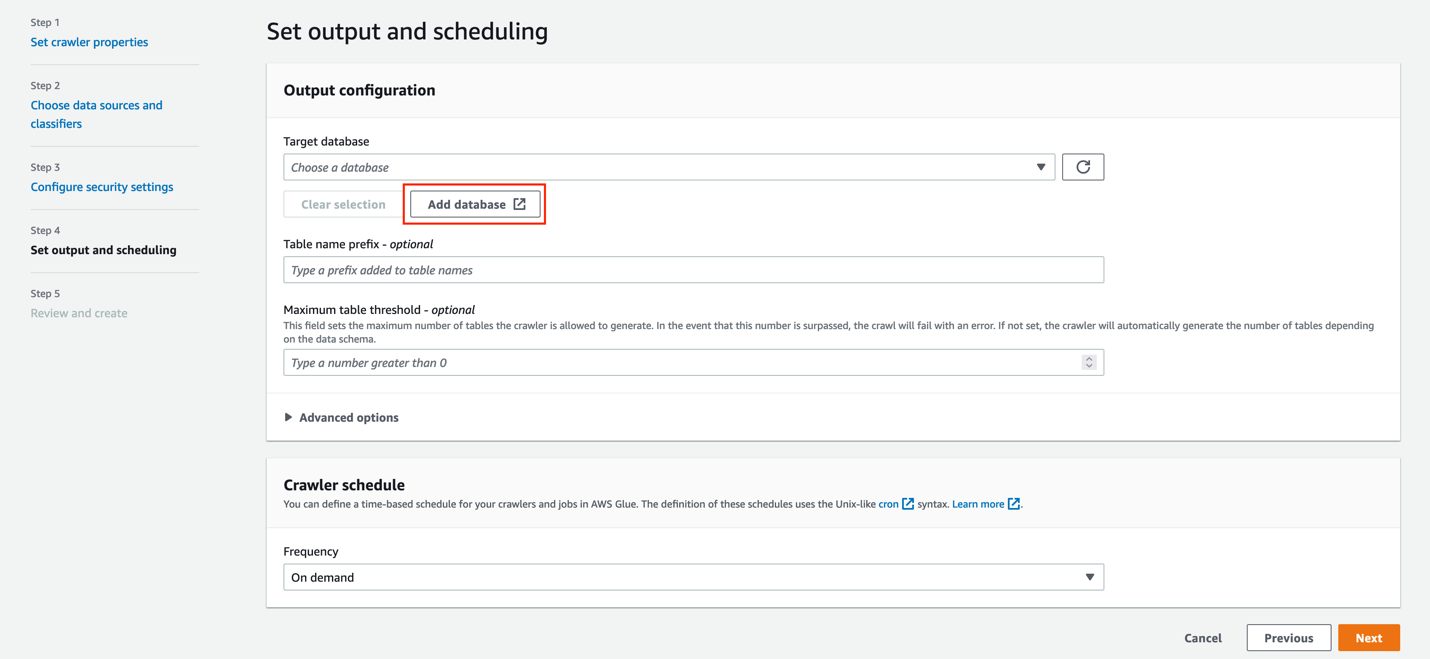
For Frequency, choose On demand. You also have the option of choosing a schedule on which the crawler will run regularly.
Choose Next.
Review the configurations and choose Create crawler. Now that the crawler has been created, we add the 2020 ticketing data to our S3 bucket so that we can test our new crawler. For this step, we use the AWS Command Line Interface (AWS CLI)
After successful completion of this command, your S3 bucket should contain the 2020 ticketing data and your crawler is ready to run. The terminal should return the following:
copy: s3://aws-bigdata-blog/artifacts/gluenewcrawlerui2/source/year=2020/Parking_Tags_Data_2020.000.csv to s3://glue-table-crawler-blog-<YOURACCOUNTNUMBER>/year=2020/Parking_Tags_Data_2020.000.csvRun the crawler and verify the updates
Run the crawler and verify the updates
Now that the new folder has been created, we run the crawler to detect the changes in the table and partitions.
Navigate to your crawler on the AWS Glue console and choose Run crawler. After running the crawler, you should see that it added the 2020 data to the tickets table.
On the Athena console, we can ensure that the Data Catalog has been updated by adding a where year = 2020 filter to the query.
AWS CLI option
You can also create the crawler using the AWS CLI. For more information, refer to create-crawler.
Clean up
To avoid incurring future charges, and to clean up unused roles and policies, delete the resources you created: the CloudFormation stack, S3 bucket, AWS Glue crawler, AWS Glue database, and AWS Glue table.
Conclusion
You can use AWS Glue crawlers to discover datasets, extract schema information, and populate the AWS Glue Data Catalog. In this post, we provided a CloudFormation template to set up AWS Glue crawlers to use Amazon S3 event notifications on existing Data Catalog tables, which reduces the time and cost needed to incrementally process table data updates in the Data Catalog.
With this feature, incremental crawling can now be offloaded from data pipelines to the scheduled AWS Glue crawler, reducing cost. This alleviates the need for full crawls, thereby reducing crawl times and Data Processing Units (DPUs) required to run the crawler. This is especially useful for customers that have S3 buckets with event notifications enabled and want to continuously catalog new changes.
Special thanks to everyone who contributed to this crawler feature launch: Theo Xu, Jessica Cheng, Arvin Mohanty, and Joseph Barlan.
About the authors
Leonardo Gómez is a Senior Analytics Specialist Solutions Architect at AWS. Based in Toronto, Canada, he has over a decade of experience in data management, helping customers around the globe address their business and technical needs.
Aayzed Tanweer is a Solutions Architect working with startup customers in the FinTech space, with a special focus on analytics services. Originally hailing from Toronto, he recently moved to New York City, where he enjoys eating his way through the city and exploring its many peculiar nooks and crannies.
Sandeep Adwankar is a Senior Technical Product Manager at AWS. Based in the California Bay Area, he works with customers around the globe to translate business and technical requirements into products that enable customers to improve how they manage, secure, and access data.
This guest post was authored by Sapan Jain, DevOps Engineer at Slice, and edited by Sobhan Archakam and Adnan Bilwani, at AWS.
Slice empowers over 18,000 independent pizzerias with the modern tools that have grown the major restaurant chains. By uniting these small businesses with specialized technology, marketing, data insights, and shared services, Slice enables them to serve their digitally-minded customers and move away from third-party apps. Using Amazon DevOps Guru, Slice is able to fine-tune their operations to better support these customers.
Serial tech entrepreneur Ilir Sela started Slice to modernize and support his family’s New York City pizzerias. Today, the company partners with restaurants in 3,000 cities and all 50 states, forming the nation’s largest pizza network. For more information, visit slicelife.com.
Slice’s challenge
At Slice, we manage a wide variety of systems, services, and platforms, all with varying levels of complexity. Observability, monitoring, and log aggregation are things we excel at, and they’re always critical for our platform engineering team. However, deriving insights from this data still requires some manual investigation, particularly when dealing with operational anomalies and/or misconfigurations.
To gain automated insights into our services and resources, Slice conducted a proof-of-concept utilizing Amazon DevOps Guru to analyze a small selection of AWS resources. Amazon DevOps Guru identified potential issues in our environment, resulting in actionable insights (ultimately leading to remediation). As a result of this analysis, we enabled Amazon DevOps Guru account-wide, thereby leading to numerous insights into our production environment.
Insights with Amazon DevOps Guru
After we configured Amazon DevOps Guru to begin its account-wide analysis, we left the tool alone to begin the process of collecting and analyzing data. We immediately began seeing some actionable insights for various production AWS resources, some of which are highlighted in the following section:
Amazon DynamoDB Point-in-time recovery
Amazon DynamoDB offers a point-in-time recovery (PITR) feature that provides continuous backups of your DynamoDB data for 35 days to help you protect against accidental write or deletes. If enabled, this lets you restore your respective table to a previous state. Amazon DevOps Guru identified several tables in our environment that had PITR disabled, along with a corresponding Recommendation.
Figure 1. The graphic shows proactive insights for the last 1 month. The one insight shown is ‘Dynamo Table Point in Time Recovery not enabled’ with a status of OnGoing and a severity of low.
Elasticache anomalous evictions
Amazon Elasticache for Redis is used by a handful of our services to cache any relevant application data. Amazon DevOps Guru identified that one of our instances was exhibiting anomalous behavior regarding its cache eviction rate. Essentially, due to the memory pressure of the instance, the eviction rate of cache entries began to increase. DevOps Guru recommended revisiting the sizing of this instance and scaling it vertically or horizontally, where appropriate.
Figure 2. The graph shows the metric: count of ElastiCache evictions plotted for the time period Jul 3, 20:35 to Jul 3, 21:35 UTC. A highlighted section shows that the evictions increased to a peak of 2500 between 21:00 and 21:08. Outside of this interval the evictions are below 500
AWS Lambda anomalous errors
We manage a few AWS Lambda functions that all serve different purposes. During the beginning of normal work day, we began to see increased error rates for a particular function resulting in an exception being thrown. DevOps Guru was able to detect the increase in error rates and flag them as anomalous. Although retries in this case wouldn’t have solved the problem, it did increase our visibility into the issue (which was also corroborated by our APM platform).
Figure 3. The graph shows the metric: count of AWS/Lambda errors plotted between 11:00 and 13:30 on Jul 6. The sections between the times 11:23 and 12:15 UTC are highlighted to show the anomalies
Conclusion
Amazon DevOps Guru integrated into our environment quickly, with no more additional configuration or setup aside from a few button clicks to enable the service. After reviewing several of the proactive insights that DevOps Guru provided, we could formulate plans of action regarding remediation. One specific case example of this is where DevOps Guru flagged several of our Lambda functions for not containing enough subnets. After triaging the finding, we discovered that we were lacking multi-AZ redundancy for several of those functions. As a result, we could implement a change that maximized our availability of those resources.
With the continuous analysis that DevOps Guru performs, we continue to gain new insights into the resources that we utilize and deploy in our environment. This lets us improve operationally while simultaneously maintaining production stability.
In modern data architectures, it’s common to store data in multiple data sources. However, organizations embracing this approach still need insights from their data and require technologies that help them break down data silos. Amazon Athena is an interactive query service that makes it easy to analyze structured, unstructured, and semi-structured data stored in Amazon Simple Storage Service (Amazon S3) in addition to relational, non-relation, object, and custom data sources through its query federation capabilities. Athena is serverless, so there’s no infrastructure to manage, and you only pay for the queries that you run.
Organizations building a modern data architecture want to query data in-place from purpose-built data stores without building complex extract, transform, and load (ETL) pipelines. Athena’s federated query feature allows organizations to achieve this and makes it easy to:
Create reports and dashboards from data stored in relational, non-relational, object, and custom data sources
Run on-demand analysis on data spread across multiple systems of record using a single tool and single SQL dialect
Join multiple data sources together to produce new input features for machine learning model training workflows
However, when querying and joining huge amounts of data from different data stores, it’s important for queries to run quickly, at low cost, and without impacting source systems. Predicate pushdown is supported by many query engines and is a technique that can drastically reduce query processing time by filtering data at the source early in the processing workflow. In this post, you’ll learn how predicate pushdown improves query performance and how you can validate when Athena applies predicate pushdown to federated queries.
Benefits of predicate pushdown
The key benefits of predicate pushdown are as follows:
Improved query runtime
Reduced network traffic between Athena and the data source
Reduced load on the remote data source
Reduced cost resulting from reduced data scans
Let’s explore a real-world scenario to understand when predicate pushdown is applied to federated queries in Athena.
Solution overview
Imagine a hypothetical ecommerce company with data stored in
Amazon Redshift – Company’s Datawarehouse, used for current and historical analytics
Amazon DynamoDB – NoSQL Database, used for real-time inventory tracking and latest supplier data in the company
Record counts for these tables are as follows.
Data Store
Table Name
Number of Records
Description
Amazon Redshift
Catalog_Sales
4.3 billion
Current and historical Sales data fact Table
Amazon Redshift
Date_dim
73,000
Date Dimension table
DynamoDB
Part
20,000
Realtime Parts and Inventory data
DynamoDB
Partsupp
80,000
Realtime Parts and supplier data
Aurora MySQL
Supplier
1,000
Latest Supplier transactions
Aurora MySQL
Customer
15,000
Latest Customer transactions
Our requirement is to query these sources individually and join the data to track pricing and supplier information and compare recent data with historical data using SQL queries with various filters applied. We’ll use Athena federated queries to query and join data from these sources to meet this requirement.
The following diagram depicts how Athena federated queries use data source connectors run as Lambda functions to query data stored in sources other than Amazon S3.
When a federated query is submitted against a data source, Athena invokes the data source connector to determine how to read the requested table and identify filter predicates in the WHERE clause of the query that can be pushed down to the source. Applicable filters are automatically pushed down by Athena and have the effect of omitting unnecessary rows early in the query processing workflow and improving overall query execution time.
Let’s explore three use cases to demonstrate predicate pushdown for our ecommerce company using each of these services.
Prerequisites
As a prerequisite, review Using Amazon Athena Federated Query to know more about Athena federated queries and how to deploy these data source connectors.
Use case 1: Amazon Redshift
In our first scenario, we run an Athena federated query on Amazon Redshift by joining its Catalog_sales and Date_dim tables. We do this to show the number of sales orders grouped by order date. The following query gets the information required and takes approximately 14 seconds scanning approximately 43 MB of data:
SELECT "d_date" AS Order_date,
count(1) AS Total_Orders
FROM "lambda:redshift"."order_schema"."catalog_sales" l,
"lambda:redshift"."order_schema"."date_dim" d
WHERE l.cs_sold_date_sk = d_date_sk
and cs_sold_date_sk between 2450815 and 2450822 --Date keys for first week of Jan 1998
GROUP BY "d_date"
order by "d_date"
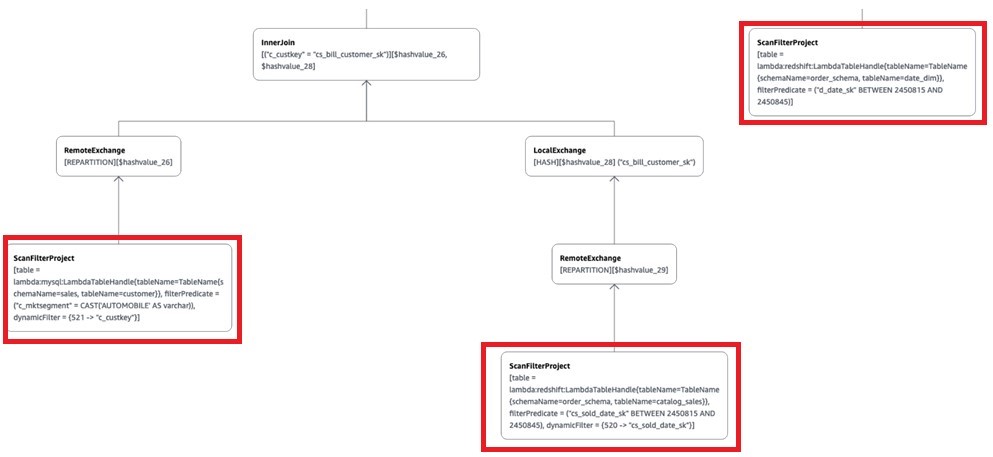
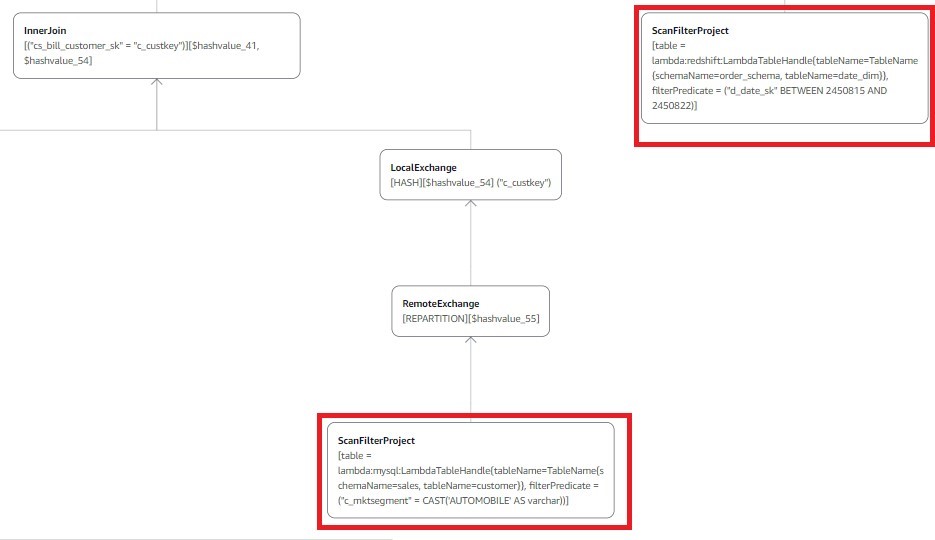
Athena pushes the following filters to the source for processing:
cs_sold_date_sk between 2450815 and 2450822 for the Catalog_Sales table in Amazon Redshift.
d_date_sk between 2450815 and 2450822; because of the join l.cs_sold_date_sk=d_date_sk in the query, the Date_dim table is also filtered at the source, and only filtered data is moved from Amazon Redshift to Athena.
Let’s analyze the query plan by using recently released visual explain tool to confirm the filter predicates are pushed to the data source:
As shown above (only displaying the relevant part of the visual explain plan), because of the predicate pushdown, the Catalog_sales and Date_dim tables have filters applied at the source. Athena processes only the resulting filtered data.
Using the Athena console, we can see query processing details using the recently released query stats to interactively explore processing details with predicate pushdown at the query stage:
Displaying only the relevant query processing stages, Catalog_sales table has approximately 4.3 billion records, and Date_dim has approximately 73,000 records in Amazon Redshift. Only 11 million records from the Catalog_sales (Stage 4) and 8 records from the Date_dim (Stage 5) are passed from source to Athena, because the predicate pushdown pushes query filter conditions to the data sources. This filters out unneeded records at the source, and only brings the required rows to Athena.
Using predicate pushdown resulted in scanning 99.75% less data from Catalog_sales and 99.99% less data from Date_dim. This results in a faster query runtime and lower cost.
Use case 2: Amazon Redshift and Aurora MySQL
In our second use case, we run an Athena federated query on Aurora MySQL and Amazon Redshift data stores. This query joins the Catalog_sales and Date_dim tables in Amazon Redshift with the Customer table in the Aurora MySQL database to get the total number of orders with the total amount spent by each customer for the first week in January 1998 for the market segment of AUTOMOBILE. The following query gets the information required and takes approximately 35 seconds scanning approximately 337 MB of data:
SELECT cs_bill_customer_sk Customer_id ,"d_date" Order_Date
,count("cs_order_number") Total_Orders ,sum(l.cs_net_paid_inc_ship_tax) AS Total_Amount
FROM "lambda:mysql".sales.customer c,"lambda:redshift"."order_schema"."catalog_sales" l
,"lambda:redshift"."order_schema"."date_dim" d
WHERE c_mktsegment = 'AUTOMOBILE'
AND c_custkey = cs_bill_customer_sk
AND l.cs_sold_date_sk=d_date_sk
AND cs_sold_date_sk between 2450815 and 2450822 --Date keys for first week of Jan 1998
GROUP BY cs_bill_customer_sk,"d_date"
ORDER BY cs_bill_customer_sk,"d_date"
Athena pushes the following filters to the data sources for processing:
cs_sold_date_sk between 2450815 and 2450822 for the Catalog_Sales table in Amazon Redshift.
d_date_sk between 2450815 and 2450822; because of the join l.cs_sold_date_sk=d_date_sk in the query, the Date_dim table is also filtered at the source (Amazon Redshift) and only filtered data is moved from Amazon Redshift to Athena.
c_mktsegment = 'AUTOMOBILE' for the Customer table in the Aurora MySQL database.
Now let’s consult the visual explain plan for this query to show the predicate pushdown to the source for processing:
As shown above (only displaying the relevant part of the visual explain plan), because of the predicate pushdown, Catalog_sales and Date_dim have the query filter applied at the source (Amazon Redshift), and the customer table has the market segment AUTOMOBILE filter applied at the source (Aurora MySQL). This brings only the filtered data to Athena.
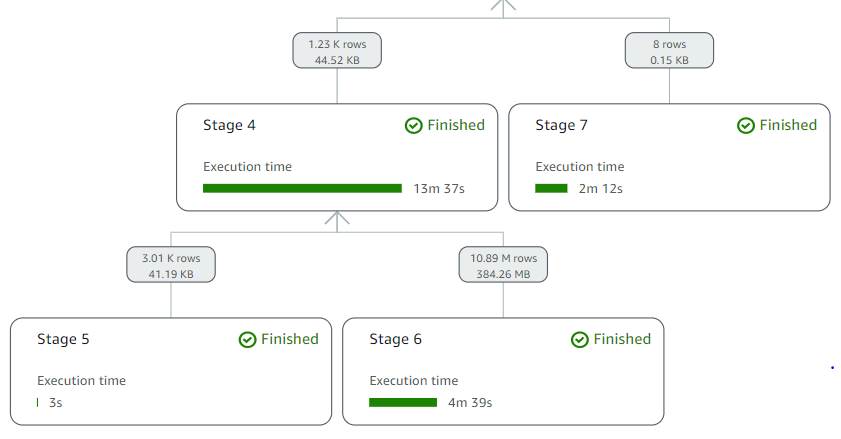
As before, we can see query processing details using the recently released query stats to interactively explore processing details with predicate pushdown at the query stage:
Displaying only the relevant query processing stages, Catalog_sales has 4.3 billion records, Date_Dim has 73,000 records in Amazon Redshift, and Customer has 15,000 records in Aurora MySQL. Only 11 million records from Catalog_sales (Stage 6), 8 records from Date_dim (Stage 7), and 3,000 records from Customer (Stage 5) are passed from the respective sources to Athena because the predicate pushdown pushes query filter conditions to the data sources. This filters out unneeded records at the source and only brings the required rows to Athena.
Here, predicate pushdown resulted in scanning 99.75% less data from Catalog_sales, 99.99% less data from Date_dim, and 79.91% from Customer. Furthermore, this results in a faster query runtime and reduced cost.
Use case 3: Amazon Redshift, Aurora MySQL, and DynamoDB
For our third use case, we run an Athena federated query on Aurora MySQL, Amazon Redshift, and DynamoDB data stores. This query joins the Part and Partsupp tables in DynamoDB, the Catalog_sales and Date_dim tables in Amazon Redshift, and the Supplier and Customer tables in Aurora MySQL to get the quantities available at each supplier for orders with the highest revenue during the first week of January 1998 for the market segment of AUTOMOBILE and parts manufactured by Manufacturer#1.
The following query gets the information required and takes approximately 33 seconds scanning approximately 428 MB of data in Athena:
SELECT "d_date" Order_Date
,c_mktsegment
,"cs_order_number"
,l.cs_item_sk Part_Key
,p.p_name Part_Name
,s.s_name Supplier_Name
,ps.ps_availqty Supplier_Avail_Qty
,l.cs_quantity Order_Qty
,l.cs_net_paid_inc_ship_tax Order_Total
FROM "lambda:dynamo".default.part p,
"lambda:mysql".sales.supplier s,
"lambda:redshift"."order_schema"."catalog_sales" l,
"lambda:dynamo".default.partsupp ps,
"lambda:mysql".sales.customer c,
"lambda:redshift"."order_schema"."date_dim" d
WHERE
c_custkey = cs_bill_customer_sk
AND l.cs_sold_date_sk=d_date_sk
AND c.c_mktsegment = 'AUTOMOBILE'
AND cs_sold_date_sk between 2450815 and 2450822 --Date keys for first week of Jan 1998
AND p.p_partkey=ps.ps_partkey
AND s.s_suppkey=ps.ps_suppkey
AND p.p_partkey=l.cs_item_sk
AND p.p_mfgr='Manufacturer#1'
Athena pushes the following filters to the data sources for processing:
cs_sold_date_sk between 2450815 and 2450822 for the Catalog_Sales table in Amazon Redshift.
d_date_sk between 2450815 and 2450822; because of the join l.cs_sold_date_sk=d_date_sk in the query, the Date_dim table is also filtered at the source and only filtered data is moved from Amazon Redshift to Athena.
c_mktsegment = 'AUTOMOBILE' for the Customer table in the Aurora MySQL database.
p.p_mfgr='Manufacturer#1' for the Part table in DynamoDB.
Now let’s run the explain plan for this query to confirm predicates are pushed down to the source for processing:
As shown above (displaying only the relevant part of the plan), because of the predicate pushdown, Catalog_sales and Date_dim have the query filter applied at the source (Amazon Redshift), the Customer table has the market segment AUTOMOBILE filter applied at the source (Aurora MySQL), and the Part table has the part manufactured by Manufacturer#1 filter applied at the source (DynamoDB).
We can analyze query processing details using the recently released query stats to interactively explore processing details with predicate pushdown at the query stage:
Displaying only the relevant processing stages, Catalog_sales has 4.3 billion records, Date_Dim has 73,000 records in Amazon Redshift, Customer has 15,000 records in Aurora MySQL, and Part has 20,000 records in DynamoDB. Only 11 million records from Catalog_sales (Stage 5), 8 records from Date_dim (Stage 9), 3,000 records from Customer (Stage 8), and 4,000 records from Part (Stage 4) are passed from their respective sources to Athena, because the predicate pushdown pushes query filter conditions to the data sources. This filters out unneeded records at the source, and only brings the required rows from the sources to Athena.
Considerations for predicate pushdown
When using Athena to query your data sources, consider the following:
Depending on the data source, data source connector, and query complexity, Athena can push filter predicates to the source for processing. The following are some of the sources Athena supports predicate pushdown with:
Athena also performs predicate pushdown on data stored in an S3 data lake. And, with predicate pushdown for supported sources, you can join all your data sources in one query and achieve fast query performance.
You can use the recently released query stats as well as EXPLAIN and EXPLAIN ANALYZE on your queries to confirm predicates are pushed down to the source.
Queries may not have predicates pushed to the source if the query’s WHERE clause uses Athena-specific functions (for example, WHERE log2(col)<10).
Conclusion
In this post, we demonstrated three federated query scenarios on Aurora MySQL, Amazon Redshift, and DynamoDB to show how predicate pushdown improves federated query performance and reduces cost and how you can validate when predicate pushdown occurs. If the federated data source supports parallel scans, then predicate pushdown makes it possible to achieve performance that is close to the performance of Athena queries on data stored in Amazon S3. You can utilize the patterns and recommendations outlined in this post when querying supported data sources to improve overall query performance and minimize data scanned.
About the authors
Rohit Bansal is an Analytics Specialist Solutions Architect at AWS. He has nearly two decades of experience helping customers modernize their data platforms. He is passionate about helping customers build scalable, cost-effective data and analytics solutions in the cloud. In his spare time, he enjoys spending time with his family, travel, and road cycling.
Ruchir Tripathi is a Senior Analytics Solutions Architect aligned to Global Financial Services at AWS. He is passionate about helping enterprises build scalable, performant, and cost-effective solutions in the cloud. Prior to joining AWS, Ruchir worked with major financial institutions and is based out of New York Office.
To build a data lake on AWS, a common data ingestion pattern is to use AWS Glue jobs to perform extract, transform, and load (ETL) data from relational databases to Amazon Simple Storage Service (Amazon S3). A project often involves extracting hundreds of tables from source databases to the data lake raw layer. And for each source table, it’s recommended to have a separate AWS Glue job to simplify operations, state management, and error handling. This approach works perfectly with a small number of tables. However, with hundreds of tables, this results in hundreds of ETL jobs, and managing AWS Glue jobs at this scale may pose an operational challenge if you’re not yet ready to deploy using a CI/CD pipeline. Instead, we tackle this issue by decoupling the following:
ETL job logic – We use an AWS Glue blueprint, which allows you to reuse one blueprint for all jobs with the same logic
Job definition – We use a JSON file, so you can define jobs programmatically without learning a new language
Job deployment – With AWS Step Functions, you can copy workflows to manage different data processing use cases on AWS Glue
In this post, you will learn how to handle data lake landing jobs deployment in a standardized way—by maintaining a JSON file with table names and a few parameters (for example, a workflow catalog). AWS Glue workflows are created and updated after manually running the resources deployment flow in Step Functions. You can further customize the AWS Glue blueprints to make your own multi-step data pipelines to move data to downstream layers and purpose-built analytics services (example use cases include partitioning or importing to an Amazon DynamoDB table).
Overview of solution
The following diagram illustrates the solution architecture, which contains two major areas:
Resource deployment (components 1–2) – An AWS Step Functions workflow is run manually on demand to update or deploy the required AWS Glue resources. These AWS Glue resources will be used for landing data into the data lake
ETL job runs (components 3–6) – The AWS Glue workflows (one per source table) run on the defined schedule, and extract and land data to the data lake raw layer
The solution workflow contains the following steps:
An S3 bucket stores an AWS Glue blueprint (ZIP) and the workflow catalog (JSON file).
A Step Functions workflow orchestrates the AWS Glue resources creation.
We use Amazon Aurora as the data source with our sample data, but any PostgreSQL database works with the provided script, or other JDBC sources with customization.
If you want to use your existing database either in AWS or on premises as a data source, you need network connectivity (a subnet and security group) for the AWS Glue jobs that can access the source database, Amazon S3, and Secrets Manager.
Provision resources with AWS CloudFormation
In this step, we provision our solution resources with AWS CloudFormation.
Database with sample data (optional)
This CloudFormation stack works only in AWS Regions where Amazon Aurora Serverless v1 is supported. Complete the following steps to create a database with sample data:
Choose Launch Stack.
On the Create stack page, choose Next.
For Stack name, enter demo-database.
For DBSecurityGroup, choose select the security group for the database (for example, default).
For DBSubnet, choose two or more private subnets to host the database.
For ETLAZ, choose the Availability Zone for ETL jobs. It must match with ETLSubnet.
For ETLSubnet, choose the subnet for the jobs. This must match with ETLAZ.
To find the subnet and corresponding Availability Zone, go to the Amazon Virtual Private Cloud (Amazon VPC) console and look at the columns Subnet ID and Availability Zone.
Choose Next.
On the Configure stack options page, skip the inputs and choose Next.
On the Review page, choose Create stack.
When the stack is complete, go to the Outputs tab and note the value for SecretsARN.
This CloudFormation stack creates the following resources:
In the Connect to database section, provide the following information:
For Database instance, enter demo-<123456789012>.
For Database username, connect with a Secrets Manager ARN.
For Secrets Manager ARN, enter the ARN from the outputs of the CloudFormation stack.
For Database name, enter hr.
Choose Connect to database.
Enter the contents of the SQL file into the editor, then choose Run.
Main stack (required)
This CloudFormation stack works in all AWS Regions.
Choose Launch Stack.
On the Create stack page, choose Next.
For Stack name, enter data-lake-landing.
For BlueprintName, enter a name for your blueprint (default: data-lake-landing).
For S3BucketNamePrefix, enter a prefix (default: data-lake-raw-layer).
Choose Next.
On the Configure stack options page, skip the inputs and choose Next.
On the Review page, select I acknowledge that AWS CloudFormation might create IAM resources with custom names.
Choose Create stack.
When the stack is complete, go to the Outputs tab and note the names of the S3 bucket (for example, data-lake-raw-layer-123456789012-region) and Step Functions workflow (for example, data-lake-landing).
The CloudFormation stack creates the following resources:
An S3 bucket as the data lake raw layer
A Step Functions workflow (see the definition on the GitHub repo)
AWS Identity and Access Management (IAM) roles and policies for the Step Functions workflow to provision AWS Glue resources and AWS Glue job executions.
The GlueExecutionRole is limited to the DemoDBSecret in Secrets Manager. If you need to connect to other databases which has a different endpoint/address or credentials, don’t forget to create new secrets and grant additional permissions to the IAM role or secrets so your AWS Glue jobs can authenticate with the source databases.
Prepare database connections
If you want to use this solution to perform ETL against your existing databases, follow this section. Otherwise, if you have deployed the CloudFormation stack for the database with sample data, jump to the section “Edit the workflow catalog”.
You need to have a running PostgreSQL database ready. To connect to other database engines, you need to customize this solution, particularly the jdbcUrl in the supplied PySpark script.
Create the database secret
To create your Secrets Manager secret, complete the following steps:
For the VPC, subnet, and security groups (prepared in the prerequisite steps), enter where the ETL jobs run and are able to connect to the source database, Amazon S3, and Secrets Manager.
Choose Create connection.
You’re now ready to configure the rest of the solution.
Edit the workflow catalog
To download the workflow catalog, complete the following steps:
If you are using the provided sample database, you must change the values of GlueExecutionRole and DestinationBucketName. If you are using your own databases, you must change all vaules except WorkflowName, JobScheduleType, and ScheduleCronPattern.
Rename the file your_blueprint_name.json and upload it to your S3 bucket (for example, s3://data-lake-raw-layer-123456789012-eu-west-1/data-lake-landing.json).
The example workflow has the JobScheduleType set to Cron. See Time-based schedules for jobs and crawlers for examples setting cron patterns. Alternatively set JobScheduleType to OnDemand.
Write the DataFrame to Amazon S3 as Parquet files.
Prepare the AWS Glue blueprint
Prepare your AWS Glue blueprint with the following steps:
Download the sample file and unzip it in your local computer.
Make any necessary changes to the PySpark script to include your own logic, and compress the three files (blueprint.cfg, jdbc_to_s3.py, layout.py; exclude any folders) as your_blueprint_name.zip (for example, data-lake-landing.zip):
zip data-lake-landing.zip blueprint.cfg jdbc_to_s3.py layout.py
Upload to the S3 bucket (for example, s3://data-lake-raw-layer-123456789012-region/data-lake-landing.zip).
Now you should have two files uploaded to your S3 bucket.
Run the Step Functions workflow to deploy AWS Glue resources
To run the Step Functions workflow, complete the following steps:
On the Step Functions console, select your state machine (data-lake-landing) and choose View details.
Choose Start execution.
Keep the default values in the pop-up.
Choose Start execution.
Wait until the Success step at the bottom turns green.
It’s normal to have some intermediate steps with the status “Caught error.”
When the workflow catalog contains a large number of ETL job entries, you can expect some delays. In our test environment, creating 100 jobs from a clean state can take around 22 minutes; the second run (deleting existing AWS Glue resources and creating 100 jobs) can take around 27 minutes.
Verify the workflow in AWS Glue
To check the workflow, complete the following steps:
Verify that all AWS Glue workflows defined in workflow_config.json are listed.
Select one of the workflows, and on the Action menu, choose Run.
Wait for about 3 minutes (or longer if not using the provided database with sample data), and verify on the Amazon S3 console that new Parquet files are created in your data lake (for example, s3://data-lake-raw-layer-123456789012-region/database/table/ingestion_date=yyyy-mm-dd/).
Step Functions workflow overview
This section describes the major steps in the Step Functions workflow.
Register the AWS Glue blueprint
A blueprint allows you to parameterize a workflow (defining jobs and crawlers), and subsequently generate multiple AWS Glue workflows reusing the same code logic to handle similar data ETL activities. The following diagram illustrates the AWS Glue blueprint registration part of the Step Functions workflow.
The step Glue: CreateBlueprint takes the ZIP archive in Amazon S3 (sample) and registers it for later use.
The step S3: ParseGlueWorkflowsConfig triggers the following Map state, and runs a set of steps for each element of an input array.
We set the maximum concurrency to five parallel iterations to lower the chance of exceeding the maximum allowed API request rate (per account per Region). For each ETL job definition, the Step Functions workflow cleans up relevant AWS Glue resources (if they exist), including the workflow, job, and trigger.
For more information on the Map state, refer to Map.
Run the AWS Glue blueprint
Within the Map state, the step Glue: CreateWorkflowFromBlueprint starts an asynchronous process to create the AWS Glue workflow (for each job definition), and the jobs and triggers that the workflow encapsulates.
In this solution, all AWS Glue workflows share the same logic, beginning with a trigger to handle the schedule, followed by a job to run the ETL logic.
As indicated by the step CreateWorkflowFailed, any AWS Glue blueprint creation failure stops the whole Step Functions workflow and marks it with a failed status. Note that no rollback will happen. Fix the errors and rerun the Step Functions workflow. This will not result in duplicated AWS Glue resources and existing ones will be cleaned up in the process.
Limitations
Note the following limitations of this solution:
Each run of the Step Functions workflow deletes all relevant AWS Glue jobs defined in the workflow catalog, and creates new jobs with a different (random) suffix. As a result, you will lose the job run history in AWS Glue. The underlying metrics and logs are retained in Amazon CloudWatch.
Clean up
To avoid incurring future charges, perform the following steps:
Disable the schedules of the deployed AWS Glue jobs:
Open the workload configuration file in your S3 bucket (s3://data-lake-raw-layer-123456789012-eu-west-1/data-lake-landing.json) and replace the value of JobScheduleType to OnDemand for all workflow definitions.
Run the Step Functions workflow (data-lake-landing).
Observe that all AWS Glue triggers ending with _starting_trigger have the trigger type On-demand instead of Schedule.
Empty the S3 bucket and delete the CloudFormation stack.
Delete the deployed AWS Glue resources:
All AWS Glue triggers ending with _starting_trigger.
All AWS Glue jobs starting with the WorkflowName defined in the workflow catalog.
All AWS Glue workflows with the WorkflowName defined in the workflow catalog.
AWS Glue blueprints.
Conclusion
AWS Glue blueprints allow data engineers to build and maintain AWS Glue jobs landing data from RDBMS to your data lake at scale.By adopting this standardized and reusable approach, instead of maintaining hundreds of AWS Glue jobs, you now keep track the workflow catalog. When you have new tables to land to your data lake, simply add the entries to your workflow catalog and rerun the Step Functions workflow to deploy resources.
Moustafa Mahmoud is a Solutions Architect of AWS Data Lab with a passion for data integration, data analysis, machine learning, and BI. Moustafa helps customers convert their ideas to a production-ready data product on AWS. He has over 10 years of experience as a data engineer, machine learning practitioner, and software developer. In his spare time, Moustafa loves exploring nature, reading, and spending time with friends and family.
Corvus Lee is a Solutions Architect of AWS Data Lab. He enjoys all kinds of data-related discussions, and helps customers build MVPs using AWS Databases, Analytics, and Machine Learning services.
AWS Identity and Access Management (IAM) Access Analyzer provides many tools to help you set, verify, and refine permissions. One part of IAM Access Analyzer—policy validation—helps you author secure and functional policies that grant the intended permissions. Now, I’m excited to announce that AWS has updated the IAM console experience for role trust policies to make it simpler for you to author and validate the policy that controls who can assume a role. In this post, I’ll describe the new capabilities and show you how to use them as you author a role trust policy in the IAM console.
Overview of changes
A role trust policy is a JSON policy document in which you define the principals that you trust to assume the role. The principals that you can specify in the trust policy include users, roles, accounts, and services. The new IAM console experience provides the following features to help you set the right permissions in the trust policy:
An interactive policy editor prompts you to add the right policy elements, such as the principal and the allowed actions, and offers context-specific documentation.
As you author the policy, IAM Access Analyzer runs over 100 checks against your policy and highlights issues to fix. This includes new policy checks specific to role trust policies, such as a check to make sure that you’ve formatted your identity provider correctly. These new checks are also available through the IAM Access Analyzer policy validation API.
Before saving the policy, you can preview findings for the external access granted by your trust policy. This helps you review external access, such as access granted to a federated identity provider, and confirm that you grant only the intended access when you create the policy. This functionality was previously available through the APIs, but now it’s also available in the IAM console.
In the following sections, I’ll walk you through how to use these new features.
Example scenario
For the walkthrough, consider the following example, which is illustrated in Figure 1. You are a developer for Example Corp., and you are working on a web application. You want to grant the application hosted in one account—the ApplicationHost account—access to data in another account—the BusinessData account. To do this, you can use an IAM role in the BusinessData account to grant temporary access to the application through a role trust policy. You will grant a role in the ApplicationHost account—the PaymentApplication role—to access the BusinessData account through a role—the ApplicationAccess role. In this example, you create the ApplicationAccess role and grant cross-account permissions through the trust policy by using the new IAM console experience that helps you set the right permissions.
Figure 1: Visual explanation of the scenario
Create the role and grant permissions through a role trust policy with the policy editor
In this section, I will show you how to create a role trust policy for the ApplicationAccess role to grant the application access to the data in your account through the policy editor in the IAM console.
To create a role and grant access
In the BusinessData account, open the IAM console, and in the left navigation pane, choose Roles.
Choose Create role, and then select Custom trust policy, as shown in Figure 2.
Figure 2: Select “Custom trust policy” when creating a role
In the Custom trust policy section, for 1. Add actions for STS, select the actions that you need for your policy. For example, to add the action sts:AssumeRole, choose AssumeRole.
Figure 3: JSON role trust policy
For 2. Add a principal, choose Add to add a principal.
In the Add principal box, for Principal type, select IAM roles. This populates the ARN field with the format of the role ARN that you need to add to the policy, as shown in Figure 4.
Figure 4: Add a principal to your role trust policy
Update the role ARN template with the actual account and role information, and then choose Add principal. In our example, the account is ApplicationHost with an AWS account number of 111122223333, and the role is PaymentApplication role. Therefore, the role ARN is arn:aws:iam:: 111122223333: role/PaymentApplication. Figure 5 shows the role trust policy with the action and principal added.
Figure 5: Sample role trust policy
(Optional) To add a condition, for 3. Add a condition, choose Add, and then complete the Add condition box according to your needs.
Author secure policies by reviewing policy validation findings
As you author the policy, you can see errors or warnings related to your policy in the policy validation window, which is located below the policy editor in the console. With this launch, policy validation in IAM Access Analyzer includes 13 new checks focused on the trust relationship for the role. The following are a few examples of these checks and how to address them:
Role trust policy unsupported wildcard in principal – you can’t use a * in your role trust policy.
Invalid federated principal syntax in role trust policy – you need to fix the format of the identity provider.
Missing action for condition key – you need to add the right action for a given condition, such as the sts:TagSession when there are session tag conditions.
In the policy validation window, do the following:
Choose the Security tab to check if your policy is overly permissive.
Choose the Errors tab to review any errors associated with the policy.
Choose the Warnings tab to review if aspects of the policy don’t align with AWS best practices.
Choose the Suggestions tab to get recommendations on how to improve the quality of your policy.
Figure 6: Policy validation window in IAM Access Analyzer with a finding for your policy
For each finding, choose Learn more to review the documentation associated with the finding and take steps to fix it. For example, Figure 6 shows the error Mismatched Action For Principal. To fix the error, remove the action sts:AssumeRoleWithWebIdentity.
Preview external access by reviewing cross-account access findings
IAM Access Analyzer also generates findings to help you assess if a policy grants access to external entities. You can review the findings before you create the policy to make sure that the policy grants only intended access. To preview the findings, you create an analyzer and then review the findings.
To preview findings for external access
Below the policy editor, in the Preview external access section, choose Go to Access Analyzer, as shown in Figure 7.
Note: IAM Access Analyzer is a regional service, and you can create a new analyzer in each AWS Region where you operate. In this situation, IAM Access Analyzer looks for an analyzer in the Region where you landed on the IAM console. If IAM Access Analyzer doesn’t find an analyzer there, it asks you to create an analyzer.
Figure 7: Preview external access widget without an analyzer
On the Create analyzer page, do the following to create an analyzer:
For Name, enter a name for your analyzer.
For Zone of trust, select the correct account.
Choose Create analyzer.
Figure 8: Create an analyzer to preview findings
After you create the analyzer, navigate back to the role trust policy for your role to review the external access granted by this policy. The following figure shows that external access is granted to PaymentApplication.
Figure 9: Preview finding
If the access is intended, you don’t need to take any action. In this example, I want the PaymentApplication role in the ApplicationHost account to assume the role that I’m creating.
If the access is unintended, resolve the finding by updating the role ARN information.
Select Next and grant the required IAM permissions for the role.
Name the role ApplicationAccess, and then choose Save to save the role.
Now the application can use this role to access the BusinessData account.
Conclusion
By using the new IAM console experience for role trust policies, you can confidently author policies that grant the intended access. IAM Access Analyzer helps you in your least-privilege journey by evaluating the policy for potential issues to make it simpler for you to author secure policies. IAM Access Analyzer also helps you preview external access granted through the trust policy to help ensure that the granted access is intended. To learn more about how to preview IAM Access Analyzer cross-account findings, see Preview access in the documentation. To learn more about IAM Access Analyzer policy validation checks, see Access Analyzer policy validation. These features are also available through APIs.
If you have feedback about this post, submit comments in the Comments section below. If you have questions about this post, start a new thread at AWS IAM re:Post or contact AWS Support.
Nowadays many customers are following a multi-cloud strategy. They might choose to use various cloud-managed services, such as Amazon Relational Database Service (Amazon RDS) for SQL Server and Azure SQL Managed Instances, to perform data analytics tasks, but still use traditional extract, transform, and load (ETL) tools to integrate and process the data. However, traditional ETL tools may require you to develop custom scripts, which makes ETL automation difficult.
In this post, I show you how to automate ETL jobs between Amazon RDS for SQL Server and Azure SQL Managed Instances using AWS Glue Studio, which is part of AWS Glue, a fully managed serverless integration service. AWS Glue Studio has a graphical interface that makes it easy to create, run, and monitor ETL jobs, and you can create a schedule to run your jobs at specific times.
Solution overview
To move data from one database to another, there are different services available either on-premise or in the cloud, varied by bandwidth limits, ongoing changes (CDC), schema and table modifications, and other features. Beyond that, we need to apply advanced data transformations, monitor, and automate the ETL jobs. This is where AWS Glue Studio can help us facilitate these activities.
As shown in the following diagram, we use AWS Glue Studio as the middleware to pull data from the source database (in this case an Azure SQL Managed Instance), then create and automate the ETL job using one of the pre-built transformations in AWS Glue Studio. Finally, we load the data to the target database (in this case an RDS for SQL Server instance).
The solution workflow consists of the following steps:
Create connections for the source and target databases.
Create and run AWS Glue crawlers.
Create and run an ETL job that transforms the data and loads it from source to target.
Create a source database table (Azure SQL Managed Instance). You can deploy the Azure database instance using the following QuickStart. For testing purposes, I import the public AdventureWorkssample database and use the dbo.Employee table. See the following code:
#Query table
SELECT * FROM [AdventureWorksLT2019].[dbo].[Employee]
Create the target database table (Amazon RDS for SQL Server). To deploy the RDS instance, refer to Create and Connect to a Microsoft SQL Server Database with Amazon RDS. You can create an empty database and table with the following statements. This is the table where the data coming from Azure will be stored.
#Create database
CREATE DATABASE AdventureWorksonRDS;
#Create table
CREATE TABLE Employee
(EmpID INT NOT NULL,
EmpName VARCHAR(50) NOT NULL,
Designation VARCHAR(50) NULL,
Department VARCHAR(50) NULL,
JoiningDate DATETIME NULL,
CONSTRAINT [PK_Employee] PRIMARY KEY CLUSTERED (EmpID)
#Query table
SELECT * FROM [AdventureWorksonRDS].[dbo].[Employee]
Create connections
The first step is to populate our AWS Glue Data Catalog with the schema information coming from our source and target data sources.
To do that, we first create connections. A connection is a Data Catalog object that stores connection information for a particular data store. Connections store login credentials, URI strings, VPC information, and more. Creating connections in the Data Catalog saves the effort of having to specify the connection details every time you create a crawler or job.
Create a connection for Azure SQL Managed Instance
To create the connection to our source database, complete the following steps:
On the AWS Glue console, choose AWS Glue Studio.
In the navigation pane of the AWS Glue Studio console, choose Connectors.
Choose Create connection.
For Name, enter AzureSQLManaged.
For Connection type, choose JDBC.
For JDBC URL, use the SQL Server syntax jdbc:protocol://host:port;database=db_name.
You can find the host and database name on the Azure SQL Managed Instance service console, on the Overview page.For this specific example, we use the following information for our Azure SQL Instance:
Enter your user name and password. Choose Create connection.
Create a connection for Amazon RDS for SQL Server
To create a connection for our target data source, complete the following steps:
On the AWS Glue Studio console, choose Connectors in the navigation pane.
Choose Create connection.
For Name, enter AWSRDSforSQL.
For Connection type, choose Amazon RDS.
For Database engine, choose Microsoft SQL Server.
For Database instances, choose your RDS DB instance.
For Database name, enter AdventureWorksonRDS.
Enter your user name and password.
Choose Create connection.
You can now see the two connections created in the Connections section.
Create and run AWS Glue crawlers
You can use a crawler to populate the AWS Glue Data Catalog with tables. This is the most common method used by most AWS Glue users. A crawler can crawl multiple data stores in a single run. Upon completion, it updates the Data Catalog with the tables it found. The ETL jobs that you define in AWS Glue use these Data Catalog tables as sources and targets.
Create a crawler for Azure SQL Managed Instance
To create a crawler for our source database, complete the following steps:
On the AWS Glue console, choose Crawlers in the navigation pane.
Choose Create crawler.
If the data hasn’t been mapped into an AWS Glue table, select Not yet and choose Add a data source.
For Data source¸ choose JDBC.
For Connection, choose AzureSQLManaged.
For Include path, specify the path of the database including the schema: AdventureWorksLT2019/dbo/%.
Choose Add a JDBC data source.
Choose Next.
Choose the IAM role created as part of the prerequisites and choose Next.
Choose Add database to create the target database in the AWS Glue Data Catalog.
For Name, enter azuresqlmanaged_db.
Choose Create database.
For Target database, choose azuresqlmanaged_db.
Choose Next.
Review if everything looks correct and choose Create crawler.
Create a crawler for Amazon RDS for SQL Server
Repeat the crawler creation steps to create the crawler for the target RDS for SQL Server database, using the following information:
Crawler name – AmazonRDSSQL_Crawler
Data source – JDBC
Connection – AWSRDSforSQL
Include path – AdventureWorksonRDS/dbo/%
IAM role – AWSGlueServiceRoleDefault
Database name – amazonrdssql_db
Run the crawlers
Now it’s time to run the crawlers.
On the AWS Glue console, choose Crawlers in the navigation pane.
Select the crawlers you created and choose Run.
When the crawler is complete, choose Databases in the navigation pane. Here you can find the databases discovered by the crawler.
Choose Tables in the navigation pane and explore the tables discovered by the crawler that correctly identified the data type as SQL Server.
Choose the table adventureworkslt2019_dbo_employee and review the schema created for the data source.
Create and run an ETL job
Now that we have crawled our source and target databases, and we have the data in the AWS Glue Data Catalog, we can create an ETL job to load and transform this data.
On the AWS Glue Studio console, choose Jobs in the navigation pane.
Select Visual with a blank canvas to use a visual interface to create our ETL jobs.
Choose Create.
On the Source menu, choose AWS Glue Data Catalog.
On the Data source properties tab, specify the database and table (for this post, azuresqlmanaged_db and adventureworkslt2019_dbo_employee).
On the Transform menu, choose Apply mapping to map the source fields to the target database.
On the Transform tab, you can see the data fields to be loaded, and you even can drop some of them if needed.
On the Target menu, choose AWS Glue Data Catalog.
On the Data target properties tab, choose the database and table where you want to load the transformed data (for this post, amazonrdssql_db and adventureworksrds_dbo_employee).
On the Job details tab, for Name, enter ETL_Azure_to_AWS.
For IAM Role, choose the appropriate role.
Choose Save.
Choose Run to run the job.
If the ETL job ran successfully, it should map the data from the source database (Azure SQL) to the target database (Amazon RDS for SQL). To confirm it, you can connect to the target database using SQL Server Management Studio (SSMS), and query the empty database/table AdventureWorksonRDS/dbo.Employee. It should have the data coming from the Azure SQL Managed Instance.
#Query table
SELECT * FROM [AdventureWorksonRDS].[dbo].[Employee]
Schedule your ETL job
In AWS Glue Studio, you can create a schedule to have your jobs run at specific times. This will reimport the full dataset and reference the use of bookmarks to do incremental loads. You can schedule your ETL jobs on an hourly, daily, weekly, monthly, or custom basis, depending on your needs. To schedule a job, complete the following steps:
On the AWS Glue Studio, navigate to the job you created.
On the Schedules tab, choose Create schedule.
For Name, enter a name (for example, dbo_employee_daily_load).
Choose your preferred frequency, start hour, and minute of the hour. For this post, we schedule it daily at 3:00 UTC.
For Description, enter an optional description.
Choose Create schedule.
Confirm on the Schedules tab that the schedule was created and activated successfully.
You have now automated your ETL job to run at your desired frequency.
Monitor your ETL job
The job monitoring dashboard provides an overall summary of the job runs, with totals for the jobs with a status of Running, Canceled, Success, or Failed.
The Runs tab shows the jobs for the specified date range and filters. You can filter the jobs on additional criteria, such as status, worker type, job type, and job name.
Conclusion
In this post, I went through the steps to automate ETL jobs using AWS Glue Studio, which is a user-friendly graphical interface to perform data integration tasks such as discovering and extracting data from various sources; enriching, cleaning, normalizing, and combining data; and loading and organizing data in databases, data warehouses, and data lakes. You can easily find and access this data using the AWS Glue Data Catalog. Data engineers and ETL developers can visually create, run, and monitor ETL workflows with a few clicks in AWS Glue Studio.
About the author
Daniel Maldonado is an AWS Solutions Architect, specializing in Microsoft workloads and big data technologies, and focused on helping customers migrate their applications and data to AWS. Daniel has over 13 years of experience working with information technologies and enjoys helping clients reap the benefits of running their workloads in the cloud.
AWS Identity and Access Management (IAM) is changing an aspect of how role trust policy evaluation behaves when a role assumes itself. Previously, roles implicitly trusted themselves from a role trust policy perspective if they had identity-based permissions to assume themselves. After receiving and considering feedback from customers on this topic, AWS is changing role assumption behavior to always require self-referential role trust policy grants. This change improves consistency and visibility with regard to role behavior and privileges. This change allows customers to create and understand role assumption permissions in a single place (the role trust policy) rather than two places (the role trust policy and the role identity policy). It increases the simplicity of role trust permission management: “What you see [in the trust policy] is what you get.”
Therefore, beginning today, for any role that has not used the identity-based behavior since June 30, 2022, a role trust policy must explicitly grant permission to all principals, including the role itself, that need to assume it under the specified conditions. Removal of the role’s implicit self-trust improves consistency and increases visibility into role assumption behavior.
Most AWS customers will not be impacted by the change at all. Only a tiny percentage (approximately 0.0001%) of all roles are involved. Customers whose roles have recently used the previous implicit trust behavior are being notified, beginning today, about those roles, and may continue to use this behavior with those roles until February 15, 2023, to allow time for making the necessary updates to code or configuration. Or, if these customers are confident that the change will not impact them, they can opt out immediately by substituting in new roles, as discussed later in this post.
The first part of this post briefly explains the change in behavior. The middle sections answer practical questions like: “why is this happening?,” “how might this change impact me?,” “which usage scenarios are likely to be impacted?,” and “what should I do next?” The usage scenario section is important because it shows that, based on our analysis, the self-assuming role behavior exhibited by code or human users is very likely to be unnecessary and counterproductive. Finally, for security professionals interested in better understanding the reasons for the old behavior, the rationale for the change, as well as its possible implications, the last section reviews a number of core IAM concepts and digs in to additional details.
What is changing?
Until today, an IAM role implicitly trusted itself. Consider the following role trust policy attached to the role named RoleA in AWS account 123456789012.
This role trust policy grants role assumption access to the role named RoleB in the same account. However, if the corresponding identity-based policy for RoleA grants the sts:AssumeRole action with respect to itself, then RoleA could also assume itself. Therefore, there were actually two roles that could assume RoleA: the explicitly permissioned RoleB, and RoleA, which implicitly trusted itself as a byproduct of the IAM ownership model (explained in detail in the final section). Note that the identity-based permission that RoleA must have to assume itself is not required in the case of RoleB, and indeed an identity-based policy associated with RoleB that references other roles is not sufficient to allow RoleB to assume them. The resource-based permission granted by RoleA’s trust policy is both necessary and sufficient to allow RoleB to assume RoleA.
Although earlier we summarized this behavior as “implicit self-trust,” the key point here is that the ability of Role A to assume itself is not actually implicit behavior. The role’s self-referential permission had to be explicit in one place or the other (or both): either in the role’s identity-based policy (perhaps based on broad wildcard permissions), or its trust policy. But unlike the case with other principals and role trust, an IAM administrator would have to look in two different policies to determine whether a role could assume itself.
As of today, for any new role, or any role that has not recently assumed itself while relying on the old behavior, IAM administrators must modify the previously shown role trust policy as follows to allow RoleA to assume itself, regardless of the privileges granted by its identity-based policy:
This change makes role trust behavior clearer and more consistent to understand and manage, whether directly by humans or as embodied in code.
How might this change impact me?
As previously noted, most customers will not be impacted by the change at all. For those customers who do use the prior implicit trust grant behavior, AWS will work with you to eliminate your usage prior to February 15, 2023. Here are more details for the two cases of customers who have not used the behavior, and those who have.
If you haven’t used the implicit trust behavior since June 30, 2022
Beginning today, if you have not used the old behavior for a given role at any time since June 30, 2022, you will now experience the new behavior. Those existing roles, as well as any new roles, will need an explicit reference in their own trust policy in order to assume themselves. If you have roles that are used only very occasionally, such as once per quarter for a seldom-run batch process, you should identify those roles and if necessary either remove the dependency on the old behavior or update their role trust policies to include the role itself prior to their next usage (see the second sample policy above for an example).
If you have used the implicit trust behavior since June 30, 2022
If you have a role that has used the implicit trust behavior since June 30, 2022, then you will continue to be able to do so with that role until February 15, 2023. AWS will provide you with notice referencing those roles beginning today through your AWS Health Dashboard and will also send an email with the relevant information to the account owner and security contact. We are allowing time for you to make any necessary changes to your existing processes, code, or configurations to prepare for removal of the implicit trust behavior. If you can’t change your processes or code, you can continue to use the behavior by making a configuration change—namely, by updating the relevant role trust policies to reference the role itself. On the other hand, you can opt out of the old behavior at any time by creating a new role with a different Amazon Resource Name (ARN) with the desired identity-based and trust-policy-based permissions and substituting it for any older role that was identified as using the implicit trust behavior. (The new role will not be allow-listed, because the allow list is based on role ARNs.) You can also modify an existing allow-listed role’s trust policy to explicitly deny access to itself. See the “What should I do next?” section for more information.
Notifications and retirement
As we previously noted, starting today, accounts with existing roles that use the implicit self-assume role assumption behavior will be notified of this change by email and through their AWS Health Dashboard. Those roles have been allow-listed, and so for now their behavior will continue as before. After February 15, 2023, the old behavior will be retired for all roles and all accounts. IAM Documentation has been updated to make clear the new behavior.
After the old behavior is retired from the allow-listed roles and accounts, role sessions that make self-referential role assumption calls will fail with an Access Denied error unless the role’s trust policy explicitly grants the permission directly through a role ARN. Another option is to grant permission indirectly through an ARN to the root principal in the trust policy that acts as a delegation of privilege management, after which permission grants in identity-based policies determine access, similar to the typical cross-account case.
Which usage scenarios are likely to be impacted?
Users often attach an IAM role to an Amazon Elastic Compute Cloud (Amazon EC2) instance, an Amazon Elastic Container Service (Amazon ECS) task, or AWS Lambda function. Attaching a role to one of these runtime environments enables workloads to use short-term session credentials based on that role. For example, when an EC2 instance is launched, AWS automatically creates a role session and assigns it to the instance. An AWS best practice is for the workload to use these credentials to issue AWS API calls without explicitly requesting short-term credentials through sts:AssumeRole calls.
However, examples and code snippets commonly available on internet forums and community knowledge sharing sites might incorrectly suggest that workloads need to call sts:AssumeRole to establish short-term sessions credentials for operation within those environments.
We analyzed AWS Security Token Service (AWS STS) service metadata about role self-assumption in order to understand the use cases and possible impact of the change. What the data shows is that in almost all cases this behavior is occurring due to unnecessarily reassuming the role in an Amazon EC2, Amazon ECS, Amazon Elastic Kubernetes Services (EKS), or Lambda runtime environment already provided by the environment. There are two exceptions, discussed at the end of this section under the headings, “self-assumption with a scoped-down policy” and “assuming a target compute role during development.”
There are many variations on this theme, but overall, most role self-assumption occurs in scenarios where the person or code is unnecessarily reassuming the role that the code was already running as. Although this practice and code style can still work with a configuration change (by adding an explicit self-reference to the role trust policy), the better practice will almost always be to remove this unnecessary behavior or code from your AWS environment going forward. By removing this unnecessary behavior, you save CPU, memory, and network resources.
Common mistakes when using Amazon EKS
Some users of the Amazon EKS service (or possibly their shell scripts) use the command line interface (CLI) command aws eks get-token to obtain an authentication token for use in managing a Kubernetes cluster. The command takes as an optional parameter a role ARN. That parameter allows a user to assume another role other than the one they are currently using before they call get-token. However, the CLI cannot call that API without already having an IAM identity. Some users might believe that they need to specify the role ARN of the role they are already using. We have updated the Amazon EKS documentation to make clear that this is not necessary.
Common mistakes when using AWS Lambda
Another example is the use of an sts:AssumeRole API call from a Lambda function. The function is already running in a preassigned role provided by user configuration within the Lambda service, or else it couldn’t successfully call any authenticated API action, including sts:AssumeRole. However, some Lambda functions call sts:AssumeRole with the target role being the very same role that the Lambda function has already been provided as part of its configuration. This call is unnecessary.
AWS Software Development Kits (SDKs) all have support for running in AWS Lambda environments and automatically using the credentials provided in that environment. We have updated the Lambda documentation to make clear that such STS calls are unnecessary.
Common mistakes when using Amazon ECS
Customers can associate an IAM role with an Amazon ECS task to give the task AWS credentials to interact with other AWS resources.
We detected ECS tasks that call sts:AssumeRole on the same role that was provided to the ECS task. Amazon ECS makes the role’s credentials available inside the compute resources of the ECS task, whether on Amazon EC2 or AWS Fargate, and these credentials can be used to access AWS services or resources as the IAM role associated with the ECS talk, without being called through sts:AssumeRole. AWS handles renewing the credentials available on ECS tasks before the credentials expire. AWS STS role assumption calls are unnecessary, because they simply create a new set of the same temporary role session credentials.
AWS SDKs all have support for running in Amazon ECS environments and automatically using the credentials provided in that ECS environment. We have updated the Amazon ECS documentation to make clear that calling sts:AssumeRole for an ECS task is unnecessary.
Common mistakes when using Amazon EC2
Users can configure an Amazon EC2 instance to contain an instance profile. This instance profile defines the IAM role that Amazon EC2 assigns the compute instance when it is launched and begins to run. The role attached to the EC2 instance enables your code to send signed requests to AWS services. Without this attached role, your code would not be able to access your AWS resources (nor would it be able to call sts:AssumeRole). The Amazon EC2 service handles renewing these temporary role session credentials that are assigned to the instance before they expire.
We have observed that workloads running on EC2 instances call sts:AssumeRole to assume the same role that is already associated with the EC2 instance and use the resulting role-session for communication with AWS services. These role assumption calls are unnecessary, because they simply create a new set of the same temporary role session credentials.
AWS SDKs all have support for running in Amazon EC2 environments and automatically using the credentials provided in that EC2 environment. We have updated the Amazon EC2 documentation to make clear that calling sts:AssumeRole for an EC2 instance with a role assigned is unnecessary.
For information on creating an IAM role, attaching that role to an EC2 instance, and launching an instance with an attached role, see “IAM roles for Amazon EC2” in the Amazon EC2 User Guide.
Other common mistakes
If your use case does not use any of these AWS execution environments, you might still experience an impact from this change. We recommend that you examine the roles in your account and identify scenarios where your code (or human use through the AWS CLI) results in a role assuming itself. We provide Amazon Athena and AWS CloudTrail Lake queries later in this post to help you locate instances where a role assumed itself. For each instance, you can evaluate whether a role assuming itself is the right operation for your needs.
Self-assumption with a scoped-down policy
The first pattern we have observed that is not a mistake is the use of self-assumption combined with a scoped-down policy. Some systems use this approach to provide different privileges for different use cases, all using the same underlying role. Customers who choose to continue with this approach can do so by adding the role to its own trust policy. While the use of scoped-down policies and the associated least-privilege approach to permissions is a good idea, we recommend that customers switch to using a second generic role and assume that role along with the scoped-down policy rather than using role self-assumption. This approach provides more clarity in CloudTrail about what is happening, and limits the possible iterations of role assumption to one round, since the second role should not be able to assume the first. Another possible approach in some cases is to limit subsequent assumptions is by using an IAM condition in the role trust policy that is no longer satisfied after the first role assumption. For example, for Lambda functions, this would be done by a condition checking for the presence of the “lambda:SourceFunctionArn” property; for EC2, by checking for presence of “ec2:SourceInstanceARN.”
Assuming an expected target compute role during development
Another possible reason for role self-assumption may result from a development practice in which developers attempt to normalize the roles that their code is running in between scenarios in which role credentials are not automatically provided by the environment, and scenarios where they are. For example, imagine a developer is working on code that she expects to run as a Lambda function, but during development is using her laptop to do some initial testing of the code. In order to provide the same execution role as is expected later in product, the developer might configure the role trust policy to allow assumption by a principal readily available on the laptop (an IAM Identity Center role, for example), and then assume the expected Lambda function execution role when the code is initializing. The same approach could be used on a build and test server. Later, when the code is deployed to Lambda, the actual role is already available and in use, but the code need not be modified in order to provide the same post-role-assumption behavior that existing outside of Lambda: the unmodified code can automatically assume what is in this case the same role, and proceed. While this approach is not illogical, as with the scope-down policy case we recommend that customers configure distinct roles for assumption both in development and test environments as well as later production environments. Again, this approach provides more clarity in CloudTrail about what is happening, and limits the possible iterations of role assumption to one round, since the second role should not be able to assume the first.
What should I do next?
If you receive an email or AWS Health Dashboard notification for an account, we recommend that you review your existing role trust policies and corresponding code. For those roles, you should remove the dependency on the old behavior, or if you can’t, update those role trust policies with an explicit self-referential permission grant. After the grace period expires on February 15, 2023, you will no longer be able to use the implicit self-referential permission grant behavior.
If you currently use the old behavior and need to continue to do so for a short period of time in the context of existing infrastructure as code or other automated processes that create new roles, you can do so by adding the role’s ARN to its own trust policy. We strongly encourage you to treat this as a temporary stop-gap measure, because in almost all cases it should not be necessary for a role to be able to assume itself, and the correct solution is to change the code that results in the unnecessary self-assumption. If for some reason that self-service solution is not sufficient, you can reach out to AWS Support to seek an accommodation of your use case for new roles or accounts.
If you make any necessary code or configuration changes and want to remove roles that are currently allow-listed, you can also ask AWS Support to remove those roles from the allow list so that their behavior follows the new model. Or, as previously noted, you can opt out of the old behavior at any time by creating a new role with a different ARN that has the desired identity-based and trust-policy–based permissions and substituting it for the allow-listed role. Another stop-gap type of option is to add an explicit deny that references the role to its own trust policy.
If you would like to understand better the history of your usage of role self-assumption in a given account or organization, you can follow these instructions on querying CloudTrail data with Athena and then use the following Athena query against your account or organization CloudTrail data, as stored in Amazon Simple Storage Services (Amazon S3). The results of the query can help you understand the scenarios and conditions and code involved. Depending on the size of your CloudTrail logs, you may need to follow the partitioning instructions to query subsets of your CloudTrail logs sequentially. If this query yields no results, the role self-assumption scenario described in this blog post has never occurred within the analyzed CloudTrail dataset.
SELECT eventid, eventtime, userIdentity.sessioncontext.sessionissuer.arn as RoleARN, split_part(userIdentity.principalId, ':', 2) as RoleSessionName from cloudtrail_logs t CROSS JOIN UNNEST(t.resources) unnested (resources_entry) where eventSource = 'sts.amazonaws.com' and eventName = 'AssumeRole' and userIdentity.type = 'AssumedRole' and errorcode IS NULL and substr(userIdentity.sessioncontext.sessionissuer.arn,12) = substr(unnested.resources_entry.ARN,12)
As another option, you can follow these instructions to set up CloudTrail Lake to perform a similar analysis. CloudTrail Lake allows richer, faster queries without the need to partition the data. As of September 20, 2022, CloudTrail Lake now supports import of CloudTrail logs from Amazon S3. This allows you to perform a historical analysis even if you haven’t previously enabled CloudTrail Lake. If this query yields no results, the scenario described in this blog post has never occurred within the analyzed CloudTrail dataset.
SELECT eventid, eventtime, userIdentity.sessioncontext.sessionissuer.arn as RoleARN, userIdentity.principalId as RoleIdColonRoleSessionName from $EDS_ID where eventSource = 'sts.amazonaws.com' and eventName = 'AssumeRole' and userIdentity.type = 'AssumedRole' and errorcode IS NULL and userIdentity.sessioncontext.sessionissuer.arn = element_at(resources,1).arn
Understanding the change: more details
To better understand the background of this change, we need to review the IAM basics of identity-based policies and resource-based policies, and then explain some subtleties and exceptions. You can find additional overview material in the IAM documentation.
The structure of each IAM policy follows the same basic model: one or more statements with an effect (allow or deny), along with principals, actions, resources, and conditions. Although the identity-based and resource-based policies share the same basic syntax and semantics, the former is associated with a principal, the latter with a resource. The main difference between the two is that identity-based policies do not specify the principal, because that information is supplied implicitly by associating the policy with a given principal. On the other hand, resource policies do not specify an arbitrary resource, because at least the primary identifier of the resource (for example, the bucket identifier of an S3 bucket) is supplied implicitly by associating the policy with that resource. Note that an IAM role is the only kind of AWS object that is both a principal and a resource.
In most cases, access to a resource within the same AWS account can be granted by either an identity-based policy or a resource-based policy. Consider an Amazon S3 example. An identity-based policy attached to an IAM principal that allows the s3:GetObject action does not require an equivalent grant in the S3 bucket resource policy. Conversely, an s3:GetObject permission grant in a bucket’s resource policy is all that is needed to allow a principal in the same account to call the API with respect to that bucket; an equivalent identity-based permission is not required. Either the identity-based policy or the resource-based policy can grant the necessary permission. For more information, see IAM policy types: How and when to use them.
However, in order to more tightly govern access to certain security-sensitive resources, such as AWS Key Management Service (AWS KMS) keys and IAM roles, those resource policies need to grant access to the IAM principal explicitly, even within the same AWS account. A role trust policy is the resource policy associated with a role that specifies which IAM principals can assume the role by using one of the sts:AssumeRole* API calls. For example, in order for RoleB to assume RoleA in the same account, whether or not RoleB’s identity-based policy explicitly allows it to assume RoleA, RoleA’s role trust policy must grant access to RoleB. Within the same account, an identity-based permission by itself is not sufficient to allow assumption of a role. On the other hand, a resource-based permission—a grant of access in the role trust policy—is sufficient. (Note that it’s possible to construct a kind of hybrid permission to a role by using both its resource policy and other identity-based policies. In that case, the role trust policy grants permission to the root principal ARN; after that, the identity-based policy of a principal in that account would need to explicitly grant permission to assume that role. This is analogous to the typical cross-account role trust scenario.)
Until now, there has been a nonintuitive exception to these rules for situations where a role assumes itself. Since a role is both a principal (potentially with an identity-based policy) and a resource (with a resource-based policy), it is in the unique position of being both a subject and an object within the IAM system, as well as being an object owned by itself rather than its containing account. Due to this ownership model, roles with identity-based permission to assume themselves implicitly trusted themselves as resources, and vice versa. That is to say, roles that had the privilege as principals to assume themselves implicitly trusted themselves as resources, without an explicit self-referential Allow in the role trust policy. Conversely, a grant of permission in the role trust policy was sufficient regardless of whether there was a grant in the same role’s identity-based policy. Thus, in the self-assumption case, roles behaved like most other resources in the same account: only a single permission was required to allow role self-assumption, either on the identity side or the resource side of their dual-sided nature. Because of a role’s implicit trust of itself as a resource, the role’s trust policy—which might otherwise limit assumption of the role with properties such as actions and conditions—was not applied, unless it contained an explicit deny of itself.
The following example is a role trust policy attached to the role named RoleA in account 123456789012. It grants explicit access only to the role named RoleB.
Assuming that the corresponding identity-based policy for RoleA granted the sts:AssumeRole action with regard to RoleA, this role trust policy provided that there were two roles that could assume RoleA: RoleB (explicitly referenced in the trust policy) and RoleA (assuming it was explicitly referenced in its identity policy). RoleB could assume RoleA only if it had the principal tag project:BlueSkyProject because of the trust policy condition. (The sts:TagSession permission is needed here in case tags need to be added by the caller as parted of the RoleAssumption call.) RoleA, on the other hand, did not need to meet that condition because it relied on a different explicit permission—the one granted in the identity-based policy. RoleA would have needed the principal tag project:BlueSkyProject to meet the trust policy condition if and only if it was relying on the trust policy to gain access through the sts:AssumeRole action; that is, in the case where its identity-based policy did not provide the needed privilege.
As we previously noted, after considering feedback from customers on this topic, AWS has decided that requiring self-referential role trust policy grants even in the case where the identity-based policy also grants access is the better approach to delivering consistency and visibility with regard to role behavior and privileges. Therefore, as of today, role assumption behavior requires an explicit self-referential permission in the role trust policy, and the actions and conditions within that policy must also be satisfied, regardless of the permissions expressed in the role’s identity-based policy. (If permissions in the identity-based policy are present, they must also be satisfied.)
Requiring self-reference in the trust policy makes role trust policy evaluation consistent regardless of which role is seeking to assume the role. Improved consistency makes role permissions easier to understand and manage, whether through human inspection or security tooling. This change also eliminates the possibility of continuing the lifetime of an otherwise temporary credential without explicit, trackable grants of permission in trust policies. It also means that trust policy constraints and conditions are enforced consistently, regardless of which principal is assuming the role. Finally, as previously noted, this change allows customers to create and understand role assumption permissions in a single place (the role trust policy) rather than two places (the role trust policy and the role identity policy). It increases the simplicity of role trust permission management: “what you see [in the trust policy] is what you get.”
Continuing with the preceding example, if you need to allow a role to assume itself, you now must update the role trust policy to explicitly allow both RoleB and RoleA. The RoleA trust policy now looks like the following:
Without this new principal grant, the role can no longer assume itself. The trust policy conditions are also applied, even if the role still has unconditioned access to itself in its identity-based policy.
Conclusion
In this blog post we’ve reviewed the old and new behavior of role assumption in the case where a role seeks to assume itself. We’ve seen that, according to our analysis of service metadata, the vast majority of role self-assumption behavior that relies solely on identity-based privileges is totally unnecessary, because the code (or human) who calls sts:AssumeRole is already, without realizing it, using the role’s credentials to call the AWS STS API. Eliminating that mistake will improve performance and decrease resource consumption. We’ve also explained in more depth the reasons for the old behavior and the reasons for making the change, and provided Athena and CloudTrail Lake queries that you can use to examine past or (in the case of allow-listed roles) current self-assumption behavior in your own environments. You can reach out to AWS Support or your customer account team if you need help in this effort.
If you currently use the old behavior and need to continue to do so, your primary option is to create an explicit allow for the role in its own trust policy. If that option doesn’t work due to operational constraints, you can reach out to AWS Support to seek an accommodation of your use case for new roles or new accounts. You can also ask AWS Support to remove roles from the allow-list if you want their behavior to follow the new model.
If you have feedback about this post, submit comments in the Comments section below. If you have questions about this post, start a new IAM-tagged discussion on AWS re:Post or contact AWS Support.
AWS would like to thank several customers and partners who highlighted this behavior as something they found surprising and unhelpful, and asked us to consider making this change. We would also like to thank independent security researcher Ryan Gerstenkorn who engaged with AWS on this topic and worked with us prior to this update.
Want more AWS Security news? Follow us on Twitter.
Amazon Simple Notification Service (Amazon SNS) now supports message signatures based on Secure Hash Algorithm 256 (SHA256) hashing. Amazon SNS signs the messages that are delivered from your Amazon SNS topic so that subscribed HTTP endpoints can verify the authenticity of the messages. In this blog post, we will show you how to enable message signatures based on SHA256 for your Amazon SNS topics.
About message signing verification
To verify the authenticity of a message sent to your HTTP endpoint by Amazon SNS, you can verify the message signature. There are two cases where we recommend verifying the authenticity of the message. The first is when Amazon SNS sends a message to an HTTP endpoint that you subscribed to a topic. The second is when Amazon SNS sends a confirmation message to your HTTP endpoint after the Subscribe or the Unsubscribe API actions. For more information, see Verifying the signatures of Amazon SNS messages in the Amazon SNS Developer Guide.
Amazon SNS now supports two message signature versions:
Signature version 1 – Amazon SNS creates the signature based on the SHA1 hash of the message.
Signature version 2 – Amazon SNS creates the signature based on the SHA256 hash of the message.
Amazon SNS adds the SignatureVersion property to the JSON payload of messages delivered to HTTP endpoints, as shown in the following code snippet. For more information on the JSON payload format, see Parsing message formats in the Amazon SNS Developer Guide.
What to consider before you enable message signatures based on SHA256 for your Amazon SNS topic
As an Amazon SNS topic owner, before you enable SHA256 support for your topic, we recommend communicating with the owners of the HTTP endpoints that are subscribed to your topic. They might need to update their message signature verification logic to accommodate the new signature version. If the endpoint owners are using the AWS SDK feature for verifying the Amazon SNS message signatures, they need to make sure that they are using one of the following versions of the AWS SDK: Java 1.12.285, JavaScript 0.3.5, Ruby 1.54.0, PHP 1.8.0 or .NET 3.7.3.96.
How to enable message signatures based on SHA256 for your Amazon SNS topic
Amazon SNS topic owners can now enable message signatures based on SHA256 hashing. In this post, you learned how to choose the hashing algorithm, either SHA256 or SHA1, for your SNS topic. For more information, see Verifying the signatures of Amazon SNS messages in the Amazon SNS Developer Guide, and SetTopicAttributes in the Amazon SNS API Reference.
For more serverless learning resources, visit Serverless Land.
If you have feedback about this post, submit comments in the Comments section below. If you have questions about this post, contact AWS Support.
Want more AWS Security how-to content, news, and feature announcements? Follow us on Twitter.
AWS Certificate Manager (ACM) is a service that lets you efficiently provision, manage, and deploy public and private SSL/TLS certificates for use with AWS services and your internal connected resources. The certificates issued by ACM can then be used to secure network communications and establish the identity of websites on the internet or resources on private networks.
So why might you want to import a certificate into ACM, rather than using a certificate issued by ACM? According to the AWS Certificate Manager User Guide topic Importing certificates into AWS Certificate Manager, “you might do this because you already have a certificate from a third-party certificate authority (CA), or because you have application-specific requirements that are not met by ACM issued certificates.”
In this blog post, I’ll list 10 reasons why you might want to import a certificate into ACM, including what specific requirements you might have, and why you might want to use a certificate signed by a third-party CA in the first place.
1. To use an ECDSA certificate for faster TLS connections
Imported Elliptic Curve Digital Signature Algorithm (ECDSA) certificates use smaller keys than ACM issued public RSA certificates, allowing for TLS connections to be established faster. For this reason, ECDSA certificates are particularly useful for systems with limited processing resources, such as Internet of Things (IoT) devices. ACM supports imported certificates with ECDSA in 256, 384, and 521 bit variations. If you want to use an ECDSA certificate for your public-facing web application, you need to get a third-party certificate and then import it into ACM. For more information about supported cryptographic algorithms for imported certificates, see Prerequisites for importing certificates in the AWS Certificate Manager User Guide.
2. To control your certificate’s renewal cycle
When you import a certificate into ACM, you have greater control over its renewal cycle simply because you can re-import it as frequently as you want. You also have control over how often your imported certificate’s private key can be rotated. As a best practice, you should rotate your certificate’s private key based on your certificate’s usage frequency.
Note: When you re-import your certificate, to maintain the existing associations during renewal, ensure that you specify the existing certificate’s Amazon Resource Name (ARN). For more information and step-by-step instructions, see Reimporting a certificate in the AWS Certificate Manager User Guide.
3. To use certificate pinning
You might have an application that requires certificate pinning, which is the practice of bypassing the typical hierarchical model of trust that is governed by certificate authorities. With certificate pinning, a host’s identity is trusted based on a specific certificate or public key. As a certificate pinning best practice, AWS recommends that public certificates issued by ACM should not be pinned because ACM will generate a new public/private key pair at the next renewal phase, which essentially replaces the pinned certificate with a new one, causing service disruption along the process. If you want to use certificate pinning, you can pin an imported certificate because imported certificates are not subject to managed renewal, thereby reducing the risk of production impact.
4. To use a higher-assurance certificate
You might want to use a higher-assurance certificate, such as an organization validation (OV) or extended validation (EV) certificate. Certificates issued by ACM currently only support domain validation (DV). If the domain you want to protect is an application that requires OV or EV, you can import OV or EV certificates into ACM by using a third-party certificate of either type. You can use the ACM API action ImportCertificate to import OV or EV certificates into ACM.
5. To use a self-signed certificate
For internal testing environments where your developers want speed and flexibility, self-signed certificates are issued faster and effortlessly. However, it’s important to know that self-signed certificates are not trusted by default, which means that self-signed certificates need to be installed inside the trust stores of the intended clients, to avoid the risk of your users getting into the habit of ignoring browser warnings. For more information, see the additional requirements for self-signed certificates in Prerequisites for importing certificates in the AWS Certificate Manager User Guide.
6. To use an IP address for the certificate’s subject
By design, the subject field of an ACM certificate can only identify a fully qualified domain name (FQDN). If you want to use an IP address for the certificate’s subject, then you can create the certificate and import it to ACM.
7. To exceed the number of domains allowed by the ACM quotas
Certificates issued by ACM are subject to the ACM service quotas. The default quota for ACM is 10 domain names for each ACM certificate, and you can request an increase to the quota up to a maximum of 100 domain names for each certificate. However, if you import certificates, they are not subject to the quotas, and you can use a public certificate with more than 100 FQDNs in its domain scope without having to go through the process of requesting any limit increases.
8. To use a private certificate issued by ACM Private CA with the IssueCertificate API action
Certificates provisioned with the IssueCertificate API action have a private status and cannot be associated directly with an AWS integrated service, such as an internal Application Load Balancer. Instead, a private certificate issued by AWS Certificate Manager Private Certificate Authority (ACM Private CA) with the IssueCertificate API action needs to be exported and then imported into ACM before the association can be made. The same is true for certificate templates as well, which are configuration templates that can be passed as parameters to the IssueCertificate API action as a means to have greater control over the private certificate’s extensions.
9. To use a private certificate issued by your on-premises CA
You might want to use a private certificate issued by your on-premises CA instead of using ACM Private CA. To administer your internal public key infrastructure (PKI), AWS generally recommends that you use ACM Private CA. However, you might still come across scenarios where a certificate signed by your on-premises CA is better suited for your specific needs. For example, you might want to have a common root of trust, for consistency and interoperability purposes across a hybrid PKI solution. Furthermore, using an external parent CA with ACM Private CA also allows you to enforce CA name constraints. For more information, see Signing private CA certificates with an external CA in the AWS Certificate Manager Private Certificate Authority User Guide.
10. To use a certificate for something other than securing a public website
In this blog post, you learned about some of the reasons you might want to import a certificate into AWS Certificate Manager (ACM). For more information about importing certificates into ACM and step-by-step instructions, see Importing certificates into AWS Certificate Manager in the AWS Certificate Manager User Guide. For the latest pricing information, see the AWS Certificate Manager Pricing page on the AWS website. You can also use the AWS pricing calculator to estimate costs.
If you have feedback about this post, submit comments in the Comments section below. If you have questions about this post, start a new thread on the AWS Certificate Manager forum or contact AWS Support.
Want more AWS Security news? Follow us on Twitter.
Anticipating events that can cause a disruption to your system’s service is critical to building highly available, reliable systems. Hazard analysis gives you a method to identify such events. Chaos engineering gives you a method to confirm that a system behaves as expected in adverse conditions. By combining these methods, Vanguard is building reliability into their systems.
Vanguard engineering teams perform hazard analysis on their systems and capture the identified events as failure scenarios. They use the identified failure scenarios to create hypotheses to support chaos engineering experiments. These hypotheses predict how the system will respond to failures and each hypothesis is then confirmed through experimentation to increase the team’s confidence in the system’s reliability.
In this article we will walk you through how Vanguard uses hazard analysis and chaos engineering. We will also provide guidance on how you can employ these techniques on your applications.
Failure Mode & Effects Analysis
A hazard analysis can be performed using different methods. At Vanguard, they have adapted the failure mode & effects analysis (FMEA) method to support their important services.
FMEA is a bottom-up approach to analyse an architecture and focus on the impact to system functions when one or more components of the system are disrupted. Members of the engineering team and architects responsible for designing and building a system brainstorm possible failure scenarios or failure modes, and document the impact of these failures on the system. Combined with a quantitative method for ranking the failure modes, the analysis process produces a prioritised list of failure modes which describes how the system would respond to individual or combined failures in its component parts or dependencies.
For each failure mode the team conducting the analysis will highlight what protections exist within the system to guard against the failure mode. Sometimes, fault isolation boundaries have been put in place to prevent client impact in failure scenarios. In other scenarios, for one reason or another, there are hard dependencies in place for which the engineering team has decided not to build in fault tolerance. For example, a team responsible for a less-critical function may have architected its system to operate across multiple availability zones, but could decide not to implement other mitigations to prioritize cost over increased resilience.
The FMEA method has been in use by engineers in the automotive, aeronautical, healthcare, and military industries for more than 60 years. Over that time, FMEA has been modified to best suit the organization and the field in which it was applied. In many variations the FMEA measures each failure mode with a risk priority number (RPN), which is intended to quantitatively rank the failure mode based upon:
The failure mode’s impact to the system as a whole
The probability of the failure mode’s occurrence
How easily the failure mode can be detected
Vanguard have adapted the FMEA process to serve their own specific requirements and processes. Vanguard have decided not to adopt the RPN element of the FMEA process, as teams found they spent a lot of time debating the impact, probability, and detectability of individual failure modes. To perform an FMEA more quickly, teams instead focus on the failure modes and system impact only, documenting a mental model of system performance which can be experimented through chaos engineering.
An excerpt of a Vanguard FMEA output is provided as an example in the following table:
The “Process Step” in the table above refers to a business function of the system being analyzed, for example “Request to retrieve stored data”. As part of the analysis, the team identifies the system components needed to perform the Process Step and considers the interactions of those components Focusing on a Process Step makes it easier to anticipate the failure scenarios that would affect the system in performing this particular business function. Also, the Process Step will imply an importance or criticality which can be a factor when prioritizing mitigations.
After selecting a Process Step, you walk through the system components involved and identify how component failures or disruptions will affect the wider system. Such component failures may involve individual components or a combination of components and are captured as “Failure Mode”. This identifies the component or components that are disrupted and their behaviour; for example, “Microservice is unavailable or returns an error”.
“Expected Behaviour” describes the effect of the failure mode on the wider system, in the context of the Process Step. This captures what other system components are affected by the Failure Mode and why, and how this impacts the Process Step as a whole.
Lastly, the “Hypothesis” column forms the basis for the chaos experiments that will follow from the FMEA to confirm that the system performs as expected.
At Vanguard, all mission-critical product teams are conducting FMEAs for their production applications. The outputs of these sessions are maintained over time and serve multiple purposes:
When onboarding new team members, it is helpful to provide the FMEA document alongside an architecture diagram and narrative. It will paint a more robust picture of how the system is intended to operate in both “happy path” and “unhappy path” scenarios.
When troubleshooting incidents, an FMEA document can help on-call engineers – especially those less experienced with debugging – to match up the documented expectations to the observed system behavior.
Site Reliability Engineers (SREs) looking for opportunities to improve the resilience of a system might look to FMEA documentation to understand the existing fault isolation boundaries and introduce additional resilience mechanisms through automation and system changes.
Finally, when selecting scenarios for experimentation with Chaos Engineering, the FMEA document provides a list of conjectures that have been mapped to hypotheses, ready to be validated through experimentation. This input into the Chaos Engineering workflow is the primary use of FMEA documents for Vanguard product teams.
There are many resources available online to learn more about how FMEA is used and applied in other organisations. In Failure Modes and Continuous Resilience, Adrian Cockcroft introduces FMEA as a method for anticipating failure scenarios. The NASA Software Engineering Handbook details how FMEAs are conducted as part of their engineering process. The Automotive Industry Group has also formally documented the use of FMEA in the Automotive Industry Action Group FMEA Handbook.
Chaos Engineering
After failure modes have been identified and mitigated through system design, it’s time to understand how resilient the system’s implementation is to those failure modes. Chaos engineering can be used to explore a system and validate that a system’s implementation meets business resiliency objectives.
Chaos engineering helps to improve a team’s mental model about the system under experimentation and provides insights into how a complex system behaves under adverse conditions. It also enables an engineer to find the unknown unknowns and the known unknowns through experiments that are built on top of the hypothesis. These experiments should simulate real world events, such as network degradation and increased client requests, and the outcome of the experiment should not be known. In other words, an experiment is not an experiment if it’s known that the conditions will cause the system to fail.
Prerequisites to Chaos Experiments at Vanguard
At Vanguard, there are some necessary prerequisites to running a chaos experiment. Firstly, the system under experiment must be set up with some basic observability tooling that will allow teams to monitor the state of the application during the failure injection. This could be as simple as an Amazon CloudWatch dashboard and some associated alarms, or as elaborate as a dedicated dashboard set up in a vendor tool.
Secondly, teams must be able to drive load to the application during the experiment; depending on the experiment type, the level and type of load may vary. The load generator can be as simple as a script on someone’s machine, or a fully automated load test depending on the requirements of the hypothesis.
Finally, teams need to have a good understanding of what the application’s “steady state” looks like. I Ideally, this takes the form of some metrics such as expected error rate, expected latency, and/or a service level objective (SLO) that can be monitored throughout the duration of the experiment. For example, a service level objective for a RESTful API might be that 90% of requests should receive a response within 100 milliseconds.
With the prerequisites met and a completed FMEA, teams can then experiment with their hypothesis using various experiment templates defined by Vanguard’s Climate of Chaos tooling.
Vanguard’s Climate of Chaos
At Vanguard, ensuring its software systems are resilient to adverse events is a critical part of its ongoing mission to provide world-class service to their clients. Vanguard believes that in order to develop high quality software, one must plan for the inevitable “stormy weather” events that occur in a distributed system.
Over the past 2 years, as a response to this need, Vanguard has developed in-house tooling called “The Climate of Chaos” to give teams easy access to common experiment templates, along with a friendly UI interface. The Climate of Chaos helps developers experiment on their systems and validate the hypotheses generated from FMEAs. It also provides the tooling for them to simulate the most common failure scenarios on Vanguard’s most commonly utilized AWS infrastructure, including Amazon Elastic Container Service (Amazon ECS), AWS Fargate, Amazon DynamoDB, Amazon Relational Database Service (Amazon RDS), AWS Lambda, and others.
The Climate of Chaos was created prior to Amazon’s release of the AWS Fault Injection Simulator (FIS), and today there is a lot of overlap with the experiment capabilities available in FIS. The Climate of Chaos has also been enhanced with company-specific features and integrations that make it easier for Vanguard developers to run chaos experiments in a controlled and predictable manner.
The Climate of Chaos includes important safety features such as an “emergency stop” function. This feature enables teams to terminate the experiment immediately if unintended side effects are encountered, rolling back the events simulated to resume steady state operation. The Climate of Chaos has been coupled with other systems like an in-house load testing tooling and added features like the ability to monitor CloudWatch alarms. Vanguard also offers teams the ability to schedule experiments to run at their convenience. Soon, Vanguard hopes to make running chaos experiments even smarter, introducing tools that will help teams run bulk experiments that systematically inject failures on a group of related applications to help pinpoint more complex failure modes.
Next Steps
Failure modes and effects analysis is a hazard analysis method which can help you identify single and combined points of failure in your system so you can prioritize the failure modes. To learn more about the FMEA process, you can read the NASA Software Engineering Handbook which outlines how they perform FMEA on their software-based systems. The AWS Whitepaper Building Mission-Critical Financial Services Applications on AWS provides example forms and suggestions for severity, probability, and detectability rankings. Appendix F in the whitepaper suggests a 1 to 10 ranking for each Risk Priority Number input, and the example spreadsheets recommend performing FMEAs for the application, platform, infrastructure, and operation layers of the system. Using these examples, you can perform an analysis of your own systems and generate hypotheses.
To experiment on your systems and validate your own hypotheses, you can use the AWS Fault Injection Simulator (FIS) mentioned earlier in this article. FIS provides you with a framework for performing controlled chaos experiments on your AWS workloads. It helps you to safely manage your experiments by providing tooling to monitor, rollback, and orchestrate chaos experiments. FIS provides the fault injection mechanisms that you will need to experiment upon your system’s implementation and resilience to identified failure modes. You can start by running experiments in pre-production environments, and then step up to running them as part of your CI/CD workflow and ultimately in your production environment. To learn more about FIS, you can read the FIS User Guide and FIS tutorials.
By using FMEA to anticipate the failures and experimenting on your systems with chaos engineering, you will gain confidence in the reliability of your system.
The content and opinions in this post are those of The Vanguard Group and AWS is not responsible for the content or accuracy of this post.
AWS Certificate Manager (ACM) is a managed service that lets you provision, manage, and deploy public and private Secure Sockets Layer/Transport Layer Security (SSL/TLS) certificates for use with Amazon Web Services (AWS) and your internal connected resources. Starting October 11, 2022, at 9:00 AM Pacific Time, public certificates obtained through ACM will be issued from one of the multiple intermediate certificate authorities (CAs) that Amazon manages. In this blog post, we share important details about this change and how you can prepare.
What is changing and why?
Public certificates that you request through ACM are obtained from Amazon Trust Services, which is a public certificate authority (CA) that Amazon manages. Like other public CAs, Amazon Trust Services CAs have a structured trust hierarchy. The public certificate issued to you, also known as the leaf certificate, can chain to one or more intermediate CAs and then to the Amazon Trust Services root CA. The Amazon Trust Services root CA is trusted by default by most and operating systems. This is why Amazon can issue public certificates that are trusted by these systems.
Starting October 11, 2022 at 9:00 AM Pacific Time, public certificates obtained through ACM will be issued from one of the multiple intermediate CAs that Amazon manages. These intermediate CAs chain to an existing Amazon Trust Services root CA. With this change, leaf certificates issued to you will be signed by different intermediate CAs. Before this change, Amazon maintained a limited number of intermediate CAs and issued and renewed certificates from the same intermediate CAs.
Amazon is making this change to create a more resilient and agile certificate infrastructure that will help us respond more quickly to future requirements. This change also presents an opportunity to correct a known issue related to delayed revocation of a subordinate CA and help minimize the scope of impact for new risks that might emerge in the future.
What can I do to prepare?
Most customers won’t experience an impact from this change. Browsers and most applications will continue to work just as they do now, because these services trust the Amazon Trust Services root CA and not a specific intermediate CA. If you’re using one of the standard operating systems and web browsers that are listed in the next section of this post, you don’t need to take any action.
If you use intermediate CA information through certificate pinning, you will need to make changes and pin to an Amazon Trust Services root CA instead of an intermediate CA or leaf certificate. Certificate pinning is a process in which your application that initiates the TLS connection only trusts a specific public certificate through one or more certificate variables that you define. If the pinned certificate is replaced, your application won’t initiate the connection. AWS recommends that you don’t use certificate pinning because it introduces an availability risk. However, if your use case requires certificate pinning, AWS recommends that you pin to an Amazon Trust Services root CA instead of an intermediate CA or leaf certificate. When you pin to an Amazon Trust Services root CA, you should pin to all of the root CAs shown in the following table.
To test that your trust store contains the Amazon Trust Services root CA, see the preceding table, which lists the Amazon Trust Services root CA certificates, and choose each test URL in the table. If the test URL works, you should see a message that says Expected Status: Good, along with the certificate chain. If the test URL doesn’t work, you will receive an error message that indicates the connection has failed.
What should I do if the Amazon Trust Services CAs are not in my trust store?
If your application is using a custom trust store, you must add the Amazon Trust Services root CAs to your application’s trust store. The instructions for doing this vary based on the application or service. Refer to the documentation for the application or service that you’re using.
If your tests of any of the test URLs failed, you must update your trust store. The simplest way to update your trust store is to upgrade the operating system or browser that you’re using.
The following operating systems use the Amazon Trust Services CAs:
Amazon Linux (all versions)
Microsoft Windows versions, with updates installed, from January 2005, Windows Vista, Windows 7, Windows Server 2008, and newer versions
Mac OS X 10.4 with Java for Mac OS X 10.4 Release 5, Mac OS X 10.5, and newer versions
Red Hat Enterprise Linux 5 (March 2007 release), Linux 6, and Linux 7 and CentOS 5, CentOS 6, and CentOS 7
Ubuntu 8.10
Debian 5.0
Java 1.4.2_12, Java 5 update 2, and all newer versions, including Java 6, Java 7, and Java 8
Modern browsers trust Amazon Trust Services CAs. To update the certificate bundle in your browser, update your browser. For instructions on how to update your browser, see the update page for your browser:
The Windows operating system manages certificate bundles for Internet Explorer and Microsoft Edge, so to update your browser, you must update Windows.
Where can I get help?
If you have questions, contact AWS Support or your technical account manager (TAM), or start a new thread on the AWS re:Post ACM Forum. If you have feedback about this post, submit comments in the Comments section below.
Want more AWS Security news? Follow us on Twitter.
Jenkins is a popular open-source automation server that provides hundreds of plugins to support building, testing, deploying, and automation. Jenkins uses a controller-agent architecture in which the controller is responsible for serving the web UI, stores the configurations and related data on disk, and delegates the jobs to the worker agents that run these jobs as their primary responsibility.
Amazon Elastic Container Service (Amazon ECS) using Fargate is a fully-managed container orchestration service that helps you easily deploy, manage, and scale containerized applications. It deeply integrates with the rest of the AWS platform to provide a secure and easy-to-use solution for running container workloads in the cloud and now on your infrastructure. Fargate is a serverless, pay-as-you-go compute engine that lets you focus on building applications without managing servers. Fargate is compatible with both Amazon ECS and Amazon Elastic Kubernetes Service (Amazon EKS).
Solution overview
The following diagram illustrates the solution architecture. The dashed lines indicate the AWS CDK deployment.
Figure 1 This diagram shows AWS CDK and how it deploys using AWS CloudFormation to create the Elastic Load Balancer, AWS Fargate, and Amazon EFS
The Jenkins controller runs as a service in Amazon ECS using Fargate as the launch type. You’ll use Amazon Elastic File System (Amazon EFS) as the persistent backing store for the Jenkins controller task. The Jenkins controller and Amazon EFS are launched in private subnets.
Prerequisites
For this post, you’ll utilize AWS CDK using TypeScript.
Let’s review the code used to define the Jenkins environment in AWS using the AWS CDK.
Setup your imports
import { Duration, IResource, RemovalPolicy, Stack, Tags } from 'aws-cdk-lib';
import { Construct } from 'constructs';
import * as cdk from 'aws-cdk-lib';
import * as ecs from 'aws-cdk-lib/aws-ecs';
import * as efs from 'aws-cdk-lib/aws-efs';
import { Port } from 'aws-cdk-lib/aws-ec2';
import * as elbv2 from 'aws-cdk-lib/aws-elasticloadbalancingv2';
Setup your Amazon ECS, which is a logical grouping of tasks or services and set vpc
Setup Access Point, which are application-specific entry points into an Amazon EFS file system that makes it easier to manage application access to shared datasets
This blog post shows how to set up an Amazon Elastic Kubernetes Service (Amazon EKS) cluster such that the applications hosted on the cluster can have their outbound internet access restricted to a set of hostnames provided by the Server Name Indication (SNI) in the allow list in the AWS Network Firewall rules. For encrypted web traffic, SNI can be used for blocking access to specific sites in the network firewall. SNI is an extension to TLS that remains unencrypted in the traffic flow and indicates the destination hostname a client is attempting to access over HTTPS.
This post also shows you how to use Network Firewall to collect hostnames of the specific sites that are being accessed by your application. Securing outbound traffic to specific hostnames is called egress filtering. In computer networking, egress filtering is the practice of monitoring and potentially restricting the flow of information outbound from one network to another. Securing outbound traffic is usually done by means of a firewall that blocks packets that fail to meet certain security requirements. One such firewall is AWS Network Firewall, a managed service that you can use to deploy essential network protections for all of your VPCs that you create with Amazon Virtual Private Cloud (Amazon VPC).
Example scenario
You have the option to scan your application traffic by the identifier of the requested SSL certificate, which makes you independent from the relationship of the IP address to the certificate. The certificate could be served from any IP address. Traditional stateful packet filters are not able to follow the changing IP address of the endpoints. Therefore, the host name information that you get from the SNI becomes important in making security decisions. Amazon EKS has gained popularity for running containerized workloads in the AWS Cloud, and you can restrict outbound traffic to only the known hostnames provided by SNI. This post will walk you through the process of setting up the EKS cluster in two different subnets so that your software can use the additional traffic routing in the VPC and traffic filtering through Network Firewall.
Solution architecture
The architecture illustrated in Figure 1 shows a VPC with three subnets in Availability Zone A, and three subnets in Availability Zone B. There are two public subnets where Network Firewall endpoints are deployed, two private subnets where the worker nodes for the EKS cluster are deployed, and two protected subnets where NAT gateways are deployed.
Figure 1: Outbound internet access through Network Firewall from Amazon EKS worker nodes
The workflow in the architecture for outbound access to a third-party service is as follows:
The outbound request originates from the application running in the private subnet (for example, to https://aws.amazon.com) and is passed to the NAT gateway in the protected subnet.
The HTTPS traffic received in the protected subnet is routed to the AWS Network Firewall endpoint in the public subnet.
The network firewall computes the rules, and either accepts or declines the request to pass to the internet gateway.
If the request is passed, the application-requested URL (provided by SNI in the non-encrypted HTTPS header) is allowed in the network firewall, and successfully reaches the third-party server for access.
The VPC settings for this blog post follow the recommendation for using public and private subnets described in Creating a VPC for your Amazon EKS cluster in the Amazon EKS User Guide, but with additional subnets called protected subnets. Instead of placing the NAT gateway in a public subnet, it will be placed in the protected subnet, and the Network Firewall endpoints in the public subnet will filter the egress traffic that flows through the NAT gateway. This design pattern adds further checks and could be a recommendation for your VPC setup.
As suggested in Creating a VPC for your Amazon EKS cluster, using the Public and private subnets option allows you to deploy your worker nodes to private subnets, and allows Kubernetes to deploy load balancers to the public subnets. This arrangement can load-balance traffic to pods that are running on nodes in the private subnets. As shown in Figure 1, the solution uses an additional subnet named the protected subnet, apart from the public and private subnets. The protected subnet is a VPC subnet deployed between the public subnet and private subnet. The outbound internet traffic that is routed through the protected subnet is rerouted to the Network Firewall endpoint hosted within the public subnet. You can use the same strategy mentioned in Creating a VPC for your Amazon EKS cluster to place different AWS resources within private subnets and public subnets. The main difference in this solution is that you place the NAT gateway in a separate protected subnet, between private subnets, and place Network Firewall endpoints in the public subnets to filter traffic in the network firewall. The NAT gateway’s IP address is still preserved, and could still be used for adding to the allow list of third-party entities that need connectivity for the applications running on the EKS worker nodes.
To see a practical example of how the outbound traffic is filtered based on the hosted names provided by SNI, follow the steps in the following Deploy a sample section. You will deploy an AWS CloudFormation template that deploys the solution architecture, consisting of the VPC components, EKS cluster components, and the Network Firewall components. When that’s complete, you can deploy a sample app running on Amazon EKS to test egress traffic filtering through AWS Network Firewall.
Deploy a sample to test the network firewall
Follow the steps in this section to perform a sample app deployment to test the use case of securing outbound traffic through AWS Network Firewall.
Prerequisites
The prerequisite actions required for the sample deployment are as follows:
Make sure you have the AWS CLI installed, and configure access to your AWS account.
Copy the necessary CloudFormation templates and the sample eksctl config files from the blog’s Amazon S3 bucket to your local file system. You can do this by using the following AWS CLI S3 cp command. aws s3 cp s3://awsiammedia/public/sample/803-network-firewall-to-filter-outbound-traffic/config.yaml . aws s3 cp s3://awsiammedia/public/sample/803-network-firewall-to-filter-outbound-traffic/lambda_function.py . aws s3 cp s3://awsiammedia/public/sample/803-network-firewall-to-filter-outbound-traffic/network-firewall-eks-collect-all.yaml . aws s3 cp s3://awsiammedia/public/sample/803-network-firewall-to-filter-outbound-traffic/network-firewall-eks.yaml .
Important: This command will download the S3 bucket contents to the current directory on your terminal, so the “.” (dot) in the command is very important.
Once this is complete, you should be able to see the list of files shown in Figure 2. (The list includes config.yaml, lambda_function.py, network-firewall-eks-collect-all.yaml, and network-firewall-eks.yaml.)
Figure 2: Files downloaded from the S3 bucket
Deploy the VPC architecture with AWS Network Firewall
In this procedure, you’ll deploy the VPC architecture by using a CloudFormation template.
To deploy the VPC architecture (AWS CLI)
Deploy the CloudFormation templatenetwork-firewall-eks.yaml, which you previously downloaded to your local file system from the Amazon S3 bucket.
You can do this through the AWS CLI by using the create-stack command, as follows.
Note: The initially allowed hostnames for egress filtering are passed to the network firewall by using the parameter key NetworkFirewallAllowedWebsites in the CloudFormation stack. In this example, the allowed hostnames are .amazonaws.com, .docker.io, and docker.com.
Make a note of the subnet IDs from the stack outputs of the CloudFormation stack after the status goes to Create_Complete.
Note: For simplicity, the CloudFormation stack name is AWS-Network-Firewall-Multi-AZ, but you can change this name to according to your needs and follow the same naming throughout this post.
To deploy the VPC architecture (console)
In your account, launch the AWS CloudFormation template by choosing the following Launch Stack button. It will take approximately 10 minutes for the CloudFormation stack to complete.
Note: The stack will launch in the N. Virginia (us-east-1) Region. To deploy this solution into other AWS Regions, download the solution’s CloudFormation template, modify it, and deploy it to the selected Region.
Deploy and set up access to the EKS cluster
In this step, you’ll use the eksctl CLI tool to create an EKS cluster.
There are two methods for creating an EKS cluster. Method A uses the eksctl create cluster command without a configuration (config) file. Method B uses a config file.
Note: Before you start, make sure you have the VPC subnet details available from the previous procedure.
Method A: No config file
You can create an EKS cluster without a config file by using the eksctl create cluster command.
From the CLI, enter the following commands. eksctl create cluster \ --vpc-private-subnets=<private-subnet-A>,<private-subnet-B> \ --vpc-public-subnets=<public-subnet-A>,<public-subnet-B>
Make sure that the subnets passed to the --vpc-public-subnets parameter are protected subnets taken from the VPC architecture CloudFormation stack output. You can verify the subnet IDs by looking at step 2 in the To deploy the VPC architecture section.
Method B: With config file
Another way to create an EKS cluster is by using the following config file, with more options with the name (cluster.yaml in this example).
Create a file named cluster.yaml by adding the following contents to it.
Run the following command to create an EKS cluster using the eksctl tool and the cluster.yaml config file. eksctl create cluster -f cluster.yaml
To set up access to the EKS cluster
Before you deploy a sample Kubernetes Pod, make sure you have the kubeconfig file set up for the EKS cluster that you created in step 2 of To deploy an EKS cluster by using the eksctl tool. For more information, see Create a kubeconfig for Amazon EKS. You can use eksctl to do this, as follows.
Now you can test access to a non-allowed website in the AWS Network Firewall stateful rules, using these steps.
First, install the cURL tool on the sample Pod you created previously. cURL is a command-line tool for getting or sending data, including files, using URL syntax. Because cURL uses the libcurl library, it supports every protocol libcurl supports. On the Pod where you have obtained a shell to a running container, run the following command to install cURL. apk install curl
Access a website using cURL. curl -I https://aws.amazon.com
This gives a timeout error similar to the following.
curl -I https://aws.amazon.com curl: (28) Operation timed out after 300476 milliseconds with 0 out of 0 bytes received
Navigate to the AWS CloudWatch console and check the alert logs for Network Firewall. You will see a log entry like the following sample, indicating that the access to https://aws.amazon.com was blocked.
The error shown here occurred because the hostname www.amazon.com was not added to the Network Firewall stateful rules allow list.
When you deployed the network firewall in step 1 of the To deploy the VPC architecture procedure, the values provided for the CloudFormation parameter NetworkFirewallAllowedWebsites were just .amazonaws.com, .docker.io, .docker.com and not aws.amazon.com.
Update the Network Firewall stateful rules
In this procedure, you’ll update the Network Firewall stateful rules to allow the aws.amazon.com domain name.
To update the Network Firewall stateful rules (console)
In the AWS CloudFormation console, locate the stack you used to create the network firewall earlier in the To deploy the VPC architecture procedure.
Select the stack you want to update, and choose Update. In the Parameters section, update the stack by adding the hostname aws.amazon.com to the parameter NetworkFirewallAllowedWebsites as a comma-separated value. See Updating stacks directly in the AWS CloudFormation User Guide for more information on stack updates.
To test the outbound access to the aws.amazon.com hostname
Get a shell to a running container in the sample Pod that you deployed earlier, by using the following command. kubectl attach amazon-linux -c alpine -i -t
On the terminal where you got a shell to a running container in the sample Pod, run the following cURL command. curl -I https://aws.amazon.com
The response should be a success HTTP 200 OK message similar to this one. curl -Ik https://aws.amazon.com HTTP/2 200 content-type: text/html;charset=UTF-8 server: Server
If the VPC subnets are organized according to the architecture suggested in this solution, outbound traffic from the EKS cluster can be sent to the network firewall and then filtered based on hostnames provided by SNI.
Collecting hostnames provided by the SNI
In this step, you’ll see how to configure the network firewall to collect all the hostnames provided by SNI that are accessed by an already running application—without blocking any access—by making use of CloudWatch and alert logs.
Select the stack to update, and then choose Update.
Choose Replace current template and upload the template network-firewall-eks-collect-all.yaml. (This template should be available from the files that you downloaded earlier from the S3 bucket in the Prerequisites section.) Choose Next. See Updating stacks directly for more information.
To configure the network firewall (AWS CLI)
Update the CloudFormation stack by using the network-firewall-eks-collect-all.yaml template file that you previously downloaded from the S3 bucket in the Prerequisites section, using the update-stack command as follows. aws cloudformation update-stack --stack-name AWS-Network-Firewall-Multi-AZ \ --template-body file://network-firewall-eks-collect-all.yaml \ --capabilities CAPABILITY_NAMED_IAM
To check the rules in the AWS Management Console
In the AWS Management Console, navigate to the Amazon VPC console and locate the AWS Network Firewall tab.
Select the network firewall that you created earlier, and then select the stateful rule with the name log-all-tls.
The rule group should appear as shown in Figure 4, indicating that the logs are captured and sent to the Alert logs.
Figure 4: Network Firewall rule groups
To test based on stateful rule
On the terminal, get the shell for the running container in the Pod you created earlier. If this Pod is not available, follow the instructions in the To deploy a sample Pod on the EKS clusterprocedure to create a new sample Pod.
Run the cURL command to aws.amazon.com. It should return HTTP 200 OK, as follows. curl -Ik https://aws.amazon.com/ HTTP/2 200 content-type: text/html;charset=UTF-8 server: Server date: ------ ---------- --------------
Navigate to the AWS CloudWatch Logs console and look up the Alert logs log group with the name /AWS-Network-Firewall-Multi-AZ/anfw/alert.
You can see the hostnames provided by SNI within the TLS protocol passing through the network firewall. The CloudWatch Alert logs for allowed hostnames in the SNI looks like the following example.
Figure 5: Architecture to collect and capture hostnames by using Network Firewall
Sample Lambda code
The sample Lambda code from Figure 5 is shown following, and is written in Python 3. The sample collects the hostnames that are provided by SNI and captured in Network Firewall. Network Firewall logs the hostnames provided by SNI in the CloudWatch Alert logs. Then, by creating a CloudWatch logs subscription filter, you can send logs to the Lambda function for further processing, for example to invoke SNS notifications.
import json
import gzip
import base64
import boto3
import sys
import traceback
sns_client = boto3.client('sns')
def lambda_handler(event, context):
try:
decoded_event = json.loads(gzip.decompress(base64.b64decode(event['awslogs']['data'])))
body = '''
{filtermatch}
'''.format(
loggroup=decoded_event['logGroup'],
logstream=decoded_event['logStream'],
filtermatch=decoded_event['logEvents'][0]['message'],
)
# print(body)# uncomment this for debugging
filterMatch = json.loads(body)
data = []
if 'http' in filterMatch['event']:
data.append(filterMatch['event']['http']['hostname'])
elif 'tls' in filterMatch['event']:
data.append(filterMatch['event']['tls']['sni'])
result = 'Trying to reach ' + 1*' ' + (data[0]) + 1*' ' 'via Network Firewall' + 1*' ' + (filterMatch['firewall_name'])
# print(result)# uncomment this for debugging
message = {'HostName': result}
send_to_sns = sns_client.publish(
TargetArn='<SNS-topic-ARN>', #Replace with the SNS topic ARN
Message=json.dumps({'default': json.dumps(message),
'sms': json.dumps(message),
'email': json.dumps(message)}),
Subject='Trying to reach the hostname through the Network Firewall',
MessageStructure='json')
except Exception as e:
print('Function failed due to exception.')
e = sys.exc_info()[0]
print(e)
traceback.print_exc()
Status="Failure"
Message=("Error occured while executing this. The error is %s" %e)
Clean up
In this step, you’ll clean up the infrastructure that was created as part of this solution.
To delete the Kubernetes workloads
On the terminal, using the kubectl CLI tool, run the following command to delete the sample Pod that you created earlier. kubectl delete pods amazon-linux
Note: Clean up all the Kubernetes workloads running on the EKS cluster. For example, if the Kubernetes service of type LoadBalancer is deployed, and if the EKS cluster where it exists is deleted, the LoadBalancer will not be deleted. The best practice is to clean up all the deployed workloads.
On the terminal, using the eksctl CLI tool, delete the created EKS cluster by using the following command. eksctl delete cluster --name filter-egress-traffic-test
To delete the CloudFormation stack and AWS Network Firewall
Navigate to the AWS CloudFormation console and choose the stack with the name AWS-Network-Firewall-Multi-AZ.
By following the VPC architecture explained in this blog post, you can protect the applications running on an Amazon EKS cluster by filtering the outbound traffic based on the approved hostnames that are provided by SNI in the Network Firewall Allow list.
Additionally, with a simple Lambda function, CloudWatch Logs, and an SNS topic, you can get readable hostnames provided by the SNI. Using these hostnames, you can learn about the traffic pattern for the applications that are running within the EKS cluster, and later create a strict list to allow only the required outbound traffic. To learn more about Network Firewall stateful rules, see Working with stateful rule groups in AWS Network Firewall in the AWS Network Firewall Developer Guide.
If you have feedback about this post, submit comments in the Comments section below. If you have questions about this post, contact AWS Support.
Want more AWS Security news? Follow us on Twitter.
Amazon QuickSight is a fully-managed, cloud-native business intelligence (BI) service that makes it easy to create and deliver insights to everyone in your organization or even with your customers and partners. You can make your data come to life with rich interactive charts and create beautiful dashboards to be shared with thousands of users, either directly within the QuickSight application, or embedded in web apps and portals.
Line charts are ubiquitous to the world of data visualization and are used to visualize change in data over a dimension. They are a great way to analyze trends and patterns where data points are connected with a straight line to visualize the overall trend. In this post, we look at some of the new improvements to our line charts:
Support for missing data points for line and area charts
Improved performance and increased data limit to 10,000 data points
Missing data points
Line charts in QuickSight expect you to have data for each X axis item. If data is missing for any X axis item, it can lead to broken lines (default behavior) because there is no line drawn connecting the missing data points.
Drawing lines with points of missing data could be misleading because it would represent incorrect data, and there are valid use cases to do so. For example, imagine a scenario of a retail sales report for a given time period where data is recorded during days of operation (Monday through Saturday). In such cases, instead of displaying a broken line chart that skips Sunday, you may want to show a continuous trend by directly connecting Saturday to Monday, hiding the fact that Sunday isn’t operational. Alternatively, you may want to view store traffic for Sunday as 0 instead of displaying a broken line.
Previously, line charts only supported treating missing data for date/time fields. Now, we have added support for categorical data for both line and area charts. The following are the different line treatment options:
Continuous line – Display continuous lines by directly connecting the line to the next available data point in the series
Show as zero – Interpolate the missing values with zero and display a continuous line
Broken line – Retain the default experience to display disjointed lines over missing values
The following diagram illustrates a line chart using each option.
This new feature applies for both categorical and time series data on area charts as well, as shown in the following graphs.
Authors can also configure different data treatments for the left and right Y axis for dual axis charts, as shown in the following example.
Increased data limit for line charts
With the recent update, we have improved line chart performance to support a maximum of 10,000 data points instead of the previous 2,500 data point limit. This also increases the limit for more line series created by the Color by field, which is also bound by the total data limit. For example, if the line chart has 1,000 data points for each series, you could display up to 10 unique colored series.
This update enables use cases where authors want to show a higher number of data points, such as hourly trends or daily trends for a year (365 data points) for multiple groups. This update doesn’t change the default limits of the Color by field (25) and X axis data point limit (100) that exist today to be compatible with existing dashboards and analysis, until authors choose to customize the limits.
Summary
In this post, we looked at how to treat missing data for line charts, where instead of viewing broken lines, you can display continuous lines. This helps you customize how you want to visualize overall trends and variations depending on the business context. Additionally, we looked at the new data handling limit for line charts, which supports 10,000 data points—four times more data than before. To learn more refer customizing missing data control.
Try out the new feature and share your feedback and questions in the comments section.
About the author
Bhupinder Chadha is a senior product manager for Amazon QuickSight focused on visualization and front end experiences. He is passionate about BI, data visualization and low-code/no-code experiences. Prior to QuickSight he was the lead product manager for Inforiver, responsible for building a enterprise BI product from ground up. Bhupinder started his career in presales, followed by a small gig in consulting and then PM for xViz, an add on visualization product.
After the solution is deployed, it works as follows:
The scheduled rule invokes the Lambda function every 5 minutes to fetch the latest domain list available.
The Lambda function fetches the list from URLhaus, parses the data retrieved, formats the data, uploads the list of domains into the S3 bucket, and invokes the Route 53 Resolver DNS Firewall importFirewallDomains API action.
The domain list is then updated.
Implementation steps
As a first step, create your own domain list on the Route 53 Resolver DNS Firewall. Having your own domain list allows you to have full control of the list of domains to which you want to apply actions, as defined within rule groups.
To create your own domain list
In the Route 53 console, in the left menu, choose Domain lists in the DNS firewall section.
Choose the Add domain list button, enter a name for your owned domain list, and then enter a placeholder domain to initialize the domain list.
Choose Add domain list to finalize the creation of the domain list.
Figure 2: Expected view of the console
The list from URLhaus contains more than a thousand records. You will use the ImportFirewallDomains endpoint to upload this list to DNS Firewall. The use of the ImportFirewallDomains endpoint requires that you first upload the list of domains and make the list available in an S3 bucket that is located in the same AWS Region as the owned domain list that you just created.
Follow the steps in the topic Creating an execution role in the IAM console to create an execution role. After step 4, when you configure permissions, choose Create Policy, and then create and add an IAM policy similar to the following example. This policy needs to:
(Optional) If you decide to use the example provided by AWS:
After cloning the repository: Build the layer following the instruction included in the readme.md and the provided script.
Zip the lambda.
In the left menu, select Layers then Create Layer. Enter a name for the layer, then select Upload a .zip file. Choose to upload the layer (node-axios-layer.zip).
As a compatible runtime, select: Node.js 16.x.
Select Create
In the Lambda console, in the same Region as your domain list, choose Create function, and then do the following:
Choose your desired runtime and architecture.
(Optional) To use the code provided by AWS: Select Node.js 16.x as the runtime.
Choose Change the default execution role.
Choose Use an existing role, and then pick the role that you just created.
After the Lambda function is created, in the left menu of the Lambda console, choose Functions, and then select the function you created.
For Code source, you can either enter the code of the Lambda function or choose the Upload from button and then choose the source for the code. AWS provides an example of functioning code on GitHub under a MIT-0 license.
(optional) To use the code provided by AWS:
Choose the Upload from button and upload the zipped code example.
After the code is uploaded, edit the default Runtime settings: Choose the Edit button and set the handler to be equal to: LambdaRpz.handler
Edit the default Layers configuration, choose the Add a layer button, select Specify an ARN and enter the ARN of the layer created during the optional step 2.
Edit the environment variables of the function: Select the Edit button and define the three following variables:
Key : FirewallDomainListId | Value : <domain-list-id>
Key : region | Value : <region>
Key : s3Prefix | Value : <DNSFW-BUCKET-NAME>
The code that you place in the function will be able to fetch the list from URLhaus, upload the list as a file to S3, and start the import of domains.
For the Lambda function to be invoked every 5 minutes, next you will create a scheduled rule with Amazon EventBridge.
To automate the invoking of the Lambda function
In the EventBridge console, in the same AWS Region as your domain list, choose Create rule.
For Rule type, choose Schedule.
For Schedule pattern, select the option A schedule that runs at a regular rate, such as every 10 minutes, and under Rate expression set a rate of 5 minutes.
Figure 3: Console view when configuring a schedule
To select the target, choose AWS service, choose Lambda function, and then select the function that you previously created.
After the solution is deployed, your domain list will be updated every 5 minutes and look like the view in Figure 4.
Figure 4: Console view of the created domain list after it has been updated by the Lambda function
If you haven’t done so already, create an S3 bucket to store the artifacts in the Region where you wish to deploy. This name of this bucket will then be referenced as ParamS3ArtifactBucket with a value of <DOC-EXAMPLE-BUCKET-ARTIFACT>
Clone the repository locally. git clone https://github.com/aws-samples/amazon-route-53-resolver-firewall-automation-examples-2
Build the Lambda function layer. From the /layer folder, use the provided script. . ./build-layer.sh
Zip and upload the artifact to the bucket created in step 1. From the root folder, use the provided script. . ./zipupload.sh <ParamS3ArtifactBucket>
Deploy the AWS CloudFormation stack by using either the AWS CLI or the CloudFormation console.
To deploy by using the AWS CLI, from the root folder, type the following command, making sure to replace <region>, <DOC-EXAMPLE-BUCKET-ARTIFACT>, <DNSFW-BUCKET-NAME>, and <DomainListName>with your own values.
In the CloudFormation console, choose Create stack, and then choose With new resources (standard).
On the creation screen, choose Template is ready, and upload the provided DNSFWStack.cfn.yaml file.
Enter a stack name and configure the requested parameters with your desired configuration and outcomes. These parameters include the following:
The name of your firewall domain list.
The name of the S3 bucket that contains Lambda artifacts.
The name of the S3 bucket that will be created to contain the files with the domain information from URLhaus.
Acknowledge that the template requires IAM permission because it will create the role for the Lambda function and manage its IAM policy, and then choose Create stack.
After a few minutes, all the resources should be created and the CloudFormation stack is now deployed. After 5 minutes, your domain list should be updated, as shown in Figure 5.
Figure 5: Console view of CloudFormation after the stack has been deployed
Conclusions and cost
In this blog post, you learned about creating and automating the update of a domain list that you fully control. To go further, you can extend and replicate the architecture pattern to fetch domain names from other sources by editing the source code of the Lambda function.
For cost information, see the AWS Pricing Calculator. This solution will be invoked 60 (minutes) * 24 (hours) * 30 (days) / 5 (minutes) = 8,640 times per month, invoking the Lambda function that will run for an average of 400 minutes, storing an average of 0.5 GB in Amazon S3, and creating a domain list that averages 1,500 domains. According to our public pricing, and without factoring in the AWS Free Tier, this will incur the estimated total cost of $1.43 per month for the filtering of 1 million DNS requests.
If you have feedback about this post, submit comments in the Comments section below. If you have questions about this post, contact AWS Support.
Want more AWS Security news? Follow us on Twitter.
If you use AWS IAM Identity Center (successor to AWS Single Sign-On) as your identity source, you create and manage your users and groups manually in the IAM Identity Center console. However, you may prefer to automate this process to save time, spend less administrative effort, and to scale effectively as your organization grows. If you use IAM Identity Center with a supported identity provider (IdP) or Microsoft Active Directory (AD), you may want to check if the right users and groups have synced into IAM Identity Center. You can do this manually, but now you can use the new APIs to make the process easier by setting up automated checks that query this information from IAM Identity Center and notify you only when you need to intervene.
This post explains how you can use IAM Identity Center APIs to automate managing users and groups in a scalable manner and gain better visibility into users and groups in the Identity Center directory. These automations can help you save time and reduce administrative effort. We will provide some background on how IAM Identity Center works and how you can use the new APIs to help simplify your workflows.
Background
IAM Identity Center allows you to centrally manage access to all of your AWS accounts within AWS Organizations or your applications. Using IAM Identity Center is the AWS recommendation for managing the workforce identities of the human users in your organization who access AWS resources. It provides you with the flexibility to create and manage users and groups in the Identity Center directory, or bring in your users and groups from a different identity source such as Active Directory or an external identity provider (IdP). After IAM Identity Center is configured, you can look up users or groups to grant them single sign-on access to AWS accounts, applications, or both. By signing-in once in the IAM Identity Center portal, your users can access their assigned AWS accounts, as well as Identity Center enabled applications such as Amazon SageMaker Studio or Amazon EMR Studio, as well as cloud applications such as Jira, Salesforce, and Tableau.
While IAM Identity Center simplifies user access, you may prefer to manage these users and groups at scale, and audit their access regularly to meet your security requirements. You may also want to automate the process of giving users access to AWS and the resources they need to do their job. Previously, you could only manage identities in the Identity Center directory manually by using the IAM Identity Center console. Now, you can use the new Identity Center APIs to build automation that manages the Identity Center directory users and groups for you.
With these Identity Center APIs, you can build automated workflows to do the following tasks:
Provision and de-provision users and groups.
Add new members to a group or remove them from a group.
Query information about users and groups in the Identity Center directory.
Update information about users and groups.
Find out which users are members of which groups.
You can create automated workflows using the APIs to define who has access to AWS accounts or applications through IAM Identity Center, and provide them with the right resources to do their job. Automating workflows can save you time and can reduce your administrative effort. With the new APIs, you can auto-generate reports about users and their IAM Identity Center access configurations. These automated reports can provide you with greater visibility to evaluate your security posture.
Provision, manage, and de-provision users and groups in IAM Identity Center
As your enterprise grows, you may want to automate your administrative tasks to reduce manual effort, save time, and scale efficiently. If you’re a cloud administrator or IT administrator who manages which employees in your organization need access to AWS as part of their job role, or what AWS resources they need so they can develop applications, now you can set up automated workflows that manage this for you.
Consider the following scenario. Your organization uses the Identity Center directory as the source for user information, and a new data scientist joins your company. You want them to be granted access to log in to AWS automatically based on their job role. After they log in, you want them to have access to the AWS resources and applications that you have approved for their job role, including Amazon SageMaker, AWS Managed Grafana, and multiple S3 buckets. Previously, you had to use the AWS Management Console to manually create a new user object and then add the new data scientist to the AWS_Data_Science group. With the new APIs, you can set up an automated workflow that creates a new user and adds the user to relevant groups in the Identity Center directory, as soon as the new data scientist is added to your human resources (HR) system.
A sample AWS Identity Store operations python script called identitystore_operations.py is available in the iam-identitycenter-identitystoreapi-operations GitHub repository. This sample program shows you how you can automate Identity Store operations to create a new user, add the user to a group, list group memberships, and update the user’s group memberships operations. This sample program requires the AWS SDK for Python (Boto3). For instructions to install the AWS SDK for Python, see the Boto3 Quickstart.
The following is an example to see all supported operations available in the sample script.
python identitystore_operations.py —h
The following is example output:
usage: identitystore_operations.py [-h]
{create_user,create_group,adduser_to_group,delete_group,list_members,list_membership}
...
positional arguments:
{create_user,create_group,adduser_to_group,delete_group,list_members,list_membership}
options:
-h, --help show this help message and exit
Next is an example of how you can create the new user John Doe in the Identity Center directory and add the user to an existing AWS_Data_Science group.
python identitystore_operations.py create_user --identitystoreid d-123456a7890 --username johndoe --givenname John --familyname Doe --groupname AWS_Data_Science
The following is example output:
User:johndoe with UserId:12345678-9012-3456-789a-bcdef021345a created successfully
User:johndoe added to Group:AWS_Data_Science successfully
To continue with this example, consider a scenario where the data scientist transitions to a role as an applied scientist, and needs access to additional AWS applications and resources. Rather than using the IAM Identity Center console to manually update the user’s information and add them to the AWS_Applied_Scientists group, you can now use automation to update the user and provide them with the access they need.
The following is an example of how the previously-created user johndoe can be added to the AWS_Applied_Scientists group.
User:johndoe added to Group:AWS_Applied_Scientists successfully
Finally for this scenario, consider that this employee leaves your company. Rather than using the IAM Identity Center console to manually delete their user object, now your automation can delete the user as soon as they are removed from your HR system.
Evaluate your security posture in IAM Identity Center
To maintain visibility across AWS, it is a best practice to regularly audit and evaluate the security controls for any service that you use. It’s also a best practice to identify the AWS accounts or applications that an employee can access. Having access to this information helps you maintain and improve your company’s security posture. As a cloud administrator, you may need to submit periodic reports to auditors enumerating the employees who have access to AWS. If you or your IT team manage users and groups in a different source system, you also need to track whether the right users and groups are synced into AWS.
The following is an example of how you can find the members of the AWS_Applied_Scientists group.
For example, consider a scenario in which you use Active Directory as your identity source. You want to confirm that the right set of users and groups have been synced into the Identity Center directory. After the users and groups are confirmed, you are required to submit this list of users and groups with access to AWS to auditors every quarter. Rather than manually verifying which employees have access to AWS and manually creating a list for the auditors, now you can use the new APIs to create a workflow that automatically queries the users and groups in the Identity Center directory, compares it to your list of intended Active Directory users and groups who should have AWS access, and provides you the information about whether there are any users or groups who have access that was not intended. Additionally, you can set up a script to generate reports every quarter for the auditors.
The following is an example of how you can find the group memberships of the specific user johndoe.
User :johndoe is a member of the following groups
AWS_Data_Science
AWS_Applied_Scientists
Conclusion
In this post, you learned how to use IAM Identity Center APIs to automate managing users and groups in a scalable manner and gain better visibility into users and groups in the Identity Center directory.
The IAM Identity Center APIs for user and group management expand the capabilities of existing Identity Store APIs, helping you build scalable workflows. They help your IT and cloud teams save time and reduce administrative effort through automation.
If you have feedback about this post, submit comments in the Comments section below. If you have questions about this post, start a new thread on AWS IAM Identity Center re:Post or contact AWS Support.
Want more AWS Security news? Follow us on Twitter.
605 is an independent TV measurement firm that offers advertising and content measurement, full-funnel attribution, media planning, optimization, and analytical solutions, all on top of their multi-source viewership data set covering over 21 million U.S. households. 605 has built their technology solutions on AWS with dozens of accounts and tens of thousands of resources to monitor.
As 605 continues to innovate and build new solutions, the size and complexity of their AWS deployment has also grown proportionally. Over time, managing their deployment has become an operational challenge for their current team. 605 has deployed different application performance monitoring (APM) tools and notification systems to help their observability staff scale and support their growing cloud environment. However, 605 realized that their continued growth on the cloud would necessitate either increasing their observability staff or assuming some risk of potential application performance issues or even outages.
Amazon DevOps Guru allowed 605 to find a third path forward. Rather than accepting the trade-off of hiring more staff or assuming more risk, 605 discovered that DevOps Guru provides an increase in operational efficiency using their existing staff resources by applying artificial intelligence (AI) to supplement their existing APM and notification platform. Layering DevOps Guru into their DevOps environment , 605 realized a 4-fold decrease in the number of alerts and notifications that proved to be false positives. In fact, 605 went from an environment where 76.2% of their alerts and notifications were false positives, to one with only 18.9% false positives simply by adding Amazon DevOps Guru. In the end, 605 can more effectively and efficiently manage their environment with existing resources and actually freeing-up DevOps brainpower to work on more strategically important initiatives than application management.
“Amazon DevOps Guru has provided insights that help us focus our infrastructure roadmap. Our current SIEM tools require building out alerting ahead of time, while DevOps Guru is constantly evolving, which prevents becoming stagnant in our monitoring. Reducing the risk of false positive alerts has saved countless engineering hours.”
Jared Williams, VP of Infrastructure and Architecture, 605
605 without DevOps Guru had their Amazon CloudWatch and Amazon Elastic Container Service for Kubernetes ( Amazon EKS) configured with different application performance monitoring and notification systems. They saw only 23.8 % legitimate alerts and notifications, where as with the integration with DevOps Guru the legitimate alerts and notifications went up to 81% for a 6-month time period. 605 are monitoring over 13+ AWS Accounts, 20+ Amazon EKS Clusters, 500+ Pods ,15000+ EC2 Instances, 500+ S3 Buckets and 55+ Application Load Balancers with DevOps Guru
Figure 1. 605 are monitoring over 13+ AWS Accounts, 20+ Amazon EKS Clusters, 500+ Pods ,15000+ EC2 Instances, 500+ S3 Buckets and 55+ Application Load Balancers with DevOps Guru.
Amazon DevOps Guru is a service powered by applying artificial intelligence (AI) that’s designed to make it easy to improve an application’s operational performance and availability. DevOps Guru helps detect behaviors that deviate from normal operating patterns so that you can identify operational issues long before they impact your applications. DevOps Guru utilizes ML models informed by years of Amazon.com and AWS operational excellence to identify anomalous application behavior (for example, increased latency, error rates, resource constraints, and others). Furthermore, it helps surface critical issues that could cause potential outages or service disruptions. When DevOps Guru identifies a critical issue, it automatically sends an alert and provides a summary of related anomalies, the likely root cause, and context for when and where the issue occurred. When possible, DevOps Guru also helps provide recommendations regarding how to remediate the issue. DevOps Guru ingests operational data from your AWS applications and provides a single dashboard to visualize issues in your operational data. DevOps Guru can be enabled for all of the resources in your AWS account, resources in your AWS CloudFormation Stacks, or resources grouped together by AWS Tags, with no manual setup or ML expertise required.
The value of DevOps Guru for 605 goes beyond providing operational efficiency and avoiding the choice of adding DevOps resources or assuming more risk. DevOps Guru also discovered issues with application performance that their existing solutions weren’t trained to inspect.
This new data allowed 605 to avoid a potential problem that they didn’t otherwise know would occur. As DevOps Guru doesn’t require any set-up beyond enabling the service and choosing resources to monitor (it’s a managed service), the service can surface issues without any prior configuration.
In the end, the value of DevOps Guru for 605 surfaces in three ways. First, it increases operational efficiency by allowing their existing DevOps team to more effectively manage its AWS applications and resources, as well as the room to grow along with their business needs. Second, DevOps Guru reduces operational fatigue and allows their DevOps teams to focus on more strategic issues by significantly reducing false positives. Lastly, DevOps Guru can find operational issues to which existing APM tools may not be configured or able to detect.
Start monitoring your AWS applications with AWS DevOps Guru today using this link
About the authors:
The collective thoughts of the interwebz
Manage Consent
To provide the best experiences, we use technologies like cookies to store and/or access device information. Consenting to these technologies will allow us to process data such as browsing behavior or unique IDs on this site. Not consenting or withdrawing consent, may adversely affect certain features and functions.
Functional
Always active
The technical storage or access is strictly necessary for the legitimate purpose of enabling the use of a specific service explicitly requested by the subscriber or user, or for the sole purpose of carrying out the transmission of a communication over an electronic communications network.
Preferences
The technical storage or access is necessary for the legitimate purpose of storing preferences that are not requested by the subscriber or user.
Statistics
The technical storage or access that is used exclusively for statistical purposes.The technical storage or access that is used exclusively for anonymous statistical purposes. Without a subpoena, voluntary compliance on the part of your Internet Service Provider, or additional records from a third party, information stored or retrieved for this purpose alone cannot usually be used to identify you.
Marketing
The technical storage or access is required to create user profiles to send advertising, or to track the user on a website or across several websites for similar marketing purposes.