Tag Archives: Speed Week

Benchmarking Edge Network Performance: Akamai, Cloudflare, AWS CloudFront, Fastly, and Google

Post Syndicated from John Graham-Cumming original https://blog.cloudflare.com/benchmarking-edge-network-performance/

Benchmarking Edge Network Performance: Akamai, Cloudflare, AWS CloudFront, Fastly, and Google

Benchmarking Edge Network Performance: Akamai, Cloudflare, AWS CloudFront, Fastly, and Google

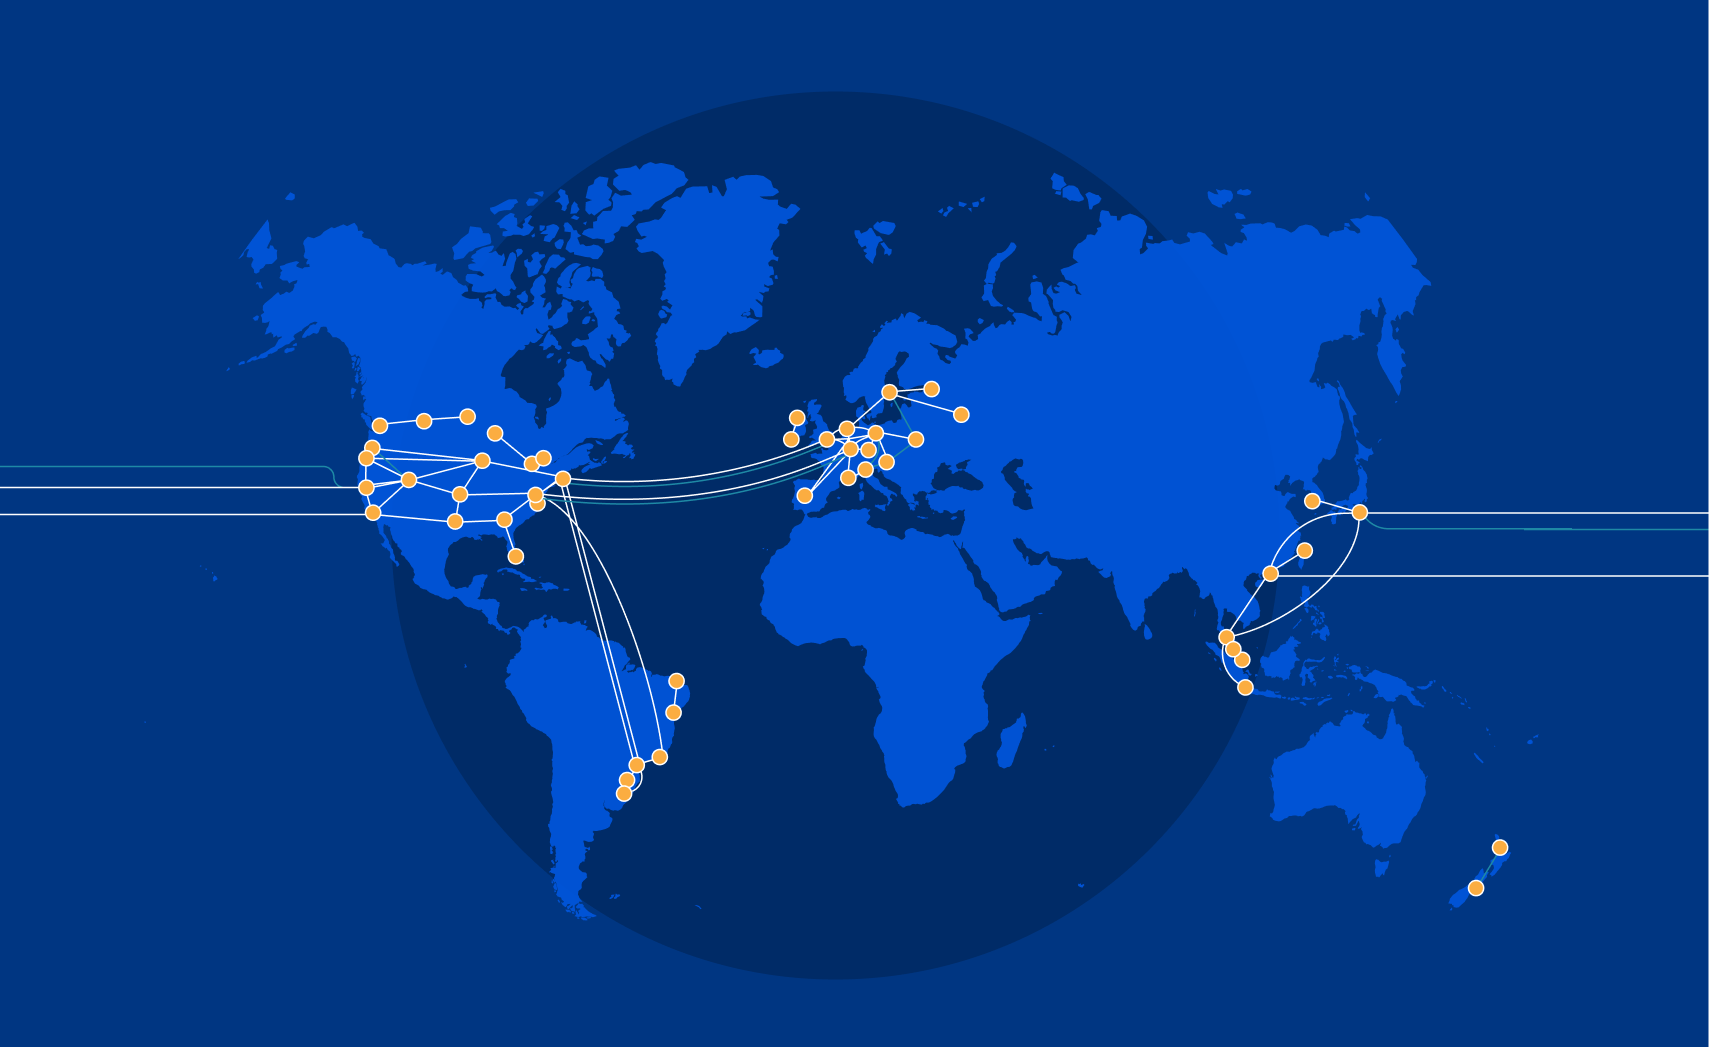
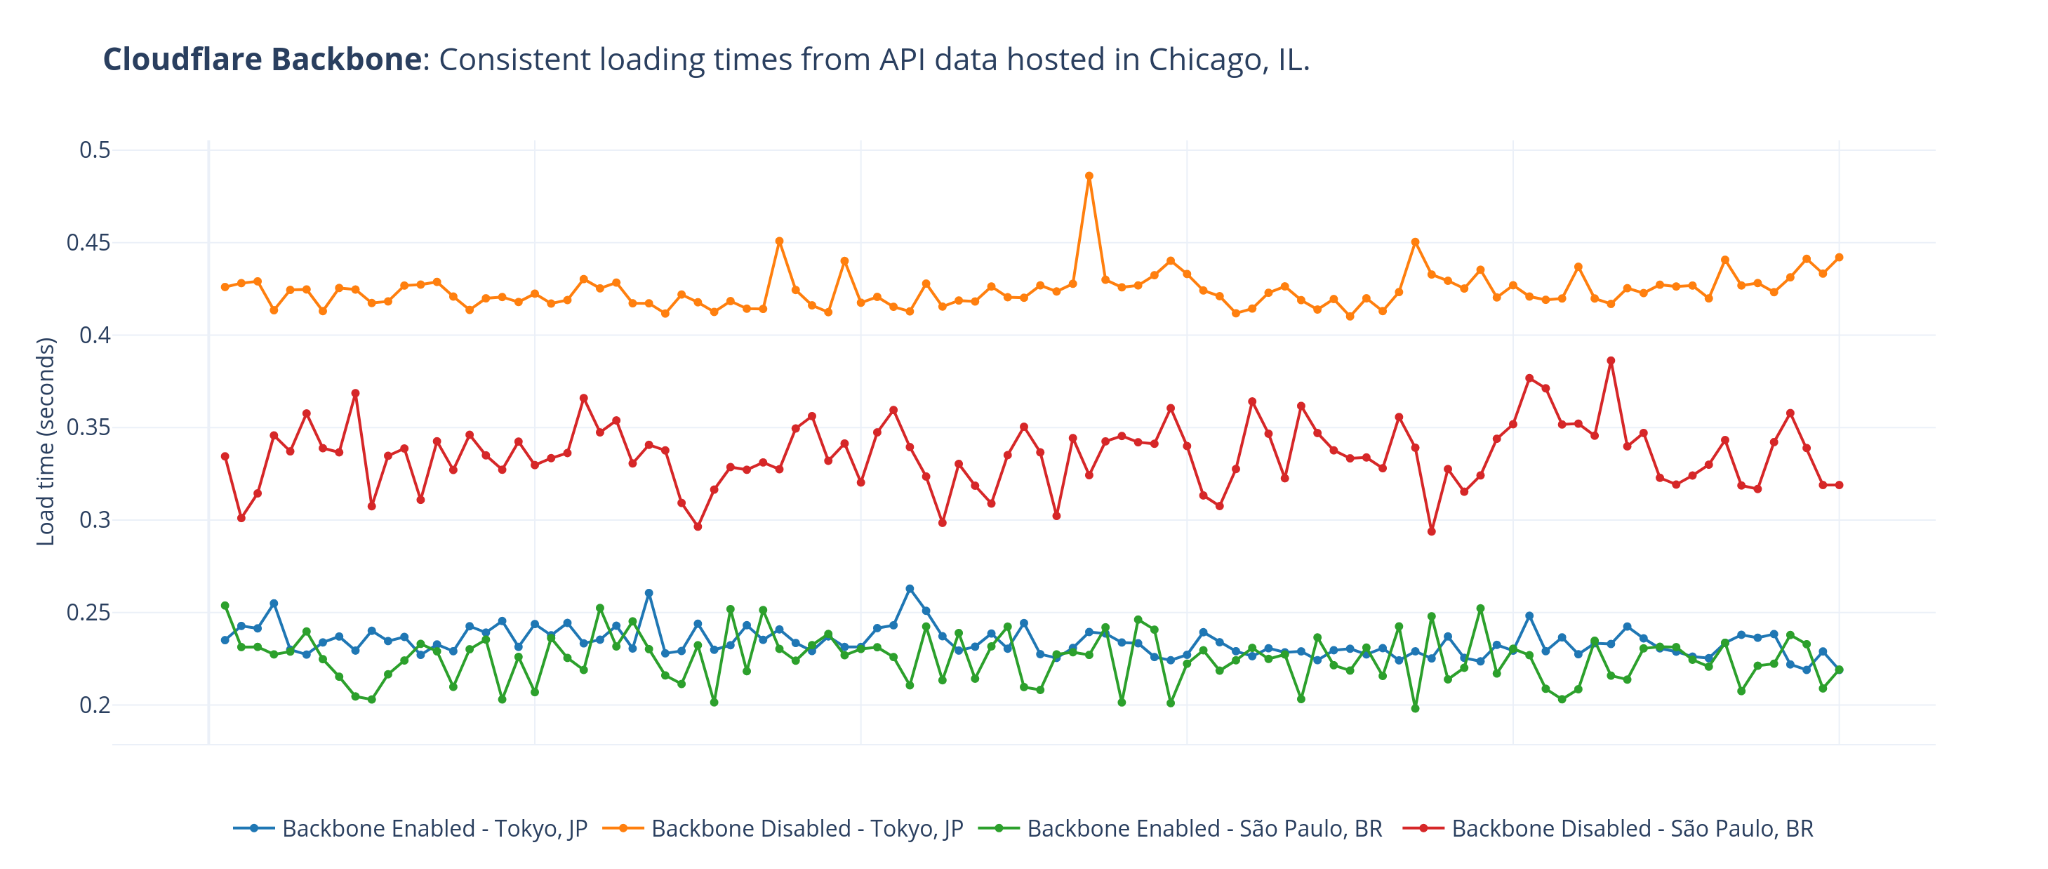
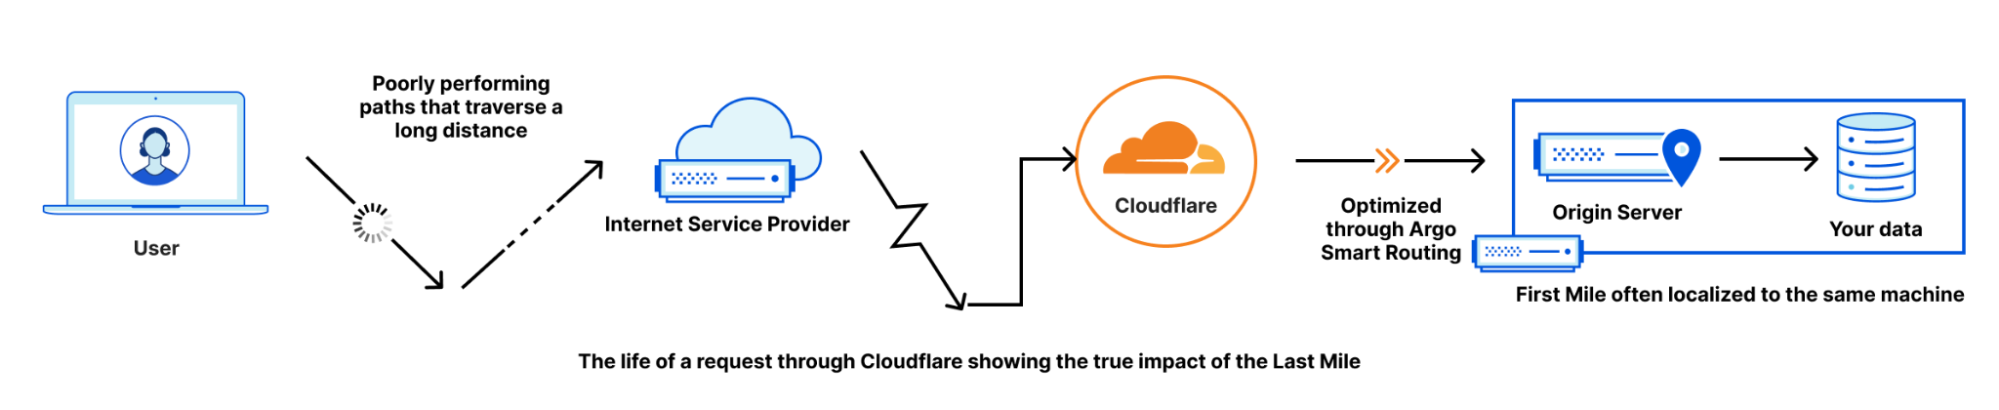
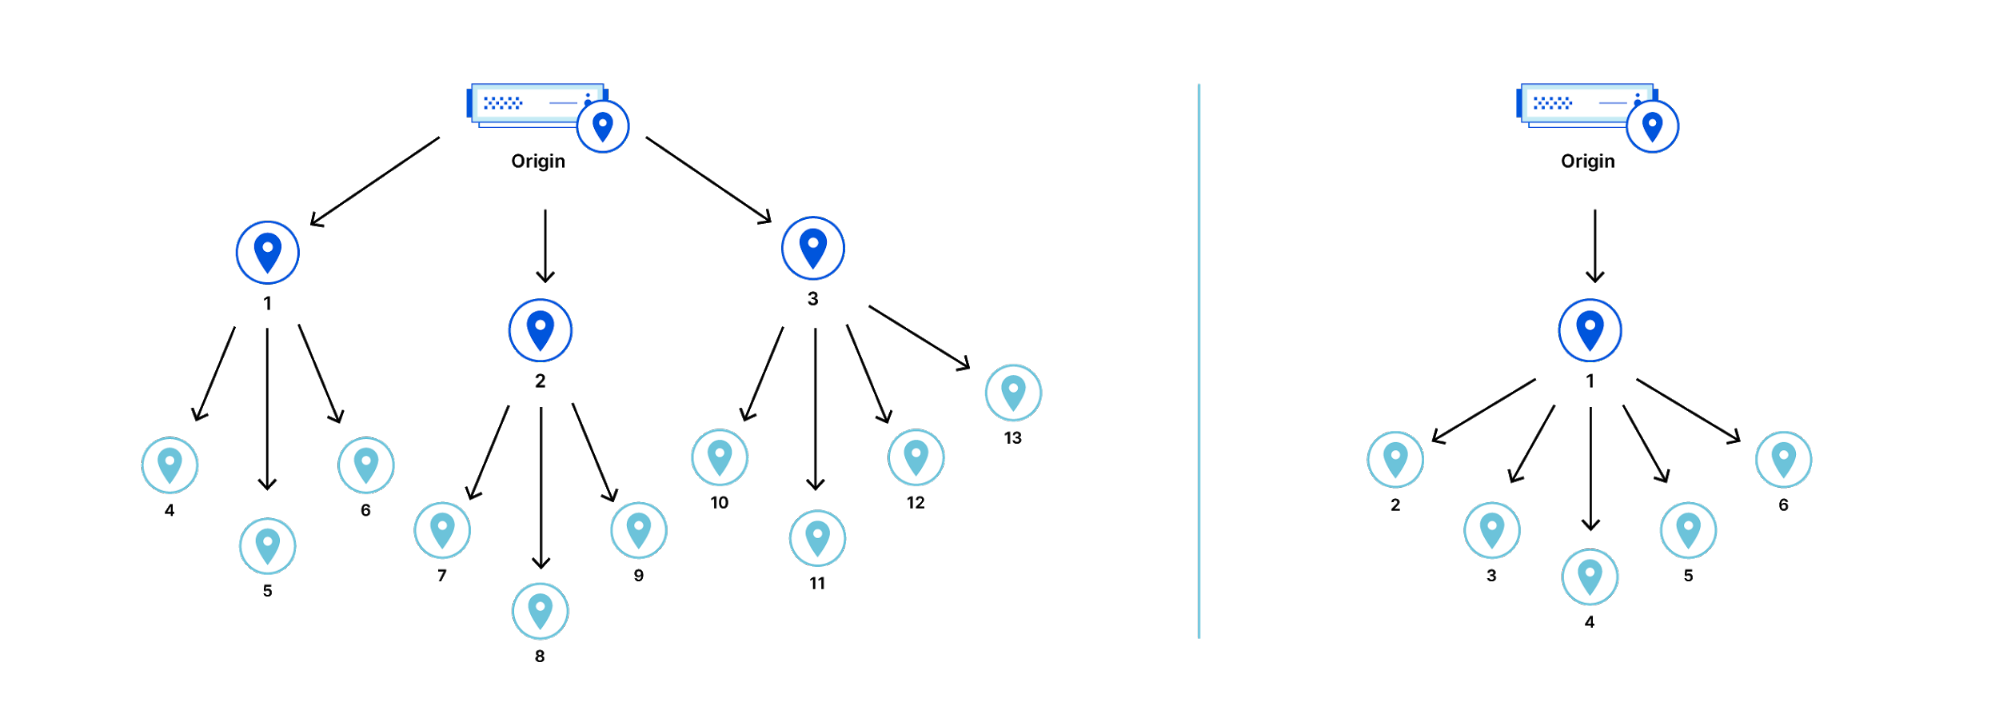
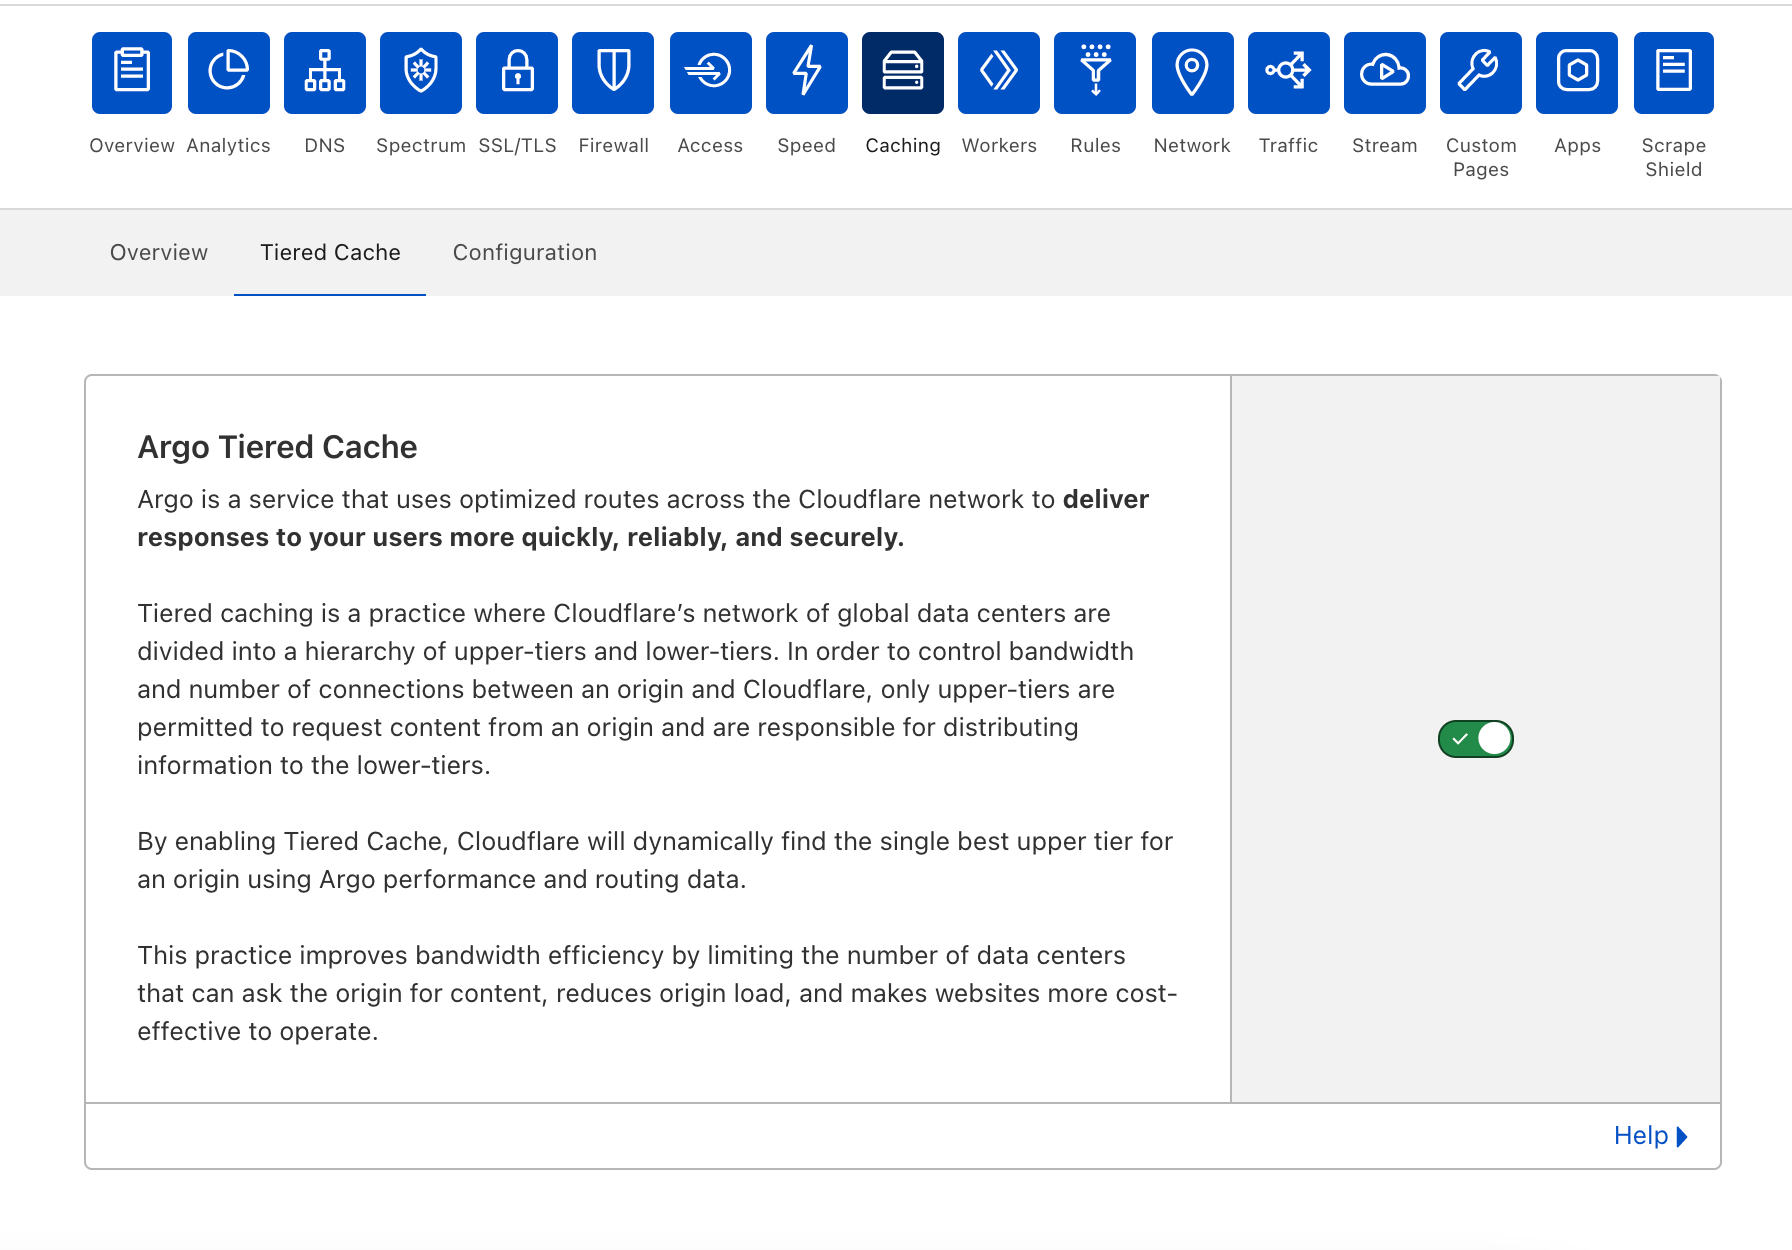
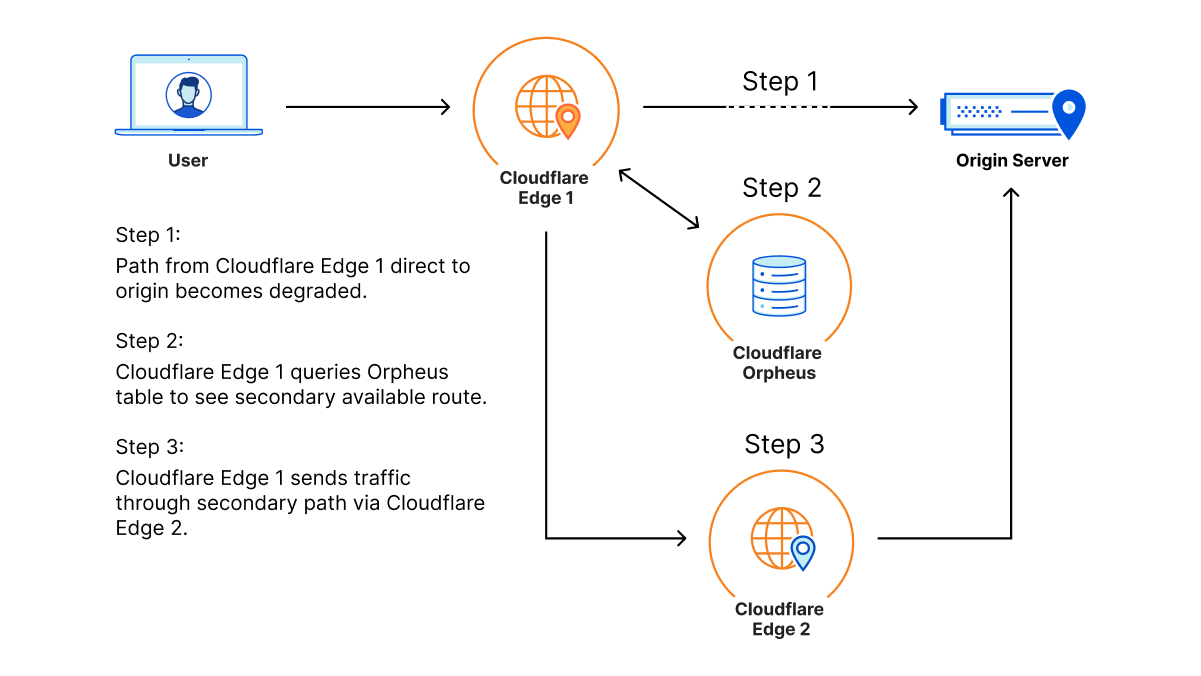
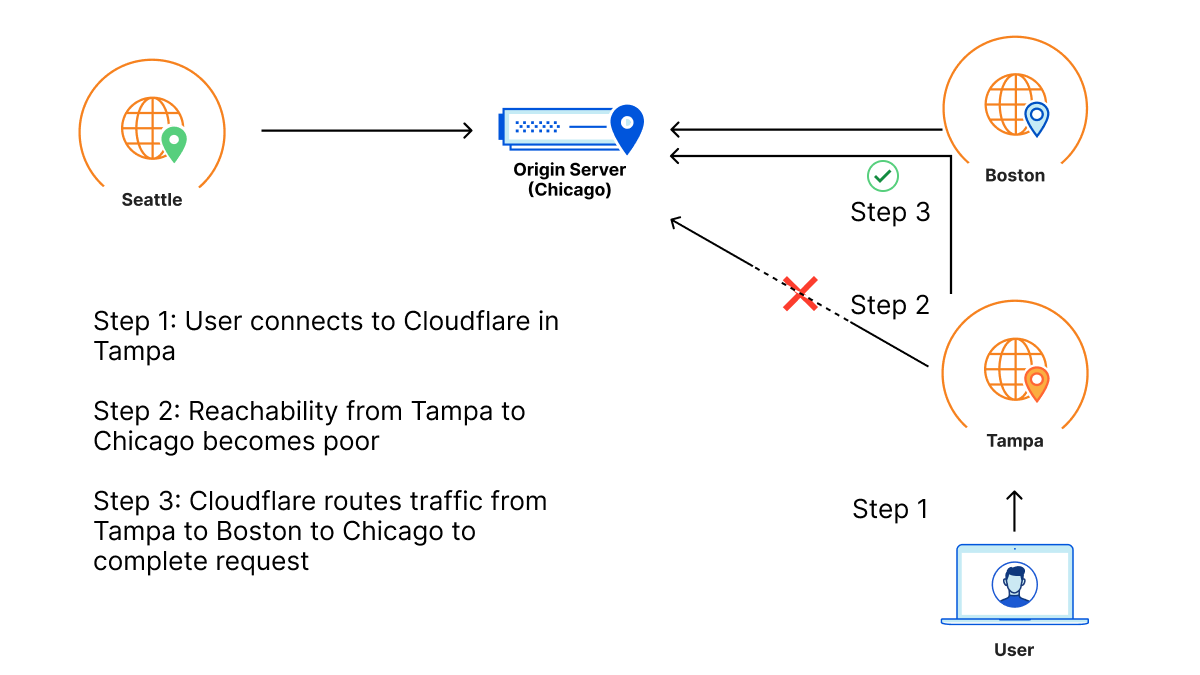
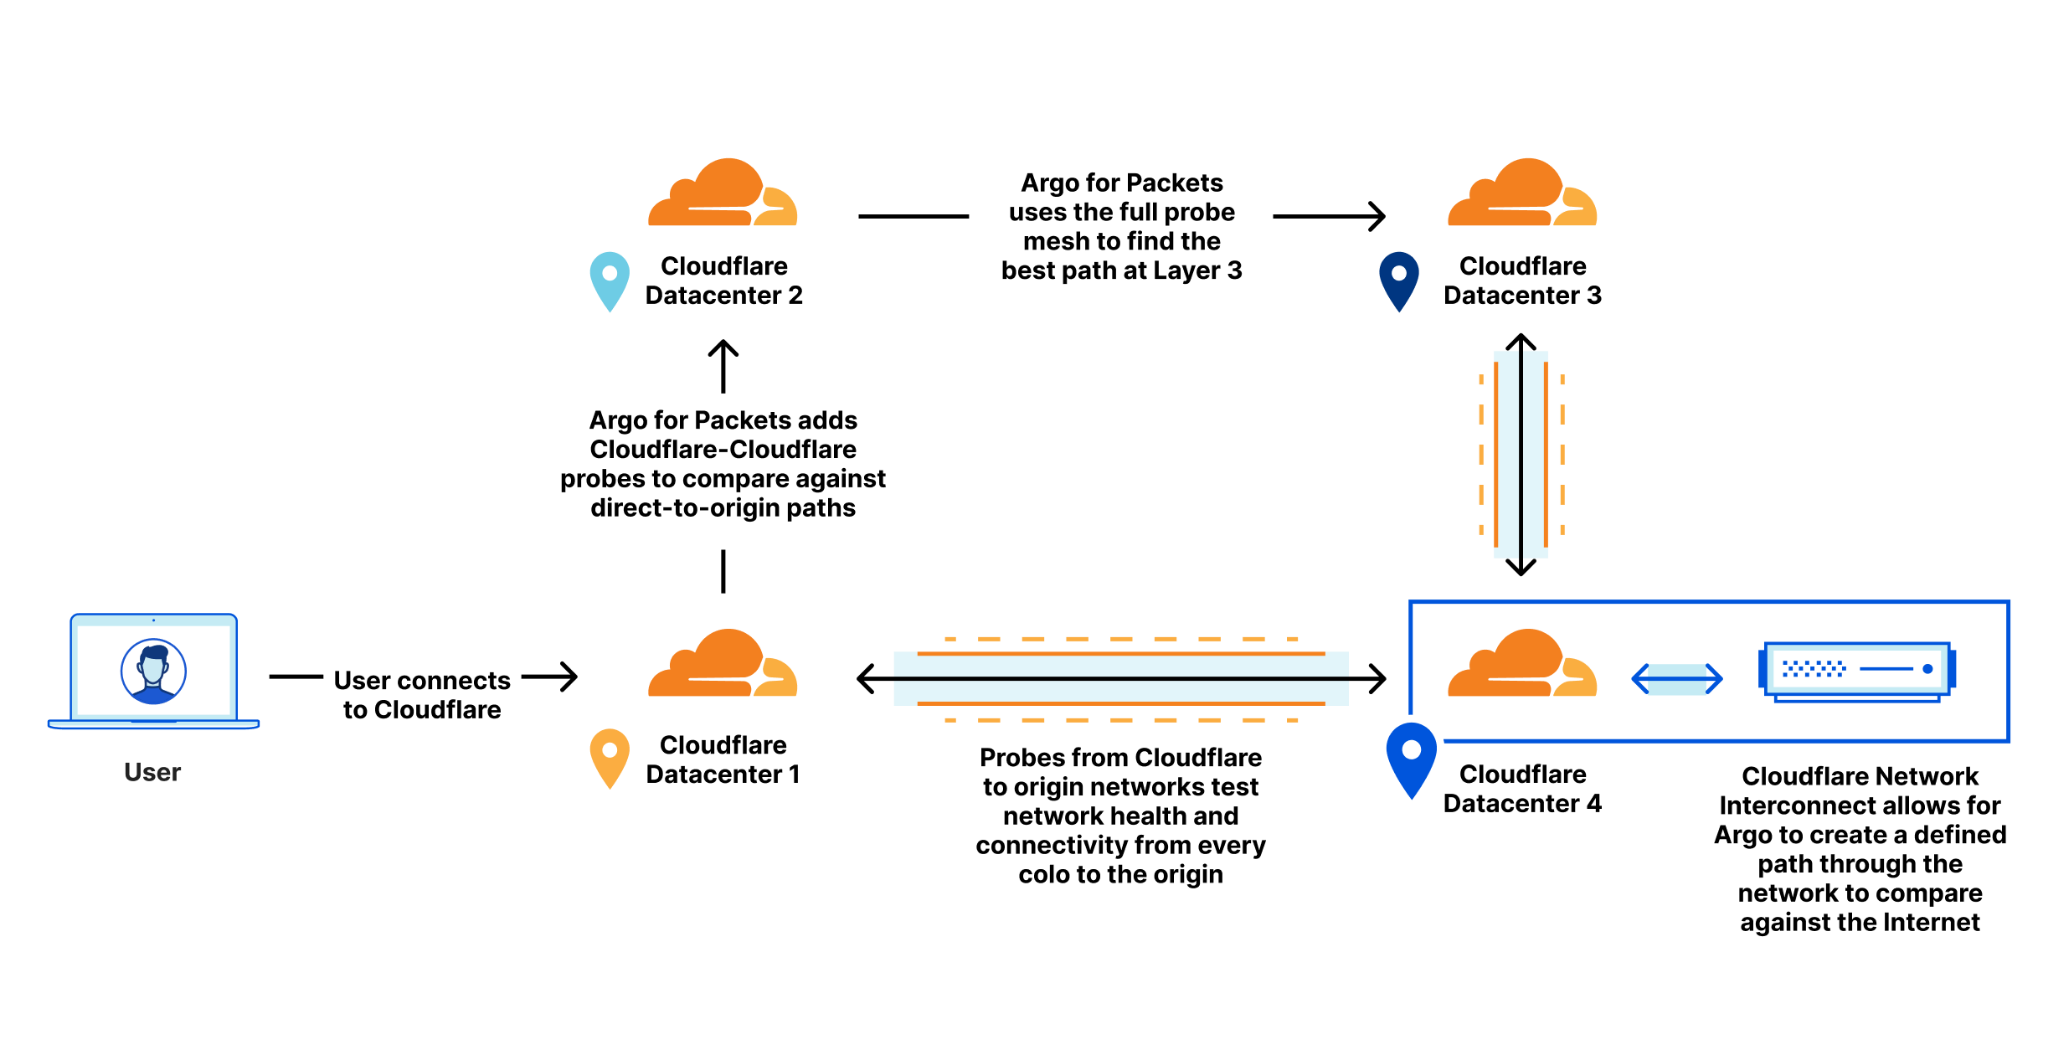
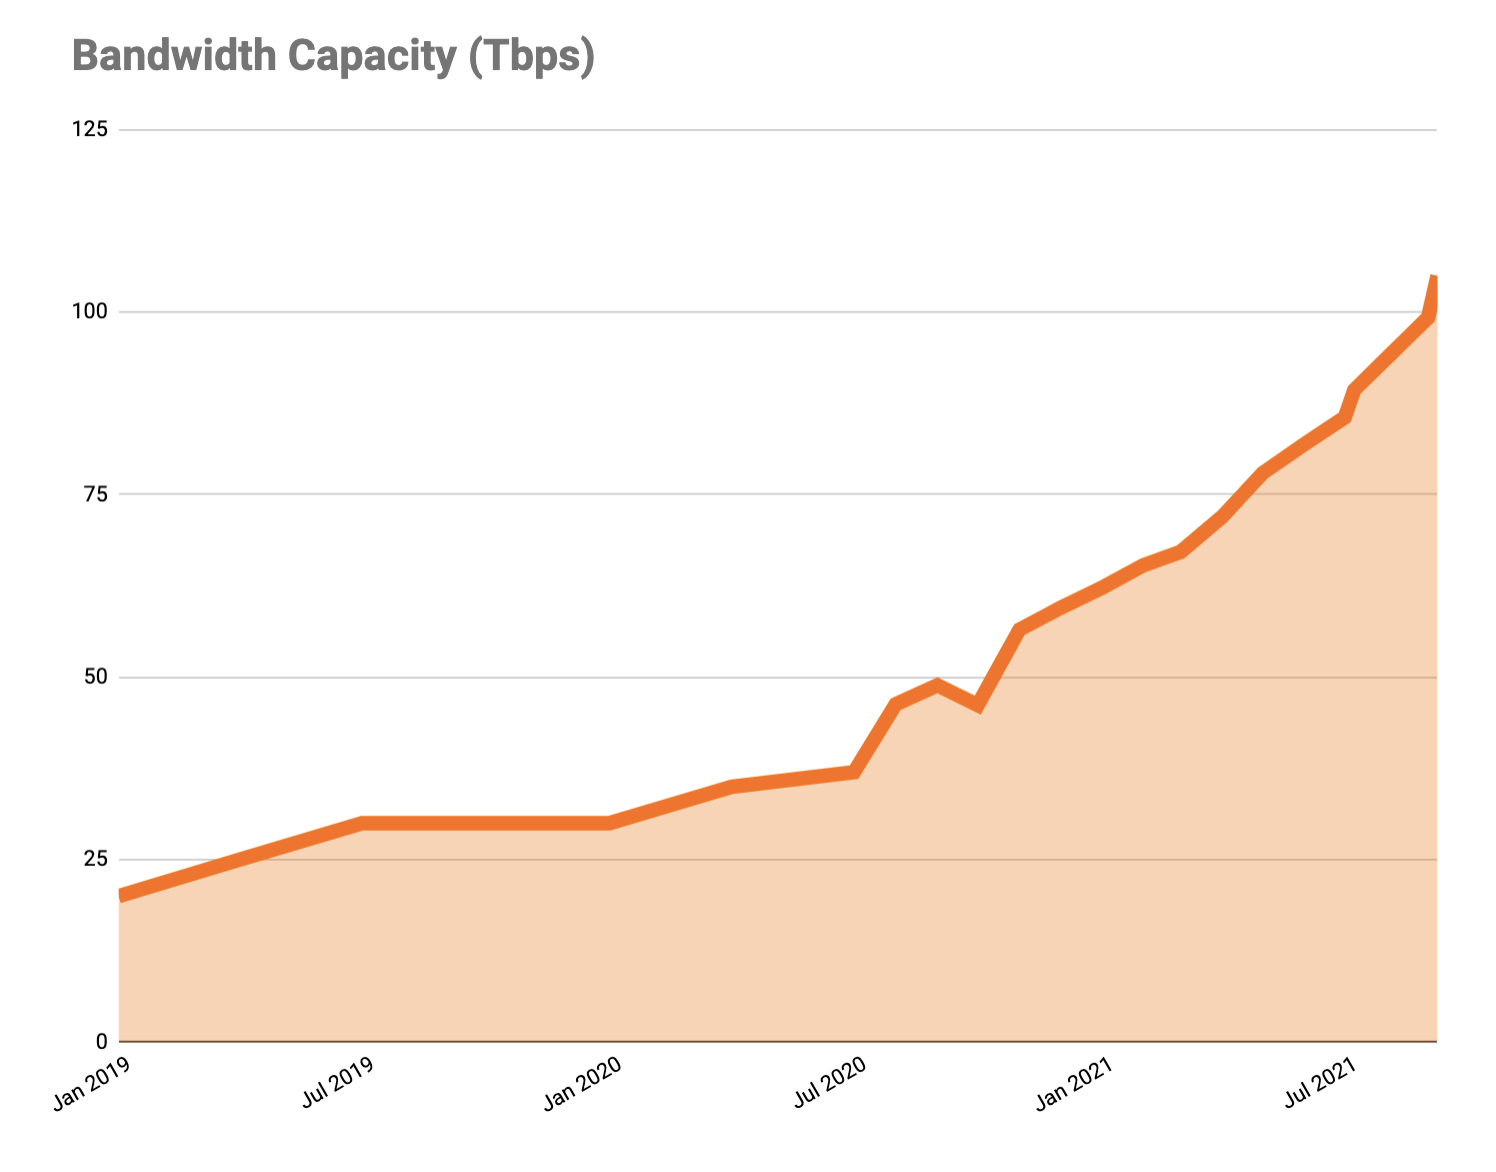
During Speed Week we’ve talked a lot about services that make the web faster. Argo 2.0 for better routing around bad Internet weather, Orpheus to ensure that origins are reachable from anywhere, image optimization to send just the right bits to the client, Tiered Cache to maximize cache hit rates and get the most out of Cloudflare’s new 25% bigger network, our expanded fiber backbone and more.

Those things are all great.

But it’s vital that we also measure the performance of our network and benchmark ourselves against industry players large and small to make sure we are providing the best, fastest service.

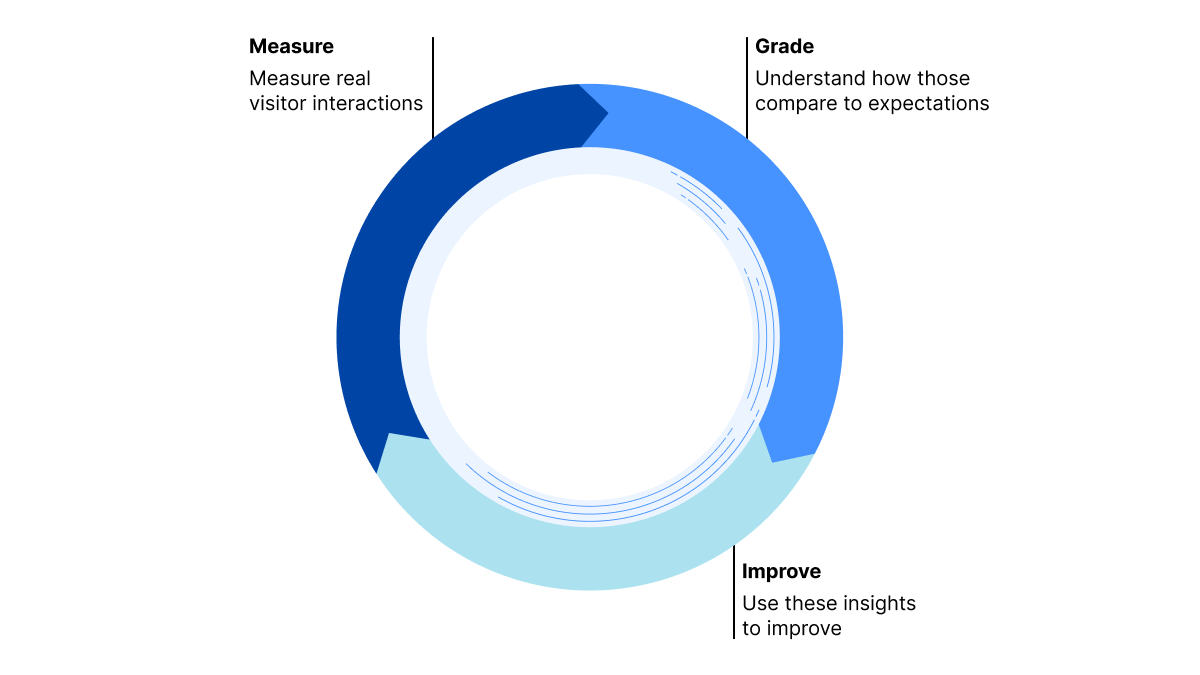
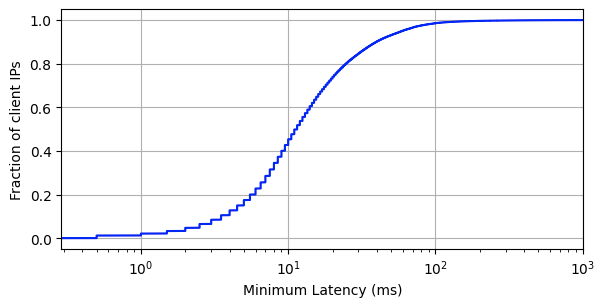
We recently ran a measurement experiment where we used Real User Measurement (RUM) data from the standard browser API to test the performance of Cloudflare and others in real-world conditions across the globe. We wanted to use third-party tests for this, but they didn’t have the granularity we wanted. We want to drill down to every single ISP in the world to make sure we optimize everywhere. We knew that in some places the answers we got wouldn’t be good, and we’d need to do work to improve our performance. But without detailed analysis across the entire globe we couldn’t know we were really the fastest or where we needed to improve.

In this blog post I’ll describe how that measurement worked and what the results are. But the short version is: Cloudflare is #1 in almost all cases whether you look at all the networks on the globe, or the top 1,000 largest, or the top 1,000 most active, and whether you look at mean timings or 95th percentile, and you measure how quickly a connection can be established, how long it takes for the first byte to arrive in a user’s web browser, or how long the complete download takes. And we’re not resting here, we’re committed to working network by network globally to ensure that we are always #1.

Why we measured

Commercial Internet measurement services (such as Cedexis, Catchpoint, Pingdom, ThousandEyes) already exist and perform the sorts of RUM measurements that Cloudflare used for this test. And we wanted to ensure that our test was as fair as possible and allowed each network to put its best foot forward.

We subscribe to the third party monitoring services already. And, when we looked at their data we weren’t satisfied.

First, we worried that the way they sampled wasn’t globally representative and was often skewed by measuring from the server, rather than the eyeball, side of the network. Or, even if operating from the eyeball side, could be skewed as artificial or tainted by bots and other automated traffic.

Second, it wasn’t granular enough. It showed our performance by country or region, but didn’t dive into individual networks and therefore obscured the details and outliers behind averages. While we looked good in third party tests, we didn’t trust them to be as thorough and accurate as we wanted. The goal isn’t to pick a test where we looked good. The goal was to be accurate and see where we weren’t good enough yet, so we could focus on those areas and improve. That’s why we had to build this ourselves.

We benchmark against others because it’s useful to know what’s possible. If someone else is faster than we are somewhere then it proves it’s possible. We won’t be satisfied until we’re at least as good as everyone else everywhere. Now we have the granular data to ensure that’ll happen. We plan our next update during Birthday Week when our target is to take 10% of networks where we’re not the fastest and become the fastest.

How we measured

To measure performance we did two things. We created a small internal team to do the measurements separate from the team that manages and optimizes our network. The goal was to show the team where we need to improve.

And to ensure that the other CDNs were tested using their most representative assets we used the very same endpoints that commercial measurement services use on the assumption that our competitors will have already ensured that those endpoints are optimized to show their networks’ best performance.

The measurements in this blog post are based on four days just before Speed Week began (2021-09-10 12:25:02 UTC to 2021-09-13 16:21:10 UTC). We took measurements of downloading exactly the same 100KB PNG file. We categorized them by the network the measurement was taken from. It’s identified by its ASN and a name. We’re not done with these measurements and will continue measuring and optimizing.

A 100KB file is a common test measurement used in the industry and allows us to measure network characteristics like the connection time, but also the total download time.

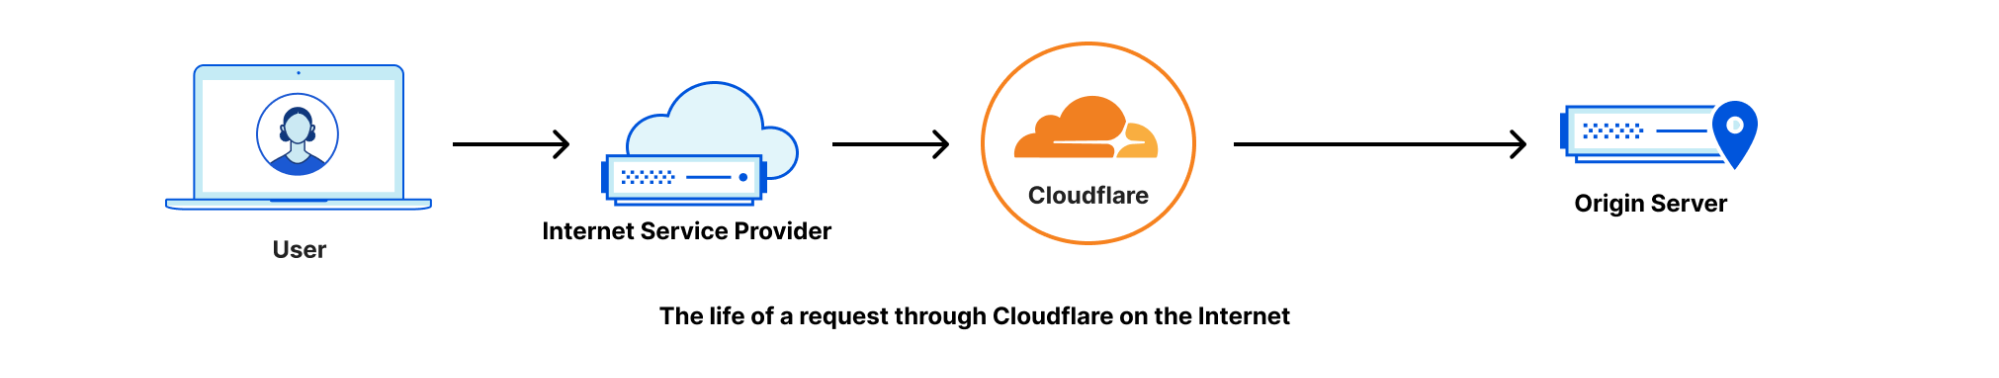
Before we get into results let’s talk a little about how the Internet fits together. The Internet is a network of networks that cooperate to form the global network that we all use. These networks are identified by a strangely named “autonomous system number” or ASN. The idea is that large networks (like ISPs, or cloud providers, or universities, or mobile phone companies) operate autonomously and then join the global Internet through a protocol called BGP (which we’ve written about in the past).

In a way the Internet is these ASNs and because the Internet is made of them we want to measure our performance for each ASN. Why? Because one part of improving performance is improving our connectivity to each ASN and knowing how we’re doing on a per-network basis helps enormously.

There are roughly 70,000 ASNs in the global Internet and during the measurement period we saw traffic from about 21,000 (exact number: 20,728) of them. This makes sense since not all networks are “external” (as in the source of traffic to websites); many ASNs are intermediaries moving traffic around the Internet.

For the rest of this blog we simply say “network” instead of “ASN”.

What we measured

Getting real user measurement data used to be hard but has been made easy for HTTP endpoints thanks to the Resource Timing API, supported by most modern browsers. This API allows a page to measure network timing data of fetched resources using high-resolution timestamps, accurate to 5 µs (microseconds).

The point of this API is to get timing information that shows how a real end-user experiences the Internet (and not a synthetic test that might measure a single component of all the things that happen when a user browses the web).

Benchmarking Edge Network Performance: Akamai, Cloudflare, AWS CloudFront, Fastly, and Google

The Resource Timing API is supported by pretty much every browser enabling measurement on everything from old versions of Internet Explorer, to mobile browsers on iOS and Android to the latest version of Chrome. Using this API gives us a view of real world use on real world browsers.

We don’t just instruct the browser to download an image too. To make sure that we’re fair and replicate the real-life end-user experience, we make sure that no local caching was involved in the request, check if the object has been compressed by the server or not, take the HTTP headers size into account, and record if the connection has been pre-warmed or not, to name a few technical details.

Here’s a high-level example on how this works:

await fetch("https://example.com/100KB.png?r=7562574954", {
              mode: "cors",
              cache: "no-cache",
              credentials: "omit",
              method: "GET",
})

performance.getEntriesByType("resource");

{
   connectEnd: 1400.3999999761581
   connectStart: 1400.3999999761581
   decodedBodySize: 102400
   domainLookupEnd: 1400.3999999761581
   domainLookupStart: 1400.3999999761581
   duration: 51.60000002384186
   encodedBodySize: 102400
   entryType: "resource"
   fetchStart: 1400.3999999761581
   initiatorType: "fetch"
   name: "https://example.com/100KB.png"
   nextHopProtocol: "h2"
   redirectEnd: 0
   redirectStart: 0
   requestStart: 1406
   responseEnd: 1452
   responseStart: 1428.5
   secureConnectionStart: 1400.3999999761581
   startTime: 1400.3999999761581
   transferSize: 102700
   workerStart: 0
}

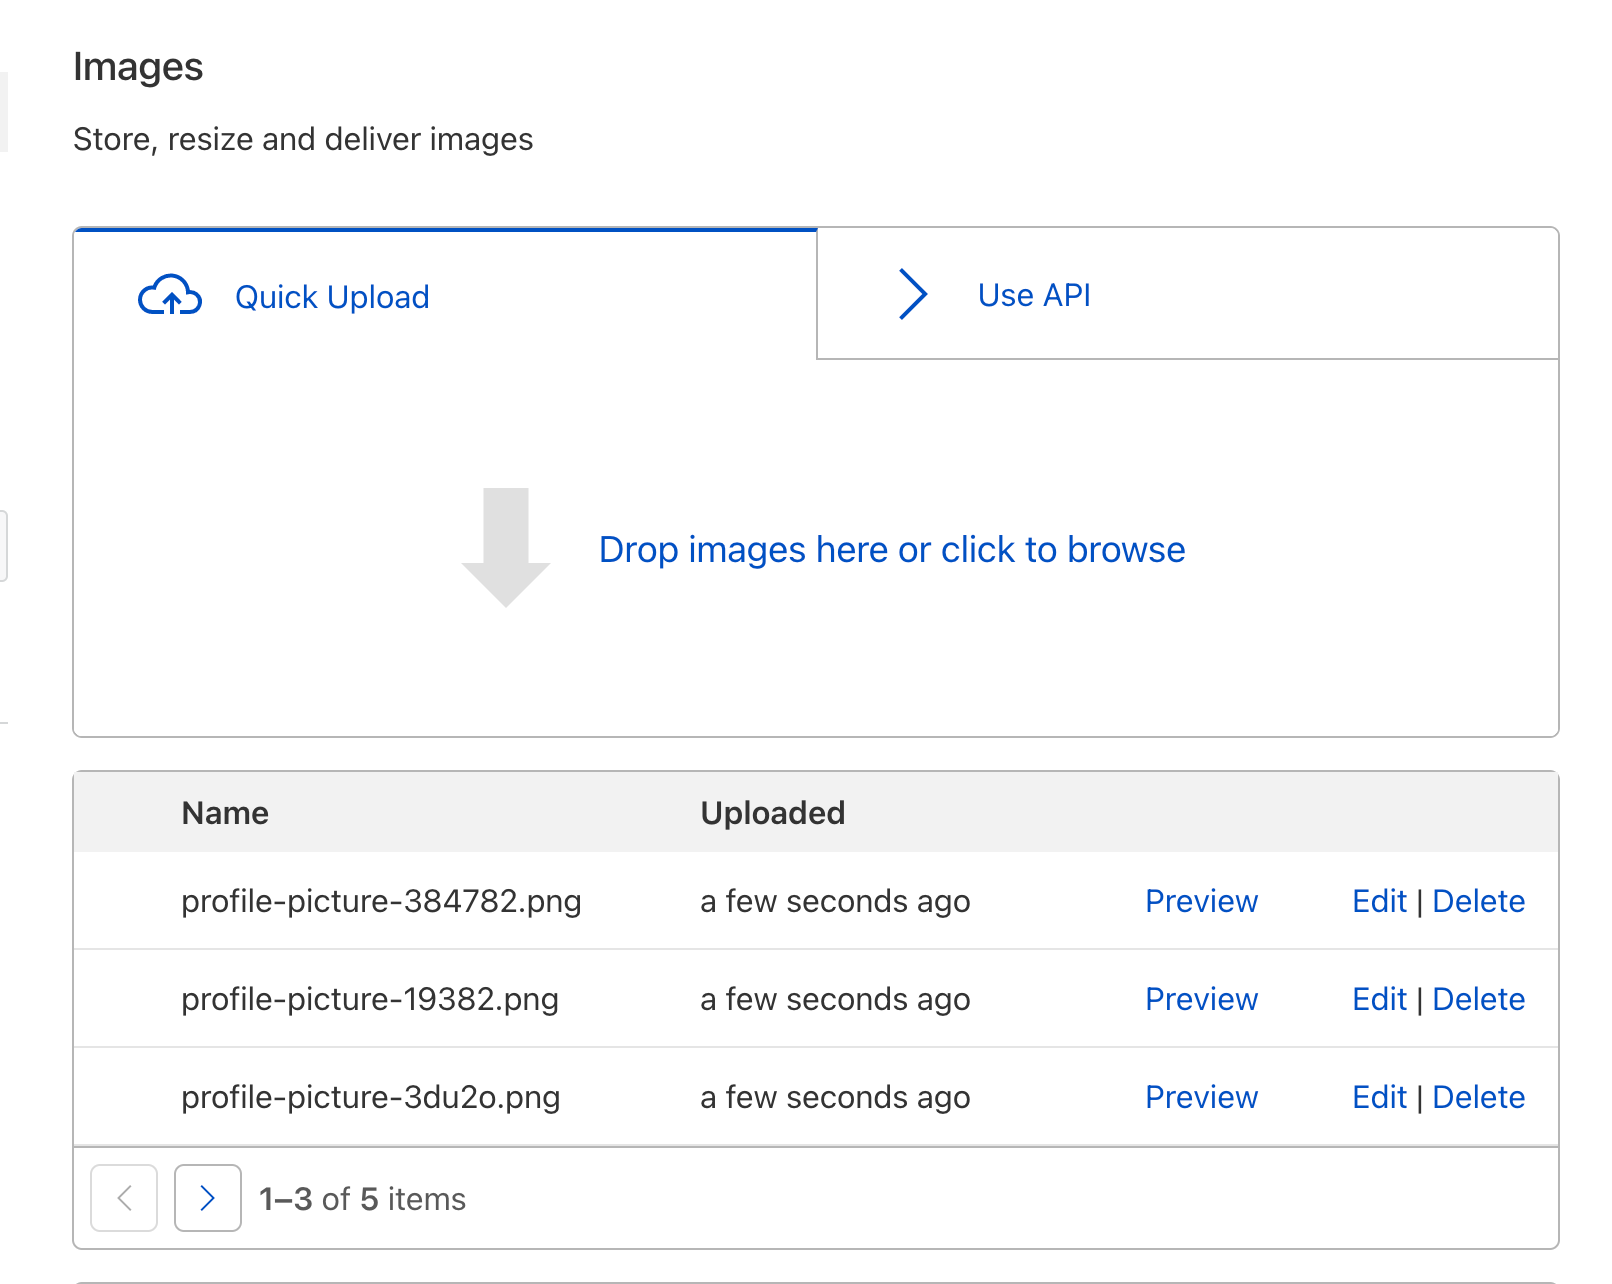
To measure the performance of each CDN we downloaded an image from each, when a browser visited one of our special pages. Once every image is downloaded we record the measurements using a Cloudflare Workers based API.

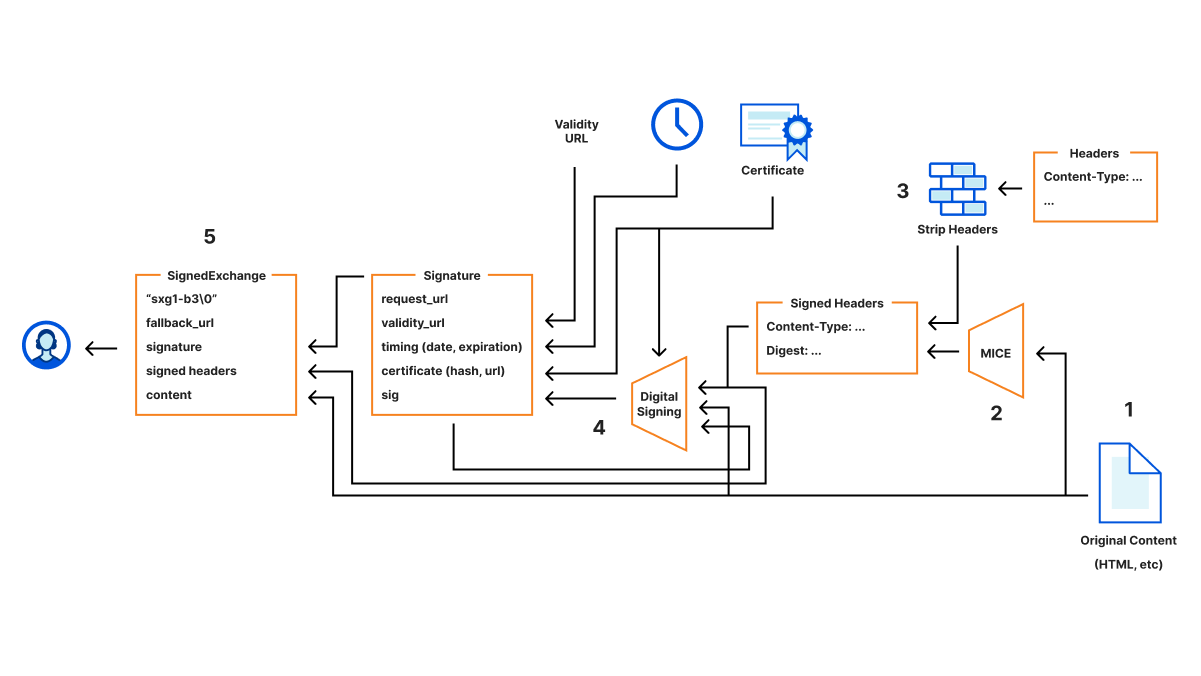
The three measurements: TCP connection time, TTFB and TTLB

We focused on three measurements to illustrate how fast our network is: TCP connection time, TTFB and TTLB. Here’s why those three values matter.

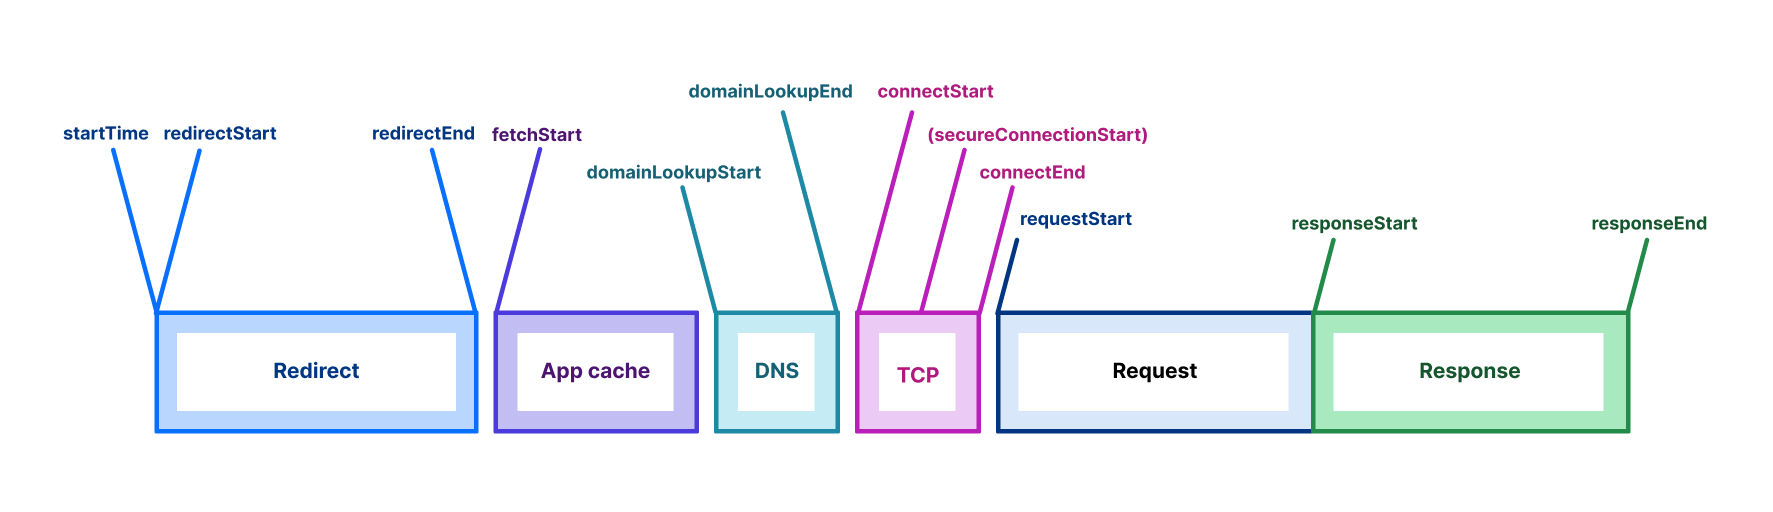
TCP connection time is used to show how well-connected we are to the global Internet as it counts only the time taken for a machine to establish a connection to the remote host (before any higher level protocols are used). The TCP connection time is calculated as connectEnd – connectStart (see the diagram above).

TTFB (or time to first byte) is the time taken once an HTTP request has been sent for the first byte of data to be returned by the server. This is a common measurement used to show how responsive a server is. We calculate TTFB as responseStart – connectStart – (requestStart – connectEnd).

TTLB (or time to last byte) is the time taken to send the entire response to the web browser. It’s a good measure of how long a complete download takes and helps measure how good the server (or CDN) is at sending data. We calculate TTLB as responseEnd – connectStart – (requestStart – connectEnd).

We then produced two sets of data: mean and p95. The mean is a very well understood number for laypeople and gives the average user experience, but it doesn’t capture the breadth of different speeds people experience very well. Because it averages everything together it can miss skewed distributions of data (where lots of people get good performance and lots bad performance, for example).

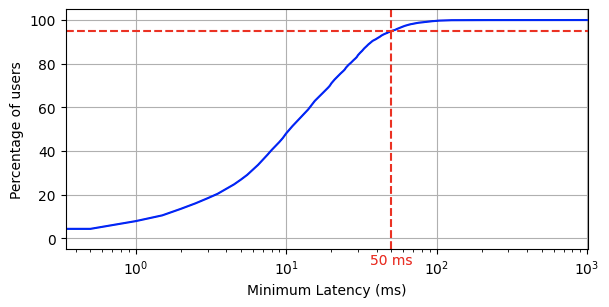
To address the mean’s problems we also used p95, the 95th percentile. This number tells us what performance 95% of measurements fall below. That can be a hard number to understand, but you can think of it as the “reasonable worst case” performance for a user. Only 5% of measurements were worse than this number.

An example chart

As this blog contains a lot of data, let’s start with a detailed look at a chart of results. We compared ourselves against industry giants Google and Amazon CloudFront, industry pioneer Akamai and up and comer Fastly.

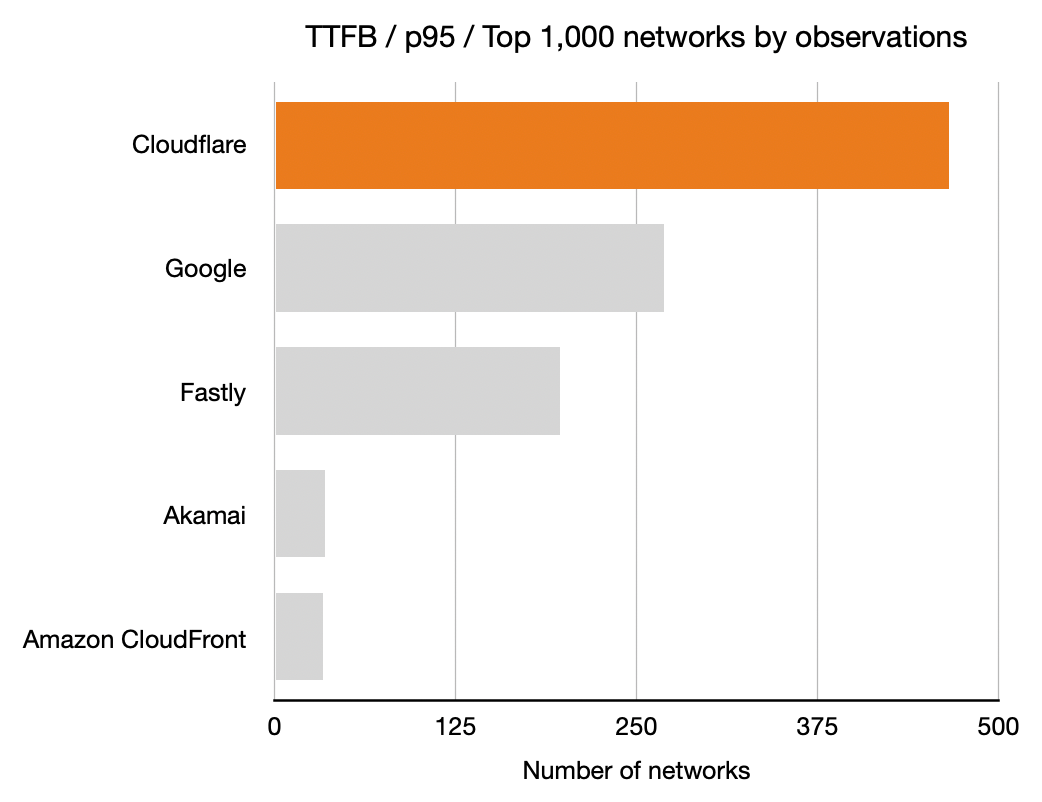
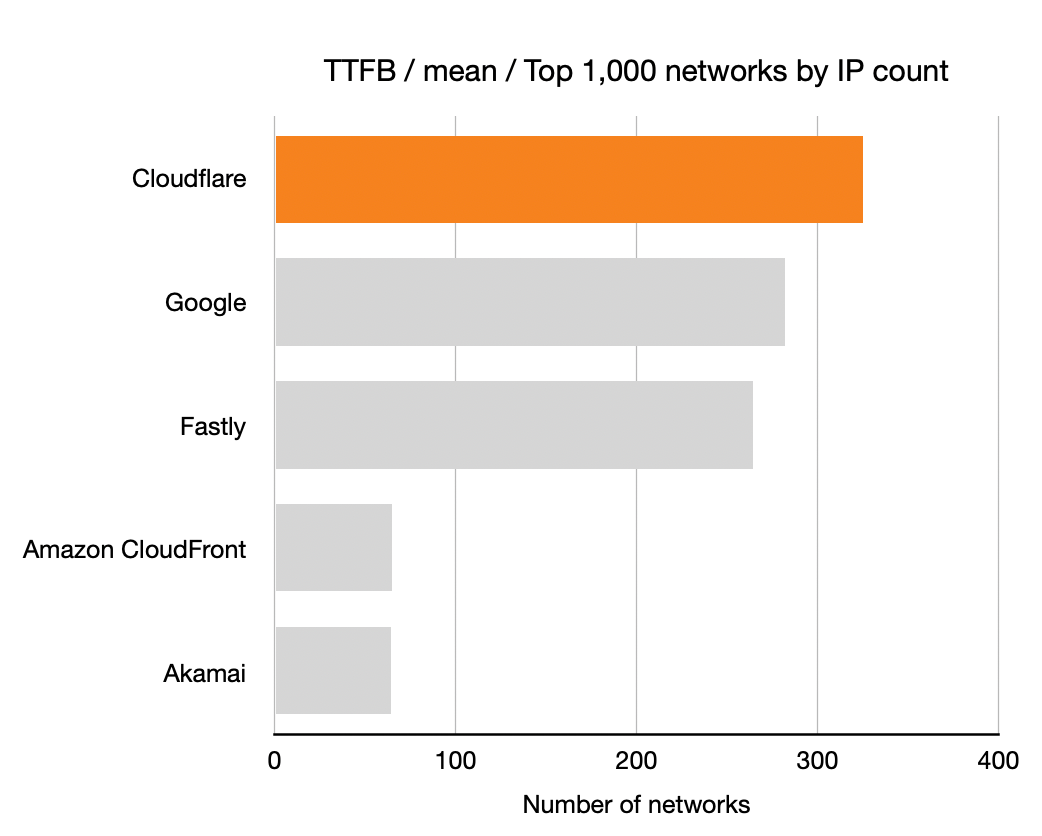
For each network (represented by an ASN) and for each CDN we calculated which CDN had the best performance. Here, for example, is a count of the number of networks on which each CDN had the best performance for TTFB. This particular chart shows p95 and includes data from the top 1,000 networks (by number of IPv4 addresses advertised).

In these charts, longer bars are better; the bars indicate the number of networks for which that CDN had the lowest TTFB at p95.

Benchmarking Edge Network Performance: Akamai, Cloudflare, AWS CloudFront, Fastly, and Google

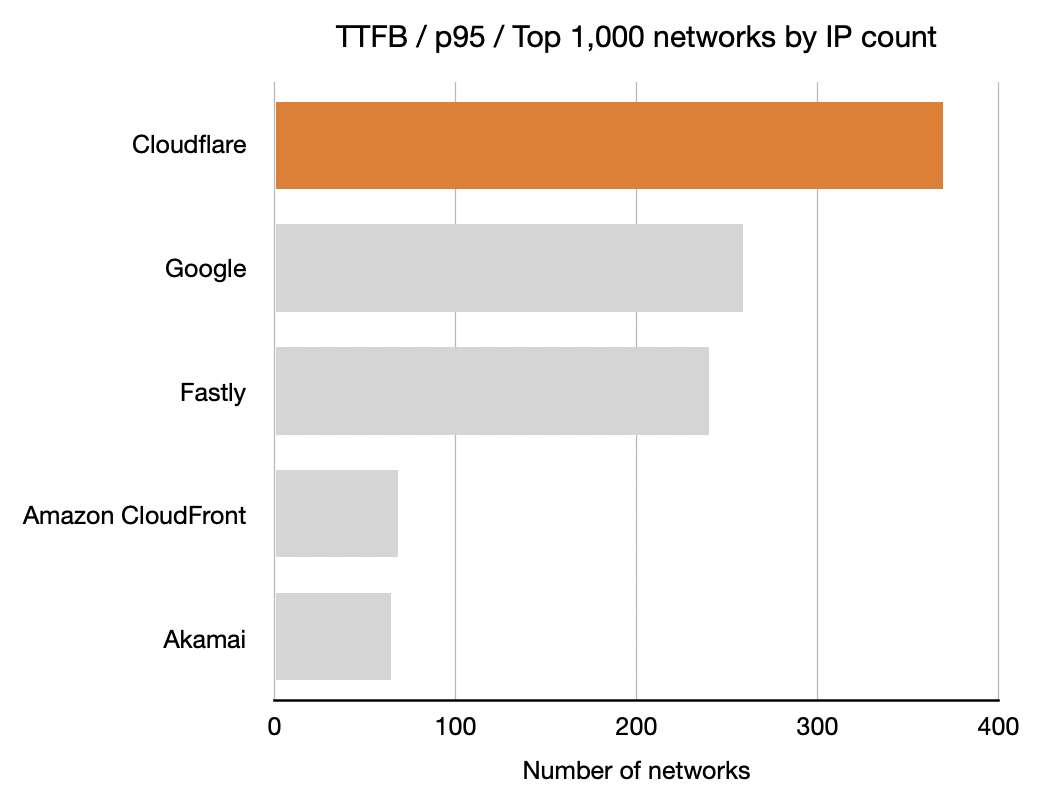
This shows that Cloudflare had the lowest time to first byte (the TTFB, or the time it took the first byte of content to reach their browser) at the 95th percentile for the largest number of networks in the top 1,000 (based on the number IPv4 addresses they advertise). Google was next, then Fastly followed by Amazon CloudFront and Akamai.

All three measures, TCP connection time, time to first byte and time to last byte, matter to the user experience. For this example, I focused on time to first byte (TTFB) because it’s such a common measure of responsiveness of the web. It’s literally the time it takes a web server to start responding to a request from a browser for a web page.

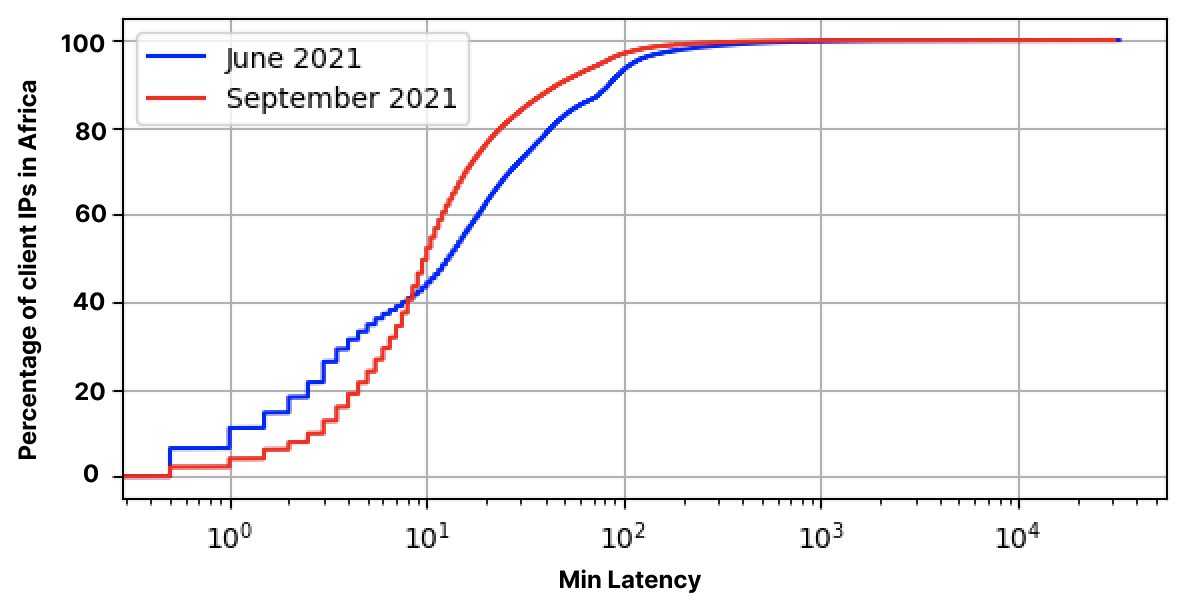
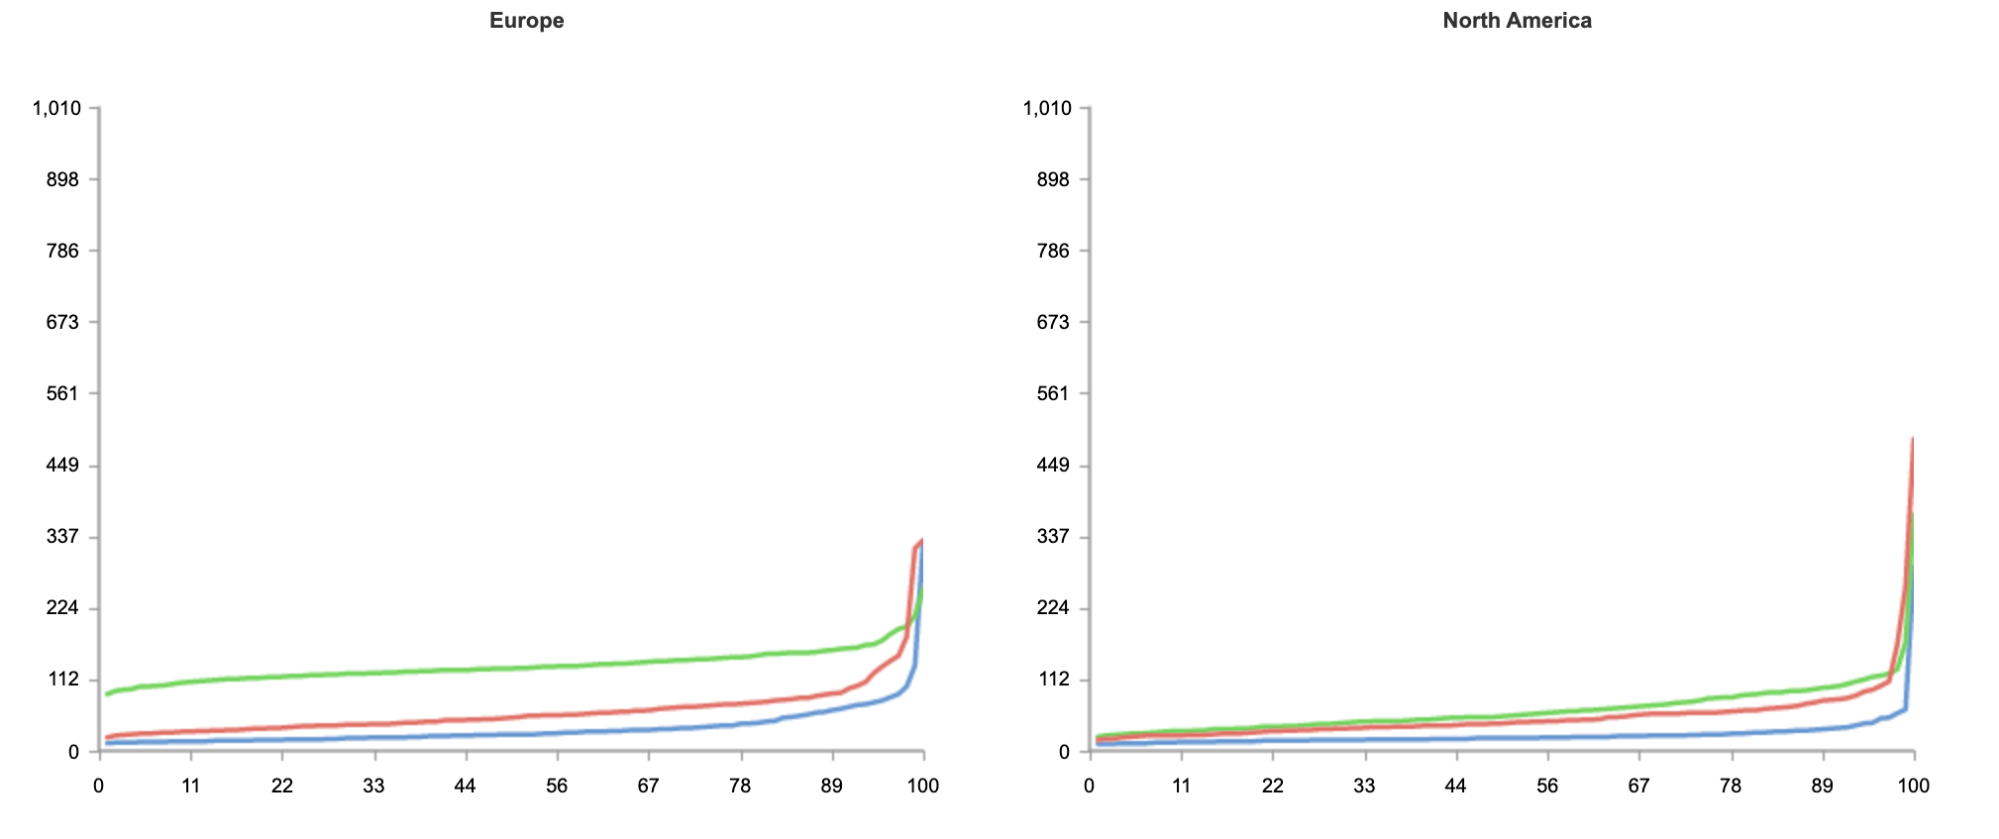
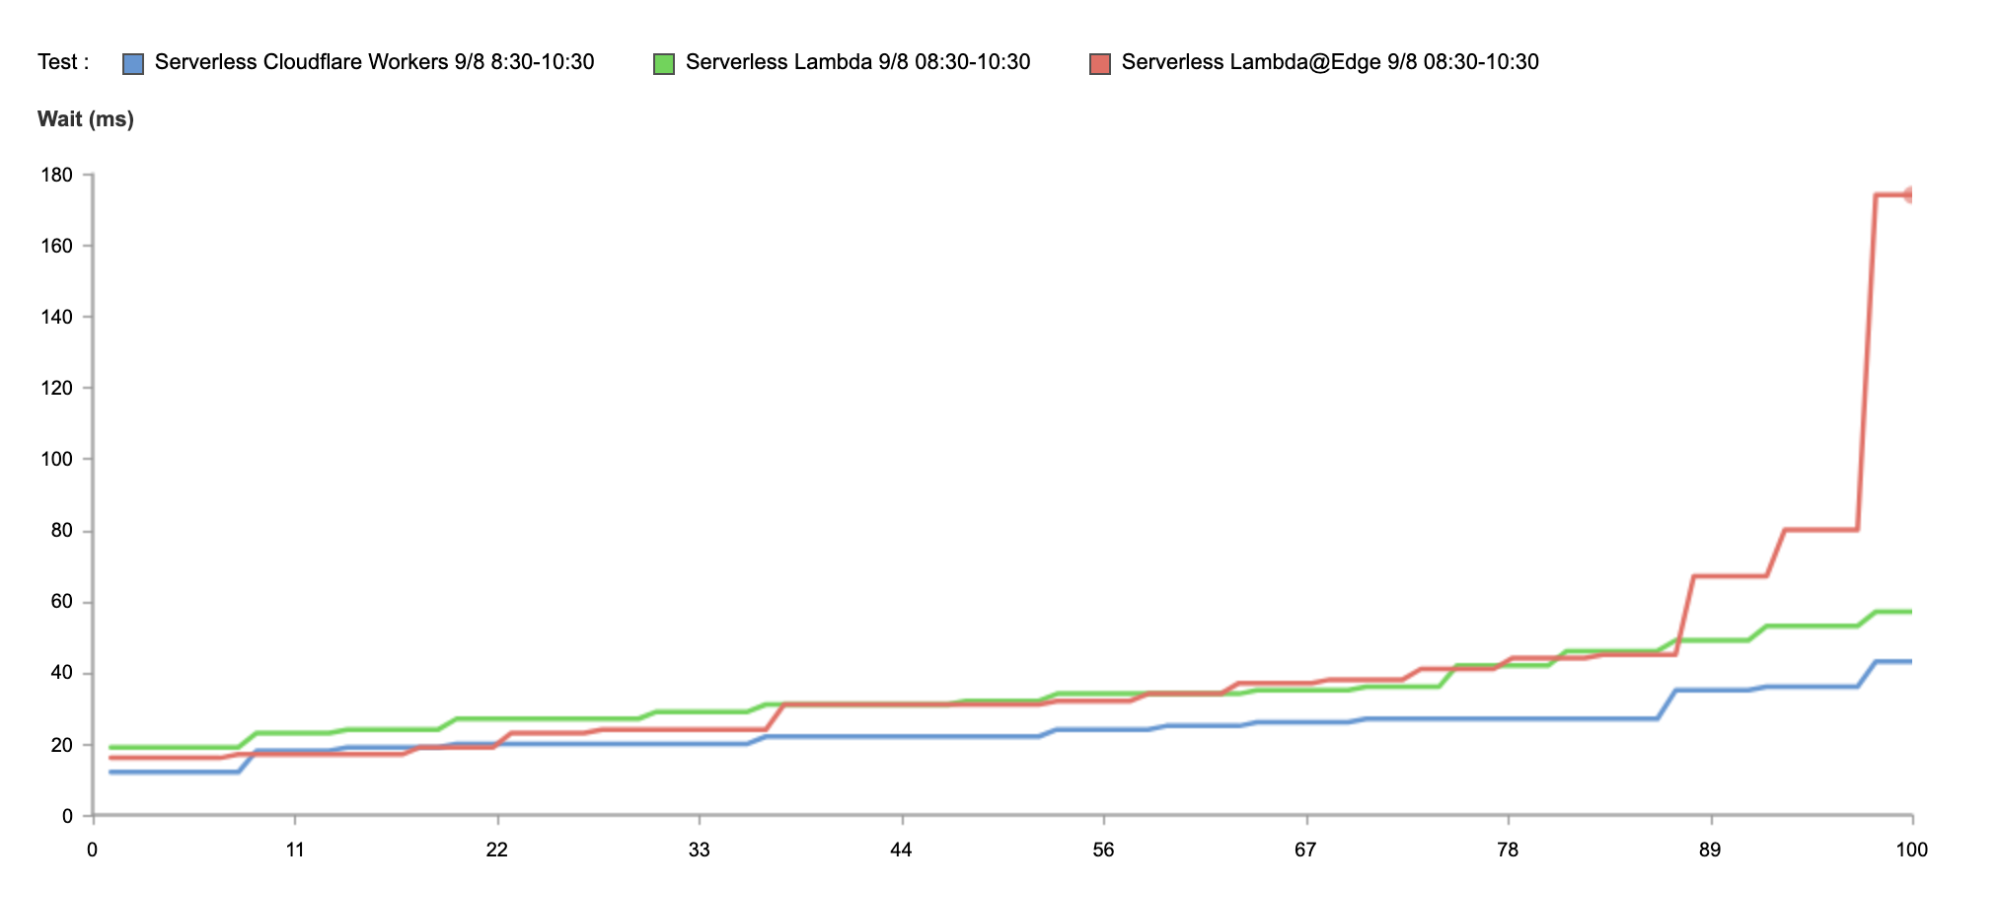
To understand the data we gathered let’s look at two large US-based ISPs: Cox and Comcast. Cox serves about 6.5 million customers and Comcast has about 30 million customers. We performed roughly 22,000 measurements on Cox’s network and 100,000 on Comcast’s. Below we’ll make use of measurement counts to rank networks by their size, here we see that our measurements and customer counts of Cox and Comcast track nicely.

Cox Communications has ASN 22773 and our data shows that the p95 TTFB for the five CDNs was as follows: Cloudflare 332.6ms, Fastly 357.6ms, Google 380.3ms, Amazon CloudFront 404.4ms and Akamai 441.5ms. In this case Cloudflare was the fastest and about 7% faster than the next CDN (Fastly) which was faster than Google and so on.

Looking at Comcast (with ASN 7922) we see p95 TTFB was 323.7ms (Fastly), 324.2ms (Cloudflare), 353.7ms (Google), 384.6ms (Akamai) and 418.8ms (Amazon CloudFront). Here Fastly (323.7ms) edged out Cloudflare (324.2ms) by 0.2%.

Figures like these go into determining which CDN is the fastest for each network for this analysis and the charts presented. At a granular level they matter to Cloudflare as we can then target networks and connectivity for optimization.

The results

Shown below are the results for three different measurement types (TCP connection time, TTFB and TTLB) with two different aggregations (mean and p95) and for three different groupings of networks.

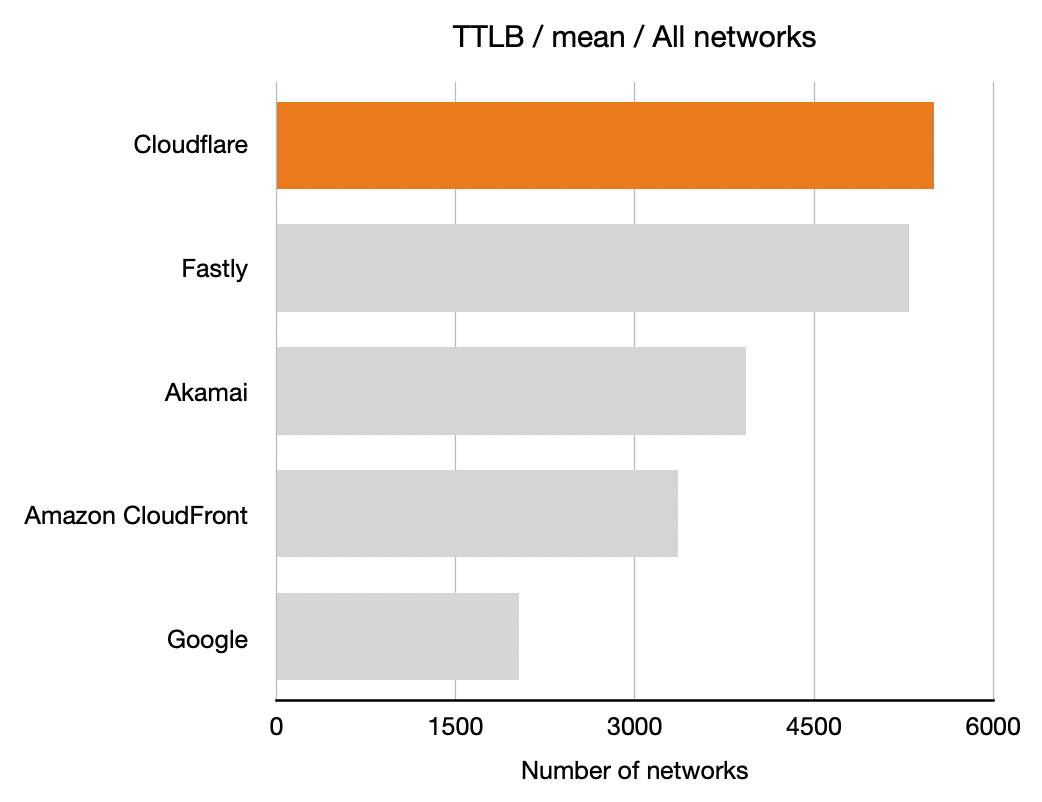
The first grouping is the simplest: it’s all the networks we have data for. The second grouping is the one used above, the top 1,000 networks by number of IP addresses. But we also show a third grouping, top 1,000 networks by number of observations. That last group is important.

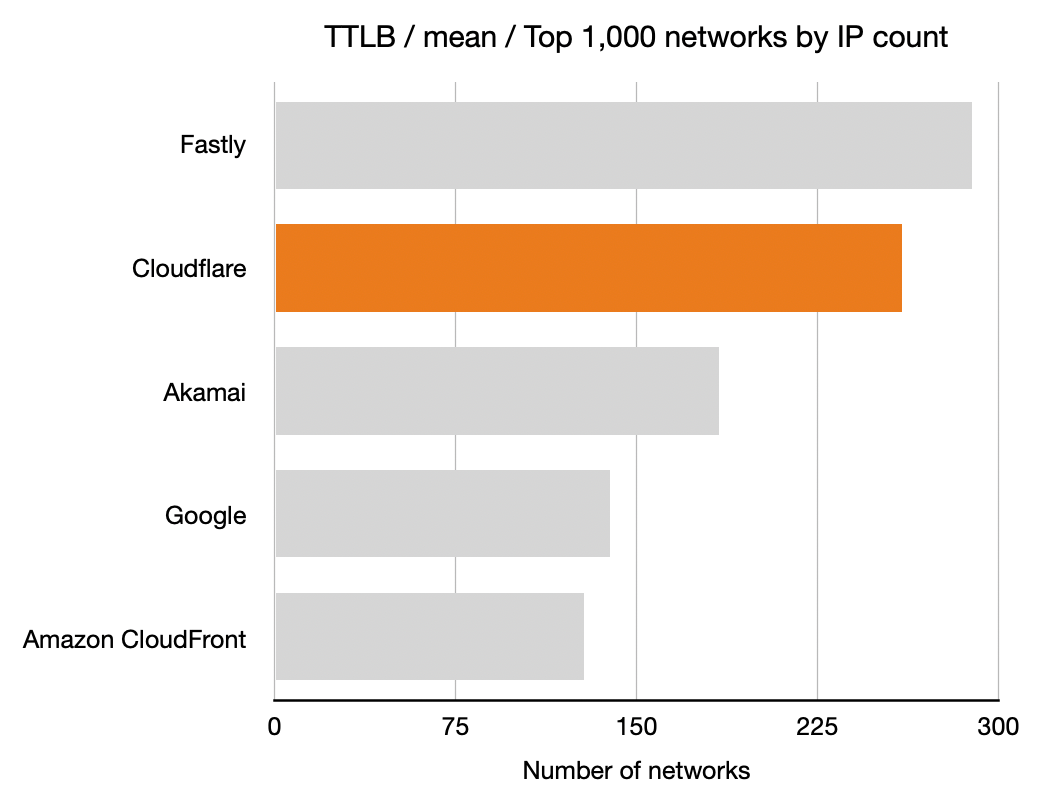
Top 1,000 networks by number of IP addresses is interesting (it includes the major ISPs) but it also includes some networks that have huge numbers of IP addresses available that aren’t necessarily used. These come about because of historical allocations of IP addresses organisations like the US Department of Defense.

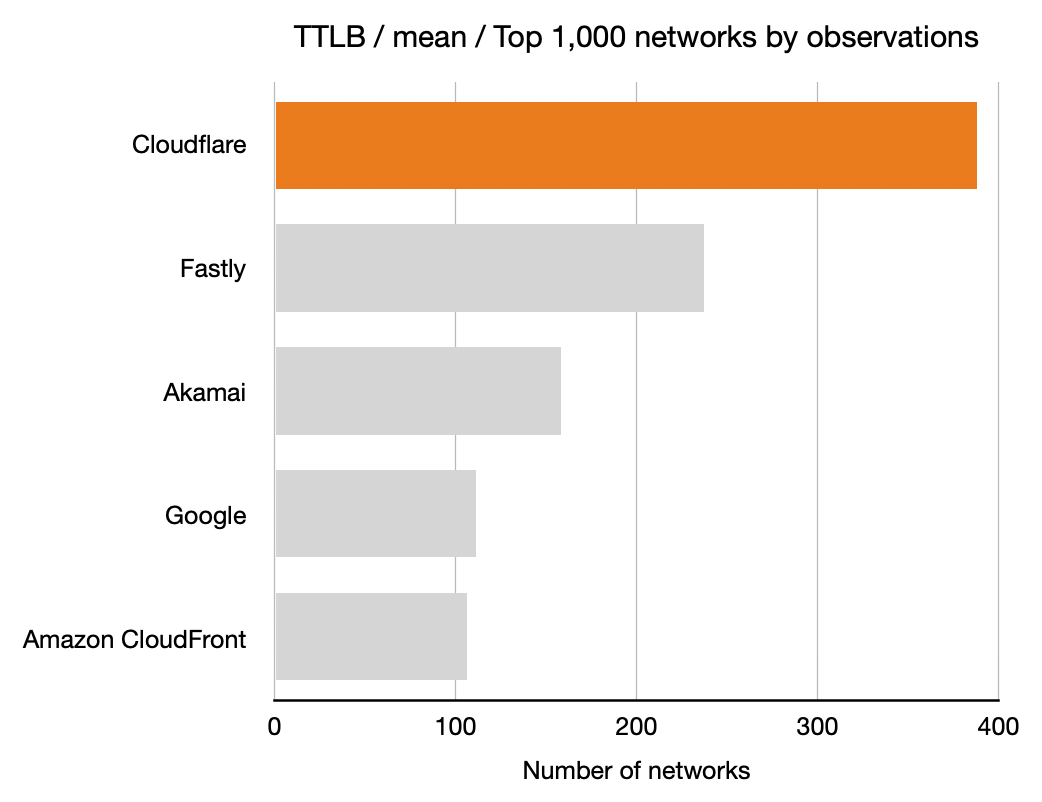
Cloudflare’s testing reveals which networks are most used, and so we also report results for the top 1,000 networks by number of observations to get an idea of how we’re performing on networks with heavy usage.

Hence, we have 18 charts showing all combinations of (TCP connection time, TTFB, TTLB), (mean, p95) and (all networks, top 1,000 networks by IP count, top 1,000 networks by observations).

You’ll see that in two of the charts Cloudflare is not #1 of 18 (we’re #2). We’ll be working to make sure we’re #1 for every measurement over the next few weeks. Both of those are average times. We’re most interested in the p95 measurements because they show the “reasonable worst case” scenario for someone using the Internet. But as we go about optimizing performance we want to be #1 on every chart so that we’re top no matter how performance is measured.
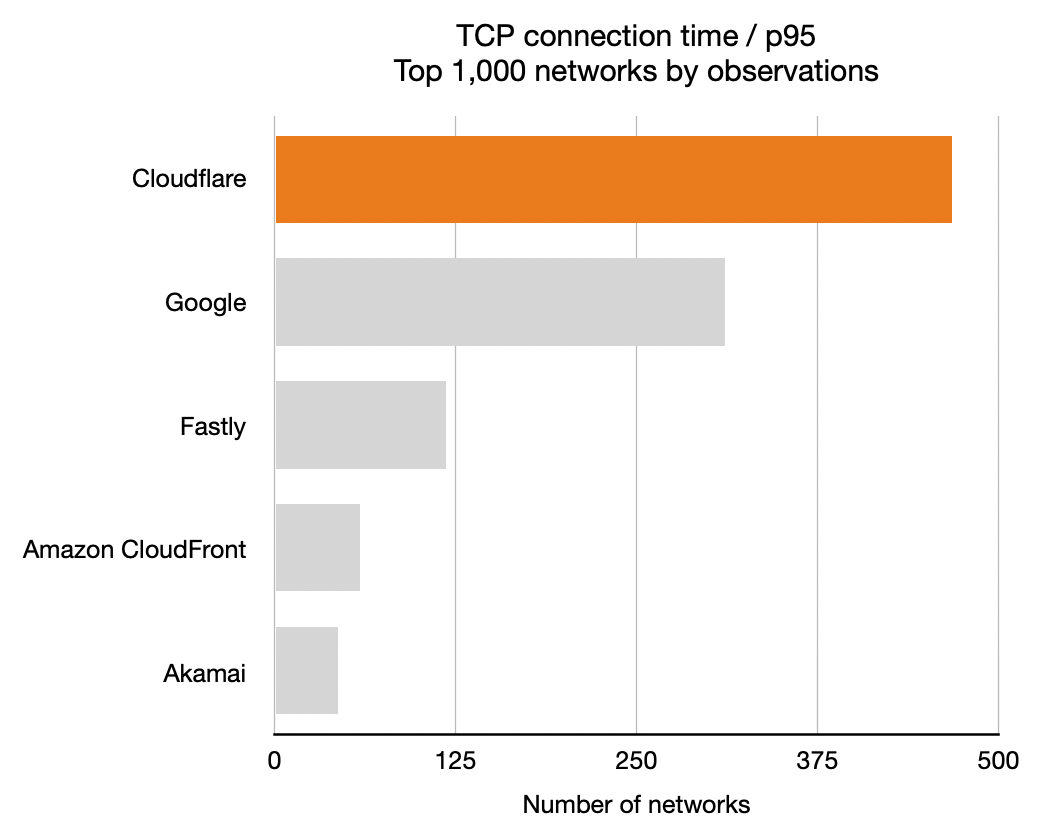
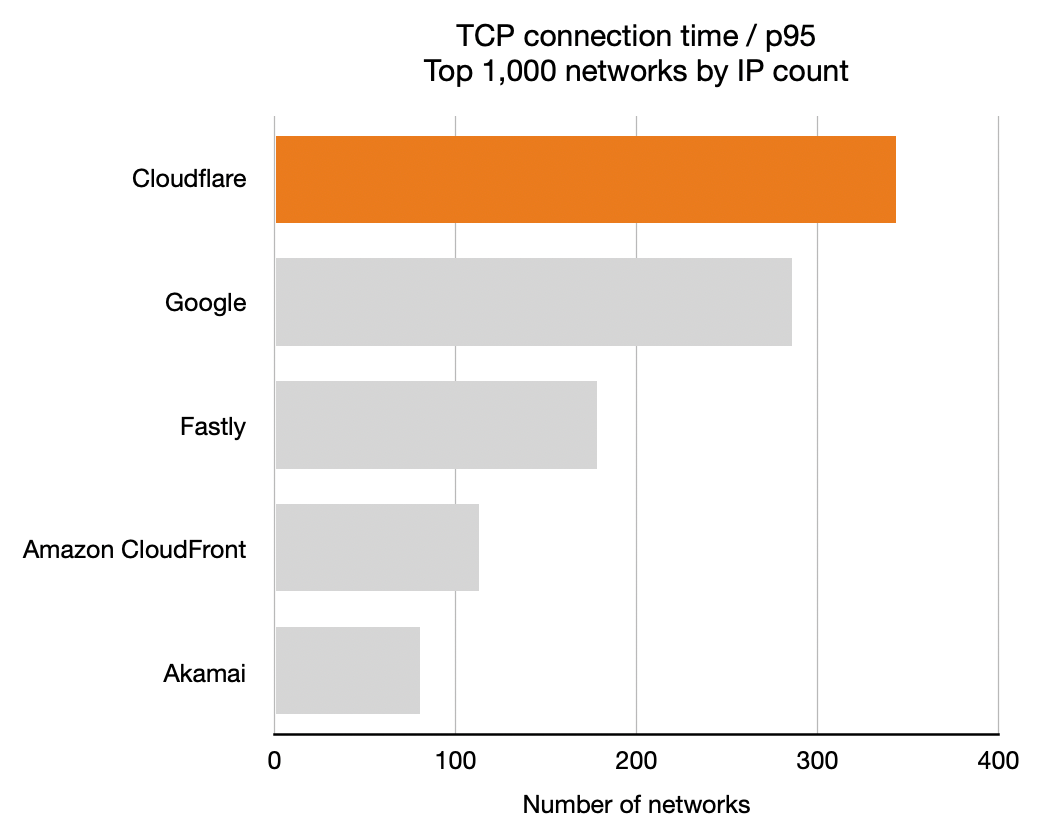
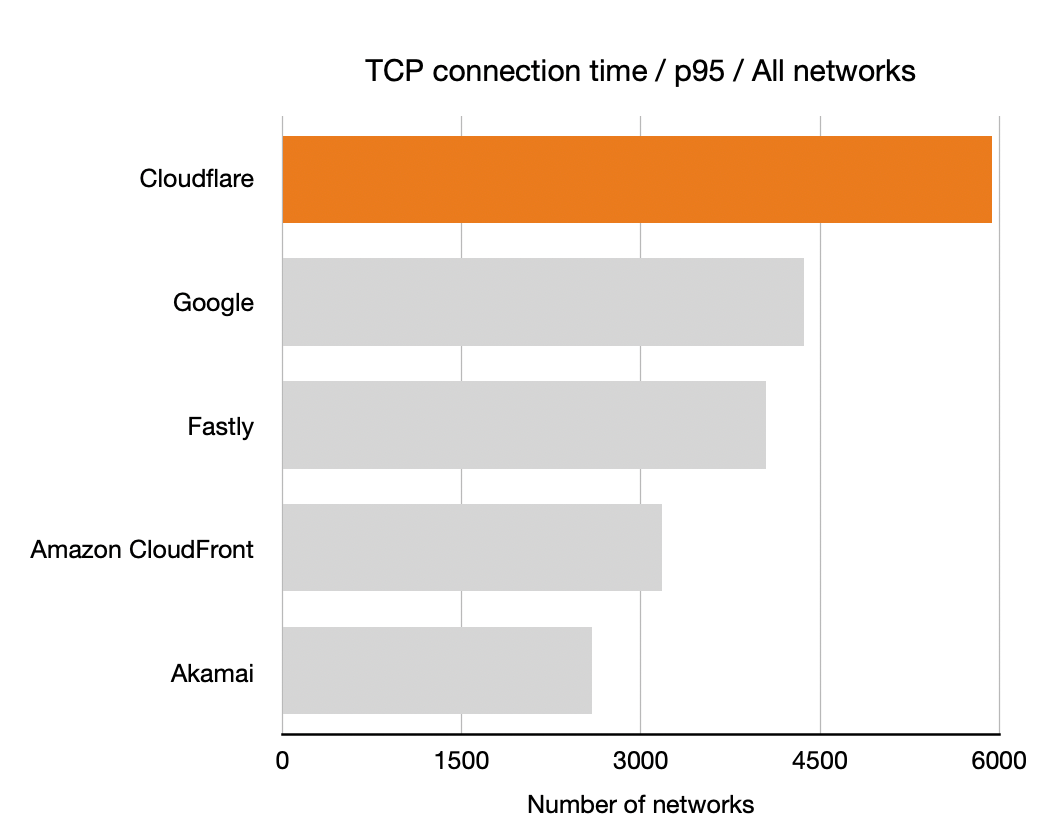
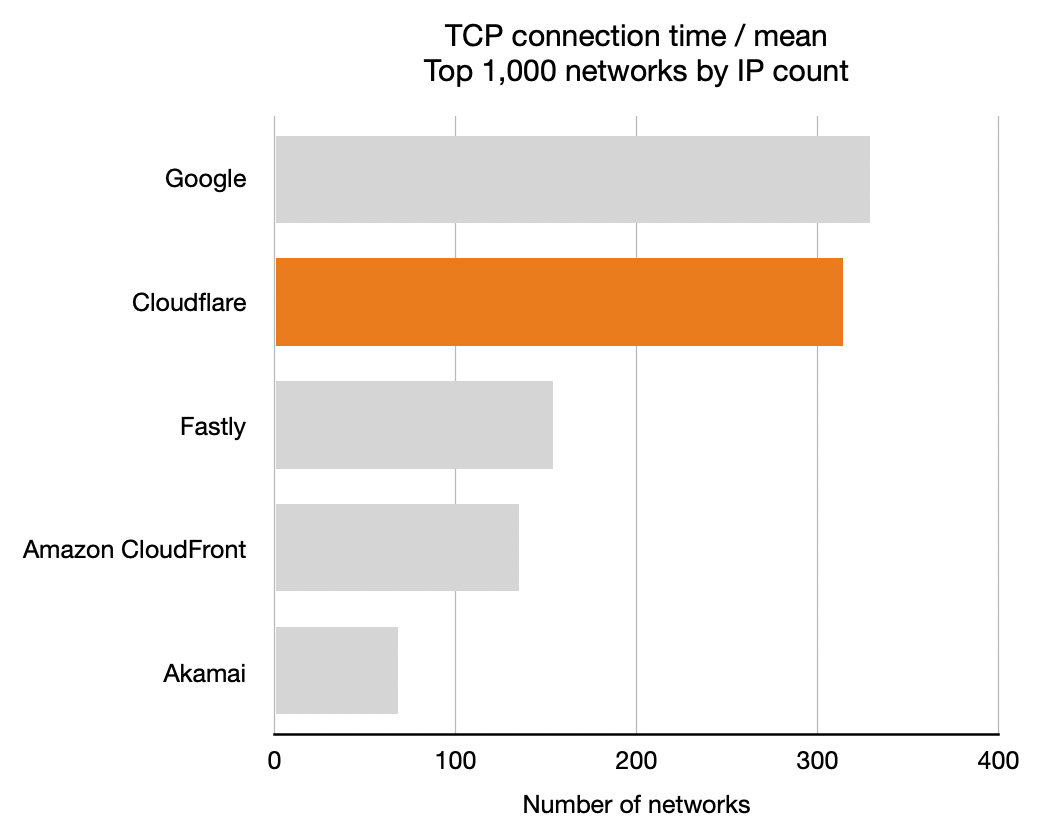
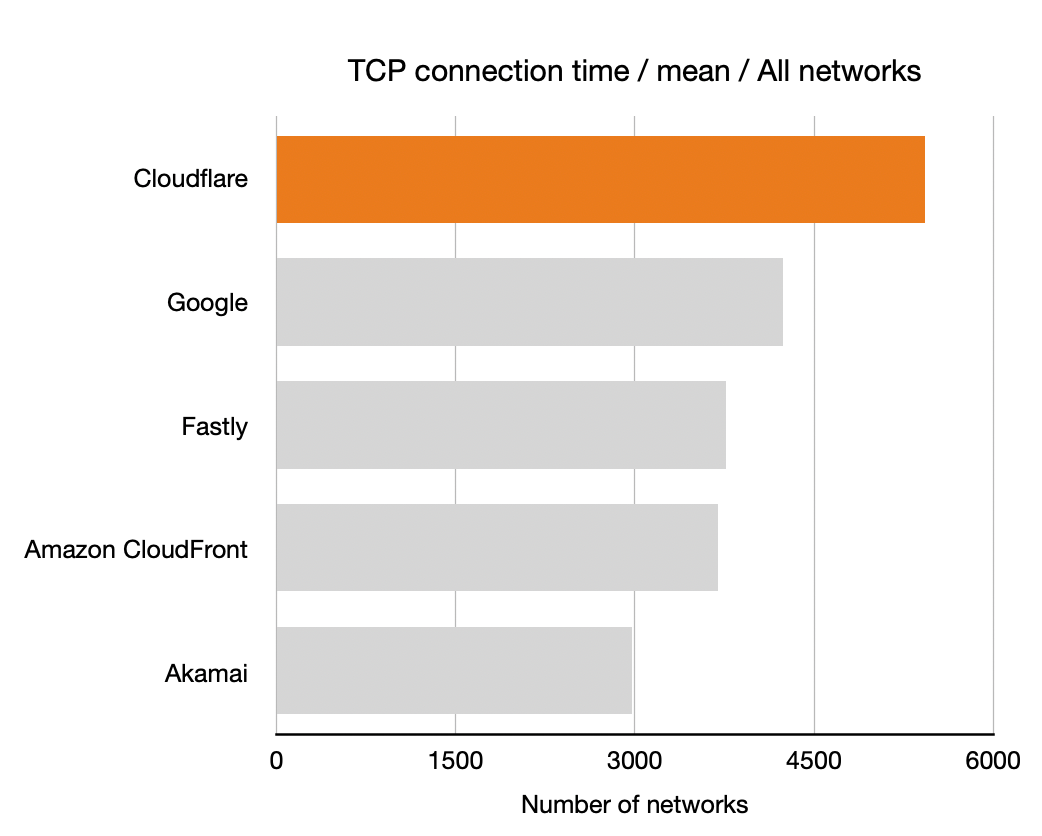
TCP Connection Time

Let’s start with TCP connection time to get a sense of how well-connected the five companies we’ve measured. Recall that longer bars are better here, they indicate that the particular CDN was the highest performance for that many networks: more networks is better.

Benchmarking Edge Network Performance: Akamai, Cloudflare, AWS CloudFront, Fastly, and Google Benchmarking Edge Network Performance: Akamai, Cloudflare, AWS CloudFront, Fastly, and Google

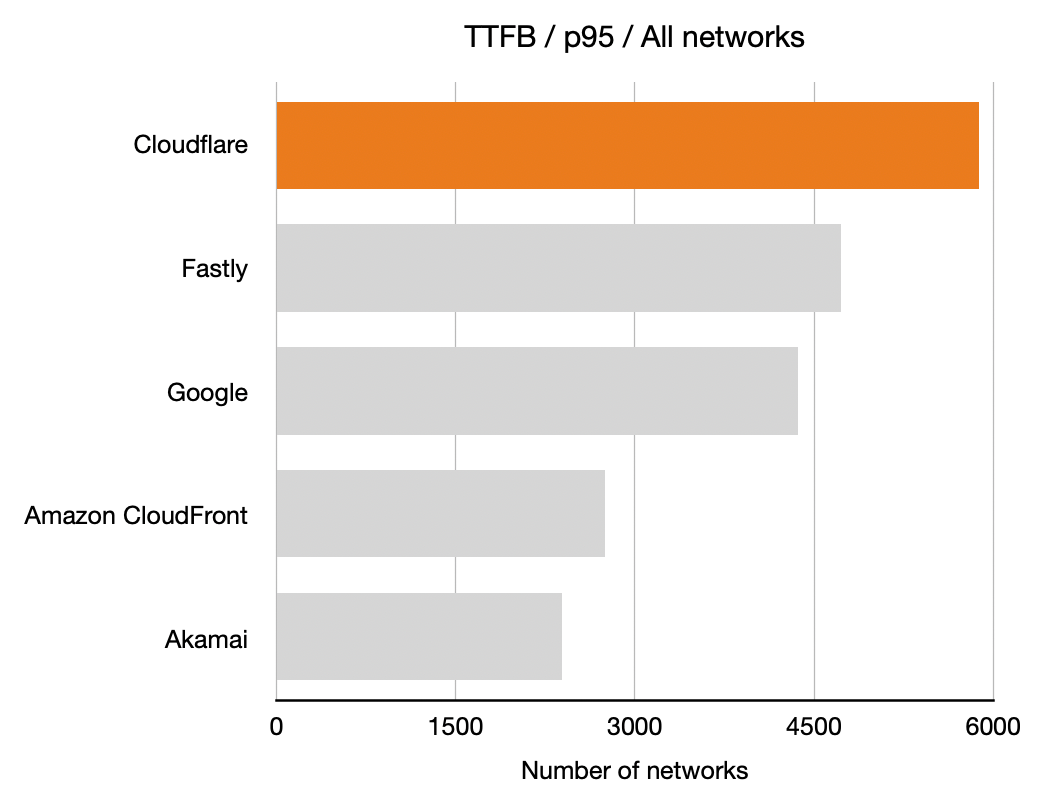
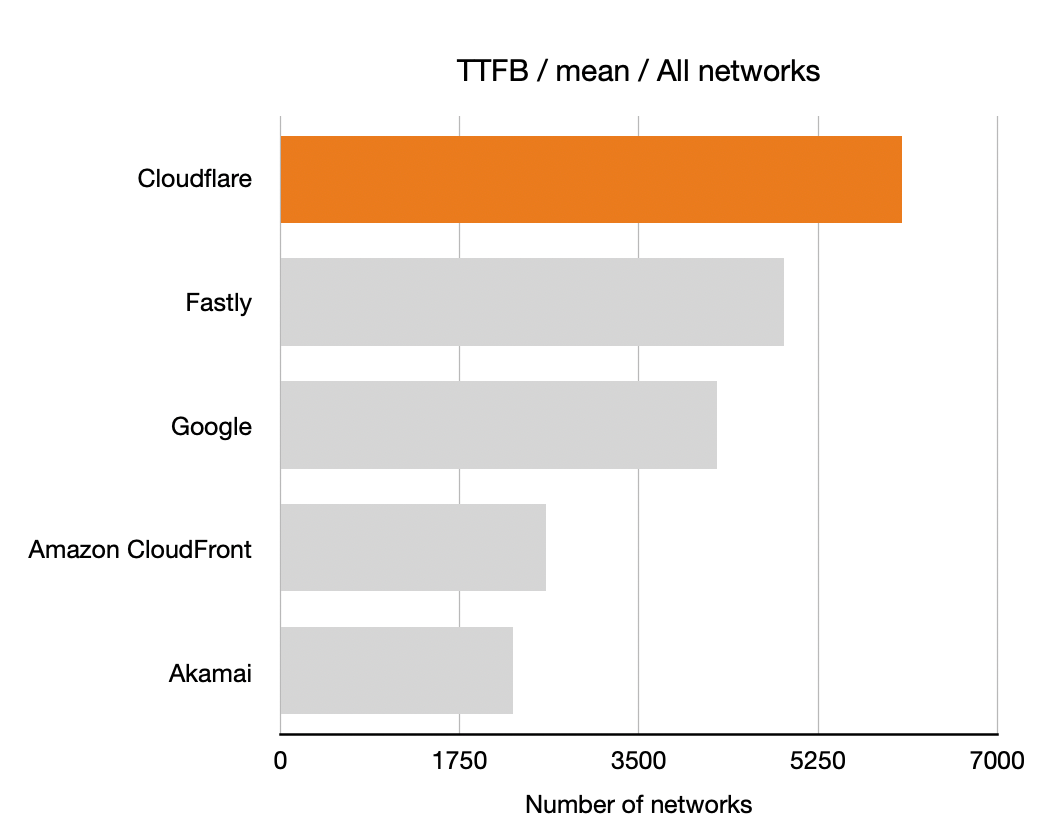
Time To First Byte (TTFB)

Next up is TTFB for the five companies. Once again, longer bars is better means more networks where that CDN had the lowest TTFB.

Benchmarking Edge Network Performance: Akamai, Cloudflare, AWS CloudFront, Fastly, and Google Benchmarking Edge Network Performance: Akamai, Cloudflare, AWS CloudFront, Fastly, and Google

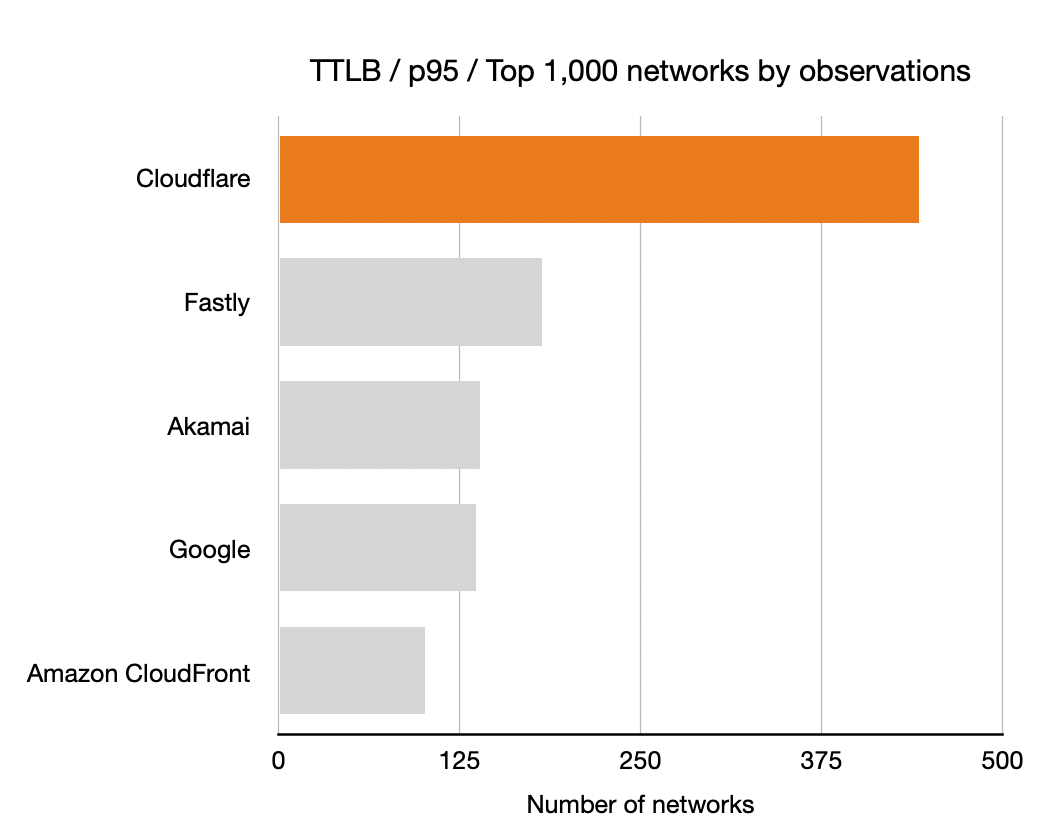
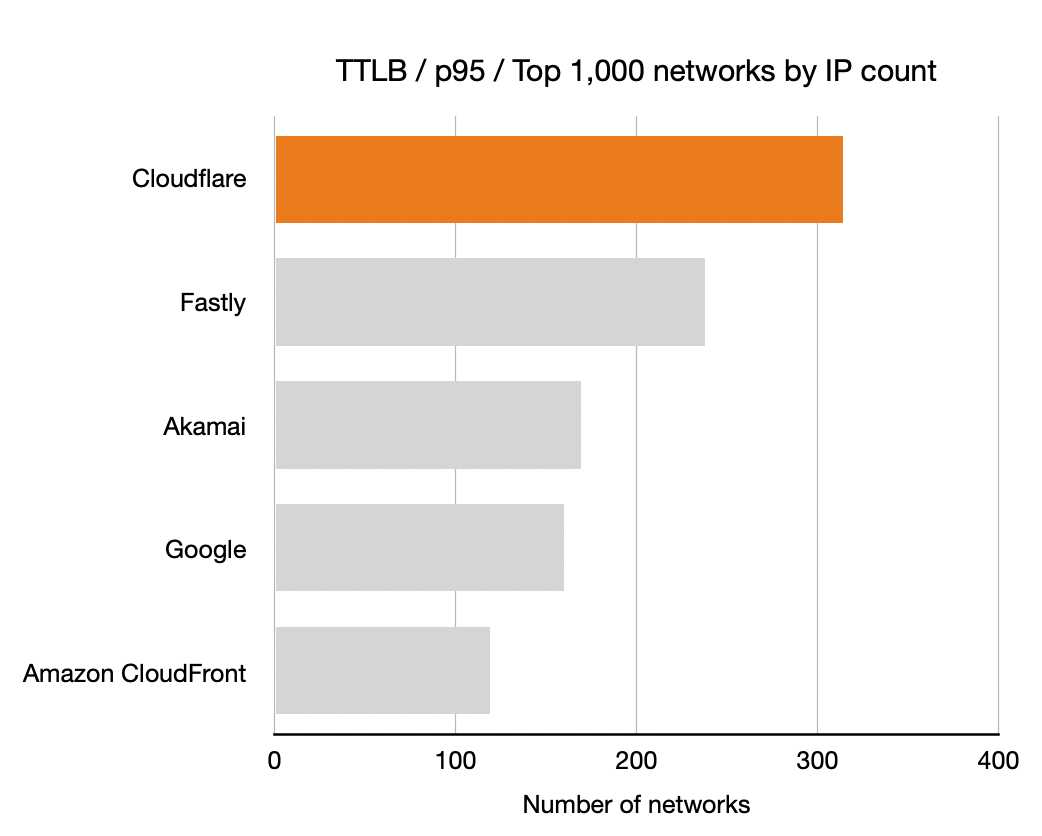
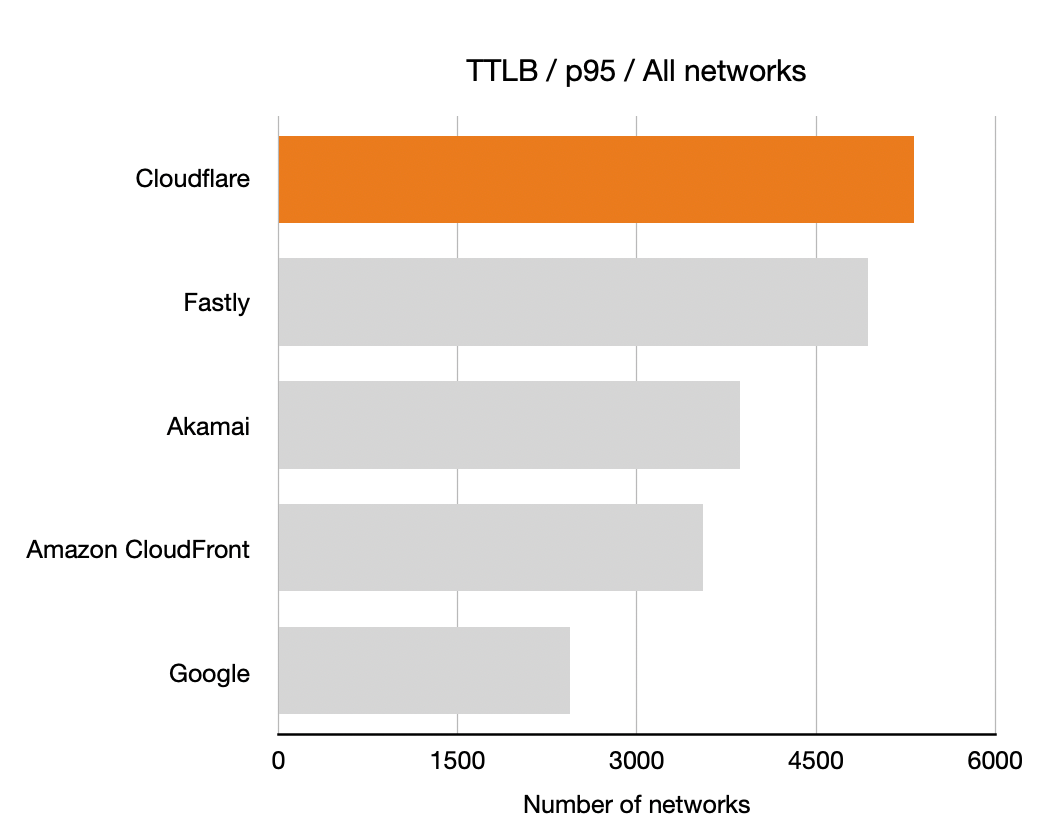
Time To Last Byte (TTLB)

And finally the TTLB measurements. Once again, longer bars is better means more networks where that CDN had the lowest TTLB.

Benchmarking Edge Network Performance: Akamai, Cloudflare, AWS CloudFront, Fastly, and Google Benchmarking Edge Network Performance: Akamai, Cloudflare, AWS CloudFront, Fastly, and Google

Optimization Targets

Looking not just at where we are #1 but where we are #1 or #2 helps us see how quickly we can optimize our network to be #1 in more places. Examining the top 1,000 networks by observations we see that we’re currently #1 or #2 for TTFB in 69.9% of networks, for TTLB in 65.0% of networks and for TCP connection time in 70.5%.

To see how much optimization we need to do to go from #2 to #1 we looked at the three measures and see that median TTFB of the #1 network is 92.3%, median TTLB is 94.0% and TCP connection time is 91.5%.

The latter figure is very interesting because it shows that we can make big gains by optimizing network level routing.

Where’s the world map?

It’s very common to present data about Internet performance on maps. World maps look good but they obscure information. The reason is very simple: world maps show geography (and, depending on the projection, a very skewed version of the world’s actual countries and land masses).

Here’s an example world map with countries colored by who had the lowest TTLB at p95. Cloudflare is in orange, Amazon CloudFront in yellow, Google in purple, Akamai in red and Fastly in blue.

Benchmarking Edge Network Performance: Akamai, Cloudflare, AWS CloudFront, Fastly, and Google

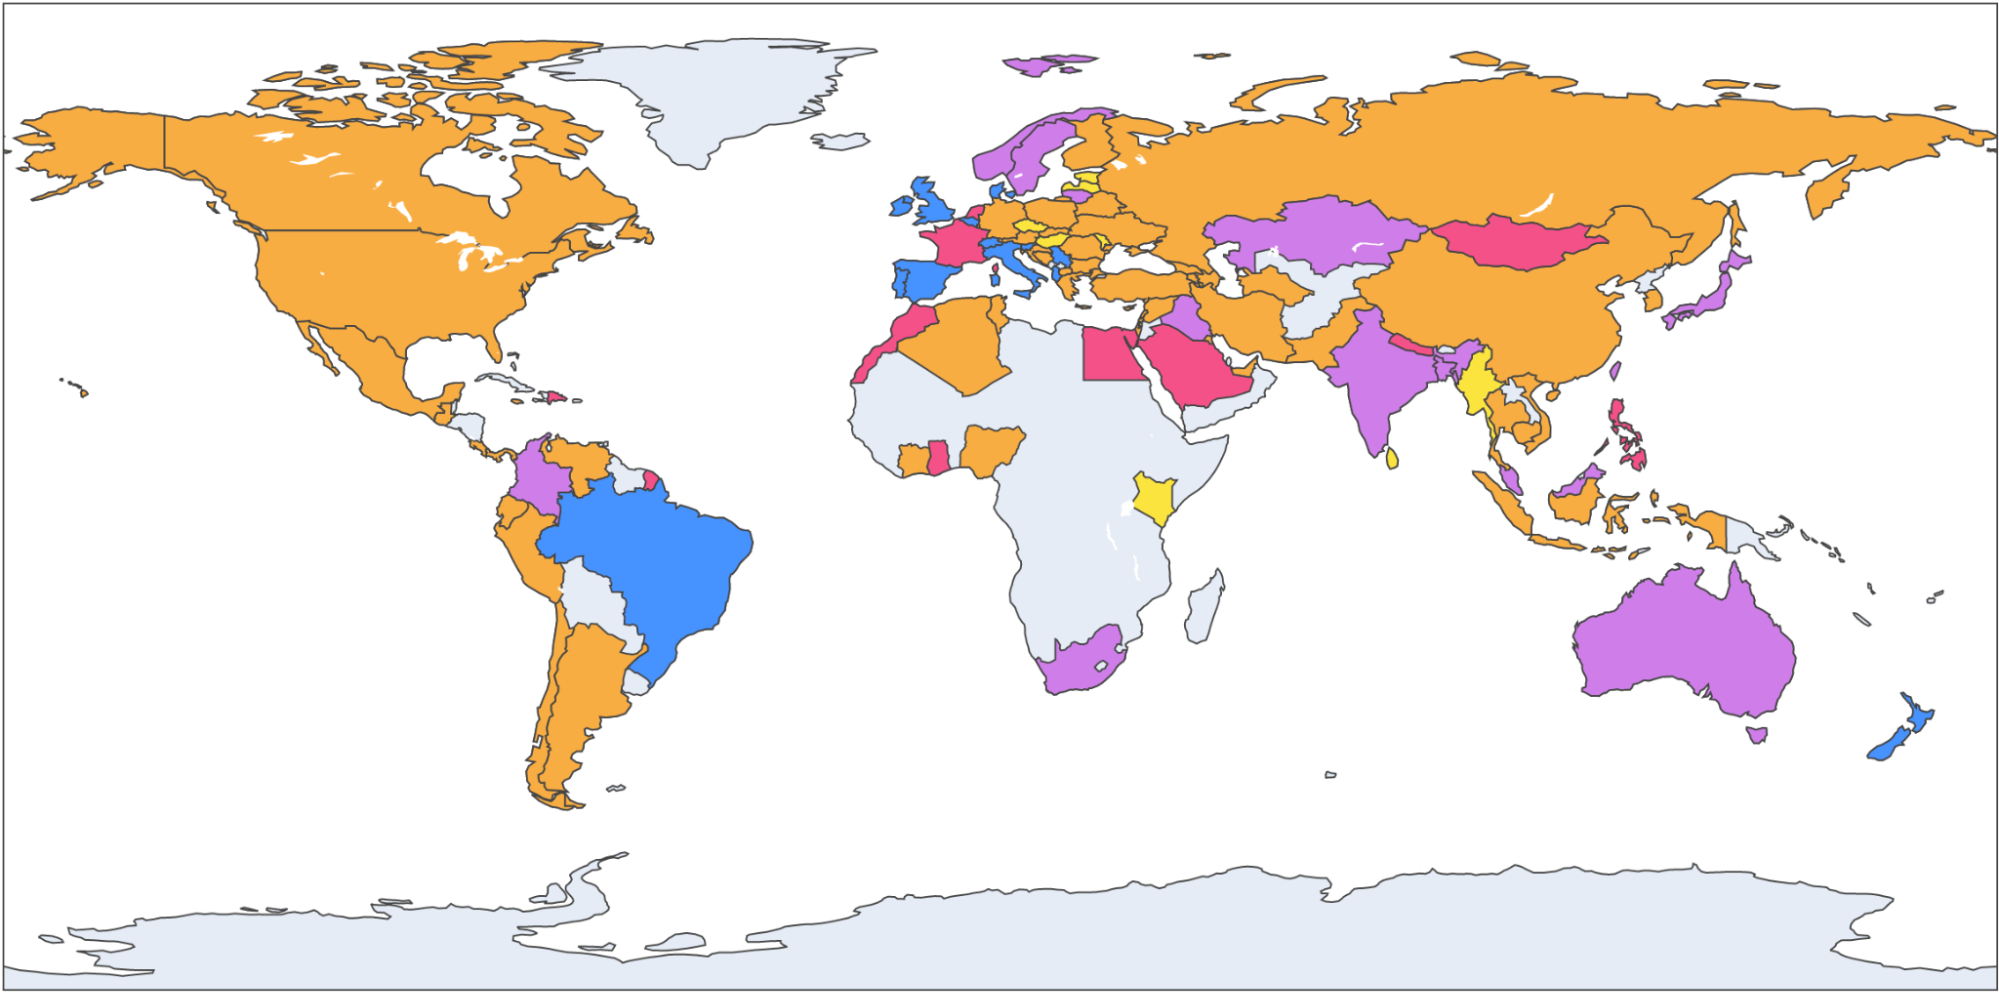
What that doesn’t show is population. And Cloudflare is interested in how well we perform for people. Consider Russia and Indonesia. Indonesia has double the population of Russia and about 1/10th of the land.

By focusing on networks we can optimize for the people who use the Internet. For example, Biznet is a major ISP in Indonesia with ASN 17451. Looking at TTFB at p95 (the same statistics we discussed earlier for US ISPs Cox and Comcast) we see that for Biznet users Cloudflare has the fastest p95 TTFB at 677.7ms, Fastly 744.0ms, Google 872.8ms, Amazon CloudFront 1,239.9 and Akamai 1,248.9ms.

What’s next

The data we’ve gathered gives us a granular view of every network that connects to Cloudflare. This allows us to optimize routes and over the coming days and weeks we’ll be using the data to further increase Cloudflare’s performance.

In just over a week it’s Cloudflare’s Birthday Week, and we are aiming to improve our performance in 10% of the networks where we are not #1 today. Stay tuned.

Announcing Project Turpentine: an easy way to get off Varnish

Post Syndicated from Joao Sousa Botto original https://blog.cloudflare.com/announcing-turpentine/

Announcing Project Turpentine: an easy way to get off Varnish

Announcing Project Turpentine: an easy way to get off Varnish

When Varnish and the Varnish Configuration Language (VCL) were first introduced 15 years ago, they were an incredibly powerful combination to configure caching on servers (and your networks). It seemed a logical choice for a language to configure CDNs — caching in the cloud.

A lot has changed on the Internet since then.

In particular, caching is just one of many things that “CDNs” are expected to do: load balancing, DDoS protection, rate limiting, transformations, synthetic responses, routing and more. But above all what “CDNs” need to be is programmable, not just configurable.

Configuration went from a niche activity to a much more common — and often involved — requirement. We’ve heard from a lot of teams that want to remove critical dependencies on the one person they have who knows how to make configuration changes — because they’re the only one on the team who knows how to write in VCL.

But it’s not just about who can write VCL — it’s what VCL is increasingly being asked to do. A lot of our customers have told us that they have much greater expectations for what they expect the network to do: they don’t just want to configure anymore… they want to be able to program it! VCL is being pushed and stretched into things it was never envisaged to do.

These are often the frustrations we hear from customers about the use of VCL. And yet, at the same time, migrations are always hard. Taking thousands of lines of code that have been built up over the years for a mission critical service, and rewriting it from scratch? Nobody wants to do that.

Today, we are excited to announce a solution to all these problems: Turpentine. Turpentine is a true VCL-to-TypeScript converter: it is the easiest and most effective way for you to migrate your legacy Varnish to a modern, Turing-complete programming language and onto the edge. But don’t think that because you’re moving up in terms of language abstraction that you’re giving up performance — it’s the opposite. Turpentine enables porting your VCL-based configuration to Cloudflare Workers — which is known for its speed. Beyond being able to eliminate the use of VCL, Turpentine enables you to take full advantage of Cloudflare: including proxies, firewall, load balancers, tiered caching/shielding and everything else Cloudflare offers.

And you’ll be able to configure it using one of the most widely used languages in the world.
Whether you’re using standard configurations, or have a heavily customized VCL file, Turpentine will generate human-readable and well commented TypeScript code and deploy it to our serverless platform that is… fast.

Announcing Project Turpentine: an easy way to get off Varnish

How It Works

To turn a VCL into TypeScript code that is well optimized, human-readable, and commented, Turpentine takes a three-phase approach:

  1. The VCL is parsed, its meaning is understood, and TypeScript code that preserves its intentions is generated. This is more than transpiling. All the functionality configured in the VCL is rewritten to the best solution available. For example, rate limiting might be custom code on your VCL — but have native functionality on Cloudflare.
  2. The code is cleaned and optimized. During this phase, Turpentine looks for redundancies and inefficiencies, and removes them. Your code will be running on Cloudflare Workers, the fastest serverless platform in the world, and we definitely don’t want to leave behind inefficiencies that would prevent you from enjoying its benefits to the full extent.
  3. The final step is pretty printing. The whole point of this exercise is to make the code easy to understand by as many people as possible on your team — so that virtually any engineer on your team, not just infrastructure experts, can program your network moving forward.

Turpentine in Action

We’ve been perfecting Turpentine in a private beta with some very large customers who have some very complicated VCL files.

Here’s a demo of a VCL file being converted to a Worker:

Legacy to Modern

Happily, this all occurs without the pains of the usual legacy migration. There’s no project plan. No engineers and IT teams trying to replicate each bit of configuration or investigating whether a specific feature even existed.

If you’re interested in finding out more, please register your interest in the sign-up form here — we’d love to explore with you. For now, we’re staying in private beta, so we can walk every new customer through the process. A Cloudflare engineer will help your team get up to speed and comfortable with the new infrastructure.

Announcing Project Turpentine: an easy way to get off Varnish

Early Hints: How Cloudflare Can Improve Website Load Times by 30%

Post Syndicated from Alex Krivit original https://blog.cloudflare.com/early-hints/

Early Hints: How Cloudflare Can Improve Website Load Times by 30%

Early Hints: How Cloudflare Can Improve Website Load Times by 30%

Want to know a secret about Internet performance? Browsers spend an inordinate amount of time twiddling their thumbs waiting to be told what to do. This waiting impacts page load performance. Today, we’re excited to announce support for Early Hints, which dramatically improves browser page load performance and reduces thumb-twiddling time.

In initial tests using Early Hints, we have observed more than 30% improvement to page load time for browsers visiting a website for the first time.

Early Hints is available in beta today — Cloudflare customers can request access to Early Hints in the dashboard’s Speed tab. It’s free for all customers because we think the web should be fast!

Early Hints in a nutshell

Browsers need instructions for what to render and what resources need to be fetched to complete “painting” a given web page. These instructions come from a server response. But the servers sending these responses often need time to compile these resources — this is known as “server think time.” While the servers are busy during this time… browsers sit idle and wait.

Early Hints takes advantage of “server think time” to asynchronously send instructions to the browser to begin loading resources while the origin server is compiling the full response. By sending these hints to a browser before the full response is prepared, the browser can figure out what it needs to do to load the webpage faster for the end user. Faster page loads and lower user-perceived latency means happier users!

More formally, Early Hints is a web standard that defines a new HTTP status code (103 Early Hints) that defines new interactions between a client and server. 103s are served to clients while a 200 OK (or error) response is being prepared (the so-called “server think time”), and contain hints on which assets will likely be needed to fully render the web page. This hinting speeds up page loads and generally reduces user-perceived latency.

Sending hints on which assets to expect before the entire response is compiled allows the browser to use think time (when it would otherwise have been waiting) to fetch needed assets, prepare parts of the displayed page, and otherwise get ready for the full response to be returned.  

Early Hints: How Cloudflare Can Improve Website Load Times by 30%

Cloudflare, as an edge network that sits in between client and server, is well positioned to issue these hints to clients on servers’ behalf. This is true for a few reasons:

  1. 103 is an experimental status code that origins may not be able to emit on their own, mostly for legacy reasons. Much of the machinery that powers the web incorrectly assumes that HTTP requests always correspond 1:1 with HTTP responses. This mistaken premise is baked into most HTTP server software, making it difficult for origin servers to emit Early Hints 103 responses prior to a “final” 200 OK response.

    Cloudflare edge servers handling this complexity on behalf of our customers neatly sidesteps these technical challenges and gets the adoption flywheel spinning faster on this exciting new technology (more on this flywheel later).

  2. Cloudflare’s edge is very close to end users. This means we can serve hints very quickly, filling even the smallest of server think blocks with useful information the client can use to get a jump start on loading assets.
  3. Cloudflare already sees request and response flow from our customers. We use this data to generate hints automatically, without a customer needing to make any origin changes at all.

How can we speed up “slow” dynamic page loads?

The typical request/response cycle between browsers and servers leaves a lot of room for optimization. When you type an address into the search bar of your browser and press Enter, a series of things happen to get you the content you need, as quickly as possible. Your browser first converts the hostname in the URL into an IP address, then establishes an initial connection to the server where the content is stored.

After the connection is established, the actual request is sent. This is often a GET request with a bunch of information about what the browser can and cannot display to the end user. Following the request, the browser must wait for the origin server to send the first bytes of the response before it begins to render the page. In this time, the server is busy executing all sorts of business logic (looking things up in databases, personalizing the page, detecting fraud, etc.) before spitting a response out to the browser.

Once the response for the original HTML page is received, the browser then needs to parse the page, generate a Document Object Model (DOM), and begin loading subresources specified on the page, like images, scripts, and additional stylesheets.

Let’s take a look at this in action. Below is the performance waterfall for a checkout page on pinecoffeesupply.com, a coffee shop with a storefront on Shopify:  

Early Hints: How Cloudflare Can Improve Website Load Times by 30%

Page rendering cannot complete (and the shopper can’t get their coffee fix, and the coffee shop can’t get paid!) until key assets are loaded. Information on subresources needed for the browser to load the page aren’t available until the server has thought about and returned the initial response (the first document in the above table). In the above example, the page load could have been accelerated had the browser known, prior to receiving the full response, that the stylesheet and the four subsequent scripts will be needed to render the page.

Attempting to parallelize this dependency is what Early Hints is all about — productively using that “server think time” to help get the browser going on critical steps to render the page before the full server response arrives. The green “thinking” bar overlaps with the blue “content download” bar, allowing both the browser and server to be preparing the page at the same time. No more waiting. This is what Early Hints is all about!

“Entrepreneurs know that first impressions matter. Shopify’s own data shows that on average, when a store improves the speed of the first page in the buyer journey by 10%, there is a 7% increase in conversion. We see great promise in Early Hints being another tool to help improve the performance and experience for all merchants and customers.”
Colin Bendell, Director Performance Engineering at Shopify

How does Early Hints speed things up?

Early Hints is a status code used in non-final HTTP responses. It is designed to speed up overall page load times by giving the browser an early signal about what certain linked assets might appear in the final response. The browser takes those hints and begins preparing the page for when the final 200 OK response from the server arrives.

The RFC provides this example of how the request/response cycle will look with Early Hints:

Client request:

GET / HTTP/1.1 
Host: example.com

Server responses:
Early Hint Response

HTTP/1.1 103 Early Hints
     Link: </style.css>; rel=preload; as=style
     Link: </script.js>; rel=preload; as=script

…Server Think Time…

Full Response

HTTP/1.1 200 OK
     Date: Thurs, 16 Sept 2021 11:30:00 GMT
     Content-Length: 1234
     Content-Type: text/html; charset=utf-8
     Link: </style.css>; rel=preload; as=style
     Link: </script.js>; rel=preload; as=script

[Rest of Response]

Seems simple enough. We’ve neatly communicated information to the browser on what resources it should consider preloading while the server is computing a full response.

This isn’t a new idea though!

Didn’t server push try to solve this problem?

There have been previous attempts at solving this problem, notably HTTP/2 “server push”. However, server push suffered from two major problems:

Server push sent the wrong bytes at the wrong time

The server pushed assets to the client, without great awareness of what was already present in browser caches, without knowing how much “server think time” would elapse and how best to spend it. Web performance guru Pat Meenan summarized server push’s gotchas in a mail thread discussing Chrome’s intent to deprecate and remove server push support:

Push sounds like a great solution, particularly when it can be done intelligently to not push resources already in cache and if it can exactly only fill the wait time while a CDN edge goes back to an origin for the HTML but getting those conditions right in practice is extremely rare. In virtually every case I have seen, the pushed resources end up delaying the HTML itself, the CSS and other render-blocking resources. Delaying the HTML is particularly bad because it delays the browser’s discovery of all of the other resources on the page. Preload works with the normal document parsing and resource discovery, letting preloaded resources intermix with other important resources and giving the dev, browsers and origins more control over prioritization.

Early Hints avoids these issues by “hinting” (vs. push being dictatorial) to clients which assets they should load, allowing them to prioritize resource loads with more complete information about what they will likely need to render a page, what they have cached, and other heuristics.

Using Early Hints with “rel=preload” solves the unsolicited bytes problem, but can still suffer from the ordering issue (forcing clients to load the wrong bytes at the wrong time). Early Hints’ superpower may actually be its use in conjunction with “rel=preconnect”. Many pages load hundreds of third party resources, and setting up connections and TLS sessions with each outside origin is time (but not bandwidth) intensive. Setting up these third party origin connections early, during think time, has practical advantages for page loading experience without the potential collateral damage of using “rel=preload”.

Server push wasn’t broadly implemented

The other notable issue with Server Push was that browsers supported it, and some origin servers implemented the feature, but no major CDN products (Cloudflare’s included) deemed the feature promising enough to implement and support at scale. Support for standards like server push or Early Hints in each key piece of the web content supply chain is critical for mass adoption.

Cracking the chicken and egg problem

Early Hints: How Cloudflare Can Improve Website Load Times by 30%

Standards like Early Hints often don’t get off the ground because of this chicken and egg problem: clients have no reason to support new standards without server support and servers have no reason to implement support without clients speaking their language. As previously discussed, Early Hints is particularly complicated for origins to directly support, because 103 is an unfamiliar status code and multiple responses to a single request may not be a well-supported pattern in common HTTP server and application stacks.

We’ve tackled this in a few ways:

  1. Close partnership with Google Chrome and other browser teams to build support for the same standard at the same time, ensuring a critical mass of adoption for Early Hints from day one.
  2. Developing ways for hints to be emitted by our edge to clients with support for the standard without requiring support for the standard from the origin. We’ve been fortunate to have a ready, willing, and able design partner in Shopify, whose performance engineering team has been instrumental in shaping our implementation and testing our production deployment.

We plan to support Early Hints in two ways: one enabled now, and the other coming soon.

To avoid requiring origins to emit 103 responses from their origins directly, we settled on an approach that takes advantage of something many customers already used to indicate which assets an HTML page depends on, the Link: response header.

  • When Cloudflare gets a response from the origin, we will parse it for Link headers with preload or preconnect rel types. These rel types indicate to the browser that the asset should be loaded as soon as possible (preload), or that a connection should be established to the specified origin but no bytes should be transferred (preconnect).
  • Cloudflare takes these headers and caches them at our edge, ready to be served as a 103 Early Hints payload.
  • When subsequent requests come for that asset, we immediately send the browser the cached Early Hints response while proxying the request to the origin server to generate the full response.
  • Cloudflare then proxies the full response from origin to the browser when it’s available.
  • When the full response is available, it will contain Link headers (that’s how we started this whole story). We will compare the Link headers in the 200 response with the cached version to make sure that they are the most up to date. If they have changed since they’ve been cached, we will automatically purge the out-of-date Early Hints and re-cache the new ones.

Coming soon: Smart Early Hints generation at the edge

We’re working hard on the next version of Early Hints. Smart Early Hints will use machine learning to generate Early Hints even when there isn’t a Link header present in the response from which we can harvest a 103. By analyzing historical request/response cycles for our customers, we can infer what assets being preloaded would help browsers load a webpage more quickly.

Look for Smart Early Hints in the next few months.

Browser support

As previously mentioned, we’ve partnered closely with Google Chrome and other browser vendors to ensure that their implementations of Early Hints interoperate well with Cloudflare’s. Google Chrome, Microsoft Edge, and Mozilla Firefox have announced their intention to support Early Hints. Progress for this support can be tracked here and here. We expect more browsers to announce support soon.

Benchmarking the impact of Early Hints

Once you get accepted into the beta and enable the feature, you can see Early Hints in action using Google Chrome, version 94 or higher. As of Sept 16th 2021, the Chrome Dev channel is at version 94.

Testing Early Hints with Chrome version 94 or higher

Early Hints support is available in Chrome by running (assuming a Mac, but the same flag works on Windows or Linux):

open /Applications/Google\ Chrome\ Dev.app --args --enable-features=EarlyHintsPreloadForNavigation

Testing Early Hints with Web Page Test

  1. Open webpagetest.org (a free performance testing tool).
  2. Specify the desired test URL. It should have the necessary preload/preconnect rel types in the Link header of the response.
  3. Choose Chrome Canary (or any Chrome version higher than 94) for the browser
  4. Under advanced settings, select Chromium.
  5. At the bottom of the Chromium section there’s a command-line section where you should paste Chrome’s Early Hints flag: --enable-features=EarlyHintsPreloadForNavigation.
  • To see the page load comparison, you can remove this flag and Early Hints won’t be enabled.

You can also test via Chrome’s Origin Trials.

Using Web Page Test, we’ve been able to observe greater than 30% improvement to a page’s content loading in the browser as measured by Largest Contentful Paint (LCP). An example test filmstrip:

Early Hints: How Cloudflare Can Improve Website Load Times by 30%

A few other considerations when testing…

  • Chrome will not support Early Hints on HTTP/1.1 (or earlier protocols).
  • Chrome will not support Early Hints on subresource requests.
  • We encourage testers to see how different rel types improve performance along with other Cloudflare performance enhancements like Argo.
  • It can be hard to see which resources are actually being loaded early as a result of Early Hints. Interrogating the ResourceTiming API will return initiator=EarlyHints for those assets.

Signing up for the Early Hints beta

Early Hints promises to revolutionize web performance. Support for the standard is live at our edge globally and is being tested by customers hungry for speed.

How to sign up for Cloudflare’s Early Hints beta:

  1. Sign in to your Cloudflare Account
  2. In the dashboard, navigate to Speed tab
  3. Click on the Optimization section
  4. Locate the Early Hints beta sign up card and request access. We’re enabling access for users on the beta list in batches.

Early Hints holds tremendous promise to speed up everyone’s experience on the web. It’s exactly the kind of product we like working on at Cloudflare and exactly the kind of feature we think should be free, for everyone. Be sure to check out the beta and let us know what you think.

You can explore our beta implementation in the Speed tab. And if you’re an engineer interested in improving the performance of the web for all, come join us!

The Zero Trust platform built for speed

Post Syndicated from Kenny Johnson original https://blog.cloudflare.com/the-zero-trust-platform-built-for-speed/

The Zero Trust platform built for speed

The Zero Trust platform built for speed

Cloudflare for Teams secures your company’s users, devices, and data — without slowing you down. Your team should not need to sacrifice performance in order to be secure. Unlike other vendors in the market, Cloudflare’s products not only avoid back hauling traffic and adding latency — they make your team faster.

We’ve accomplished this by building Cloudflare for Teams on Cloudflare. All the products in the Zero Trust platform build on the improvements and features we’re highlighting as part of Speed Week:

  1. Cloudflare for Teams replaces legacy private networks with Cloudflare’s network, a faster way to connect users to applications.
  2. Cloudflare’s Zero Trust decisions are enforced in Cloudflare Workers, the performant serverless platform that runs in every Cloudflare data center.
  3. The DNS filtering features in Cloudflare Gateway run on the same technology that powers 1.1.1.1, the world’s fastest recursive DNS resolver.
  4. Cloudflare’s Secure Web Gateway accelerates connections to the applications your team uses.
  5. The technology that powers Cloudflare Browser Isolation is fundamentally different compared to other approaches and the speed advantages demonstrate that.

We’re excited to share how each of these components work together to deliver a comprehensive Zero Trust platform that makes your team faster. All the tools we talk about below are available today, they’re easy to use (and get started with) — and they’re free for your first 50 users. If you want to sign up now, head over to the Teams Dashboard!

Shifting From an Old Model to a New, Much Faster One

Legacy access control slowed down teams

Most of our customers start their Zero Trust journey by replacing their legacy private network. Private networks, by default, trust users inside those networks. If a user is on the network, they are considered trusted and can reach other services unless explicitly blocked. Security teams hate that model. It creates a broad attack surface for internal and external bad actors. All they need to do is get network access.

Zero Trust solutions provide a more secure alternative where every request or connection is considered untrusted. Instead, users need to prove they should be able to reach the specific applications or services based on signals like identity, device posture, location and even multifactor method.

Cloudflare Access gives your team the ability to apply these rules, while also logging every event, as a full VPN replacement. Now instead of sneaking onto the network, a malicious user would need valid user credentials, a hard-key and company laptop to even get started.

It also makes your applications much, much faster by avoiding the legacy VPN backhaul requirement.

Private networks attempt to mirror a physical location. Deployments start inside the walls of an office building, for example. If a user was in the building, they could connect. When they left the building, they needed a Virtual Private Network (VPN) client. The VPN client punched a hole back into the private network and allowed the user to reach the same set of resources. If those resources also sat outside the office, the VPN became a slow backhaul requirement.

Some businesses address this by creating different VPN instances for their major hubs across the country or globe. However, they still need to ensure a fast and secure connection between major hubs and applications. This is typically done with dedicated MPLS connections to improve application performance. MPLS lines are both expensive and take IT resources to maintain.

When teams replace their VPN with a Zero Trust solution, they can and often do reduce the latency added by backhauling traffic through a VPN appliance. However, we think that “slightly faster” is not good enough. Cloudflare Access delivers your applications and services to end users on Cloudflare’s network while verifying every request to ensure the user is properly authenticated.

Cloudflare’s Zero Trust approach speeds teams up

Organizations start by connecting their resources to Cloudflare’s network using Cloudflare Tunnel, a service that runs in your environment and creates outbound-only connections to Cloudflare’s edge. That service is powered by our Argo Smart Routing technology, which improves performance of web assets by 30% on average (Argo Smart Routing became even faster earlier this week).

The Zero Trust platform built for speed

On the other side, users connect to Cloudflare’s network by reaching a data center near them in over 250 cities around the world. 95% of the entire Internet-connected world is now within 50 ms of a Cloudflare presence, and 80% of the entire Internet-connected world is within 20ms (for reference, it takes 300-400 ms for a human to blink).

The Zero Trust platform built for speed

Finally, Cloudflare’s network finds the best route to get your users to your applications — regardless of where they are located, using Cloudflare’s global backbone. Our backbone consists of dedicated fiber optic lines and reserved portions of wavelength that connect Cloudflare data centers together. This is split approximately 55/45 between “metro” capacity, which redundantly connects data centers in which we have a presence, and “long-haul” capacity, which connects Cloudflare data centers in different cities. There are no individual VPN instances or MPLS lines, all a user needs to do is access their desired application and Cloudflare handles the logic to efficiently route their request.

The Zero Trust platform built for speed

When teams replace their private networks with Cloudflare, they accelerate the performance of the applications their employees need. However, the Zero Trust model also includes new security layers. Those safeguards should not slow you down, either — and on Cloudflare, they won’t.

Instant Zero Trust decisions built on the Internet’s most performant serverless platform, Workers

Cloudflare Access checks every request and connection against the rules that your administrators configure on a resource-by-resource basis. If users have not proved they should be able to reach a given resource, we begin evaluating their signals by taking steps like prompting them to authenticate with their identity/Sign-Sign On provider or checking their device for posture. If users meet all the criteria, we allow them to proceed.

Despite evaluating dozens of signals, we think this step should be near instantaneous to the user. To solve that problem, we built Cloudflare Access’ authentication layer entirely on Cloudflare Workers. Every application’s Access policies are stored and evaluated at every one of Cloudflare’s 250+ data centers. Instead of a user’s traffic having to be backhauled to an office and then to the application, traffic is routed from the closest data center to the user directly to their desired application.

As Rita Kozlov wrote earlier this week, Cloudflare Workers is the Internet’s fast serverless platform. Workers runs in every data center in Cloudflare’s network — meaning the authentication decision does not add more backhaul or get in the way of the network acceleration discussed above. In comparison to other serverless platforms, Cloudflare Workers is “210% faster than Lambda@Edge and 298% faster than Lambda.”

By building on Cloudflare Workers, we can authenticate user sessions to a given resource in less than three milliseconds on average. This also makes Access resilient — unlike a VPN that can go down and block user access, even if any Cloudflare data center goes offline, user requests are redirected to a nearby data center.

Filtering built on the same platform as the world’s fastest public DNS resolver

After securing internal resources, the next phase in a Zero Trust journey for many customers is to secure their users, devices, and data from external threats. Cloudflare Gateway helps organizations start by filtering DNS queries leaving devices and office networks.

When users navigate to a website or connect to a service, their device begins by making a DNS query to their DNS resolver. Most DNS resolvers respond with the IP of the hostname being requested. If the DNS resolver is aware of what hostnames on the Internet are dangerous, the resolver can instead keep the user safe by blocking the query.

Historically, organizations deployed DNS filtering solutions using appliances that sat inside their physical office. Similar to the private network challenges, users outside the office had to use a VPN to backhaul their traffic to the appliances in the office that provided DNS filtering and other security solutions.

That model has shifted to cloud-based solutions. However, those solutions are only as good as the speed of their DNS resolution and distribution of the data centers. Again, this is better for performance — but not yet good enough.

We wanted to bring DNS filtering closer to each user. When DNS queries are made from a device running Cloudflare Gateway, all requests are initially sent to a nearby Cloudflare data center. These DNS queries are then checked against a comprehensive list of known threats.

We’re able to do this faster than a traditional DNS filter because Cloudflare operates the world’s fastest public DNS resolver, 1.1.1.1. Cloudflare processes hundreds of billions of DNS queries per day and the users who choose 1.1.1.1 enjoy the fastest DNS resolution on the Internet and audited privacy guarantees.

Customers who secure their teams with Cloudflare Gateway benefit from the same improvements and optimizations that have kept 1.1.1.1 the fastest resolver on the Internet. When organizations begin filtering DNS with Cloudflare Gateway, they immediately improve the Internet experience for their employees compared to any other DNS resolver.

A Secure Web Gateway without performance penalties

In the kick-off post for Speed Week, we described how delivering a waitless Internet isn’t just about having ample bandwidth. The speed of light and round trips incurred by DNS, TLS and HTTP protocols can easily manifest into a degraded browsing experience.

To protect their teams from threats and data loss on the Internet, security teams inspect and filter traffic on a Virtual Private Network (VPN) and Secure Web Gateway (SWG). On an unfiltered Internet connection, your DNS, TLS and HTTP requests take a short trip from your browser to your local ISP which then sends the request to the target destination. With a filtered Internet connection, this traffic is instead sent from your local ISP to a centralized SWG hosted either on-premise or in a zero trust network — before eventually being dispatched to the end destination.

This centralization of Internet traffic introduces the tromboning effect, artificially degrading performance by forcing traffic to take longer paths to destinations even when the end destination is closer than the filtering service. This effect can be eliminated by performing filtering on a network that is interconnected directly with your ISP.

To quantify this point we again leveraged Catchpoint to measure zero trust network round trip time from a range of international cities. Based on public documentation we also measured publicly available endpoints for Cisco Umbrella, ZScaler, McAfee and Menlo Security.

The Zero Trust platform built for speed

There is a wide variance in results. Cloudflare, on average, responds in 10.63ms, followed by Cisco Umbrella (26.39ms), ZScaler (35.60ms), Menlo Security (37.64ms) and McAfee (59.72ms).

Cloudflare for Teams is built on the same network that powers the world’s fastest DNS resolver and WARP to deliver consumer-grade privacy and performance. Since our network is highly interconnected and located in over 250 cities around the world our network, we’re able to eliminate the tromboning effect by inspecting and filtering traffic in the same Internet exchange points that your Internet Service Provider uses to connect you to the Internet.

These tests are simple network latency tests and do not encapsulate latency’s impact end-to-end on DNS, TLS and HTTPS connections or the benefits of our global content delivery network serving cached content for the millions of websites accelerated by our network. Unlike content delivery networks which are publicly measured, zero trust networks are hidden behind enterprise contracts which hinder industry-wide transparency.

Latency sensitivity and Browser Isolation

The web browser has evolved into workplace’s most ubiquitous application, and with it created one of the most common attack vectors for phishing, malware and data loss. This risk has led many security teams to incorporate a remote browser isolation solution into their security stack.

Users browsing remotely are especially sensitive to latency. Remote web pages will typically load fast due to the remote browser’s low latency, high bandwidth connection to the website, but user interactions such as scrolling, typing and mouse input stutter and buffer leading to significant user frustration. A high latency connection on a local browser is the opposite with latency manifesting as slow page load times.

Segmenting these results per continent, we can see highly inconsistent latency on centralized zero trust networks and far more consistent results for Cloudflare’s decentralized zero trust network.

The Zero Trust platform built for speed

The thin green line shows Cloudflare consistently responding in under 11ms globally, with other vendors delivering unstable and inconsistent results. If you’ve had a bad experience with other Remote Browser Isolation tools in the past, it was likely because it wasn’t built on a network designed to support it.

Give it a try!

We believe that security shouldn’t result in sacrificing performance — and we’ve architected our Zero Trust platform to make it so. We also believe that Zero Trust security shouldn’t just be the domain of the big players with lots of resources — it should be available to everyone as part of our mission to help make the Internet a better place. We’ve made all the tools covered above free for your first 50 users. Get started today in the Teams Dashboard!

Magic makes your network faster

Post Syndicated from Annika Garbers original https://blog.cloudflare.com/magic-makes-your-network-faster/

Magic makes your network faster

Magic makes your network faster

We launched Magic Transit two years ago, followed more recently by its siblings Magic WAN and Magic Firewall, and have talked at length about how this suite of products helps security teams sleep better at night by protecting entire networks from malicious traffic. Today, as part of Speed Week, we’ll break down the other side of the Magic: how using Cloudflare can automatically make your entire network faster. Our scale and interconnectivity, use of data to make more intelligent routing decisions, and inherent architecture differences versus traditional networks all contribute to performance improvements across all IP traffic.

What is Magic?

Cloudflare’s “Magic” services help customers connect and secure their networks without the cost and complexity of maintaining legacy hardware. Magic Transit provides connectivity and DDoS protection for Internet-facing networks; Magic WAN enables customers to replace legacy WAN architectures by routing private traffic through Cloudflare; and Magic Firewall protects all connected traffic with a built-in firewall-as-a-service. All three share underlying architecture principles that form the basis of the performance improvements we’ll dive deeper into below.

Anycast everything

In contrast to traditional “point-to-point” architecture, Cloudflare uses Anycast GRE or IPsec (coming soon) tunnels to send and receive traffic for customer networks. This means that customers can set up a single tunnel to Cloudflare, but effectively get connected to every single Cloudflare location, dramatically simplifying the process to configure and maintain network connectivity.

Magic makes your network faster

Every service everywhere

In addition to being able to send and receive traffic from anywhere, Cloudflare’s edge network is also designed to run every service on every server in every location. This means that incoming traffic can be processed wherever it lands, which allows us to block DDoS attacks and other malicious traffic within seconds, apply firewall rules, and route traffic efficiently and without bouncing traffic around between different servers or even different locations before it’s dispatched to its destination.

Zero Trust + Magic: the next-gen network of the future

With Cloudflare One, customers can seamlessly combine Zero Trust and network connectivity to build a faster, more secure, more reliable experience for their entire corporate network. Everything we’ll talk about today applies even more to customers using the entire Cloudflare One platform – stacking these products together means the performance benefits multiply (check out our post on Zero Trust and speed from today for more on this).

More connectivity = faster traffic

So where does the Magic come in? This part isn’t intuitive, especially for customers using Magic Transit in front of their network for DDoS protection: how can adding a network hop subtract latency?

The answer lies in Cloudflare’s network architecture — our web of connectivity to the rest of the Internet. Cloudflare has invested heavily in building one of the world’s most interconnected networks (9800 interconnections and counting, including with major ISPs, cloud services, and enterprises). We’re also continuing to grow our own private backbone and giving customers the ability to directly connect with us. And our expansive connectivity to last mile providers means we’re just milliseconds away from the source of all your network traffic, regardless of where in the world your users or employees are.

This toolkit of varying connectivity options means traffic routed through the Cloudflare network is often meaningfully faster than paths across the public Internet alone, because more options available for BGP path selection mean increased ability to choose more performant routes. Imagine having only one possible path between your house and the grocery store versus ten or more – chances are, adding more options means better alternatives will be available. A cornucopia of connectivity methods also means more resiliency: if there’s an issue on one of the paths (like construction happening on what is usually the fastest street), we can easily route around it to avoid impact to your traffic.

One common comparison customers are interested in is latency for inbound traffic. From the end user perspective, does routing through Cloudflare speed up or slow down traffic to networks protected by Magic Transit? Our response: let’s test it out and see! We’ve repeatedly compared Magic Transit vs standard Internet performance for customer networks across geographies and industries and consistently seen really exciting results. Here’s an example from one recent test where we used third-party probes to measure the ping time to the same customer network location (their data center in Qatar) before and after onboarding with Magic Transit:

Probe location RTT w/o Magic (ms) RTT w/ Magic (ms) Difference (ms) Difference (% improvement)
Dubai 27 23 4 13%
Marseille 202 188 13 7%
Global (results averaged across 800+ distributed probes) 194 124 70 36%

All of these results were collected without the use of Argo Smart Routing for Packets, which we announced on Tuesday. Early data indicates that networks using Smart Routing will see even more substantial gains.

Modern architecture eliminates traffic trombones

In addition to the performance boost available for traffic routed across the Cloudflare network versus the public Internet, customers using Magic products benefit from a new architecture model that totally removes up to thousands of miles worth of latency.

Traditionally, enterprises adopted a “hub and spoke” model for granting employees access to applications within and outside their network. All traffic from within a connected network location was routed through a central “hub” where a stack of network hardware (e.g. firewalls) was maintained. This model worked great in locations where the hub and spokes were geographically close, but started to strain as companies became more global and applications moved to the cloud.

Now, networks using hub and spoke architecture are often backhauling traffic thousands of miles, between continents and across oceans, just to apply security policies before packets are dispatched to their final destination, which is often physically closer to where they started! This creates a “trombone” effect, where precious seconds are wasted bouncing traffic back and forth across the globe, and performance problems are amplified by packet loss and instability along the way.

Magic makes your network faster

Network and security teams have tried to combat this issue by installing hardware at more locations to establish smaller, regional hubs, but this quickly becomes prohibitively expensive and hard to manage. The price of purchasing multiple hardware boxes and dedicated private links adds up quickly, both in network gear and connectivity itself as well as the effort required to maintain additional infrastructure. Ultimately, this cost usually outweighs the benefit of the seconds regained with shorter network paths.

The “hub” is everywhere

There’s a better way — with the Anycast architecture of Magic products, all traffic is automatically routed to the closest Cloudflare location to its source. There, security policies are applied with single-pass inspection before traffic is routed to its destination. This model is conceptually similar to a hub and spoke, except that the hub is everywhere: 95% of the entire Internet-connected world is within 50 ms of a Cloudflare location (check out this week’s updates on our quickly-expanding network presence for the latest). This means instead of tromboning traffic between locations, it can stop briefly at a Cloudflare hop in-path before it goes on its way: dramatically faster architecture without compromising security.

To demonstrate how this architecture shift can make a meaningful difference, we created a lab to mirror the setup we’ve heard many customers describe as they’ve explained performance issues with their existing network. This example customer network is headquartered in South Carolina and has branch office locations on the west coast, in California and Oregon. Traditionally, traffic from each branch would be backhauled through the South Carolina “hub” before being sent on to its destination, either another branch or the public Internet.

In our alternative setup, we’ve connected each customer network location to Cloudflare with an Anycast GRE tunnel, simplifying configuration and removing the South Carolina trombone. We can also enforce network and application-layer filtering on all of this traffic, ensuring that the faster network path doesn’t compromise security.

Magic makes your network faster

Here’s a summary of results from performance tests on this example network demonstrating the difference between the traditional hub and spoke setup and the Magic “global hub” — we saw up to 70% improvement in these tests, demonstrating the dramatic impact this architecture shift can make.

LAX <> OR (ms)
ICMP round-trip for “Regular” (hub and spoke) WAN 127
ICMP round-trip for Magic WAN 38
Latency savings for Magic WAN vs “Regular” WAN 70%

This effect can be amplified for networks with globally distributed locations — imagine the benefits for customers who are used to delays from backhauling traffic between different regions across the world.

Getting smarter

Adding more connectivity options and removing traffic trombones provide a performance boost for all Magic traffic, but we’re not stopping there. In the same way we leverage insights from hundreds of billions of requests per day to block new types of malicious traffic, we’re also using our unique perspective on Internet traffic to make more intelligent decisions about routing customer traffic versus relying on BGP alone. Earlier this week, we announced updates to Argo Smart Routing including the brand-new Argo Smart Routing for Packets. Customers using Magic products can enable it to automatically boost performance for any IP traffic routed through Cloudflare (by 10% on average according to results so far, and potentially more depending on the individual customer’s network topology) — read more on this in the announcement blog.

What’s next?

The modern architecture, well-connected network, and intelligent optimizations we’ve talked about today are just the start. Our vision is for any customer using Magic to connect and protect their network to have the best performance possible for all of their traffic, automatically. We’ll keep investing in expanding our presence, interconnections, and backbone, as well as continuously improving Smart Routing — but we’re also already cooking up brand-new products in this space to deliver optimizations in new ways, including WAN Optimization and Quality of Service functions. Stay tuned for more Magic coming soon, and get in touch with your account team to learn more about how we can help make your network faster starting today.

Cloudflare Backbone: A Fast Lane on the Busy Internet Highway

Post Syndicated from Tanner Ryan original https://blog.cloudflare.com/cloudflare-backbone-internet-fast-lane/

Cloudflare Backbone: A Fast Lane on the Busy Internet Highway

Cloudflare Backbone: A Fast Lane on the Busy Internet Highway

The Internet is an amazing place. It’s a communication superhighway, allowing people and machines to exchange exabytes of information every day. But it’s not without its share of issues: whether it’s DDoS attacks, route leaks, cable cuts, or packet loss, the components of the Internet do not always work as intended.

The reason Cloudflare exists is to help solve these problems. As we continue to grow our rapidly expanding global network in more than 250 cities, while directly connecting with more than 9,800 networks, it’s important that our network continues to help bring improved performance and resiliency to the Internet. To accomplish this, we built our own backbone. Other than improving redundancy, the immediate advantage to you as a Cloudflare user? It can reduce your website loading times by up to 45% — and you don’t have to do a thing.

The Cloudflare Backbone

We began building out our global backbone in 2018. It comprises a network of long-distance fiber optic cables connecting various Cloudflare data centers across North America, South America, Europe, and Asia. This also includes Cloudflare’s metro fiber network, directly connecting data centers within a metropolitan area.

Cloudflare Backbone: A Fast Lane on the Busy Internet Highway

Our backbone is a dedicated network, providing guaranteed network capacity and consistent latency between various locations. It gives us the ability to securely, reliably, and quickly route packets between our data centers, without having to rely on other networks.

This dedicated network can be thought of as a fast lane on a busy highway. When traffic in the normal lanes of the highway encounter slowdowns from congestion and accidents, vehicles can make use of a fast lane to bypass the traffic and get to their destination on time.

Our software-defined network is like a smart GPS device, as we’re always calculating the performance of routes between various networks. If a route on the public Internet becomes congested or unavailable, our network automatically adjusts routing preferences in real-time to make use of all routes we have available, including our dedicated backbone, helping to deliver your network packets to the destination as fast as we can.

Measuring backbone improvements

As we grow our global infrastructure, it’s important that we analyze our network to quantify the impact we’re having on performance.

Here’s a simple, real-world test we’ve used to validate that our backbone helps speed up our global network. We deployed a simple API service hosted on a public cloud provider, located in Chicago, Illinois. Once placed behind Cloudflare, we performed benchmarks from various geographic locations with the backbone disabled and enabled to measure the change in performance.

Instead of comparing the difference in latency our backbone creates, it is important that our experiment captures a real-world performance gain that an API service or website would experience. To validate this, our primary metric is measuring the average request time when accessing an API service from Miami, Seattle, San Jose, São Paulo, and Tokyo. To capture the response of the network itself, we disabled caching on the Cloudflare dashboard and sent 100 requests from each testing location, both while forcing traffic through our backbone, and through the public Internet.

Now, before we claim our backbone solves all Internet problems, you can probably notice that for some tests (Seattle, WA and San Jose, CA), there was actually an increase in response time when we forced traffic through the backbone. Since latency is directly proportional to the distance of fiber optic cables, and since we have over 9,800 direct connections with other Internet networks, there is a possibility that an uncongested path on the public Internet might be geographically shorter, causing this speedup compared to our backbone.

Luckily for us, we have technologies like Argo Smart Routing, Argo Tiered Caching, WARP+, and most recently announced Orpheus, which dynamically calculates the performance of each route at our data centers, choosing the fastest healthy route at that time. What might be the fastest path during this test may not be the fastest at the time you are reading this.

With that disclaimer out of the way, now onto the test.

Cloudflare Backbone: A Fast Lane on the Busy Internet Highway

With the backbone disabled, if a visitor from São Paulo performed a request to our service, they would be routed to our São Paulo data center via BGP Anycast. With caching disabled, our São Paulo data center forwarded the request over the public Internet to the origin server in Chicago. On average, the entire process to fetch data from the origin server and return to the response to the requesting user took 335.8 milliseconds.

Once the backbone was enabled and requests were created, our software performed tests to determine the fastest healthy route to the origin, whether it was a route on the public Internet or through our private backbone. For this test the backbone was faster, resulting in an average total request time of 230.2 milliseconds. Just by routing the request through our private backbone, we improved the average response time by 31%.

We saw even better improvement when testing from Tokyo. When routing the request over the public Internet, the request took an average of 424 milliseconds. By enabling our backbone which created a faster path, the request took an average of 234 milliseconds, creating an average response time improvement of 44%.

Visitor Location Distance to Chicago Avg. response time using public Internet (ms) Avg. response using backbone (ms) Change in response time
Miami, FL, US 1917 km 84 75 10.7% decrease
Seattle, WA, US 2785 km 118 124 5.1% increase
San Jose, CA, US 2856 km 122 132 8.2% increase
São Paulo, BR 8403 km 336 230 31.5% decrease
Tokyo JP 10129 km 424 234 44.8% decrease

We also observed a smaller deviation in the response time of packets routed through our backbone over larger distances.

Cloudflare Backbone: A Fast Lane on the Busy Internet Highway

Our next generation network

Cloudflare is built on top of lossy, unreliable networks that we do not have control over. It’s our software that turns these traditional tubes of the Internet into a smart, high performing, and reliable network Cloudflare customers get to use today. Coupled with our new, but rapidly expanding backbone, it is this software that produces significant performance gains over traditional Internet networks.

Whether you visit a website powered by Cloudflare’s Argo Smart Routing, Argo Tiered Caching, Orpheus, or use our 1.1.1.1 service with WARP+ to access the Internet, you get direct access to the Internet fast lane we call the Cloudflare backbone.

For Cloudflare, a better Internet means improving Internet security, reliability, and performance. The backbone gives us the ability to build out our network in areas that have typically lacked infrastructure investments by other networks. Even with issues on the public Internet, these initiatives allow us to be located within 50 milliseconds of 95% of the Internet connected population.

In addition to our growing global infrastructure providing 1.1.1.1, WARP, Roughtime, NTP, IPFS Gateway, Drand, and F-Root to the greater Internet, it’s important that we extend our services to those who are most vulnerable. This is why we extend all our infrastructure benefits directly to the community, through projects like Galileo, Athenian, Fair Shot, and Pangea.

And while these thousands of fiber optic connections are already fixing today’s Internet issues, we truly are just getting started.

Want to help build the future Internet? Networks that are faster, safer, and more reliable than they are today? The Cloudflare Infrastructure team is currently hiring!

If you operate an ISP or transit network and would like to bring your users faster and more reliable access to websites and services powered by Cloudflare’s rapidly expanding network, please reach out to our Edge Partnerships team at [email protected].

Unboxing the Last Mile: Introducing Last Mile Insights

Post Syndicated from David Tuber original https://blog.cloudflare.com/last-mile-insights/

Unboxing the Last Mile: Introducing Last Mile Insights

Unboxing the Last Mile: Introducing Last Mile Insights

“The last 20% of the work requires 80% of the effort.” The Pareto Principle applies in many domains — nowhere more so on the Internet, however, than on the Last Mile. Last Mile networks are heterogeneous and independent of each other, but all of them need to be running to allow for everyone to use the Internet. They’re typically the responsibility of Internet Service Providers (ISPs). However, if you’re an organization running a mission-critical service on the Internet, not paying attention to Last Mile networks is in effect handing off responsibility for the uptime and performance of your service over to those ISPs.

Probably not the best idea.

When a customer puts a service on Cloudflare, part of our job is to offer a good experience across the whole Internet. We couldn’t do that without focusing on Last Mile networks. In particular, we’re focused on two things:

  • Cloudflare needs to have strong connectivity to Last Mile ISPs and needs to be as close as possible to every Internet-connected person on the planet.
  • Cloudflare needs good observability tools to know when something goes wrong, and needs to be able to surface that data to you so that you can be informed.

Today, we’re excited to announce Last Mile Insights, to help with this last problem in particular. Last Mile Insights allows customers to see where their end-users are having trouble connecting to their Cloudflare properties. Cloudflare can now show customers the traffic that failed to connect to Cloudflare, where it failed to connect, and why. If you’re an enterprise Cloudflare customer, you can sign up to join the beta in the Cloudflare Dashboard starting today: in the Analytics tab under Edge Reachability.

The Last Mile is historically the most complicated, least understood, and in some ways the most important part of operating a reliable network. We’re here to make it easier.

What is the Last Mile?

The Last Mile is the connection between your home and your ISP. When we talk about how users connect to content on the Internet, we typically do it like this:

Unboxing the Last Mile: Introducing Last Mile Insights

This is useful, but in reality, there are lots of things in the path between a user and anything on the Internet. Say that a user is connecting to a resource hosted behind Cloudflare. The path would look like this:

Unboxing the Last Mile: Introducing Last Mile Insights

Cloudflare is a global Anycast network that takes traffic from the Internet and proxies it to your origin. Because we function as a proxy, we think of the life of a request in two legs: before it reaches Cloudflare (end users to Cloudflare), and after it reaches Cloudflare (Cloudflare to origin). However, in Internet parlance, there are generally three legs: the First Mile tends to represent the path from an origin server to the data that you are requesting. The Middle Mile represents the path from an origin server to any proxies or other network hops. And finally, there is the final hop from the ISP to the user, which is known as the Last Mile.

Issues with the Last Mile are difficult to detect. If users are unable to reach something on the Internet, it is difficult for the resource to report that there was a problem. This is because if a user never reaches the resource, then the resource will never know something is wrong. Multiply that one problem across hundreds of thousands of Last Mile ISPs coming from a diverse set of regions, and it can be really hard for services to keep track of all the possible things that can go wrong on the Internet. The above graphic actually doesn’t really reflect the scope of the problem, so let’s revise it a bit more:

Unboxing the Last Mile: Introducing Last Mile Insights

It’s not an easy problem to keep on top of.

Brand New Last Mile Insights

Cloudflare is launching a closed beta of a brand new Last Mile reporting tool, Last Mile Insights. Last Mile Insights allows for customers to see where their end-users are having trouble connecting to their Cloudflare properties. Cloudflare can now show customers the traffic that failed to connect to Cloudflare, where it failed to connect, and why.

Unboxing the Last Mile: Introducing Last Mile Insights

Access to this data is useful to our customers because when things break, knowing what is broken and why — and then communicating with your end users — is vital. During issues, users and employees may create support/helpdesk tickets and social media posts to understand what’s going on. Knowing what is going on, and then communicating effectively about what the problem is and where it’s happening, can give end users confidence that issues are identified and being investigated… even if the issues are occurring on a third party network. Beyond that, understanding the root of the problem can help with mitigations and speed time to resolution.

How do Last Mile Insights work?

Our Last Mile monitoring tools use a combination of signals and machine learning to detect errors and performance regressions on the Last Mile.

Among the signals: Network Error Logging (NEL) is a browser-based reporting system that allows users’ browsers to report connection failures to an endpoint specified by the webpage that failed to load. When a user is able to connect to Cloudflare on a site with NEL enabled, Cloudflare will pass back two headers that indicate to the browser that they should report any network failures to an endpoint specified in the headers. The browser will then operate as usual, and if something happens that prevents the browser from being able to connect to the site, it will log the failure as a report and send it to the endpoint. This all happens in real time; the endpoint receives failure reports instantly after the browser experiences them.

The browser can send failure reports for many reasons: it could send reports because the TLS certificate was incorrect, the ISP or an upstream transit was having issues on the request path, the terminating server was overloaded and dropping requests, or a data center was unreachable. The W3C specification outlines specific buckets that the browser should break reports into and uploads those as reasons the browser could not connect. So the browser is literally telling the reporting endpoint why it was unable to reach the desired site. Here’s an example of a sample report a browser gives to Cloudflare’s endpoint:

Unboxing the Last Mile: Introducing Last Mile Insights

The report itself is a JSON blob that contains a lot of things, but the things we care about are when in the request the failure occurred (phase), why the request failed (tcp.timed_out), the ASN the request came over, and the metro area where the request came from. This information allows anyone looking at the reports to see where things are failing and why. Personal Identifiable Information is not captured in NEL reports. For more information, please see our KB article on NEL.

Many services can operate their own reporting endpoints and set their own headers indicating that users who connect to their site should upload these reports to the endpoint they specify. Cloudflare is also an operator of one such endpoint, and we’re excited to open up the data collected by us for customer use and visibility.  Let’s talk about a customer who used Last Mile Insights to help make a bad day on the Internet a little better.

Case Study: Canva

Canva is a Cloudflare customer that provides a design and collaboration platform hosted in the cloud. With more than 60 million users around the world, having constant access to Canva’s platform is critical. Last year, Canva users connecting through Cox Communications in San Diego started to experience connectivity difficulties. Around 50% of Canva’s users connecting via Cox Communications saw disconnects during that time period, and these users weren’t able to access Canva or Cloudflare at all. This wasn’t a Canva or Cloudflare outage, but rather, was caused by Cox routing traffic destined for Canva incorrectly, and causing errors for mutual Cox/Canva customers as a result.

Normally, this scenario would have taken hours to diagnose and even longer to mitigate. Canva would’ve seen a slight drop in traffic, but as the outage wasn’t on Canva’s side, it wouldn’t have flagged any alerts based on traffic drops. Canva engineers, in this case, would be notified by the users which would then be followed by a lengthy investigation to diagnose the problem.

Fortunately, Cloudflare has invested in monitoring systems to proactively identify issues exactly like these. Within minutes of the routing anomaly being introduced on Cox’s network, Canva was made aware of the issue via our monitoring, and a conversation with Cox was started to remediate the issue. Meanwhile, Canva could advise their users on the steps to fix it.

Cloudflare is excited to be offering our internal monitoring solution to our customers so that they can see what we see.

But providing insights into seeing where problems happen on the Last Mile is only part of the solution. In order to truly deliver a reliable, fast network, we also need to be as close to end users as possible.

Getting close to users

Getting close to end users is important for one reason: it minimizes the time spent on the Last Mile. These networks can be unreliable and slow. The best way to improve performance is to spend as little time on them as possible. And the only way to do that is to get close to our users. In order to get close to our users, Cloudflare is constantly expanding our presence into new cities and markets. We’ve just announced expansion into new markets and are adding even more new markets all the time to get as close to every network and every user as we can.

This is because not every network is the same. Some users may be clustered very close together in cities with high bandwidth, in others, this may not be the case. Because user populations are not homogeneous, each ISP operates their network differently to meet the needs of their users. Physical distance from where servers are matters a great deal, because nobody can outrun the speed of light. If you’re farther away from the content you want, it will take longer to reach it. But distance is not the only variable; bandwidth and speed will also vary, because networks are operated differently all over the world. But one thing we do know is that your network performance will also be impacted by how healthy your Last Mile network is.

Healthier networks perform better

A healthy network has no downtime, minimal congestion, and low packet loss.  These things all add latency. If you’re driving somewhere, street closures, traffic, and bad roads will prevent you from going as fast as possible to where you need to be. Healthy networks provide the best possible conditions for you to connect, and Last Mile performance is better because of it.  Consider three networks in the same country: ISP A, ISP B, and ISP C. These ISPs have similar distribution among their users. ISP A is healthy and is directly connected with Cloudflare. ISP B is healthy but is not directly connected to Cloudflare.  ISP C is an unhealthy network. Our data shows that Last Mile latencies for ISP C are significantly slower than Network A or B because the network quality of ISP C is worse.

Unboxing the Last Mile: Introducing Last Mile Insights

This box plot shows that the latencies to Cloudflare for ISP C are 360% higher than ISPs A or B.

We want all networks to be like Network A, but that’s not always the case, and it’s something Cloudflare can’t control. The only thing Cloudflare can do to mitigate performance problems like these is to limit how much time you spend on these networks.

Shrinking the Last Mile gives better performance

By placing data centers close to our users, we reduce the amount of time spent on these Last Mile networks, and the latency between end users and Cloudflare goes down. A great example of this is how bringing up new locations in Africa affected the latency for the Internet-connected population there.  Blue shows the latency before these locations were added, and red shows after:

Unboxing the Last Mile: Introducing Last Mile Insights

Our efforts globally have brought 95% of the Internet-connected population within 50ms of us:

Unboxing the Last Mile: Introducing Last Mile Insights

You will also notice that 80% of the Internet is within 30ms of us. The tail for Last Mile latencies is very long, and every data center we add helps bring that tail closer to great performance. As we expand into more locations and countries, more of the Internet will be even better connected.

But even when the Last Mile is shrunken down by our infrastructure expansions, networks can still have issues that are difficult to detect. Existing logging and monitoring solutions don’t provide a good way to see what the problem is. Cloudflare has built a sophisticated set of tools to identify issues with Last Mile networks outside our control, and help reduce time to resolution for this purpose, and it has already found problems on the Last Mile for our customers.

Cloudflare has unique performance and insight into Last Mile networking

Running an application on the Internet requires customers to look at the whole Internet. Many cloud services optimize latency starting at the first mile and work their way out, because it’s easier to optimize for things they can control. Because the Last Mile is controlled by hundreds or thousands of ISPs, it is difficult to influence how the Last Mile behaves.

Cloudflare is focused on closing performance gaps everywhere, including close to your users and employees. Last mile performance and reliability is critically important to delivering content, keeping employees productive, and all the other things the world depends on the Internet to do. If a Last Mile provider is having a problem, then users connecting to the Internet through them will have a bad day.

Cloudflare’s efforts to provide better Last Mile performance and visibility allow customers to rely on Cloudflare to optimize the Last Mile, making it one less thing they have to think about. Through Last Mile Insights and network expansion efforts — available today in the Cloudflare Dashboard,  in the Analytics tab under Edge Reachability — we want to provide you the ability to see what’s really happening on the Internet while knowing that Cloudflare is working on giving your users the best possible Internet experience.

Discovering what’s slowing down your website with Web Analytics

Post Syndicated from Joao Sousa Botto original https://blog.cloudflare.com/web-analytics-vitals-explorer/

Discovering what’s slowing down your website with Web Analytics

Discovering what’s slowing down your website with Web Analytics

Web Analytics is Cloudflare’s privacy-focused real user measurement solution. It leverages a lightweight JavaScript beacon and does not use any client-side state, such as cookies or localStorage, to collect usage metrics. Nor does it “fingerprint” individuals via their IP address, User Agent string, or any other data.

Cloudflare Web Analytics makes essential web analytics, such as the top-performing pages on your website and top referrers, available to everyone for free, and it’s becoming more powerful than ever.

Focusing on Performance

Earlier this year we merged Web Analytics with our Browser Insights product, which enabled customers proxying their websites through Cloudflare to evaluate visitors’ experience on their web properties through Core Web Vitals such as Largest Contentful Paint (LCP) and First Input Delay (FID).

It was important to bring the Core Web Vitals performance measurements into Web Analytics given the outsized impact that page load times have on bounce rates. A page load time increase from 1s to 3s increases bounce rates by 32% and from 1s to 6s increases it by 106% (source).

Now that you know the impact a slow-loading web page can have on your visitors, it’s time for us to make it a no-brainer to take action. Read on.

Becoming Action-Oriented

We believe that, to deliver the most value to our users, the product should facilitate the following process:

  1. Measure the real user experience
  2. Grade this experience — is it satisfactory or in need of improvement?
  3. Provide actionable insights — what part of the web page should be tweaked to improve the user experience?
  4. Repeat
Discovering what’s slowing down your website with Web Analytics

And it all starts with Web Analytics Vitals Explorer, which started rolling out today.

Introducing Web Analytics Vitals Explorer

Vitals Explorer enables you to easily pinpoint which elements on your pages are affecting users the most, with accurate measurements from the visitors perspective and an easy-to-read impact grading.

To do that, we have automatically updated the Web Analytics JavaScript beacon so that it collects the relevant vital measurements from the browser. As always, we are not collecting any information that would invade your visitors’ privacy.

Usage

Once this new beacon is updated on your sites — and again the update will happen transparently to you — you can then navigate to the Core Web Vitals page on Web Analytics. When entering that page, you will see three graphs grading the user experience for Largest Contentful Paint (LCP), First Input Delay (FID), and Cumulative Layout Shift (CLS). Below each graph you can see the debug section with the top five elements with a negative impact on the metric. Lastly, when clicking on either of these elements shown in the data table, you will be presented with its impact and exact paths so that you can easily decide whether this is worth keeping on your website in its current format.

Discovering what’s slowing down your website with Web Analytics

In addition to this new Core Web Vitals content, we have also added First Paint and First Contentful Paint to the Page Load Time page. When you navigate to this page you will now see the page load summary and a graph representing page load timing. These will allow you to quickly identify any regressions to these important performance metrics.

Discovering what’s slowing down your website with Web Analytics

Measurement details

This additional debugging information for Core Web Vitals is measured during the lifespan of the page (until the user leaves the tab or closes the browser window, which updates visibilityState to a hidden state).

Here’s what we collect:

Common for all Core Web Vitals

  • Element is a CSS selector representing the DOM node. With this string, the developer can use `document.querySelector(<element_name>)` in their browser’s dev console to find out which DOM node has a negative impact on your scores/values.
  • Path is the URL path at the time the Core Web Vitals are captured.
  • Value is the metric value for each Core Web Vitals. This value is in milliseconds for LCP or FID and a score for CLS (Cumulative Layout Shift).

Largest Contentful Paint

  • URL is the source URL (such as image, text, web fonts).
  • Size is the source object’s size in bytes.

First Input Delay

  • Name is the type of event (such as mousedown, keydown, pointerdown).

Cumulative Layout Shift

Layout information is a JSON value that includes width, height, x axis position, y axis position, left, right, top, and bottom. You are able to observe layout shifts that happen on the page by observing these values.

  • CurrentRect is the largest source element’s layout information after the shift. This JSON value is shown as Current under Layout Shifts section in the Web Analytics UI.
  • PreviousRect is the largest source element’s layout information before the shift. This JSON value is shown as Previous under Layout Shifts section in the Web Analytics UI.

Paint Timings

Additionally, we have added two important paint timings

  • First Paint is the time between navigation and when the browser renders the first pixels to the screen.
  • First Contentful Paint is the time when the browser renders the first bit of content from the DOM.

A lot of this is based on standard browser measurements, which you can read about in detail on this blog post from Google.

Moving forward

And we are by no means done. Moving forward, we will bring this structured approach with grading and actionable insights into as Web Analytics measurements as possible, and keep guiding you through how to improve your visitors’ experience. So stay tuned.
And in the meantime, do let us know what you think about this feature and ask questions on the community forums.

Cloudflare Images Now Available to Everyone

Post Syndicated from Zaid Farooqui original https://blog.cloudflare.com/announcing-cloudflare-images/

Cloudflare Images Now Available to Everyone

Cloudflare Images Now Available to Everyone

Today, we are launching Cloudflare Images for all customers. Images is a single product that stores, resizes, optimizes and serves images. We built Cloudflare Images so customers of all sizes can build a scalable and affordable image pipeline in minutes.

Store images efficiently

Many legacy image pipelines are architected to take an image and create multiple copies of it to account for different sizes and formats. These copies are then stored in a storage bucket and delivered using a CDN. This architecture can be hard to maintain and adds infrastructure cost in unpredictable ways.

With Cloudflare Images, you don’t need to worry about creating and storing multiple versions of the same image in different sizes and formats. Cloudflare Images makes a clear distinction between your stored images and the variants. Once you upload an image, you can apply any defined variant to the uploaded image. The variants and different formats don’t count towards your stored images quota.

This means that when a user uploads a picture that you need to resize in three different ways and serve in two different formats, you pay for one stored image instead of seven different images (the original, plus three variants for each of the two formats.)

Built-in access control

Every image that is uploaded to Cloudflare Images can be marked private, so it can only be accessed using an expiring signed URL token. This is ideal for use cases like membership sites that sell premium content.

Signed URLs give you the flexibility to validate if someone is a paying member using your custom logic and only give them access to the set of images they have paid for.

Eliminate egress costs

Egress cost is the cost of getting your data out of a storage provider. The most common case being when you serve an image from storage you pay for the bits transmitted. And you end up paying every, single time that same image is displayed. It is easy to not account for this cost when you are doing cost-benefit analysis between different solutions. But egress costs add up rapidly, and it is not uncommon for customers to pay their storage provider a very large multiple of their total storage cost in egress.

When you use a multi-vendor solution for your image pipeline, you might use vendor A for storage, vendor B for resizing the images and vendor C for delivering the images. At face value, this solution might appear cheaper because you think “we’ve picked the most affordable option for each piece of our image pipeline.” But in this setup, the resizing service (vendor B) and the CDN (vendor C) still need to request images from vendor A.

With Cloudflare Images, you never have to worry about egress costs because the images are stored, optimized and delivered by a single product. And you will see only two line items on your bill for Cloudflare Images. You pay \$5/month for every 100,000 stored images and \$1 per 100,000 delivered images. There are no additional resizing, compute or egress costs.

Uploading Images

Cloudflare Images offers multiple ways to upload your images. We accept all the common file formats including JPEG, GIF and WEBP. Each image uploaded to Images can be up to 10 MB.

If you only have a few images or simply want a taste of the product, you can use the Images Dashboard. Simply drag and drop one or more images:

Cloudflare Images Now Available to Everyone
Cloudflare Images Dashboard

If you have an app that lets your users upload images, you can use the Direct Creator Uploads feature of Cloudflare Images.

The Direct Creator Uploads API lets you request single-use tokens. These one-time upload URLs can be used by your app to upload your user’s submissions without exposing your API Key or Token. Here is an example cURL that returns a one-use upload url:

curl --request POST \
  --url https://api.cloudflare.com/client/v4/accounts/:account_id/images/v1/direct_upload \
  --header 'Content-Type: application/json' \
  --header 'Authorization: Bearer :token'

If the call is successful, you’ll receive a response that looks like this:

{
  "result": {
    "id": "2cdc28f0-017a-49c4-9ed7-87056c839c2",
    "uploadURL": "https://upload.imagedelivery.net/2cdc28f0-017a-49c4-9ed7-87056c839c2"
  },
  "result_info": null,
  "success": true,
  "errors": [],
  "messages": []
}

Your client-side app can now upload the image directly to the uploadURL without exposing your account credentials to the client.

Resizing with Variants

Cloudflare Images lets you define variants and apply them to your uploaded images. You can define up to 20 different variants to support different use cases. Each variant has properties including the width and height of resized images.

Cloudflare Images Now Available to Everyone
Configure variants in Cloudflare Images

You can also configure the fit property to describe how the width and height dimensions should be interpreted.

Fit Option Behavior
Scale Down Image will be shrunk in size to fully fit within the given width or height, but won’t be enlarged.
Contain Image will be resized (shrunk or enlarged) to be as large as possible within the given width or height while preserving the aspect ratio.
Cover Image will be resized to exactly fill the entire area specified by width and height, and will be cropped if necessary.
Crop Image will be shrunk and cropped to fit within the area specified by width and height. The image won’t be enlarged. For images smaller than the given dimensions it’s the same as scale-down. For images larger than the given dimensions, it’s the same as cover.
Pad Image will be resized (shrunk or enlarged) to be as large as possible within the given width or height while preserving the aspect ratio, and the extra area will be filled with a background color (white by default)

We plan to add more properties to give you maximum flexibility. If there is a particular property you’d love to see, let us know.

Once you define your variants, you can begin using them with any image. From the Dashboard, simply click on Variants to quickly preview how any image would be rendered using each of your variants.

Cloudflare Images Now Available to Everyone
Previewing variants in Cloudflare Images

Optimized image delivery

Once you’ve uploaded your first image, you will see the Image Delivery URL in your Images Dashboard:

Cloudflare Images Now Available to Everyone
Serving images with Cloudflare Images

A typical Image Delivery URL looks like this:

https://imagedelivery.net/ZWd9g1K7eljCn_KDTu_OWA/:image_id/:variant_name

You can use this url template to form the final URL that returns any image and variant combination.

When a client requests an image, Cloudflare Images will pick the optimal format between WebP, PNG, JPEG and GIF. The format served to the eyeball is determined by client headers and the image type. Cloudflare Images will soon support AVIF, offering further compression. One of the best parts of using Cloudflare Images is that when we add support for newer formats such as AVIF, you will get the upside without needing to make any changes to your codebase.

What’s next

All Cloudflare customers can sign up to use Cloudflare Images this week. We built Cloudflare Images for developers. Check out the Cloudflare Images developer docs for examples of implementing common use-cases such as letting your users upload images directly to Images and using signed URLs to implement access control.

We’re just getting started with Cloudflare Images. Here are some of the features we plan to support soon:

  • AVIF support for even smaller file sizes and faster load times.
  • Variants that add a blur effect to your images.
  • Analytics to better understand your use of Images.

Optimizing images on the web

Post Syndicated from Greg Brimble original https://blog.cloudflare.com/optimizing-images/

Optimizing images on the web

Optimizing images on the web

Images are a massive part of the Internet. On the median web page, images account for 51% of the bytes loaded, so any improvement made to their speed or their size has a significant impact on performance.

Today, we are excited to announce Cloudflare’s Image Optimization Testing Tool. Simply enter your website’s URL, and we’ll run a series of automated tests to determine if there are any possible improvements you could make in delivering optimal images to visitors.

Optimizing images on the web

How users experience speed

Everyone who has ever browsed the web has experienced a website that was slow to load. Often, this is a result of poorly optimized images on that webpage that are either too large for purpose or that were embedded on the page with insufficient information.

Images on a page might take painfully long to load as pixels agonizingly fill in from top-to-bottom; or worse still, they might cause massive shifts of the page layout as the browser learns about their dimensions. These problems are a serious annoyance to users and as of August 2021, search engines punish pages accordingly.

Understandably, slow page loads have an adverse effect on a page’s “bounce rate” which is the percentage of visitors which quickly move off of the page. On e-commerce sites in particular, the bounce rate typically has a direct monetary impact and pages are usually very image-heavy. It is critically important to optimize all the images on your webpages to reduce load on and egress from your origin, to improve your performance in search engine rankings and, ultimately, to provide a great experience for your users.

Measuring speed

Since the end of August 2021, Google has used the Core Web Vitals to quantify page performance when considering search results rankings. These metrics are three numbers: Largest Contentful Paint (LCP), First Input Delay (FID), and Cumulative Layout Shift (CLS). They approximate the experience of loading, interactivity and visual stability respectively.

CLS and LCP are the two metrics we can improve by optimizing images. When CLS is high, this indicates that large amounts of the page layout is shifting as it loads. LCP measures the time it takes for the single largest image or text block in the viewport to render.

These can both be measured “in the field” with Real User Monitoring (RUM) analytics such as Cloudflare’s Web Analytics, or in a “lab environment” using Cloudflare’s Image Optimization Testing Tool.

How to optimize for speed

Dimensions

One of the most impactful performance improvements a website author can make is ensuring they deliver images with appropriate dimensions. Images taken on a modern camera can be truly massive, and some recent flagship phones have gigantic sensors. The Samsung Galaxy S21 Ultra, for example, has a 108 MP sensor which captures a 12,000 by 9,000 pixel image. That same phone has a screen width of only 1440 pixels. It is physically impossible to show every pixel of the photo on that device: for a landscape photo, only 12% of pixel columns can be displayed.

Embedding this image on a webpage presents the same problem, but this time, that image and all of its unused pixels are sent over the Internet. Ultimately, this creates unnecessary load on the server, higher egress costs, and longer loading times for visitors.. This is exacerbated even further for visitors on mobile since they are often using a slower connection and have limits on their data usage. On a fast 3G connection, that 108 MP photo might consume 26 MB of both the visitor’s data plan and the website’s egress bandwidth, and take more than two minutes to load!

It might be tempting to always deliver images with the highest possible resolution to avoid “blocky” or pixelated images, but when resizing is done correctly, this is not a problem. “Blocky” artifacts typically occur when an image is processed multiple times (for example, an image is repeatedly uploaded and downloaded by users on a platform which compresses that image). Pixelated images occur when an image has been shrunk to a size smaller than the screen it is rendered on.

So, how can website authors avoid these pitfalls and ensure a correctly sized image is delivered to visitors’ devices? There are two main approaches:

  • Media conditions with srcset and sizes

When embedding an image on a webpage, traditionally the author would simply pass a src attribute on an img tag:

<img src="hello_world_12000.jpg" alt="Hello, world!" />

Since 2017, all modern browsers have supported the more dynamic srcset attribute. This allows authors to set multiple image sources, depending on the matching media condition of the visitor’s browser:

<img srcset="hello_world_1500.jpg 1500w,
             hello_world_2000.jpg 2000w,
             hello_world_12000.jpg 12000w"
     sizes="(max-width: 1500px) 1500px,
            (max-width: 2000px) 2000px,
            12000px"
     src="hello_world_12000.jpg"
     alt="Hello, world!" />

Here, with the srcset attribute, we’re informing the browser that there are three variants of the image, each with a different intrinsic width: 1,500 pixels, 2,000 pixels and the original 12,000 pixels. The browser then evaluates the media conditions in the sizes attribute ( (max-width: 1500px) and (max-width: 2000px)) in order to select the appropriate image variant from the srcset attribute. If the browser’s viewport width is less than 1500px, the hello_world_1500.jpg image variant will be loaded; if the browser’s viewport width is between 1500px and 2000px, the hello_world_2000.jpg image variant will be loaded; and finally, if the browser’s viewport width is larger than 2000px, the browser will fallback to loading the hello_world_12000.jpg image variant.

Similar behavior is also possible with a picture element, using the source child element which supports a variety of other selectors.

  • Client Hints

Client Hints are a standard that some browsers are choosing to implement, and some not. They are a set of HTTP request headers which tell the server about the client’s device. For example, the browser can attach a Viewport-Width header when requesting an image which informs the server of the width of that particular browser’s viewport (note this header is currently in the process of being renamed to Sec-CH-Viewport-Width).

This simplifies the markup in the previous example greatly — in fact, no changes are required from the original simple HTML:

<img src="hello_world_12000.jpg" alt="Hello, world!" />

If Client Hints are supported, when the browser makes a request for hello_world_12000.jpg, it might attach the following header:

Viewport-Width: 1440

The server could then automatically serve a smaller image variant (e.g. hello_world_1500.jpg), despite the request originally asking for hello_world_12000.jpg image.

By enabling browsers to request an image with appropriate dimensions, we save bandwidth and time for both your server and for your visitors.

Format

JPEG, PNG, GIF, WebP, and now, AVIF. AVIF is the latest image format with widespread industry support, and it often outperforms its preceding formats. AVIF supports transparency with an alpha channel, it supports animations, and it is typically 50% smaller than comparable JPEGs (vs. WebP’s reduction of only 30%).

We added the AVIF format to Cloudflare’s Image Resizing product last year as soon as Google Chrome added support. Firefox 93 (scheduled for release on October 5, 2021) will be Firefox’s first stable release, and with both Microsoft and Apple as members of AVIF’s Alliance for Open Media, we hope to see support in Edge and Safari soon. Before these modern formats, we also saw innovative approaches to improving how an image loads on a webpage. BlurHash is a technique of embedding a very small representation of the image inside the HTML markup which can be immediately rendered and acts as a placeholder until the final image loads. This small representation (hash) produced a blurry mix of colors similar to that of the final image and so eased the loading experience for users.

Progressive JPEGs are similar in effect, but are a built-in feature of the image format itself. Instead of encoding the image bytes from top-to-bottom, bytes are ordered in increasing levels of image detail. This again produces a more subtle loading experience, where the user first sees a low quality image which progressively “enhances” as more bytes are loaded.

Optimizing images on the web

Quality

The newer image formats (WebP and AVIF) support lossless compression, unlike their predecessor, JPEG. For some uses, lossless compression might be appropriate, but for the majority of websites, speed is prioritized and this minor loss in quality is worth the time and bytes saved.

Optimizing where to set the quality is a balancing act: too aggressive and artifacts become visible on your image; too little and the image is unnecessarily large. Butteraugli and SSIM are examples of algorithms which approximate our perception of image quality, but this is currently difficult to automate and is therefore best set manually. In general, however, we find that around 85% in most compression libraries is a sensible default.

Markup

All of the previous techniques reduce the number of bytes an image uses. This is great for improving the loading speed of those images and the Largest Contentful Paint (LCP) metric. However, to improve the Cumulative Layout Shift (CLS) metric, we must minimize changes to the page layout. This can be done by informing the browser of the image size ahead of time.

On a poorly optimized webpage, images will be embedded without their dimensions in the markup. The browser fetches those images, and only once it has received the header bytes of the image can it know about the dimensions of that image. The effect is that the browser first renders the page where the image takes up zero pixels, and then suddenly redraws with the dimensions of that image before actually loading the image pixels themselves. This is jarring to users and has a serious impact on usability.

It is important to include dimensions of the image inside HTML markup to allow the browser to allocate space for that image before it even begins loading. This prevents unnecessary redraws and reduces layout shift. It is even possible to set dimensions when dynamically loading responsive images: by informing the browser of the height and width of the original image, assuming the aspect ratio is constant, it will automatically calculate the correct height, even when using a width selector.

<img height="9000"
     width="12000"
     srcset="hello_world_1500.jpg 1500w,
             hello_world_2000.jpg 2000w,
             hello_world_12000.jpg 12000w"
     sizes="(max-width: 1500px) 1500px,
            (max-width: 2000px) 2000px,
            12000px"
     src="hello_world_12000.jpg"
     alt="Hello, world!" />

Finally, lazy-loading is a technique which reduces the work that the browser has to perform right at the onset of page loading. By deferring image loads to only just before they’re needed, the browser can prioritize more critical assets such as fonts, styles and JavaScript. By setting the loading property on an image to lazy, you instruct the browser to only load the image as it enters the viewport. For example, on an e-commerce site which renders a grid of products, this would mean that the page loads faster for visitors, and seamlessly fetches images below the fold, as a user scrolls down. This is supported by all major browsers except Safari which currently has this feature hidden behind an experimental flag.

<img loading="lazy" … />

Hosting

Finally, you can improve image loading by hosting all of a page’s images together on the same first-party domain. If each image was hosted on a different domain, the browser would have to perform a DNS lookup, create a TCP connection and perform the TLS handshake for every single image. When they are all co-located on a single domain (especially so if that is the same domain as the page itself), the browser can re-use the connection which improves the speed it can load those images.

Test your website

Today, we’re excited to announce the launch of Cloudflare’s Image Optimization Testing Tool. Simply enter your website URL, and we’ll run a series of automated tests to determine if there are any possible improvements you could make in delivering optimal images to visitors.

We use WebPageTest and Lighthouse to calculate the Core Web Vitals on two versions of your page: one as the original, and one with Cloudflare’s best-effort automatic optimizations. These optimizations are performed using a Cloudflare Worker in combination with our Image Resizing product, and will transform an image’s format, quality, and dimensions.

We report key summary metrics about your webpage’s performance, including the aforementioned Cumulative Layout Shift (CLS) and Largest Contentful Page (LCP), as well as a detailed breakdown of each image on your page and the optimizations that can be made.

Cloudflare Images

Cloudflare Images can help you to solve a number of the problems outlined in this post. By storing your images with Cloudflare and configuring a set of variants, we can deliver optimized images from our edge to your website or app. We automatically set the optimal image format and allow you to customize the dimensions and fit for your use-cases.

We’re excited to see what you build with Cloudflare Images, and you can expect additional features and integrations in the near future. Get started with Images today from $6/month.

Building Cloudflare Images in Rust and Cloudflare Workers

Post Syndicated from Yevgen Safronov original https://blog.cloudflare.com/building-cloudflare-images-in-rust-and-cloudflare-workers/

Building Cloudflare Images in Rust and Cloudflare Workers

Building Cloudflare Images in Rust and Cloudflare Workers

This post explains how we implemented the Cloudflare Images product with reusable Rust libraries and Cloudflare Workers. It covers the technical design of Cloudflare Image Resizing and Cloudflare Images. Using Rust and Cloudflare Workers helps us quickly iterate and deliver product improvements over the coming weeks and months.

Reuse of code in Rusty image projects

We developed Image Resizing in Rust. It’s a web server that receives HTTP requests for images along with resizing options, fetches the full-size images from the origin, applies resizing and other image processing operations, compresses, and returns the HTTP response with the optimized image.

Rust makes it easy to split projects into libraries (called crates). The image processing and compression parts of Image Resizing are usable as libraries.

We also have a product called  Polish, which is a Golang-based service that recompresses images in our cache. Polish was initially designed to run command-line programs like jpegtran and pngcrush. We took the core of Image Resizing and wrapped it in a command-line executable. This way, when Polish needs to apply lossy compression or generate WebP images or animations, it can use Image Resizing via a command-line tool instead of a third-party tool.

Reusing libraries has allowed us to easily unify processing between Image Resizing and Polish (for example, to ensure that both handle metadata and color profiles in the same way).

Cloudflare Images is another product we’ve built in Rust. It added support for a custom storage back-end, variants (size presets), support for signing URLs and more. We made it as a collection of Rust crates, so we can reuse pieces of it in other services running anywhere in our network. Image Resizing provides image processing for Cloudflare Images and shares libraries with Images to understand the new URL scheme, access the storage back-end, and database for variants.

How Image Resizing works

Building Cloudflare Images in Rust and Cloudflare Workers

The Image Resizing service runs at the edge and is deployed on every server of the Cloudflare global network. Thanks to Cloudflare’s global Anycast network, the closest Cloudflare data center will handle eyeball image resizing requests. Image Resizing is tightly integrated with the Cloudflare cache and handles eyeball requests only on a cache miss.

There are two ways to use Image Resizing. The default URL scheme provides an easy, declarative way of specifying image dimensions and other options. The other way is to use a JavaScript API in a Worker. Cloudflare Workers give powerful programmatic control over every image resizing request.

How Cloudflare Images work

Building Cloudflare Images in Rust and Cloudflare Workers

Cloudflare Images consists of the following components:

  • The Images core service that powers the public API to manage images assets.
  • The Image Resizing service responsible for image transformations and caching.
  • The Image delivery Cloudflare Worker responsible for serving images and passing corresponding parameters through to the Imaging Resizing service.
  • Image storage that provides access and storage for original image assets.

To support Cloudflare Images scenarios for image transformations, we made several changes to the Image Resizing service:

  • Added access to Cloudflare storage with original image assets.
  • Added access to variant definitions (size presets).
  • Added support for signing URLs.

Image delivery

The primary use case for Cloudflare Images is to provide a simple and easy-to-use way of managing images assets. To cover egress costs, we provide image delivery through the Cloudflare managed imagedelivery.net domain. It is configured with Tiered Caching to maximize the cache hit ratio for image assets. imagedelivery.net provides image hosting without a need to configure a custom domain to proxy through Cloudflare.

A Cloudflare Worker powers image delivery. It parses image URLs and passes the corresponding parameters to the image resizing service.

How we store Cloudflare Images

There are several places we store information on Cloudflare Images:

  • image metadata in Cloudflare’s core data centers
  • variant definitions in Cloudflare’s edge data centers
  • original images in core data centers
  • optimized images in Cloudflare cache, physically close to eyeballs.

Image variant definitions are stored and delivered to the edge using Cloudflare’s distributed key-value store called Quicksilver. We use a single source of truth for variants. The Images core service makes calls to Quicksilver to read and update variant definitions.

The rest of the information about the image is stored in the image URL itself:
https://imagedelivery.net/<encoded account id>/<image id>/<variant name>

<image id> contains a flag, whether it’s publicly available or requires access verification. It’s not feasible to store any image metadata in Quicksilver as the data volume would increase linearly with the number of images we host. Instead, we only allow a finite number of variants per account, so we responsibly utilize available disk space on the edge. The downside of storing image metadata as part of <image id> is that <image id> will change on access change.

How we keep Cloudflare Images up to date

The only way to access images is through the use of variants. Each variant is a named image resizing configuration. Once the image asset is fetched, we cache the transformed image in the Cloudflare cache. The critical question is how we keep processed images up to date. The answer is by purging the Cloudflare cache when necessary. There are two use cases:

  • access to the image is changed
  • the variant definition is updated

In the first instance, we purge the cache by calling a URL:
https://imagedelivery.net/<encoded account id>/<image id>

Then, the customer updates the variant we issue a cache purge request by tag:
account-id/variant-name

To support cache purge by tag, the image resizing service adds the necessary tags for all transformed images.

How we restrict access to Cloudflare Images

The Image resizing service supports restricted access to images by using URL signatures with expiration. URLs are signed with an SHA-256 HMAC key. The steps to produce valid signatures are:

  1. Take the path and query string (the path starts with /).
  2. Compute the path’s SHA-256 HMAC with the query string, using the Images’ URL signing key as the secret. The key is configured in the Dashboard.
  3. If the URL is meant to expire, compute the Unix timestamp (number of seconds since 1970) of the expiration time, and append ?exp= and the timestamp as an integer to the URL.
  4. Append ? or & to the URL as appropriate (? if it had no query string; & if it had a query string).
  5. Append sig= and the HMAC as hex-encoded 64 characters.

A signed URL looks like this:

Building Cloudflare Images in Rust and Cloudflare Workers

A signed URL with an expiration timestamp looks like this:

Building Cloudflare Images in Rust and Cloudflare Workers

Signature of /hello/world URL with a secret ‘this is a secret’ is 6293f9144b4e9adc83416d1b059abcac750bf05b2c5c99ea72fd47cc9c2ace34.

https://imagedelivery.net/hello/world?sig=6293f9144b4e9adc83416d1b059abcac750bf05b2c5c99ea72fd47cc9c2ace34

Building Cloudflare Images in Rust and Cloudflare Workers

Direct creator uploads with Cloudflare Worker and KV

Similar to Cloudflare Stream, Images supports direct creator uploads. That allow users to upload images without API tokens. Everyday use of direct creator uploads is by web apps, client-side applications, or mobile apps where users upload content directly to Cloudflare Images.

Once again, we used our serverless platform to support direct creator uploads. The successful API call stores the account’s information in Workers KV with the specified expiration date. A simple Cloudflare Worker handles the upload URL, which reads the KV value and grants upload access only on a successful call to KV.

Future Work

Cloudflare Images product has an exciting product roadmap. Let’s review what’s possible with the current architecture of Cloudflare Images.

Resizing hints on upload

At the moment, no image transformations happen on upload. That means we can serve the image globally once it is uploaded to Image storage. We are considering adding resizing hints on image upload. That won’t necessarily schedule image processing in all cases but could provide a valuable signal to resize the most critical image variants. An example could be to generate an AVIF variant for the most vital image assets.

Serving images from custom domains

We think serving images from a domain we manage (with Tiered Caching) is a great default option for many customers. The downside is that loading Cloudflare images requires additional TLS negotiations on the client-side, adding latency and impacting loading performance. On the other hand, serving Cloudflare Images from custom domains will be a viable option for customers who set up a website through Cloudflare. The good news is that we can support such functionality with the current architecture without radical changes in the architecture.

Conclusion

The Cloudflare Images product runs on top of the Cloudflare global network. We built Cloudflare Images in Rust and Cloudflare Workers. This way, we use Rust reusable libraries in several products such as Cloudflare Images, Image Resizing, and Polish. Cloudflare’s serverless platform is an indispensable tool to build Cloudflare products internally. If you are interested in building innovative products in Rust and Cloudflare Workers, we’re hiring.

How Cloudflare Images can make your life easier

Post Syndicated from Rita Soares original https://blog.cloudflare.com/how-cloudflare-images-can-make-your-life-easier/

How Cloudflare Images can make your life easier

How Cloudflare Images can make your life easier

Imagine how a customer would feel if they get to your website, and it takes forever to load all the images you serve. This would become a negative user experience that might lead to lower overall site traffic and high bounce rates.

The good news is that regardless of whether you need to store and serve 100,000 or one million images, Cloudflare Images gives you the tools you need to build an entire image pipeline from scratch.

Customer pains

After speaking with many of Cloudflare customers, we quickly understood that whether you are an e-commerce retailer, a blogger or have a platform for creators, everyone shares the same problems:

  • Egress fees. Each time an image needs to go from Product A (storage) to Product B (optimize) and to Product C (delivery) there’s a fee. If you multiply this by the millions of images clients serve per day it’s easy to understand why their bills are so high.
  • Buckets everywhere. Our customers’ current pipelines involve uploading images to and from services like AWS, then using open source products to optimize images, and finally to serve the images they need to store them in another cloud bucket since CDN don’t have long-term storage. This means that there is a dependency on buckets at each step of the pipeline.
  • Load times. When an image is not correctly optimized the image can be much larger than needed resulting in an unnecessarily long download time. This can lead to a bad end user experience that might result in loss of overall site traffic.
  • High Maintenance. To maintain an image pipeline companies need to rely on several AWS and open source products, plus an engineering team to build and maintain that pipeline. This takes the focus away from engineering on the product itself.

How can Cloudflare Images help?  

Zero Egress Costs

The majority of cloud providers allow you to store images for a small price, but the bill starts to grow every time you need to retrieve that image to optimize and deliver. The good news is that with Cloudflare Images customers don’t need to worry about egress costs, since all storage, optimization and delivery are part of the same tool.

The buckets stop with Cloudflare Images

One small step for humankind, one giant leap for image enthusiasts!

With Cloudflare Images the bucket pain stops now, and customers have two options:

  1. One image upload can generate up to 100 variants, which allows developers to stop placing image sizes in URLs. This way, if a site gets redesigned there isn’t a need to change all the image sizes because you already have all the variants you need stored in Cloudflare Images.
  2. Give your users a one-time permission to upload one file to your server. This way developers don’t need to write additional code to move files from users into a bucket — they will be automatically uploaded into your Cloudflare storage.

Minimal engineering effort

Have you ever dreamed about your team focusing entirely on product development instead of maintaining infrastructure? We understand, and this is why we created a straightforward set of APIs as well as a UI in the Cloudflare Dashboard. This allows your team to serve and optimize images without the need to set up and maintain a pipeline from scratch.

Once you get access to Cloudflare Images your team can start:

  • Uploading, deleting and updating images via API.
  • Setting up preferred variants.
  • Editing with Image Resizing both with the UI and API.
  • Serving an image with one click.

Process images on the fly

We all know that Google and many other search engines use the loading speed as one of their ranking factors; Cloudflare Images helps you be on the top of that list. We automatically detect what browser your clients are using and serve the most optimized version of the image, so that you don’t need to worry about file extensions, configuring origins for your image sets or even cache hit rates.

Curious to have a sneak peek at Cloudflare Images? Sign up now!

From AMP to Signed Exchanges, Or How Innovation Happens at Cloudflare

Post Syndicated from Matthew Prince original https://blog.cloudflare.com/from-amp-to-signed-exchanges-or-how-innovation-happens-at-cloudflare/

From AMP to Signed Exchanges, Or How Innovation Happens at Cloudflare

From AMP to Signed Exchanges, Or How Innovation Happens at Cloudflare

This is the story of how we decided to work with Google to build Signed Exchanges support at Cloudflare. But, more generally, it’s also a story of how Cloudflare thinks about building disruptive new products and how we’ve built an organization designed around continuous innovation and long-term thinking.

A Threat to the Open Web?

The story starts with me pretty freaked out. In May 2015, Facebook had announced a new format for the web called Instant Articles. The format allowed publishers to package up their pages and serve them directly from Facebook’s infrastructure. This was a threat to Google, so the company responded in October with Accelerated Mobile Pages (AMP). The idea was generally the same as Facebook’s but using Google’s infrastructure.

As a general Internet user, if these initiatives were successful they were pretty scary. The end game was that the entirety of the web would effectively be slurped into Facebook and Google’s infrastructure.

But as the cofounder and CEO of Cloudflare, this presented an even more immediate risk. If everyone moved their infrastructure to Facebook and Google, there wasn’t much left for us to do. Our mission is to help build a better Internet, but we’ve always assumed there would be an Internet. If Facebook and Google were successful, there was real risk there would just be Facebook and Google.

That said, the rationale behind these initiatives was compelling. While they ended with giving Facebook and Google much more control, they started by trying to solve a real problem. The web was designed with the assumption that the devices connecting to it would be on a fixed, wired connection. As more of the web moved to being accessed over wireless, battery-powered, relatively low-power devices, many of the assumptions of the web were holding back its performance.

This is particularly true in the developing world. While a failed connection can happen anywhere, the further you get from where content is hosted, the more likely it is to happen. Facebook and Google both reasoned that if they could package up the web and serve complete copies of pages from their infrastructure, which spanned the developing world, they could significantly increase the usability of the web in areas where there was still an opportunity for Internet usage to grow. Again, this is a laudable goal. But, if successful, the results would have been dreadful for the Internet as we know it.

Seeds of Disruption

So that’s why I was freaked out. In our management meetings at Cloudflare I’d walk through how this was a risk to the Internet and our business, and we needed to come up with a strategy to address it. Everyone on our team listened and agreed but ultimately and reasonably said: that’s in the future, and we have immediate priorities of things our customers need, so we’ll need to wait until next quarter to prioritize it.

That’s all correct, and probably the right decision if you are forced to make one, but it’s also how companies end up getting disrupted. So, in 2016, we decided to fund a small team led by Dane Knecht, Cloudflare’s founding product manager, to set up a sort of skunkworks team in Austin, TX. The idea was to give the team space away from headquarters, so it could work on strategic projects with a long payoff time horizon.

Today, Dane’s team is known as the Emerging Technologies & Incubation (ETI) team. It was where products like Cloudflare for Teams, 1.1.1.1, and Workers were first dreamed up and prototyped. And it remains critical to how Cloudflare continues to be so innovative. Austin, since 2016, has also grown from a small skunkworks outpost to what will, before the end of this year, be our largest office. That office now houses members from every Cloudflare team, not just ETI. But, in some ways, it all started with trying to figure out how we should respond to Instant Articles and AMP.

We met with both Facebook and Google. Facebook’s view of the world was entirely centered around their app, and didn’t leave much room for partners. Google, on the other hand, was born out of the open web and still ultimately wanted to foster it. While there has been a lot of criticism of AMP, much of which we discussed with them directly, it’s important to acknowledge that it started from a noble goal: to make the web faster and easier to use for those with limited Internet resources.

We built a number of products to extend the AMP ecosystem and make it more open. Viewed on their own, those products have not been successes. But they catalyzed a number of other innovations. For instance, building a third party AMP cache on Cloudflare required a more programmable network. That directly resulted in us prototyping a number of different serverless computing strategies and finally settling on Workers. In fact, many of the AMP products we built were the first products built using Workers.

Part of the magic of our ETI team is that they are constantly trying new things. They’re set up differently, in order to take lots of “shots on goal.” Some won’t work, in which case we want them to fail fast. And, even for those that don’t, we are always learning, collaborating, and innovating. That’s how you create a culture of innovation that produces products at the rate we do at Cloudflare.

Signed Exchanges: Helping Build a Better Internet

Importantly also, working with the AMP team at Google helped us better collaborate on ideas around Internet performance. Cloudflare’s mission is to “help build a better Internet.” It’s not to “build a better Internet.” The word “help” is essential and something I’ll always correct if I hear someone leave it out. The Internet is inherently a collection of networks, and also a collection of work from a number of people and organizations. Innovation doesn’t happen in a vacuum but is catalyzed by collaboration and open standards. Working with other great companies who are aligned with democratizing performance optimization technology and speeding up the Internet is how we believe we can make significant and meaningful leaps in terms of performance.

From AMP to Signed Exchanges, Or How Innovation Happens at Cloudflare

And that’s what Signed Exchanges have the opportunity to be. They take the best parts of AMP — in terms of allowing pages to be preloaded to render almost instantly — but give back control over the content to the individual publishers. They don’t require you to exclusively use Google’s infrastructure and are extensible well beyond just traffic originating from search results. And they make the web incredibly fast and more accessible even in those areas where Internet access is slow or expensive.

We’re proud of the part we played in bringing this new technology to the Internet. We’re excited to see how people use it to build faster services available more broadly. And the ETI team is back at work looking over the innovation horizon and continuously asking the question: what’s next?

From AMP to Signed Exchanges, Or How Innovation Happens at Cloudflare

Improving Origin Performance for Everyone with Orpheus and Tiered Cache

Post Syndicated from David Tuber original https://blog.cloudflare.com/orpheus/

Improving Origin Performance for Everyone with Orpheus and Tiered Cache

Improving Origin Performance for Everyone with Orpheus and Tiered Cache

Cloudflare’s mission is to help build a better Internet for everyone. Building a better Internet means helping build more reliable and efficient services that everyone can use. To help realize this vision, we’re announcing the free distribution of two products, one old and one new:

  • Tiered Caching is now available to all customers for free. Tiered Caching reduces origin data transfer and improves performance, making web properties cheaper and faster to operate. Tiered Cache was previously a paid addition to Free, Pro, and Business plans as part of Argo.
  • Orpheus is now available to all customers for free. Orpheus routes around problems on the Internet to ensure that customer origin servers are reachable from everywhere, reducing the number of errors your visitors see.

Tiered Caching: improving website performance and economics for everyone

Tiered Cache uses the size of our network to reduce requests to customer origins by dramatically increasing cache hit ratios. With data centers around the world, Cloudflare caches content very close to end users, but if a piece of content is not in cache, the Cloudflare edge data centers must contact the origin server to receive the cacheable content. This can be slow and places load on an origin server compared to serving directly from cache.

Tiered Cache works by dividing Cloudflare’s data centers into a hierarchy of lower-tiers and upper-tiers. If content is not cached in lower-tier data centers (generally the ones closest to a visitor), the lower-tier must ask an upper-tier to see if it has the content. If the upper-tier does not have it, only the upper-tier can ask the origin for content. This practice improves bandwidth efficiency by limiting the number of data centers that can ask the origin for content, reduces origin load, and makes websites more cost-effective to operate.

Dividing data centers like this results in improved performance for visitors because distances and links traversed between Cloudflare data centers are generally shorter and faster than the links between data centers and origins. It also reduces load on origins, making web properties more economical to operate. Customers enabling Tiered Cache can achieve a 60% or greater reduction in their cache miss rate as compared to Cloudflare’s traditional CDN service.

Additionally, Tiered Cache concentrates connections to origin servers so they come from a small number of data centers rather than the full set of network locations. This results in fewer open connections using server resources.

Improving Origin Performance for Everyone with Orpheus and Tiered Cache

Tiered Cache is simple to enable:

  • Log into your Cloudflare account.
  • Navigate to the Caching in the dashboard.
  • Under Caching, select Tiered Cache.
  • Enable Tiered Cache.

From there, customers will automatically be enrolled in Smart Tiered Cache Topology without needing to make any additional changes. Enterprise Customers can select from different prefab topologies or have a custom topology created for their unique needs.

Improving Origin Performance for Everyone with Orpheus and Tiered Cache

Smart Tiered Cache dynamically selects the single best upper tier for each of your website’s origins with no configuration required. We will dynamically find the single best upper tier for an origin by using Cloudflare’s performance and routing data. Cloudflare collects latency data for each request to an origin. Using this latency data, we can determine how well any upper-tier data center is connected with an origin and can empirically select the best data center with the lowest latency to be the upper-tier for an origin.

Today, Smart Tiered Cache is being offered to ALL Cloudflare customers for free, in contrast to other CDNs who may charge exorbitant fees for similar or worse functionality. Current Argo customers will get additional benefits described here. We think that this is a foundational improvement to the performance and economics of running a website.

But what happens if an upper-tier can’t reach an origin?

Orpheus: solving origin reachability problems for everyone

Cloudflare is a reverse proxy that receives traffic from end users and proxies requests back to customer servers or origins. To be successful, Cloudflare needs to be reachable by end users while simultaneously being able to reach origins. With end users around the world, Cloudflare needs to be able to reach origins from multiple points around the world at the same time. This is easier said than done! The Internet is not homogenous, and diverse Cloudflare network locations do not necessarily take the same paths to a given customer origin at any given time. A customer origin may be reachable from some networks but not from others.

Cloudflare developed Argo to be the Waze of the Internet, allowing our network to react to changes in Internet traffic conditions and route around congestion and breakages in real-time, ensuring end users always have a good experience. Argo Smart Routing provides amazing performance and reliability improvements to our customers.

Enter Orpheus. Orpheus provides reachability benefits for customers by finding unreachable paths on the Internet in real time, and guiding traffic away from those paths, ensuring that Cloudflare will always be able to reach an origin no matter what is happening on the Internet.  

Today, we’re excited to announce that Orpheus is available to and being used by all our customers.

Fewer 522s

You may have seen this error before at one time or another.

Improving Origin Performance for Everyone with Orpheus and Tiered Cache

This error indicates that a user was unable to reach content because Cloudflare couldn’t reach the origin. Because of the unpredictability of the Internet described above, users may see this error even when an origin is up and able to receive traffic.

So why do you see this error? The 522 error occurs when network instability causes traffic sent by Cloudflare to fail either before it reaches the origin, or on the way back from the origin to Cloudflare. This is the equivalent of either Cloudflare or your origin sending a request and never getting a response. Both sides think that they’re fine, but the network path between them is not reachable at all. This causes customer pain.

Orpheus solves that pain, ensuring that no matter where users are or where the origin is, an Internet application will always be reachable from Cloudflare.

How it works

Orpheus builds and provisions routes from Cloudflare to origins by analyzing data from users on every path from Cloudflare and ordering them on a per-data center level with the goal of eliminating connection errors and minimizing packet loss. If Orpheus detects errors on the current path from Cloudflare back to a customer origin, Orpheus will steer subsequent traffic from the impacted network path to the healthiest path available.

Improving Origin Performance for Everyone with Orpheus and Tiered Cache

This is similar to how Argo works but with some key differences: Argo is always steering traffic down the fastest path, whereas Orpheus is reactionary and steers traffic down healthy (and not necessarily the fastest) paths when needed.

Improving origin reachability for customers

Let’s look at an example.

Barry has an origin hosted in WordPress in Chicago for his daughter’s band. This zone primarily sees traffic from three locations: the location closest to his daughter in Seattle, the location closest to him in Boston, and the location closest to his parents in Tampa, who check in on their granddaughter’s site daily for updates.

One day, a link between Tampa and the Chicago origin gets cut by a wandering backhoe. This means that Tampa loses some connectivity back to the Chicago origin. As a result, Barry’s parents start to see failures when connecting back to origin when connecting to the site. This reflects in origin reachability decreasing. Orpheus helps here by finding alternate paths for Barry’s parents, whether it’s through Boston, Seattle, or any location in between that isn’t impacted by the fiber cut seen in Tampa.

Improving Origin Performance for Everyone with Orpheus and Tiered Cache

So even though there is packet loss between one of Cloudflare’s data centers and Barry’s origin, because there is a path through a different Cloudflare data center that doesn’t have loss, the traffic will still succeed because the traffic will go down the non-lossy path.

How much does Orpheus help my origin reachability?

In our rollout of Orpheus for customers, we observed that Orpheus improved Origin reachability by 23%, from 99.87% to 99.90%. Here is a chart showing the improvement Orpheus provides (lower is better):

Improving Origin Performance for Everyone with Orpheus and Tiered Cache

We measure this reachability improvement by measuring 522 rates for every data center-origin pair and then comparing traffic that traversed Orpheus routes with traffic that went directly back to origin. Orpheus was especially helpful at improving reachability for slightly lossy paths that could present small amounts of failure over a long period of time, whereas direct to origin would see those failures.

Note that we’ll never get this number to 0% because, with or without Orpheus, some origins really are unreachable because they are down!

Orpheus makes Cloudflare products better

Orpheus pairs well with some of our products that are already designed to provide highly available services on an uncertain Internet. Let’s go over the interactions between Orpheus and three of our products: Load Balancing, Cloudflare Network Interconnect, and Tiered Cache.

Load Balancing

Orpheus and Load Balancing go together to provide high reachability for every origin endpoint. Load balancing allows for automatic selection of endpoints based on health probes, ensuring that if an origin isn’t working, customers will still be available and operational. Orpheus finds reachable paths from Cloudflare to every origin. These two products in tandem provide a highly available and reachable experience for customers.

Cloudflare Network Interconnect

Orpheus and Cloudflare Network Interconnect (CNI) combine to always provide a highly reachable path, no matter where in the world you are. Consider Acme, a company who is connected to the Internet by only one provider that has a lot of outages. Orpheus will do its best to steer traffic around the lossy paths, but if there’s only one path back to the customer, Orpheus won’t be able to find a less-lossy path. Cloudflare Network Interconnect solves this problem by providing a path that is separate from the transit provider that any Cloudflare data center can access. CNI provides a viable path back to Acme’s origin that will allow Orpheus to engage from any data center in the world if loss occurs.

Shields for All

Orpheus and Tiered Cache can combine to build an adaptive shield around an origin that caches as much as possible while improving traffic back to origin. Tiered Cache topologies allow for customers to deflect much of their static traffic away from their origin to reduce load, and Orpheus helps ensure that any traffic that has to go back to the origin traverses over highly available links.

Improving origin performance for everyone

The Internet is a growing, ever-changing ecosystem. With the release of Orpheus and Tiered Cache for everyone, we’ve given you the ability to navigate whatever the Internet has in store to provide the best possible experience to your customers.

Argo 2.0: Smart Routing Learns New Tricks

Post Syndicated from David Tuber original https://blog.cloudflare.com/argo-v2/

Argo 2.0: Smart Routing Learns New Tricks

Argo 2.0: Smart Routing Learns New Tricks

We launched Argo in 2017 to improve performance on the Internet. Argo uses real-time global network information to route around brownouts, cable cuts, packet loss, and other problems on the Internet. Argo makes the network that Cloudflare relies on—the Internet—faster, more reliable, and more secure on every hop around the world.

Without any complicated configuration, Argo is able to use real-time traffic data to pick the fastest path across the Internet, improving performance and delivering more satisfying experiences to your customers and users.

Today, Cloudflare is announcing several upgrades to Argo’s intelligent routing:

  • When it launched, Argo was entirely focused on the “middle mile,” speeding up connections from Cloudflare to our customers’ servers. Argo now delivers optimal routes from clients and users to Cloudflare, further reducing end-to-end latency while still providing the impressive edge to origin performance that Argo is known for. These last-mile improvements reduce end user round trip times by up to 40%.
  • We’re also adding support for accelerating pure IP workloads, allowing Magic Transit and Magic WAN customers to build IP networks to enjoy the performance benefits of Argo.

Starting today, all Free, Pro, and Business plan Argo customers will see improved performance with no additional configuration or charge. Enterprise customers have already enjoyed the last mile performance improvements described here for some time. Magic Transit and WAN customers can contact their account team to request Early Access to Argo Smart Routing for Packets.

What’s Argo?

Argo finds the best and fastest possible path for your traffic on the Internet. Every day, Cloudflare carries hundreds of billions of requests across our network and the Internet. Because our network, our customers, and their end users are well distributed globally, all of these requests flowing across our infrastructure paint a great picture of how different parts of the Internet are performing at any given time.

Just like Waze examines real data from real drivers to give you accurate, uncongested — and sometimes unorthodox — routes across town, Argo Smart Routing uses the timing data Cloudflare collects from each request to pick faster, more efficient routes across the Internet.

In practical terms, Cloudflare’s network is expansive in its reach. Some Internet links in a given region may be congested and cause poor performance (a literal traffic jam). By understanding this is happening and using alternative network locations and providers, Argo can put traffic on a less direct, but faster, route from its origin to its destination.

These benefits are not theoretical: enabling Argo Smart Routing shaves an average of 33% off HTTP time to first byte (TTFB).

One other thing we’re proud of: we’ve stayed super focused on making it easy to use. One click in the dashboard enables better, smarter routing, bringing the full weight of Cloudflare’s network, data, and engineering expertise to bear on making your traffic faster. Advanced analytics allow you to understand exactly how Argo is performing for you around the world.

You can read a lot more about how Argo works in our original launch blog post.

Even More Blazing Fast

We’ve continuously improved Argo since the day it was launched, making it faster, quicker to respond to changes on the Internet, and allowing more types of traffic to flow over smart routes.

Argo’s new performance optimizations improve last mile latencies and reduce time to first byte even further. Argo’s last mile optimizations can save up to 40% on last mile round trip time (RTT) with commensurate improvements to end-to-end latency.

Running benchmarks against an origin server in the central United States, with visitors coming from around the world, Argo delivered the following results:

Argo 2.0: Smart Routing Learns New Tricks

The Argo improvements on the last mile reduced overall time to first byte by 39%, and reduced end-to-end latencies by 5% overall:

Argo 2.0: Smart Routing Learns New Tricks

Faster, better caching

Argo customers don’t just see benefits to their dynamic traffic. Argo’s new found skills provide benefits for static traffic as well. Because Argo now finds the best path to Cloudflare, client TTFB for cache hits sees the same last mile benefit as dynamic traffic.

Getting access to faster Argo

The best part about all these improvements? They’re already deployed and enabled for all Argo customers! These optimizations have been live for Enterprise customers for some time and were enabled for Free, Pro, and Business plans this week.

Moving Down the Stack: Argo Smart Routing for Packets

Customers use Magic Transit and Magic WAN to create their own IP networks on top of Cloudflare’s network, with access to a full suite of network functions (firewalls, DDoS mitigation, and more) delivered as a service. This allows customers to build secure, private, global networks without the need to purchase specialized hardware. Now, Argo Smart Routing for Packets allows these customers to create these IP networks with the performance benefits of Argo.

Consider a fictional gaming company, Golden Fleece Games. Golden Fleece deployed Magic Transit to mitigate attacks by malicious actors on the Internet. They want to be able to provide a quality game to their users while staying up. However, they also need their service to be as fast as possible. If their game sees additional latency, then users won’t play it, and even if their service is technically up, the increased latency will show a decrease in users. For Golden Fleece, being slow is just as bad as being down.

Finance customers also have similar requirements for low latency, high security scenarios. Consider Jason Financial, a fictional Magic Transit customer using Packet Smart Routing. Jason Financial employees connect to Cloudflare in New York, and their requests are routed to their data center which is connected to Cloudflare through a Cloudflare Network Interconnect attached to Cloudflare in Singapore. For Jason Financial, reducing latency is extraordinarily important: if their network is slow, then the latency penalties they incur can literally cost them millions of dollars due to how fast the stock market moves. Jason wants Magic Transit and other Cloudflare One products to secure their network and prevent attacks, but improving performance is important for them as well.

Argo’s Smart Routing for Packets provides these customers with the security they need at speeds faster than before. Now, customers can get the best of both worlds: security and performance. Now, let’s talk a bit about how it works.

A bird’s eye view of the Internet

Argo Smart Routing for Packets picks the fastest possible path between two points. But how does Argo know that the chosen route is the fastest? As with all Argo products, the answer comes by analyzing a wealth of network data already available on the Cloudflare edge. In Argo for HTTP or Argo for TCP, Cloudflare is able to use existing timing data from traffic that’s already being sent over our edge to optimize routes. This allows us to improve which paths are taken as traffic changes and congestion on the Internet happens. However, to build Smart Routing for Packets, the game changed, and we needed to develop a new approach to collect latency data at the IP layer.

Let’s go back to the Jason Financial case. Before, Argo would understand that the number of paths that are available from Cloudflare’s data centers back to Jason’s data center is proportional to the number of data centers Cloudflare has multiplied by the number of distinct interconnections between each data center. By looking at the traffic to Singapore, Cloudflare can use existing Layer 4 traffic and network analytics to determine the best path. But Layer 4 is not Layer 3, and when you move down the stack, you lose some insight into things like round trip time (RTT), and other metrics that compose time to first byte because that data is only produced at higher levels of the application stack. It can become harder to figure out what the best path actually is.

Optimizing performance at the IP layer can be more difficult than at higher layers. This is because protocol and application layers have additional headers and stateful protocols that allow for further optimization. For example, connection reuse is a performance improvement that can only be realized at higher layers of the stack because HTTP requests can reuse existing TCP connections. IP layers don’t have the concept of connections or requests at all: it’s just packets flowing over the wire.

To help bridge the gap, Cloudflare makes use of an existing data source that already exists for every Magic Transit customer today: health check probes. Every Magic Transit customer leverages existing health check probes from every single Cloudflare data center back to the customer origin. These probes are used to determine tunnel health for Magic Transit, so that Cloudflare knows which paths back to origin are healthy. These probes contain a variety of information that can also be used to improve performance as well. By examining health check probes and adding them to existing Layer 4 data, Cloudflare can get a better understanding of one-way latencies and can construct a map that allows us to see all the interconnected data centers and how fast they are to each other. Once this customer gets a Cloudflare Network Interconnect, Argo can use the data center-to-data center probes to create an alternate path for the customer that’s different from the public Internet.

Argo 2.0: Smart Routing Learns New Tricks

Using this map, Cloudflare can construct dynamic routes for each customer based on where their traffic enters Cloudflare’s network and where they need to go. This allows us to find the optimal route for Jason Financial and allows us to always pick the fastest path.

Packet-Level Latency Reductions

We’ve kind of buried the lede here! We’ve talked about how hard it is to optimize performance for IP traffic. The important bit: despite all these difficulties, Argo Smart Routing for Packets is able to provide a 10% average latency improvement worldwide in our internal testing!

Argo 2.0: Smart Routing Learns New Tricks

Depending on your network topology, you may see latency reductions that are even higher!

How do I get Argo Smart Routing for Packets?

Argo Smart Routing for Packets is in closed beta and is available only for Magic Transit customers who have a Cloudflare Network Interconnect provisioned. If you are a Magic Transit customer interested in seeing the improved performance of Argo Smart Routing for Packets for yourself, reach out to your account team today! If you don’t have Magic Transit but want to take advantage of bigger performance gains while acquiring uncompromised levels of network security, begin your Magic Transit onboarding process today!

What’s next for Argo

Argo’s roadmap is simple: get ever faster, for any type of traffic.

Argo’s recent optimizations will help customers move data across the Internet at as close to the speed of light as possible. Internally, “how fast are we compared to the speed of light” is one of our engineering team’s key success metrics. We’re not done until we’re even.

Improve site load times and SEO with one-click support for Signed Exchanges on Google Search

Post Syndicated from Marc Lamik original https://blog.cloudflare.com/automatic-signed-exchanges/

Improve site load times and SEO with one-click support for Signed Exchanges on Google Search

Improve site load times and SEO with one-click support for Signed Exchanges on Google Search

We’re excited to announce that, starting today, Cloudflare customers will be able to generate Signed Exchanges (SXG) for Google Search with just one click. Signed Exchanges is an open web platform specification Google developed as a way of verifying a cached version of a website — enabling massively faster delivery of a website from a third party, such as Google itself from its search results page, or from a news aggregator that is linking out to other sites.

The advantage to you as a website owner? Not only will your site load faster when linked to from a site supporting SXG, but because many search engines use page load times in order to determine search results, you should see a very nice boost in SEO.

What are signed exchanges, and how do they work?

Introduced by Google, a Signed Exchange (SXG) is an open standard delivery mechanism that makes it possible to authenticate the origin of a resource, independent of how it was delivered. This decoupling advances a variety of use cases, such as prefetching, offline Internet experiences, and serving from third-party caches. It does so in a secure and privacy-preserving manner.

Improve site load times and SEO with one-click support for Signed Exchanges on Google Search

Now, imagine yourself as the ruler of your kingdom with an important message to deliver to all your subjects. You have too many people to reach, so you can’t do it alone. You decide to enlist your trusty knights to ride out with large chests filled with copies of your message. There are villains everywhere that would love to take these messages and modify them for their own nefarious machinations for their own profit.

You, being the wise ruler you are, have a crafty plan: you have a very special stamp made that can imprint a seal that everyone can recognize, yet no one can recreate. With this wondrous seal, no one can tamper with the messages without breaking the seal and proving the forgery for all to see. Now, your knights can bring these chests to all corners of the kingdom and hand out the messages to the masses, and your subjects can trust that the message came from you. There is a side benefit for your people, too. They can come whenever they want to pick up the message without your watchful eye, so they’re more inclined to read it at their leisure.

Maybe this is stretching the analogy a bit, but in the case of Signed Exchanges, a cryptographic signature on a digest of the response and headers acts as the tamper proof seal for the message. Fast forwarding our example to the present day: you want to get your newest web experience out to global distribution with the understanding that just about everyone will come through a search engine or aggregator site. Ahead of time, when you publish your content, the search engine crawls your site for content, but instead of delivering the raw content, you negotiate the delivery of the signed exchange. (This is accomplished simply through additional “Accept: application/signed-exchange;v=<version>” request headers from the crawler that announces the preference for signed exchanges).

Then Cloudflare generates the Signed Exchange, using the following process:

Improve site load times and SEO with one-click support for Signed Exchanges on Google Search
  1. Cloudflare fetches the original content that you want to sign, including the response headers.
  2. An additional Digest header is added that uses Merkle Integrity Content Encoding to support the progressive detection of data modification/corruption.
  3. We also strip out headers that don’t make sense within the context of Signed Exchanges (like Connection, Keep-Alive, etc.) as well as security sensitive headers (Set-Cookie, Authentication-Info, etc.).
  4. Then these headers, including the digest, along with additional metadata, like request URL, URL of the certificate, hash of the certificate, expiration time, etc., are all chained together into a stream that is used to calculate the final signature.
  5. The original content, along with the headers, signature, and a fallback URL are then packed into a final binary for delivery.

This Signed Exchange is then cached and sent to the crawler, which also stores the Signed Exchange. After indexing the content, it can now show up in searches. The user then discovers the link to your content in the search results. The search engine also preloads the signed exchange for your content in the background in the meantime, effectively pre-filling the cache in the client’s browser. This exchange was delivered from the search engine, so no signal has gone to the origin yet. Thus, the search intent of the user isn’t leaked to the origin. Since the exchange is signed and validated against your certificate, the browser trusts the contents and can display the content with attribution to the original URL. Now, when the user clicks on the link to view the contents, it magically loads instantaneously from the local cache.

Improve site load times and SEO with one-click support for Signed Exchanges on Google Search

There are many resources on the web available that go into detail about the specific format of Signed Exchanges, so we won’t rehash them here in detail. But one important aspect that isn’t obvious at first glance is the complexity of managing the signing process itself. The many details involve:

  • The inclusion of the atypical CanSignHttpExchanges extension to your certificate.
  • The requirement to deliver your certificates in a specific CBOR (like binary JSON) format.
  • OCSP stapling to ensure the validity of the certificates is required.
  • Renewals of these certificates on a more frequent basis (i.e. requires automation).
  • Caching of the generated signed exchanges, since they can be expensive to generate.

Luckily, all of these are in Cloudflare’s wheelhouse, since we already have deep expertise in Certificate Management and TLS delivery infrastructure. By partnering with Google on the Signed Exchange implementation, we can ensure the consistency of implementation, but improve the simplicity of integrating the technology with the single push of a button.

“Signed Exchanges make the web faster and a better user experience for users, by enabling cross-site prefetching. Site owners have seen clear improvement to Largest Contentful Paint, one of the Core Web Vitals, as well as increased user stickiness. Cloudflare now makes it simple for sites to implement Signed Exchanges and derive these benefits.” — Jeff Jose, Product Manager, Google

Bigger than search alone

The broader implication of SXGs is that they make content portable: content delivered via an SXG can be easily distributed by third parties while maintaining full assurance and attribution of its origin. Historically, the only way for a site to use a third party to distribute its content while maintaining attribution has been for the site to share its SSL certificates with the distributor. This has security drawbacks. Moreover, it is a far stretch from making content truly portable.

In the long-term, truly portable content can be used to achieve use cases like fully offline experiences. In the immediate term, the primary use case of SXGs is the delivery of faster user experiences by providing content in an easily cacheable format. Specifically, Google Search will cache and sometimes prefetch SXGs. For sites that receive a large portion of their traffic from Google Search, SXGs can be an important tool for delivering faster page loads to users.

It’s also possible that all sites could eventually support this standard. Every time a site is loaded, all the linked articles could be pre-loaded. Web speeds across the board would be dramatically increased. Matthew’s blog post talks more about this possibility.

Sign up today

Automatic Signed Exchanges will be free for all Cloudflare Pro, Business and Enterprise customers as well as for customers using our Advanced Platform Optimization product.

Sign up for the Automatic Signed Exchange beta waitlist today and after being approved, activating is only one flip of a switch.

To sign up for the waitlist go to the Speed page on the Cloudflare dashboard and click on “Join Waitlist” on the Automatic Signed Exchanges (SXGs) card.

Improve site load times and SEO with one-click support for Signed Exchanges on Google Search

We’ll take care of the rest.

How we built Instant Logs

Post Syndicated from Ben Yule original https://blog.cloudflare.com/how-we-built-instant-logs/

How we built Instant Logs

How we built Instant Logs

As a developer, you may be all too familiar with the stress of responding to a major service outage, becoming aware of an ongoing security breach, or simply dealing with the frustration of setting up a new service for the first time. When confronted with these situations, you want a real-time view into the events flowing through your network, so you can receive, process, and act on information as quickly as possible.

If you have a UNIX mindset, you’ll be familiar with tailing web service logs and searching for patterns using grep. With distributed systems like Cloudflare’s edge network, this task becomes much more complex because you’ll either need to log in to thousands of servers, or ship all the logs to a single place.

This is why we built Instant Logs. Instant Logs removes all barriers to accessing your Cloudflare logs, giving you a complete platform to view your HTTP logs in real time, with just a single click, right from within Cloudflare’s dashboard. Powerful filters then let you drill into specific events or search for patterns, and act on them instantly.

The Challenge

Today, Cloudflare’s Logpush product already gives customers the ability to ship their logs to a third-party analytics or storage provider of their choosing. While this system is already exceptionally fast, delivering logs in about 15s on average, it is optimized for completeness and the utmost certainty that your data is reliably making it to its destination. It is the ideal solution for after things have settled down, and you want to perform a forensic deep dive or retrospective.

We originally aimed to extend this system to provide our real-time logging capabilities, but we soon realized the objectives were inherently at odds with each other. In order to get all of your data, to a single place, all the time, the laws of the universe require that latencies be introduced into the system. We needed a complementary solution, with its own unique set of objectives.

This ultimately boiled down to the following

  1. It has to be extremely fast, in human terms. This means average latencies between an event occurring at the edge and being received by the client should be under three seconds.
  2. We wanted the system design to be simple, and communication to be as direct to the client as possible. This meant operating the dataplane entirely at the edge, eliminating unnecessary round trips to a core data center.
  3. The pipeline needs to provide sensible results on properties of all sizes, ranging from a few requests per day to hundreds of thousands of requests per second.
  4. The pipeline must support a broad set of user-definable filters that are applied before any sampling occurs, such that a user can target and receive exactly what they want.

Workers and Durable Objects

Our existing Logpush pipeline relies heavily on Kafka to provide sharding, buffering, and aggregation at a single, central location. While we’ve had excellent results using Kafka for these pipelines, the clusters are optimized to run only within our core data centers. Using Kafka would require extra hops to far away data centers, adding a latency penalty we were not willing to incur.

In order to keep the data plane running on the edge, we needed primitives that would allow us to perform some of the same key functions we needed out of Kafka. This is where Workers and the recently released Durable Objects come in. Workers provide an incredibly simple to use, highly elastic, edge-native, compute platform we can use to receive events, and perform transformations. Durable Objects, through their global uniqueness, allow us to coordinate messages streaming from thousands of servers and route them to a singular object. This is where aggregation and buffering are performed, before finally pushing to a client over a thin WebSocket. We get all of this, without ever having to leave the edge!

Let’s walk through what this looks like in practice.

A Simple Start

Imagine a simple scenario in which we have a single web server which produces log messages, and a single client which wants to consume them. This can be implemented by creating a Durable Object, which we will refer to as a Durable Session, that serves as the point of coordination between the server and client. In this case, the client initiates a WebSocket connection with the Durable Object, and the server sends messages to the Durable Object over HTTP, which are then forwarded directly to the client.

How we built Instant Logs

This model is quite quick and introduces very little additional latency other than what would be required to send a payload directly from the web server to the client. This is thanks to the fact that Durable Objects are generally located at or near the data center where they are first requested. At least in human terms, it’s instant. Adding more servers to our model is also trivial. As the additional servers produce events, they will all be routed to the same Durable Object, which merges them into a single stream, and sends them to the client over the same WebSocket.

How we built Instant Logs

Durable Objects are inherently single threaded. As the number of servers in our simple example increases, the Durable Object will eventually saturate its CPU time and will eventually start to reject incoming requests. And even if it didn’t, as data volumes increase, we risk overwhelming a client’s ability to download and render log lines. We’ll handle this in a few different ways.

Honing in on specific events

Filtering is the most simple and obvious way to reduce data volume before it reaches the client. If we can filter out the noise, and stream only the events of interest, we can substantially reduce volume. Performing this transformation in the Durable Object itself will provide no relief from CPU saturation concerns. Instead, we can push this filtering out to an invoking Worker, which will run many filter operations in parallel, as it elastically scales to process all the incoming requests to the Durable Object. At this point, our architecture starts to look a lot like the MapReduce pattern!

How we built Instant Logs

Scaling up with shards

Ok, so filtering may be great in some situations, but it’s not going to save us under all scenarios. We still need a solution to help us coordinate between potentially thousands of servers that are sending events every single second. Durable Objects will come to the rescue, yet again. We can implement a sharding layer consisting of Durable Objects, we will call them Durable Shards, that effectively allow us to reduce the number of requests being sent to our primary object.

How we built Instant Logs

But how do we implement this layer if Durable Objects are globally unique? We first need to decide on a shard key, which is used to determine which Durable Object a given message should first be routed to. When the Worker processes a message, the key will be added to the name of the downstream Durable Object. Assuming our keys are well-balanced, this should effectively reduce the load on the primary Durable Object by approximately 1/N.

Reaching the moon by sampling

But wait, there’s more to do. Going back to our original product requirements, “The pipeline needs to provide sensible results on properties of all sizes, ranging from a few requests per day to hundreds of thousands of requests per second.” With the system as designed so far, we have the technical headroom to process an almost arbitrary number of logs. However, we’ve done nothing to reduce the absolute volume of messages that need to be processed and sent to the client, and at high log volumes, clients would quickly be overwhelmed. To deliver the interactive, instant user experience customers expect, we need to roll up our sleeves one more time.

This is where our final trick, sampling, comes into play.

Up to this point, when our pipeline saturates, it still makes forward progress by dropping excess data as the Durable Object starts to refuse connections. However, this form of ‘uncontrolled shedding’ is dangerous because it causes us to lose information. When we drop data in this way, we can’t keep a record of the data we dropped, and we cannot infer things about the original shape of the traffic from the messages that we do receive. Instead, we implement a form of ‘controlled’ sampling, which still preserves the statistics, and information about the original traffic.

For Instant Logs, we implement a sampling technique called Reservoir Sampling. Reservoir sampling is a form of dynamic sampling that has this amazing property of letting us pick a specific k number of items from a stream of unknown length n, with a single pass through the data. By buffering data in the reservoir, and flushing it on a short (sub second) time interval, we can output random samples to the client at the maximum data rate of our choosing. Sampling is implemented in both layers of Durable Objects.

How we built Instant Logs

Information about the original traffic shape is preserved by assigning a sample interval to each line, which is equivalent to the number of samples that were dropped for this given sample to make it through, or 1/probability. The actual number of requests can then be calculated by taking the sum of all sample intervals within a time window. This technique adds a slight amount of latency to the pipeline to account for buffering, but enables us to point an event source of nearly any size at the pipeline, and we can expect it will be handled in a sensible, controlled way.

Putting it all together

What we are left with is a pipeline that sensibly handles wildly different volumes of traffic, from single digits to hundreds of thousands of requests a second. It allows the user to pinpoint an exact event in a sea of millions, or calculate summaries over every single one. It delivers insight within seconds, all without ever having to do more than click a button.

Best of all? Workers and Durable Objects handle this workload with aplomb and no tuning, and the available developer tooling allowed me to be productive from my first day writing code targeting the Workers ecosystem.

How to get involved?

We’ll be starting our Beta for Instant Logs in a couple of weeks. Join the waitlist to get notified about when you can get access!

If you want to be part of building the future of data at Cloudflare, we’re hiring engineers for our data team in Lisbon, London, Austin, and San Francisco!

Data at Cloudflare just got a lot faster: Announcing Live-updating Analytics and Instant Logs

Post Syndicated from Jon Levine original https://blog.cloudflare.com/instant-logs/

Data at Cloudflare just got a lot faster: Announcing Live-updating Analytics and Instant Logs

Data at Cloudflare just got a lot faster: Announcing Live-updating Analytics and Instant Logs

Today, we’re excited to introduce Live-updating Analytics and Instant Logs. For Pro, Business, and Enterprise customers, our analytics dashboards now update live to show you data as it arrives. In addition to this, Enterprise customers can now view their HTTP request logs instantly in the Cloudflare dashboard.

Cloudflare’s data products are essential for our customers’ visibility into their network and applications. Having this data in real time makes it even more powerful — could you imagine trying to navigate using a GPS that showed your location a minute ago? That’s the power of real time data!

Real time data unlocks entirely new use cases for our customers. They can respond to threats and resolve errors as soon as possible, keeping their applications secure and minimising disruption to their end users.

Lightning fast, in-depth analytics

Cloudflare products generate petabytes of log data daily and are designed for scale. To make sense of all this data, we summarize it using analytics — the ability to see time series data, tops Ns, and slices and dices of the data generated by Cloudflare products. This allows customers to identify trends and anomalies and drill deep into problems.

We take it a step further from just showing you high-level metrics. With Cloudflare Analytics you have the ability to quickly drill down into the most important data — narrow in on a specific time period and add a chain of filters to slice your data further and see all the reflecting analytics.

Data at Cloudflare just got a lot faster: Announcing Live-updating Analytics and Instant Logs
Video of Cloudflare analytics showing live updating and drill down capabilities

Let’s say you’re a developer who’s made some recent changes to your website, you’ve deleted some old content and created new web pages. You want to know as soon as possible if these changes have led to any broken links, so you can quickly identify them and make fixes. With live-updating analytics, you can monitor your traffic by status code. If you notice an uptick in 404 errors add a filter to get details on all 404s and view the top referrers causing the errors. From there, take steps to resolve the problem whether by creating a redirect page rule or fixing broken links on your own site.

Instant Logs at your fingertips

While Analytics are a great way to see data at an aggregate level, sometimes you need event level information, too. Logs are powerful because they record every single event that flows through a network, so you can figure out what occurred on a granular level.

Our Logpush system is already able to get logs from our global edge network to a customer’s storage destination or analytics provider within seconds. However, setting this up has a lot of overhead and often customers incur long processing times at their destination. We wanted logs to be instant — instant to set up, deliver and take action on.

It’s that easy.

With Instant Logs, customers can actively monitor the traffic that’s flowing through their network and make key decisions that affect their applications now. Real time data unlocks totally new use cases:

  • For Security Engineers: Stop an attack as it’s developing. For example, apply a Firewall rule and see it’s impact — get answers within seconds. If it’s not what you were intending, try another rule and check again.
  • For Developers: Roll out a config change — to Cloudflare, or to your origin — and have piece of mind to watch as your error rates stay flat (we hope!).

(By the way, if you’re a fan of Workers and want to see real time Workers logging, check out the recently released dashboard for Workers logs.)

Logs at the speed of sight

“Real time” or “instant” can mean different things to different people in different contexts. At Cloudflare, we’re striving to make it as close to the speed of sight as possible. For us, this means we wanted the “glass-to-glass” time — from when you hit “enter” in your browser until when the logs appear — to be under one second.

How did we do?

Today, Cloudflare’s Instant Logs have an average delay of two seconds, and we’re continuing to make improvements to drive that down.

“Real-time” is a very fuzzy term. Looking at other services we see Akamai talking about real-time data as “within minutes” or “latency of 10 minutes”, Amazon talks about “near real-time” for CloudWatch, Google Cloud Logging provides log tailing with a configurable buffer “up to 60 seconds” to deal with potential out-of-order log delivery, and we benchmarked Fastly logs at 25 seconds.

Our goal is to drive down the delay as much as possible (within the laws of physics). We’re happy to have shipped Instant Logs that arrive in two seconds, but we’re not satisfied and will continue to bring that number down.

In time sensitive scenarios such as an attack or an outage, a few minutes or even 30 seconds of delay can have a big impact on customers. At Cloudflare, our goal is to get our customer’s data into their hands as fast as possible  — and we’re just getting started.

How to get access?

Live-updating Analytics is available now on all Pro, Business, and Enterprise plans. Select the “Last 30 minutes” view of your traffic in the Analytics tab to start monitoring your analytics live.

We’ll be starting our Beta for Instant Logs in a couple of weeks. Join the waitlist to get notified about when you can get access!

If you’re eager for details on the inner workings of Instant Logs, check out our blog post about how we built Instant Logs.

What’s next

We’re hard at work to make Instant Logs available for all Enterprise customers — stay tuned after joining our waitlist. We’re also planning to bring all of our datasets to Instant Logs, including Firewall Events. In addition, we’re working on the next set of features like the ability to download logs from your session and compute running aggregates from logs.

For a peek into what we have our sights on next, we know how important it is to perform analysis on not only up-to-date data, but also historical data. We want to give customers the ability to analyze logs, draw insights and perform forensics straight from the Cloudflare platform.

If this sounds cool, we’re hiring engineers for our data team in Lisbon, London and San Francisco — would love to have you help us build the future of data at Cloudflare.

Cloudflare Passes 250 Cities, Triples External Network Capacity, 8x-es Backbone

Post Syndicated from Jon Rolfe original https://blog.cloudflare.com/250-cities-is-just-the-start/

Cloudflare Passes 250 Cities, Triples External Network Capacity, 8x-es Backbone

Cloudflare Passes 250 Cities, Triples External Network Capacity, 8x-es Backbone

It feels like just the other week that we announced ten new cities and our expansion to 25+ cities in Brazil — probably because it was. Today, I have three speedy infrastructure updates: we’ve passed 250 on-network cities, more than tripled our external network capacity, and increased our long-haul internal backbone network by over 800% since the start of 2020.

Light only travels through fiber so fast and with so much bandwidth — and worse still over the copper or on mobile networks that make up most end-users’ connections to the Internet. At some point, there’s only so much software you can throw at the problem before you run into the fundamental problem that an edge network solves: if you want your users to see incredible performance, you have to have servers incredibly physically close. For example, over the past three months, we’ve added another 10 cities in Brazil.  Here’s how that lowered the connection time to Cloudflare. The red line shows the latency prior to the expansion, the blue shows after.

Cloudflare Passes 250 Cities, Triples External Network Capacity, 8x-es Backbone

We’re exceptionally proud of all the teams at Cloudflare that came together to raise the bar for the entire industry in terms of global performance despite border closures, semiconductor shortages, and a sudden shift to working from home. 95% of the entire Internet-connected world is now within 50 ms of a Cloudflare presence, and 80% of the entire Internet-connected world is within 20ms (for reference, it takes 300-400 ms for a human to blink):

Cloudflare Passes 250 Cities, Triples External Network Capacity, 8x-es Backbone

Today, when we ask ourselves what it means to have a fast website, it means having a server less than 0.05 seconds away from your user, no matter where on Earth they are. This is only possible by adding new cities, partners, capacity, and cables — so let’s talk about those.

New Cities

Cutting straight to the point, let’s start with cities and countries: in the last two-ish months, we’ve added another 17 cities (outside of mainland China) split across eight countries: Guayaquil, Ecuador; Dammam, Saudi Arabia; Algiers, Algeria; Surat Thani, Thailand; Hagåtña, Guam, United States; Krasnoyarsk, Russia; Cagayan, Philippines; and ten cities in Brazil: Caçador, Ribeirão Preto, Brasília, Florianópolis, Sorocaba, Itajaí, Belém, Americana, Blumenau, and Belo Horizonte.

Meanwhile, with our partner, JD Cloud and AI, we’re up to 37 cities in mainland China: Anqing and Huainan, Anhui; Beijing, Beijing; Fuzhou and Quanzhou, Fujian; Lanzhou, Gansu; Foshan, Guangzhou, and Maoming, Guangdong; Guiyang, Guizhou; Chengmai and Haikou, Hainan; Langfang and Qinhuangdao, Hebei; Zhengzhou, Henan; Shiyan and Yichang, Hubei; Changde and Yiyang, Hunan; Hohhot, Inner Mongolia; Changzhou, Suqian, and Wuxi, Jiangsu; Nanchang and Xinyu, Jiangxi; Dalian and Shenyang, Liaoning; Xining, Qinghai; Baoji and Xianyang, Shaanxi; Jinan and Qingdao, Shandong; Shanghai, Shanghai; Chengdu, Sichuan; Jinhua, Quzhou, and Taizhou, Zhejiang. These are subject to change: as we ramp up, we have been working with JD Cloud to “trial” cities for a few weeks or months to observe performance and tweak the cities to match.

More Capacity: What and Why?

In addition to all these new cities, we’re also proud to announce that we have seen a 3.5x increase in external network capacity from the start of 2020 to now. This is just as key to our network strategy as new cities: it wouldn’t matter if we were in every city on Earth if we weren’t interconnected with other networks. Last-mile ISPs will sometimes still “trombone” their traffic, but in general, end users will get faster Internet as we interconnect more.

Cloudflare Passes 250 Cities, Triples External Network Capacity, 8x-es Backbone

This interconnection is spread far and wide, both to user networks and those of website hosts and other major cloud networks. This has involved a lot of middleman-removal: rather than run fiber optics from our routers through a third-party network to an origin or user’s network, we’re running more and more Private Network Interconnects (PNIs) and, better yet, Cloudflare Network Interconnects (CNIs) to our customers.

These PNIs and CNIs can not only reduce egress costs for our customers (particularly with our Bandwidth Alliance partners) but also increase the speed, reliability, and privacy of connections. The fewer networks and less distance your Internet traffic flows through, the better off everyone is. To put some numbers on that, only 30% of this newly doubled capacity was transit, leaving 70% flowing directly either physically over PNIs/CNIs or logically over peering sessions at Internet exchange points.

The Backbone

Cloudflare Passes 250 Cities, Triples External Network Capacity, 8x-es Backbone

At the same time as this increase in external capacity, we’ve quietly been adding hundreds of new segments to our backbone. Our backbone consists of dedicated fiber optic lines and reserved portions of wavelength that connect Cloudflare data centers together. This is split approximately 55/45 between “metro” capacity, which redundantly connects data centers in which we have a presence, and “long-haul” capacity, which connects Cloudflare data centers in different cities.

The backbone is used to increase the speed of our customer traffic, e.g., for Argo Smart Routing, Argo Tiered Caching, and WARP+. Our backbone is like a private highway connecting cities, while public Internet routing is like local roads: not only does the backbone directly connect two cities, but it’s reliably faster and sees fewer issues. We’ll dive into some benchmarks of the speed improvements of the backbone in a more comprehensive future blog post.

The backbone is also more secure. While Cloudflare signs all of its BGP routes with RPKI, pushes adjacent networks to use RPKI to avoid route hijacks, and encrypts external and internal traffic, the most secure and private way to safeguard our users’ traffic is to keep it on-network as much as possible.

Internal load balancing between cities has also been greatly improved, thanks to the use of the backbone for traffic management with a technology we call Plurimog (a reference to our in-colo Layer 4 load balancer, Unimog). A surge of traffic into Portland can be shifted instantaneously over diverse links to Seattle, Denver, or San Jose with a single hop, without waiting for changes to propagate over anycast or running the risk of an interim increase in errors.

From an expansion perspective, two key areas of focus have been our undersea North America to Europe (transatlantic) and Asia to North America (transpacific) backbone rings. These links use geographically diverse subsea cable systems and connect into diverse routers and data centers on both ends — four transatlantic cables from North America to Europe, three transamerican cables connecting South and North America, and three transpacific cables connecting Asia and North America. User traffic coming from Los Angeles could travel to an origin as west as Singapore or as east as Moscow without leaving our network.

This rate of growth has been enabled by improved traffic forecast modeling, rapid internal feedback loops on link utilization, and more broadly by growing our teams and partnerships. We are creating a global view of capacity, pricing, and desirability of backbone links in the same way that we have for transit and peering. The result is a backbone that doubled in long-haul capacity this year, increased more than 800% from the start of last year, and will continue to expand to intelligently crisscross the globe.

The backbone has taken on a huge amount of traffic that would otherwise go over external transit and peering connections, freeing up capacity for when it is explicitly needed (last-hop routes, failover, etc.) and avoiding any outages on other major global networks (e.g., CenturyLink, Verizon).

In Conclusion

Cloudflare Passes 250 Cities, Triples External Network Capacity, 8x-es Backbone
A map of the world highlighting all 250+ cities in which Cloudflare is deployed.

More cities, capacity, and backbone are more steps as part of going from being the most global network on Earth to the most local one as well. We believe in providing security, privacy, and reliability for all — not just those who have the money to pay for something we consider fundamental Internet rights. We have seen the investment into our network pay huge dividends this past year.

Happy Speed Week!

Do you want to work on the future of a globally local network? Are you passionate about edge networks? Do you thrive in an exciting, rapid-growth environment? If so, good news: Cloudflare Infrastructure is hiring; check our open roles here!

Alternatively — if you work at an ISP we aren’t already deployed with and want to bring this level of speed and control to your users, we’re here to make that happen. Please reach out to our Edge Partnerships team at [email protected].

Cloudflare Workers: the Fast Serverless Platform

Post Syndicated from Rita Kozlov original https://blog.cloudflare.com/cloudflare-workers-the-fast-serverless-platform/

Cloudflare Workers: the Fast Serverless Platform

Cloudflare Workers: the Fast Serverless Platform

Just about four years ago, we announced Cloudflare Workers, a serverless platform that runs directly on the edge.

Throughout this week, we will talk about the many ways Cloudflare is helping make applications that already exist on the web faster. But if today is the day you decide to make your idea come to life, building your project on the Cloudflare edge, and deploying it directly to the tubes of the Internet is the best way to guarantee your application will always be fast, for every user, regardless of their location.

It’s been a few years since we talked about how Cloudflare Workers compares to other serverless platforms when it comes to performance, so we decided it was time for an update. While most of our work on the Workers platform over the past few years has gone into making the platform more powerful: introducing new features, APIs, storage, debugging and observability tools, performance has not been neglected.

Today, Workers is 30% faster than it was three years ago at P90. And it is 210% faster than Lambda@Edge, and 298% faster than Lambda.

Oh, and also, we eliminated cold starts.

How do you measure the performance of serverless platforms?

I’ve run hundreds of performance benchmarks between CDNs in the past — the formula is simple: we use a tool called Catchpoint, which makes requests from nodes all over the world to the same asset, and reports back on the time it took for each location to return a response.

Measuring serverless performance is a bit different — since the thing you’re comparing is the performance of compute, rather than a static asset, we wanted to make sure all functions performed the same operation.

In our 2018 blog on speed testing, we had each function simply return the current time. For the purposes of this test, “serverless” products that were not able to meet the minimum criteria of being able to perform this task were disqualified. Serverless products used in this round of testing executed the same function, of identical computational complexity, to ensure accurate and fair results.

It’s also important to note what it is that we’re measuring. The reason performance matters, is because it impacts the experience of actual end customers. It doesn’t matter what the source of latency is: DNS, network congestion, cold starts… the customer doesn’t care what the source is, they care about wasting time waiting for their application to load.

It is therefore important to measure performance in terms of the end user experience — end to end, which is why we use global benchmarks to measure performance.

The result below shows tests run from 50 nodes all over the world, across North America, South America, Europe, Asia and Oceania.

Blue: Cloudflare Workers
Red: Lambda@Edge
Green: Lambda

(Link to results).

Cloudflare Workers: the Fast Serverless Platform

As you can see from the results, no matter where users are in the world, when it comes to speed, Workers can guarantee the best experience for customers.

In the case of Workers, getting the best performance globally requires no additional effort on the developers’ part. Developers do not need to do any additional load balancing, or configuration of regions. Every deployment is instantly live on Cloudflare’s extensive edge network.

Even if you’re not seeking to address a global audience, and your customer base is conveniently located on the East coast of the United States, Workers is able to guarantee the fastest response on all requests.

Cloudflare Workers: the Fast Serverless Platform

Above, we have the results just from Washington, DC, as close as we could get to us-east-1. And again, without any optimization, Workers is 34% faster.

Why is that?

What defines the performance of a serverless platform?

Other than the performance of the code itself, from the perspective of the end user, serverless application performance is fundamentally a function of two variables: distance an application executes from the user, and the time it takes the runtime itself to spin up. The realization that distance from the user is becoming a greater and greater bottleneck on application performance is causing many serverless vendors to push deeper and deeper into the edge. Running applications on the edge — closer to the end user — increases performance. As 5G comes online, this trend will only continue to accelerate.

However, many cloud vendors in the serverless space run into a critical problem when addressing the issue when competing for faster performance. And that is: the legacy architecture they’re using to build out their offerings doesn’t work well with the inherent limitations of the edge.

Since the goal behind the serverless model is to intentionally abstract away the underlying architecture, not everyone is clear on how legacy cloud providers like AWS have created serverless offerings like Lambda. Legacy cloud providers deliver serverless offerings by spinning up a containerized process for your code. The provider auto-scales all the different processes in the background. Every time a container is spun up, the entire language runtime is spun up with it, not just your code.

To help address the first graph, measuring global performance, vendors are attempting to move away from their large, centralized architecture (a few, big data centers) to a distributed, edge-based world (a greater number of smaller data centers all over the world) to close the distance between applications and end users. But there’s a problem with their approach: smaller data centers mean fewer machines, and less memory. Each time vendors pursue a small but many data centers strategy to operate closer to the edge, the likelihood of a cold start occurring on any individual process goes up.

This effectively creates a performance ceiling for serverless applications on container-based architectures. If legacy vendors with small data centers move your application closer to the edge (and the users), there will be fewer servers, less memory, and more likely that an application will need a cold start. To reduce the likelihood of that, they’re back to a more centralized model; but that means running your applications from one of a few big centralized data centers. These larger centralized data centers, by definition, are almost always going to be further away from your users.

You can see this at play in the graph above by looking at the results of the tests when running in Lambda@Edge — despite the reduced proximity to the end user, p90 performance is slower than that of Lambda’s, as containers have to spin up more frequently.

Serverless architectures built on containers can move up and down the frontier, but ultimately, there’s not much they can do to shift that frontier curve.

What makes Workers so fast?

Workers was designed from the ground up for an edge-first serverless model. Since Cloudflare started with a distributed edge network, rather than trying to push compute from large centralized data centers out into the edge, working under those constraints forced us to innovate.

In one of our previous blog posts, we’ve discussed how this innovation translated to a new paradigm shift with Workers’ architecture being built on lightweight V8 isolates that can spin up quickly, without introducing a cold start on every request.

Not only has running isolates given us advantage out of the box, but as V8 gets better, so does our platform. For example, when V8 announced Liftoff, a compiler for WASM, all WASM Workers instantly got faster.

Similarly, whenever improvements are made to Cloudflare’s network (for example, when we add new data centers) or stack (e.g., supporting new, faster protocols like HTTP/3), Workers instantly benefits from it.

Additionally, we’re always seeking to make improvements to Workers itself to make the platform even faster. For example, last year, we released an improvement that helped eliminate cold starts for our customers.

One key advantage that helps Workers identify and address performance gaps is the scale at which it operates. Today, Workers services hundreds of thousands of developers, ranging from hobbyists to enterprises all over the world, serving millions of requests per second. Whenever we make improvements for a single customer, the entire platform gets faster.

Performance that matters

The ultimate goal of the serverless model is to enable developers to focus on what they do best — build experiences for their users. Choosing a serverless platform that can offer the best performance out of the box means one less thing developers have to worry about. If you’re spending your time optimizing for cold starts, you’re not spending your time building the best feature for your customers.

Just like developers want to create the best experience for their users by improving the performance of their application, we’re constantly striving to improve the experience for developers building on Workers as well.

In the same way customers don’t want to wait for slow responses, developers don’t want to wait on slow deployment cycles.

This is where the Workers platform excels yet again.

Any deployment on Cloudflare Workers takes less than a second to propagate globally, so you don’t want to spend time waiting on your code deploy, and users can see changes as quickly as possible.

Of course, it’s not just the deployment time itself that’s important, but the efficiency of the full development cycle, which is why we’re always seeking to improve it at every step: from sign up to debugging.

Don’t just take our word for it!

Needless to say, much as we try to remain neutral, we’re always going to be just a little biased. Luckily, you don’t have to take our word for it.

We invite you to sign up and deploy your first Worker today — it’ll just take a few minutes!