Post Syndicated from Sébastien Stormacq original https://aws.amazon.com/blogs/aws/week-in-review-terraform-in-service-catalog-aws-supply-chain-streaming-response-in-lambda-and-amplify-library-for-swift-april-10-2023/
The AWS Summit season has started. AWS Summits are free technical and business conferences happening in large cities across the planet. This week, we were happy to welcome our customers and partners in Sydney and Paris. In France, 9,973 customers and partners joined us for the day to meet and exchange ideas but also to attend one of the more than 145 technical breakout sessions and the keynote. This is the largest cloud computing event in France, and I can’t resist sharing a picture from the main room during the opening keynote.

There are AWS Summits on all continents ; you can find the list and the links for registration here https://aws.amazon.com/events/summits. The next on my agenda are listed at the end of this post.
These two Summits did not slow down our services teams. I counted 44 new capabilities since last Monday. Here are the few that caught my attention.
Last Week on AWS
AWS Lambda response streaming – Response streaming is a new invocation pattern that lets functions progressively stream response payloads back to clients. You can use Lambda response payload streaming to send response data to callers as it becomes available. Response streaming also allows you to build functions that return larger payloads and perform long-running operations while reporting incremental progress (within the 15 minutes execution period). My colleague Julian wrote an incredibly detailed blog post to help you to get started.
AWS Supply Chain Now Generally Available – AWS Supply Chain is a cloud application that mitigates risk and lowers costs with unified data and built-in contextual collaboration. It connects to your existing enterprise resource planning (ERP) and supply chain management systems to bring you ML-powered actionable insights into your supply chain.
AWS Service Catalog Supports Terraform Templates – With AWS Service Catalog, you can create, govern, and manage a catalog of infrastructure as code (IaC) templates that are approved for use on AWS. You can now define AWS Service Catalog products and their resources using either AWS CloudFormation or Hashicorp Terraform and choose the tool that better aligns with your processes and expertise.
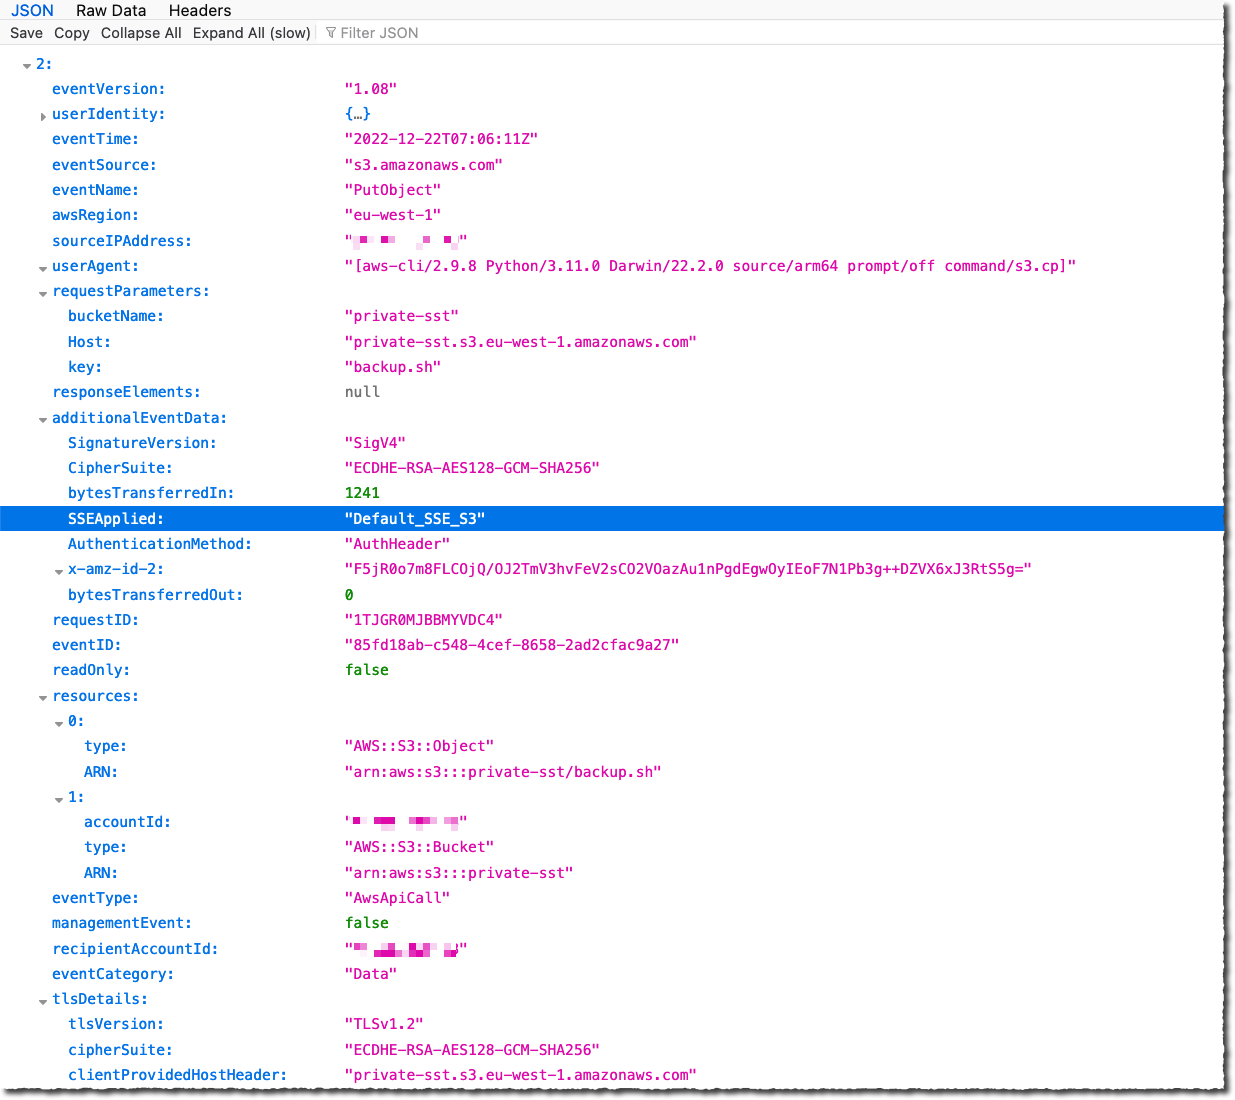
Amazon S3 enforces two security best practices and brings new visibility into object replication status – As announced on December 13, 2022, Amazon S3 is now deploying two new default bucket security settings by automatically enabling S3 Block Public Access and disabling S3 access control lists (ACLs) for all new S3 buckets. Amazon S3 also adds a new Amazon CloudWatch metric that can be used to diagnose and correct S3 Replication configuration issues more quickly. The OperationFailedReplication metric, available in both the Amazon S3 console and in Amazon CloudWatch, gives you per-minute visibility into the number of objects that did not replicate to the destination bucket for each of your replication rules.
AWS Security Hub launches four security best practices – AWS Security Hub has released 4 new controls for its National Institute of Standards and Technology (NIST) SP 800-53 Rev. 5 standard. These controls conduct fully-automatic security checks against Elastic Load Balancing (ELB), Amazon Elastic Kubernetes Service (Amazon EKS), Amazon Redshift, and Amazon Simple Storage Service (Amazon S3). To use these controls, you should first turn on the NIST standard.
AWS Cloud Operation Competency Partners – AWS Cloud Operations covers five fundamental solution areas: Cloud Governance, Cloud Financial Management, Monitoring and Observability, Compliance and Auditing, and Operations Management. The new competency enables customers to select validated AWS Partners who offer comprehensive solutions with an integrated approach across multiple areas.
Amplify Library for Swift on macOS – Amplify is an open-source, client-side library making it easier to access a cloud backend from your front-end application code. It provides language-specific constructs to abstract low-level details of the cloud API. It helps you to integrate services such as analytics, object storage, REST or GraphQL APIs, user authentication, geolocation and mapping, and push notifications. You can now write beautiful macOS applications that connect to the same cloud backend as their iOS counterparts.
X in Y Jeff started this section a while ago to list the expansion of new services and capabilities to additional Regions. I noticed 11 Regional expansions this week:
- New Direct Connect location in Mumbai, India.
- AWS Codebuild is available in three additional Regions: Asia Pacific (Hyderabad) and Europe (Spain, Zurich)
- AWS CodePipeline is available in three additional Regions: Africa (Cape Town), Europe (Zurich), and Middle East (Bahrain)
- Amplify Studio is available in Europe (Milan)
- Amazon HealthLake is available in Asia Pacific (Mumbai)
- Amazon Polly offers full support in Asia Pacific (Osaka)
- Amazon CloudFormation StackSets is available in Asia Pacific (Hyderabad) and Middle East (UAE)
- Amazon Kinesis Data Analytics is available in three additional Regions: Asia Pacific (Hyderabad) and Europe (Spain, Zurich)
- Amazon SageMaker is available in Asia Pacific (Hyderabad)
- Amazon Glue is available in Europe (Spain, Zurich)
- Amazon Appstream 2.0 is available in AWS GovCloud (US-East)
Upcoming AWS Events
And to finish this post, I recommend you check your calendars and sign up for these AWS-led events:
 .Net Developer Day – .NET Enterprise Developer Day EMEA 2023 (April 25) is a free, one-day virtual conference providing enterprise developers with the most relevant information to swiftly and efficiently migrate and modernize their .NET applications and workloads on AWS.
![]() AWS re:Inforce 2023 – Now register AWS re:Inforce, in Anaheim, California, June 13–14. AWS Chief Information Security Officer CJ Moses will share the latest innovations in cloud security and what AWS Security is focused on. The breakout sessions will provide real-world examples of how security is embedded into the way businesses operate. To learn more and get the limited discount code to register, see CJ’s blog post of Gain insights and knowledge at AWS re:Inforce 2023 in the AWS Security Blog.
AWS re:Inforce 2023 – Now register AWS re:Inforce, in Anaheim, California, June 13–14. AWS Chief Information Security Officer CJ Moses will share the latest innovations in cloud security and what AWS Security is focused on. The breakout sessions will provide real-world examples of how security is embedded into the way businesses operate. To learn more and get the limited discount code to register, see CJ’s blog post of Gain insights and knowledge at AWS re:Inforce 2023 in the AWS Security Blog.
 AWS Global Summits – Check your calendars and sign up for the AWS Summit close to where you live or work: Seoul (May 3–4), Berlin and Singapore (May 4), Stockholm (May 11), Hong Kong (May 23), Amsterdam (June 1), London (June 7), Madrid (June 15), and Milano (June 22).
![]() AWS Community Day – Join community-led conferences driven by AWS user group leaders close to your city: Lima (April 15), Helsinki (April 20), Chicago (June 15), Manila (June 29–30), and Munich (September 14). Recently, we have been bringing together AWS user groups from around the world into Meetup Pro accounts. Find your group and its meetups in your city!
AWS Community Day – Join community-led conferences driven by AWS user group leaders close to your city: Lima (April 15), Helsinki (April 20), Chicago (June 15), Manila (June 29–30), and Munich (September 14). Recently, we have been bringing together AWS user groups from around the world into Meetup Pro accounts. Find your group and its meetups in your city!
You can browse all upcoming AWS-led in-person and virtual events, and developer-focused events such as AWS DevDay.
Stay Informed
That was my selection for this week! To better keep up with all of this news, don’t forget to check out the following resources:
- What’s New with AWS – All AWS announcements. You might want to add the RSS feed to your news reader.
- The Official AWS Podcast – Listen each week for updates on the latest AWS news and deep dives into exciting use cases. There are also official AWS podcasts in your local languages. Check out the ones in French, German, Italian, and Spanish.
- AWS News Blog – This blog.
- And subscribe to the open-source newsletter brought to you by my most excellent colleague Ricardo.
That’s all for this week. Check back next Monday for another Week in Review!
 This online and mobile usage drives very specific traffic patterns on IT systems: a huge peak of connections and authentications in the few minutes before the start of a game and millions of video streams that must be delivered reliably over a variety of changing network qualities. In addition to these technical challenges, there is also an economic challenge: to deliver advertisements at key moments, such as before a national anthem or during a 15-minute half-time. The digital platform sells its own set of commercials, which are different from the commercials broadcast over the air, and might also be different from region to region. All these video streams have to be delivered to millions of viewers on a wide range of devices and a variety of network conditions: from 1 Gbs fiber at home down to 3 G networks in remote areas.
 By the time France took to the pitch on Dec. 18, 2022, TF1 knew they would break records on the platform. Thierry said the traffic was higher than estimated, but the platform absorbed it. He also described that during the first part of the game, when Argentina was leading, the TF1 team observed a slow decline of connections… that is, until


 .
.