Top announcements of AWS re:Invent 2023

Post Syndicated from AWS Editorial Team original https://aws.amazon.com/blogs/aws/top-announcements-of-aws-reinvent-2023/

Welcome to Las Vegas, where excitement fills the air for the premier AWS event of the year – re:Invent 2023! Happening Nov. 27 – Dec. 1, re:Invent 2023 offers keynotes, training, Innovation Talks, AWS Builder Labs, and much more to inspire you on your cloud journey.

Can’t make it in person? Tune in to the live streams of the keynotes, and check back here as we provide daily updates on the most exciting product launches.

If you don’t want to miss a thing, here are a few more ways to keep in touch:

(This post was last updated: 5:05 p.m. PST, Nov. 26, 2023.)


Use natural language to query Amazon CloudWatch logs and metrics (preview)
To make it easy to interact with your operational data, Amazon CloudWatch is introducing natural language query generation for Logs and Metrics Insights.

Increase collaboration and securely share cloud knowledge with AWS re:Post Private
re:Post Private includes content tailored specifically for your organization’s use cases, along with private discussion and collaboration forums for the members of your organization and your AWS account team.

Use anomaly detection with AWS Glue to improve data quality (preview)
This new feature will help to improve your data quality by using machine learning to detect statistical anomalies and unusual patterns.

Mutual authentication for Application Load Balancer reliably verifies certificate-based client identities
With this new feature, you can now offload client authentication to Application Load Balancer, ensuring only trusted clients communicate with backend applications.

Check your AWS Free Tier usage programmatically with a new API
You can use the API directly with the AWS Command Line Interface or integrate it into an application with the AWS SDKs.

Use Amazon CloudWatch to consolidate hybrid, multicloud, and on-premises metrics
You can now consolidate metrics from your hybrid, multicloud, and on-premises data sources using Amazon CloudWatch and process them in a consistent, unified fashion.

Announcing cross-region data replication for Amazon WorkSpaces
Snapshots are taken every 12 hours, replicated to the desired destination region, and are used to provide a recovery point objective of 12-24 hours.

Amazon Transcribe Call Analytics adds new generative AI-powered call summaries (preview)
Powered by Amazon Bedrock, this feature helps businesses improve customer experience, and agent and supervisor productivity by automatically summarizing customer service calls.

Build generative AI apps using AWS Step Functions and Amazon Bedrock
Step Functions provides two new optimized API actions for Amazon Bedrock: InvokeModel and CreateModelCustomizationJob.

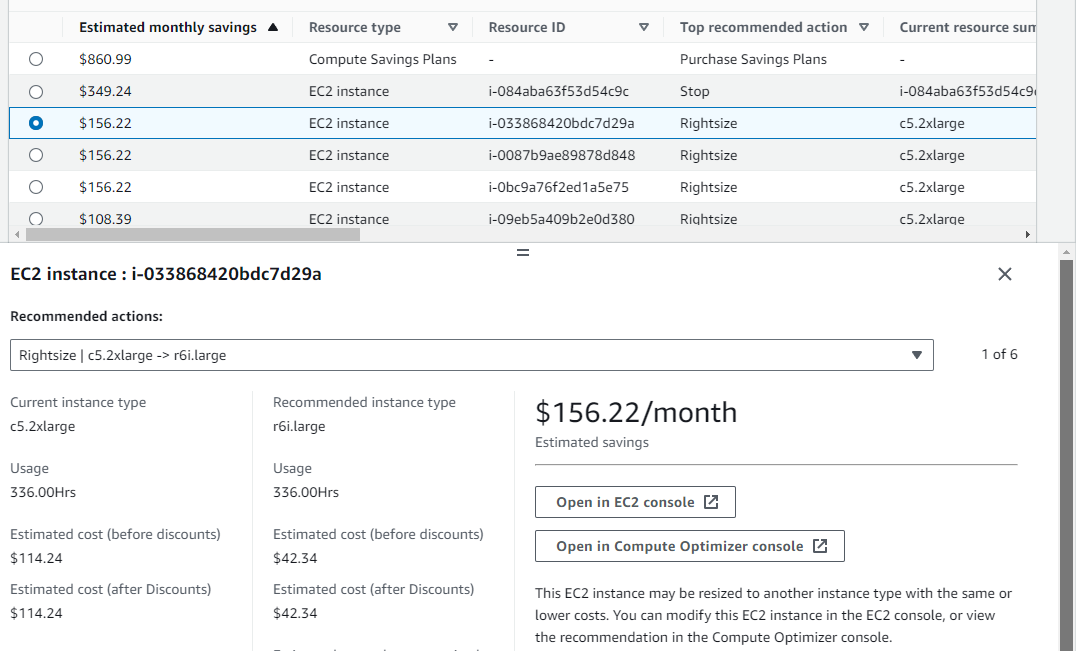
New Cost Optimization Hub centralizes recommended actions to save you money
This new AWS Billing and Cost Management feature makes it easy for you to identify, filter, aggregate, and quantify savings for AWS cost optimization recommendations.

Amazon CloudWatch Logs now offers automated pattern analytics and anomaly detection
Amazon CloudWatch can now automatically recognize and cluster patterns among log records, extract noteworthy content and trends, and notify you of anomalies using advanced machine learning algorithms.

Amazon Managed Service for Prometheus collector provides agentless metric collection for Amazon EKS
This new capability discovers and collects Prometheus metrics from Amazon Elastic Kubernetes Service (Amazon EKS) automatically and without an agent.

Optimize your storage costs for rarely-accessed files with Amazon EFS Archive
We’ve added a new storage class for Amazon Elastic File System optimized for long-lived data that is rarely accessed.

New Amazon CloudWatch log class for infrequent access logs at a reduced price
This new log class offers a tailored set of capabilities at a lower cost for infrequently accessed logs, enabling customers to consolidate all their logs in one place in a cost-effective manner.

Авариите покрай обилния сняг

Post Syndicated from Боян Юруков original https://yurukov.net/blog/2023/snow-incidents/

Доста снимки в мрежата видяхме за паднали дървета в София. Още повече съобщения за спиране на тока в последните два дни. Видяхме и репортажи в медиите и за двете и дискусии какво се прави и какво следва да се прави по въпроса. За да илюстрирам както мащаба на проблема, така и колко е полезно да гледаме на тези неща с данни, извадих две справки от последните 48 час.

Паднало дърво в София снощи.

Първата справка е директно от базата ми с данни от сигнали до столична община – CallSofia. Писах за това колко непрегледен е сайтът им и как трудно се намират стари сигнали. Затова направих удобен инструмент, с който да се преглеждат. В тези данни извадих справка за всички сигнали за проблеми със зелена система подадени на 25 и 26 ноември. Практически всички без няколко бяха за паднали дървета и клони. За улеснение ги поставих на тази карта. Общо бяха 1130.

Разбира се, това далеч не са всички такива случаи, а само онези, за които е подаден сигнал. Такива обикновено са онези блокиращи пътното платно. Дори като се обезопасят дърветата, най-често се оставят на тротоара – също както снегът, който се избутва от пътя, където явно пречи най-много. Ще забележите също, че почти липсват сигнали за парковете, където несъмнено ще има доста повече. Въобще пешеходните зони са винаги второстепенни и по-скоро място за складиране.

Втората справка е на база данни, които така и не ми е останало време да визуализирам по правилен начин. Преди време започнах да тегля всички аварии на ток, вода и парно в София. За тока всъщност събирам данни за целият регион на ЕРМ Запад. Получих въпроси защо не събирам и данните за другите части на България. Причината е, че просто не ги публикуват в достатъчно ясен и подробен формат, за да позволи следене и картографиране на инцидентите. Поне не без значителни усилия.

В последните два дни сайтът особено на ЕРМ падаше доста често. Затова имам доста дупки в данните. Предвид обаче колко чести и продължителни бяха авариите, може да се каже, че съм получил данни за всички. Става въпрос за 5549 трафопоста, които са имали авария поне веднъж поне за 30 мин.

2.4% са между половин и един час. 20% са между 1 и 6 часа. 25% са между 6 и 24 часа, а над половината са повече от ден. Средно спиранията на тока са имали прогнозна продължителност от 22 часа и 35 мин. Тук ще видите конкретно София:

Тук може да отворите двете карти на нова страница – тази за сигналите за дърветата и тази за спиранията на тока.

The post Авариите покрай обилния сняг first appeared on Блогът на Юруков.

Use natural language to query Amazon CloudWatch logs and metrics (preview)

Post Syndicated from Danilo Poccia original https://aws.amazon.com/blogs/aws/use-natural-language-to-query-amazon-cloudwatch-logs-and-metrics-preview/

To make it easy to interact with your operational data, Amazon CloudWatch is introducing today natural language query generation for Logs and Metrics Insights. With this capability, powered by generative artificial intelligence (AI), you can describe in English the insights you are looking for, and a Logs or Metrics Insights query will be automatically generated.

This feature provides three main capabilities for CloudWatch Logs and Metrics Insights:

  • Generate new queries from a description or a question to help you get started easily.
  • Query explanation to help you learn the language including more advanced features.
  • Refine existing queries using guided iterations.

Let’s see how these work in practice with a few examples. I’ll cover logs first and then metrics.

Generate CloudWatch Logs Insights queries with natural language
In the CloudWatch console, I select Log Insights in the Logs section. I then select the log group of an AWS Lambda function that I want to investigate.

I choose the Query generator button to open a new Prompt field where I enter what I need using natural language:

Tell me the duration of the 10 slowest invocations

Then, I choose Generate new query. The following Log Insights query is automatically generated:

fields @timestamp, @requestId, @message, @logStream, @duration 
| filter @type = "REPORT" and @duration > 1000
| sort @duration desc
| limit 10

Console screenshot.

I choose Run query to see the results.

Console screenshot.

I find that now there’s too much information in the output. I prefer to see only the data I need, so I enter the following sentence in the Prompt and choose Update query.

Show only timestamps and latency

The query is updated based on my input and only the timestamp and duration are returned:

fields @timestamp, @duration 
| filter @type = "REPORT" and @duration > 1000
| sort @duration desc
| limit 10

I run the updated query and get a result that is easier for me to read.

Console screenshot.

Now, I want to know if there are any errors in the log. I enter this sentence in the Prompt and generate a new query:

Count the number of ERROR messages

As requested, the generated query is counting the messages that contain the ERROR string:

fields @message
| filter @message like /ERROR/
| stats count()

I run the query and find out that there are more errors than I expected. I need more information.

Console screenshot.

I use this prompt to update the query and get a better distribution of the errors:

Show the errors per hour

The updated query uses the bin() function to group the result in one hour intervals.

fields @timestamp, @message
| filter @message like /ERROR/
| stats count(*) by bin(1h)

Let’s see a more advanced query about memory usage. I select the log groups of a few Lambda functions and type:

Show invocations with the most over-provisioned memory grouped by log stream

Before generating the query, I choose the gear icon to toggle the options to include my prompt and an explanation as comment. Here’s the result (I split the explanation over multiple lines for readability):

# Show invocations with the most over-provisioned memory grouped by log stream

fields @logStream, @memorySize/1000/1000 as memoryMB, @maxMemoryUsed/1000/1000 as maxMemoryUsedMB, (@memorySize/1000/1000 - @maxMemoryUsed/1000/1000) as overProvisionedMB 
| stats max(overProvisionedMB) as maxOverProvisionedMB by @logStream 
| sort maxOverProvisionedMB desc

# This query finds the amount of over-provisioned memory for each log stream by
# calculating the difference between the provisioned and maximum memory used.
# It then groups the results by log stream and calculates the maximum
# over-provisioned memory for each log stream. Finally, it sorts the results
# in descending order by the maximum over-provisioned memory to show
# the log streams with the most over-provisioned memory.

Now, I have the information I need to understand these errors. On the other side, I also have EC2 workloads. How are those instances running? Let’s look at some metrics.

Generate CloudWatch Metrics Insights queries with natural language
In the CloudWatch console, I select All metrics in the Metrics section. Then, in the Query tab, I use the Editor. If you prefer, the Query generator is available also in the Builder.

I choose Query generator like before. Then, I enter what I need using plain English:

Which 10 EC2 instances have the highest CPU utilization?

I choose Generate new query and get a result using the Metrics Insights syntax.

SELECT AVG("CPUUtilization")
FROM SCHEMA("AWS/EC2", InstanceId)
GROUP BY InstanceId
ORDER BY AVG() DESC
LIMIT 10

To see the graph, I choose Run.

Console screenshot.

Well, it looks like my EC2 instances are not doing much. This result shows how those instances are using the CPU, but what about storage? I enter this in the prompt and choose Update query:

How about the most EBS writes?

The updated query replaces the average CPU utilization with the sum of bytes written to all EBS volumes attached to the instance. It keeps the limit to only show the top 10 results.

SELECT SUM("EBSWriteBytes")
FROM SCHEMA("AWS/EC2", InstanceId)
GROUP BY InstanceId
ORDER BY SUM() DESC
LIMIT 10

I run the query and, by looking at the result, I have a better understanding of how storage is being used by my EC2 instances.

Try entering some requests and run the generated queries over your logs and metrics to see how this works with your data.

Things to know
Amazon CloudWatch natural language query generation for logs and metrics is available in preview in the US East (N. Virginia) and US West (Oregon) AWS Regions.

There is no additional cost for using natural language query generation during the preview. You only pay for the cost of running the queries according to CloudWatch pricing.

Generated queries are produced by generative AI and dependent on factors including the data selected and available in your account. For these reasons, your results may vary.

When generating a query, you can include your original request and an explanation of the query as comments. To do so, choose the gear icon in the bottom right corner of the query edit window and toggle those options.

This new capability can help you generate and update queries for logs and metrics, saving you time and effort. This approach allows engineering teams to scale their operations without worrying about specific data knowledge or query expertise.

Use natural language to analyze your logs and metrics with Amazon CloudWatch.

— Danilo

Automate safe AWS CloudFormation deployments from GitHub

Post Syndicated from Dan Blanco original https://aws.amazon.com/blogs/devops/automate-safe-aws-cloudformation-deployments-from-github/

AWS CloudFormation, an Infrastructure as Code (IaC) service that lets you model, provision, and manage AWS and third-party resources, now supports using Git sync to automatically trigger a deployment whenever a tracked Git repository is updated. This enables developers to significantly speed up the development cycle for CloudFormation by integrating into their Git workflow and reducing time lost to context switching. The new integration works directly with GitHub, GitHub Enterprise, GitLab, and Bitbucket.

In this post, you’ll explore what a modern development experience looks like using both GitHub’s native tooling as well as the native CloudFormation Git sync integration. You’ll be creating a cloud development environment using GitHub CodeSpaces, integrating direct feedback into Pull Requests using GitHub Actions and the CloudFormation Linter, and automating safe deployments.

Requirements

Creating an empty repository

For this, you’ll start with a new GitHub repository. GitHub allows you to create new Git repositories for free. For this example, you’ll create a repository called git-sync.

Creating a repository called Git sync

Setting up a Codespace

Once you create the repository, you’ll have the option to create a Codespace. Codespaces are remote development environments managed by GitHub that allows you to develop from anywhere on standardized virtual machines.

Creating a new code space on the Git sync repository

Codespaces uses Visual Studio Code as its code editor of choice. Visual Studio Code is an open-source code editor that has excellent flexibility and extensibility due to the ability to install extensions.

Codespace using Visual Studio Code as code editor

Once it finishes creating, you can set up the environment much like you would your local development environment. You’re going to be adding the CloudFormation Linter extension to provide fast in-editor feedback when developing your template. This lets you avoid having to send CloudFormation your templates for validation and instead have good confidence that your templates are valid before you submit them for provisioning. You’ll install it both using the command line and an extension to Visual Studio Code itself. In the terminal, run:

pip3 install cfn-lint

Once that installs, you can install the linter in the extensions panel:

Installing the CloudFormation Linter Visual Studio Code Extension

Next, you’ll create your template in the base directory called vpc.yaml. As you start typing, the linter extension will offer recommendations and auto-complete for you.

Linter recommending autocompletion for AWS::EC2::VPC

Copy the following template into our newly created vpc.yaml file:

AWSTemplateFormatVersion: "2010-09-09"
Resources:
  VPC:
    Type: AWS::EC2::VPC
    Properties:
      CidrBlock: 10.0.0.0/16

This template creates a VPC with a CIDR block of 10.0.0.0/16.

You can verify the template gives no errors by running cfn-lint in the terminal and verifying it returns no errors.

cfn-lint -t vpc.yaml

Adding the deployment file

In order to support many different types of deployments, Git sync supports a deployment file to provide flexibility for managing CloudFormation stacks from within a Git repository. This config file manages the location of the template file, and any parameters or tags you may be interested in using. I strongly encourage you to use a config file for managing your parameters and tags, as it enables easy auditability and deterministic deployments.

You’ll be creating a new file called deployment-file.yaml in your repository. Since this stack doesn’t have parameters or tags, it’ll be relatively simple:

template-file-path: ./vpc.yaml

You also have the ability to add this file in the console later.

Adding Pull Request actions

Now that you’ve configured your development environment just the way you want it, you want to ensure that anyone who submits a pull-request will receive the same high-quality feedback that you’re getting locally. You can do this using GitHub Actions. Actions are a customizable workflow tool that you can leverage to enable pull-request feedback and CI builds.

To do that, you’ll have to create the following folder structure: .github/workflows/pull-request.yaml. The contents of this file are as follows:

name: Pull Request workflow

on:
  - pull_request

jobs:
  cloudformation-linter:
    runs-on: ubuntu-latest

    steps:
      - name: Checkout
        uses: actions/checkout@3
      - name: Linter install
        uses: scottbrenner/cfn-lint-action@v2
        with:
          command: cfn-lint -t ./vpc.yaml

With this configured, you’ll now get feedback on a pull request with the linter’s findings. Push your work to the remote branch.

git add -A
git commit -m "add pull request linting workflow, add base vpc template"
git push origin main

Now you’ll add a subnet to your VPC and intentionally make a mistake by adding an invalid property called VpcName, instead of VpcId.

AWSTemplateFormatVersion: "2010-09-09"
Resources:
  VPC:
    Type: AWS::EC2::VPC
    Properties:
      CidrBlock: 10.0.0.0/16

  Subnet:
    Type: AWS::EC2::Subnet
    Properties:
      VpcName: !Ref VPC
      CidrBlock: 10.0.0.1/16

The linter will immediately inform you this is invalid:

CloudFormation Linter GitHub Action indicating errors and line numbers

You can ignore these for now. To create your pull request, you have to create a new branch and commit your local changes. You can do that using:

git switch -c add-subnet
git add -A
git commit -m "add subnet"
git push origin add-subnet

Once you push these commits, GitHub will allow you to create a pull request against your main branch. However, once you create it, you’ll notice that your checks fail when your GitHub Actions finish running.

Stack Deployments File section with "I am providing my own file in my repository" selected

You can see what went wrong by checking the “Files changed” tab. Your linter action will provide feedback directly on the pull request and block your merge action if you’ve set up your branch protection. This repository requires at least one reviewer and all checks to pass, so you’ll have to resolve both these failures.

CloudFormation Linter GitHub Action indicating errors and line numbers

Now that you have the high-quality feedback as well as the offending line numbers, you can go back to your template and make the necessary fix of changing VpcName to VpcId.

AWSTemplateFormatVersion: "2010-09-09"
Resources:
  VPC:
    Type: AWS::EC2::VPC
    Properties:
      CidrBlock: 10.0.0.0/16

  Subnet:
    Type: AWS::EC2::Subnet
    Properties:
      VpcId: !Ref VPC
      CidrBlock: 10.0.0.1/16

The local linter is happy, and after you commit again you’ll see that your remote linter is equally happy. After getting another approver, you can merge your commit into your main branch.

Approval from reviewer and passing checks enabling a merge

Enabling Git sync

You now have a high-quality cloud development environment and your pull request process ensures your templates are linted before merging. You can be sure that a CloudFormation template that makes it to the main branch is ready to be deployed. Next, you’ll be leveraging the newly released Git sync feature of CloudFormation to automatically sync your deployed stack with this new template.

First, create the role that will deploy our CloudFormation template. Be sure to note the name you select for this as you’ll be using it to manage your stack later. This example uses vpc-example-cloudformation-deployment-role.

{
  "Version": "2012-10-17",
  "Statement": [
    {
      "Effect": "Allow",
      "Action": [
        "ec2:CreateVpc",
        "ec2:CreateSubnet",
        "ec2:DescribeVpcs",
        "ec2:DeleteVpc",
        "ec2:DeleteSubnet",
        "ec2:ModifySubnetAttribute",
        "ec2:ModifyVpcAttribute"
      ],
      "Resource": "*",
      "Condition": {
        "ForAnyValue:StringEquals": {
          "aws:CalledVia": ["cloudformation.amazonaws.com"]
        }
      }
    }
  ]
}

Once the role has been created, you’ll have to create a new stack:

Template source section with sync from Git option selected

Here, you can see the new option to select Sync from Git template source, which you can configure on the next screen. Since you already created your stack deployment file, you can select I am providing my own file in my repository.

Stack Deployments File section with "I am providing my own file in my repository" selected

Next, you can configure your Git integration to choose your repository. Since it’s your first time, you’ll need to use the CodeStar Connection you created beforehand and select your repository.

Git sync configuration with CodeStar connection selected, repository set to "Git sync" and branch of "main" selected

Select GitHub, your connection, the repository, and branch, the deployment file location.

Finally, you will select New IAM Role to create a service managed role. This role will enable Git sync to connect to your repository. You’ll only need to do this once; in the future you’ll be able to use the existing role you’ll create here.

IAM Role selection

On the next page, you’ll select the IAM Role you created to manage this stack. This role controls the resources that CloudFormation will deploy. Stacks managed by Git sync must have a role already created.

Finally, you can see the status of your sync in the new “Git sync” tab, including the configuration you provided earlier as well as the status of your sync, your previous deployments, and the option to retry or disconnect the sync if needed.

Git sync configuration data indicting repository, provider, branch, deployment file path, and Git sync status

Conclusion

At this point, you’ve configured a remote development environment to get high-quality feedback when creating and updating your CloudFormation templates. You also have the same high-quality feedback when creating a pull request. Finally, when a template does get merged to the main branch, it will be automatically deployed to your stack. This represents a robust and extensible CI/CD system to manage your infrastructure as code. I’m excited to hear your feedback about this feature!


Dan Blanco

Dan is a senior AWS Developer Advocate based in Atlanta for the AWS IaC team. When he’s not advocating for IaC tools, you can either find him in the kitchen whipping up something delicious or flying in the Georgia sky. Find him on twitter (@TheDanBlanco) or in the AWS CloudFormation Discord.

Increase collaboration and securely share cloud knowledge with AWS re:Post Private

Post Syndicated from Sébastien Stormacq original https://aws.amazon.com/blogs/aws/increase-collaboration-and-securely-share-cloud-knowledge-with-aws-repost-private/

Today we’re launching AWS re:Post Private, a fully managed knowledge service to accelerate cloud adoption, improve productivity, and drive innovation. re:Post Private allows organizations to increase collaboration and access knowledge resources built for your cloud community. It includes curated collections of technical content and training materials from AWS. The content is tailored specifically for your organization’s use cases, along with private discussion and collaboration forums for the members of your organization and your AWS account team.

As its name implies, you can think of it as a private version of AWS re:Post, with private content and access limited to people that belong to your organization and your AWS Account team.

Organizations of all sizes and verticals are increasingly moving their operations to the cloud. To ensure cloud adoption success, organizations must have the right skills and structure in place. The optimal way to achieve this is by setting up a centralized cloud center of excellence (CCOE). A CCOE is a centralized governance function for the organization and acts in a consultative role for central IT, business-unit IT, and cloud service consumers in the business. According to Gartner, a CCOE has three pillars: governance, brokerage, and community. The community pillar establishes the cloud community of practice (COP) that brings together stakeholders and facilitates cloud collaboration. It helps organizations adapt themselves for cloud adoption by promoting COP member interaction and facilitating cloud-related training and skills development.

AWS re:Post Private facilitates the creation, structure, and management of an internal cloud community of practice. It allows you to build a custom knowledge base that is searchable, reusable, and scalable. It allows community members to post private questions and answers and publish articles. It combines the benefits of traditional forums, such as community discussion and collaboration, with the benefits of an integrated information experience.

AWS re:Post Private is a fully managed service: there is no need to operate complex knowledge management and collaboration technologies or to develop custom solutions.

AWS re:Post Private also facilitates your interactions with AWS Support. You can create a support case directly from your private re:Post, and you can convert case resolution to reusable knowledge visible to all in your organization.

You choose in which AWS Region re:Post Private stores your data and who has access. All data at rest and in transit is encrypted using industry-standard algorithms. Your administrator chooses between using AWS-managed encryption keys or keys you manage and control.

Your organization’s Technical Account Managers are automatically added to your private re:Post. You can select other persons to invite among your organization and AWS teams, such as your AWS Solutions Architect. Only your private re:Post administrators need an AWS account. All other users can federate from your organization’s identity provider, such as Microsoft Active Directory.

Let’s see how to create a re:Post Private
To get started with AWS re:Post Private, as an administrator, I point my browser to the re:Post section of the AWS Management Console. I select Create private re:Post and enter the information needed to create a private re:Post for my organization, my team, or my project.

AWS re:Post Private - create 1

I can choose the Data encryption parameters and whether or not I enable Service access for Support case integration. When I’m ready, I select Create this re:Post.

AWS re:Post Private - create 2

Once the private re:Post is created, I can grant access to users and groups. User and group information comes from AWS IAM Identity Center and your identity provider. Invited users receive an email inviting them to connect to the private re:Post and create their profile.

That’s pretty much it for the administrator part. Once the private re:Post is created, I receive an endpoint name that I can share with the rest of my organization.

Let’s see how to use re:Post Private
As a member of the organization, I navigate to re:Post Private using the link I received from the administrator. I authenticate with the usual identity service of my organization, and I am redirected to the re:Post Private landing page.

On the top menu, I can select a tab to view the contents for Questions, Community Articles, Selections, Tags, Topics, Community Groups, or My Dashboard. This should be familiar if you already use the public knowledge service AWS re:Post that adopted a similar structure.

AWS re:Post Private - Landing page 1

Further down on the page, I see the popular topics and the top contributors in my organization.I also have access to Questions and Community Groups. I can search the available content by keyword, tags, author, and so on.

AWS re:Post Private - Landing page 2

AWS re:Post Private - Landing page 3

Pricing and availability
You can create your organization’s AWS re:Post Private in the following AWS Regions: US West (Oregon) and Europe (Frankfurt).

AWS re:Post Private is available to customers having an AWS Enterprise or Enterprise On-Ramp support plan. re:Post Private offers a free tier that allows you to explore and try out standard capabilities for six months. There is no limit on the number of users in the free tier, and content storage is limited to 10 GB. When you reach the free storage limit, the plan is converted to the paid standard tier.

With AWS re:Post Private Standard tier, you only pay for what you use. We charge based on the number of users per month. Please visit the re:Post Private pricing page for more information.

Get started today and activate AWS re:Post Private for your organization.

— seb

Use anomaly detection with AWS Glue to improve data quality (preview)

Post Syndicated from Jeff Barr original https://aws.amazon.com/blogs/aws/use-anomaly-detection-with-aws-glue-to-improve-data-quality-preview/

We are launching a preview of a new AWS Glue Data Quality feature that will help to improve your data quality by using machine learning to detect statistical anomalies and unusual patterns. You get deep insights into data quality issues, data quality scores, and recommendations for rules that you can use to continuously monitor for anomalies, all without having to write any code.

Data quality counts
AWS customers already build data integration pipelines to extract and transform data. They set up data quality rules to ensure that the resulting data is of high quality and can be used to make accurate business decisions. In many cases, these rules assess the data based on criteria that were chosen and locked in at a specific point in time, reflecting the current state of the business. However, as the business environment changes and the properties of the data shift, the rules are not always reviewed and updated.

For example, a rule could be set to verify that daily sales are at least ten thousand dollars for an early-stage business. As the business succeeds and grows, the rule should be checked and updated from time to time, but in practice this rarely happens. As a result, if there’s an unexpected drop in sales, the outdated rule does not activate, and no one is happy.

Anomaly detection in action
To detect unusual patterns and to gain deeper insights into data, organizations try to create their own adaptive systems or turn to costly commercial solutions that require specific technical skills and specialized business knowledge.

To address this widespread challenge, Glue Data Quality now makes use of machine learning (ML).

Once activated, this cool new addition to Glue Data Quality gathers statistics as fresh data arrives, using ML and dynamic thresholds to learn from past patterns while looking outliers and unusual data patterns. This process produces observations and also visualizes trends so that you can quickly gain a better understanding of the anomaly.

You will also get rule recommendations as part of the Observations, and you can easily and progressively add them to your data pipelines. Rules can enforce an action such as stopping your data pipelines. In the past, you could only write static rules. Now, you can write Dynamic rules that have auto-adjusting thresholds and AnomalyDetection Rules that grasp recurring patterns and spot deviations. When you use rules as part of data pipelines, they can stop the data flow so that a data engineer can review, fix and resume.

To use anomaly detection, I add an Evaluate Data Quality node to my job:

I select the node and click Add analyzer to choose a statistic and the columns:

Glue Data Quality learns from the data to recognize patterns and then generates observations that will be shown in the Data quality tab:

And a visualization:

After I review the observations I add new rules. The first one sets adaptive thresholds that check the row count is between the smallest of the last 10 runs and the largest of the last 20 runs. The second one looks for unusual patters, for example RowCount being abnormally high on weekends:

Join the preview
This new capability is available in preview in the following AWS Regions: US East (Ohio), US East (N. Virginia), US West (Oregon), Asia Pacific (Tokyo), and Europe (Ireland). To learn more, read Data Quality Anomaly Detection]].

Stay tuned for a detailed blog post when this feature launches!

Learn more

Data Quality Anomaly Detection

— Jeff;

Mutual authentication for Application Load Balancer reliably verifies certificate-based client identities

Post Syndicated from Channy Yun original https://aws.amazon.com/blogs/aws/mutual-authentication-for-application-load-balancer-to-reliably-verify-certificate-based-client-identities/

Today, we are announcing support for mutually authenticating clients that present X509 certificates to Application Load Balancer. With this new feature, you can now offload client authentication to the load balancer, ensuring only trusted clients communicate with their backend applications. This new capability is built on S2N, AWS’s open source Transport Layer Security (TLS) implementation that provides strong encryption and protections against zero-day vulnerabilities, which developers can trust.

Mutual authentication (mTLS) is commonly used for business-to-business (B2B) applications such as online banking, automobile, or gaming devices to authenticate devices using digital certificates. Companies typically use it with a private certificate authority (CA) to authenticate their clients before granting access to data and services.

Customers have implemented mutual authentication using self-created or third-party solutions that require additional time and management overhead. These customers spend their engineering resources to build the functionality into their backend, update their code to keep up with the latest security patches, and invest heavily in infrastructure to create and rotate certificates.

With mutual authentication on Application Load Balancer, you have a fully managed, scalable, and cost-effective solution that enables you to use your developer resources to focus on other critical projects. Your ALB will authenticate clients with revocation checks and pass client certificate information to the target, which can be used for authorization by applications.

Getting started with mutual authentication on ALB
To enable mutual authentication on ALB, choose Create Application Load Balancer by the ALB wizard on Amazon EC2 console. When you select HTTPS in the Listeners and routing section, you can see more settings such as security policy, default server certificate, and a new client certificate handling option to support mutual authentication.

With Mutual authentication (mTLS) enabled, you can configure how listeners handle requests that present client certificates. This includes how your Application Load Balancer authenticates certificates and the amount of certificate metadata that is sent to your backend targets.

Mutual authentication has two options. The Passthrough option sends all the client certificate chains received from the client to your backend application using HTTP headers. The mTLS-enabled Application Load Balancer gets the client certificate in the handshake, establishes a TLS connection, and then sends whatever it gets in HTTPS headers to the target application. The application will need to verify the client certificate chain to authenticate the client.

With the Verify with trust store option, Application Load Balancer and client verify each other’s identity and establish a TLS connection to encrypt communication between them. We introduce a new trust store feature, and you can upload any CA bundle with roots and/or intermediate certificates generated by AWS Private Certificate Authority or any other third party CA as the source of trust to validate your client certificates.

It requires selecting an existing trust store or creating a new one. Trust stores contain your CAs, trusted certificates, and, optionally, certificate revocation lists (CRLs). The load balancer uses a trust store to perform mutual authentication with clients.

To use this option and create a new trust store, choose Trust Stores in the left menu of the Amazon EC2 console and choose Create trust store.

You can choose a CA certificate bundle in PEM format and, optionally, CRLs from your Amazon Simple Storage Service (Amazon S3) bucket. A CA certificate bundle is a group of CA certificates (root or intermediate) used by a trust store. CRLs can be used when a CA revokes client certificates that have been compromised, and you need to reject those revoked certificates. You can replace a CA bundle, and add or remove CRLs from the trust store after creation.

You can use the AWS Command Line Interface (AWS CLI) with new APIs such as create-trust-store to upload CA information, configure the mutual-authentication-mode on the Application Load Balancer listener, and send user certificate information to targets.

$ aws elbv2 create-trust-store --name my-tls-name \
    --ca-certificates-bundle-s3-bucket channy-certs \
    --ca-certificates-bundle-s3-key Certificates.pem \
    --ca-certificates-bundle-s3-object-version <version>
>> arn:aws:elasticloadbalancing:root:file1
$ aws elbv2 create-listener --load balancer-arn <value> \
    --protocol HTTPS \
    --port 443 \
    --mutual-authentication Mode=verify,
      TrustStoreArn=<arn:aws:elasticloadbalancing:root:file1>

If you already have your own private CA, such as AWS Private CA, third-party CA, or self-signed CA, you can upload their CA bundle or CRLs to the Application Load Balancer trust store to enable mutual authentication.

To test the mutual authentication on Application Load Balancer, follow the step-by-step instructions to make a self-signed CA bundle and client certificate using OpenSSL, upload them to the Amazon S3 bucket, and use them with an ELB trust store.

You can use curl with the --key and --cert parameters to send the client certificate as part of the request:

$ curl --key my_client.key --cert my_client.pem https://api.yourdomain.com

Mutual authentication can fail if a client presents an invalid or expired certificate, fails to present a certificate, cannot find a trust chain, or if any links in the trust chain have expired, or the certificate is on the revocation list.

Application Load Balancer will close the connections whenever it fails to authenticate a client and will record new connection logs that capture detailed information about requests sent to your load balancer. Each log contains information such as the client’s IP address, handshake latency, TLS cipher used, and client certificate details. You can use these connection logs to analyze request patterns and troubleshoot issues.

To learn more, see Mutual authentication on Application Load Balancer in the AWS documentation.

Now available
Mutual authentication on Application Load Balancer is now available in all commercial AWS Regions where Application Load Balancer is available, except China. With no upfront costs or commitments required, you only pay for what you use. To learn more, see the Elastic Load Balancing pricing page.

Give it a try now and send feedback to AWS re:Post for Amazon EC2 or through your usual AWS Support contacts.

Learn more:
Application Load Balancer product page

— Channy

How to use the BatchGetSecretsValue API to improve your client-side applications with AWS Secrets Manager

Post Syndicated from Brendan Paul original https://aws.amazon.com/blogs/security/how-to-use-the-batchgetsecretsvalue-api-to-improve-your-client-side-applications-with-aws-secrets-manager/

AWS Secrets Manager is a service that helps you manage, retrieve, and rotate database credentials, application credentials, OAuth tokens, API keys, and other secrets throughout their lifecycles. You can use Secrets Manager to help remove hard-coded credentials in application source code. Storing the credentials in Secrets Manager helps avoid unintended or inadvertent access by anyone who can inspect your application’s source code, configuration, or components. You can replace hard-coded credentials with a runtime call to the Secrets Manager service to retrieve credentials dynamically when you need them.

In this blog post, we introduce a new Secrets Manager API call, BatchGetSecretValue, and walk you through how you can use it to retrieve multiple Secretes Manager secrets.

New API — BatchGetSecretValue

Previously, if you had an application that used Secrets Manager and needed to retrieve multiple secrets, you had to write custom code to first identify the list of needed secrets by making a ListSecrets call, and then call GetSecretValue on each individual secret. Now, you don’t need to run ListSecrets and loop. The new BatchGetSecretValue API reduces code complexity when retrieving secrets, reduces latency by running bulk retrievals, and reduces the risk of reaching Secrets Manager service quotas.

Security considerations

Though you can use this feature to retrieve multiple secrets in one API call, the access controls for Secrets Manager secrets remain unchanged. This means AWS Identity and Access Management (IAM) principals need the same permissions as if they were to retrieve each of the secrets individually. If secrets are retrieved using filters, principals must have both permissions for list-secrets and get-secret-value on secrets that are applicable. This helps protect secret metadata from inadvertently being exposed. Resource policies on secrets serve as another access control mechanism, and AWS principals must be explicitly granted permissions to access individual secrets if they’re accessing secrets from a different AWS account (see Cross-account access for more information). Later in this post, we provide some examples of how you can restrict permissions of this API call through an IAM policy or a resource policy.

Solution overview

In the following sections, you will configure an AWS Lambda function to use the BatchGetSecretValue API to retrieve multiple secrets at once. You also will implement attribute based access control (ABAC) for Secrets Manager secrets, and demonstrate the access control mechanisms of Secrets Manager. In following along with this example, you will incur costs for the Secrets Manager secrets that you create, and the Lambda function invocations that are made. See the Secrets Manager Pricing and Lambda Pricing pages for more details.

Prerequisites

To follow along with this walk-through, you need:

  1. Five resources that require an application secret to interact with, such as databases or a third-party API key.
  2. Access to an IAM principal that can:
    • Create Secrets Manager secrets through the AWS Command Line Interface (AWS CLI) or AWS Management Console.
    • Create an IAM role to be used as a Lambda execution role.
    • Create a Lambda function.

Step 1: Create secrets

First, create multiple secrets with the same resource tag key-value pair using the AWS CLI. The resource tag will be used for ABAC. These secrets might look different depending on the resources that you decide to use in your environment. You can also manually create these secrets in the Secrets Manager console if you prefer.

Run the following commands in the AWS CLI, replacing the secret-string values with the credentials of the resources that you will be accessing:

  1.  
    aws secretsmanager create-secret --name MyTestSecret1 --description "My first test secret created with the CLI for resource 1." --secret-string "{\"user\":\"username\",\"password\":\"EXAMPLE-PASSWORD-1\"}" --tags "[{\"Key\":\"app\",\"Value\":\"app1\"},{\"Key\":\"environment\",\"Value\":\"production\"}]"
  2.  
    aws secretsmanager create-secret --name MyTestSecret2 --description "My second test secret created with the CLI for resource 2." --secret-string "{\"user\":\"username\",\"password\":\"EXAMPLE-PASSWORD-2\"}" --tags "[{\"Key\":\"app\",\"Value\":\"app1\"},{\"Key\":\"environment\",\"Value\":\"production\"}]"
  3.  
    aws secretsmanager create-secret --name MyTestSecret3 --description "My third test secret created with the CLI for resource 3." --secret-string "{\"user\":\"username\",\"password\":\"EXAMPLE-PASSWORD-3\"}" --tags "[{\"Key\":\"app\",\"Value\":\"app1\"},{\"Key\":\"environment\",\"Value\":\"production\"}]"
  4.  
    aws secretsmanager create-secret --name MyTestSecret4 --description "My fourth test secret created with the CLI for resource 4." --secret-string "{\"user\":\"username\",\"password\":\"EXAMPLE-PASSWORD-4 \"}" --tags "[{\"Key\":\"app\",\"Value\":\"app1\"},{\"Key\":\"environment\",\"Value\":\"production\"}]"
  5.  
    aws secretsmanager create-secret --name MyTestSecret5 --description "My fifth test secret created with the CLI for resource 5." --secret-string "{\"user\":\"username\",\"password\":\"EXAMPLE-PASSWORD-5\"}" --tags "[{\"Key\":\"app\",\"Value\":\"app1\"},{\"Key\":\"environment\",\"Value\":\"production\"}]"

Next, create a secret with a different resource tag value for the app key, but the same environment key-value pair. This will allow you to demonstrate that the BatchGetSecretValue call will fail when an IAM principal doesn’t have permissions to retrieve and list the secrets in a given filter.

Create a secret with a different tag, replacing the secret-string values with credentials of the resources that you will be accessing.

  1.  
    aws secretsmanager create-secret --name MyTestSecret6 --description "My test secret created with the CLI." --secret-string "{\"user\":\"username\",\"password\":\"EXAMPLE-PASSWORD-6\"}" --tags "[{\"Key\":\"app\",\"Value\":\"app2\"},{\"Key\":\"environment\",\"Value\":\"production\"}]"

Step 2: Create an execution role for your Lambda function

In this example, create a Lambda execution role that only has permissions to retrieve secrets that are tagged with the app:app1 resource tag.

Create the policy to attach to the role

  1. Navigate to the IAM console.
  2. Select Policies from the navigation pane.
  3. Choose Create policy in the top right corner of the console.
  4. In Specify Permissions, select JSON to switch to the JSON editor view.
  5. Copy and paste the following policy into the JSON text editor.
    {
    	"Version": "2012-10-17",
    	"Statement": [
    		{
    			"Sid": "Statement1",
    			"Effect": "Allow",
    			"Action": [
    				"secretsmanager:ListSecretVersionIds",
    				"secretsmanager:GetSecretValue",
    				"secretsmanager:GetResourcePolicy",
    				"secretsmanager:DescribeSecret"
    			],
    			"Resource": [
    				"*"
    			],
    			"Condition": {
    				"StringNotEquals": {
    					"aws:ResourceTag/app": [
    						"${aws:PrincipalTag/app}"
    					]
    				}
    			}
    		},
    		{
    			"Sid": "Statement2",
    			"Effect": "Allow",
    			"Action": [
    				"secretsmanager:ListSecrets"
    			],
    			"Resource": ["*"]
    		}
    	]
    }

  6. Choose Next.
  7. Enter LambdaABACPolicy for the name.
  8. Choose Create policy.

Create the IAM role and attach the policy

  1. Select Roles from the navigation pane.
  2. Choose Create role.
  3. Under Select Trusted Identity, leave AWS Service selected.
  4. Select the dropdown menu under Service or use case and select Lambda.
  5. Choose Next.
  6. Select the checkbox next to the LambdaABACPolicy policy you just created and choose Next.
  7. Enter a name for the role.
  8. Select Add tags and enter app:app1 as the key value pair for a tag on the role.
  9. Choose Create Role.

Step 3: Create a Lambda function to access secrets

  1. Navigate to the Lambda console.
  2. Choose Create Function.
  3. Enter a name for your function.
  4. Select the Python 3.10 runtime.
  5. Select change default execution role and attach the execution role you just created.
  6. Choose Create Function.
    Figure 1: create a Lambda function to access secrets

    Figure 1: create a Lambda function to access secrets

  7. In the Code tab, copy and paste the following code:
    import json
    import boto3
    from botocore.exceptions import ClientError
    import urllib.request
    import json
    
    session = boto3.session.Session()
    # Create a Secrets Manager client
    client = session.client(
            service_name='secretsmanager'
        )
        
    
    def lambda_handler(event, context):
    
         application_secrets = client.batch_get_secret_value(Filters =[
            {
            'Key':'tag-key',
            'Values':[event["TagKey"]]
            },
            {
            'Key':'tag-value',
            'Values':[event["TagValue"]]
            }
            ])
    
    
        ### RESOURCE 1 CONNECTION ###
        try:
            print("TESTING CONNECTION TO RESOURCE 1")
            resource_1_secret = application_secrets["SecretValues"][0]
            ## IMPLEMENT RESOURCE CONNECTION HERE
    
            print("SUCCESFULLY CONNECTED TO RESOURCE 1")
        
        except Exception as e:
            print("Failed to connect to resource 1")
            return e
    
        ### RESOURCE 2 CONNECTION ###
        try:
            print("TESTING CONNECTION TO RESOURCE 2")
            resource_2_secret = application_secrets["SecretValues"][1]
            ## IMPLEMENT RESOURCE CONNECTION HERE
            
            print("SUCCESFULLY CONNECTED TO RESOURCE 2")
        
        except Exception as e:
            print("Failed to connect to resource 2",)
            return e
    
        
        ### RESOURCE 3 CONNECTION ###
        try:
            print("TESTING CONNECTION TO RESOURCE 3")
            resource_3_secret = application_secrets["SecretValues"][2]
            ## IMPLEMENT RESOURCE CONNECTION HERE
            
            print("SUCCESFULLY CONNECTED TO DB 3")
            
        except Exception as e:
            print("Failed to connect to resource 3")
            return e 
    
        ### RESOURCE 4 CONNECTION ###
        try:
            print("TESTING CONNECTION TO RESOURCE 4")
            resource_4_secret = application_secrets["SecretValues"][3]
            ## IMPLEMENT RESOURCE CONNECTION HERE
            
            print("SUCCESFULLY CONNECTED TO RESOURCE 4")
            
        except Exception as e:
            print("Failed to connect to resource 4")
            return e
    
        ### RESOURCE 5 CONNECTION ###
        try:
            print("TESTING ACCESS TO RESOURCE 5")
            resource_5_secret = application_secrets["SecretValues"][4]
            ## IMPLEMENT RESOURCE CONNECTION HERE
            
            print("SUCCESFULLY CONNECTED TO RESOURCE 5")
            
        except Exception as e:
            print("Failed to connect to resource 5")
            return e
        
        return {
            'statusCode': 200,
            'body': json.dumps('Successfully Completed all Connections!')
        }

  8. You need to configure connections to the resources that you’re using for this example. The code in this example doesn’t create database or resource connections to prioritize flexibility for readers. Add code to connect to your resources after the “## IMPLEMENT RESOURCE CONNECTION HERE” comments.
  9. Choose Deploy.

Step 4: Configure the test event to initiate your Lambda function

  1. Above the code source, choose Test and then Configure test event.
  2. In the Event JSON, replace the JSON with the following:
    {
    "TagKey": "app",
    “TagValue”:”app1”
    }

  3. Enter a Name for your event.
  4. Choose Save.

Step 5: Invoke the Lambda function

  1. Invoke the Lambda by choosing Test.

Step 6: Review the function output

  1. Review the response and function logs to see the new feature in action. Your function logs should show successful connections to the five resources that you specified earlier, as shown in Figure 2.
    Figure 2: Review the function output

    Figure 2: Review the function output

Step 7: Test a different input to validate IAM controls

  1. In the Event JSON window, replace the JSON with the following:
    {
      "TagKey": "environment",
    “TagValue”:”production”
    }

  2. You should now see an error message from Secrets Manager in the logs similar to the following:
    User: arn:aws:iam::123456789012:user/JohnDoe is not authorized to perform: 
    secretsmanager:GetSecretValue because no resource-based policy allows the secretsmanager:GetSecretValue action

As you can see, you were able to retrieve the appropriate secrets based on the resource tag. You will also note that when the Lambda function tried to retrieve secrets for a resource tag that it didn’t have access to, Secrets Manager denied the request.

How to restrict use of BatchGetSecretValue for certain IAM principals

When dealing with sensitive resources such as secrets, it’s recommended that you adhere to the principle of least privilege. Service control policies, IAM policies, and resource policies can help you do this. Below, we discuss three policies that illustrate this:

Policy 1: IAM ABAC policy for Secrets Manager

This policy denies requests to get a secret if the principal doesn’t share the same project tag as the secret that the principal is trying to retrieve. Note that the effectiveness of this policy is dependent on correctly applied resource tags and principal tags. If you want to take a deeper dive into ABAC with Secrets Manager, see Scale your authorization needs for Secrets Manager using ABAC with IAM Identity Center.

{
  "Version": "2012-10-17",
  "Statement": [
    {
      "Sid": "Statement1",
      "Effect": "Deny",
      "Action": [
        "secretsmanager:GetSecretValue",
	“secretsmanager:BatchGetSecretValue”
      ],
      "Resource": [
        "*"
      ],
      "Condition": {
        "StringNotEquals": {
          "aws:ResourceTag/project": [
            "${aws:PrincipalTag/project}"
          ]
        }
      }
    }
  ]
}

Policy 2: Deny BatchGetSecretValue calls unless from a privileged role

This policy example denies the ability to use the BatchGetSecretValue unless it’s run by a privileged workload role.

"Version": "2012-10-17",
	"Statement": [
		{
			"Sid": "Statement1",
			"Effect": "Deny",
			"Action": [
				"secretsmanager:BatchGetSecretValue",
			],
			"Resource": [
				"arn:aws:secretsmanager:us-west-2:12345678910:secret:testsecret"
			],
			"Condition": {
				"StringNotLike": {
					"aws:PrincipalArn": [
						"arn:aws:iam::123456789011:role/prod-workload-role"
					]
				}
			}
		}]
}

Policy 3: Restrict actions to specified principals

Finally, let’s take a look at an example resource policy from our data perimeters policy examples. This resource policy restricts Secrets Manager actions to the principals that are in the organization that this secret is a part of, except for AWS service accounts.

{
    "Version": "2012-10-17",
    "Statement": 
	[
        {
            "Sid": "EnforceIdentityPerimeter",
            "Effect": "Deny",
            "Principal": 
			{
                "AWS": "*"
            },
            "Action": "secretsmanager:*",
            "Resource": "*",
            "Condition": 
			{
                "StringNotEqualsIfExists": 
				{
                    "aws:PrincipalOrgID": "<my-org-id>"
                },
                "BoolIfExists": 
				{
                    "aws:PrincipalIsAWSService": "false"
                }
            }
        },
     ]
}

Conclusion

In this blog post, we introduced the BatchGetSecretValue API, which you can use to improve operational excellence, performance efficiency, and reduce costs when using Secrets Manager. We looked at how you can use the API call in a Lambda function to retrieve multiple secrets that have the same resource tag and showed an example of an IAM policy to restrict access to this API.

To learn more about Secrets Manager, see the AWS Secrets Manager documentation or the AWS Security Blog.

 
If you have feedback about this post, submit comments in the Comments section below. If you have questions about this post, contact AWS Support.

Want more AWS Security news? Follow us on Twitter.

Brendan Paul

Brendan Paul

Brendan is a Senior Solutions Architect at Amazon Web Services supporting media and entertainment companies. He has a passion for data protection and has been working at AWS since 2019. In 2024, he will start to pursue his Master’s Degree in Data Science at UC Berkeley. In his free time, he enjoys watching sports and running.

Use Amazon CloudWatch to consolidate hybrid, multicloud, and on-premises metrics

Post Syndicated from Jeff Barr original https://aws.amazon.com/blogs/aws/new-use-amazon-cloudwatch-to-consolidate-hybrid-multi-cloud-and-on-premises-metrics/

You can now consolidate metrics from your hybrid, multicloud, and on-premises data sources using Amazon CloudWatch and process them in a consistent, unified fashion. You can query, visualize, and alarm on any and all of the metrics, regardless of their source. In addition to giving you a unified view, this new feature will help you to identify trends and issues that span multiple parts and aspects of your infrastructure.

When I first heard about this new feature, I thought, “Wait, I can do that with PutMetricData, what’s the big deal?” Quite a bit, as it turns out. PutMetricData stores the metrics in CloudWatch, but this cool new feature fetches them on demand, directly from the source.

Instead of storing data, you select and configure connectors that pull data from Amazon Managed Service for Prometheus, generic Prometheus, Amazon OpenSearch Service, Amazon RDS for MySQL, Amazon RDS for PostgreSQL, CSV files stored in Amazon Simple Storage Service (Amazon S3), and Microsoft Azure Monitor. Each connector is a AWS Lambda function that is deployed from a AWS CloudFormation template. CloudWatch invokes the appropriate Lambda functions as needed and makes use of the returned metrics immediately — they are not buffered or kept around.

Creating and using connectors
To get started I open the CloudWatch Console, click All metrics, and activate the Multi source query tab, then I click Create and manage data sources:

And then I do it again:

Then I choose a data source type:

CloudWatch will then prompt me for the details that it needs to create and set up the connector for my data source. For example, if I select Amazon RDS – MySQL, I give my data source a name, choose the RDS database instance, and specify the connection info:

When I click Create data source, a Lambda function, a Lambda Permission, an IAM role, a Secrets Manager Secret, a Log Group, and a AWS CloudFormation Stack will be created in my account:

Then, when I am ready to reference the data source and make use of the metrics that it provides, I enter a SQL query that returns timestamps and values for the metric:

Inside the Lambda function
The code for the Custom – getting started template is short, simple, and easy to understand. It implements handlers for two events:

DescribeGetMetricData – This handler returns a string that includes the name of the connector, default values for the arguments to the other handler, and a text description in Markdown format that is displayed in the custom data source query builder in the CloudWatch console.

GetMetricData – This handler returns a metric name, 1-dimensional array of timestamps and metric values, all for a time range that is provided as arguments to the handler.

If you spend a few minutes examining this code you should be able to see how to write functions to connect to your own data sources.

Things to know
Here are a couple of things to keep in mind about this powerful new feature:

Regions – You can create and use data connectors in all commercial AWS Regions; a connector that is running in one region can connect to and retrieve data from services and endpoints in other regions and other AWS accounts.

Pricing – There is no extra charge for the connectors. You pay for the invocations of the Lambda functions and for any other AWS infrastructure that you create.

— Jeff;

Announcing cross-region data replication for Amazon WorkSpaces

Post Syndicated from Jeff Barr original https://aws.amazon.com/blogs/aws/cross-region-data-replication-for-amazon-workspaces/

You can now use cross-region data replication to provide business continuity for your Amazon WorkSpaces users. Snapshots are taken every 12 hours, replicated to the desired destination region, and are used to provide a recovery point objective (RPO) of 12-24 hours.

Multi-Region Resilience Review
In her 2022 post Advancing business continuity with Amazon WorkSpaces Multi-Region Resilience, my colleague Ariel introduced you to the initial version of this feature and showed you how to use it to set up standby virtual desktops available for your users. After it has been set up, users log in with Amazon WorkSpaces registration codes that include fully qualified domain names (FQDNs). If the WorkSpaces in the primary region are unavailable, the users are redirected to standby WorkSpaces in the secondary region.

The standby WorkSpaces are available for a small, fixed monthly fee for infrastructure and storage, with a low flat rate change for each hour of usage during the month. Together, this feature and this business model make it easy and economical for you to maintain a standby deployment.

Cross-Region Data Replication
Today we are making this feature even more powerful by adding one-way cross-region data replication. Applications, documents, and other resources stored on the primary WorkSpace are snapshotted every 12 hours and copied to the region hosting the secondary WorkSpace. You get an additional layer of redundancy, enhanced data protection, and can minimize productivity that would otherwise be lost to disruptions. This is particularly helpful if users have installed and configured applications on top of the base image since they won’t have to repeat these steps on the secondary WorkSpace.

Here’s how it all works:

Normal Operation – During normal operation, the users in your WorkSpaces fleet are using the primary region. EBS snapshots of the system (C:) and data (D:) drives are created every 12 hours. Multi-Region Resilience runs in the secondary region and checks for fresh snapshots regularly. When it finds them, it initiates a copy to the secondary region. As the copies arrive in the secondary region they are used to update the secondary WorkSpace.

Failover Detection – As part of the setup process, you will follow Configure your DNS service and setup DNS routing policies to set up DNS routing policies and optional Amazon Route 53 health checks to manage cross-Region redirection.

Failover – If a large-scale event (LSE) affects the primary region and the primary WorkSpace, the failover detection that I just described goes in to effect. When users try to reconnect, they are redirected to the secondary region, the latest snapshots are used to launch a WorkSpace for them, and they are back up and running with access to data and apps that are between 12 and 24 hours old.

Failback – At the conclusion of the LSE, the users manually back up any data that they have created on the secondary WorkSpace and log out of it. Then they log in again, and this time they will be directed to the primary region and WorkSpace, where they can restore their backups and continue to work.

Getting Set Up
As a WorkSpaces administrator, I start by locating the desired primary WorkSpace:

I select it and choose Create Standby WorkSpaces from the Actions menu:

I select the desired region for the secondary WorkSpace and click Next:

Then I choose the right directory in the region, and again click Next:

If the primary WorkSpace is encrypted, I must enter the ARN of the KMS key in the secondary region (or, even better, use a multi-Region key). I check Enable data replication and confirm that I am authorizing an additional monthly charge:

On the next page I review my choices and click Create to initiate the creation of the secondary WorkSpace in the region that I selected.

As mentioned earlier I also need to set up Multi-Region Resilience. This includes setting up a domain name to use as a WorkSpaces registration code, setting up Route 53 health checks, and using them to power routing policies.

Things to Know
Here are a couple of important things to know about Cross-Region Data Replication:

Directories – You can use a self-managed Active Directory, AWS Managed AD or AD Connector configured as described in this post. Simple AD is not supported.

Snapshots – The first-ever EBS snapshot for a particular data volume is full, and subsequent snapshots are incremental. As a result, the first replication for a given WorkSpace will likely take longer than subsequent ones. Snapshots are initiated on a schedule that is internal to WorkSpaces and you cannot control the timing.

Encryption – You can use this feature with Encrypted WorkSpaces as long as you use the same AWS Key Management Service (AWS KMS) keys in the primary and secondary regions. You can also use multi-Region keys.

Bundles – You can use the Windows 10 and Windows 11 bundles, and you can also BYOL.

Accounts – Every AWS account has a fixed limit on the number of pending EBS snapshots. This may affect your ability to use this feature with large fleets of WorkSpaces.

Pricing – You pay a fixed monthly fee based on the amount of storage configured for each primary WorkSpace. See the Amazon WorkSpaces Pricing page for more information.

— Jeff;

Amazon Transcribe Call Analytics adds new generative AI-powered call summaries (preview)

Post Syndicated from Veliswa Boya original https://aws.amazon.com/blogs/aws/amazon-transcribe-call-analytics-adds-new-generative-ai-powered-call-summaries-preview/

We are announcing generative artificial intelligence (AI)-powered call summarization in Amazon Transcribe Call Analytics in preview. Powered by Amazon Bedrock, this feature helps businesses improve customer experience, and agent and supervisor productivity by automatically summarizing customer service calls. Amazon Transcribe Call Analytics provides machine learning (ML)-powered analytics that allows contact centers to understand the sentiment, trends, and policy compliance of customer conversations to improve their experience and identify crucial feedback. A single API call is all it takes to extract transcripts, rich insights, and summaries from your customer conversations.

We understand that as a business, you want to maintain an accurate historical record of key conversation points, including action items associated with each conversation. To do this, agents summarize notes after the conversation has ended and enter these in their CRM system, a process that is time-consuming and subject to human error. Now imagine the customer trust erosion that follows when the agent fails to correctly capture and act upon important action items discussed during conversations.

How it works
Starting today, to assist agents and supervisors with the summarization of customer conversations, Amazon Transcribe Call Analytics will generate a concise summary of a contact center interaction that captures key components such as why the customer called, how the issue was addressed, and what follow-up actions were identified. After completing a customer interaction, agents can directly proceed to help the next customer since they don’t have to summarize a conversation, resulting in reduced customer wait times and improved agent productivity. Further, supervisors can review the summary when investigating a customer issue to get a gist of the conversation, without having to listen to the entire call recording or read the transcript.

Exploring Amazon Transcribe Call Analytics in the console
To see how this works visually, I first create an Amazon Simple Storage Service (Amazon S3) bucket in the relevant AWS Region. I then upload the audio file to the S3 bucket.

Audio file in S3 bucket

To create an analytics job that transcribes the audio and provides additional analytics about the conversation that the customer and the agent were having, I go to the Amazon Transcribe Call Analytics console. I select Post-call Analytics in the left hand navigation bar and then choose Create job.

Create Post-call analytics job

Next I enter a job name making sure to keep the language settings based on the language in the audio file.

Job settings

In the Amazon S3 URI path, I provide the link to the audio file uploaded in the first screenshot shown in this post.

Audio file details

In Role name, I select Create an IAM role which will have access to the Amazon S3 bucket, then choose Next.

Create IAM Role

I enable Generative call summarization, and then choose Create job.

Configure job

After a few minutes, the job’s status will change from In progress to Complete, indicating that it was completed successfully.

Job status

Select the job, and the next screen will show the transcript and a new tab, Generative call summarization – preview.

You can also download the transcript to view the analytics and summary.

Now available
Generative call summarization in Amazon Transcribe Call Analytics is available today in English in US East (N. Virginia) and US West (Oregon).

With generative call summarization in Amazon Transcribe Call Analytics, you pay as you go and are billed monthly based on tiered pricing. For more information, see Amazon Transcribe pricing.

Learn more:

– Veliswa

Large Language Models for sentiment analysis with Amazon Redshift ML (Preview)

Post Syndicated from Blessing Bamiduro original https://aws.amazon.com/blogs/big-data/large-language-models-for-sentiment-analysis-with-amazon-redshift-ml-preview/

Amazon Redshift ML empowers data analysts and database developers to integrate the capabilities of machine learning and artificial intelligence into their data warehouse. Amazon Redshift ML helps to simplify the creation, training, and application of machine learning models through familiar SQL commands.

You can further enhance Amazon Redshift’s inferencing capabilities by Bringing Your Own Models (BYOM). There are two types of BYOM: 1) remote BYOM for remote inferences, and 2) local BYOM for local inferences. With local BYOM, you utilize a model trained in Amazon SageMaker for in-database inference within Amazon Redshift by importing Amazon SageMaker Autopilot and Amazon SageMaker trained models into Amazon Redshift. Alternatively, with remote BYOM you can invoke remote custom ML models deployed in SageMaker. This enables you to use custom models in SageMaker for churn, XGBoost, linear regression, multi-class classification and now LLMs.

Amazon SageMaker JumpStart is a SageMaker feature that helps deploy pretrained, publicly available large language models (LLM) for a wide range of problem types, to help you get started with machine learning. You can access pretrained models and use them as-is or incrementally train and fine-tune these models with your own data.

In prior posts, Amazon Redshift ML exclusively supported BYOMs that accepted text or CSV as the data input and output format. Now, it has added support for the SUPER data type for both input and output. With this support, you can use LLMs in Amazon SageMaker JumpStart which offers numerous proprietary and publicly available foundation models from various model providers.

LLMs have diverse use cases. Amazon Redshift ML supports available LLM models in SageMaker including models for sentiment analysis. In sentiment analysis, the model can analyze product feedback and strings of text and hence the sentiment. This capability is particularly valuable for understanding product reviews, feedback, and overall sentiment.

Overview of solution

In this post, we use Amazon Redshift ML for sentiment analysis on reviews stored in an Amazon Redshift table. The model takes the reviews as an input and returns a sentiment classification as the output. We use an out of the box LLM in SageMaker Jumpstart. Below picture shows the solution overview.

Walkthrough

Follow the steps below to perform sentiment analysis using Amazon Redshift’s integration with SageMaker JumpStart to invoke LLM models:

  1. Deploy LLM model using foundation models in SageMaker JumpStart and create an endpoint
  2. Using Amazon Redshift ML, create a model referencing the SageMaker JumpStart LLM endpoint
  3. Create a user defined function(UDF) that engineers the prompt for sentiment analysis
  4. Load sample reviews data set into your Amazon Redshift data warehouse
  5. Make a remote inference to the LLM model to generate sentiment analysis for input dataset
  6. Analyze the output

Prerequisites

For this walkthrough, you should have the following prerequisites:

  • An AWS account
  • An Amazon Redshift Serverless preview workgroup or an Amazon Redshift provisioned preview cluster. Refer to creating a preview workgroup or creating a preview cluster documentation for steps.
  • For the preview, your Amazon Redshift data warehouse should be on preview_2023 track in of these regions – US East (N. Virginia), US West (Oregon), EU-West (Ireland), US-East (Ohio), AP-Northeast (Tokyo) or EU-North-1 (Stockholm).

Solution Steps

Follow the below solution steps

1. Deploy LLM Model using Foundation models in SageMaker JumpStart and create an endpoint

  1. Navigate to Foundation Models in Amazon SageMaker Jumpstart
  2. Search for the foundation model by typing Falcon 7B Instruct BF16 in the search box
  3. Choose View Model

  4. In the Model Details  page, choose Open notebook in Studio

  5. When Select domain and user profile dialog box opens up, choose the profile you like from the drop down and choose Open Studio

  6. When the notebook opens, a prompt Set up notebook environment pops open. Choose ml.g5.2xlarge or any other instance type recommended in the notebook and choose Select

  7. Scroll to Deploying Falcon model for inference section of the notebook and run the three cells in that section
  8. Once the third cell execution is complete, expand Deployments section in the left pane, choose Endpoints to see the endpoint created. You can see endpoint Name. Make a note of that. It will be used in the next steps
  9. Select Finish.

2. Using Amazon Redshift ML, create a model referencing the SageMaker JumpStart LLM endpoint

Create a model using Amazon Redshift ML bring your own model (BYOM) capability. After the model is created, you can use the output function to make remote inference to the LLM model. To create a model in Amazon Redshift for the LLM endpoint created previously, follow the below steps.

  1. Login to Amazon Redshift endpoint. You can use Query editor V2 to login
  2. Import this notebook into Query Editor V2. It has all the SQLs used in this blog.
  3. Ensure you have the below IAM policy added to your IAM role. Replace <endpointname> with the SageMaker JumpStart endpoint name captured earlier
    {
      "Statement": [
          {
              "Action": "sagemaker:InvokeEndpoint",
              "Effect": "Allow",
              "Resource": "arn:aws:sagemaker:<region>:<AccountNumber>:endpoint/<endpointname>",
              "Principal": "*"
          }
      ]
    }

  4. Create model in Amazon Redshift using the create model statement given below. Replace <endpointname> with the endpoint name captured earlier. The input and output data type for the model needs to be SUPER.
    CREATE MODEL falcon_7b_instruct_llm_model
    FUNCTION falcon_7b_instruct_llm_model(super)
    RETURNS super
    SAGEMAKER '<endpointname>'
    IAM_ROLE default;

3. Load sample reviews data set into your Amazon Redshift data warehouse

In this blog post, we will use a sample fictitious reviews dataset for the walkthrough

  1. Login to Amazon Redshift using Query Editor V2
  2. Create sample_reviews table using the below SQL statement. This table will store the sample reviews dataset
    CREATE TABLE sample_reviews
    (
    review varchar(4000)
    );

  3. Download the sample file, upload into your S3 bucket and load data into sample_reviews table using the below COPY command
    COPY sample_reviews
    FROM 's3://<<your_s3_bucket>>/sample_reviews.csv'
    IAM_ROLE DEFAULT
    csv
    DELIMITER ','
    IGNOREHEADER 1;

4. Create a UDF that engineers the prompt for sentiment analysis

The input to the LLM consists of two main parts – the prompt and the parameters.

The prompt is the guidance or set of instructions you want to give to the LLM. Prompt should be clear to provide proper context and direction for the LLM. Generative AI systems rely heavily on the prompts provided to determine how to generate a response.  If the prompt does not provide enough context and guidance, it can lead to unhelpful responses. Prompt engineering helps avoid these pitfalls.

Finding the right words and structure for a prompt is challenging and often requires trial and error. Prompt engineering allows experimenting to find prompts that reliably produce the desired output.  Prompt engineering helps shape the input to best leverage the capabilities of the Generative-AI model being used. Well-constructed prompts allow generative AI to provide more nuanced, high-quality, and helpful responses tailored to the specific needs of the user.

The parameters allow configuring and fine-tuning the model’s output. This includes settings like maximum length, randomness levels, stopping criteria, and more. Parameters give control over the properties and style of the generated text and are model specific.

The UDF below takes varchar data in your data warehouse, parses it into SUPER (JSON format) for the LLM. This flexibility allows you to store your data as varchar in your data warehouse without performing data type conversion to SUPER to use LLMs in Amazon Redshift ML and makes prompt engineering easy. If you want to try a different prompt, you can just replace the UDF

The UDF given below has both the prompt and a parameter.

  • Prompt: “Classify the sentiment of this sentence as Positive, Negative, Neutral. Return only the sentiment nothing else” – This instructs the model to classify the review into 3 sentiment categories.
  • Parameter: “max_new_tokens”:1000 – This allows the model to return up to 1000 tokens.
CREATE FUNCTION udf_prompt_eng_sentiment_analysis (varchar)
  returns super
stable
as $$
  select json_parse(
  '{"inputs":"Classify the sentiment of this sentence as Positive, Negative, Neutral. Return only the sentiment nothing else.' || $1 || '","parameters":{"max_new_tokens":1000}}')
$$ language sql;

5. Make a remote inference to the LLM model to generate sentiment analysis for input dataset

The output of this step is stored in a newly created table called sentiment_analysis_for_reviews. Run the below SQL statement to create a table with output from LLM model

CREATE table sentiment_analysis_for_reviews
as
(
    SELECT 
        review, 
        falcon_7b_instruct_llm_model
            (
                udf_prompt_eng_sentiment_analysis(review)
        ) as sentiment
    FROM sample_reviews
);

6. Analyze the output

The output of the LLM is of datatype SUPER. For the Falcon model, the output is available in the attribute named generated_text. Each LLM has its own output payload format. Please refer to the documentation for the LLM you would like to use for its output format.

Run the below query to extract the sentiment from the output of LLM model. For each review, you can see it’s sentiment analysis

SELECT review, sentiment[0]."generated_text" :: varchar as sentiment 
FROM sentiment_analysis_for_reviews;

Cleaning up

To avoid incurring future charges, delete the resources.

  1. Delete the LLM endpoint in SageMaker Jumpstart
  2. Drop the sample_reviews table and the model in Amazon Redshift using the below query

    DROP MODEL falcon_7b_instruct_llm_model;
    DROP TABLE sample_reviews;
    DROP FUNCTION fn_gen_prompt_4_sentiment_analysis;

  3. If you have created an Amazon Redshift endpoint, delete the endpoint as well

Conclusion

In this post, we showed you how to perform sentiment analysis for data stored in Amazon Redshift using Falcon, a large language model(LLM) in SageMaker jumpstart and Amazon Redshift ML. Falcon is used as an example, you can use other LLM models as well with Amazon Redshift ML. Sentiment analysis is just one of the many use cases that are possible with LLM support in Amazon Redshift ML. You can achieve other use cases such as data enrichment, content summarization, knowledge graph development and more. LLM support broadens the analytical capabilities of Amazon Redshift ML as it continues to empower data analysts and developers to incorporate machine learning into their data warehouse workflow with streamlined processes driven by familiar SQL commands. The addition of SUPER data type enhances Amazon Redshift ML capabilities, allowing smooth integration of large language models (LLM) from SageMaker JumpStart for remote BYOM inferences.


About the Authors

Blessing Bamiduro is part of the Amazon Redshift Product Management team. She works with customers to help explore the use of Amazon Redshift ML in their data warehouse. In her spare time, Blessing loves travels and adventures.

Anusha Challa is a Senior Analytics Specialist Solutions Architect focused on Amazon Redshift. She has helped many customers build large-scale data warehouse solutions in the cloud and on premises. She is passionate about data analytics and data science.

Build generative AI apps using AWS Step Functions and Amazon Bedrock

Post Syndicated from Marcia Villalba original https://aws.amazon.com/blogs/aws/build-generative-ai-apps-using-aws-step-functions-and-amazon-bedrock/

Today we are announcing two new optimized integrations for AWS Step Functions with Amazon Bedrock. Step Functions is a visual workflow service that helps developers build distributed applications, automate processes, orchestrate microservices, and create data and machine learning (ML) pipelines.

In September, we made available Amazon Bedrock, the easiest way to build and scale generative artificial intelligence (AI) applications with foundation models (FMs). Bedrock offers a choice of foundation models from leading providers like AI21 Labs, Anthropic, Cohere, Stability AI, and Amazon, along with a broad set of capabilities that customers need to build generative AI applications, while maintaining privacy and security. You can use Amazon Bedrock from the AWS Management Console, AWS Command Line Interface (AWS CLI), or AWS SDKs.

The new Step Functions optimized integrations with Amazon Bedrock allow you to orchestrate tasks to build generative AI applications using Amazon Bedrock, as well as to integrate with over 220 AWS services. With Step Functions, you can visually develop, inspect, and audit your workflows. Previously, you needed to invoke an AWS Lambda function to use Amazon Bedrock from your workflows, adding more code to maintain them and increasing the costs of your applications.

Step Functions provides two new optimized API actions for Amazon Bedrock:

  • InvokeModel – This integration allows you to invoke a model and run the inferences with the input provided in the parameters. Use this API action to run inferences for text, image, and embedding models.
  • CreateModelCustomizationJob – This integration creates a fine-tuning job to customize a base model. In the parameters, you specify the foundation model and the location of the training data. When the job is completed, your custom model is ready to be used. This is an asynchronous API, and this integration allows Step Functions to run a job and wait for it to complete before proceeding to the next state. This means that the state machine execution will pause while the create model customization job is running and will resume automatically when the task is complete.

Optimized connectors

The InvokeModel API action accepts requests and responses that are up to 25 MB. However, Step Functions has a 256 kB limit on state payload input and output. In order to support larger payloads with this integration, you can define an Amazon Simple Storage Service (Amazon S3) bucket where the InvokeModel API reads data from and writes the result to. These configurations can be provided in the parameters section of the API action configuration parameters section.

How to get started with Amazon Bedrock and AWS Step Functions
Before getting started, ensure that you create the state machine in a Region where Amazon Bedrock is available. For this example, use US East (N. Virginia), us-east-1.

From the AWS Management Console, create a new state machine. Search for “bedrock,” and the two available API actions will appear. Drag the InvokeModel to the state machine.

Using the invoke model connector

You can now configure that state in the menu on the right. First, you can define which foundation model you want to use. Pick a model from the list, or get the model dynamically from the input.

Then you need to configure the model parameters. You can enter the inference parameters in the text box or load the parameters from Amazon S3.

Configuration for the API Action

If you keep scrolling in the API action configuration, you can specify additional configuration options for the API, such as the S3 destination bucket. When this field is specified, the API action stores the API response in the specified bucket instead of returning it to the state output. Here, you can also specify the content type for the requests and responses.

Additional configuration for the connector

When you finish configuring your state machine, you can create and run it. When the state machine runs, you can visualize the execution details, select the Amazon Bedrock state, and check its inputs and outputs.

Executing the state machine

Using Step Functions, you can build state machines as extensively as you need, combining different services to solve many problems. For example, you can use Step Functions with Amazon Bedrock to create applications using prompt chaining. This is a technique for building complex generative AI applications by passing multiple smaller and simpler prompts to the FM instead of a very long and detailed prompt. To build a prompt chain, you can create a state machine that calls Amazon Bedrock multiple times to get an inference for each of the smaller prompts. You can use the parallel state to run all these tasks in parallel and then use an AWS Lambda function that unifies the responses of the parallel tasks into one response and generates a result.

Available now
AWS Step Functions optimized integrations for Amazon Bedrock are limited to the AWS Regions where Amazon Bedrock is available.

You can get started with Step Functions and Amazon Bedrock by trying out a sample project from the Step Functions console.

– Marcia

New Cost Optimization Hub centralizes recommended actions to save you money

Post Syndicated from Channy Yun original https://aws.amazon.com/blogs/aws/new-cost-optimization-hub-to-find-all-recommended-actions-in-one-place-for-saving-you-money/

Today, we are announcing Cost Optimization Hub, a new AWS Billing and Cost Management feature that makes it easy for you to identify, filter, aggregate, and quantify savings for AWS cost optimization recommendations.

With the new Cost Optimization Hub, you can interactively query cost optimization recommendations such as idle resource detection, resource rightsizing, and purchasing options across multiple AWS Regions and AWS accounts in your organizations without any data aggregation and processing. You can find out how much you’ll save if you implement those recommendations and easily compare and prioritize recommendations by savings.

Andy Jassy, CEO of Amazon, told shareholders, “We’re trying to build customer relationships (and a business) that outlast all of us, and as a result, our AWS sales and support teams are spending much of their time helping customers optimize their AWS spend so they can better weather this uncertain economy” in his 2022 Letter to Shareholders.

Cost Optimization Hub gathers all cost-optimizing recommended actions across AWS Cloud Financial Management (CFM) services, including AWS Cost Explorer and AWS Compute Optimizer, in one place. It incorporates customer-specific pricing and discounts into these recommendations, and it deduplicates findings and savings to give a consolidated view of your cost optimization opportunities.

If you are a FinOps team or infrastructure management team member who wants to understand your cost optimization opportunities in aggregate, such as which AWS accounts or AWS Regions have the most cost optimization opportunities, you should start with Cost Optimization Hub.

You can easily analyze cost optimization opportunities with built-in filters and grouping options. For example, after understanding which AWS account has the most cost optimization opportunities, you can identify the top cost optimization strategies, such as stopping idle resources, rightsizing, and Graviton migration. If you identify which AWS Region has the highest number of rightsizing opportunities, you can get a list of rightsizing recommendations for the Region. It will redirect you to the Compute Optimizer console through deep linking to validate the details, such as the projected CPU utilization if you implement the change.

Getting started with Cost Optimization Hub
To get started, choose Cost Optimization Hub in the left navigation menu of the AWS Billing and Cost Management Console. You can opt in by selecting Enable. There is a 24-hour wait time for Cost Optimization Hub to populate data initially and data will be refreshed daily afterward.

After opt-in, you can see the dashboard of cost optimization recommendations by AWS account, AWS Region, and tag key. If you want to see the list of resources available for optimization, choose View opportunities.

Cost Optimization Hub supports six types of cost-optimizing recommended actions, including:

  • Stop – Stop idle or unused resources to save up to 100 percent of the resources’ cost.
  • Rightsize – Move to a smaller Amazon EC2 instance type, Amazon EBS volume, AWS Lambda memory size, or AWS Fargate task size
  • Upgrade – Move to a later-generation product, such as moving from EBS io1 volume type to io2.
  • Graviton migration – Move from EC2 instance types with x86-based processors to EC2 instance types with AWS Graviton-based processors to save costs.
  • Purchase Savings Plans – Purchase Compute Savings Plans, EC2 Instance Savings Plans, and Amazon SageMaker Savings Plans
  • Purchase Reserved Instances – Purchase Amazon EC2, Amazon RDS, Amazon DynamoDB, Amazon ElastiCache, and Amazon Redshift Reserved Instances.

You can see the resource type, top recommended action, and estimated monthly savings. You can also filter the list by AWS account, AWS Region, implementation effort, and tag key as the group-by dimension.

You also can classify each recommendation as “Is resources restart needed” or “Is rollback possible.” If you specify Is resources restart needed=No as the filter, you can only see recommendations that don’t require you to restart your resources, such as EBS volume recommendations. Similarly, If you specify Is rollback possible=Yes as the filter, you can only see recommendations that can be rolled back.

If you select a specific source, for example, right-sizing EC2 instance, you can view details and connect to Amazon EC2 and the AWS Compute Optimizer console. Note that estimated monthly savings is a quick approximation of future savings. The actual savings you will realize are dependent on your future AWS usage patterns.

You can also interactively query through AWS Command Line Interface (AWS CLI) and AWS SDKs.  Here’s a sample query to find the recommendations about deleting and rightsizing resources:

$ aws cost-optimization-hub list-recommendations

The preceding query gives you the following results:

{
   "items":[
      {
         "recommendationId":"MDA2MDI1ODQ1MTA1XzQ5MzNhYzZlLWZmYTUtNGI2ZC04YzBkLTAxYWE3Y2JlNjNlYg==",
         "accountId":"006025845105",
         "region":"Global",
         "resourceId":"006025845105_ComputeSavingsPlans",
         "currentResourceType":"ComputeSavingsPlans",
         "recommendedResourceType":"ComputeSavingsPlans",
         "estimatedMonthlySavings":1506.591472696,
         "estimatedSavingsPercentage":55.46400024,
         "estimatedMonthlyCost":2716.341169146,
         "currencyCode":"USD",
         "implementationEffort":"VeryLow",
         "restartNeeded":false,
         "actionType":"PurchaseSavingsPlans",
         "rollbackPossible":false,
         "recommendedResourceSummary":"$1.628/hour with three years term",
         "lastRefreshTimestamp":"2023-10-23T16:54:13-07:00",
         "recommendationLookbackPeriodInDays":30,
         "source":"CostExplorer"
      },
      {
         "recommendationId":"MDA2MDI1ODQ1MTA1XzhiZTRlNTczLTE0MDctNGIzOS05MmY3LTdmN2EzOTU2Y2ZkYw==",
         "accountId":"006025845105",
         "region":"us-east-1",
         "resourceId":"arn:aws:lambda:us-east-1:006025845105:function:Lambda-recommendation-testing:$LATEST",
         "resourceArn":"arn:aws:lambda:us-east-1:006025845105:function:Lambda-recommendation-testing:$LATEST",
         "currentResourceType":"LambdaFunction",
         "recommendedResourceType":"LambdaFunction",
         "estimatedMonthlySavings":3.1682091425308054e-06,
         "estimatedSavingsPercentage":1.936368871741565,
         "estimatedMonthlyCost":0.00016044778307703665,
         "currencyCode":"USD",
         "implementationEffort":"Low",
         "restartNeeded":false,
         "actionType":"Rightsize",
         "rollbackPossible":true,
         "currentResourceSummary":"128 MB memory",
         "recommendedResourceSummary":"160 MB memory",
         "lastRefreshTimestamp":"2023-10-24T04:07:35.364000-07:00",
         "recommendationLookbackPeriodInDays":14,
         "source":"ComputeOptimizer"
      }
   ]
}

For more information about new Cost Optimization Hub APIs, see the Cost Optimization Hub API documentation.

Now available
Cost Optimization Hub is now generally available for all customers. There is no additional charge for this new capability. You can now get started and view cost optimization recommendations across all AWS Regions.

To learn more, see the Cost Optimization Hub page and send feedback to AWS re:Post for Cost Optimization or through your usual AWS Support contacts.

— Channy

Amazon CloudWatch Logs now offers automated pattern analytics and anomaly detection

Post Syndicated from Danilo Poccia original https://aws.amazon.com/blogs/aws/amazon-cloudwatch-logs-now-offers-automated-pattern-analytics-and-anomaly-detection/

Searching through log data to find operational or business insights often feels like looking for a needle in a haystack. It usually requires you to manually filter and review individual log records. To help you with that, Amazon CloudWatch has added new capabilities to automatically recognize and cluster patterns among log records, extract noteworthy content and trends, and notify you of anomalies using advanced machine learning (ML) algorithms trained using decades of Amazon and AWS operational data.

Specifically, CloudWatch now offers the following:

  • The Patterns tab on the Logs Insights page finds recurring patterns in your query results and lets you analyze them in detail. This makes it easier to find what you’re looking for and drill down into new or unexpected content in your logs.
  • The Compare button in the time interval selector on the Logs Insights page lets you quickly compare the query result for the selected time range to a previous period, such as the previous day, week, or month. In this way, it takes less time to see what has changed compared to a previous stable scenario.
  • The Log Anomalies page in the Logs section of the navigation pane automatically surfaces anomalies found in your logs while they are processed during ingestion.

Let’s see how these work in practice with a typical troubleshooting journey. I will look at some application logs to find key patterns, compare two time periods to understand what changed, and finally see how detecting anomalies can help discover issues.

Finding recurring patterns in the logs
In the CloudWatch console, I choose Logs Insights from the Logs section of the navigation pane. To start, I have selected which log groups I want to query. In this case, I select a log group of a Lambda function that I want to inspect and choose Run query.

In the Pattern tab, I see the patterns that have been found in these log groups. One of the patterns seems to be an error. I can select it to quickly add it as a filter to my query and focus on the logs that contain this pattern. For now, I choose the magnifying glass icon to analyze the pattern.

Console screenshot.

In the Pattern inspect window, a histogram with the occurrences of the pattern in the selected time period is shown. After the histogram, samples from the logs are provided.

Console screenshot.

The variable parts of the pattern (such as numbers) have been extracted as “tokens.” I select the Token values tab to see the values for a token. I can select a token value to quickly add it as a filter to the query and focus on the logs that contain this pattern with this specific value.

Console screenshot.

I can also look at the Related patterns tab to see other logs that typically occurred at the same time as the pattern I am analyzing. For example, if I am looking at an ERROR log that was always written alongside a DEBUG log showing more details, I would see that relationship there.

Comparing logs with a previous period
To better understand what is happening, I choose the Compare button in the time interval selector. This updates the query to compare results with a previous period. For example, I choose Previous day to see what changed compared to yesterday.

Console screenshot.

In the Patterns tab, I notice that there has actually been a 10 percent decrease in the number of errors, so the current situation might not be too bad.

I choose the magnifying glass icon on the pattern with severity type ERROR to see a full comparison of the two time periods. The graph overlaps the occurrences of the pattern over the two periods (now and yesterday in this case) inside the selected time range (one hour).

Console screenshot.

Errors are decreasing but are still there. To reduce those errors, I make some changes to the application. I come back after some time to compare the logs, and a new ERROR pattern is found that was not present in the previous time period.

Console screenshot.

My update probably broke something, so I roll back to the previous version of the application. For now, I’ll keep it as it is because the number of errors is acceptable for my use case.

Detecting anomalies in the log
I am reassured by the decrease in errors that I discovered comparing the logs. But how can I know if something unexpected is happening? Anomaly detection for CloudWatch Logs looks for unexpected patterns in the logs as they are processed during ingestion and can be enabled at log group level.

I select Log groups in the navigation pane and type a filter to see the same log group I was looking at before. I choose Configure in the Anomaly detection column and select an Evaluation frequency of 5 minutes. Optionally, I can use a longer interval (up to 60 minutes) and add patterns to process only specific log events for anomaly detection.

After I activate anomaly detection for this log group, incoming logs are constantly evaluated against historical baselines. I wait for a few minutes and, to see what has been found, I choose Log anomalies from the Logs section of the navigation pane.

Console screenshot.

To simplify this view, I can suppress anomalies that I am not interested in following. For now, I choose one of the anomalies in order to inspect the corresponding pattern in a way similar to before.

Console screenshot.

After this additional check, I am convinced there are no urgent issues with my application. With all the insights I collected with these new capabilities, I can now focus on the errors in the logs to understand how to solve them.

Things to know
Amazon CloudWatch automated log pattern analytics is available today in all commercial AWS Regions where Amazon CloudWatch Logs is offered excluding the China (Beijing), the China (Ningxia), and Israel (Tel Aviv) Regions.

The patterns and compare query features are charged according to existing Logs Insights query costs. Comparing a one-hour time period against another one-hour time period is equivalent to running a single query over a two-hour time period. Anomaly detection is included as part of your log ingestion fees, and there is no additional charge for this feature. For more information, see CloudWatch pricing.

Simplify how you analyze logs with CloudWatch automated log pattern analytics.

— Danilo

Amazon Managed Service for Prometheus collector provides agentless metric collection for Amazon EKS

Post Syndicated from Donnie Prakoso original https://aws.amazon.com/blogs/aws/amazon-managed-service-for-prometheus-collector-provides-agentless-metric-collection-for-amazon-eks/

Today, I’m happy to announce a new capability, Amazon Managed Service for Prometheus collector, to automatically and agentlessly discover and collect Prometheus metrics from Amazon Elastic Kubernetes Service (Amazon EKS). Amazon Managed Service for Prometheus collector consists of a scraper that discovers and collects metrics from Amazon EKS applications and infrastructure without needing to run any collectors in-cluster.

This new capability provides fully managed Prometheus-compatible monitoring and alerting with Amazon Managed Service for Prometheus. One of the significant benefits is that the collector is fully managed, automatically right-sized, and scaled for your use case. This means you don’t have to run any compute for collectors to collect the available metrics. This helps you optimize metric collection costs to monitor your applications and infrastructure running on EKS.

With this launch, Amazon Managed Service for Prometheus now supports two major modes of Prometheus metrics collection: AWS managed collection, a fully managed and agentless collector, and customer managed collection.

Getting started with Amazon Managed Service for Prometheus Collector
Let’s take a look at how to use AWS managed collectors to ingest metrics using this new capability into a workspace in Amazon Managed Service for Prometheus. Then, we will evaluate the collected metrics in Amazon Managed Service for Grafana.

When you create a new EKS cluster using the Amazon EKS console, you now have the option to enable AWS managed collector by selecting Send Prometheus metrics to Amazon Managed Service for Prometheus. In the Destination section, you can also create a new workspace or select your existing Amazon Managed Service for Prometheus workspace. You can learn more about how to create a workspace by following the getting started guide.

Then, you have the flexibility to define your scraper configuration using the editor or upload your existing configuration. The scraper configuration controls how you would like the scraper to discover and collect metrics. To see possible values you can configure, please visit the Prometheus Configuration page.

Once you’ve finished the EKS cluster creation, you can go to the Observability tab on your cluster page to see the list of scrapers running in your EKS cluster.

The next step is to configure your EKS cluster to allow the scraper to access metrics. You can find the steps and information on Configuring your Amazon EKS cluster.

Once your EKS cluster is properly configured, the collector will automatically discover metrics from your EKS cluster and nodes. To visualize the metrics, you can use Amazon Managed Grafana integrated with your Prometheus workspace. Visit the Set up Amazon Managed Grafana for use with Amazon Managed Service for Prometheus page to learn more.

The following is a screenshot of metrics ingested by the collectors and visualized in an Amazon Managed Grafana workspace. From here, you can run a simple query to get the metrics that you need.

Using AWS CLI and APIs
Besides using the Amazon EKS console, you can also use the APIs or AWS Command Line Interface (AWS CLI) to add an AWS managed collector. This approach is useful if you want to add an AWS managed collector into an existing EKS cluster or make some modifications to the existing collector configuration.

To create a scraper, you can run the following command:

aws amp create-scraper \ 
       --source eksConfiguration="{clusterArn=<EKS-CLUSTER-ARN>,securityGroupIds=[<SG-SECURITY-GROUP-ID>],subnetIds=[<SUBNET-ID>]}" \ 
       --scrape-configuration configurationBlob=<BASE64-CONFIGURATION-BLOB> \ 
       --destination=ampConfiguration={workspaceArn="<WORKSPACE_ARN>"}

You can get most of the parameter values from the respective AWS console, such as your EKS cluster ARN and your Amazon Managed Service for Prometheus workspace ARN. Other than that, you also need to define the scraper configuration defined as configurationBlob.

Once you’ve defined the scraper configuration, you need to encode the configuration file into base64 encoding before passing the API call. The following is the command that I use in my Linux development machine to encode sample-configuration.yml into base64 and copy it onto the clipboard.

$ base64 sample-configuration.yml | pbcopy

Now Available
The Amazon Managed Service for Prometheus collector capability is now available to all AWS customers in all AWS Regions where Amazon Managed Service for Prometheus is supported.

Learn more:

Happy building!
— Donnie

The collective thoughts of the interwebz