Automate deployment of an Amazon QuickSight analysis connecting to an Amazon Redshift data warehouse with an AWS CloudFormation template

Post Syndicated from Sandeep Bajwa original https://aws.amazon.com/blogs/big-data/automate-deployment-of-an-amazon-quicksight-analysis-connecting-to-an-amazon-redshift-data-warehouse-with-an-aws-cloudformation-template/

Amazon Redshift is the most widely used data warehouse in the cloud, best suited for analyzing exabytes of data and running complex analytical queries. Amazon QuickSight is a fast business analytics service to build visualizations, perform ad hoc analysis, and quickly get business insights from your data. QuickSight provides easy integration with Amazon Redshift, providing native access to all your data and enabling organizations to scale their business analytics capabilities to hundreds of thousands of users. QuickSight delivers fast and responsive query performance by using a robust in-memory engine (SPICE).

As a QuickSight administrator, you can use AWS CloudFormation templates to migrate assets between distinct environments from development, to test, to production. AWS CloudFormation helps you model and set up your AWS resources so you can spend less time managing those resources and more time focusing on your applications that run in AWS. You no longer need to create data sources or analyses manually. You create a template that describes all the AWS resources that you want, and AWS CloudFormation takes care of provisioning and configuring those resources for you. In addition, with versioning, you have your previous assets, which provides the flexibility to roll back deployments if the need arises. For more details, refer to Amazon QuickSight resource type reference.

In this post, we show how to automate the deployment of a QuickSight analysis connecting to an Amazon Redshift data warehouse with a CloudFormation template.

Solution overview

Our solution consists of the following steps:

  1. Create a QuickSight analysis using an Amazon Redshift data source.
  2. Create a QuickSight template for your analysis.
  3. Create a CloudFormation template for your analysis using the AWS Command Line Interface (AWS CLI).
  4. Use the generated CloudFormation template to deploy a QuickSight analysis to a target environment.

The following diagram shows the architecture of how you can have multiple AWS accounts, each with its own QuickSight environment connected to its own Amazon Redshift data source. In this post, we outline the steps involved in migrating QuickSight assets in the dev account to the prod account. For this post, we use Amazon Redshift as the data source and create a QuickSight visualization using the Amazon Redshift sample TICKIT database.

The following diagram illustrates flow of the high-level steps.

Prerequisites

Before setting up the CloudFormation stacks, you must have an AWS account and an AWS Identity and Access Management (IAM) user with sufficient permissions to interact with the AWS Management Console and the services listed in the architecture.

The migration requires the following prerequisites:

Create a QuickSight analysis in your dev environment

In this section, we walk through the steps to set up your QuickSight analysis using an Amazon Redshift data source.

Create an Amazon Redshift data source

To connect to your Amazon Redshift data warehouse, you need to create a data source in QuickSight. As shown in the following screenshot, you have two options:

  • Auto-discovered
  • Manual connect

QuickSight auto-discovers Amazon Redshift clusters that are associated with your AWS account. These resources must be located in the same Region as your QuickSight account.

For more details, refer to Authorizing connections from Amazon QuickSight to Amazon Redshift clusters.

You can also manually connect and create a data source.

Create an Amazon Redshift dataset

The next step is to create a QuickSight dataset, which identifies the specific data in a data source you want to use.

For this post, we use the TICKIT database created in an Amazon Redshift data warehouse, which consists of seven tables: two fact tables and five dimensions, as shown in the following figure.

This sample database application helps analysts track sales activity for the fictional TICKIT website, where users buy and sell tickets online for sporting events, shows, and concerts.

  1. On the Datasets page, choose New dataset.
  2. Choose the data source you created in the previous step.
  3. Choose Use custom SQL.
  4. Enter the custom SQL as shown in the following screenshot.

The following screenshot shows our completed data source.

Create a QuickSight analysis

The next step is to create an analysis that utilizes this dataset. In QuickSight, you analyze and visualize your data in analyses. When you’re finished, you can publish your analysis as a dashboard to share with others in your organization.

  1. On the All analyses tab of the QuickSight start page, choose New analysis.

The Datasets page opens.

  1. Choose a dataset, then choose Use in analysis.

  1. Create a visual. For more information about creating visuals, see Adding visuals to Amazon QuickSight analyses.

Create a QuickSight template from your analysis

A QuickSight template is a named object in your AWS account that contains the definition of your analysis and references to the datasets used. You can create a template using the QuickSight API by providing the details of the source analysis via a parameter file. You can use templates to easily create a new analysis.

You can use AWS Cloud9 from the console to run AWS CLI commands.

The following AWS CLI command demonstrates how to create a QuickSight template based on the sales analysis you created (provide your AWS account ID for your dev account):

aws quicksight create-template --aws-account-id  <DEVACCOUNT>--template-id QS-RS-SalesAnalysis-Template --cli-input-json file://parameters.json

The parameter.json file contains the following details (provide your source QuickSight user ARN, analysis ARN, and dataset ARN):

{
    "Name": "QS-RS-SalesAnalysis-Temp",
    "Permissions": [
        {"Principal": "<QS-USER-ARN>", 
          "Actions": [ "quicksight:CreateTemplate",
                       "quicksight:DescribeTemplate",                   
                       "quicksight:DescribeTemplatePermissions",
                       "quicksight:UpdateTemplate"         
            ] } ] ,
     "SourceEntity": {
       "SourceAnalysis": {
         "Arn": "<QS-ANALYSIS-ARN>",
         "DataSetReferences": [
           {
             "DataSetPlaceholder": "sales",
             "DataSetArn": "<QS-DATASET-ARN>"
           }
         ]
       }
     },
     "VersionDescription": "1"
    }

You can use the AWS CLI describe-user, describe_analysis, and describe_dataset commands to get the required ARNs.

To upload the updated parameter.json file to AWS Cloud9, choose File from the tool bar and choose Upload local file.

The QuickSight template is created in the background. QuickSight templates aren’t visible within the QuickSight UI; they’re a developer-managed or admin-managed asset that is only accessible via the AWS CLI or APIs.

To check the status of the template, run the describe-template command:

aws quicksight describe-template --aws-account-id <DEVACCOUNT> --template-id "QS-RS-SalesAnalysis-Temp"

The following code shows command output:

Copy the template ARN; we need it later to create a template in the production account.

The QuickSight template permissions in the dev account need to be updated to give access to the prod account. Run the following command to update the QuickSight template. This provides the describe privilege to the target account to extract details of the template from the source account:

aws quicksight update-template-permissions --aws-account-id <DEVACCOUNT> --template-id “QS-RS-SalesAnalysis-Temp” --grant-permissions file://TemplatePermission.json

The file TemplatePermission.json contains the following details (provide your target AWS account ID):

[
  {
    "Principal": "arn:aws:iam::<TARGET ACCOUNT>",
    "Actions": [
      "quicksight:UpdateTemplatePermissions",
      "quicksight:DescribeTemplate"
    ]
  }
]

To upload the updated TemplatePermission.json file to AWS Cloud9, choose the File menu from the tool bar and choose Upload local file.

Create a CloudFormation template

In this section, we create a CloudFormation template containing our QuickSight assets. In this example, we use a YAML formatted template saved on our local machine. We update the following different sections of the template:

  • AWS::QuickSight::DataSource
  • AWS::QuickSight::DataSet
  • AWS::QuickSight::Template
  • AWS::QuickSight::Analysis

Some of the information required to complete the CloudFormation template can be gathered from the source QuickSight account via the describe AWS CLI commands, and some information needs to be updated for the target account.

Create an Amazon Redshift data source in AWS CloudFormation

In this step, we add the AWS::QuickSight::DataSource section of the CloudFormation template.

Gather the following information on the Amazon Redshift cluster in the target AWS account (production environment):

  • VPC connection ARN
  • Host
  • Port
  • Database
  • User
  • Password
  • Cluster ID

You have the option to create a custom DataSourceID. This ID is unique per Region for each AWS account.

Add the following information to the template:

Resources:
  RedshiftBuildQSDataSource:
    Type: 'AWS::QuickSight::DataSource'
    Properties:  
      DataSourceId: "RS-Sales-DW"      
      AwsAccountId: !Sub ${AWS::ACCOUNT ID}
      VpcConnectionProperties:
        VpcConnectionArn: <VPC-CONNECTION-ARN>      
      Type: REDSHIFT   
      DataSourceParameters:
        RedshiftParameters:     
          Host: "<HOST>"
          Port: <PORT>
          Clusterid: "<CLUSTER ID>"
          Database: "<DATABASE>"    
      Name: "RS-Sales-DW"
      Credentials:
        CredentialPair:
          Username: <USER>
          Password: <PASSWORD>
      Permissions:

Create an Amazon Redshift dataset in AWS CloudFormation

In this step, we add the AWS::QuickSight::DataSet section in the CloudFormation template to match the dataset definition from the source account.

Gather the dataset details and run the list-data-sets command to get all datasets from the source account (provide your source dev account ID):

aws quicksight list-data-sets  --aws-account-id <DEVACCOUNT>

The following code is the output:

Run the describe-data-set command, specifying the dataset ID from the previous command’s response:

aws quicksight describe-data-set --aws-account-id <DEVACCOUNT> --data-set-id "<YOUR-DATASET-ID>"

The following code shows partial output:

Based on the dataset description, add the AWS::Quicksight::DataSet resource in the CloudFormation template, as shown in the following code. Note that you can also create a custom DataSetID. This ID is unique per Region for each AWS account.

QSRSBuildQSDataSet:
    Type: 'AWS::QuickSight::DataSet'
    Properties:
      DataSetId: "RS-Sales-DW" 
      Name: "sales" 
      AwsAccountId: !Sub ${AWS::ACCOUNT ID}
      PhysicalTableMap:
        PhysicalTable1:          
          CustomSql:
            SqlQuery: "select sellerid, username, (firstname ||' '|| lastname) as name,city, sum(qtysold) as sales
              from sales, date, users
              where sales.sellerid = users.userid and sales.dateid = date.dateid and year = 2008
              group by sellerid, username, name, city
              order by 5 desc
              limit 10"
            DataSourceArn: !GetAtt RedshiftBuildQSDataSource.Arn
            Name"RS-Sales-DW"
            Columns:
            - Type: INTEGER
              Name: sellerid
            - Type: STRING
              Name: username
            - Type: STRING
              Name: name
            - Type: STRING
              Name: city
            - Type: DECIMAL
              Name: sales                                     
      LogicalTableMap:
        LogicalTable1:
          Alias: sales
          Source:
            PhysicalTableId: PhysicalTable1
          DataTransforms:
          - CastColumnTypeOperation:
              ColumnName: sales
              NewColumnType: DECIMAL
      Permissions:
        - Principal: !Join 
            - ''
            - - 'arn:aws:quicksight:'
              - !Ref QuickSightIdentityRegion
              - ':'
              - !Ref 'AWS::AccountId'
              - ':user/default/'
              - !Ref QuickSightUser
          Actions:
            - 'quicksight:UpdateDataSetPermissions'
            - 'quicksight:DescribeDataSet'
            - 'quicksight:DescribeDataSetPermissions'
            - 'quicksight:PassDataSet'
            - 'quicksight:DescribeIngestion'
            - 'quicksight:ListIngestions'
            - 'quicksight:UpdateDataSet'
            - 'quicksight:DeleteDataSet'
            - 'quicksight:CreateIngestion'
            - 'quicksight:CancelIngestion'
      ImportMode: DIRECT_QUERY

You can specify ImportMode to choose between Direct_Query or Spice.

Create a QuickSight template in AWS CloudFormation

In this step, we add the AWS::QuickSight::Template section in the CloudFormation template, representing the analysis template.

Use the source template ARN you created earlier and add the AWS::Quicksight::Template resource in the CloudFormation template:

QSTCFBuildQSTemplate:
    Type: 'AWS::QuickSight::Template'
    Properties:
      TemplateId: "QS-RS-SalesAnalysis-Temp"
      Name: "QS-RS-SalesAnalysis-Temp"
      AwsAccountId:!Sub ${AWS::ACCOUNT ID}
      SourceEntity:
        SourceTemplate:
          Arn: '<SOURCE-TEMPLATE-ARN>'          
      Permissions:
        - Principal: !Join 
            - ''
            - - 'arn:aws:quicksight:'
              - !Ref QuickSightIdentityRegion
              - ':'
              - !Ref 'AWS::AccountId'
              - ':user/default/'
              - !Ref QuickSightUser
          Actions:
            - 'quicksight:DescribeTemplate'
      VersionDescription: Initial version - Copied over from AWS account.

Create a QuickSight analysis

In this last step, we add the AWS::QuickSight::Analysis section in the CloudFormation template. The analysis is linked to the template created in the target account.

Add the AWS::Quicksight::Analysis resource in the CloudFormation template as shown in the following code:

QSRSBuildQSAnalysis:
    Type: 'AWS::QuickSight::Analysis'
    Properties:
      AnalysisId: 'Sales-Analysis'
      Name: 'Sales-Analysis'
      AwsAccountId:!Sub ${AWS::ACCOUNT ID}
      SourceEntity:
        SourceTemplate:
          Arn: !GetAtt  QSTCFBuildQSTemplate.Arn
          DataSetReferences:
            - DataSetPlaceholder: 'sales'
              DataSetArn: !GetAtt QSRSBuildQSDataSet.Arn
      Permissions:
        - Principal: !Join 
            - ''
            - - 'arn:aws:quicksight:'
              - !Ref QuickSightIdentityRegion
              - ':'
              - !Ref 'AWS::AccountId'
              - ':user/default/'
              - !Ref QuickSightUser
          Actions:
            - 'quicksight:RestoreAnalysis'
            - 'quicksight:UpdateAnalysisPermissions'
            - 'quicksight:DeleteAnalysis'
            - 'quicksight:DescribeAnalysisPermissions'
            - 'quicksight:QueryAnalysis'
            - 'quicksight:DescribeAnalysis'
            - 'quicksight:UpdateAnalysis'      

Deploy the CloudFormation template in the production account

To create a new CloudFormation stack that uses the preceding template via the AWS CloudFormation console, complete the following steps:

  1. On the AWS CloudFormation console, choose Create Stack.
  2. On the drop-down menu, choose with new resources (standard).
  3. For Prepare template, select Template is ready.
  4. For Specify template, choose Upload a template file.
  5. Save the provided CloudFormation template in a .yaml file and upload it.
  6. Choose Next.
  7. Enter a name for the stack. For this post, we use QS-RS-CF-Stack.
  8. Choose Next.
  9. Choose Next again.
  10. Choose Create Stack.

The status of the stack changes to CREATE_IN_PROGRESS, then to CREATE_COMPLETE.

Verify the QuickSight objects in the following table have been created in the production environment.

QuickSight Object Type Object Name (Dev) Object Name ( Prod)
Data Source RS-Sales-DW RS-Sales-DW
Dataset Sales Sales
Template QS-RS-Sales-Temp QS-RS-SalesAnalysis-Temp
Analysis Sales Analysis Sales-Analysis

The following example shows that Sales Analysis was created in the target account.

Conclusion

This post demonstrated an approach to migrate a QuickSight analysis with an Amazon Redshift data source from one QuickSight account to another with a CloudFormation template.

For more information about automating dashboard deployment, customizing access to the QuickSight console, configuring for team collaboration, and implementing multi-tenancy and client user segregation, check out the videos Virtual Admin Workshop: Working with Amazon QuickSight APIs and Admin Level-Up Virtual Workshop, V2 on YouTube.


About the author

Sandeep Bajwa is a Sr. Analytics Specialist based out of Northern Virginia, specialized in the design and implementation of analytics and data lake solutions.

Невинни по Гешев, корумпирани по „Магнитски“

Post Syndicated from Емилия Милчева original https://www.toest.bg/nievinni-po-gieshiev-korumpirani-po-maghnitski/

Невинни по Гешев, корумпирани по „Магнитски“

Всичко в държавата вървеше по радевпеевскиборисовгешев, когато вторият списък със санкционирани заради корупция български граждани по Глобалния акт „Магнитски“ развали карето. Осем българи от общо десет европейски граждани, санкционирани по „Магнитски“, накараха България да изглежда като европейската Сомалия (най-корумпираната африканска държава). Корупцията е свързана с договори в енергетиката, законодателни манипулации в услуга на олигарси и подкупи в съдебната система.

След хазартния бос Васил Божков, олигарха депутат от ДПС Делян Пеевски и свързания също с ДПС Илко Желязков този път американското Министерство на финансите санкционира финансовия министър на Бойко Борисов (2014–2020) Владислав Горанов, свързаните с ядрената енергетика Румен Овчаров, който е и бивш енергиен министър на БСП, Иван Генов и Александър Николов. Петият е обвиненият в шпионаж Николай Малинов, награден с орден „Дружба“ от руския президент Путин.

Край на номерата

Вече не могат да се правят на абдали, както преди години казал главният прокурор на Бойко Борисов, а той – на свой приближен:

И накрая Гешев вика: „Абе, аз обичам се пра’им на луд, ама вие, г-н премиер, май се праи’те много успешно.“

Всички тарикатлъци са изпробвани.

Борисов реже с тъп нож пъпната връв с лицето „Влади“ Горанов. Гешев е в ступор – не е отронил и дума. Може би устата му още е пълна с американски пай от молитвената закуска в Белия дом. Няма как отново да каже, че не е задължително законът „Магнитски“ да води до наказателноправен ефект в България, тъй като е американски инструмент. Такова беше обяснението му миналото лято, когато бяха прекратени проверките срещу Пеевски и Желязков.

В опит да разхвали Шефа прокуратурата обяви, че санкциите били резултат от визитата му, за която по-рано беше съобщила, че е частна. Толкова плосък пиар, че дори за меме не става. Тази седмица се появи и позиция, повтаряща в основни линии коментара, който заместник главният прокурор и шеф на следствието Борислав Сарафов направи след новината за втория списък със санкции по „Магнитски“.

Не било работа само на прокуратурата да се бори с корупцията, а и на изпълнителната и законодателната власт. Разкриването на престъпленията било от компетентността на органите на МВР и службите за сигурност, които при установяване на данни за престъпление следва да я уведомяват. Има и дълго обяснение какво е свършено по лицата от първия и втория списък и че ОАЕ не са изпълнили молбата за правна помощ, пратена през април 2022 г., за разпит на Васил Божков чрез видеоконферентна връзка.

На Горанов е посветено едно-единствено изречение – че има образувано досъдебно производство. За Пеевски и Желязков, както е ясно от миналата година, не са били открити данни за извършени престъпления в информацията, „постъпила от ГДБОП, ГДНП, ДАНС, КПКОНПИ, НАП, Агенция по вписванията и други държавни органи“. Чисти като сълза.

Най-вероятно Пеевски вече е разбрал, че няма да му се получи с делата и наетите за „избелването“ му лобисти в САЩ. Като се прибави и решението на Великобритания да му наложи санкции (също и на Божков и Желязков), с което отрязва достъпа до финансовата си система, вкл. офшорни юрисдикции, облаците се сгъстяват. Тримата са първите европейци, които Лондон определя като рискови заради тежка корупция. Те, както обясни британският посланик Роб Диксън в „120 минути“ по bTV, няма да могат да минават дори транзитно през Великобритания.

Опияненият от властта си президент много внимателно артикулира позиция по темата „Магнитски“, избягвайки оценка за българската корупция, която толкова критикуваше в началото на първия си мандат, а паметта му за главния прокурор, чиято оставка искаше през 2020 г., е все така отслабена. За Радев „войнолюбците“ и недопускането на военна подкрепа за Украйна са по-важни теми от „Магнитски 2“. Нямаше как да избегне обаче очевадното – че санкциите са „силен политически сигнал“.

Срамно за държавата

С какво корупцията в една толкова малка държава като България пречи на най-голямата икономика в света? Корупцията, свързана и с влиянието на Кремъл, отслабва държавата и способностите ѝ на евроатлантически партньор в такъв стратегически район, а следователно – и на съюзниците.

В интервю по БНР Джеймс О’Брайън – ръководител на Службата за координация на санкциите в администрацията на президента Джо Байдън, обясни, че целта на санкциите е да подсили избора на България, който задълбочава нейната интеграция в Европа и сътрудничеството със световните компании, както и диверсификацията на енергийните източници.

Освен че отслабва държавността, корупцията краде от всеки български гражданин.

Губим национално богатство, всеки от нас губи стойност – от труда си, от онова, което притежаваме, защото България не може да привлича инвестиции, защото е страна с висок политически риск, защото е страна, в която няма правосъдие,

коментира в предаването „Лице в лице“ по bTV съпредседателят на „Демократична България“ Христо Иванов.

Външната намеса в българското правосъдие е срам за държавата. „Откъде накъде в САЩ ще пипат българските крадци, България да не им е колония, да си ловят техните!“, надигнаха се противници, които, по съвпадение, са и русофили. Но при липсата на безпристрастно следствие и прокуратура и при наличието на зависим Висш съдебен съвет и на подчинени институции единственото, което остава, е политическата воля за съдебна реформа.

Някои от политическите сили обаче ще трябва да бъдат принудени да участват – и затова санкциите са безапелационни. Споменаването за първи път в тях на конкретни суми от корупция, скрити в офшорни сметки (5 млн. евро за Румен Овчаров, 5 млн. лв. за Александър Николов), не е случайно. То може да се разчете единствено като „Внимавайте, разполагаме с достатъчно информация!“.

Служебният кабинет се опита да „приспи“ темата за голямата корупция – визитна картичка на няколко управления, съсредоточавайки огъня върху някои грешки, допуснати от управлявалото половин година правителство на Кирил Петков. Но в мотивите за санкциите по „Магнитски“ се крият десетки обвинителни актове. Стига прокуратурата да заработи ефективно и най-сетне да свърши нещо, което твърди, че няма как да извърши, макар Наказателно-процесуалният кодекс да го предвижда – да разпита Васил Божков чрез видеоконферентна връзка.

Същият Божков, който твърди, че е изтеглил 67 млн. лв. кеш от банка, за да ги раздаде като подкупи – „бях точен с парите“. Същият, заради когото мотивите по „Магнитски“ обвързват Горанов и Пеевски – вторият е уредил законодателни промени в полза на хазартния бизнес, от които хазната е загубила близо 600 млн. лв. за пет години.

Избори по „Магнитски“

Несъмнено санкциите по „Магнитски“ ще засегнат най-силно ГЕРБ, независимо от яростните опити за оттласкване от Владислав Горанов. Но дали само той е единственият виновник за законодателното уреждане на моментните лотарии?

Игрите със ставките за хазарта, облагодетелстващи лотариите на Божков, тръгват от едно законодателно предложение на Йордан Цонев (ДПС) и Петър Кънев (БСП) през 2013 г. и продължават с редакции от БСП и ГЕРБ в следващия парламент. Всеки път, когато гласуват някоя законодателна промяна по тях, депутатите, все едно от коя партия, неизменно пропускат да дефинират какво точно са игрите, при които се събират такси и/или комисиони за участие.

Така най-масовите хазартни игри, като традиционната и моментната лотария, се оказват облагодетелствани и дори за известно време извън облагане – за разлика от Държавния спортен тотализатор, който плаща по-високи данъци от частните си конкуренти. Като министър на финансите Горанов пропуска да забележи тази врата у поле, не я забелязва и Държавната комисия по хазарта. Но „вратата“ е сложена там със съдействието на депутати от три партии.

Резултатът е тези близо 600 млн. лв., които, вместо да влязат в бюджета, отиват в частни сметки – а част от тях за подкупи. Всъщност сумата е над 700 млн. лв. (с лихвите), както обясни Горанов през 2020 г., когато избухна скандалът. По-късно той напусна поста министър на финансите заедно с още двама министри – на икономиката и на вътрешните работи, с мотива, че от ГЕРБ искат да бъдат опровергани твърденията за връзките им с ДПС и Пеевски. А на следващите избори извън листите на ГЕРБ остана и Менда Стоянова.

Напрежението в ГЕРБ расте, тъй като в партията си дават ясно сметка, че шансовете за политическо бъдеще се повишават, ако Борисов не е лидер. Преди парламентарните избори на 2 април никой не мисли за промени, които биха предизвикали сътресения (независимо че имат подръка хартиените бюлетини). Но след парламентарния вот предстои и местен наесен, а в промеждутъка не е ясно каква уличаваща информация би могла да се появи.

Горанов едва ли ще стои със скръстени ръце и опасенията да не проговори са силни. Както беше казал в един разговор с покойния шеф на митниците Ваньо Танов, огласен през януари 2011 г.,

няма такова нещо като конфликт на интереси, интересите винаги са в синхрон, не са в конфликт.

Вярвам, че ще докаже своята невинност, заяви лидерът на ГЕРБ, след като стана известна новината за втория списък санкционирани по „Магнитски“. Но може и на Борисов да се наложи да я доказва.

За русофилска партия като БСП санкционираният Овчаров, макар и член на Националния съвет, не е особен проблем и причината за това не са тежките скандали с изключени и напуснали. Лидерката на социалистите Корнелия Нинова дължи началото на своята политическа кариера в БСП именно на Овчаров.

Новите санкции за Пеевски от Лондон няма да накърнят преизбирането му като депутат от ДПС. Лидерът на ДПС Мустафа Карадайъ се надява той пак да е в листите – ако има достатъчно номинации. „За две години ние не видяхме факти за Пеевски, свързани със санкциите по „Магнитски“. Осланяме се на върховенството на закона – невинен до доказване на противното. Той обжалва в САЩ административния акт“, каза Карадайъ при внасяне на документите за регистрация на партията за предстоящия вот.

Седнали да играят белотче в Дубай Васил Божков, Бойко Борисов, Владислав Горанов и Делян Пеевски… Това вече не може да е краят на историята. Тази история ще има друг край, защото и това каре се развали.

Колаж: Тоест
Използвани снимки:
Владислав Горанов – Raul Mee (EU2017EE)/flickr.com
Румен Овчаров – скрийншот/btv.bg
Бойко Борисов – EU2017EE Estonian Presidency/Wikimedia
Делян Пеевски – parliament.bg
Васил Божков – скрийншот/пресконференция на Васил Божков

Security updates for Thursday

Post Syndicated from original https://lwn.net/Articles/923503/

Security updates have been issued by Debian (firefox-esr), Fedora (community-mysql, edk2, firefox, and git), Slackware (curl and git), SUSE (apache2-mod_security2, aws-efs-utils, bind, curl, git, ImageMagick, java-11-openjdk, java-17-openjdk, java-1_8_0-openjdk, kernel, libksba, and mozilla-nss), and Ubuntu (golang-golang-x-text, golang-x-text, linux-aws, linux-aws-5.15, linux-azure-fde, linux-gcp, linux-gcp-5.15,
linux-intel-iotg, linux-aws-5.4, linux-gcp, linux-gcp-5.4, linux-hwe-5.4, linux-ibm,
linux-ibm-5.4, linux-oracle-5.4, linux-gke, linux-gke-5.15, nss, and xorg-server, xorg-server-hwe-16.04).

ChatGPT Is Ingesting Corporate Secrets

Post Syndicated from Bruce Schneier original https://www.schneier.com/blog/archives/2023/02/chatgpt-is-ingesting-corporate-secrets.html

Interesting:

According to internal Slack messages that were leaked to Insider, an Amazon lawyer told workers that they had “already seen instances” of text generated by ChatGPT that “closely” resembled internal company data.

This issue seems to have come to a head recently because Amazon staffers and other tech workers throughout the industry have begun using ChatGPT as a “coding assistant” of sorts to help them write or improve strings of code, the report notes.

[…]

“This is important because your inputs may be used as training data for a further iteration of ChatGPT,” the lawyer wrote in the Slack messages viewed by Insider, “and we wouldn’t want its output to include or resemble our confidential information.”

Ба(ла)клава за всеки вкус

Post Syndicated from original https://www.toest.bg/ba-la-klava-za-vseki-vkus/

Ба(ла)клава за всеки вкус

В първия момент, щом го зървам във фийда си, заглавието от Vogue Scandinavia ме озадачава – нима баклавата не е винаги актуална?! Нима за нея може да има сезони, та да е нужно да се провъзгласява, че остава на мода и тази година? При по-внимателно вглеждане обаче разбирам, че в бързината съм пропуснала една сричка и заглавието всъщност гласи: The balaclava is here to stay in 2023. Тоест

не било баклава, а балаклава.

Статията обявява т.нар. балаклава – нещо средно между плетена качулка и шапка с яка – за модния хит на сезона. В началото на февруари, освен върху главите на много от посетителите на Седмицата на модата в Копенхаген, с подобен модел шапко-качулка (на непознатия ми до този момент бранд Gunia) – в бежово и с връзки под брадичката – е забелязана и Лили Колинс, главната актриса в сериала „Емили в Париж“, да се разхожда по улиците на снежен Стокхолм.

Според друга статия на сайта на CNN пък задаването на въпроса „как се плете балаклава“ в Google се е увеличило с 5000% в рамките на 2022 г., а само между началото на ноември и края на декември търсенето на аксесоара е скочило с 230%. Бърза проверка показва, че в момента в Instagram има 339 000 изображения, отбелязани с хаштаг #balaclava, и още 147 000 с #balaklava. (И все пак, дори и заедно, те все още са далеч от 2,2-та милиона изображения с хаштага #baklava.)

Като поредния пример за постоянното рециклиране на модни тенденции (лично аз имам спомен за такъв модел шапко-шалове, тогава известни като „ски маски“ или „кюнци“, още от 80-те, когато ми се струваха безнадеждно смотани), балаклавата не ми е особено интересна като „сарториален“ аксесоар, а и продължава да не е по вкуса ми, но за сметка на това ми се струва доста любопитна от лингвистична, историческа и географска гледна точка.

Самата аз чух думата „балаклава“ за първи път през 2012 г., покрай арестите на членовете на групата Pussy Riot след протестното им изпълнение в московската катедрала „Христос Спасител“. Отличителният белег и запазена марка на групата, както знаем, са въпросните балаклави в ярки цветове. За разлика от тези на модните последователи в Копенхаген, които остават лицето непокрито, балаклавите на жените от Pussy Riot са с дупки за очите и устата и служат не за да държат топло, а за да скрият самоличността на носещите ги. С такава цел, разбира се, подобни шапко-маски в днешно време се използват както от престъпници, така и от спецотряди и други пазители на реда, а в миналото са носени от нинджи и тем подобни криминални субекти¹.

Чак след уверението от скандинавския Vogue, че балаклавата „никъде няма да си ходи“, решавам все пак да се поразровя за произхода ѝ. С голяма изненада разбирам, че

не само не било баклава, а балаклава, ами и корените ѝ не били криминални, а кримски.

Оказва се, че наименованието на така модерния аксесоар датира още от ХIХ век и е взето назаем от тогавашния град (сегашен квартал на Севастопол) със същото име² в Крим³. В опит да се предпазят от големия зимен студ, британските войници, сражаващи се в Кримската война (1853–1856), носят именно такива ръчно плетени и изпратени им специално от дома шапко-шалове под каските си. Ето че изборът на бранда Gunia от страна на Лили Колинс, макар вероятно да е случаен, се оказва доста удачен – въпросната марка е украинска и цели промоцията и опазването на украинските традиционни занаяти⁴.

Не съвсем неуместна се оказва и моята първоначална асоциация с баклавата,

тъй като една от версиите за етимологията на името на град Балаклава е именно от турски език – някои източници твърдят, че то произлиза от balık („риба“⁵) и yuva („гнездо“), а други го свързват с думата balıklaga, тоест „добро място за риболов“, като и двете версии се базират на изобилието от риба в едноименния залив, където се намира градът. Това изобилие е отразено и от третата теория за произхода на името, според която то идва от кримскотатарски език, на който изразът balıqlı ava буквално означава „рибно време“⁶.

А и връзката с етимологията на самата баклава може би не е толкова далечна – твърди се, че думата произлиза от монголския корен baγla- (от своя страна тюркска заемка), чието значение „връзвам, увивам, наслоявам“ освен свойствата на баклавата всъщност доста добре описва и функциите на балаклавата, чиито връзки връзваме под брадичката и с която увиваме главата си.

И докато в днешно време е възможно човек да обърка баклавата с вид шапка, в миналото объркването е можело да бъде от съвсем различно естество: кулинарните историци смятат един древноримски сладкиш от наслоени кори с медена заливка, рецептата за който датира от II век пр.Хр., за вероятен предшественик на баклавата. Латинското му название, произлизащо от древногръцката дума πλακόεις (plakóeis, тоест „плоско“), означава „плосък сладкиш“, или иначе казано – placenta.

¹ Модните анализатори обясняват сегашната популярност на балаклавата сред „цивилното“ население като резултат от пандемията, през която свикнахме част от лицата ни да са покрити.

² Въпреки че името на селището и наименованието на модния аксесоар са идентични, с латиница те се изписват различно: мястото е Balaklava, a шапката е balaclava. В гореспоменатите хаштагове в Instagram обаче се използват и двете изписвания, за да отбелязват почти изцяло изображения на шапки, с много малки изключения на снимки от града.

³ През втората половина на ХIХ век наименованието Балаклава е дадено на редица градове, улици и други локации в англоезични държави, сред които Великобритания, Канада, Австралия, Нова Зеландия, а даже и Ямайка.

⁴ Скандинавският Vogue определя аксесоара на главата на Лили Колинс като балаклава, но за да сме точни, трябва да отбележим, че на сайта на Gunia този модел с връзки под брадичката се казва „плетена вълнена шапка“. Брандът все пак предлага и съвсем класическа плетена балаклава в червен или сив меланж.

⁵ Българската дума „балък“, макар и с доста променено значение, произлиза точно от турската дума за „риба“ (balık).

⁶ На кримскотатарски обаче името на града няма как да бъде объркано с баклавата, тъй като там тя е известна като „пахлава“.

В рубриката „От дума на дума“ Екатерина Петрова търси актуални, интересни или новопоявили се думи от нашето ежедневие и проследява често изненадващия им произход, развитието на значенията им във времето и взаимовръзките им с близки и далечни езици.

На второ четене: „Светът от вчера“

Post Syndicated from Стефан Иванов original https://www.toest.bg/na-vtoro-chetene-2/

„Светът от вчера“ от Стефан Цвайг

На второ четене: „Светът от вчера“

превод от немски Даря Хараланова, изд. „Аквариус“, 2021

Една натрапчива мисъл ми правеше компания през цялото време, докато четях книгата – какво точно да напиша и какви причини и аргументи да изтъкна, за да я прочетат повече хора днес, когато за пореден път можем да говорим за „света от вчера“. Преди войната и преди пандемията.

Първо, може би че Цвайг е добре познат писател както на днешните български читатели, така и на тези далеч преди 9 септември 1944-та. А първият превод на автобиографията му е именно от тази година и е излязъл в легендарната поредица „Златни зърна“ в превод на Живка Драгнева. Вторият превод, на Анна Лилова, е от 1989-та, друга твърде важна година. Настоящият отново излиза в ключов момент и според мен е най-добрата възможна версия досега.

Второ,

в един период от време Цвайг е най-превежданият писател в света.

Трето, той е вдъхновението зад „Грандхотел „Будапеща“ на Уес Андерсън.

Четвърто, книгата е преобърната версия на приказките от „Хиляда и една нощ“. Цвайг е сам на себе си и Шехерезада, и Шахриар. В момента, когато разказът му стига до началото на Втората световна война, той слага край на историята и на живота си.

Пето, критикуван е посмъртно от Томас Ман, че пише бестселъри, което, поне за мен, е по-скоро похвала. Цвайг продължава да бъде изключително достъпен, ясен и четивен.

Шесто, критикуван е посмъртно от Хана Аренд, че не е написал мемоарите си с по-висока температура на политическата позиция, а именно това е едно от достойнствата на книгата. Цвайг разказва субективно и лично, споделя спомени за всекидневието, за средата и обкръжението си и на десетки места ясно заема позиция, хуманна и пацифистка. Но ако беше направил това, което Аренд желае от него – да детонира словесни и реторични бомби, – то книгата щеше да бъде, почти със сигурност, по-лоша. Да, полемична, но не и толкова полезна или интересна за бъдещите поколения читатели. Многообразието ѝ щеше сериозно да пострада.

Седмо, Томас Бернхард и Стефан Цвайг на пръв поглед нямат нищо общо, но са симетрично и диаметрално противоположни, полюси. Това, което Цвайг иска да припомни и съхрани, това, което болезнено му липсва и по което изпитва самоунищожителна носталгия, липсващото, което го убива постепенно, е същото, срещу което Бернхард воюва в цялото си творчество – виенският свят на спокойствието и сигурността. Важно беше за мен да прочета и тази гледна точка, тази неискана пледоария, която всъщност с лекота устоява на виртуозните атаки на Бернхард с помощта на последователна и щедра човещина.

Осмо, да, това е нещо повече от автобиография. Тъга по изгубено време е, по изчезнали ценности, по изчезнала толерантност и отишъл, та се не видял хуманизъм. Това е безкрайно писмо на бъдещ самоубиец, който не може и не иска да живее в света на все още непобедения Хитлер. И в Европа, разкъсвана от варварство, омраза, убийства и война.

Девето,

книгата е фатално съвременна.

Неслучайно Салман Рушди пише, че „времето на забрава за Цвайг вече свърши, хубаво е той отново да е тук“. Книгите му заслужават да бъдат четени отново и отново, докато урокът бъде научен. Един пример: Полковник Редл, най-високопоставеният шеф на шпионажа на австрийската армия, бил същевременно платен агент на руския Генерален щаб. Той не само издавал тайните и плановете за нападение: сега изведнъж станало ясно защо всички изпратени през последната година от него австрийски шпиони в Русия са били арестувани един след друг и осъдени.

Десето, това е най-добрият панорамен и детайлен портрет на културния живот на Европа преди Първата и Втората световна война, който съм чел. Цвайг е бил близък и е познавал много хора – той разказва за Хофманстал и Рилке, Ромен Ролан и Фройд, Малер и Роден, Реноар и Салвадор Дали, Жид, Йейтс, Пирандело, Пол Валери, Верхарен, Джеймс Енсор, Горки, Кроче, Джойс и още, и още. Прави впечатление не само колко лесно, открито и интензивно са общували помежду си писатели, художници, композитори и музиканти, но и колко лишени от грандомания, егоизъм и суета са били.

На второ четене: „Светът от вчера“

Единайсето, книгата може да бъде четена като роман за съзряване, критика на една закостеняла и консервативна образователна система, наръчник по теория и практика на творческия процес, политическа история, история на произхода на нацизма, социален анализ, история на нравите и сексуалността от първата половина на миналия век.

Дванайсето, това е и изповед на един обсебен колекционер на ръкописи, притежавал и после изгубил заради войните: записки с огледален шрифт на Леонардо, обръщение на Наполеон, цял роман на Балзак, „Раждането на трагедията“ на Ницше, кантата на Бах, арии на Глук и Хендел и още – ръкописи на Брамс, Шопен, Шуберт, Хайдн, Моцарт и Гьоте.

Тринайсето,

приликите между днешния имперски „русский мир“ на Путин и нацисткото завоевателско „жизнено пространство“ болезнено се набиват на очи

и за да не се повтарят отново и отново тези катастрофални и убийствени грешки, е нужно те да се познават. Поне за мен няма по-добър техен разказвач от Цвайг. Австриец, евреин, писател, хуманист и пацифист, човек, лишен от родина.

Четиринайсето, историята обича съвпаденията, особено в трагедиите. Войната в Украйна започна на 24 февруари миналата година. Цвайг и съпругата му слагат край на живота си на 23 февруари 1942 г. Три години и половина преди края на Втората световна война. Дано настоящата агресия и война свършат много по-скоро. И дано се окаже, че историята не обича толкова много съвпаденията.

За петнайсета причина и аргумент думата има самият Цвайг:

Израснах във Виена, тази наднационална столица на две хиляди години, която бях принуден да напусна като престъпник, преди да бъде понижена в провинциален германски град. Моите произведения на езика, на който съм ги написал, бяха превърнати в пепел в същата тази страна, където си бяха спечелили милиони читатели. Така че аз към никого повече не принадлежа, чужд съм навсякъде и в най-добрия случай съм гост; дори същинската родина, която сърцето ми си избра, Европа, е изгубена за мен, откакто за втори път самоубийствено се разкъсва в братска война. Против волята си станах свидетел на най-ужасното поражение на разума и на най-дивашкия за цялата писана история триумф на бруталността; никога – отбелязвам това съвсем не с гордост, a със срам – нито едно поколение не е претърпявало такова морално падение от такива духовни висоти както нашето. Само за краткия интервал от време, откакто ми набоде брада, а сега започва да побелява, в това само половин столетие се случиха повече радикални преобразования и промени, отколкото в продължение на десет поколения, и – чувства го всеки от нас: като че ли прекалено много!


Активните дарители на „Тоест“ получават постоянна отстъпка в размер на 20% от коричната цена на всички заглавия от каталога на „Аквариус“, както и на няколко други български издателства в рамките на партньорската програма Читателски клуб „Тоест“. За повече информация прочетете на toest.bg/club.

Никой от нас не чете единствено най-новите книги. Тогава защо само за тях се пише? „На второ четене“ е рубрика, в която отваряме списъците с книги, публикувани преди поне година, четем ги и препоръчваме любимите си от тях. Рубриката е част от партньорската програма Читателски клуб „Тоест“. Изборът на заглавия обаче е единствено на авторите – Стефан Иванов и Севда Семер, които биха ви препоръчали тези книги и ако имаше как веднъж на две седмици да се разходите с тях в книжарницата.

Регенерацията на органи – на една (регенерирана) ръка разстояние

Post Syndicated from original https://www.toest.bg/regeneratsiyata-na-organi-na-edna-regenerirana-ryka-razstoiyanie/

Регенерацията на органи – на една (регенерирана) ръка разстояние

Дали човешкото тяло има възможност да се самолекува? Този въпрос отдавна е напуснал полето на научната фантастика и стои в основата на всички разработки в областта на регенеративната медицина. Съществуват всякакви причини за загуба на орган или тъкан – стареене, хронични болести, механично нарушение, вроден дефект. Работата на учените е да изследват възможностите за лечение и възобновяване на тъкани и органи, за да подобрим качеството и продължителността на живота си.

И макар че бозайниците не могат да регенерират органите си напълно, трябва да се знае, че от всяко правило има изключения. Бодлокожата мишка от род Acomys е забележителен представител, защото може да регенерира кожата и козината си изцяло, след като успее да избяга от хищника, който е успял да ги нарани. Други моделни животни (за лабораторни експерименти), чрез които се изследва регенерацията, са плоскоклетъчният червей от род Планария, декоративната аквариумна риба, позната като Данио (Zebrafish), и земноводният саламандър аксолотъл (Ambystoma mexicanum). За него ще поговорим малко повече днес.

Шампионът на регенерацията

Уникалността на аксолотлите сред гръбначните животни се дължи на способността им да извършват пълна регенерация на крайниците и гръбначния си мозък дори при възрастни индивиди. Те могат да регенерират и ресните (орган за дишане), които се намират от двете страни на главата им, ретината на очите, челюстите и редица вътрешни органи.

В природата крайниците на аксолотлите могат да бъдат многократно „ампутирани“ от различни видове хищници, след което настъпва регенерацията. Изучаването на механизмите, участващи в процеса, е най-удобно именно при крайниците на животното, тъй като те са най-достъпни.

Нормалната регенереция при аксолотъла протича по следния начин: през първия ден на нараняването клетки от най-външния слой на кожата (епидермис) мигрират към повърхността на раната. Стъпката е критична, тъй като контактът между епидермиса и мускула под него е от решаващо значение за началото на регенерацията.

Следва образуване на локална популация от нискоспециализирани стволови клетки, които имат способността да се превръщат в различни класове клетъчни типове. Уникалното в тази стъпка е, че въпросните клетки се получават чрез дедиференциация – с други думи, връщат се назад във времето. Тези клетки се натрупват под епидермиса и се образува т.нар. бластема. След това бластемата се удължава до формирането на пъпка или конус.

В по-късния стадий регенерацията вече е зависима от нервите. От тъканта се образува плоска форма на лопатка и започва редиференциацията. Клетките, изграждащи бластемата, спират да се размножават и поемат различни пътища на специализиране. Структурите, които се образуват наново, са точни копия на липсващите. Този необикновен процес ангажира вниманието на учените, тъй като в основата му стои голяма енигма.

Проведените експерименти, в които се прерязват нервите, инервиращи крайника, преди той да бъде ампутиран, сочат, че способността на бластемата да започне отново да формира различни по вид клетки е зависим от нервите процес. Въпреки това крайните стъпки са независими от нервите. Когато нервите в крайника на аксолотъла са прерязани в ранен етап на регенерационния процес, растежът спира. Ако съответният нерв се пререже в по-късен етап, регенерацията ще продължи.

Фактори на регенерацията

Регенерацията, зависима от нервите, не е нещо невиждано. Тя е в основата на възстановяването на тъкани при гръбначните и се наблюдава и при зарастване на рани при хората. Например при пациенти с парализирани крайници, когато невроните, инервиращи мускула, са с нарушена структура, крайникът не се възстановява и този мускул се смята за „загубен“, или денервиран. Ако пациентът е с парализиран крайник, но без нарушена инервация, той би могъл да се възстанови. Друг пример е периферната невропатия (увреждане на периферната нервна система) при хора с диабет. Тя води до т.нар. диабетно стъпало. В този случай, когато периферните нерви са увредени и крайникът бъде наранен, тъканта не може да се заздрави и умира (некроза).

Но да се върнем на аксолотъла. Смята се, че нервите транспортират към раната белтъци, познати като невротропни фактори, и те влияят върху развитието на бластемата. Един от изследваните фактори е неурегулин 1 (neuregulin 1/nrg-1). Той се свързва с определен рецептор и изпраща сигнали, чрез които клетките мигрират към раната и се размножават. При денервиран крайник nrg-1 и рецепторът му липсват.

Друг фактор, заслужаващ внимание, е амфирегулинът (amphyregulin), вид епидермален растежен фактор. Установено е, че прекомерната му експресия (синтез) води до нарушение на регенерацията при аксолотлите, ако той продължи да присъства след формирането на бластемата. Ролята му при регенерацията на крайниците на аксолотъла не е напълно изяснена.

От друга страна, при хората амфирегулинът има роля в развитието на автоимунното заболяване псориазис, характеризиращо се със свръхрастеж на епидермиса. Интересно е, че раните от биопсия при пациентите с псориазис зарастват по-бързо, отколкото при другите хора, и това се дължи именно на свръхрастежа на епидермиса.

Други гени, които са в основата на регенерацията при аксолотъла, са част от т.нар. сигнален път (форма на общуване между клетките чрез промяна на структурата на определени белтъци) на ретиноевата киселина. Днес тя е популярна съставка в козметиката за борба със стареенето на кожата.

Регенеративно бъдеще

Един от най-атрактивните подходи в регенеративната медицина днес е 3D принтирането на функционални биологични тъкани. Биопринтингът се прилага с цел създаване на клетъчни триизмерни структури, имитиращи естествените тъкани и използвани като техен заместител. Материалът, използван за тази техника, са хидрогеловете – натурални полимери, които осигуряват триизмерна течна среда, имитираща тази на междуклетъчното пространство.

Друг вид материал е биомастилото, което позволява принтирането на живи клетки. То предоставя биохимични и физични стимули, насочващи клетките към размножаване и диференциране, като по този начин се поддържа жизнеността им.

Всичко това може и да звучи като научна фантастика, но е абсолютен факт. За съжаление, все още сме далеч от регенерацията на аксолотъла. Но отговорът на въпроса за самолечението се крие в бластемата. Тази структура липсва при хората. Последните изследвания на регенерацията при аксолотъла са насочени именно към установяването на гените, които участват в процеса на де- и редиференциация на клетките, изграждащи бластемата.

Най-новите молекулярни подходи, като CRISPR/Cas системата и секвенирането на РНК, позволяват проследяването на пътя на възрастните клетки към раната и превръщането им в стволови клетки, част от бластемата. Изясняването на молекулярното репрограмиране нa тези клетки ще даде възможност за приложението на нови терапии в регенеративната медицина при човека.

Заглавно изображение: Див тип на саламандъра аксолотъл (Ambystoma mexicanum). Източник: Личен архив

Implementing reactive progress tracking for AWS Step Functions

Post Syndicated from Benjamin Smith original https://aws.amazon.com/blogs/compute/implementing-reactive-progress-tracking-for-aws-step-functions/

This blog post is written by Alexey Paramonov, Solutions Architect, ISV and Maximilian Schellhorn, Solutions Architect ISV

This blog post demonstrates a solution based on AWS Step Functions and Amazon API Gateway WebSockets to track execution progress of a long running workflow. The solution updates the frontend regularly and users are able to track the progress and receive detailed status messages.

Websites with long-running processes often don’t provide feedback to users, leading to a poor customer experience. You might have experienced this when booking tickets, searching for hotels, or buying goods online. These sites often call multiple backend and third-party endpoints and aggregate the results to complete your request, causing the delay. In these long running scenarios, a transparent progress tracking solution can create a better user experience.

Overview

The example provided uses:

  • AWS Serverless Application Model (AWS SAM) for deployment: an open-source framework for building serverless applications.
  • AWS Step Functions for orchestrating the workflow.
  • AWS Lambda for mocking long running processes.
  • API Gateway to provide a WebSocket API for bidirectional communications between clients and the backend.
  • Amazon DynamoDB for storing connection IDs from the clients.

The example provides different options to report the progress back to the WebSocket connection by using Step Functions SDK integration, Lambda integrations, or Amazon EventBridge.

The following diagram outlines the example:

  1. The user opens a connection to WebSocket API. The OnConnect and OnDisconnect Lambda functions in the “WebSocket Connection Management” section persist this connection in DynamoDB (see documentation). The connection is bidirectional, meaning that the user can send requests through the open connection and the backend can respond with a new progress status whenever it is available.
  2. The user sends a new order through the WebSocket API. API Gateway routes the request to the “OnOrder” AWS Lambda function, which starts the state machine execution.
  3. As the request propagates through the state machine, we send progress updates back to the user via the WebSocket API using AWS SDK service integrations.
  4. For more customized status responses, we can use a centralized AWS Lambda function “ReportProgress” that updates the WebSocket API.

How to respond to the client?

To send the status updates back to the client via the WebSocket API, three options are explored:

Option 1: AWS SDK integration with API Gateway invocation

As the diagram shows, the API Gateway workflow tasks starting with the prefix “Report:” send responses directly to the client via the WebSocket API. This is an example of the state machine definition for this step:

          'Report: Workflow started':
            Type: Task
            Resource: arn:aws:states:::apigateway:invoke
            ResultPath: $.Params
            Parameters:
              ApiEndpoint: !Join [ '.',[ !Ref ProgressTrackingWebsocket, execute-api, !Ref 'AWS::Region', amazonaws.com ] ]
              Method: POST
              Stage: !Ref ApiStageName
              Path.$: States.Format('/@connections/{}', $.ConnectionId)
              RequestBody:
                Message: 🥁 Workflow started
                Progress: 10
              AuthType: IAM_ROLE
            Next: 'Mock: Inventory check'

This option reports the progress directly without using any additional Lambda functions. This limits the system complexity, reduces latency between the progress update and the response delivered to the client, and potentially reduces costs by reducing Lambda execution duration. A potential drawback is the limited customization of the response and getting familiar with the definition language.

Option 2: Using a Lambda function for reporting the progress status

To further customize response logic, create a Lambda function for reporting. As shown in point 4 of the diagram, you can also invoke a “ReportProgress” function directly from the state machine. This Python code snippet reports the progress status back to the WebSocket API:

apigw_management_api_client = boto3.client('apigatewaymanagementapi', endpoint_url=api_url)
apigw_management_api_client.post_to_connection(
            ConnectionId=connection_id,
            Data=bytes(json.dumps(event), 'utf-8')
        )

This option allows for more customizations and integration into the business logic of other Lambda functions to track progress in more detail. For example, execution of loops and reporting back on every iteration. The tradeoff is that you must handle exceptions and retries in your code. It also increases overall system complexity and additional costs associated with Lambda execution.

Option 3: Using EventBridge

You can combine option 2 with EventBridge to provide a centralized solution for reporting the progress status. The solution also handles retries with back-off if the “ReportProgress” function can’t communicate with the WebSocket API.

You can also use AWS SDK integrations from the state machine to EventBridge instead of using API Gateway. This has the additional benefit of a loosely coupled and resilient system but you could experience increased latency due to the additional services used. The combination of EventBridge and the Lambda function adds a minimal latency, but it might not be acceptable for short-lived workflows. However, if the workflow takes tens of seconds to complete and involves numerous steps, option 3 may be more suitable.

This is the architecture:

  1. As before.
  2. As before.
  3. AWS SDK integration sends the status message to EventBridge.
  4. The message propagates to the “ReportProgress” Lambda function.
  5. The Lambda function sends the processed message through the WebSocket API back to the client.

Deploying the example

Prerequisites

Make sure you can manage AWS resources from your terminal.

  • AWS CLI and AWS SAM CLI installed.
  • You have an AWS account. If not, visit this page.
  • Your user has sufficient permissions to manage AWS resources.
  • Git is installed.
  • NPM is installed (only for local frontend deployment).

To view the source code and documentation, visit the GitHub repo. This contains both the frontend and backend code.

To deploy:

  1. Clone the repository:
    git clone "https://github.com/aws-samples/aws-step-functions-progress-tracking.git"
  2. Navigate to the root of the repository.
  3. Build and deploy the AWS SAM template:
    sam build && sam deploy --guided
  4. Copy the value of WebSocketURL in the output for later.
  5. The backend is now running. To test it, use a hosted frontend.

Alternatively, you can deploy the React-based frontend on your local machine:

  1. Navigate to “progress-tracker-frontend/”:
    cd progress-tracker-frontend
  2. Launch the react app:
    npm start
  3. The command opens the React app in your default browser. If it does not happen automatically, navigate to http://localhost:3000/ manually.

Now the application is ready to test.

Testing the example application

  1. The webpage requests a WebSocket URL – this is the value from the AWS SAM template deployment. Paste it into Enter WebSocket URL in the browser and choose Connect.
  2. On the next page, choose Send Order and watch how the progress changes.

    This sends the new order request to the state machine. As it progresses, you receive status messages back through the WebSocket API.
  3. Optionally, you can inspect the raw messages arriving to the client. Open the Developer tools in your browser and navigate to the Network tab. Filter for WS (stands for WebSocket) and refresh the page. Specify the WebSocket URL, choose Connect and then choose Send Order.

Cleaning up

The services used in this solution are eligible for AWS Free Tier. To clean up the resources, in the root directory of the repository run:

sam delete

This removes all resources provisioned by the template.yml file.

Conclusion

In this post, you learn how to augment your Step Functions workflows with low latency progress tracking via API Gateway WebSockets. Consider adding the progress tracking to your long running workflows to improve the customer experience and provide a reactive look and feel for your application.

Navigate to the GitHub repository and review the implementation to see how your solution could become more user friendly and responsive. Start with examining the template.yml and the state machine’s definition and see how the frontend handles WebSocket communication and message visualization.

For more serverless learning resources, visit  Serverless Land.

Achieve up to 27% better price-performance for Spark workloads with AWS Graviton2 on Amazon EMR Serverless

Post Syndicated from Karthik Prabhakar original https://aws.amazon.com/blogs/big-data/achieve-up-to-27-better-price-performance-for-spark-workloads-with-aws-graviton2-on-amazon-emr-serverless/

Amazon EMR Serverless is a serverless option in Amazon EMR that makes it simple to run applications using open-source analytics frameworks such as Apache Spark and Hive without configuring, managing, or scaling clusters.

At AWS re:Invent 2022, we announced support for running serverless Spark and Hive workloads with AWS Graviton2 (Arm64) on Amazon EMR Serverless. AWS Graviton2 processors are custom-built by AWS using 64-bit Arm Neoverse cores, delivering a significant leap in price-performance for your cloud workloads.

This post discusses the performance improvements observed while running Apache Spark jobs using AWS Graviton2 on EMR Serverless. We found that Graviton2 on EMR Serverless achieved 10% performance improvement for Spark workloads based on runtime. AWS Graviton2 is offered at a 20% lower cost than the x86 architecture option (see the Amazon EMR pricing page for details), resulting in a 27% overall better price-performance for workloads.

Spark performance test results

The following charts compare the benchmark runtime with and without Graviton2 for a EMR Serverless Spark application (note that the charts are not drawn to scale). We observed up to 10% improvement in total runtime and 8% improvement in geometric mean for the queries compared to x86.

The following table summarizes our results.

Metric Graviton2 x86 %Gain
Total Execution Time (in seconds) 2,670 2,959 10%
Geometric Mean (in seconds) 22.06 24.07 8%

Testing configuration

To evaluate the performance improvements, we use benchmark tests derived from TPC-DS 3 TB scale performance benchmarks. The benchmark consists of 104 queries, and each query is submitted sequentially to an EMR Serverless application. EMR Serverless has automatic and fine-grained scaling enabled by default. Spark provides Dynamic Resource Allocation (DRA) to dynamically adjust the application resources based on the workload, and EMR Serverless uses the signals from DRA to elastically scale workers as needed. For our tests, we chose a predefined pre-initialized capacity that allows the application to scale to default limits. Each application has 1 driver and 100 workers configured as pre-initialized capacity, allowing it to scale to a maximum of 8000 vCPU/60000 GB capacity. When launching the applications, as default we use x86_64 to get baseline numbers and Arm64 for AWS Graviton2, and the application had VPC networking enabled.

The following table summarizes the Spark application configuration.

Number of Drivers Driver Size Number of Executors Executor Size Ephemeral Storage Amazon EMR release label
1 4 vCPUs, 16 GB Memory 100 4 vCPUs, 16 GB Memory 200 G 6.9

Performance test results and cost comparison

Let’s do a cost comparison of the benchmark tests. Because we used 1 driver [4 vCPUs, 16 GB memory] and 100 executors [4 vCPUs, 16 GB memory] for each run, the total capacity used is 4*101=192 vCPUs, 16*101=1616 GB memory, 200*100=20000 GB storage. The following table summarizes the cost.

Test Total time (Seconds) vCPUs Memory (GB) Ephemeral (Storage GB) Cost
x86_64 2,958.82 404 1616 18000 $26.73
Graviton2 2,670.38 404 1616 18000 $19.59

The calculations are as follows:

  • Total vCPU cost = (number of vCPU * per vCPU rate * job runtime in hour)
  • Total GB = (Total GB of memory configured * per GB-hours rate * job runtime in hour)
  • Storage = 20 GB of ephemeral storage is available for all workers by default—you pay only for any additional storage that you configure per worker

Cost breakdown

Let’s look at the cost breakdown for x86:

  • Job runtime – 49.3 minutes = 0.82 hours
  • Total vCPU cost – 404 vCPUs x 0.82 hours job runtime x 0.052624 USD per vCPU = 17.4333 USD
  • Total GB cost – 1,616 memory-GBs x 0.82 hours job runtime x 0.0057785 USD per memory GB = 7.6572 USD
  • Storage cost – 18,000 storage-GBs x 0.82 hours job runtime x 0.000111 USD per storage GB = 1.6386 USD
  • Additional storage – 20,000 GB – 20 GB free tier * 100 workers = 18,000 additional storage GB
  • EMR Serverless total cost (x86): 17.4333 USD + 7.6572 USD + 1.6386 USD = 26.7291 USD

Let’s compare to the cost breakdown for Graviton 2:

  • Job runtime – 44.5 minutes = 0.74 hours
  • Total vCPU cost – 404 vCPUs x 0.74 hours job runtime x 0.042094 USD per vCPU = 12.5844 USD
  • Total GB cost – 1,616 memory-GBs x 0.74 hours job runtime x 0.004628 USD per memory GB = 5.5343 USD
  • Storage cost – 18,000 storage-GBs x 0.74 hours job runtime x 0.000111 USD per storage GB = 1.4785 USD
  • Additional storage – 20,000 GB – 20 GB free tier * 100 workers = 18,000 additional storage GB
  • EMR Serverless total cost (Graviton2): 12.5844 USD + 5.5343 USD + 1.4785 USD = 19.5972 USD

The tests indicate that for the benchmark run, AWS Graviton2 lead to an overall cost savings of 27%.

Individual query improvements and observations

The following chart shows the relative speedup of individual queries with Graviton2 compared to x86.

We see some regression in a few shorter queries, which had little impact on the overall benchmark runtime. We observed better performance gains for long running queries, for example:

  • q67 average 86 seconds for x86, 74 seconds for Graviton2 with 24% runtime performance gain
  • q23a and q23b gained 14% and 16%, respectively
  • q32 regressed by 7%; the difference between average runtime is <500 milliseconds (11.09 seconds for Graviton2 vs. 10.39 seconds for x86)

To quantify performance, we use benchmark SQL derived from TPC-DS 3 TB scale performance benchmarks.

If you’re evaluating migrating your workloads to Graviton2 architecture on EMR Serverless, we recommend testing the Spark workloads based on your real-world use cases. The outcome might vary based on the pre-initialized capacity and number of workers chosen. If you want to run workloads across multiple processor architectures, (for example, test the performance on x86 and Arm vCPUs) follow the walkthrough in the GitHub repo to get started with some concrete ideas.

Conclusion

As demonstrated in this post, Graviton2 on EMR Serverless applications consistently yielded better performance for Spark workloads. Graviton2 is available in all Regions where EMR Serverless is available. To see a list of Regions where EMR Serverless is available, see the EMR Serverless FAQs. To learn more, visit the Amazon EMR Serverless User Guide and sample codes with Apache Spark and Apache Hive.

If you’re wondering how much performance gain you can achieve with your use case, try out the steps outlined in this post and replace with your queries.

To launch your first Spark or Hive application using a Graviton2-based architecture on EMR Serverless, see Getting started with Amazon EMR Serverless.


About the authors

Karthik Prabhakar is a Senior Big Data Solutions Architect for Amazon EMR at AWS. He is an experienced analytics engineer working with AWS customers to provide best practices and technical advice in order to assist their success in their data journey.

Nithish Kumar Murcherla is a Senior Systems Development Engineer on the Amazon EMR Serverless team. He is passionate about distributed computing, containers, and everything and anything about the data.

[$] NASA and open-source software

Post Syndicated from original https://lwn.net/Articles/923223/

From the moon landing to the James Webb Space Telescope and many other
scientific missions, software is critical for the US National Aeronautics and Space Administration
(NASA). Sharing information has also been in the DNA of the space
agency from the beginning. As a result, NASA also contributes to and
releases open-source software and open data. In a keynote at FOSDEM 2023,
Science Data Officer Steve Crawford talked about NASA and
open-source software, including the challenges NASA has faced in using open
source and the
agency’s recent initiatives to lower
barriers.

Amazon EMR Serverless supports larger worker sizes to run more compute and memory-intensive workloads

Post Syndicated from Veena Vasudevan original https://aws.amazon.com/blogs/big-data/amazon-emr-serverless-supports-larger-worker-sizes-to-run-more-compute-and-memory-intensive-workloads/

Amazon EMR Serverless allows you to run open-source big data frameworks such as Apache Spark and Apache Hive without managing clusters and servers. With EMR Serverless, you can run analytics workloads at any scale with automatic scaling that resizes resources in seconds to meet changing data volumes and processing requirements. EMR Serverless automatically scales resources up and down to provide just the right amount of capacity for your application.

We are excited to announce that EMR Serverless now offers worker configurations of 8 vCPUs with up to 60 GB memory and 16 vCPUs with up to 120 GB memory, allowing you to run more compute and memory-intensive workloads on EMR Serverless. An EMR Serverless application internally uses workers to execute workloads. and you can configure different worker configurations based on your workload requirements. Previously, the largest worker configuration available on EMR Serverless was 4 vCPUs with up to 30 GB memory. This capability is especially beneficial for the following common scenarios:

  • Shuffle-heavy workloads
  • Memory-intensive workloads

Let’s look at each of these use cases and the benefits of having larger worker sizes.

Benefits of using large workers for shuffle-intensive workloads

In Spark and Hive, shuffle occurs when data needs to be redistributed across the cluster during a computation. When your application performs wide transformations or reduce operations such as join, groupBy, sortBy, or repartition, Spark and Hive triggers a shuffle. Also, every Spark stage and Tez vertex is bounded by a shuffle operation. Taking Spark as an example, by default, there are 200 partitions for every Spark job defined by spark.sql.shuffle.partitions. However, Spark will compute the number of tasks on the fly based on the data size and the operation being performed. When a wide transformation is performed on top of a large dataset, there could be GBs or even TBs of data that need to be fetched by all the tasks.

Shuffles are typically expensive in terms of both time and resources, and can lead to performance bottlenecks. Therefore, optimizing shuffles can have a significant impact on the performance and cost of a Spark job. With large workers, more data can be allocated to each executor’s memory, which minimizes the data shuffled across executors. This in turn leads to increased shuffle read performance because more data will be fetched locally from the same worker and less data will be fetched remotely from other workers.

Experiments

To demonstrate the benefits of using large workers for shuffle-intensive queries, let’s use q78 from TPC-DS, which is a shuffle-heavy Spark query that shuffles 167 GB of data over 12 Spark stages. Let’s perform two iterations of the same query with different configurations.

The configurations for Test 1 are as follows:

  • Size of executor requested while creating EMR Serverless application = 4 vCPUs, 8 GB memory, 200 GB disk
  • Spark job config:
    • spark.executor.cores = 4
    • spark.executor.memory = 8
    • spark.executor.instances = 48
    • Parallelism = 192 (spark.executor.instances * spark.executor.cores)

The configurations for Test 2 are as follows:

  • Size of executor requested while creating EMR Serverless application = 8 vCPUs, 16 GB memory, 200 GB disk
  • Spark job config:
    • spark.executor.cores = 8
    • spark.executor.memory = 16
    • spark.executor.instances = 24
    • Parallelism = 192 (spark.executor.instances * spark.executor.cores)

Let’s also disable dynamic allocation by setting spark.dynamicAllocation.enabled to false for both tests to avoid any potential noise due to variable executor launch times and keep the resource utilization consistent for both tests. We use Spark Measure, which is an open-source tool that simplifies the collection and analysis of Spark performance metrics. Because we’re using a fixed number of executors, the total number of vCPUs and memory requested are the same for both the tests. The following table summarizes the observations from the metrics collected with Spark Measure.

. Total Time Taken for Query in milliseconds shuffleLocalBlocksFetched shuffleRemoteBlocksFetched shuffleLocalBytesRead shuffleRemoteBytesRead shuffleFetchWaitTime shuffleWriteTime
Test 1 153244 114175 5291825 3.5 GB 163.1 GB 1.9 hr 4.7 min
Test 2 108136 225448 5185552 6.9 GB 159.7 GB 3.2 min 5.2 min

As seen from the table, there is a significant difference in performance due to shuffle improvements. Test 2, with half the number of executors that are twice as large as Test 1, ran 29.44% faster, with 1.97 times more shuffle data fetched locally compared to Test 1 for the same query, same parallelism, and same aggregate vCPU and memory resources. Therefore, you can benefit from improved performance without compromising on cost or job parallelism with the help of large executors. We have observed similar performance benefits for other shuffle-intensive TPC-DS queries such as q23a and q23b.

Recommendations

To determine if the large workers will benefit your shuffle-intensive Spark applications, consider the following:

  • Check the Stages tab from the Spark History Server UI of your EMR Serverless application. For example, from the following screenshot of Spark History Server, we can determine that this Spark job wrote and read 167 GB of shuffle data aggregated across 12 stages, looking at the Shuffle Read and Shuffle Write columns. If your jobs shuffle over 50 GB of data, you may potentially benefit from using larger workers with 8 or 16 vCPUs or spark.executor.cores.

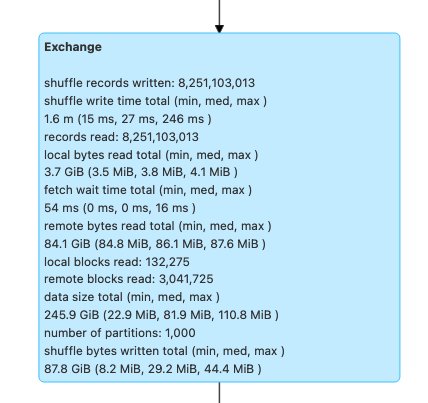
  • Check the SQL / DataFrame tab from the Spark History Server UI of your EMR Serverless application (only for Dataframe and Dataset APIs). When you choose the Spark action performed, such as collect, take, showString, or save, you will see an aggregated DAG for all stages separated by the exchanges. Every exchange in the DAG corresponds to a shuffle operation, and it will contain the local and remote bytes and blocks shuffled, as seen in the following screenshot. If the local shuffle blocks or bytes fetched is much less compared to the remote blocks or bytes fetched, you can rerun your application with larger workers (with 8 or 16 vCPUs or spark.executor.cores) and review these exchange metrics in a DAG to see if there is any improvement.

  • Use the Spark Measure tool with your Spark query to obtain the shuffle metrics in the Spark driver’s stdout logs, as shown in the following log for a Spark job. Review the time taken for shuffle reads (shuffleFetchWaitTime) and shuffle writes (shuffleWriteTime), and the ratio of the local bytes fetched to the remote bytes fetched. If the shuffle operation takes more than 2 minutes, rerun your application with larger workers (with 8 or 16 vCPUs or spark.executor.cores) with Spark Measure to track the improvement in shuffle performance and the overall job runtime.
Time taken: 177647 ms

Scheduling mode = FIFO
Spark Context default degree of parallelism = 192

Aggregated Spark stage metrics:
numStages => 22
numTasks => 10156
elapsedTime => 159894 (2.7 min)
stageDuration => 456893 (7.6 min)
executorRunTime => 28418517 (7.9 h)
executorCpuTime => 20276736 (5.6 h)
executorDeserializeTime => 326486 (5.4 min)
executorDeserializeCpuTime => 124323 (2.1 min)
resultSerializationTime => 534 (0.5 s)
jvmGCTime => 648809 (11 min)
shuffleFetchWaitTime => 340880 (5.7 min)
shuffleWriteTime => 245918 (4.1 min)
resultSize => 23199434 (22.1 MB)
diskBytesSpilled => 0 (0 Bytes)
memoryBytesSpilled => 0 (0 Bytes)
peakExecutionMemory => 1794288453176
recordsRead => 18696929278
bytesRead => 77354154397 (72.0 GB)
recordsWritten => 0
bytesWritten => 0 (0 Bytes)
shuffleRecordsRead => 14124240761
shuffleTotalBlocksFetched => 5571316
shuffleLocalBlocksFetched => 117321
shuffleRemoteBlocksFetched => 5453995
shuffleTotalBytesRead => 158582120627 (147.7 GB)
shuffleLocalBytesRead => 3337930126 (3.1 GB)
shuffleRemoteBytesRead => 155244190501 (144.6 GB)
shuffleRemoteBytesReadToDisk => 0 (0 Bytes)
shuffleBytesWritten => 156913371886 (146.1 GB)
shuffleRecordsWritten => 13867102620

Benefits of using large workers for memory-intensive workloads

Certain types of workloads are memory-intensive and may benefit from more memory configured per worker. In this section, we discuss common scenarios where large workers could be beneficial for running memory-intensive workloads.

Data skew

Data skews commonly occur in several types of datasets. Some common examples are fraud detection, population analysis, and income distribution. For example, when you want to detect anomalies in your data, it’s expected that only less than 1% of the data is abnormal. If you want to perform some aggregation on top of normal vs. abnormal records, 99% of the data will be processed by a single worker, which may lead to that worker running out of memory. Data skews may be observed for memory-intensive transformations like groupBy, orderBy, join, window functions, collect_list, collect_set, and so on. Join types such as BroadcastNestedLoopJoin and Cartesan product are also inherently memory-intensive and susceptible to data skews. Similarly, if your input data is Gzip compressed, a single Gzip file can’t be read by more than one task because the Gzip compression type is unsplittable. When there are a few very large Gzip files in the input, your job may run out of memory because a single task may have to read a huge Gzip file that doesn’t fit in the executor memory.

Failures due to data skew can be mitigated by applying strategies such as salting. However, this often requires extensive changes to the code, which may not be feasible for a production workload that failed due to an unprecedented data skew caused by a sudden surge in incoming data volume. For a simpler workaround, you may just want to increase the worker memory. Using larger workers with more spark.executor.memory allows you to handle data skew without making any changes to your application code.

Caching

In order to improve performance, Spark allows you to cache the data frames, datasets, and RDDs in memory. This enables you to reuse a data frame multiple times in your application without having to recompute it. By default, up to 50% of your executor’s JVM is used to cache the data frames based on the property spark.memory.storageFraction. For example, if your spark.executor.memory is set to 30 GB, then 15 GB is used for cache storage that is immune to eviction.

The default storage level of cache operation is DISK_AND_MEMORY. If the size of the data frame you are trying to cache doesn’t fit in the executor’s memory, a portion of the cache spills to disk. If there isn’t enough space to write the cached data in disk, the blocks are evicted and you don’t get the benefits of caching. Using larger workers allows you to cache more data in memory, boosting job performance by retrieving cached blocks from memory rather than the underlying storage.

Experiments

For example, the following PySpark job leads to a skew, with one executor processing 99.95% of the data with memory-intensive aggregates like collect_list. The job also caches a very large data frame (2.2 TB). Let’s run two iterations of the same job on EMR Serverless with the following vCPU and memory configurations.

Let’s run Test 3 with the previously largest possible worker configurations:

  • Size of executor set while creating EMR Serverless application = 4 vCPUs, 30 GB memory, 200 GB disk
  • Spark job config:
    • spark.executor.cores = 4
    • spark.executor.memory = 27 G

Let’s run Test 4 with the newly released large worker configurations:

  • Size of executor set in while creating EMR Serverless application = 8 vCPUs, 60 GB memory, 200 GB disk
  • Spark job config:
    • spark.executor.cores = 8
    • spark.executor.memory = 54 G

Test 3 failed with FetchFailedException, which resulted due to the executor memory not being sufficient for the job.

Also, from the Spark UI of Test 3, we see that the reserved storage memory of the executors was fully utilized for caching the data frames.

The remaining blocks to cache were spilled to disk, as seen in the executor’s stderr logs:

23/02/06 16:06:58 INFO MemoryStore: Will not store rdd_4_1810
23/02/06 16:06:58 WARN MemoryStore: Not enough space to cache rdd_4_1810 in memory! (computed 134.1 MiB so far)
23/02/06 16:06:58 INFO MemoryStore: Memory use = 14.8 GiB (blocks) + 507.5 MiB (scratch space shared across 4 tasks(s)) = 15.3 GiB. Storage limit = 15.3 GiB.
23/02/06 16:06:58 WARN BlockManager: Persisting block rdd_4_1810 to disk instead.

Around 33% of the persisted data frame was cached on disk, as seen on the Storage tab of the Spark UI.

Test 4 with larger executors and vCores ran successfully without throwing any memory-related errors. Also, only about 2.2% of the data frame was cached to disk. Therefore, cached blocks of a data frame will be retrieved from memory rather than from disk, offering better performance.

Recommendations

To determine if the large workers will benefit your memory-intensive Spark applications, consider the following:

  • Determine if your Spark application has any data skews by looking at the Spark UI. The following screenshot of the Spark UI shows an example data skew scenario where one task processes most of the data (145.2 GB), looking at the Shuffle Read size. If one or fewer tasks process significantly more data than other tasks, rerun your application with larger workers with 60–120 G of memory (spark.executor.memory set anywhere from 54–109 GB factoring in 10% of spark.executor.memoryOverhead).

  • Check the Storage tab of the Spark History Server to review the ratio of data cached in memory to disk from the Size in memory and Size in disk columns. If more than 10% of your data is cached to disk, rerun your application with larger workers to increase the amount of data cached in memory.
  • Another way to preemptively determine if your job needs more memory is by monitoring Peak JVM Memory on the Spark UI Executors tab. If the peak JVM memory used is close to the executor or driver memory, you can create an application with a larger worker and configure a higher value for spark.executor.memory or spark.driver.memory. For example, in the following screenshot, the maximum value of peak JVM memory usage is 26 GB and spark.executor.memory is set to 27 G. In this case, it may be beneficial to use larger workers with 60 GB memory and spark.executor.memory set to 54 G.

Considerations

Although large vCPUs help increase the locality of the shuffle blocks, there are other factors involved such as disk throughput, disk IOPS (input/output operations per second), and network bandwidth. In some cases, more small workers with more disks could offer higher disk IOPS, throughput, and network bandwidth overall compared to fewer large workers. We encourage you to benchmark your workloads against suitable vCPU configurations to choose the best configuration for your workload.

For shuffle-heavy jobs, it’s recommended to use large disks. You can attach up to 200 GB disk to each worker when you create your application. Using large vCPUs (spark.executor.cores) per executor may increase the disk utilization on each worker. If your application fails with “No space left on device” due to the inability to fit shuffle data in the disk, use more smaller workers with 200 GB disk.

Conclusion

In this post, you learned about the benefits of using large executors for your EMR Serverless jobs. For more information about different worker configurations, refer to Worker configurations. Large worker configurations are available in all Regions where EMR Serverless is available.


About the Author

Veena Vasudevan is a Senior Partner Solutions Architect and an Amazon EMR specialist at AWS focusing on big data and analytics. She helps customers and partners build highly optimized, scalable, and secure solutions; modernize their architectures; and migrate their big data workloads to AWS.

CIEM is Required for Cloud Security and IAM Providers to Compete: Gartner® Report

Post Syndicated from Aaron Wells original https://blog.rapid7.com/2023/02/15/ciem-is-required-for-cloud-security-and-iam-providers-to-compete-gartner-r-report/

CIEM is Required for Cloud Security and IAM Providers to Compete: Gartner® Report

In an ongoing effort to help security organizations stay competitive, we’re pleased to offer this complimentary Gartner® report, Emerging Tech: CIEM Is Required for Cloud Security and IAM Providers to Compete. The research in the report demonstrates the need for Cloud Infrastructure Entitlement Management (CIEM) product leaders to adopt trends that can help deliver value across Cloud Security and Identity and Access Management (IAM) enterprises.

CIEM product leaders looking to remain competitive in Cloud Security and IAM practices should consider prioritizing specific capabilities in their planning in order to address new and emerging threats and, as Gartner says:                            

  • Gain a further competitive edge in the CIEM market by investing in more-advanced guided remediation capabilities, such as automated downsizing of over-privileged accounts.
  • Appeal to a larger audience beyond cloud security teams by positioning CIEM as part of broader enterprise security controls.

Businesses not currently prioritizing CIEM capabilities, however, can’t simply “do a 180” and expect to be successful. Managing entitlements in the current sophisticated age of attacks and digital espionage can feel impossible. It is imperative for security organizations to adopt updated access practices though, not only to remain competitive but to remain secure.

Least Privileged Access (LPA) approaches lacking in effectiveness can find support in CIEM tools that provide advanced enforcement and remediation of ineffective LPA methods. Gartner says:

“The anomaly-detection capabilities leveraged by CIEM tools can be extended to analyze the misconfigurations and vulnerabilities in the IAM stack. With overprivileged account discovery, and some guided remediation, CIEM tools can help organizations move toward a security posture where identities have at least privileges.”

Broadening the portfolio

Within cloud security, identity-verification practices are more critical than ever. Companies developing and leveraging SaaS applications must constantly grapple with varying business priorities, thus identity permissions across these applications can become inconsistent. This can leave applications — and the business — open to vulnerabilities and other challenges.

When it comes to dynamic multi- and hybrid-cloud environments, it can become prohibitively difficult to monitor identity administration and governance. Challenges can include:

  • Prevention of misuse from privileged accounts
  • Poor visibility for performing compliance and oversight
  • Added complexity from short-term cloud entitlements
  • Inconsistency across multiple cloud infrastructures
  • Accounts with excessive access permissions

Multi-cloud IAM requires a more refined approach, and CIEM tools can capably address the challenges above, which is why they must be adopted as part of a suite of broader enterprise security controls.

Accelerating cloud adoption

Technology and service providers fulfilling IAM services are in critical need of capabilities that can address specific cloud use cases. Gartner says:

“It is a natural extension to assist existing customers in their digital transformation and cloud adoption journey. These solutions are able to bridge both on-premises identity implementations and cloud to support hybrid use cases. This will also translate existing IAM policies and apply relevant elements for the cloud while adding additional use cases unique to the cloud environment.”

In fact, a key finding from the report is that “visibility of entitlements and rightsizing of permissions are quickly becoming ‘table stakes’ features in the CIEM market.”

Mature CIEM vendors can typically be expected to also offer additional capabilities like cloud security posture management (CSPM). InsightCloudSec from Rapid7 is a CIEM solution that also offers CSPM capabilities to effectively manage the perpetual shift, adoption, and innovation of cloud infrastructure. Businesses and security organizations can more effectively compete when they offer strong solutions that support and aid existing CIEM capabilities.

Download the report

Rapid7 is pleased to continually offer leading research to help you gain clarity into ways you can stand out in this ultra-competitive landscape. Read the entire complimentary Gartner report now to better understand just how in-demand CIEM capabilities are becoming and how product leaders can tailor strategies to Cloud Security and IAM enterprises.

Gartner, “Emerging Tech: CIEM Is Required for Cloud Security and IAM Providers to Compete”

Swati Rakheja, Mark Wah. 13 July 2022.

Gartner is registered trademark and servicemark of Gartner, Inc and/or its affiliates in the U.S. and internationally, and is used herein with permission. All rights reserved.

AWS now licensed by DESC to operate as a Tier 1 cloud service provider in the Middle East (UAE) Region

Post Syndicated from Ioana Mecu original https://aws.amazon.com/blogs/security/aws-now-licensed-by-desc-to-operate-as-a-tier-1-cloud-service-provider-in-the-middle-east-uae-region/

We continue to expand the scope of our assurance programs at Amazon Web Services (AWS) and are pleased to announce that our Middle East (UAE) Region is now certified by the Dubai Electronic Security Centre (DESC) to operate as a Tier 1 cloud service provider (CSP). This alignment with DESC requirements demonstrates our continuous commitment to adhere to the heightened expectations for CSPs. AWS government customers can run their applications in the AWS Cloud certified Regions in confidence.

AWS was evaluated by independent third-party auditor BSI on behalf of DESC on January 23, 2023. The Certificate of Compliance illustrating the AWS compliance status is available through AWS Artifact. AWS Artifact is a self-service portal for on-demand access to AWS compliance reports. Sign in to AWS Artifact in the AWS Management Console, or learn more at Getting Started with AWS Artifact.

As of this writing, 62 services offered in the Middle East (UAE) Region are in scope of this certification. For up-to-date information, including when additional services are added, visit the AWS Services in Scope by Compliance Program webpage and choose DESC CSP.

AWS strives to continuously bring services into scope of its compliance programs to help you meet your architectural and regulatory needs. Please reach out to your AWS account team if you have questions or feedback about DESC compliance.

To learn more about our compliance and security programs, see AWS Compliance Programs. As always, we value your feedback and questions; reach out to the AWS Compliance team through the Contact Us page.

 
If you have feedback about this post, submit comments in the Comments section below.

Want more AWS Security how-to content, news, and feature announcements? Follow us on Twitter.

Ioana Mecu

Ioana Mecu

Ioana is a Security Audit Program Manager at AWS based in Madrid, Spain. She leads security audits, attestations, and certification programs across Europe and the Middle East. Ioana has previously worked in risk management, security assurance, and technology audits in the financial sector industry for the past 15 years.

How Strategic Blue uses Amazon QuickSight and AWS Cost and Usage Reports to help their customers save millions

Post Syndicated from Frank Contrepois original https://aws.amazon.com/blogs/big-data/how-strategic-blue-uses-amazon-quicksight-and-aws-cost-and-usage-reports-to-help-their-customers-save-millions/

This is a guest post co-written with Frank Contrepois from Strategic Blue.

For over 10 years, Strategic Blue has helped organizations unlock the most value from the cloud by enabling their customers to purchase non-standard commitments. By taking a commodity trading approach to purchasing from AWS, Strategic Blue helps customers purchase commitments for varying lengths of time, such as a 9-month Reserved Instance or an 18-month Savings Plan. Over the years, they’ve been able to help customers save millions by maximizing commitments.

In this post, we share how Strategic Blue uses Amazon QuickSight and AWS Cost and Usage Reports to help their customers save costs.

The challenge

Buying and selling AWS differently means that the cost and usage data available to Strategic Blue on the AWS Management Console only matches what they purchased—not what their customers purchased. In order to accurately bill their customers, Strategic Blue has built a billing system that takes AWS Cost and Usage Reports (CUR) as input and outputs a pro forma CUR that matches what their customers would expect to see. Although the CUR remains a critical source of data, it can have hundreds of columns and millions of rows, making it very difficult for Strategic Blue’s customers to visualize and understand.

Initially, in order to give their customers a way to visualize and understand their spend, Strategic Blue started building a dashboard from scratch using QuickSight, AWS Glue, and Amazon Athena. The idea was to build a dashboard accessible to all of Strategic Blue’s customers (as soon as they were onboarded) that enabled them to see their true cost and usage. QuickSight provides modern interactive dashboards that enable fast time-to-insights and have features that allow for the easy embedding of dashboards into web applications linked to a customer’s single sign-on (SSO) solution. Combined with row-level-security, a dashboard can be pre-filtered to show an individual user’s cost and usage information for only the accounts they are responsible for.

However, figuring out how to accurately show cost and usage insights from the CUR from scratch was a challenge. The amount of work required to decode the raw content of the CUR to build something that matches what you would see in AWS Cost Explorer quickly became overwhelming.

The solution

To help you visualize the treasure trove of data available in a CUR file, AWS created the Cloud Intelligence Dashboards solution. The Cloud Intelligence Dashboards provide a full stack of capabilities, deployed via AWS CloudFormation or other methods, that include six different QuickSight dashboards geared towards helping you optimize your spend on AWS.

Strategic Blue deployed the CUDOS Dashboard (one of the six dashboards available as of this writing) to solve their business case for providing their customers with accurate, comprehensive insights into their cost and usage.

“The Cloud Intelligence Dashboards provided all of the accurate CUR calculations and maintenance we need. This saves us many hours of reverse engineering to keep pace with AWS innovation and changes as their product and billing mechanisms mature.”

– Frank Contrepois, Head of FinOps at Strategic Blue.

The following screenshot shows an example of the dashboard.

Embedding and scaling to all customers

Strategic Blue uses the embedding and row-level security features of QuickSight to scale the dashboards to every customer the moment they are onboarded. By integrating their SSO Amazon Cognito with QuickSight, Strategic Blue is able to provide customers instant access to an instance of CUDOS through a portal as soon as they are onboarded to Strategic Blue’s platform. The row-level security setup managed by administrators within Strategic Blue makes sure that their customers only ever see their own cost and usage data. This helps Strategic Blue offer the protection and security customers expect.

To see the Strategic Blue portal with embedded CUDOS in action, watch the following demo video, or to unlock your savings potential in the cloud, sign up with Strategic Blue now.

Now that CUDOS is embedded into Strategic Blue’s portal, they are able to offer additional value free of charge to their customers. Strategic Blue’s portal uses the customer’s CUDOS dashboard to find opportunities to save and optimize. After the engagement, Strategic Blue will continue to analyze the impact of their customer’s cost optimization measures, reporting back to them what they’ve saved and what additional opportunities there are to further optimize.

Strategic Blue is already seeing an impact. Since enabling an embedded version of CUDOS for every customer and for internal teams, Strategic Blue is seeing a 27% increase in positive feedback for regular meetings, 31% fewer support tickets related to questions about cost, and a move from tactical to strategic FinOps conversations.

The future

Strategic Blue plans to evaluate and embed the rest of the Cloud Intelligence Dashboards, such as the KPI Dashboard to help customers track goals and metrics around cost optimization, and the Trusted Advisor Organizational Dashboard, which helps customers stay on top of underutilized resources as well as operational information such as security and fault tolerance postures. With the foundation in place and QuickSight’s ease of use, Strategic Blue will continue working closely with customers to customize and refine the dashboards to meet specific customer needs, improving and expanding their offerings.

Conclusion

In this post, we covered how Strategic Blue used Cloud Intelligence Dashboards built on QuickSight to help customers get accurate insights into their cloud cost and usage. Strategic Blue’s customers can access stunning and interactive dashboards that can be customized with ease and without the need for technical skills. The comprehensive embedding capabilities, granular row-level-security, and SSO integrations of QuickSight ensure that Strategic Blue is able to provide customers secure and seamless access to their Cloud Intelligence Dashboards.

It’s easy to install Cloud Intelligence Dashboards in your account. Visit Cloud Intelligence Dashboards for details on how to deploy the dashboards today, and let us know how it goes.


About the Authors

Frank Contrepois is the Head of FinOps at Strategic Blue. Frank and his team support a wide range of customers to implement Cloud FinOps including small-and medium-sized organizations, private equity (PE) funds and investors, enterprises and global cloud resellers striking significant deals. He is an AWS APN Ambassador and has several AWS and GCP pro-level certifications. Outside of work, he is a husband, father of two wonderful boys, and co-host of the “What’s new with in Cloud FinOps” podcast.

Aaron Edell is Head of GTM for Customer Cloud Intelligence for Amazon Web Services. He is responsible for building and scaling businesses around Cloud Financial Management, FinOps, and the Well-Architected Cost Optimization pillar. He focuses his GTM efforts on the Cloud Intelligence Dashboards and remains obsessed with helping all customers get better visibility and access to their cost and usage data.

New Workstation Kingpins Intel Xeon W-3400 Xeon W-2400 and W790 Launch

Post Syndicated from Patrick Kennedy original https://www.servethehome.com/new-workstation-kingpins-intel-xeon-w-3400-xeon-w-2400-and-w790-launch/

We delve into the new Intel Xeon W-3400 and Xeon W-2400 series bringing PCIe Gen5 lanes, DDR5, and more cores to the workstation market

The post New Workstation Kingpins Intel Xeon W-3400 Xeon W-2400 and W790 Launch appeared first on ServeTheHome.

The collective thoughts of the interwebz