Create cross-account, custom Amazon Managed Grafana dashboards for Amazon Redshift

Post Syndicated from Tahir Aziz original https://aws.amazon.com/blogs/big-data/create-cross-account-custom-amazon-managed-grafana-dashboards-for-amazon-redshift/

Amazon Managed Grafana recently announced a new data source plugin for Amazon Redshift, enabling you to query, visualize, and alert on your Amazon Redshift data from Amazon Managed Grafana workspaces. With the new Amazon Redshift data source, you can now create dashboards and alerts in your Amazon Managed Grafana workspaces to analyze your structured and semi-structured data across data warehouses, operational databases, and data lakes. The Amazon Redshift plugin also comes with default out-of-the-box dashboards that make it simple to get started monitoring the health and performance of your Amazon Redshift clusters.

In this post, we present a step-by-step tutorial to use the Amazon Redshift data source plugin to visualize metrics from your Amazon Redshift clusters hosted in different AWS accounts using AWS Single Sign-On (AWS SSO) as well as how to create custom dashboards visualizing data from Amazon Redshift system tables in Amazon Managed Grafana.

Solution overview

Let’s look at the AWS services that we use in our tutorial:

Amazon Managed Grafana is a fully managed service for open-source Grafana developed in collaboration with Grafana Labs. Grafana is a popular open-source analytics platform that enables you to query, visualize, alert on, and understand your operational metrics. You can create, explore, and share observability dashboards with your team, and spend less time managing your Grafana infrastructure and more time improving the health, performance, and availability of your applications. Amazon Managed Grafana natively integrates with AWS services (like Amazon Redshift) so you can securely add, query, visualize, and analyze operational and performance data across multiple accounts and Regions for the underlying AWS service.

Amazon Redshift is a fully managed, petabyte-scale data warehouse service in the cloud. You can start with just a few hundred gigabytes of data and scale to a petabyte or more. This enables you to use your data to acquire new insights for your business and customers. Today, tens of thousands of AWS customers from Fortune 500 companies, startups, and everything in between use Amazon Redshift to run mission-critical business intelligence (BI) dashboards, analyze real-time streaming data, and run predictive analytics jobs. With the constant increase in generated data, Amazon Redshift customers continue to achieve successes in delivering better service to their end-users, improving their products, and running an efficient and effective business.

AWS SSO is where you create or connect your workforce identities in AWS and manage access centrally across your AWS organization. You can choose to manage access just to your AWS accounts or cloud applications. You can create user identities directly in AWS SSO, or you can bring them from your Microsoft Active Directory or a standards-based identity provider, such as Okta Universal Directory or Azure AD. With AWS SSO, you get a unified administration experience to define, customize, and assign fine-grained access. Your workforce users get a user portal to access all their assigned AWS accounts, Amazon Elastic Compute Cloud (Amazon EC2) Windows instances, or cloud applications. AWS SSO can be flexibly configured to run alongside or replace AWS account access management via AWS Identity and Access Management (IAM).

The following diagram illustrates the solution architecture.
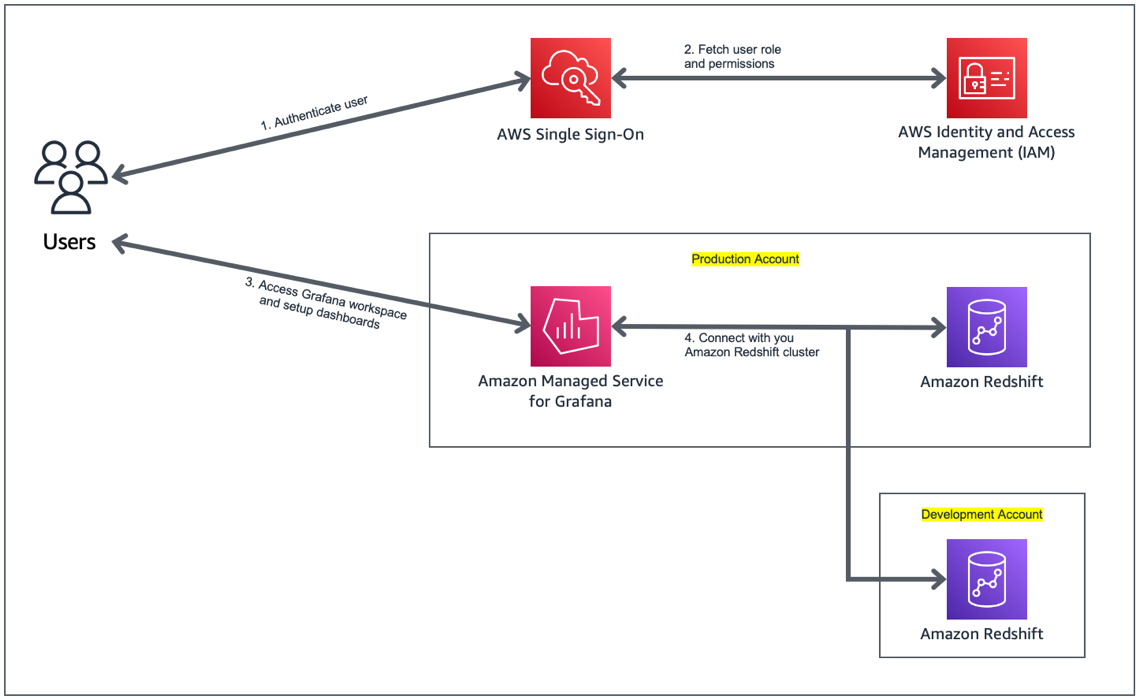
The solution includes the following components:

  • Captured metrics from the Amazon Redshift clusters in the development and production AWS accounts.
  • Amazon Managed Grafana, with the Amazon Redshift data source plugin added to it. Amazon Managed Grafana communicates with the Amazon Redshift cluster via the Amazon Redshift Data Service API.
  • The Grafana web UI, with the Amazon Redshift dashboard using the Amazon Redshift cluster as the data source. The web UI communicates with Amazon Managed Grafana via an HTTP API.

We walk you through the following steps in this post:

  1. Create a user in AWS SSO for Amazon Managed Grafana workspace access.
  2. Configure an Amazon Managed Grafana workspace.
  3. Set up two Amazon Redshift clusters as the data sources in Grafana.
  4. Import the Amazon Redshift dashboard supplied with the data source.
  5. Create a custom Amazon Redshift dashboard to visualize metrics from the Amazon Redshift clusters.

Prerequisites

To follow along with this post, you should have the following prerequisites:

Set up AWS SSO

In this section, we set up AWS SSO and register users.

In addition to AWS SSO integration, Amazon Managed Grafana also supports direct SAML integration with SAML 2.0 identity providers.

  1. If you don’t have AWS SSO enabled, open the AWS SSO console and choose Enable AWS SSO.
  2. After AWS SSO is enabled, choose Users in the navigation pane.
  3. Choose Add user.
  4. Enter the user details and choose Next: Groups.
  5. Choose Add user.

Set up your Amazon Grafana workspace

In this section, we demonstrate how to set up a Grafana workspace using Amazon Managed Grafana. We set up authentication using AWS SSO, register data sources, and add administrative users for the workspace.

  1. On the Amazon Managed Grafana console, choose Create workspace.
  2. For Workspace name, enter a suitable name.
  3. Choose Next.
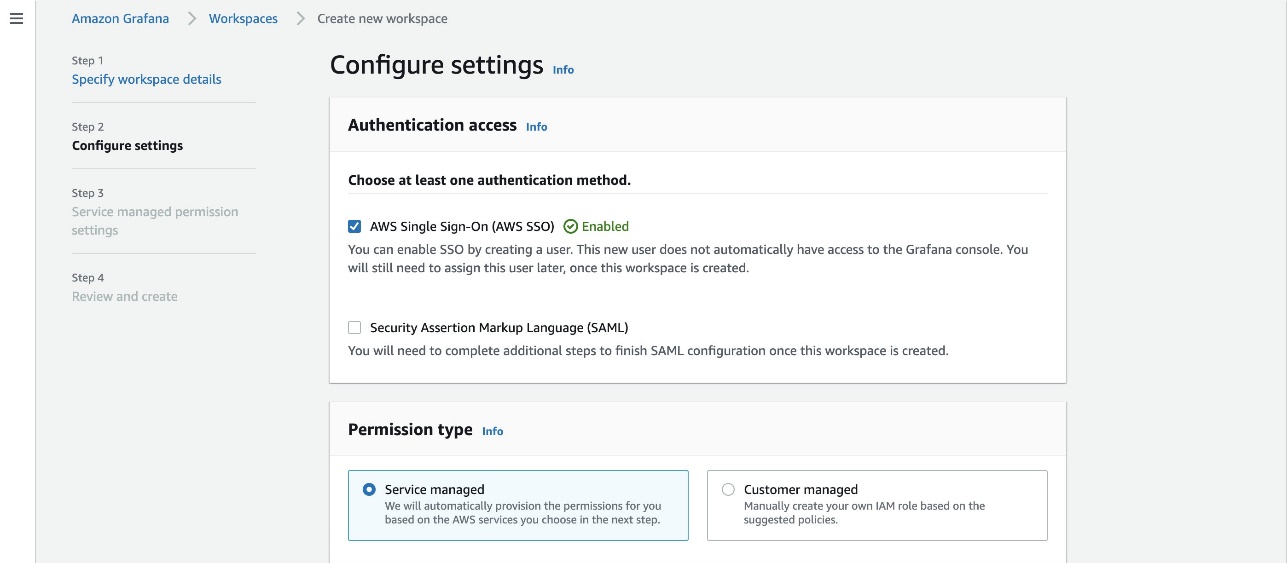
  4. For Authentication access, select AWS Single Sign-On.
  5. For Permission type, select Service managed.
  6. Choose Next.
  7. Select Current account.
  8. For Data sources, select Amazon Redshift.
  9. Choose Next.
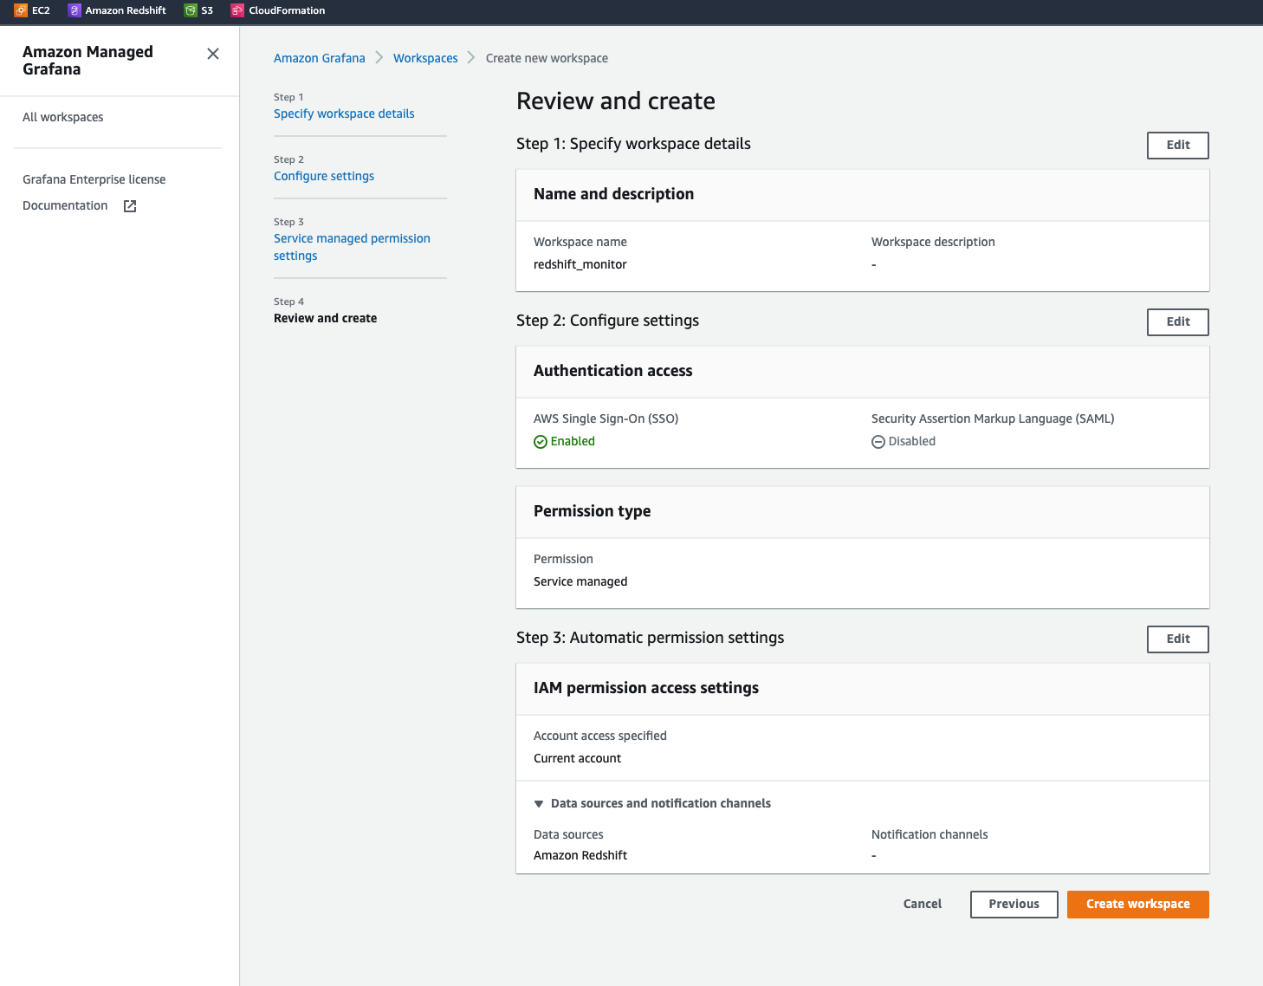
  10. Review the details and choose Create workspace.

    Now we assign a user to the workspace.
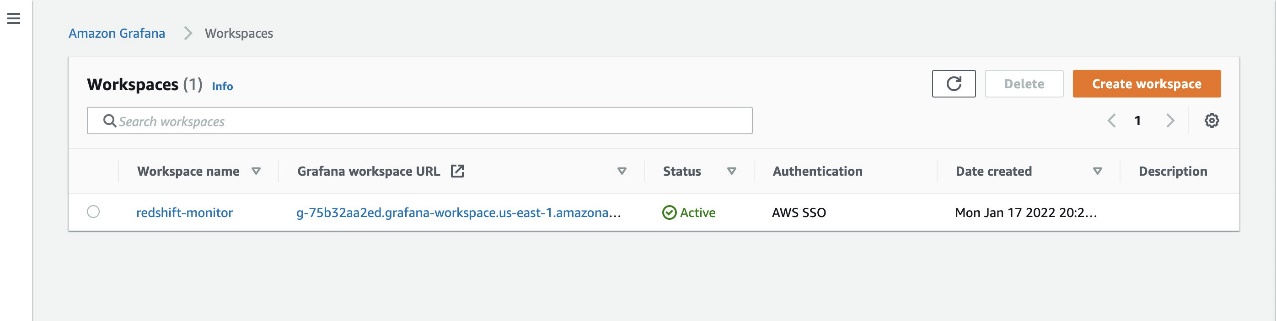
  11. On the Workspaces page, choose the workspace you created.
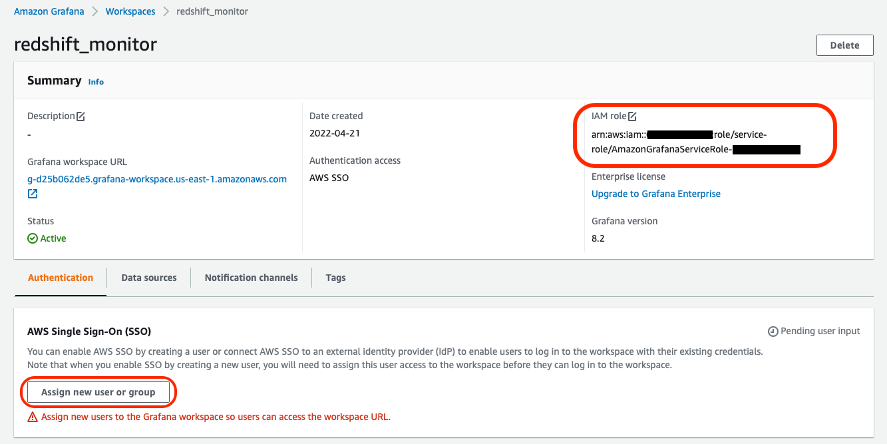
  12. Note the IAM role attached to your workspace.
  13. Choose Assign new user or group.
  14. Select the user to assign to the workspace.
  15. Choose Assign users and groups.

    For the purposes of this post, we need an admin user.
  16. To change the permissions of the user you just assigned, select the user name and choose Make admin.

For the cross-account setup, we use two Amazon Redshift clusters: production and development. In the next section, we configure IAM roles in both the production and development accounts so that the Grafana in the production account is able to connect to the Amazon Redshift clusters in the production account as well as in the development account.

Configure an IAM role for the development account

In this section, we set up the IAM role in the AWS account hosting the development environment. This role is assumed by the Amazon Managed Grafana service from the production AWS account to establish the connection between Amazon Managed Grafana and Amazon Redshift cluster in the development account.

  1. On the IAM console, choose Roles in the navigation pane.
  2. Choose Create role.
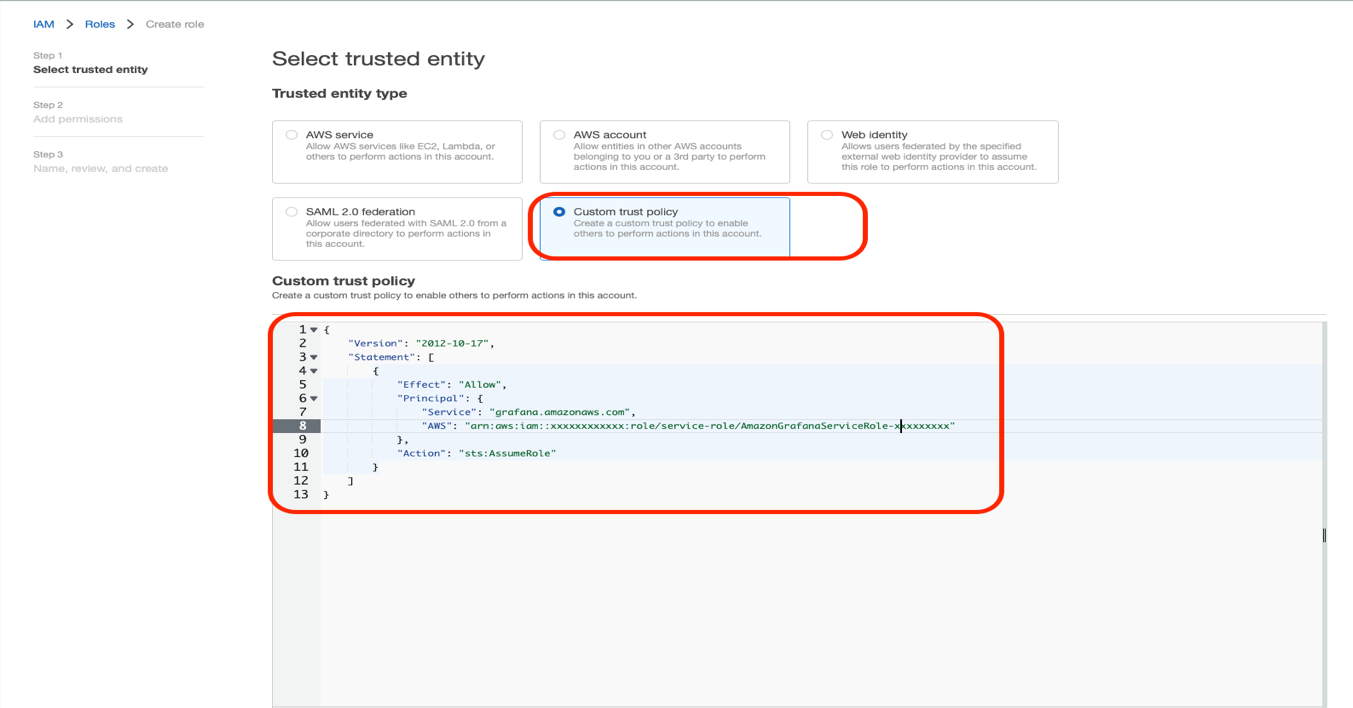
  3. Select Custom trust policy.
  4. Use the following policy code (update the account number for your production account and the Grafana service role attached to the workspace):
    {
        "Version": "2012-10-17",
        "Statement": [
            {
                "Effect": "Allow",
                "Principal": {
                    "AWS": "arn:aws:iam::<production-account-number>:role/service-role/AmazonGrafanaServiceRole-xxxxxxxxxx",
                    "Service": "grafana.amazonaws.com"
                },
                "Action": "sts:AssumeRole"
            }
        ]
    }

  5. Choose Next.
  6. Attach the managed IAM policy AmazonGrafanaRedshiftAccess to this role. For instructions, refer to Modifying a role permissions policy (console).
  7. Provide a role name, description, and tags (optional), and create the role.
Configure an IAM role for the production account

Next, we configure the IAM role created by the Amazon Managed Grafana service in order to establish the connection between Amazon Managed Grafana and the Amazon Redshift cluster in the production account.

  1. On the IAM console, choose Roles in the navigation pane.
  2. Search for the AmazonGrafanaServiceRole-xxxxxxx role attached to your Grafana workspace.
  3. Create an inline IAM policy and attach it to this role with the following policy code:
    {
    	"Version": "2012-10-17",
    	"Statement": [{
    		"Sid": "VisualEditor0",
    		"Effect": "Allow",
    		"Action": [
    			"sts:AssumeRole"
    		],
    		"Resource":"arn:aws:iam::<dev-account-number>:role/<DevAccountRoleName>"
    	}]
    }

  4. Provide a role name, description, and tags (optional), and create the role.

Import the default dashboard

In this section, we connect to the Amazon Redshift clusters in the production and development accounts from the Amazon Managed Grafana console and import the default dashboard.

  1. On the Amazon Managed Grafana console, choose Workspaces in the navigation pane.
  2. Choose the workspace you just created (authenticate and sign in if needed).
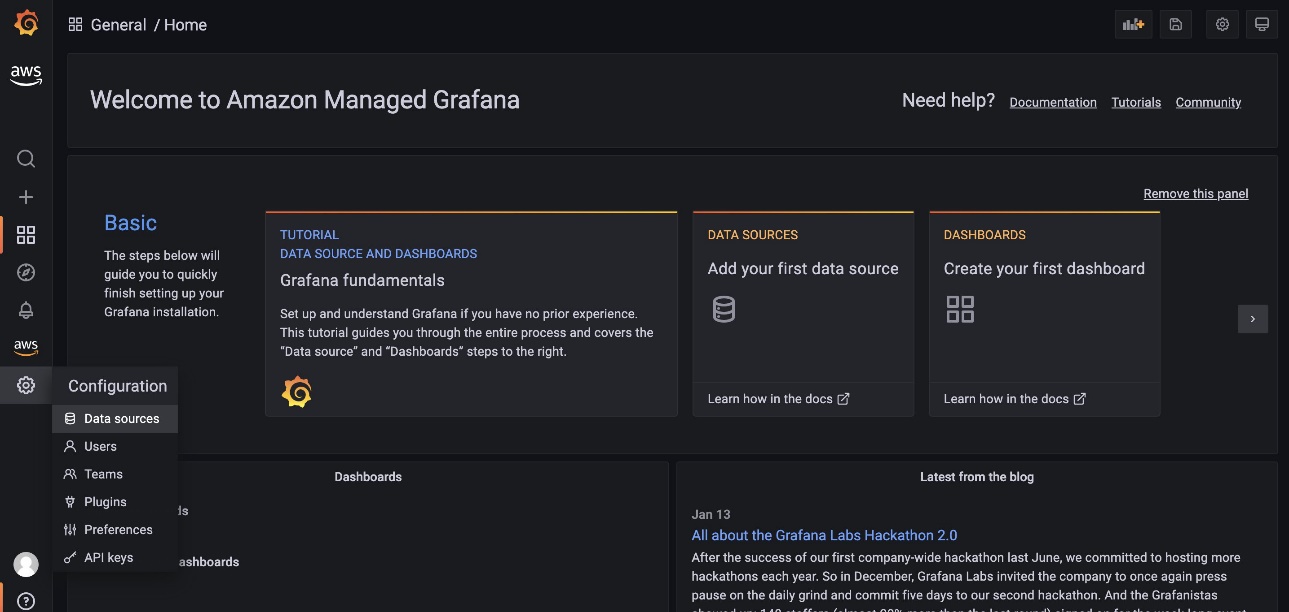
  3. In the navigation pane, choose Settings and on the Configuration menu, choose Data sources.
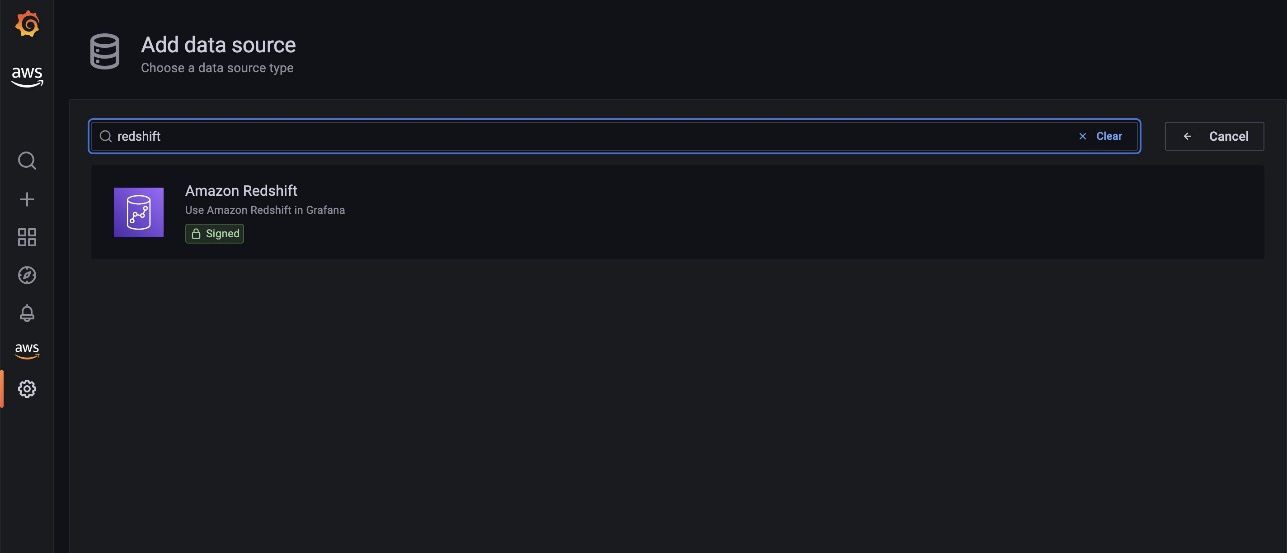
  4. Choose Add data source.
  5. Search for and choose Amazon Redshift.
  6. On the Settings tab, for Authentication provider, choose Workspace IAM role.
  7. For Default Region, choose us-east-1.
  8. Under Redshift Details, choose Temporary credentials.
  9. Enter the cluster identifier and database name for your Amazon Redshift cluster in the development account.
  10. For Database user, enter redshift_data_api_user.
  11. Choose Save & test.
    When the connection is successfully established, a message appears that the data source is working. You can now move on to the next step.
  12. Repeat these steps to add another data source to connect to the Amazon Redshift cluster in the development account.
  13. On the Settings tab, for Authentication provider, choose Workspace IAM role.
  14. Enter the workspace role as the ARN of the IAM role you created earlier (arn:aws:iam::dev-account-number:role/cross-account-role-name).
  15. For Default Region, choose us-east-1.
  16. Under Redshift Details, choose Temporary credentials.
  17. Enter the cluster identifier and database name for your Amazon Redshift cluster in the development account.
  18. For Database user, enter redshift_data_api_user.
  19. Choose Save & test.
    When the connection is successfully established, a message appears that the data source is working.
  20. On the Dashboards tab, choose Import next to Amazon Redshift.

On the dashboard page, you can change the data source between your production and development clusters on a drop-down menu.

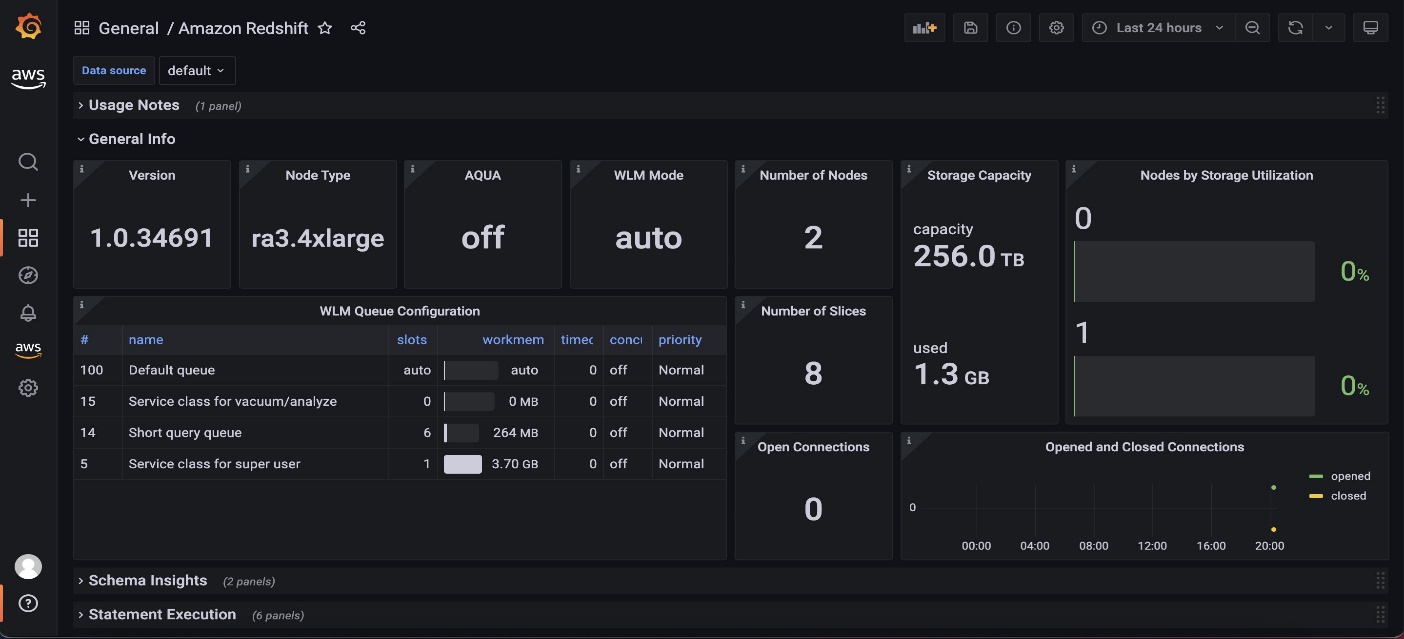
The default Amazon Redshift dashboard, as shown in the following screenshot, makes it easy to monitor the overall health of the cluster by showing different cluster metrics, like total storage capacity used, storage utilization per node, open and closed connections, WLM mode, AQUA status, and more.
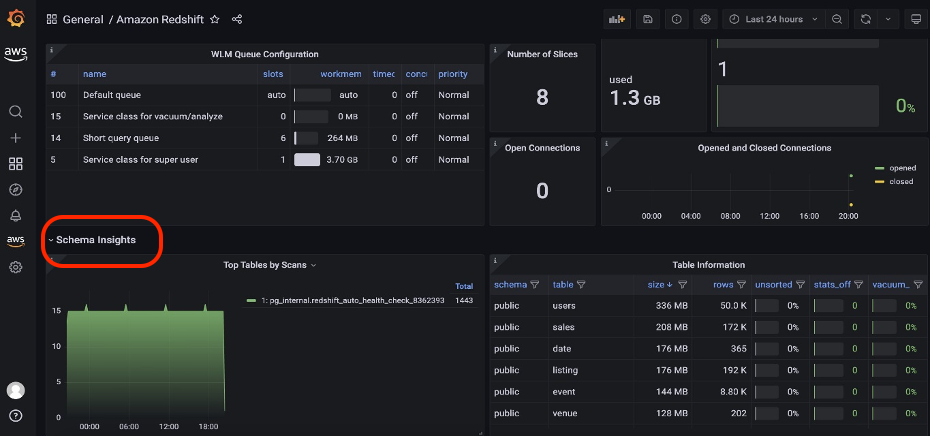
Additionally, the default dashboard displays several table-level metrics such as size of the tables, total number of rows, unsorted rows percentage, and more, in the Schema Insights section.
Add a custom dashboard for Amazon Redshift

The Amazon Redshift data source plugin allows you to query and visualize Amazon Redshift data metrics from within Amazon Managed Grafana. It’s preconfigured with general metrics. To add a custom metric from the Amazon Redshift cluster, complete the following steps:

  1. On the Amazon Managed Grafana console, choose All workspaces in the navigation pane.
  2. Choose the Grafana workspace URL for the workspace you want to modify.
  3. Choose Sign in with AWS SSO and provide your credentials.
  4. On the Amazon Managed Grafana workspace page, choose the plus sign and on the Create menu, choose Dashboard.
  5. Choose Add a new panel.
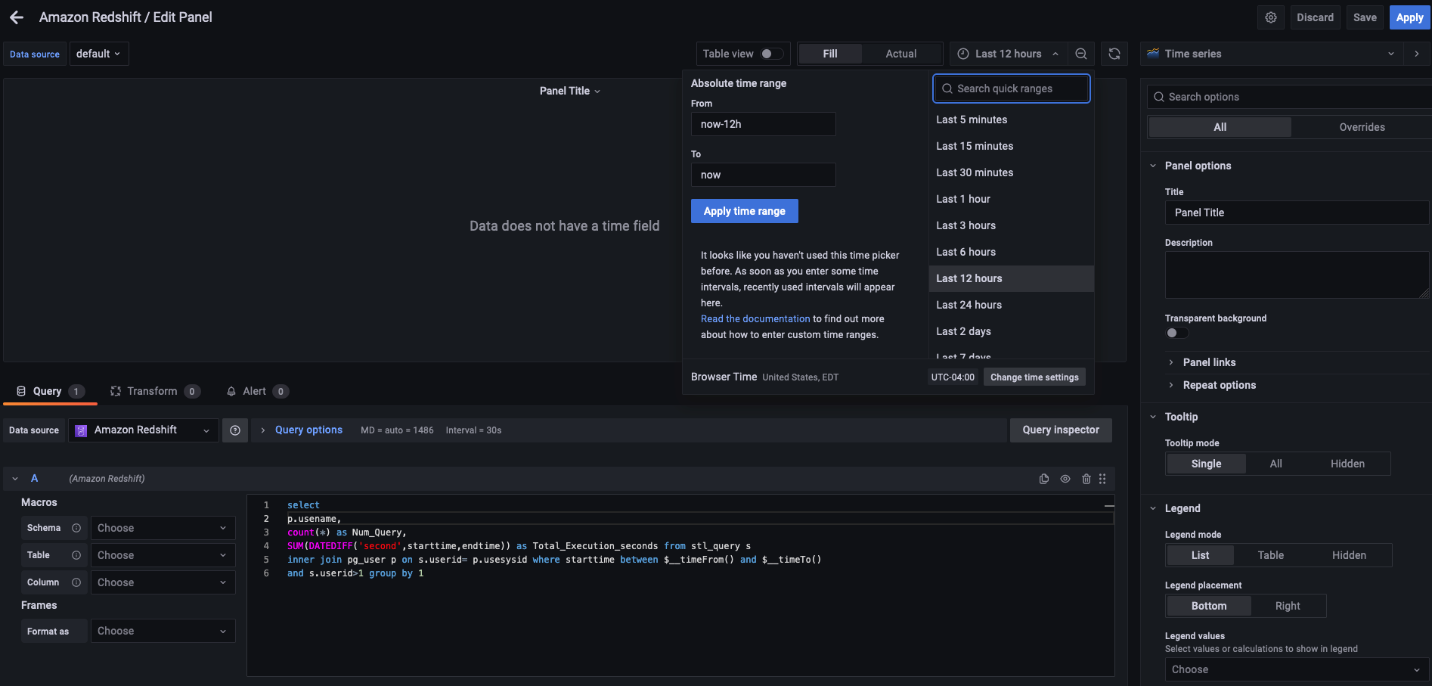
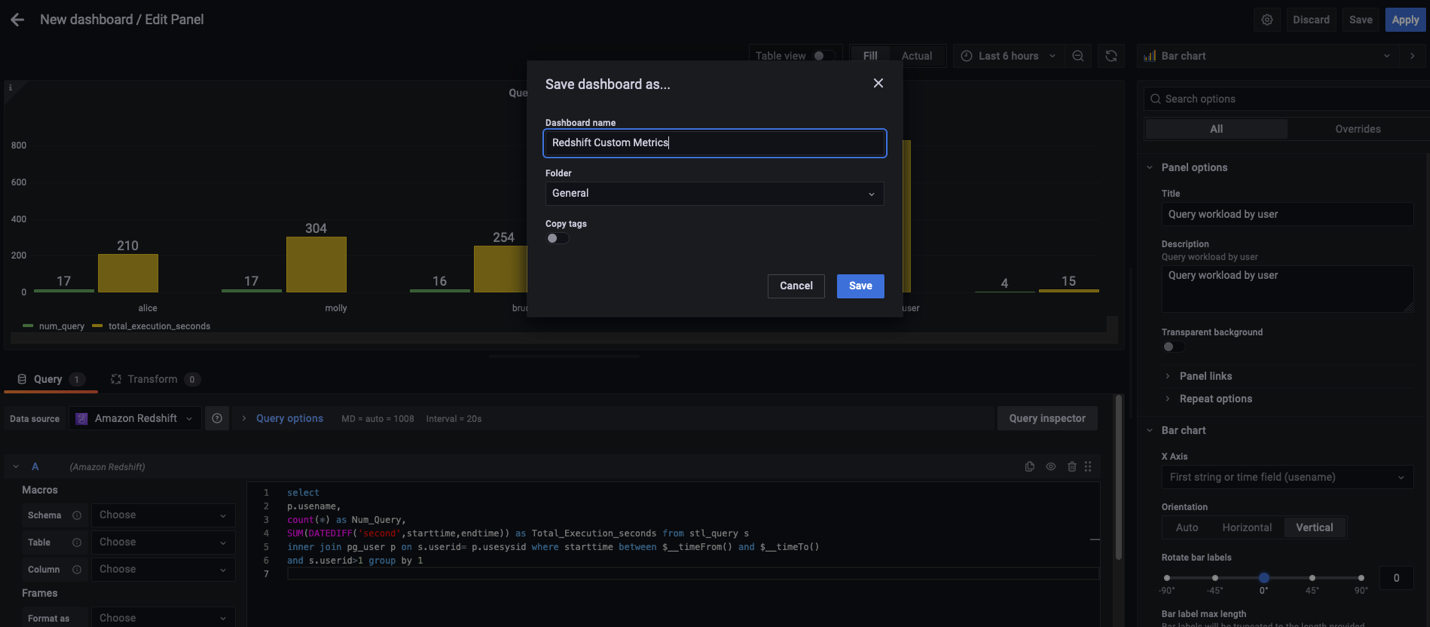
  6. Add the following custom SQL to get the data from the Amazon Redshift cluster:
    select 
    p.usename,
    count(*) as Num_Query,
    SUM(DATEDIFF('second',starttime,endtime)) as Total_Execution_seconds from stl_query s 
    inner join pg_user p on s.userid= p.usesysid where starttime between $__timeFrom() and $__timeTo()
    and s.userid>1 group by 1

    For this post, we use the default settings, but you can control and link the time range using the $__timeFrom() and $__timeTo() macros; they’re bound with the time range control of your dashboard. For more information and details about the supported expressions, see Query Redshift data.

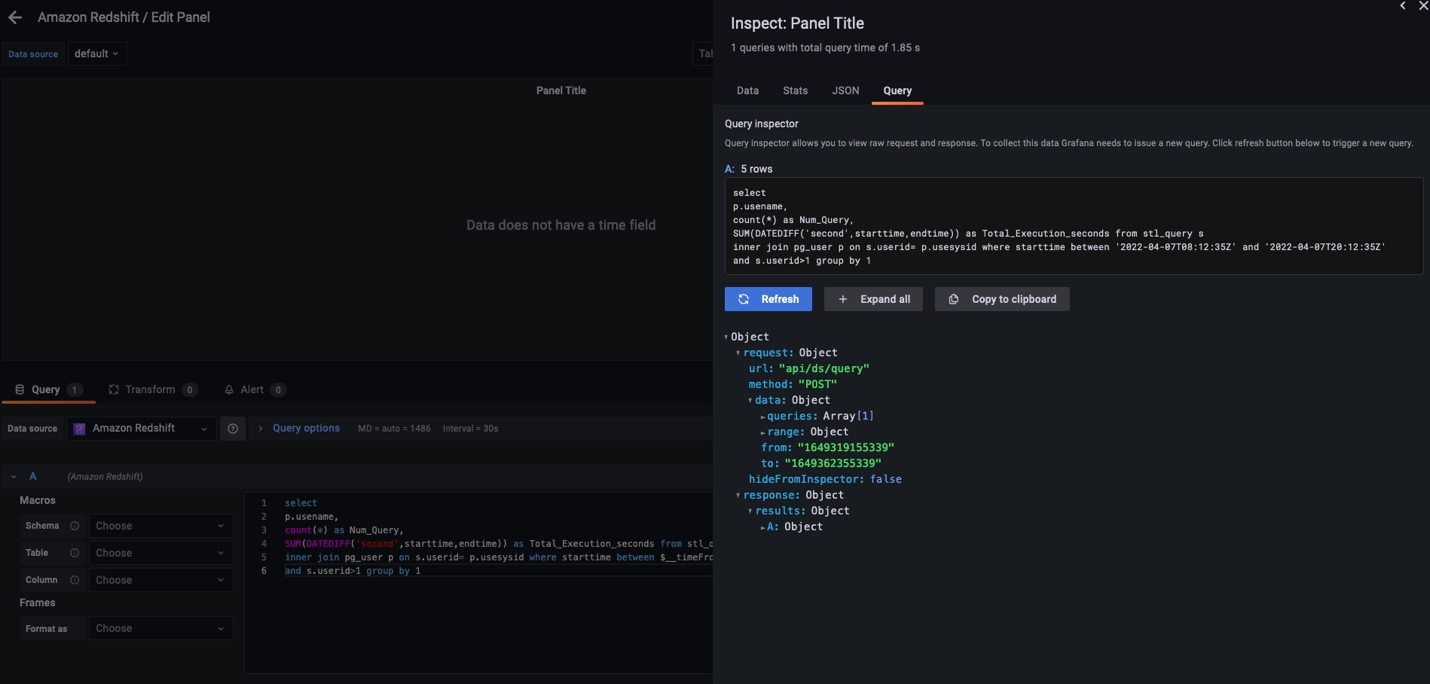
  7. To inspect the data, choose Query inspector to test the custom query outcome.
    Amazon Managed Grafana supports a variety of visualizations. For this post, we create a bar chart.
  8. On the Visualizations tab in the right pane, choose Bar chart.
  9. Enter a title and description for the custom chart, and leave all other properties as default.
    For more information about supported properties, see Visualizations.
  10. Choose Save.
  11. In the pop-up window, enter a dashboard name and choose Save.

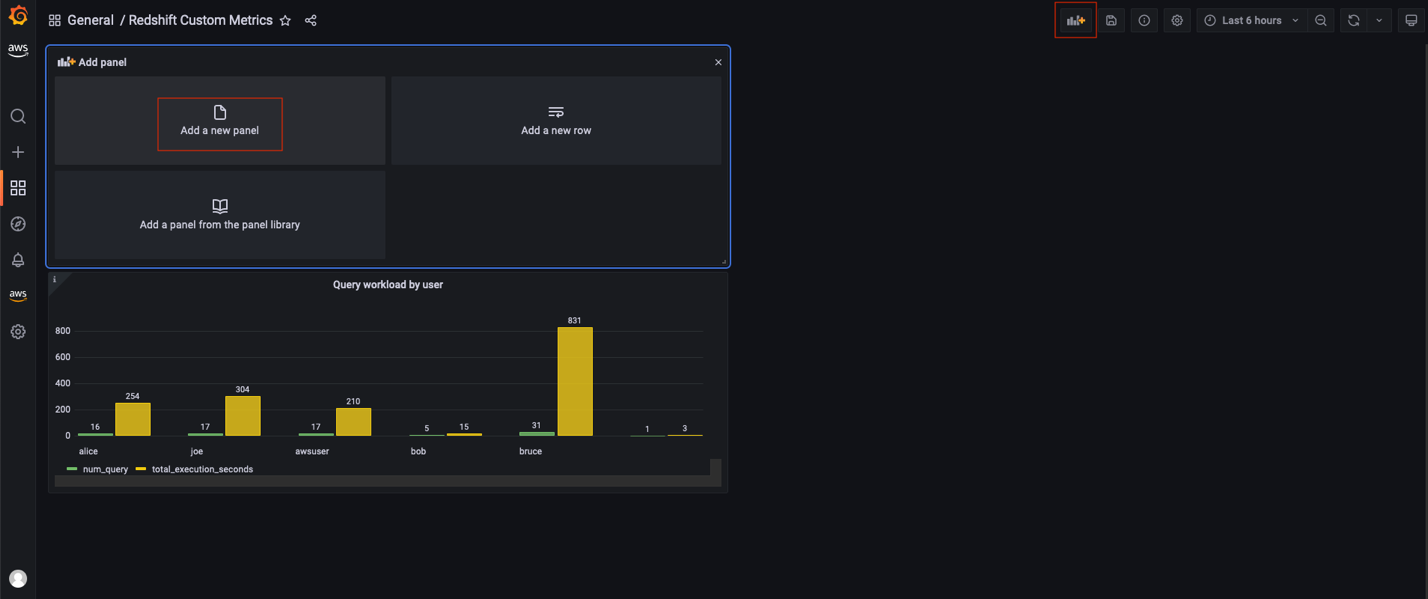
    A new dashboard is created with a custom metric.
  12. To add more metrics, choose the Add panel icon, choose Add a new panel, and repeat the previous steps.

Clean up

To avoid incurring future charges, complete the following steps:

  1. Delete the Amazon Managed Grafana workspace.
  2. If you created a new Amazon Redshift cluster for this demonstration, delete the cluster.

Conclusion

In this post, we demonstrated how to use AWS SSO and Amazon Managed Grafana to create an operational view to monitor the health and performance of Amazon Redshift clusters. We learned how to extend your default dashboard by adding custom and insightful dashboards to your Grafana workspace.

We look forward to hearing from you about your experience. If you have questions or suggestions, please leave a comment.


About the Authors

Tahir Aziz is an Analytics Solution Architect at AWS. He has worked with building data warehouses and big data solutions for over 13 years. He loves to help customers design end-to-end analytics solutions on AWS. Outside of work, he enjoys traveling and cooking.

Shawn Sachdev is a Sr. Analytics Specialist Solutions Architect at AWS. He works with customers and provides guidance to help them innovate and build well-architected and high-performance data warehouses and implement analytics at scale on the AWS platform. Before AWS, he worked in several analytics and system engineering roles. Outside of work, he loves watching sports, and is an avid foodie and craft beer enthusiast.

Ekta Ahuja is an Analytics Specialist Solutions Architect at AWS. She is passionate about helping customers build scalable and robust data and analytics solutions. Before AWS, she worked in several different data engineering and analytics roles. Outside of work, she enjoys baking, traveling, and board games.

Wielaard: Sourceware – GNU Toolchain Infrastructure roadmap

Post Syndicated from original https://lwn.net/Articles/898655/

Mark Wielaard writes
about improvements at Sourceware
, the site that holds the repository
for many projects in the GNU toolchain and beyond.

Although email based git workflows are great for real patch
discussions, they do not always make tracking the state of patches
easy. Just like our other services, such as bugzilla, mailinglists
and git repos, we like to provide zero maintenance infrastructure
for tracking and automation of patches and testing. So we are
trying to consolidate around a shared buildbot for (test)
automation and patchwork for tracking the state of
contributions.

Continually assessing application resilience with AWS Resilience Hub and AWS CodePipeline

Post Syndicated from Scott Bryen original https://aws.amazon.com/blogs/architecture/continually-assessing-application-resilience-with-aws-resilience-hub-and-aws-codepipeline/

As customers commit to a DevOps mindset and embrace a nearly continuous integration/continuous delivery model to implement change with a higher velocity, assessing every change impact on an application resilience is key. This blog shows an architecture pattern for automating resiliency assessments as part of your CI/CD pipeline. Automatically running a resiliency assessment within CI/CD pipelines, development teams can fail fast and understand quickly if a change negatively impacts an applications resilience. The pipeline can stop the deployment into further environments, such as QA/UAT and Production, until the resilience issues have been improved.

AWS Resilience Hub is a managed service that gives you a central place to define, validate and track the resiliency of your AWS applications. It is integrated with AWS Fault Injection Simulator (FIS), a chaos engineering service, to provide fault-injection simulations of real-world failures. Using AWS Resilience Hub, you can assess your applications to uncover potential resilience enhancements. This will allow you to validate your applications recovery time (RTO), recovery point (RPO) objectives and optimize business continuity while reducing recovery costs. Resilience Hub also provides APIs for you to integrate its assessment and testing into your CI/CD pipelines for ongoing resilience validation.

AWS CodePipeline is a fully managed continuous delivery service for fast and reliable application and infrastructure updates. You can use AWS CodePipeline to model and automate your software release processes. This enables you to increase the speed and quality of your software updates by running all new changes through a consistent set of quality checks.

Continuous resilience assessments

Figure 1 shows the resilience assessments automation architecture in a multi-account setup. AWS CodePipeline, AWS Step Functions, and AWS Resilience Hub are defined in your deployment account while the application AWS CloudFormation stacks are imported from your workload account. This pattern relies on AWS Resilience Hub ability to import CloudFormation stacks from a different accounts, regions, or both, when discovering an application structure.

High-level architecture pattern for automating resilience assessments

Figure 1. High-level architecture pattern for automating resilience assessments

Add application to AWS Resilience Hub

Begin by adding your application to AWS Resilience Hub and assigning a resilience policy. This can be done via the AWS Management Console or using CloudFormation. In this instance, the application has been created through the AWS Management Console. Sebastien Stormacq’s post, Measure and Improve Your Application Resilience with AWS Resilience Hub, walks you through how to add your application to AWS Resilience Hub.

In a multi-account environment, customers typically have dedicated AWS workload account per environment and we recommend you separate CI/CD capabilities into another account. In this post, the AWS Resilience Hub application has been created in the deployment account and the resources have been discovered using an CloudFormation stack from the workload account. Proper permissions are required to use AWS Resilience Hub to manage application in multiple accounts.

Adding application to AWS Resilience Hub

Figure 2. Adding application to AWS Resilience Hub

Create AWS Step Function to run resilience assessment

Whenever you make a change to your application CloudFormation, you need to update and publish the latest version in AWS Resilience Hub to ensure you are assessing the latest changes. Now that AWS Step Functions SDK integrations support AWS Resilience Hub, you can build a state machine to coordinate the process, which will be triggered from AWS Code Pipeline.

AWS Step Functions is a low-code, visual workflow service that developers use to build distributed applications, automate IT and business processes, and build data and machine learning pipelines using AWS services. Workflows manage failures, retries, parallelization, service integrations, and observability so developers can focus on higher-value business logic.

AWS Step Function for orchestrating AWS SDK calls

Figure 3. AWS Step Function for orchestrating AWS SDK calls

  1. The first step in the workflow is to update the resources associated with the application defined in AWS Resilience Hub by calling ImportResourcesToDraftApplication.
  2. Check for the import process to complete using a wait state, a call to DescribeDraftAppVersionResourcesImportStatus and then a choice state to decide whether to progress or continue waiting.
  3. Once complete, publish the draft application by calling PublishAppVersion to ensure we are assessing the latest version.
  4. Once published, call StartAppAssessment to kick-off a resilience assessment.
  5. Check for the assessment to complete using a wait state, a call to DescribeAppAssessment and then a choice state to decide whether to progress or continue waiting.
  6. In the choice state, use assessment status from the response to determine if the assessment is pending, in progress or successful.
  7. If successful, use the compliance status from the response to determine whether to progress to success or fail.
    • Compliance status will be either “PolicyMet” or “PolicyBreached”.
  8. If policy breached, publish onto SNS to alert the development team before moving to fail.

Create stage within code pipeline

Now that we have the AWS Step Function created, we need to integrate it into our pipeline. The post Fine-grained Continuous Delivery With CodePipeline and AWS Step Functions demonstrates how you can trigger a step function from AWS Code Pipeline.

When adding the stage, you need to pass the ARN of the stack which was deployed in the previous stage as well as the ARN of the application in AWS Resilience Hub. These will be required on the AWS SDK calls and you can pass this in as a literal.

AWS CodePipeline stage step function input

Figure 4. AWS CodePipeline stage step function input

Example state using the input from AWS CodePipeline stage

Figure 5. Example state using the input from AWS CodePipeline stage

For more information about these AWS SDK calls, please refer to the AWS Resilience Hub API Reference documents.

Customers often run their workloads in lower environments in a less resilient way to save on cost. It’s important to add the assessment stage at the appropriate point of your pipeline. We recommend adding this to your pipeline after the deployment to a test environment which mirrors production but before deploying to production. By doing this you can fail fast and halt changes which will lower resilience in production.

A note on service quotas: AWS Resilience Hub allows you to run 20 assessments per month per application. If you need to increase this quota, please raise a ticket with AWS Support.

Conclusion

In this post, we have seen an approach to continuously assessing resilience as part of your CI/CD pipeline using AWS Resilience Hub, AWS CodePipeline and AWS Step Functions. This approach will enable you to understand fast if a change will weaken resilience.

AWS Resilience Hub also generates recommended AWS FIS Experiments that you can deploy and use to test the resilience of your application. As well as assessing the resilience, we also recommend you integrate running these tests into your pipeline. The post Chaos Testing with AWS Fault Injection Simulator and AWS CodePipeline demonstrates how you can active this.

[$] Introducing PyScript

Post Syndicated from original https://lwn.net/Articles/898452/

In a keynote at PyCon 2022 in Salt
Lake City, Utah, Peter Wang introduced another entrant in the field of
in-browser Python interpreters. The Python community has long sought a way
to be able to write Python—instead of JavaScript—to run in web browsers, and there
have been various efforts to do so over the years. Wang announced PyScript as a new framework, built atop
one of those earlier projects, to allow
Python scripting directly within the browser; those programs have access to
much of the existing Python ecosystem as well as being able to interact
with the browser document object model (DOM) directly.
In addition, he gave some rather eye-opening demonstrations as part of the talk.

[Security Nation] Steve Micallef of SpiderFoot on Open-Source Intelligence

Post Syndicated from Rapid7 original https://blog.rapid7.com/2022/06/22/security-nation-steve-micallef-of-spiderfoot-on-open-source-intelligence/

[Security Nation] Steve Micallef of SpiderFoot on Open-Source Intelligence

In this episode of Security Nation, Jen and Tod chat with Steve Micallef about SpiderFoot, the open-source intelligence tool of which he is the creator and founder. He tells us how the platform went from a passion project to a fully fledged open-source offering, with a SaaS option to boot, and how it can help security engineers automate tasks and focus on finding the major threats in their data.

Stick around for our Rapid Rundown, where Tod chats with producer Jesse about a new paper that reveals all is not as it seems with CVSS scores.

Steve Micallef

[Security Nation] Steve Micallef of SpiderFoot on Open-Source Intelligence

Steve Micallef is the author of SpiderFoot (www.spiderfoot.net), an open-source OSINT automation platform. You can follow him @binarypool on Twitter.

Show notes

Interview links

Rapid Rundown links

  • Read the full paper, “A Closer Look at CVSS Scores.”
  • Follow the author, Jacques Chester, on Twitter.

Like the show? Want to keep Jen and Tod in the podcasting business? Feel free to rate and review with your favorite podcast purveyor, like Apple Podcasts.

Want More Inspiring Stories From the Security Community?

Subscribe to Security Nation Today

Managing multi-tenant APIs using Amazon API Gateway

Post Syndicated from James Beswick original https://aws.amazon.com/blogs/compute/managing-multi-tenant-apis-using-amazon-api-gateway/

This post is written by Satish Mane, Solutions Architect.

Many ISVs provide platforms as a service in a multi-tenant environment. You can achieve multi-tenancy by partitioning the platform based on customer identifiers such as customer ID or account ID. The architecture for multi-tenant environments is often composed of authentication, authorization, a service layer, queues, and databases.

The primary focus of these architectures is to simplify the addition of more features. The multi-tenant design pattern has opened up new challenges and opportunities for software vendors thanks to microservice architectures gaining popularity. The challenge in a multi-tenant environment is that excessive load by a single customer, because of many requests to an API, can affect the entire platform.

This blog post looks at how to protect and monetize multi-tenant APIs using Amazon API Gateway. It describes a multi-tenant architecture design pattern based on a custom tenant ID to onboard customers. A tenant in a multi-tenant platform represents the customer having a group of users with common access, but individuals having specific permissions to the platform.

Overview

This example protects multi-tenant platform REST APIs using Amazon Cognito, Amazon API Gateway, and AWS Lambda.

In the following sections, you learn how to use the API Gateway’s usage plans to protect and productize multi-tenant platforms. Usage plans enable throttling of excessive API requests and apply an API usage quota policy. The user authenticates using Amazon Cognito to get a JSON Web Token (JWT) that is passed to API Gateway for authorization.

The multi-tenant platform that exposes REST APIs has clients such as a mobile app, a web application, and API clients that consume the REST APIs. This post focuses on protecting REST APIs with Amazon Cognito as the security layer for authenticating users and issuing tokens using OpenID Connect. The token contains the customer identity information, such as the tenant ID to which the users belong. API Gateway throttles the requests from a tenant only after the limit defined in the usage plans exceeds.

Architecture

This architecture shows the flow of user requests:

  1. The client application sends a request to Amazon Cognito using the /oauth/authorize or /login API. Amazon Cognito authenticates the user credentials.
  2. Amazon Cognito redirects using an authorization code grant and prompts the user to enter credentials. After authentication, it returns the authorization code.
  3. It then passes the authorization code to obtain a JWT from Amazon Cognito.
  4. Upon successful authentication, Amazon Cognito returns a JWT, such as acccess_token, id_token, refresh_token. The access/id token stores information about the granted permissions including tenant ID to which this user belongs to.
  5. The client application invokes the REST API that is deployed in API Gateway. The API request passes the JWT as a bearer token in the API request Authorization header.
  6. Since the tenant ID is hidden in the encrypted JWT token, the Lambda authorizer function validates and decodes the token, and extracts the tenant ID from the JWT.
  7. The Lambda token authorizer function returns an IAM policy along with tenant ID from the decoded token to which a user belongs.
  8. The application’s REST API is configured with usage plans against a custom API key, which is the tenant ID in API Gateway. API Gateway evaluates the IAM policy and looks up the usage policy using the API key. It throttles API requests if the number of requests exceed the throttle or quota limits in the usage policy.
  9. If the number of API requests is within the limit, then API Gateway sends requests to the downstream application REST API. This could be deployed using containers, Lambda, or an Amazon EC2 instance.

Customer (tenant) onboarding

There are multiple ways to set up multi-tenant applications. You can either create tenant-specific pools or add tenant ID as a custom attribute in each user profile. This blog uses the latter approach. The tenant ID is added to the JWT after successful authentication.

Since, tenant ID is an API key in API Gateway, the length of tenant ID must be a minimum of 20 characters. You can define the structure of tenant ID such as <customer id>-<random string>. As part of tenant onboarding, you can automate configuring the API key and usage plans in API Gateway using CDK APIs. Here, you configure the API key and usage plan as part of the solution deployment itself.

Authentication and authorization

You need a user pool and application client enabled with the authorization code mechanism for authenticating users. API Gateway can verify JWT OAuth tokens against single Amazon Cognito user pools. To get tenant information (tenant ID), use a custom Lambda authorizer function in API Gateway to verify the token, extract the tenant id, and return to API Gateway.

API Gateway usage plans

API Gateway supports the usage plan feature for REST APIs only. This solution uses an integration point as a MOCK integration type. You can use the usage plan to set the throttle and quota limit that are associated with API keys. API keys can be generated or you can use a custom key. To enforce usage plans for each tenant separately, use tenant ID as a prefix to a uniquely generated value to prepare the custom API key.

Configure API Gateway to integrate API key and Usage plan

You need to enable REST API to use the API key and set the source to AUTHORIZER. There are two ways to accept API keys for every incoming request. You can supply it as part of the incoming request HEADER or via a custom authorizer Lambda function. This example uses a custom authorizer Lambda function to retrieve the API key that is extracted from the JWT received through an incoming API request. Customers only pass encrypted JWTs in the request authorization header. These steps are automated using the AWS CDK.

Pre-requisites

Deploying the example

The example source code is available on GitHub. To deploy and configure solution:

  1. Clone the repository to your local machine.
    git clone https://github.com/aws-samples/api-gateway-usage-policy-based-api-protection
  2. Prepare the deployment package.
    cdk synth
    npm run build
    npm install --prefix aws-usage-policy-stack/lambda/src
  3. Configure the user pool in Amazon Cognito.
    npx cdk deploy CognitoStack
  4. Open the AWS Management Console and navigate to Amazon Cognito. Choose Manage user pool and select your user pool. Note down the pool ID under general settings.
    User pool
  5. Create a user with a tenant ID.
    aws cognito-idp admin-create-user --user-pool-id <REPLACE WITH COGNITO POOL ID> --username <REPLACE WITH USERNAME> \
    --user-attributes Name="given_name",Value="<REPLACE WITH FIRST NAME>" Name="family_name",Value="<REPLACE WITH LAST NAME>" " Name="custom:tenant_id",Value="<REPLACE WITH CUSTOMER ID>" \
    --temporary-password change1t
    
  6. To simplify testing the OAuth flow, use https://openidconnect.net/. In the configuration, set the JWKS well known URI.
    https://cognito-idp.<REPLACE WITH AWS REGION>.amazonaws.com/<REPLACE WITH COGNITO POOL ID>/.well-known/openid-configuration
  7. Test the OAuth flow with https://openidconnect.net/ to fetch the JWT ID token. Save the token in a text editor for later use.
  8. Open aws-usage-policy-stack/app.ts in an IDE and replace “NOT_DEFINED” with the 20-character long tenant ID from the previous section.
  9. Configure the user pool in API Gateway and create the Lambda function:
    npx cdk deploy ApigatewayStack
  10. After successfully deploying the API Gateway stack, open the AWS Management Console and select API Gateway. Locate ProductRestApi in the name column and note its ID.
    API Gateway console

Testing the example

Test the example using the following curl command. It throttles the requests to the deployed API based on defined limits and quotas. The following thresholds are preset: API quota limit of 5 requests/day, throttle limit of 10 requests/second, and a burst limit of 2 requests/second.

To simulate the scenario and start throttling requests.

  1. Open a terminal window.
  2. Install the curl utility if necessary.
  3. Run the following command six times after replacing placeholders with the correct values.
    curl -H "Authorization: Bearer <REPLACE WITH ID_TOKEN received in step 7 of Deploy Amazon Cognito Resources>" -X GET https://<REPLACE WITH REST API ID noted in step 10 of Deploy Amazon API Gateway resources>.execute-api.eu-west-1.amazonaws.com/dev/products.

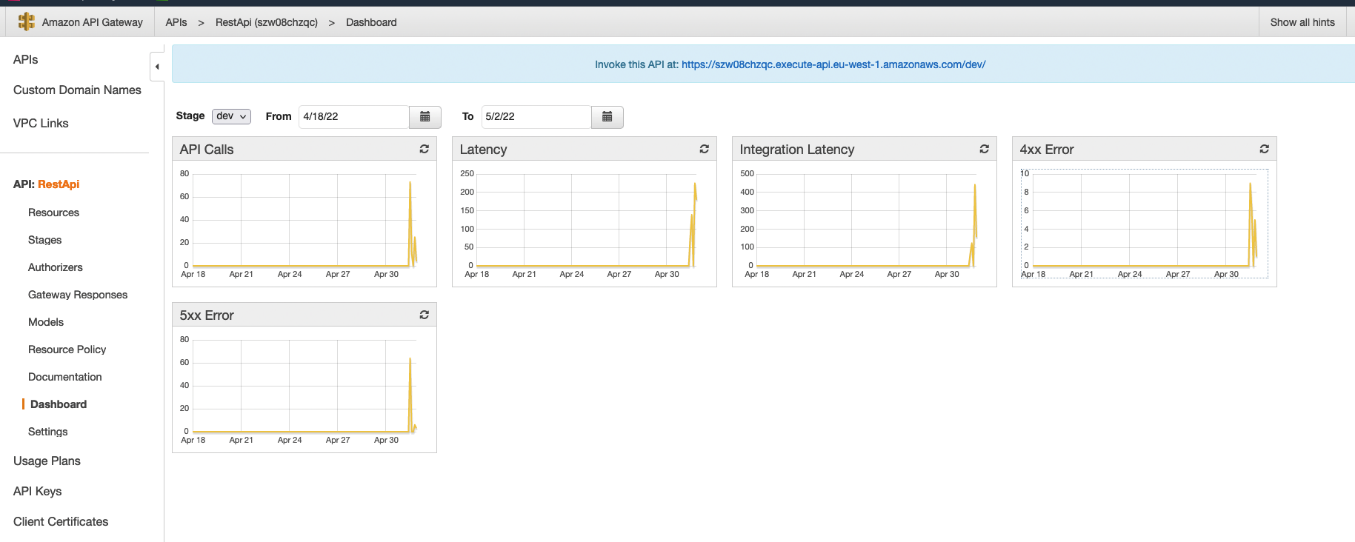
You receive the message {“message”: “Limit Exceeded”} after you run the command for the sixth time. To repeat the tests, navigate to the API Gateway console. Change the quota limits in the usage plan and run the preceding command again. You can monitor HTTP/2 429 exceptions (Limit Exceeded) in API Gateway dashboard.

API Gateway console

Any changes to usage plan limits do not need redeployment of the API in API Gateway. You can change limits dynamically. Changes take a few seconds to become effective.

Cleaning up

To avoid incurring future charges, clean up the resources created. To delete the CDK stack, use the following command. Since there are multiple stacks, you must explicitly specify the name of the stacks.

cdk destroy CognitoStack ApigatewayStack

Conclusion

This post covers the API Gateway usage plan feature to protect multi-tenant APIs from excessive request loads and also as a product offering that enforces customer specific usage quotas.

To learn more about Amazon API Gateway, refer to Amazon API Gateway documentation. For more serverless learning resources, visit Serverless Land.

How to Secure App Development in the Cloud, With Tips From Gartner

Post Syndicated from Ben Austin original https://blog.rapid7.com/2022/06/22/how-to-secure-app-development-in-the-cloud-with-tips-from-gartner/

How to Secure App Development in the Cloud, With Tips From Gartner

Building applications in the cloud has been great for development speed and scalability, but it can sometimes feel more like a sustained migraine for security teams. How do you keep your cloud applications safe without resorting to a dizzying patchwork of overlapping tools and dispersed services?

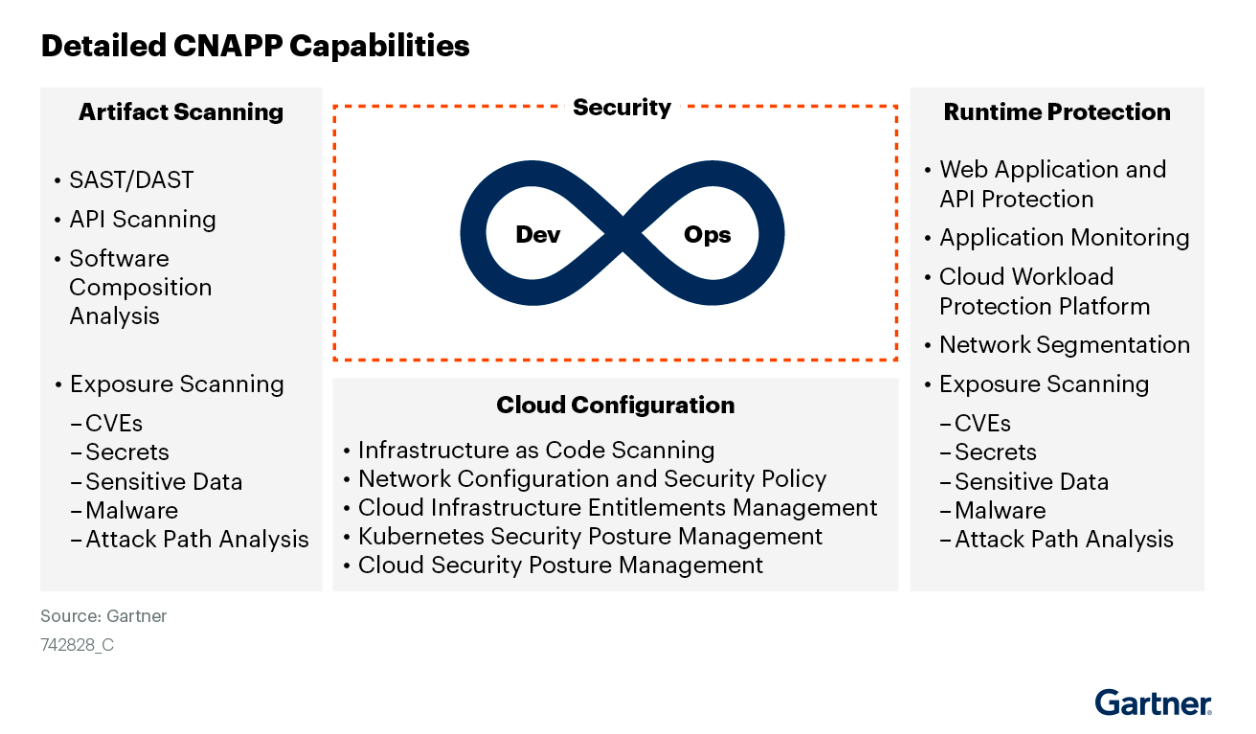
Gartner® research on “Innovation Insight for Cloud-Native Application Protection Platforms” breaks down the core capabilities required to effectively reduce risk in your cloud environment, and how they might come together into a single solution or ecosystem to relieve your security headaches.

You can read the full report here. But if you’re tight for time, or just want to get a preview first, we’ve got you covered in this post.

At a high level, here’s what Gartner found in its research into cloud-native application protection platforms (CNAPP):

  • “To support [digital] initiatives, developers have embraced cloud-native application development, typically combining microservices-based architectures built using containers, assembled in DevOps-style development pipelines, deployed into programmatic cloud infrastructure and orchestrated at runtime using Kubernetes and maintained with an immutable infrastructure mindset. This shift creates significant challenges in securing these applications.”
  • “The unique characteristics of cloud-native applications makes them impossible to secure without a complex set of overlapping tools spanning development and production,” including infrastructure as code (IaC) scanning, cloud workload protection platforms (CWPP), cloud infrastructure entitlement management (CIEM), cloud security posture management (CSPM), and container management.
  • “Understanding and addressing the real risk of cloud-native applications requires advanced analytics combining siloed views of application risk, open-source component risk, cloud infrastructure risk, and runtime workload risk.”

Gartner also has a few recommendations for how to handle this new security paradigm:

  • “Implement an integrated security approach that covers the entire life cycle of cloud-native applications, starting in development and extending into production.”
  • “Integrate security into the developer’s toolchain so that security testing is automated as code is created and moves through the development pipeline, reducing the friction of adoption.”
  • “[Security and risk management] leaders should evaluate emerging cloud-native application protection platforms that provide a complete life cycle approach for security.”

Basically, securing app development in the cloud effectively is going to require tools that let you consolidate core security functions, get a clear view of your environment (and the risks it may contain), and empower your developers to incorporate security into the security pipeline.

So, what’s our take?

CNAPP represents the next evolution of cloud security through the unification of previously siloed feature sets or solutions. In previous years, just having tools that did one or more of these core functions provided by separate vendors was “good enough.” But over time, as cloud security programs across enterprises continued to scale and mature, it became clear that the dispersed nature of these tools made it extremely difficult, if not impossible, to get a true understanding of risk across complex cloud environments and make meaningful progress in operationalizing cloud security.

CNAPP is essentially a mindset that can save organizations from having to deploy a new set of technologies. It’s the idea that teams need a consolidated view of the different risks in their environment at the infrastructure, workload, orchestration, or API level, as well as unified workflows and automation capabilities to effectively mitigate those risks.

How to Secure App Development in the Cloud, With Tips From Gartner

The reality today, however, is that very few vendors can actually live up to the high bar that Gartner has set with CNAPP. The capabilities shown on the diagram above are extremely wide-ranging and span across multiple teams (DevSecOps and more) within an organization.

CNAPP is about more than just identifying a shopping list of capabilities that your security team needs. When considering how to build out a program to protect cloud-native applications, security teams should focus on driving toward a set of outcomes they hope to achieve. Gartner doesn’t define these outcomes in their CNAPP report, but based on our experience working with some of the most sophisticated cloud and application security teams in the world, some of those desired outcomes may include:

  1. An up-to-date, easily maintainable inventory of all infrastructure, workloads, and apps that make up your organization’s entire cloud footprint
  2. Centralized reporting on risk across the full application stack, including open-source and third-party components
  3. Ongoing, real-time monitoring of suspicious or malicious activity at both the application and infrastructure levels
  4. Integration into the development team’s CI/CD pipeline in order to prevent risks at scale before code is deployed
  5. Automated workflows, both for notification and remediation, to detect and respond to threats as quickly as possible, with minimal human intervention

Each team’s list of outcomes will vary slightly depending on operational maturity, compliance requirements, size and complexity of the cloud environment, and what types of applications they are protecting. Keeping these five outcomes top of mind while evaluating solutions will help your team build from a solid foundation and avoid simply checking boxes off a long list of capabilities.

CNAPP may be a mindset shift first and foremost – but at the end of the day, the capabilities needed to achieve this more holistic approach to cloud and application security have to live somewhere within your technology stack. A unified platform that supports all these needs can help break down unnecessary silos and make it easier to contextualize your security data across the entire cloud infrastructure.

GARTNER is a registered trademark and service mark of Gartner, Inc. and/or its affiliates in the U.S. and internationally and is used herein with permission. All rights reserved.

Gartner, Innovation Insight for Cloud-Native Application Protection Programs, by Neil MacDonald, Charlie Winckless, 25 August 2021

Additional reading:

NEVER MISS A BLOG

Get the latest stories, expertise, and news about security today.

Security updates for Wednesday

Post Syndicated from original https://lwn.net/Articles/898605/

Security updates have been issued by Debian (exo and ntfs-3g), Fedora (collectd, golang-github-cli-gh, grub2, qemu, and xen), Red Hat (httpd:2.4, kernel, and postgresql), SUSE (drbd, fwupdate, neomutt, and trivy), and Ubuntu (apache2, openssl, openssl1.0, and qemu).

Verify Apple devices with no installed software

Post Syndicated from Kenny Johnson original https://blog.cloudflare.com/private-attestation-token-device-posture/

Verify Apple devices with no installed software

Verify Apple devices with no installed software

One of the foundations of Zero Trust is determining if a user’s device is “healthy” — that it has its operating system up-to-date with the latest security patches, that it’s not jailbroken, that it doesn’t have malware installed, and so on. Traditionally, determining this has required installing software directly onto a user’s device.

Earlier this month, Cloudflare participated in the announcement of an open source standard called a Private Attestation Token. Device manufacturers who support the standard can now supply a Private Attestation Token with any request made by one of their devices. On the IT Administration side, Private Attestation Tokens means that security teams can verify a user’s device before they access a sensitive application — without the need to install any software or collect a user’s device data.

At WWDC 2022, Apple announced Private Attestation Tokens. Today, we’re announcing that Cloudflare Access will support verifying a Private Attestation token. This means that security teams that rely on Cloudflare Access can verify a user’s Apple device before they access a sensitive application — no additional software required.

Determining a “healthy” device

There are many solutions on the market that help security teams determine if a device is “healthy” and corporately managed. What the majority of these solutions have in common is that they require software to be installed directly on the user’s machine. This comes with challenges associated with client software including compatibility issues, version management, and end user support. Many companies have dedicated Mobile Device Management (MDM) tools to manage the software installed on employee machines.

MDM is a proven model, but it is also a challenge to manage — taking a dedicated team in many cases. What’s more, installing client or MDM software is not always possible for contractors, vendors or employees using personal machines. Security teams have to resort to VDI or VPN solutions for external users to securely access corporate applications.

How Private Attestation Tokens verify a device

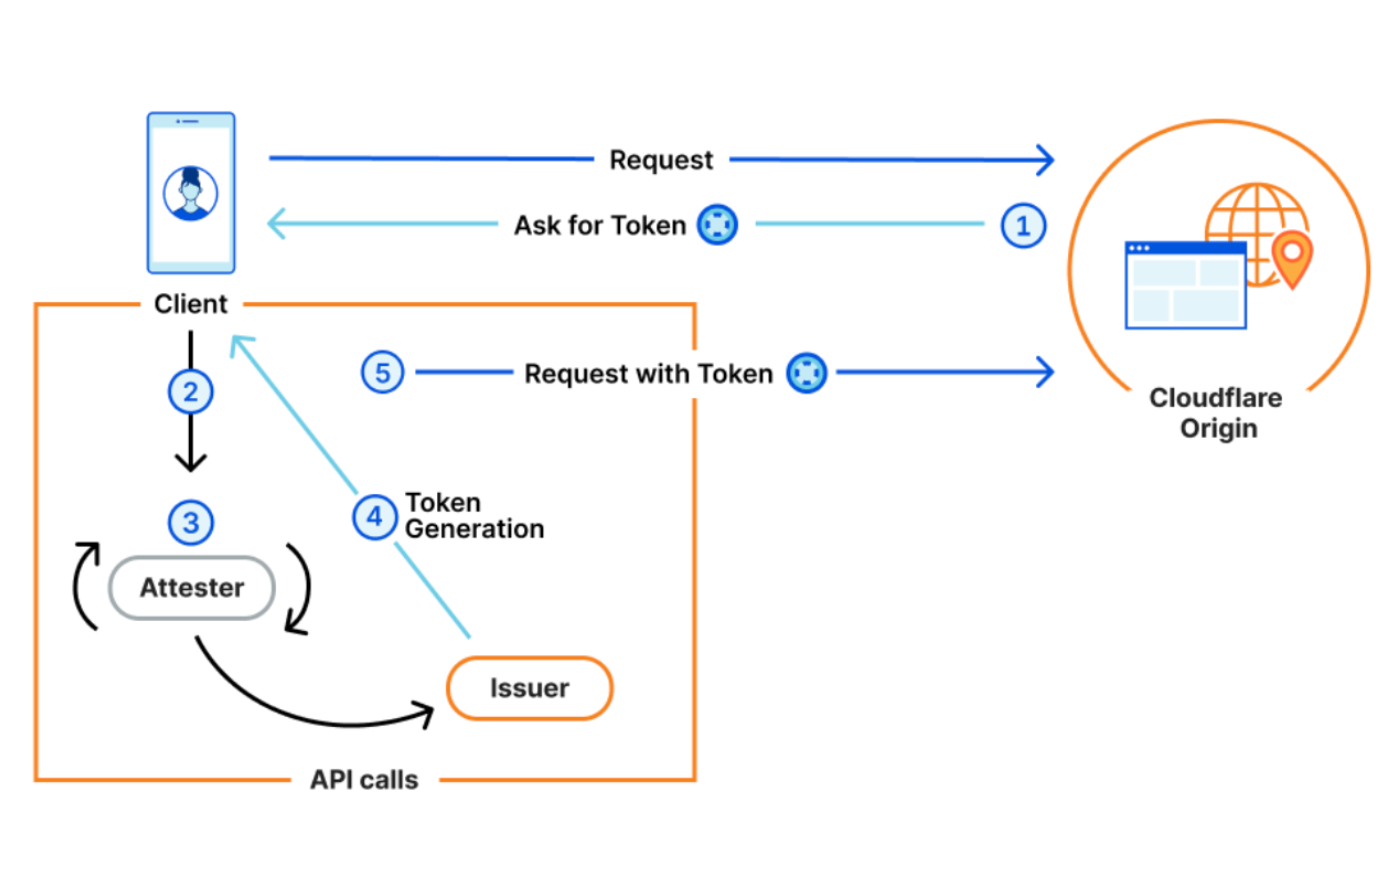
Private Attestation Tokens leverage the Privacy Pass Protocol, which Cloudflare authored with major device manufacturers, to attest to a device’s health and integrity.

In order for Private Attestation Tokens to work, four parties agree to work in concert with a common framework to generate and exchange anonymous, unforgeable tokens. Without all four parties in the process, PATs won’t work.

  1. An Origin. A website, application, or API that receives requests from a client. When a website receives a request to their origin, the origin must know to look for and request a token from the client making the request. For Cloudflare customers, Cloudflare acts as the origin (on behalf of customers) and handles the requesting and processing of tokens.
  2. A Client. Whatever tool the visitor is using to attempt to access the Origin. This will usually be a web browser or mobile application. In our example, let’s say the client is a mobile Safari Browser.
  3. An Attester. The Attester is who the client asks to prove something (i.e that a mobile device has a valid IMEI) before a token can be issued. In our example below, the Attester is Apple, the device vendor.
  4. An Issuer. The issuer is the only one in the process that actually generates, or issues, a token. The Attester makes an API call to whatever Issuer the Origin has chosen to trust,  instructing the Issuer to produce a token. In our case, Cloudflare will also be the Issuer.
Verify Apple devices with no installed software

We are then able to rely on the attestation from the device manufacturer as a form of validation that a device is in a “healthy” enough state to be allowed access to a sensitive application.

Checking device health without client software

Private Attestation Tokens do not require any additional software to be installed on the user’s device. This is because the “attestation” of device health and validity is attested directly by the device operating system’s manufacturer — in this case, Apple.

This means that a security team can use Cloudflare Access and Private Attestation Tokens to verify if a user is accessing from a “healthy” Apple device before allowing access to a sensitive corporate application. Some checks as part of the attestation include:

  • Is the device on the latest OS version?
  • Is the device jailbroken?
  • Is the window attempting to log in, in focus?
  • And much more.

Over time, we are working with other device manufacturers to expand device support and what is verified as part of the device attestation process. The attributes that are attested will also continue to expand over time, which means the device verification in Access will only strengthen.

In the next few months, we will move Private Attestation Support in Cloudflare Access to a closed beta. The first version will work for iOS devices and support will expand from there. The only change required will be an updated Access policy, no software will need to be installed. If you would like to be part of the beta program, sign up here today!

How to augment or replace your VPN with Cloudflare

Post Syndicated from Michael Keane original https://blog.cloudflare.com/how-to-augment-or-replace-your-vpn/

How to augment or replace your VPN with Cloudflare

“Never trust, always verify.”

How to augment or replace your VPN with Cloudflare

Almost everyone we speak to these days understands and agrees with this fundamental principle of Zero Trust. So what’s stopping folks? The biggest gripe we hear: they simply aren’t sure where to start. Security tools and network infrastructure have often been in place for years, and a murky implementation journey involving applications that people rely on to do their work every day can feel intimidating.

While there’s no universal answer, several of our customers have agreed that offloading key applications from their traditional VPN to a cloud-native Zero Trust Network Access (ZTNA) solution like Cloudflare Access is a great place to start—providing an approachable, meaningful upgrade for their business.

In fact, GartnerⓇ predicted that “by 2025, at least 70% of new remote access deployments will be served predominantly by ZTNA as opposed to VPN services, up from less than 10% at the end of 2021.”1 By prioritizing a ZTNA project, IT and Security executives can better shield their business from attacks like ransomware while simultaneously improving their employees’ daily workflows. The trade-off between security and user experience is an outmoded view of the world; organizations can truly improve both if they go down the ZTNA route.

You can get started here with Cloudflare Access for free, and in this guide we’ll show you why, and how.

Why nobody likes their VPN

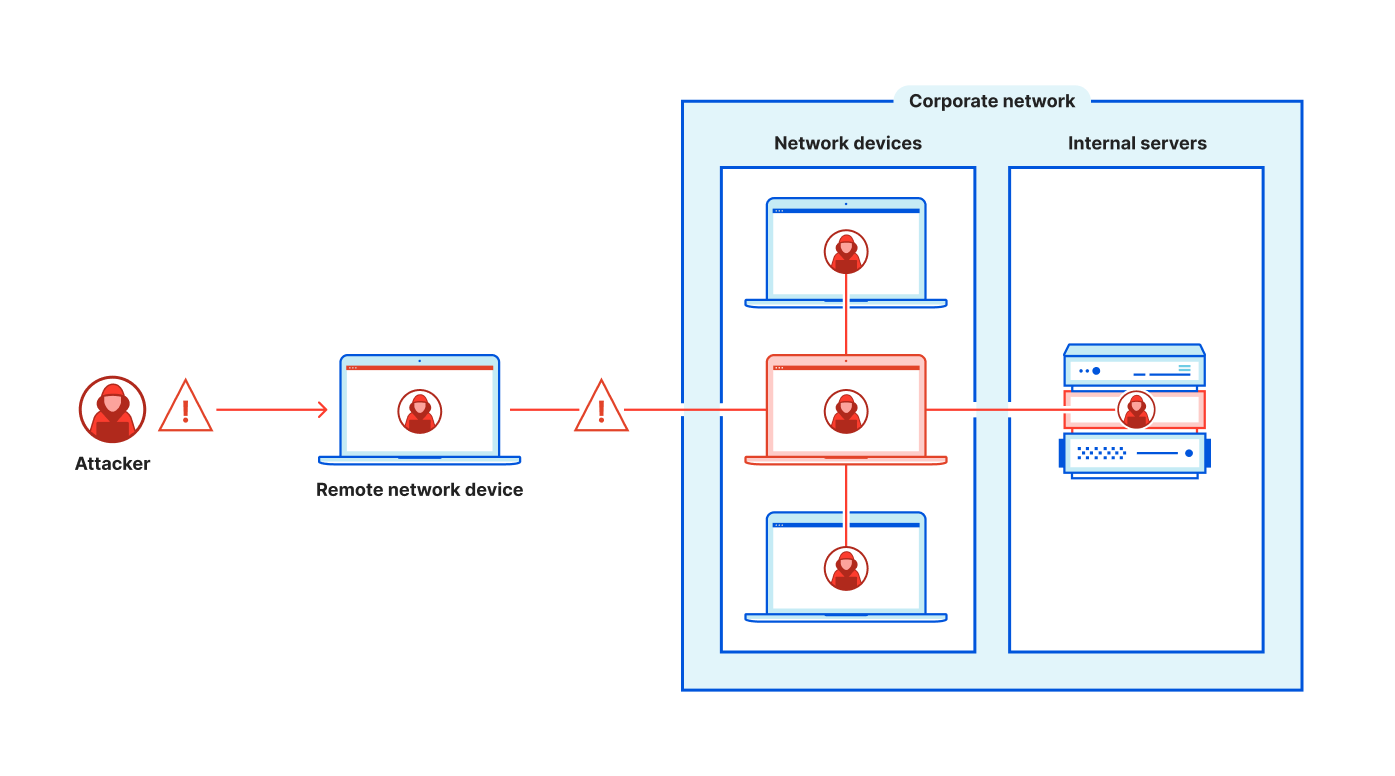
The network-level access and default trust granted by VPNs create avoidable security gaps by inviting the possibility of lateral movement within your network. Attackers may enter your network through a less-sensitive entry point after stealing credentials, and then traverse to find more business-critical information to exploit. In the face of rising attacks, the threat here is too real—and the path to mitigate is too within reach—to ignore.

How to augment or replace your VPN with Cloudflare

Meanwhile, VPN performance feels stuck in the 90s… and not in a fun, nostalgic way. Employees suffer through slow and unreliable connections that simply weren’t built for today’s scale of remote access. In the age of the “Great Reshuffle” and the current recruiting landscape, providing subpar experiences for teams based on legacy tech doesn’t have a great ROI. And when IT/security practitioners have plenty of other job opportunities readily available, they may not want to put up with manual, avoidable tasks born from an outdated technology stack. From both security and usability angles, moving toward VPN replacement is well worth the pursuit.

Make least-privilege access the default

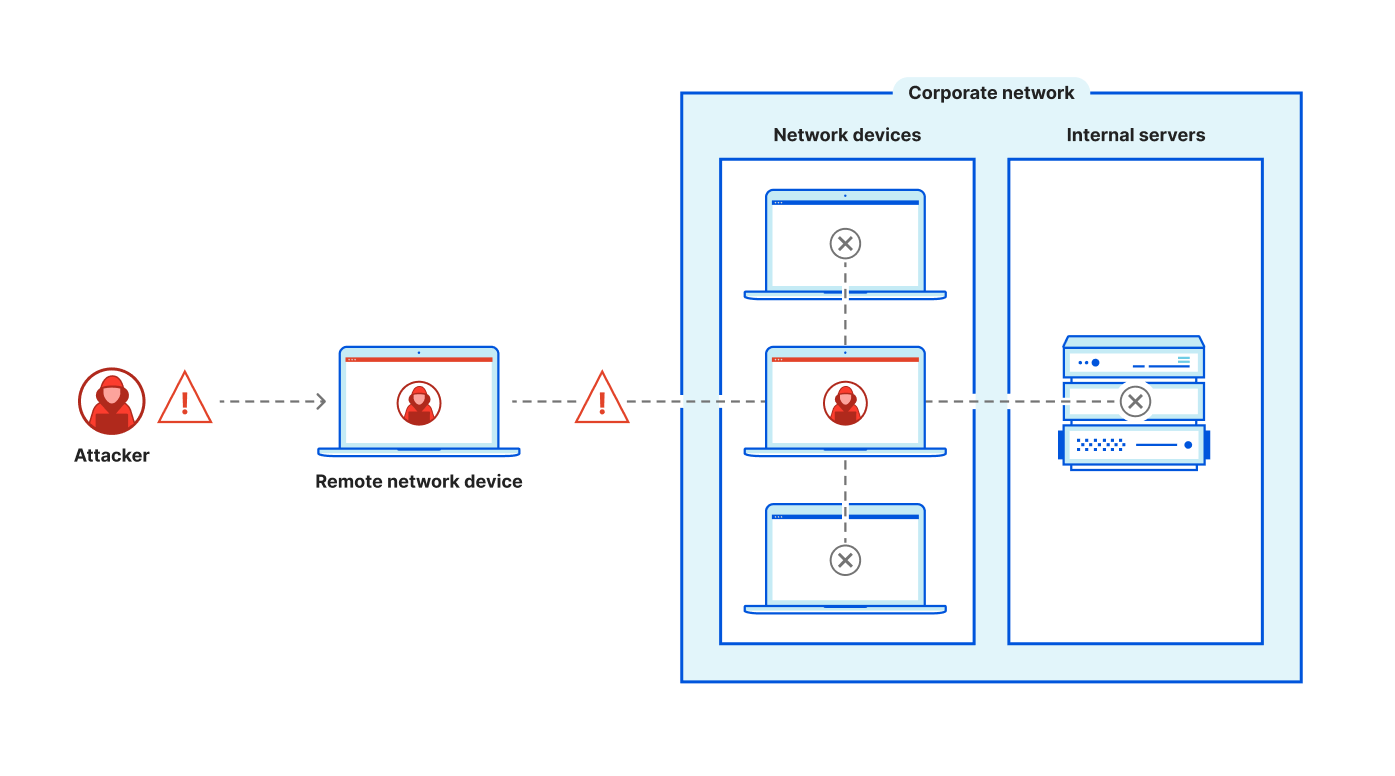
Instead of authenticating a user and providing access to everything on your corporate network, a ZTNA implementation or “software-defined perimeter” authorizes access per resource, effectively eliminating the potential for lateral movement. Each access attempt is evaluated against Zero Trust rules based on identity, device posture, geolocation, and other contextual information. Users are continuously re-evaluated as context changes, and all events are logged to help improve visibility across all types of applications.

How to augment or replace your VPN with Cloudflare

As co-founder of Udaan, Amod Malviya, noted, “VPNs are frustrating and lead to countless wasted cycles for employees and the IT staff supporting them. Furthermore, conventional VPNs can lull people into a false sense of security. With Cloudflare Access, we have a far more reliable, intuitive, secure solution that operates on a per user, per access basis. I think of it as Authentication 2.0 — even 3.0″.

Better security and user experience haven’t always co-existed, but the fundamental architecture of ZTNA really does improve both compared to legacy VPNs. Whether your users are accessing Office 365 or your custom, on-prem HR app, every login experience is treated the same. With Zero Trust rules being checked behind the scenes, suddenly every app feels like a SaaS app to your end users. Like our friends at OneTrust said when they implemented ZTNA, “employees can connect to the tools they need, so simply teams don’t even know Cloudflare is powering the backend. It just works.”

Assembling a ZTNA project plan

VPNs are so entrenched in an organization’s infrastructure that fully replacing one may take a considerable amount of time, depending on the total number of users and applications served. However, there still is significant business value in making incremental progress. You can migrate away from your VPN at your own pace and let ZTNA and your VPN co-exist for some time, but it is important to at least get started.

Consider which one or two applications behind your VPN would be most valuable for a ZTNA pilot, like one with known complaints or numerous IT support tickets associated with it. Otherwise, consider internal apps that are heavily used or are visited by particularly critical or high-risk users. If you have any upcoming hardware upgrades or license renewals planned for your VPN(s), apps behind the accompanying infrastructure may also be a sensible fit for a modernization pilot.

As you start to plan your project, it’s important to involve the right stakeholders. For your ZTNA pilot, your core team should at minimum involve an identity admin and/or admin who manages internal apps used by employees, plus a network admin who understands your organization’s traffic flow as it relates to your VPN. These perspectives will help to holistically consider the implications of your project rollout, especially if the scope feels dynamic.

Executing a transition plan for a pilot app

Step 1: Connect your internal app to Cloudflare’s network
The Zero Trust dashboard guides you through a few simple steps to set up our app connector, no virtual machines required. Within minutes, you can create a tunnel for your application traffic and route it based on public hostnames or your private network routes. The dashboard will provide a string of commands to copy and paste into your command line to facilitate initial routing configurations. From there, Cloudflare will manage your configuration automatically.

A pilot web app may be the most straightforward place to start here, but you can also extend to SSH, VNC, RDP, or internal IPs and hostnames through the same workflow. With your tunnel up and running, you’ve created the means through which your users will securely access your resources and have essentially eliminated the potential for lateral movement within your network. Your application is not visible to the public Internet, significantly reducing your attack surface.

Step 2: Integrate identity and endpoint protection
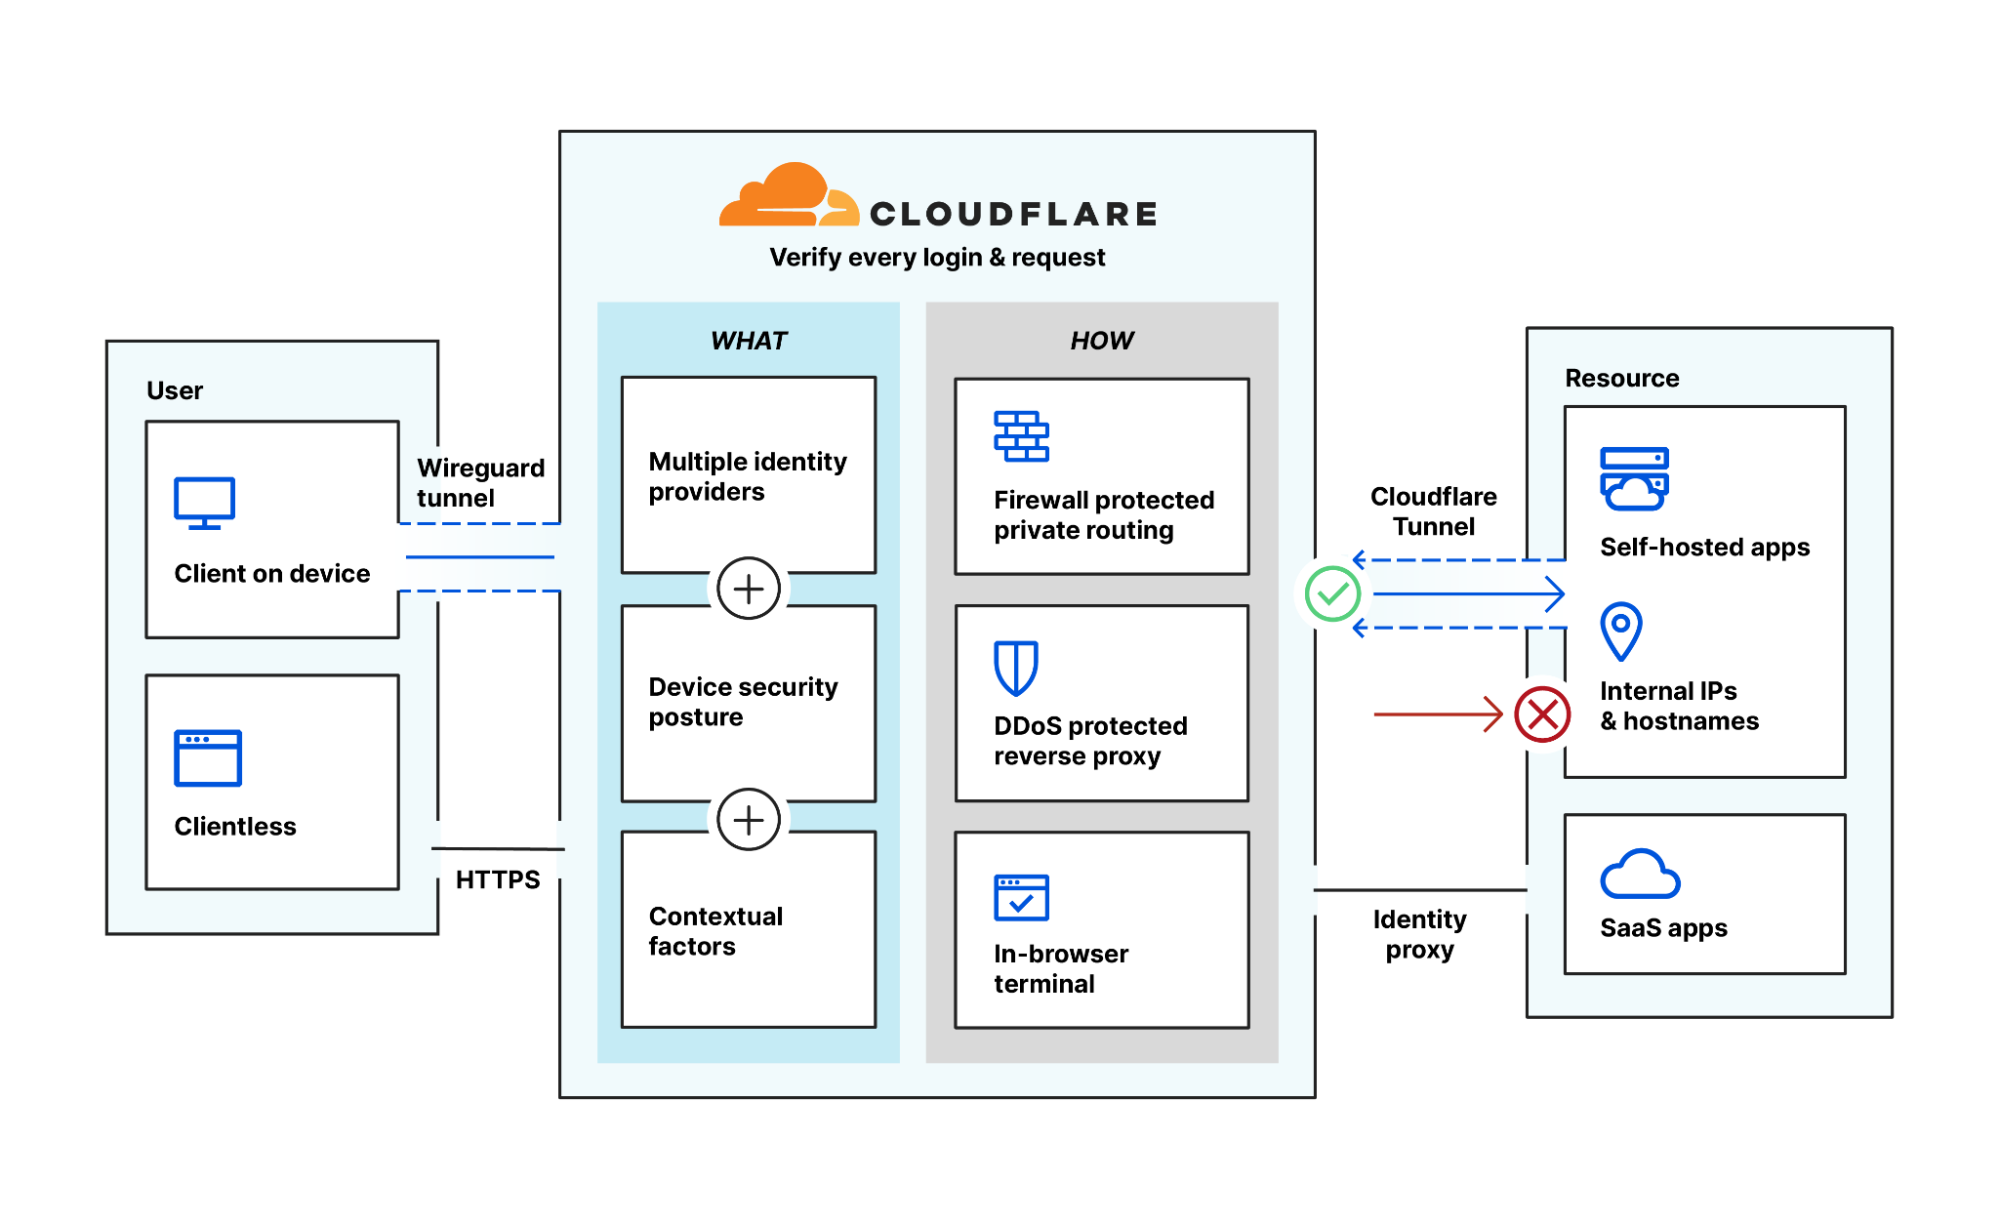
Cloudflare Access acts as an aggregation layer for your existing security tools. With support for over a dozen identity providers (IdPs) like Okta, Microsoft Azure AD, Ping Identity, or OneLogin, you can link multiple simultaneous IdPs or separate tenants from one IdP. This can be particularly useful for companies undergoing mergers or acquisitions or perhaps going through compliance updates, e.g. incorporating a separate FedRAMP tenant.

In a ZTNA implementation, this linkage lets both tools play to their strengths. The IdP houses user stores and performs the identity authentication check, while Cloudflare Access controls the broader Zero Trust rules that ultimately decide access permissions to a broad range of resources.

Similarly, admins can integrate common endpoint protection providers like Crowdstrike, SentinelOne, Tanium or VMware Carbon Black to incorporate device posture into Zero Trust rulesets. Access decisions can incorporate device posture risk scores for tighter granularity.

You might find shortcut approaches to this step if you plan on using simpler authentication like one-time pins or social identity providers with external users like partners or contractors. As you mature your ZTNA rollout, you can incorporate additional IdPs or endpoint protection providers at any time without altering your fundamental setup. Each integration only adds to your source list of contextual signals at your disposal.

Step 3: Configure Zero Trust rules
Depending on your assurance levels for each app, you can customize your Zero Trust policies to appropriately restrict access to authorized users using contextual signals. For example, a low-risk app may simply require email addresses ending in “@company.com” and a successful SMS or email multifactor authentication (MFA) prompt. Higher risk apps could require hard token MFA specifically, plus a device posture check or other custom validation check using external APIs.

MFA in particular can be difficult to implement with legacy on-prem apps natively using traditional single sign-on tools. Using Cloudflare Access as a reverse proxy helps provide an aggregation layer to simplify rollout of MFA to all your resources, no matter where they live.

Step 4: Test clientless access right away
After connecting an app to Cloudflare and configuring your desired level of authorization rules, end users in most cases can test web, SSH, or VNC access without using a device client. With no downloads or mobile device management (MDM) rollouts required, this can help accelerate ZTNA adoption for key apps and be particularly useful for enabling third-party access.

Note that a device client can still be used to unlock other use cases like protecting SMB or thick client applications, verifying device posture, or enabling private routing. Cloudflare Access can handle any arbitrary L4-7 TCP or UDP traffic, and through bridges to WAN-as-a-service it can offload VPN use cases like ICMP or server-to-client initiated protocol traffic like VoIP as well.

How to augment or replace your VPN with Cloudflare

At this stage for the pilot app, you are up and running with ZTNA! Top priority apps can be offloaded from your VPN one at a time at any pace that feels comfortable to help modernize your access security. Still, augmenting and fully replacing a VPN are two very different things.

Moving toward full VPN replacement

While a few top resource candidates for VPN offloading might be clear for your company, the total scope could be overwhelming, with potentially thousands of internal IPs and domains to consider. You can configure the local domain fallback entries within Cloudflare Access to point to your internal DNS resolver for selected internal hostnames. This can help you more efficiently disseminate access to resources made available over your Intranet.
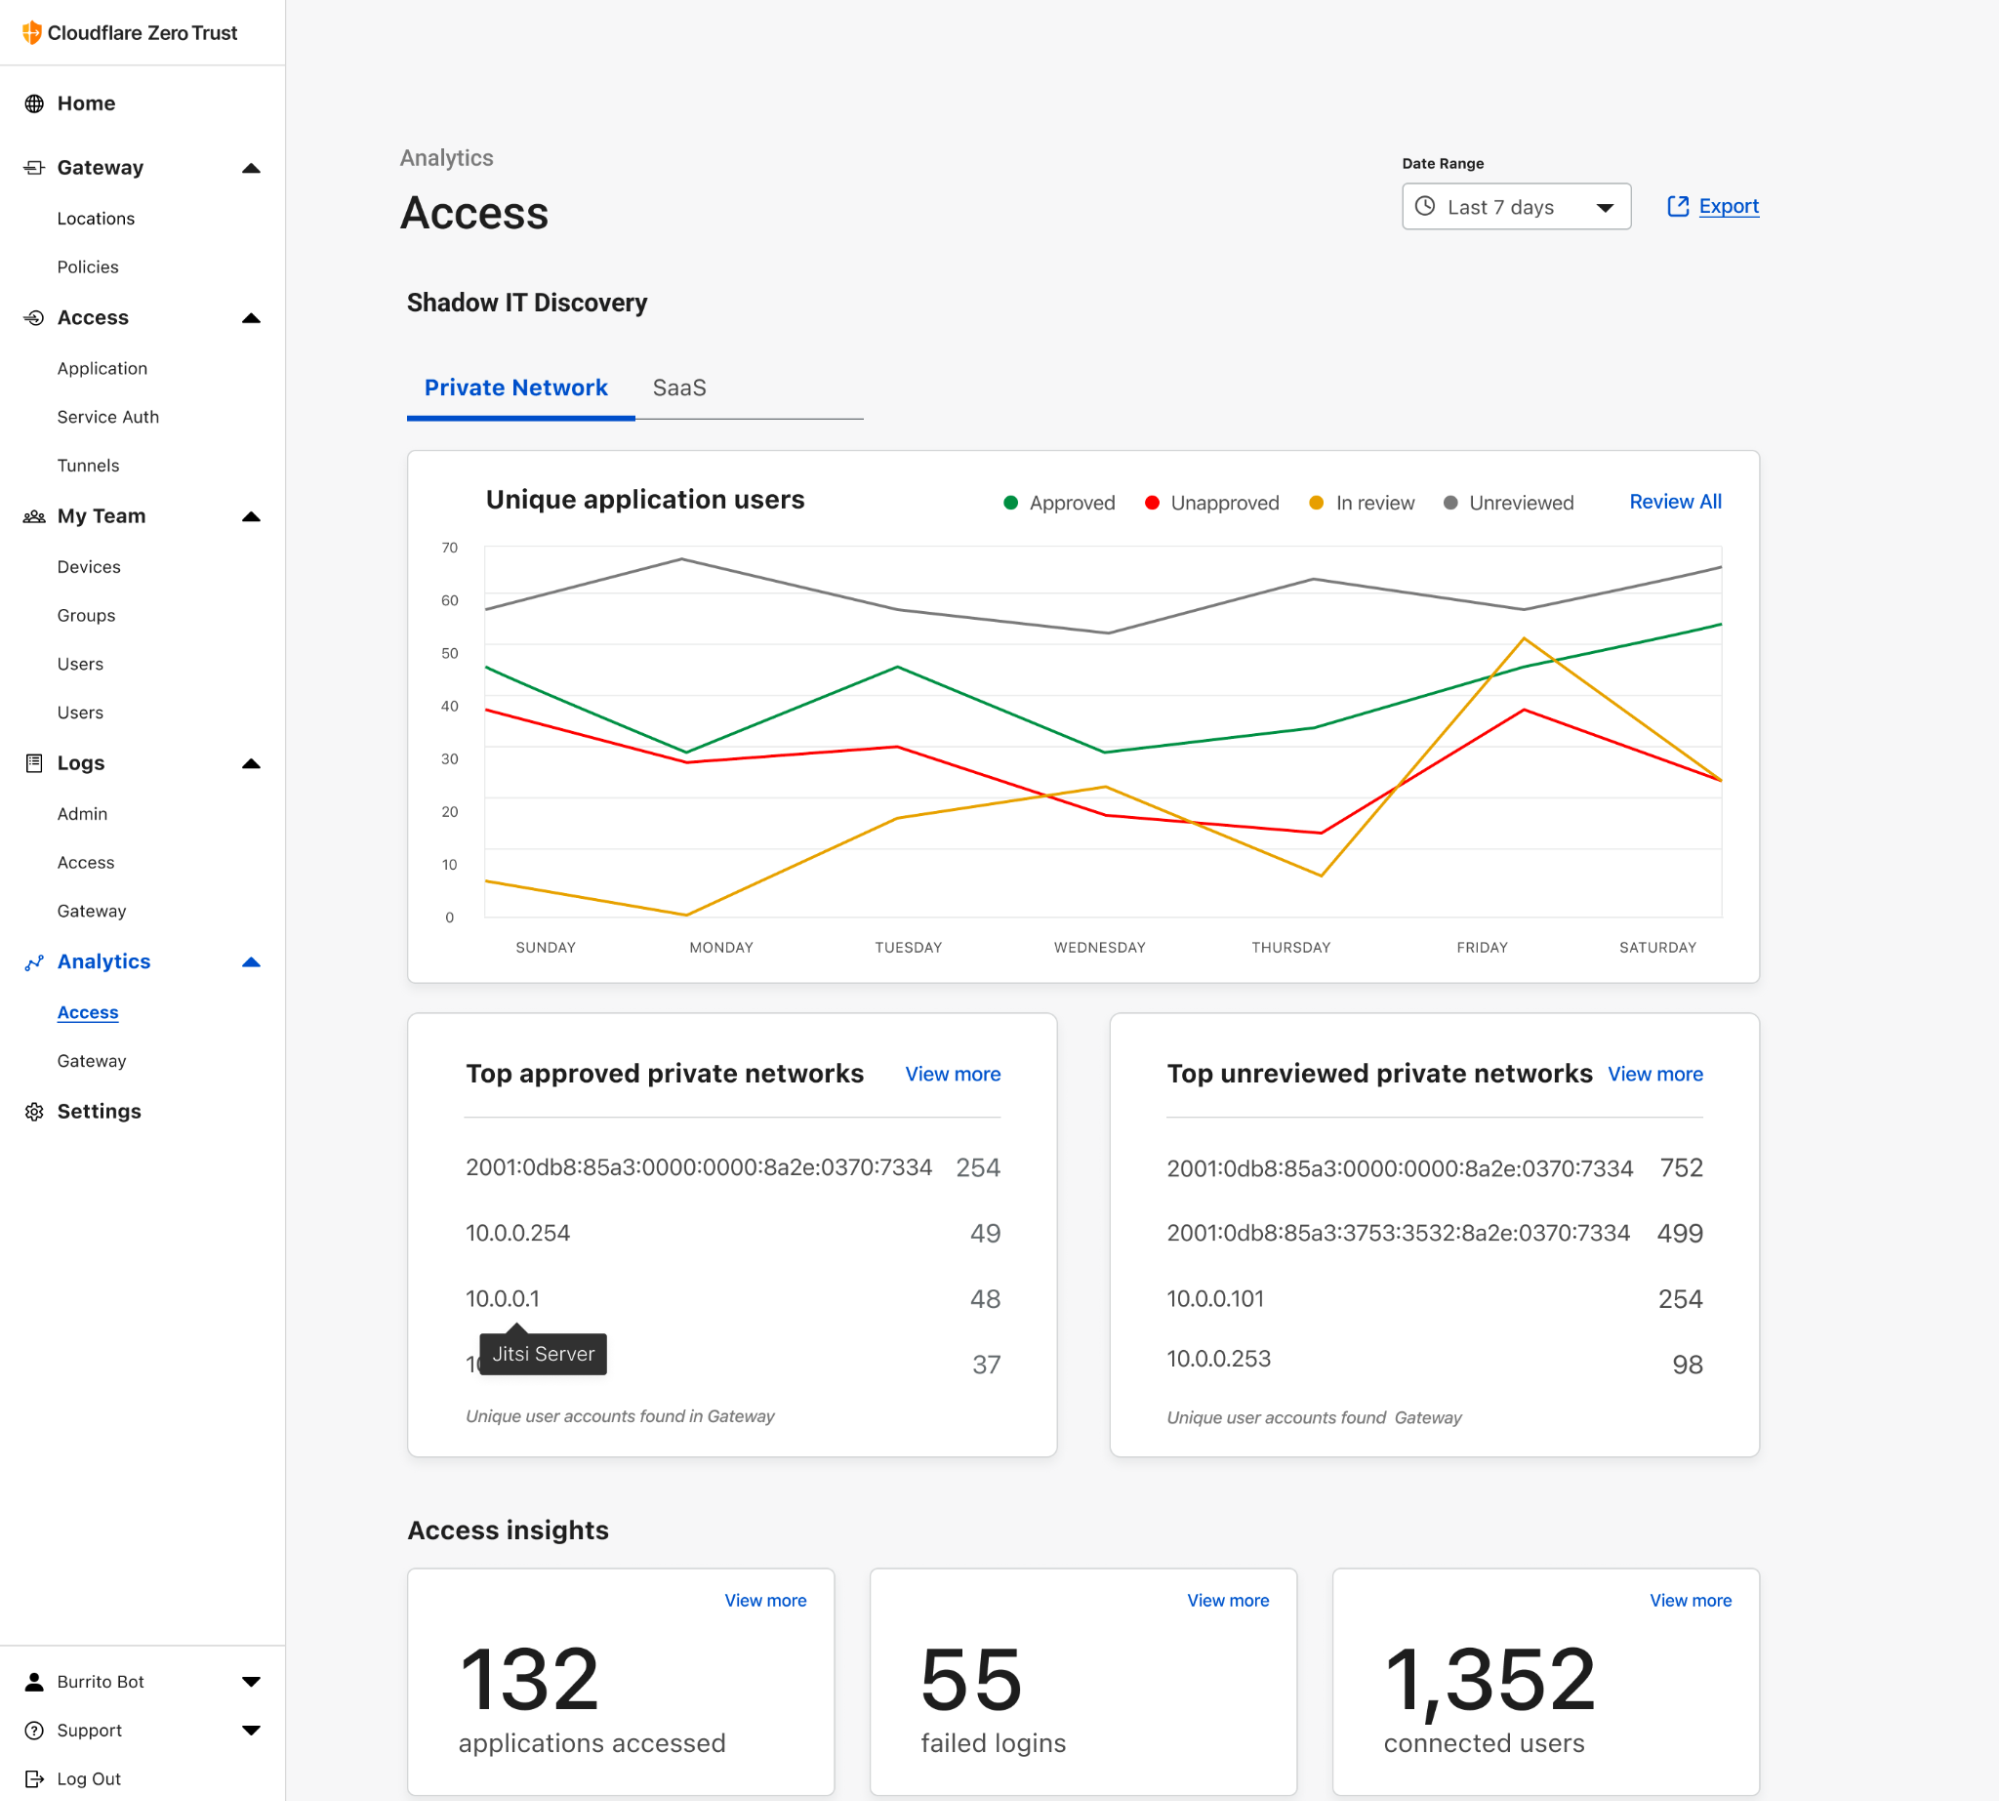
It can also be difficult for admins to granularly understand the full reach of their current VPN usage. Potential visibility issues aside, the full scope of applications and users may be in dynamic flux especially at large organizations. You can use the private network discovery report within Cloudflare Access to passively vet the state of traffic on your network over time. For discovered apps requiring more protection, Access workflows help you tighten Zero Trust rules as needed.

Both of these capabilities can help reduce anxiety around fully retiring a VPN. By starting to build your private network on top of Cloudflare’s network, you’re bringing your organization closer to achieving Zero Trust security.

The business impact our customers are seeing

Offloading applications from your VPN and moving toward ZTNA can have measurable benefits for your business even in the short term. Many of our customers speak to improvements in their IT team’s efficiency, onboarding new employees faster and spending less time on access-related help tickets. For example, after implementing Cloudflare Access, eTeacher Group reduced its employee onboarding time by 60%, helping all teams get up to speed faster.

Even if you plan to co-exist with your VPN alongside a slower modernization cadence, you can still track IT tickets for the specific apps you’ve transitioned to ZTNA to help quantify the impact. Are overall ticket numbers down? Did time to resolve decrease? Over time, you can also partner with HR for qualitative feedback through employee engagement surveys. Are employees feeling empowered with their current toolset? Do they feel their productivity has improved or complaints have been addressed?

Of course, improvements to security posture also help mitigate the risk of expensive data breaches and their lingering, damaging effects to brand reputation. Pinpointing narrow cause-and-effect relationships for the cost benefits of each small improvement may feel more art than science here, with too many variables to count. Still, reducing reliance on your VPN is a great step toward reducing your attack surface and contributes to your macro return on investment, however long your full Zero Trust journey may last.

Start the clock toward replacing your VPN

Our obsession with product simplicity has helped many of our customers sunset their VPNs already, and we can’t wait to do more.

You can get started here with Cloudflare Access for free to begin augmenting your VPN. Follow the steps outlined above with your prioritized ZTNA test cases, and for a sense of broader timing you can create your own Zero Trust roadmap as well to figure out what project should come next.

For a full summary of Cloudflare One Week and what’s new, tune in to our recap webinar.

___

1Nat Smith, Mark Wah, Christian Canales. (2022, April 08). Emerging Technologies: Adoption Growth Insights for Zero Trust Network Access. GARTNER is a registered trademark and service mark of Gartner, Inc. and/or its affiliates in the U.S. and internationally and is used herein with permission. All rights reserved.



Introducing Private Network Discovery

Post Syndicated from Abe Carryl original https://blog.cloudflare.com/introducing-network-discovery/

Introducing Private Network Discovery

Introducing Private Network Discovery

With Cloudflare One, building your private network on Cloudflare is easy. What is not so easy is maintaining the security of your private network over time. Resources are constantly being spun up and down with new users being added and removed on a daily basis, making it painful to manage over time.

That’s why today we’re opening a closed beta for our new Zero Trust network discovery tool. With Private Network Discovery, our Zero Trust platform will now start passively cataloging both the resources being accessed and the users who are accessing them without any additional configuration required. No third party tools, commands, or clicks necessary.

To get started, sign-up for early access to the closed beta and gain instant visibility into your network today. If you’re interested in learning more about how it works and what else we will be launching in the future for general availability, keep scrolling.

One of the most laborious aspects of migrating to Zero Trust is replicating the security policies which are active within your network today. Even if you do have a point-in-time understanding of your environment, networks are constantly evolving with new resources being spun up dynamically for various operations. This results in a constant cycle to discover and secure applications which creates an endless backlog of due diligence for security teams.

That’s why we built Private Network Discovery. With Private Network Discovery, organizations can easily gain complete visibility into the users and applications that live on their network without any additional effort on their part. Simply connect your private network to Cloudflare, and we will surface any unique traffic we discover on your network to allow you to seamlessly translate them into Cloudflare Access applications.

Building your private network on Cloudflare

Building out a private network has two primary components: the infrastructure side, and the client side.

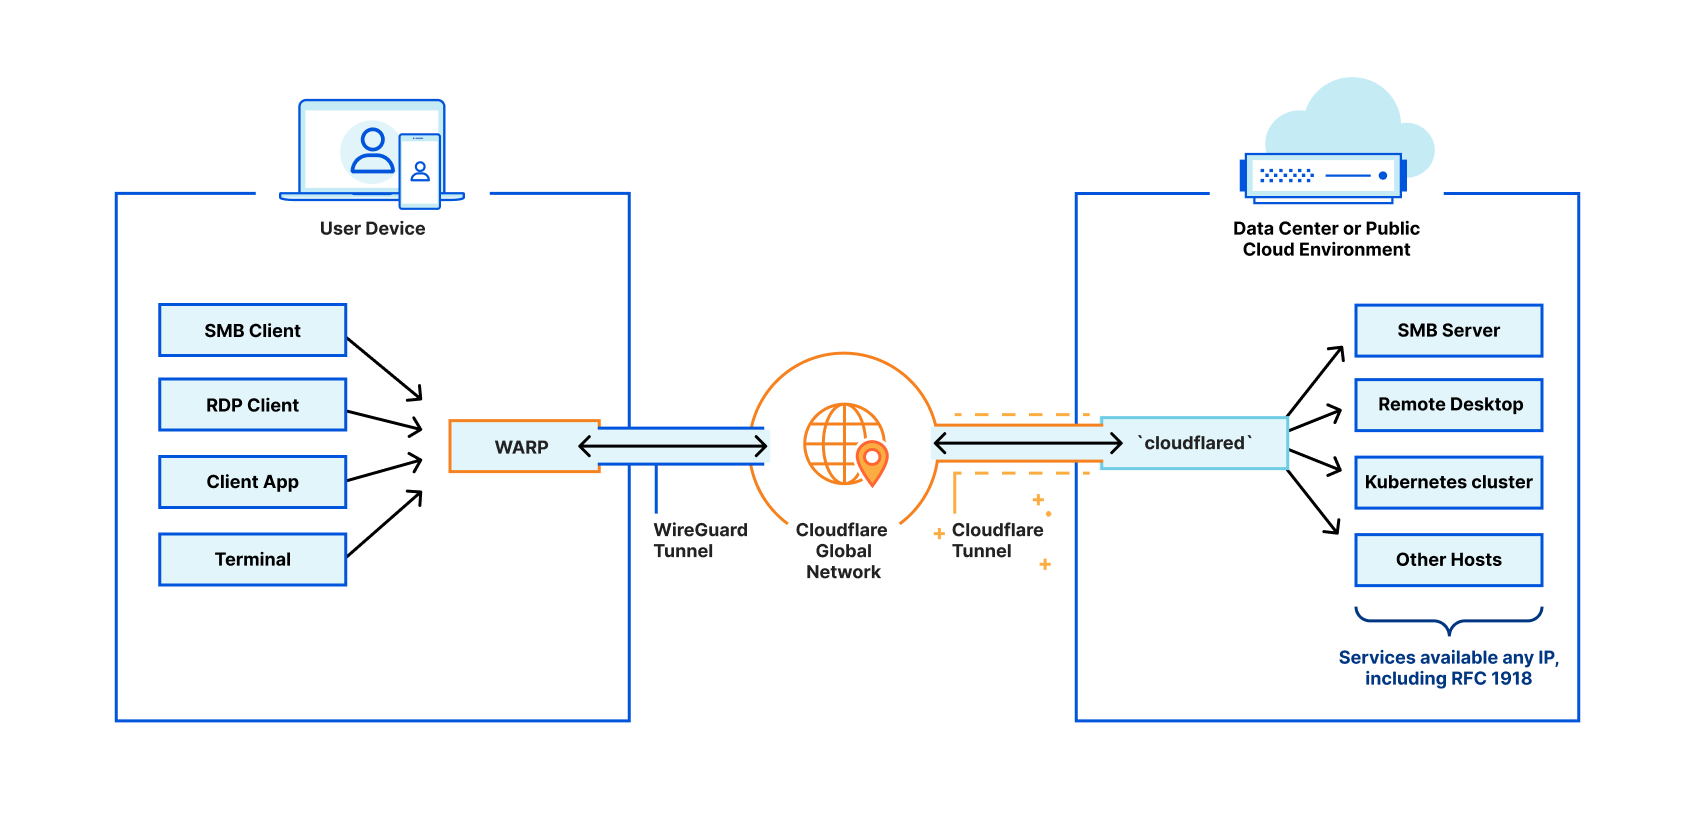
The infrastructure side of the equation is powered by Cloudflare Tunnel, which simply connects your infrastructure (whether that be a single application, many applications, or an entire network segment) to Cloudflare. This is made possible by running a simple command-line daemon in your environment to establish multiple secure, outbound-only links to Cloudflare. Simply put, Tunnel is what connects your network to Cloudflare.

On the other side of this equation, you need your end users to be able to easily connect to Cloudflare and, more importantly, your network. This connection is handled by our robust device agent, Cloudflare WARP. This agent can be rolled out to your entire organization in just a few minutes using your in-house MDM tooling, and it establishes a secure connection from your users’ devices to the Cloudflare network.

Introducing Private Network Discovery

Now that we have your infrastructure and your users connected to Cloudflare, it becomes easy to tag your applications and layer on Zero Trust security controls to verify both identity and device-centric rules for each and every request on your network.

How it works

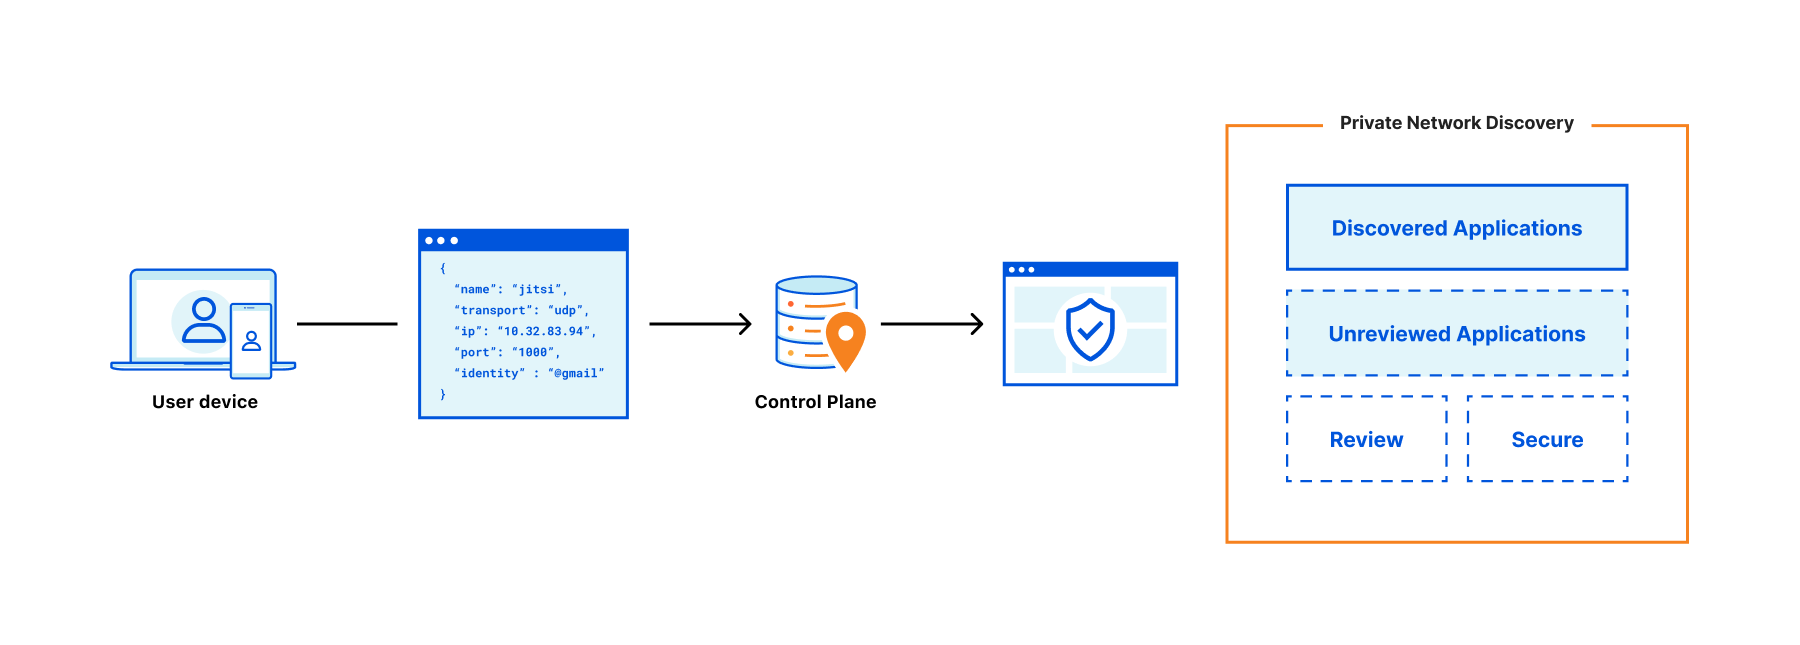
As we mentioned earlier, we built this feature to help your team gain visibility into your network by passively cataloging unique traffic destined for an RFC 1918 or RFC 4193 address space. By design, this tool operates in an observability mode whereby all applications are surfaced, but are tagged with a base state of “Unreviewed.”

Introducing Private Network Discovery

The Network Discovery tool surfaces all origins within your network, defined as any unique IP address, port, or protocol. You can review the details of any given origin and then create a Cloudflare Access application to control access to that origin. It’s also worth noting that Access applications may be composed of more than one origin.

Let’s take, for example, a privately hosted video conferencing service, Jitsi. I’m using this example as our team actually uses this service internally to test our new features before pushing them into production. In this scenario, we know that our self-hosted instance of Jitsi lives at 10.0.0.1:443. However, as this is a video conferencing application, it communicates on both tcp:10.0.0.1:443 and udp:10.0.0.1:10000. Here we would select one origin and assign it an application name.

As a note, during the closed beta you will not be able to view this application in the Cloudflare Access application table. For now, these application names will only be reflected in the discovered origins table of the Private Network Discovery report. You will see them reflected in the Application name column exclusively. However, when this feature goes into general availability you’ll find all the applications you have created under Zero Trust > Access > Applications as well.

After you have assigned an application name and added your first origin, tcp:10.0.0.1:443, you can then follow the same pattern to add the other origin, udp:10.0.0.1:10000, as well. This allows you to create logical groupings of origins to create a more accurate representation of the resources on your network.

Introducing Private Network Discovery

By creating an application, our Network Discovery tool will automatically update the status of these individual origins from “Unreviewed” to “In-Review.” This will allow your team to easily track the origin’s status. From there, you can drill further down to review the number of unique users accessing a particular origin as well as the total number of requests each user has made. This will help equip your team with the information it needs to create identity and device-driven Zero Trust policies. Once your team is comfortable with a given application’s usage, you can then manually update the status of a given application to be either “Approved” or “Unapproved”.

What’s next

Our closed beta launch is just the beginning. While the closed beta release supports creating friendly names for your private network applications, those names do not currently appear in the Cloudflare Zero Trust policy builder.

As we move towards general availability, our top priority will be making it easier to secure your private network based on what is surfaced by the Private Network Discovery tool. With the general availability launch, you will be able to create Access applications directly from your Private Network Discovery report, reference your private network applications in Cloudflare Access and create Zero Trust security policies for those applications, all in one singular workflow.

As you can see, we have exciting plans for this tool and will continue investing in Private Network Discovery in the future. If you’re interested in gaining access to the closed beta, sign-up here and be among the first users to try it out!

Cloudflare recognized by Microsoft as a Security Software Innovator

Post Syndicated from Abhi Das original https://blog.cloudflare.com/cloudflare-recognized-by-microsoft-as-a-security-software-innovator/

Cloudflare recognized by Microsoft as a Security Software Innovator

This post is also available in 简体中文, Deutsch, Français, Español.

Cloudflare recognized by Microsoft as a Security Software Innovator

Recently, Microsoft announced the winners for the 2022 Microsoft Security Excellence Awards, a prestigious classification in the Microsoft partner community. We are honored to announce that Cloudflare has won the Security Software Innovator award. This award recognized Cloudflare’s innovative approach to Zero Trust and Security solutions. Our transformative technology in collaboration with Microsoft provides world-class joint solutions for our mutual customers.

Microsoft Security Excellence Awards

The third annual Microsoft Security awards celebrated finalists in 10 categories spanning security, compliance, and identity. Microsoft unveiled the winners of the Microsoft Security Partner Awards, voted on by a group of industry veterans, on June 6, 2022.

Through this award, Microsoft recognizes Cloudflare’s approach to constantly deliver the most innovative solutions for joint customers. Together with Microsoft, we have supported thousands of customers including many of the largest Fortune 500 companies on their Zero Trust journey, enabling customers to simply and easily support their security needs with faster performance.

Cloudflare has built deep integrations with Microsoft to help organizations take the next step in their Zero Trust journey. These integrations empower organizations to make customer implementations operationally efficient while delivering a seamless user experience. Currently, all our mutual customers benefit from several integrations across Microsoft 365 and Azure to secure web applications and safeguard employees with identity and device protections. Working with Microsoft has been critical in helping our customers on their Zero Trust journey. It is a complex undertaking that Cloudflare has been simplifying through our extremely easy to adopt product portfolio such as Cloudflare One via a  single pane of glass.

We want to thank Microsoft for its continued collaboration with Cloudflare. We are committed to serving our joint customers as we expand our integrations across Microsoft’s suite of products and continuously innovate against the latest threats.

“Partners are critical to solving customers’ constantly evolving security challenges and threat landscape. The close collaboration and deep integrations between Cloudflare and Microsoft ensure our joint customers are equipped with innovative technologies that are seamlessly integrated to address their security challenges. We are pleased to recognize Cloudflare with the Security Software Innovator Award at this year’s Microsoft Security Excellence Awards.”
– Ann Johnson, Corporate Vice President of Security, Compliance, Identity, and Management, Business Development at Microsoft.

Not only a must-have – Zero Trust requires constant innovation

Cloudflare recognized by Microsoft as a Security Software Innovator
Perimeter based security models are breaking under pressure

The rapid transition to remote work and the rise of SaaS applications has disrupted how businesses need to think about protecting their networks. Organizations historically protected their sensitive applications and networks by building a “castle-and-moat”, piecing together disparate point solutions for each defensive layer.

Comprehensive solutions require a layered defensive architecture for Internet security (DNS and HTTPS filtering), endpoint and data protection (Remote Browser Isolation and Data-Loss Prevention) as well as SaaS app security (CASB) and connecting users both in-and-away from the office via private network connections. This model is difficult to implement and manage, and doesn’t scale in the modern workplace with users and applications residing everywhere that is connected to the Internet.

Why Zero Trust is a must-have:

  1. Apps can now live anywhere on-prem, cloud or SaaS
  2. Employees can access those resources from anywhere
  3. Attacks are getting more sophisticated constantly
  4. Internet is the new ‘Office’ away from ‘Castle-Moat’ model
Cloudflare recognized by Microsoft as a Security Software Innovator
Current world of how applications are deployed and accessed

Cloudflare One protects any application or network for users everywhere by running our full suite of product across our global network present in more than 270 cities around the world:

  • Protect any self-hosted or SaaS application with Access.
  • Inspect and protect Internet access with Gateway.
  • Isolate sensitive applications and high-risk browsing with Browser Isolation.
  • Protection from data-loss with CASB and DLP controls.

Finally, any device, office or network can be protected by Cloudflare One by connecting to our closest point of presence via our Roaming Agent (WARP) or via tunneled or direct connectivity.

Cloudflare recognized by Microsoft as a Security Software Innovator
Our current integrations with Microsoft within the context of a request flow

Looking forward to continuing this journey as the world around us changes constantly

This is the first year that Microsoft has a  Software Security Innovator award category, and we’re extremely proud to have won. Cloudflare is committed to strive and deliver next generation innovative Zero Trust solutions to our customers. If you are interested in our Cloudflare One suite, please reach out. Also, if you are interested in partnering with our Zero Trust solutions, fill out the form here.

Symbiote Backdoor in Linux

Post Syndicated from Bruce Schneier original https://www.schneier.com/blog/archives/2022/06/symbiote-backdoor-in-linux.html

Interesting:

What makes Symbiote different from other Linux malware that we usually come across, is that it needs to infect other running processes to inflict damage on infected machines. Instead of being a standalone executable file that is run to infect a machine, it is a shared object (SO) library that is loaded into all running processes using LD_PRELOAD (T1574.006), and parasitically infects the machine. Once it has infected all the running processes, it provides the threat actor with rootkit functionality, the ability to harvest credentials, and remote access capability.

News article:

Researchers have unearthed a discovery that doesn’t occur all that often in the realm of malware: a mature, never-before-seen Linux backdoor that uses novel evasion techniques to conceal its presence on infected servers, in some cases even with a forensic investigation.

No public attribution yet.

So far, there’s no evidence of infections in the wild, only malware samples found online. It’s unlikely this malware is widely active at the moment, but with stealth this robust, how can we be sure?

Handy Tips #32: Deploying Zabbix in the Azure cloud platform

Post Syndicated from Arturs Lontons original https://blog.zabbix.com/handy-tips-32-deploying-zabbix-in-the-azure-cloud-platform/21355/

Deploy your Zabbix servers and proxies in the Azure cloud.

There are many use cases where deploying your Zabbix server or Zabbix proxies in the cloud can reduce costs, provide an additional layer of security and redundancy, and improve the available management toolset.

Deploy your Zabbix instance in the Azure cloud with the official Zabbix cloud images:

  • Cloud images are available for the latest Zabbix server and proxy versions
  • Deploy a fresh Zabbix instance in 5 minutes

  • Dynamically scale the cloud resources
  • Select the deployment options based on your budget

Check out the video to learn how to deploy Zabbix in the Microsoft Azure cloud platform:

How to deploy Zabbix in the Azure cloud platform:

  1. Navigate to the Zabbix Cloud Images page
  2. Select the Microsoft Azure vendor and Zabbix server cloud image
  3. Press the Get it now button and press Continue in the next window
  4. On the deployment page press the Create button
  5. Provide the virtual machine name, resource group, region
  6. Specify the administrator account settings
  7. Provide the disk, network, tag, and advanced settings
  8. Verify the provided settings
  9. Press Create to begin deploying the virtual machine
  10. For public key authentication: download and store the private key
  11. Once the deployment is complete, press the Go to resource button
  12. Save your public IP address and connect to it via SSH
  13. Save the initial frontend username and password
  14. Use the public IP address to connect to your Zabbix frontend
  15. Log in with the saved username and password obtained

Tips and best practices
  • The default SSH user is called azureuser
  • Remember to store your SSH private key in a secure location
  • You can access the Zabbix database by using the root user
  • The password for the MySQL database root user is stored in /root/.my.cnf configuration file

Feeling overwhelmed with deploying and managing your Zabbix instance?
Check out the Zabbix certified specialist courses, where under the guidance of a Zabbix certified trainer, you will learn how to deploy, configure and manage your Zabbix instance.

The post Handy Tips #32: Deploying Zabbix in the Azure cloud platform appeared first on Zabbix Blog.

The names of the new Astro Pi computers get revealed

Post Syndicated from Sam Duffy original https://www.raspberrypi.org/blog/new-astro-pi-computer-names-mission-zero-2021-22/

We and our collaborators at ESA Education are excited to announce that 17,168 programs written by young people from 26 countries have been successfully deployed on board the International Space Station (ISS) for the European Astro Pi Challenge 2021/22. And we can finally reveal the names of the two new and upgraded Astro Pi computers that Astro Pi participants have chosen.

The mark 2 Astro Pi units spin in microgravity on the International Space Station.
Young people participating in this year’s Astro Pi Mission Zero had the chance to help name these two upgraded Astro Pi computers, which we sent to the ISS in December.

Astro Pi is more popular than ever with young people

A record number of 28,126 young people took part across both missions in the Astro Pi Challenge 2021/22. In addition to the 299 Mission Space Lab teams who achieved flight status with the code they wrote for their scientific experiments this year, young people wrote 16,869 Mission Zero programs that were run on the new Astro Pi computers. This is an amazing 84% increase compared to Mission Zero last year.

Mission Zero is perfect for beginner coders: participants follow our step-by-step instructions and write a simple program for the Astro Pis. The program takes a humidity reading on board the ISS and displays it for the astronauts. Participants can also include code to display their own unique message on the Astro Pi LED displays. Mission Zero teams are very inventive, and the young people made great use of the Astro Pis’ LED display to create pixel art:

Pixel art coded by young people in Astro Pi Mission Zero.
Examples of pixel art images designed by Mission Zero 2021/22 teams for the Astro Pis’ LED displays.

Every Mission Zero participant receives a unique certificate showing exactly where the ISS was on its orbital path when their program was run:

The new Astro Pi computers’ names

This year, the deployment of all the Mission Zero and Mission Space Lab programs was overseen by ESA astronaut Matthias Maurer. But before he could do that, he first had an extra special task: unpacking and assembling the brand-new Astro Pi units in microgravity.

Matthias catching Astro Pis in microgravity.

The two original Astro Pis, named Ed and Izzy, travelled to the ISS back in 2015 as part of Tim Peake’s Principia mission. Since the, these two special Raspberry Pi computers have run programs written by more than 54,000 young people. They have done an amazing job and will return to Earth later in 20 22.

This year’s European Astro Pi Challenge is the first to use the two all-new Astro Pi computers, which we sent up to the ISS in December 2021. They are packed with special features, widening young people’s possibilities for new Mission Space Lab experiments. Running this year’s 17,168 programs was the new Astro Pis’ first task. 

Two Astro Pi units on board the International Space Station.
The two new Astro Pi computers on board the ISS

All young people taking part in Mission Zero this year had the once-in-a-lifetime opportunity: they got to suggest and vote for the names of the two new Astro Pi computers. We received nearly 7,000 name suggestions.

ESA astronaut Matthias Maurer has recorded a special message for all Astro Pi participants, revealing that the new Astro Pi computers will be named in honour of two inspirational European scientists drum roll… Nikola Tesla and Marie Curie!

The Astro Pi unit equipped with a Raspberry Pi High Quality Camera that is sensitive to near-infrared light is now called Nikola, and the Astro Pi unit with a visible-light sensitive High Quality Camera is now called Marie.

Marie Curie was born in Poland in 1867 and the first person ever to win two Nobel Prizes, in Physics and Chemistry, for her contribution to pioneering work on radioactivity and the treatment of cancer. Nikola Tesla was born in Croatia in 1856, and his innovations in electrical engineering included alternating current — vital for transmitting electricity over long distances — and the induction motor.

Marie Curie and Nikola Tesla’s work continues to impact all of our lives today, and we are delighted that this year’s Astro Pi participants have democratically chosen their names for the new Astro Pi computers.

Sign up for news about the next Astro Pi Challenge

The European Astro Pi Challenge will be back again in September 2022. Subscribe to the Astro Pi newsletter on the Astro Pi website to be the first to hear when the 2022/23 missions have lift off! 

The post The names of the new Astro Pi computers get revealed appeared first on Raspberry Pi.

The collective thoughts of the interwebz