Post Syndicated from original https://xkcd.com/2618/

Post Syndicated from original https://xkcd.com/2618/
Post Syndicated from original https://lwn.net/Articles/894390/
It would have been surprising indeed if the 2022 Linux Storage,
Filesystem, Memory-management and BPF Summit (LSFMM) did not include a
session working toward solutions to the longstanding problems with
get_user_pages(), an internal function that locks user-space pages
in memory for access by the kernel. The issue has, after all, come up numerous times
over the years. This year’s event duly contained a session in the joint
filesystem and memory-management track, led by John Hubbard, with a focus
on page pinning and how it interacts with filesystems.
Post Syndicated from Ilya Epshteyn original https://aws.amazon.com/blogs/security/establishing-a-data-perimeter-on-aws/
For your sensitive data on AWS, you should implement security controls, including identity and access management, infrastructure security, and data protection. Amazon Web Services (AWS) recommends that you set up multiple accounts as your workloads grow to isolate applications and data that have specific security requirements. AWS tools can help you establish a data perimeter between your multiple accounts, while blocking unintended access from outside of your organization. Data perimeters on AWS span many different features and capabilities. Based on your security requirements, you should decide which capabilities are appropriate for your organization. In this first blog post on data perimeters, I discuss which AWS Identity and Access Management (IAM) features and capabilities you can use to establish a data perimeter on AWS. Subsequent posts will provide implementation guidance and IAM policy examples for establishing your identity, resource, and network data perimeters.
A data perimeter is a set of preventive guardrails that help ensure that only your trusted identities are accessing trusted resources from expected networks. These terms are defined as follows:
You typically implement data perimeter guardrails as coarse-grained controls that apply across a broad set of AWS accounts and resources. When you implement a data perimeter, consider the following six primary control objectives.
| Data perimeter | Control objective |
| Identity | Only trusted identities can access my resources. |
| Only trusted identities are allowed from my network. | |
| Resource | My identities can access only trusted resources. |
| Only trusted resources can be accessed from my network. | |
| Network | My identities can access resources only from expected networks. |
| My resources can only be accessed from expected networks. |
Note that the controls in the preceding table are coarse in nature and are meant to serve as always-on boundaries. You can think of data perimeters as creating a firm boundary around your data to prevent unintended access patterns. Although data perimeters can prevent broad unintended access, you still need to make fine-grained access control decisions. Establishing a data perimeter does not diminish the need to continuously fine-tune permissions by using tools such as IAM Access Analyzer as part of your journey to least privilege.
To implement the preceding control objectives on AWS, use three primary capabilities:
Let’s expand the previous table to include the corresponding policies you would use to implement the controls for each of the control objectives.
| Data perimeter | Control objective | Implemented by using |
| Identity | Only trusted identities can access my resources. | Resource-based policies |
| Only trusted identities are allowed from my network. | VPC endpoint policies | |
| Resource | My identities can access only trusted resources. | SCPs |
| Only trusted resources can be accessed from my network. | VPC endpoint policies | |
| Network | My identities can access resources only from expected networks. | SCPs |
| My resources can only be accessed from expected networks. | Resource-based policies |
As you can see in the preceding table, the correct policy for each control objective depends on which resource you are trying to secure. Resource-based policies, which are applied to resources such as Amazon S3 buckets, can be used to filter access based on the calling principal and the network from which they are making a call. VPC endpoint policies are used to inspect the principal that is making the API call and the resource they are trying to access. And SCPs are used to restrict your identities from accessing resources outside your control or from outside your network. Note that SCPs apply only to your principals within your AWS organization, whereas resource policies can be used to limit access to all principals.
The last components are the specific IAM controls or condition keys that enforce the control objective. For effective data perimeter controls, use the following primary IAM condition keys, including the new resource owner condition keys:
We can now complete the table that we’ve been developing throughout this post.
| Data perimeter | Control objective | Implemented by using | Primary IAM capability |
| Identity | Only trusted identities can access my resources. | Resource-based policies | aws:PrincipalOrgID aws:PrincipalIsAWSService |
| Only trusted identities are allowed from my network. | VPC endpoint policies | aws:PrincipalOrgID | |
| Resource | My identities can access only trusted resources. | SCPs | aws:ResourceOrgID |
| Only trusted resources can be accessed from my network. | VPC endpoint policies | aws:ResourceOrgID | |
| Network | My identities can access resources only from expected networks. | SCPs | aws:SourceIp aws:SourceVpc aws:SourceVpce aws:ViaAWSService |
| My resources can only be accessed from expected networks. | Resource-based policies | aws:SourceIp aws:SourceVpc aws:SourceVpce aws:ViaAWSService aws:PrincipalIsAWSService |
For the identity data perimeter, the primary condition key is aws:PrincipalOrgID, which you can use in resource-based policies and VPC endpoint policies so that only your identities are allowed access. Use aws:PrincipalIsAWSService to allow AWS services to access your resources by using their own identities—for example, AWS CloudTrail can use this access to write data to your bucket.
For the resource data perimeter, the primary condition key is aws:ResourceOrgID, which you can use in an SCP policy or VPC endpoint policy to allow your identities and network to access only the resources that belong to your AWS organization.
Last, for the network perimeter, use the aws:SourceIp, aws:SourceVpc, and aws:SourceVpce condition keys in SCPs and resource-based policies to make sure that your identities and resources are accessed only from your trusted network. Use the aws:PrincipalIsAWSService and aws:ViaAWSService condition keys to allow AWS services to access your resources from outside your network locations. For example, CloudTrail can use this access to write data to one of your S3 buckets, or Amazon Athena can query data in your S3 buckets. For more information about using these keys as part of your data perimeter strategy, see the blog post IAM makes it easier for you to manage permissions for AWS services accessing your resources.
In this blog post, you learned the foundational elements that are needed to implement an identity, resource, and network data perimeter on AWS, including the primary IAM capabilities that are used to implement each of the control objectives. Stay tuned to the follow-up posts in this series, which will provide prescriptive guidance on establishing your identity, resource, and network data perimeters.
Following are additional resources that will help you further explore the data perimeter topic, including a whitepaper and a hands-on-workshop. We have also curated several blog posts related to the key IAM capabilities discussed in this post.
If you have any questions, comments, or concerns, contact AWS Support or start a new thread on the IAM forum. If you have feedback about this post, submit comments in the Comments section below.
Want more AWS Security news? Follow us on Twitter.
Post Syndicated from original https://lwn.net/Articles/894379/
In a combined filesystem and memory-management session at the 2022 Linux Storage,
Filesystem, Memory-management and BPF Summit (LSFMM), Paul McKenney
gave an update on
the changes to the read-copy-update (RCU) subsystem that had been made over
the last several years. He started with a quick overview of what RCU is
and why it exists at all. He did not go into any
real depth, though, since many of the topics could take a 90-minute session of their
own, he said, but he did provide some descriptions of the work that has gone into
RCU recently.
Post Syndicated from Greg Wiseman original https://blog.rapid7.com/2022/05/10/patch-tuesday-may-2022/

This month is par for the course in terms of both number and severity of vulnerabilities being patched by Microsoft. That means there’s plenty of work to be done by system and network administrators, as usual.
There is one 0-day this month: CVE-2022-26925, a Spoofing vulnerability in the Windows Local Security Authority (LSA) subsystem, which allows attackers able to perform a man-in-the-middle attack to force domain controllers to authenticate to the attacker using NTLM authentication. This is very bad news when used in conjunction with an NTLM relay attack, potentially leading to remote code execution (RCE). This bug affects all supported versions of Windows, but Domain Controllers should be patched on a priority basis before updating other servers.
Two other CVEs were also publicly disclosed before today’s releases, though they have not yet been seen exploited in the wild. CVE-2022-22713 is a denial-of-service vulnerability that affects Hyper-V servers running relatively recent versions of Windows (20H2 and later). CVE-2022-29972 is a Critical RCE that affects the Amazon Redshift ODBC driver used by Microsoft’s Self-hosted Integration Runtime (a client agent that enables on-premises data sources to exchange data with cloud services such as Azure Data Factory and Azure Synapse Pipelines). This vulnerability also prompted Microsoft to publish their first guidance-based advisory of the year, ADV220001, indicating their plans to strengthen tenant isolation in their cloud services without actually providing any specific details or actions to be taken by customers.
All told, 74 CVEs were fixed this month, the vast majority of which affect functionality within the Windows operating system. Other notable vulnerabilities include CVE-2022-21972 and CVE-2022-23270, critical RCEs in the Point-to-Point Tunneling Protocol. Exploitation requires attackers to win a race condition, which increases the complexity, but if you have any RAS servers in your environment, patch sooner rather than later.
CVE-2022-26937 carries a CVSSv3 score of 9.8 and affects services using the Windows Network File System (NFS). This can be mitigated by disabling NFSV2 and NFSV3 on the server; however, this may cause compatibility issues, and upgrading is highly recommended.
CVE-2022-22017 is yet another client-side Remote Desktop Protocol (RDP) vulnerability. While not as worrisome as when an RCE affects RDP servers, if a user can be enticed to connect to a malicious RDP server via social engineering tactics, an attacker will gain RCE on their system.
Sharepoint Server administrators should be aware of CVE-2022-29108, a post-authentication RCE fixed today. Exchange admins have CVE-2022-21978 to worry about, which could allow an attacker with elevated privileges on an Exchange server to gain the rights of a Domain Administrator.
A host of Lightweight Directory Access Protocol (LDAP) vulnerabilities were also addressed this month, including CVE-2022-22012 and CVE-2022-29130 – both RCEs that, thankfully, are only exploitable if the MaxReceiveBuffer LDAP policy is set to a value higher than the default value.
Although there are no browser vulnerabilities this month, two RCEs affecting Excel (CVE-2022-29109 and CVE-2022-29110) and one Security Feature Bypass affecting Office (CVE-2022-29107) mean there is still some endpoint application patching to do.
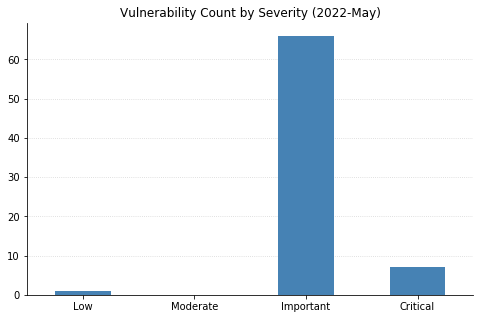
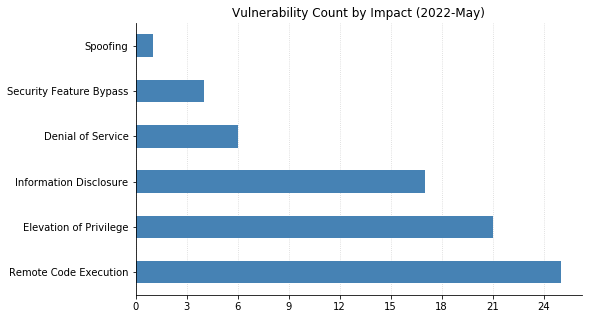
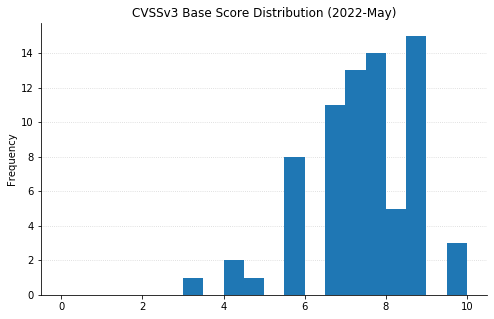
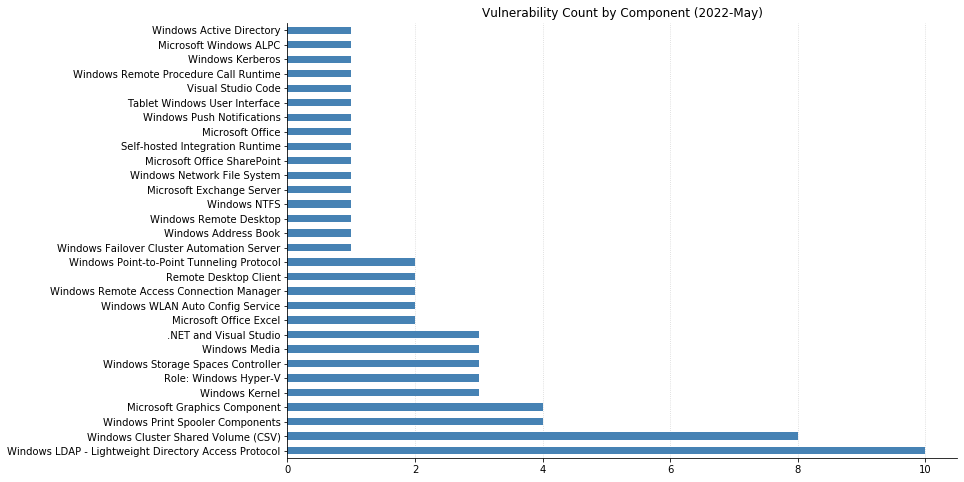
| CVE | Title | Exploited? | Publicly disclosed? | CVSSv3 base score | Has FAQ? |
|---|---|---|---|---|---|
| CVE-2022-29972 | Insight Software: CVE-2022-29972 Magnitude Simba Amazon Redshift ODBC Driver | No | Yes | N/A | Yes |
| CVE | Title | Exploited? | Publicly disclosed? | CVSSv3 base score | Has FAQ? |
|---|---|---|---|---|---|
| CVE-2022-29148 | Visual Studio Remote Code Execution Vulnerability | No | No | 7.8 | Yes |
| CVE-2022-30129 | Visual Studio Code Remote Code Execution Vulnerability | No | No | 8.8 | Yes |
| CVE-2022-23267 | .NET and Visual Studio Denial of Service Vulnerability | No | No | 7.5 | No |
| CVE-2022-29117 | .NET and Visual Studio Denial of Service Vulnerability | No | No | 7.5 | No |
| CVE-2022-29145 | .NET and Visual Studio Denial of Service Vulnerability | No | No | 7.5 | No |
| CVE-2022-30130 | .NET Framework Denial of Service Vulnerability | No | No | 3.3 | No |
| CVE | Title | Exploited? | Publicly disclosed? | CVSSv3 base score | Has FAQ? |
|---|---|---|---|---|---|
| CVE-2022-26935 | Windows WLAN AutoConfig Service Information Disclosure Vulnerability | No | No | 6.5 | Yes |
| CVE-2022-29121 | Windows WLAN AutoConfig Service Denial of Service Vulnerability | No | No | 6.5 | Yes |
| CVE-2022-26936 | Windows Server Service Information Disclosure Vulnerability | No | No | 6.5 | Yes |
| CVE-2022-22015 | Windows Remote Desktop Protocol (RDP) Information Disclosure Vulnerability | No | No | 6.5 | Yes |
| CVE-2022-29103 | Windows Remote Access Connection Manager Elevation of Privilege Vulnerability | No | No | 7.8 | No |
| CVE-2022-29132 | Windows Print Spooler Elevation of Privilege Vulnerability | No | No | 7.8 | No |
| CVE-2022-26937 | Windows Network File System Remote Code Execution Vulnerability | No | No | 9.8 | Yes |
| CVE-2022-26925 | Windows LSA Spoofing Vulnerability | Yes | Yes | 8.1 | Yes |
| CVE-2022-22012 | Windows LDAP Remote Code Execution Vulnerability | No | No | 9.8 | Yes |
| CVE-2022-29130 | Windows LDAP Remote Code Execution Vulnerability | No | No | 9.8 | Yes |
| CVE-2022-22013 | Windows LDAP Remote Code Execution Vulnerability | No | No | 8.8 | No |
| CVE-2022-22014 | Windows LDAP Remote Code Execution Vulnerability | No | No | 8.8 | No |
| CVE-2022-29128 | Windows LDAP Remote Code Execution Vulnerability | No | No | 8.8 | Yes |
| CVE-2022-29129 | Windows LDAP Remote Code Execution Vulnerability | No | No | 8.8 | Yes |
| CVE-2022-29137 | Windows LDAP Remote Code Execution Vulnerability | No | No | 8.8 | No |
| CVE-2022-29139 | Windows LDAP Remote Code Execution Vulnerability | No | No | 8.8 | Yes |
| CVE-2022-29141 | Windows LDAP Remote Code Execution Vulnerability | No | No | 8.8 | No |
| CVE-2022-26931 | Windows Kerberos Elevation of Privilege Vulnerability | No | No | 7.5 | Yes |
| CVE-2022-26934 | Windows Graphics Component Information Disclosure Vulnerability | No | No | 6.5 | Yes |
| CVE-2022-29112 | Windows Graphics Component Information Disclosure Vulnerability | No | No | 6.5 | Yes |
| CVE-2022-22011 | Windows Graphics Component Information Disclosure Vulnerability | No | No | 5.5 | Yes |
| CVE-2022-29115 | Windows Fax Service Remote Code Execution Vulnerability | No | No | 7.8 | Yes |
| CVE-2022-26926 | Windows Address Book Remote Code Execution Vulnerability | No | No | 7.8 | Yes |
| CVE-2022-22019 | Remote Procedure Call Runtime Remote Code Execution Vulnerability | No | No | 8.8 | Yes |
| CVE-2022-21972 | Point-to-Point Tunneling Protocol Remote Code Execution Vulnerability | No | No | 8.1 | Yes |
| CVE-2022-23270 | Point-to-Point Tunneling Protocol Remote Code Execution Vulnerability | No | No | 8.1 | Yes |
| CVE-2022-29105 | Microsoft Windows Media Foundation Remote Code Execution Vulnerability | No | No | 7.8 | No |
| CVE-2022-29127 | BitLocker Security Feature Bypass Vulnerability | No | No | 4.2 | Yes |
| CVE | Title | Exploited? | Publicly disclosed? | CVSSv3 base score | Has FAQ? |
|---|---|---|---|---|---|
| CVE-2022-21978 | Microsoft Exchange Server Elevation of Privilege Vulnerability | No | No | 8.2 | Yes |
| CVE | Title | Exploited? | Publicly disclosed? | CVSSv3 base score | Has FAQ? |
|---|---|---|---|---|---|
| CVE-2022-29108 | Microsoft SharePoint Server Remote Code Execution Vulnerability | No | No | 8.8 | Yes |
| CVE-2022-29107 | Microsoft Office Security Feature Bypass Vulnerability | No | No | 5.5 | Yes |
| CVE-2022-29109 | Microsoft Excel Remote Code Execution Vulnerability | No | No | 7.8 | Yes |
| CVE-2022-29110 | Microsoft Excel Remote Code Execution Vulnerability | No | No | 7.8 | Yes |
| CVE | Title | Exploited? | Publicly disclosed? | CVSSv3 base score | Has FAQ? |
|---|---|---|---|---|---|
| CVE-2022-26930 | Windows Remote Access Connection Manager Information Disclosure Vulnerability | No | No | 5.5 | Yes |
| CVE-2022-29125 | Windows Push Notifications Apps Elevation of Privilege Vulnerability | No | No | 7 | Yes |
| CVE-2022-29114 | Windows Print Spooler Information Disclosure Vulnerability | No | No | 5.5 | Yes |
| CVE-2022-29140 | Windows Print Spooler Information Disclosure Vulnerability | No | No | 5.5 | Yes |
| CVE-2022-29104 | Windows Print Spooler Elevation of Privilege Vulnerability | No | No | 7.8 | No |
| CVE-2022-22016 | Windows PlayToManager Elevation of Privilege Vulnerability | No | No | 7 | Yes |
| CVE-2022-26933 | Windows NTFS Information Disclosure Vulnerability | No | No | 5.5 | Yes |
| CVE-2022-29131 | Windows LDAP Remote Code Execution Vulnerability | No | No | 8.8 | Yes |
| CVE-2022-29116 | Windows Kernel Information Disclosure Vulnerability | No | No | 4.7 | Yes |
| CVE-2022-29133 | Windows Kernel Elevation of Privilege Vulnerability | No | No | 8.8 | Yes |
| CVE-2022-29142 | Windows Kernel Elevation of Privilege Vulnerability | No | No | 7 | Yes |
| CVE-2022-29106 | Windows Hyper-V Shared Virtual Disk Elevation of Privilege Vulnerability | No | No | 7 | Yes |
| CVE-2022-24466 | Windows Hyper-V Security Feature Bypass Vulnerability | No | No | 4.1 | Yes |
| CVE-2022-22713 | Windows Hyper-V Denial of Service Vulnerability | No | Yes | 5.6 | Yes |
| CVE-2022-26927 | Windows Graphics Component Remote Code Execution Vulnerability | No | No | 8.8 | Yes |
| CVE-2022-29102 | Windows Failover Cluster Information Disclosure Vulnerability | No | No | 5.5 | Yes |
| CVE-2022-29113 | Windows Digital Media Receiver Elevation of Privilege Vulnerability | No | No | 7.8 | Yes |
| CVE-2022-29134 | Windows Clustered Shared Volume Information Disclosure Vulnerability | No | No | 6.5 | Yes |
| CVE-2022-29120 | Windows Clustered Shared Volume Information Disclosure Vulnerability | No | No | 6.5 | Yes |
| CVE-2022-29122 | Windows Clustered Shared Volume Information Disclosure Vulnerability | No | No | 6.5 | Yes |
| CVE-2022-29123 | Windows Clustered Shared Volume Information Disclosure Vulnerability | No | No | 6.5 | Yes |
| CVE-2022-29138 | Windows Clustered Shared Volume Elevation of Privilege Vulnerability | No | No | 7 | Yes |
| CVE-2022-29135 | Windows Cluster Shared Volume (CSV) Elevation of Privilege Vulnerability | No | No | 7 | Yes |
| CVE-2022-29150 | Windows Cluster Shared Volume (CSV) Elevation of Privilege Vulnerability | No | No | 7 | Yes |
| CVE-2022-29151 | Windows Cluster Shared Volume (CSV) Elevation of Privilege Vulnerability | No | No | 7 | Yes |
| CVE-2022-26913 | Windows Authentication Security Feature Bypass Vulnerability | No | No | 7.4 | Yes |
| CVE-2022-23279 | Windows ALPC Elevation of Privilege Vulnerability | No | No | 7 | Yes |
| CVE-2022-29126 | Tablet Windows User Interface Application Core Elevation of Privilege Vulnerability | No | No | 7 | Yes |
| CVE-2022-26932 | Storage Spaces Direct Elevation of Privilege Vulnerability | No | No | 8.2 | Yes |
| CVE-2022-26938 | Storage Spaces Direct Elevation of Privilege Vulnerability | No | No | 7 | Yes |
| CVE-2022-26939 | Storage Spaces Direct Elevation of Privilege Vulnerability | No | No | 7 | Yes |
| CVE-2022-26940 | Remote Desktop Protocol Client Information Disclosure Vulnerability | No | No | 6.5 | Yes |
| CVE-2022-22017 | Remote Desktop Client Remote Code Execution Vulnerability | No | No | 8.8 | Yes |
| CVE-2022-26923 | Active Directory Domain Services Elevation of Privilege Vulnerability | No | No | 8.8 | Yes |
Post Syndicated from Manash Deb original https://aws.amazon.com/blogs/big-data/analyze-amazon-ses-events-at-scale-using-amazon-redshift/
Email is one of the most important methods for business communication across many organizations. It’s also one of the primary methods for many businesses to communicate with their customers. With the ever-increasing necessity to send emails at scale, monitoring and analysis has become a major challenge.
Amazon Simple Email Service (Amazon SES) is a cost-effective, flexible, and scalable email service that enables you to send and receive emails from your applications. You can use Amazon SES for several use cases, such as transactional, marketing, or mass email communications.
An important benefit of Amazon SES is its native integration with other AWS services, such as Amazon CloudWatch and Amazon Redshift, which allows you to monitor and analyze your emails sending at scale seamlessly. You can store your email events in Amazon Redshift, which is a widely used, fast, and fully managed cloud data warehouse. You can then analyze these events using SQL to gain business insights such as marketing campaign success, email bounces, complaints, and so on.
In this post, you will learn how to implement an end-to-end solution to automate this email analysis and monitoring process.
The following architecture diagram highlights the end-to-end solution, which you can provision automatically with an AWS CloudFormation template.
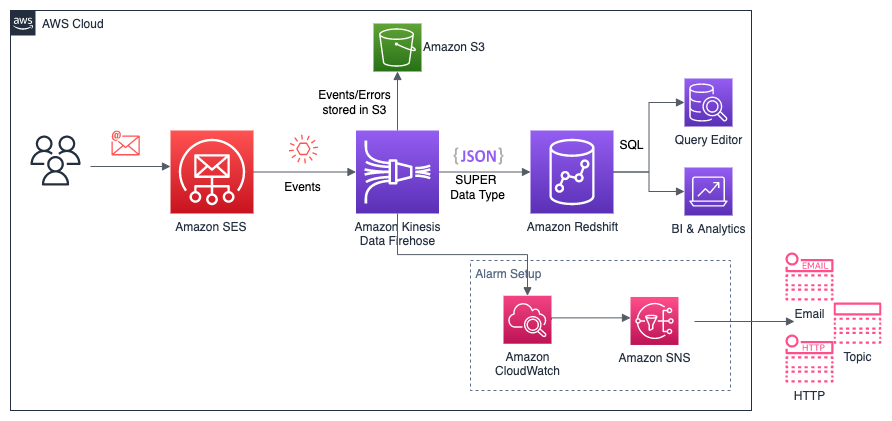
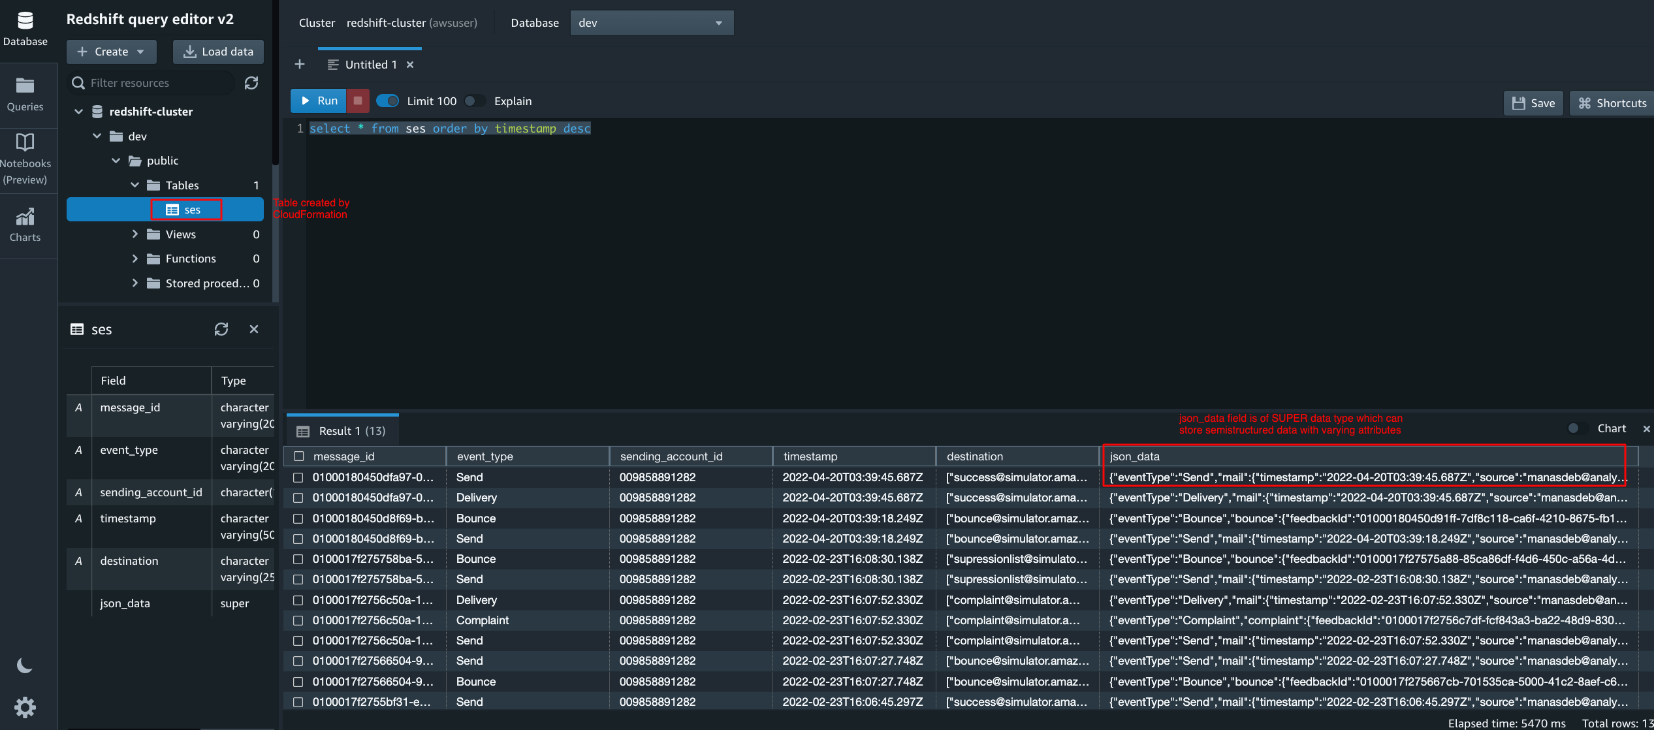
In this solution, you publish Amazon SES email events to an Amazon Kinesis Data Firehose delivery stream that publishes data to Amazon Redshift. You then connect to the Amazon Redshift database and use a SQL query tool to analyze Amazon SES email events that meet the given criteria. We use the Amazon Redshift SUPER data type to store the event (JSON data) in Amazon Redshift. The SUPER data type handles semi-structured data, which can have varying table attributes and types.
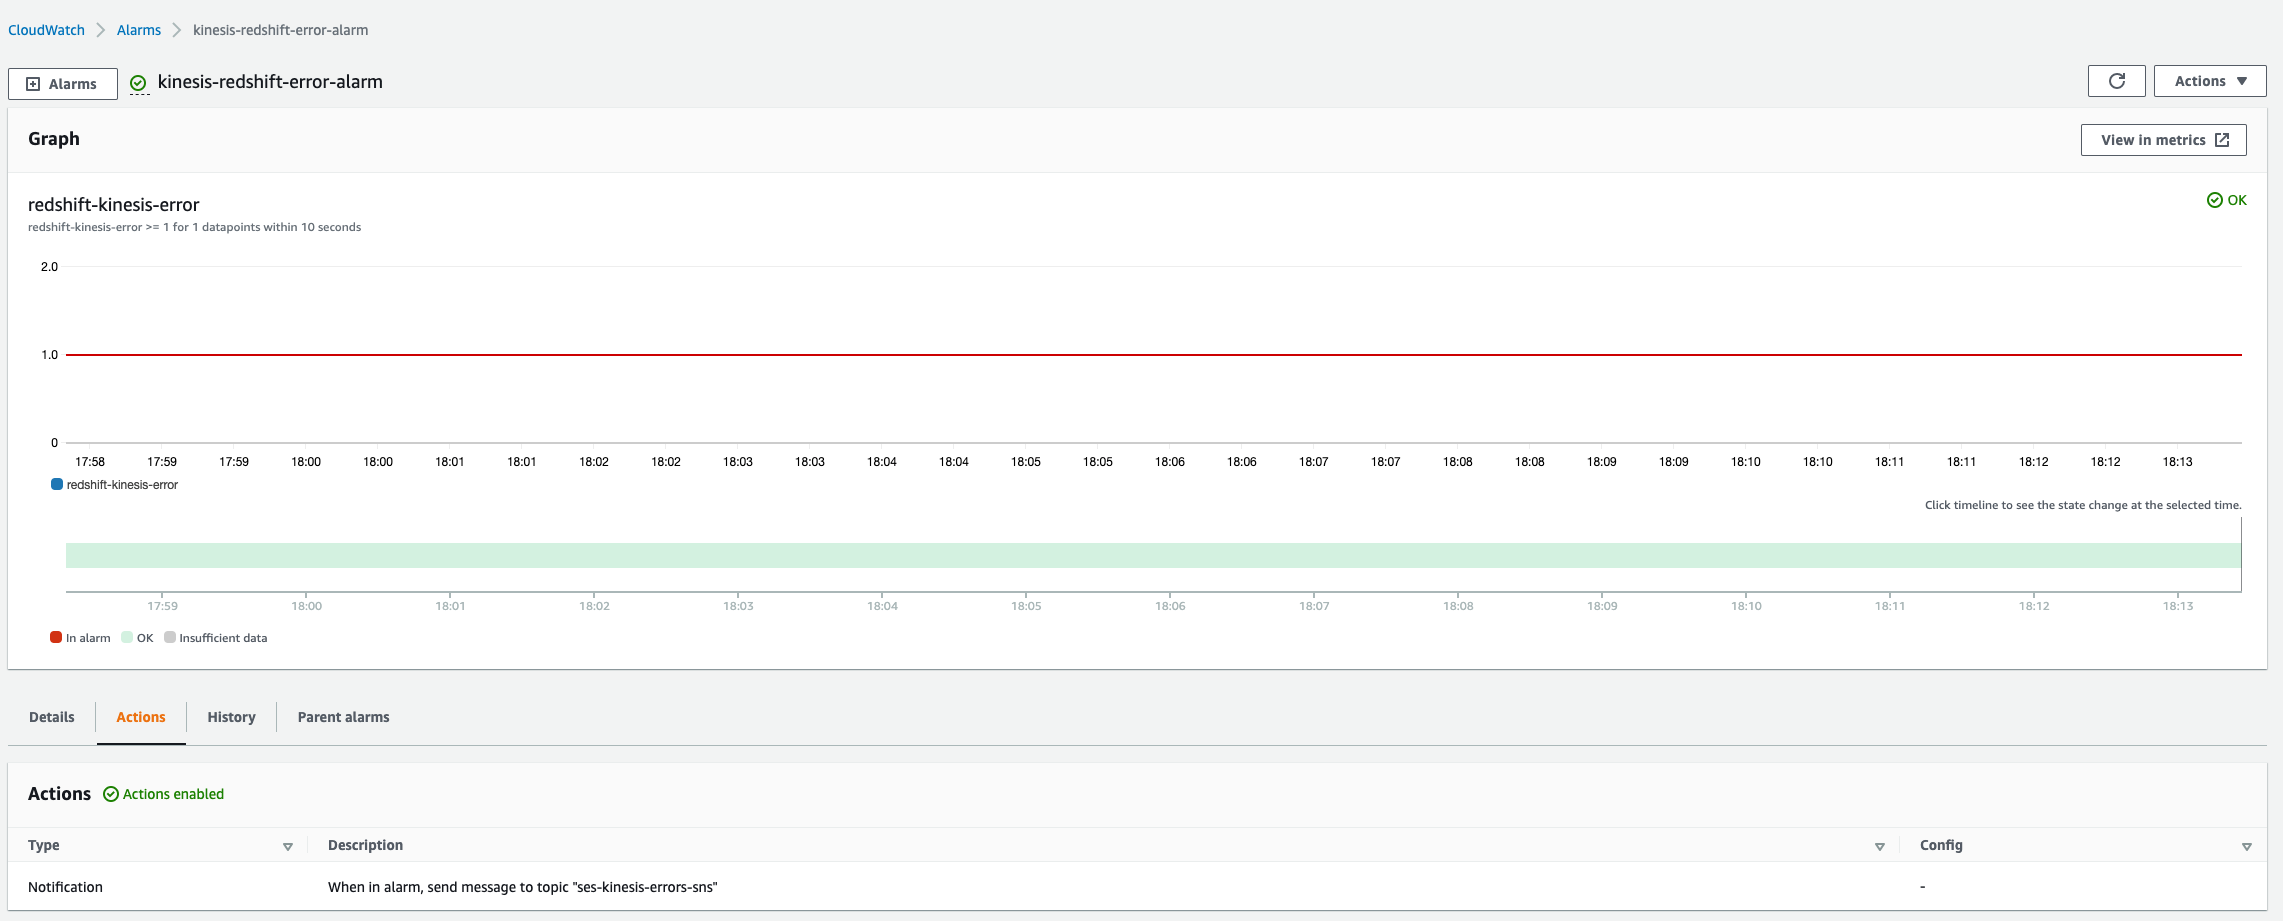
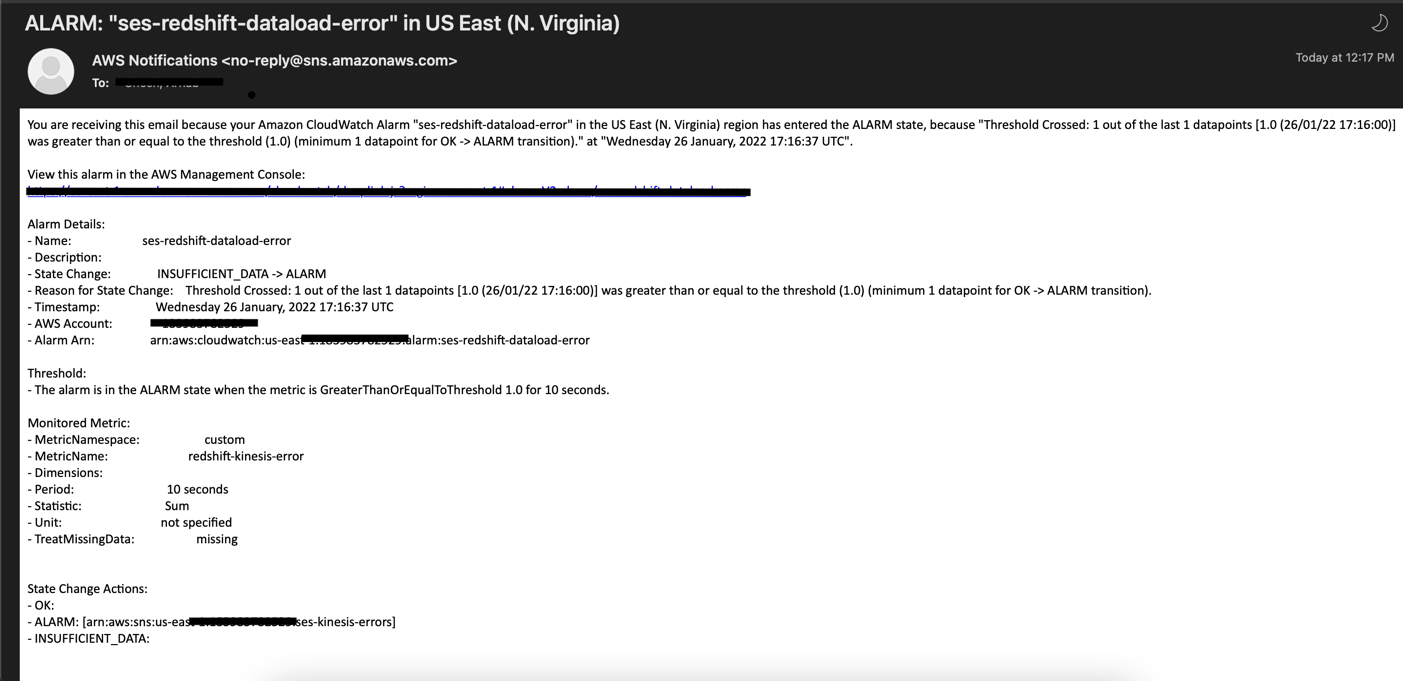
The alarm system uses Amazon CloudWatch logs that Kinesis Data Firehose generates when a data load to Amazon Redshift fails. We have set up a metric filter that pattern matches the CloudWatch log events to determine the error condition and triggers a CloudWatch alarm. This in turn sends out email notifications using Amazon Simple Notification Service (Amazon SNS).
As a prerequisite for deploying the solution in this post, you need to set up Amazon SES in your account. For more information, see Getting Started with Amazon Simple Email Service.
The architecture built by AWS CloudFormation supports AWS best practices for high availability and security. The CloudFormation template takes care of the following key resources and features:
ses, as shown in the following screenshot.

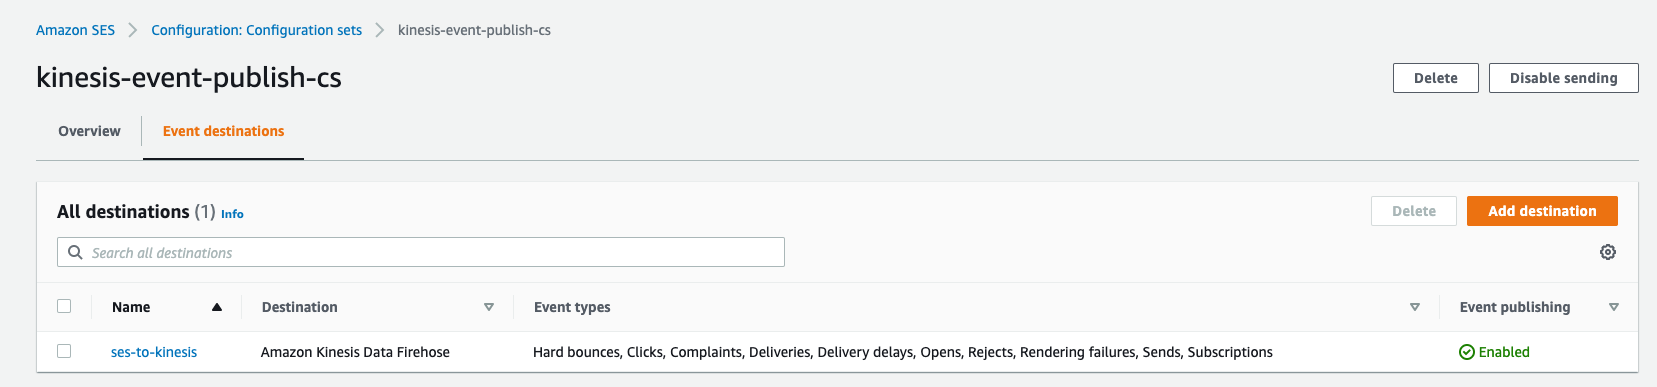
To use the configuration set when sending emails, you can specify a default configuration set for your verified identity, or include a reference to the configuration set in the headers of the email.


A CloudWatch alarm based on the metric filter triggers an SNS notification when in alarm state. For more information, see Using Amazon CloudWatch alarms.
The provided CloudFormation template automatically creates all the required resources for this solution in your AWS account. For more information, see Getting started with AWS CloudFormation.

ses_events.NumberofNodes parameter must be greater than 1.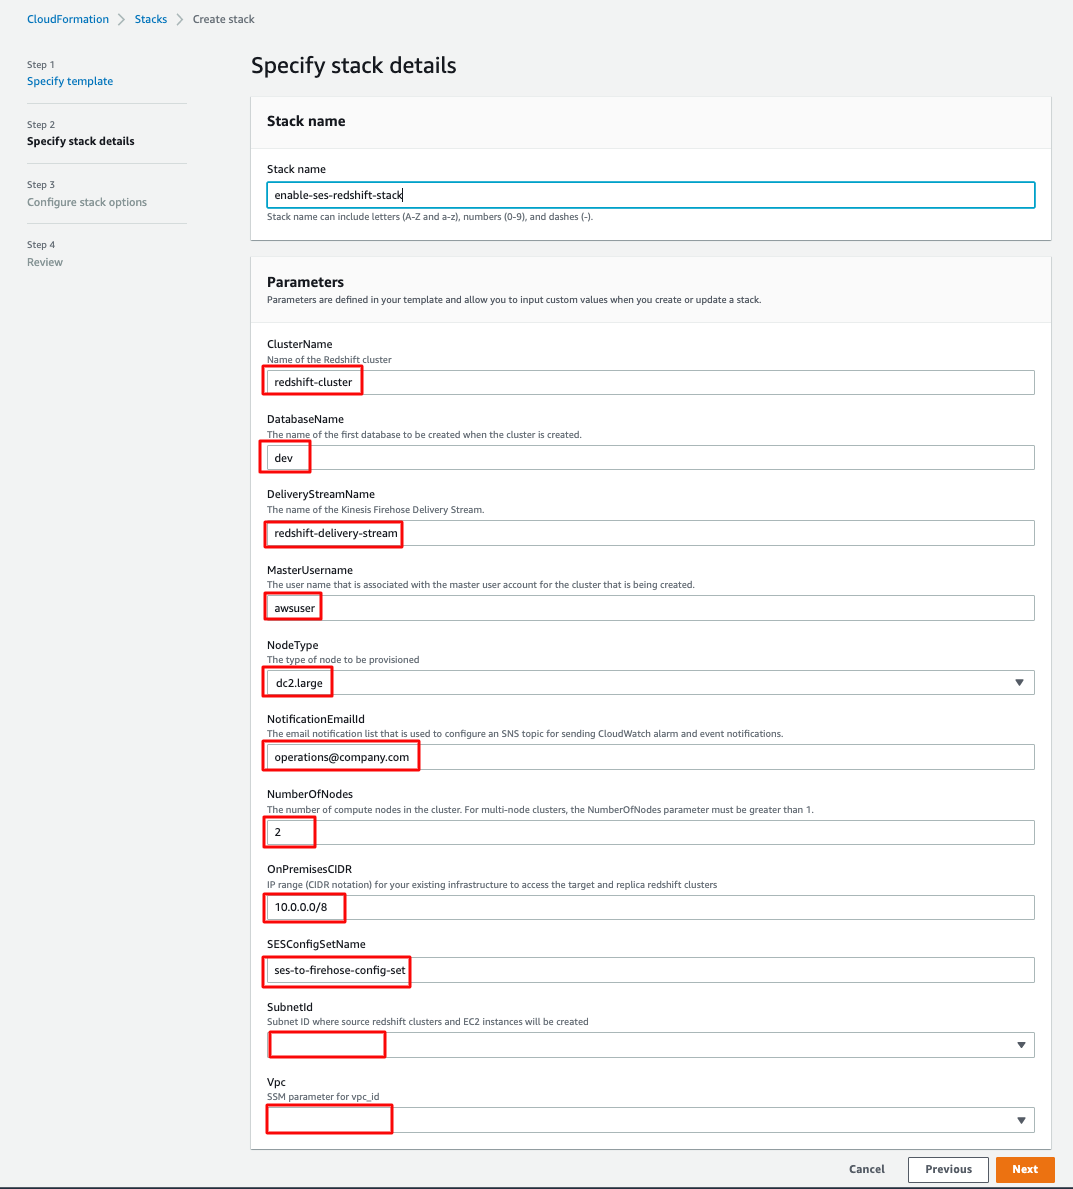

You can track the progress of the stack creation on the Events tab. Wait for the stack to complete and show the status CREATE_COMPLETE.

To send a test email, we use the Amazon SES mailbox simulator. Set the configuration-set header to the one created by the CloudFormation template.
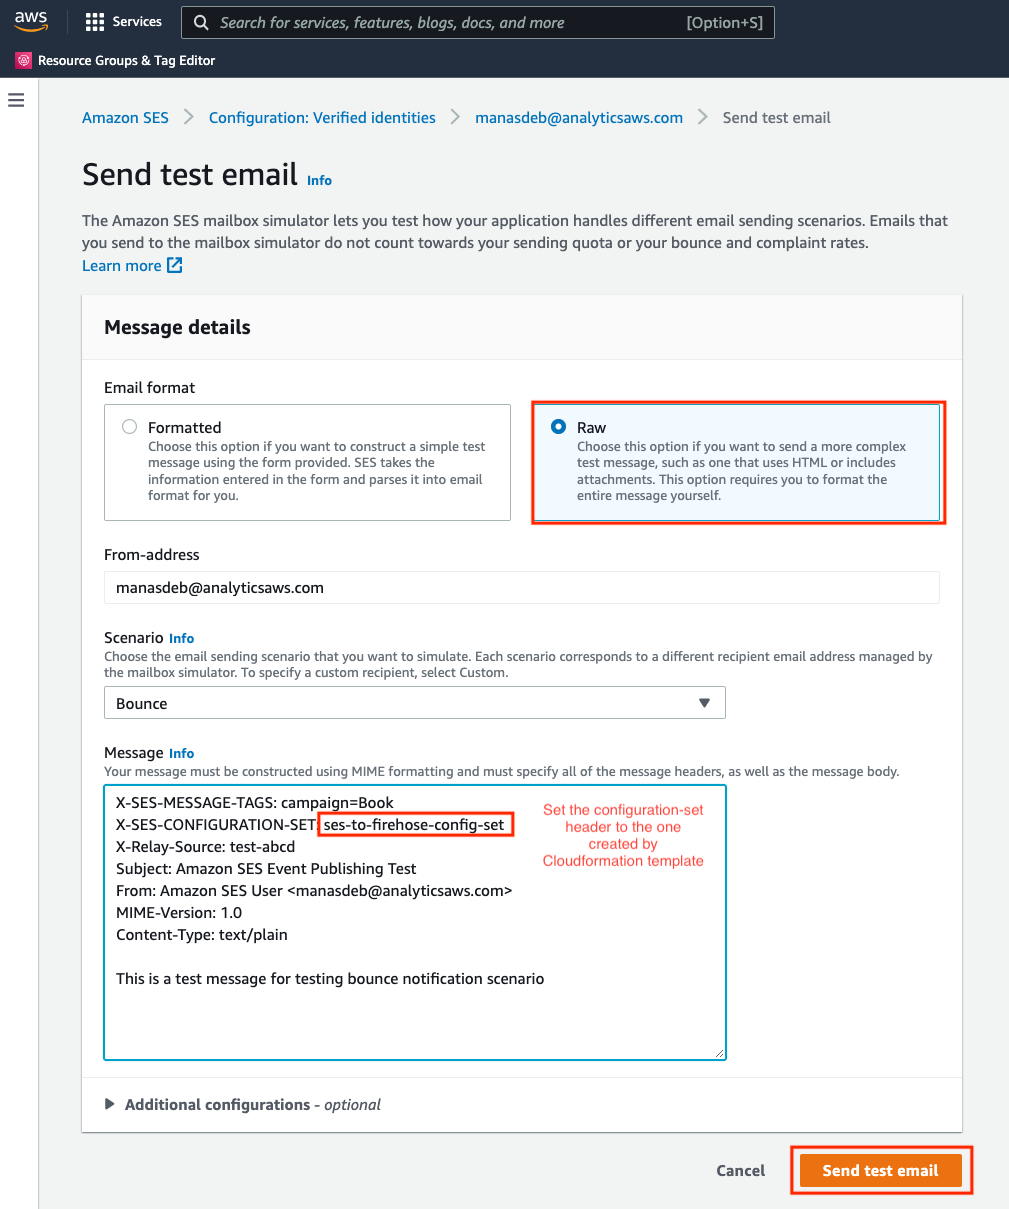
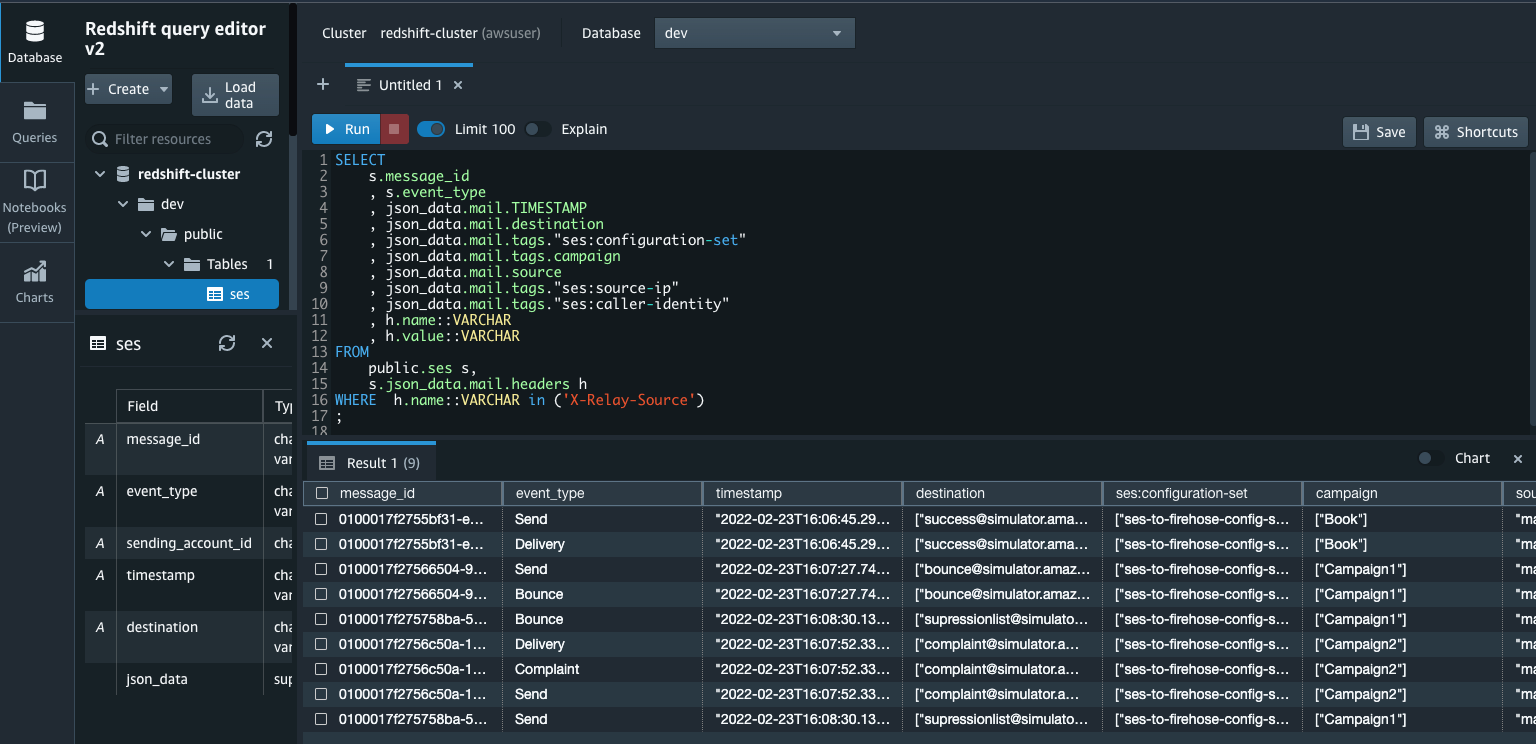
We use the Amazon Redshift query editor V2 to query the Amazon Redshift table (created by the CloudFormation template) and see if the events have shown up.
If the data load of the event stream fails from Kinesis Data Firehose to Amazon Redshift, the failure notification system is triggered, and you receive an email notification via Amazon SNS.
Some of the AWS resources deployed by the CloudFormation stacks in this post incur a cost as long as you continue to use them.
You can delete the CloudFormation stack to delete all AWS resources created by the stack. To clean up all your stacks, use the AWS CloudFormation console to remove the stacks that you created in reverse order.
After stack deletion begins, you can’t stop it. The stack proceeds to the DELETE_IN_PROGRESS state. When the stack deletion is complete, the stack changes to the DELETE_COMPLETE state. The AWS CloudFormation console doesn’t display stacks in the DELETE_COMPLETE state by default. To display deleted stacks, you must change the stack view filter. For more information, see Viewing deleted stacks on the AWS CloudFormation console.
If the delete fails, the stack enters the DELETE_FAILED state. For solutions, see Delete stack fails.
In this post, we walked through the process of setting up Amazon SES and Amazon Redshift to deploy an email reporting service that can scale to support millions of events. We used Amazon Redshift to store semi-structured messages using the SUPER data type in database tables to support varying message sizes and formats. With this solution, you can easily run analytics at scale and analyze your email event data for deliverability-related issues such as bounces or complaints.
Use the CloudFormation template provided to speed up provisioning of the cloud resources required for the solution (Amazon SES, Kinesis Data Firehose, and Amazon Redshift) in your account while following security best practices. Then you can analyze Amazon SES events at scale using Amazon Redshift.
 Manash Deb is a Software Development Engineer in the AWS Directory Service team. He has worked on building end-to-end applications in different database and technologies for over 15 years. He loves to learn new technologies and solving, automating, and simplifying customer problems on AWS.
 Arnab Ghosh is a Solutions Architect for AWS in North America helping enterprise customers build resilient and cost-efficient architectures. He has over 13 years of experience in architecting, designing, and developing enterprise applications solving complex business problems.
 Sanjoy Thanneer is a Sr. Technical Account Manager with AWS based out of New York. He has over 20 years of experience working in Database and Analytics Domains. He is passionate about helping enterprise customers build scalable , resilient and cost efficient Applications.
 Justin Morris is a Email Deliverability Manager for the Simple Email Service team. With over 10 years of experience in the IT industry, he has developed a natural talent for diagnosing and resolving customer issues and continuously looks for growth opportunities to learn new technologies and services.
Post Syndicated from João Tomé original https://blog.cloudflare.com/watching-eurovision-2022-on-cloudflare-radar/


The Eurovision Song Contest has a history that goes back to 1956, so it’s even older than the European Union and one of its highlights over the years was being the first global stage for the Swedish group ABBA — Waterloo won the 1974 edition). This year, for the 66th edition, we have a dedicated page for Eurovision fans, journalists or anyone interested in following Internet trends related to the event taking place in Turin, Italy.
The contest consists of two semi-finals and a final. The first semi-final is today, May 10, at 21:00 CEST, the second is Thursday, May 12, at 21:00 CEST. And the final is on Saturday, May 14, at 21:00 CEST. We are using Central European Summer Time and not our usual (on Radar) UTC because that’s the timezone of most of the 40 countries that will take part in the contest. There will be 17 countries in the first semi-final, 18 in the second, and 25 in the final (the full list is here).
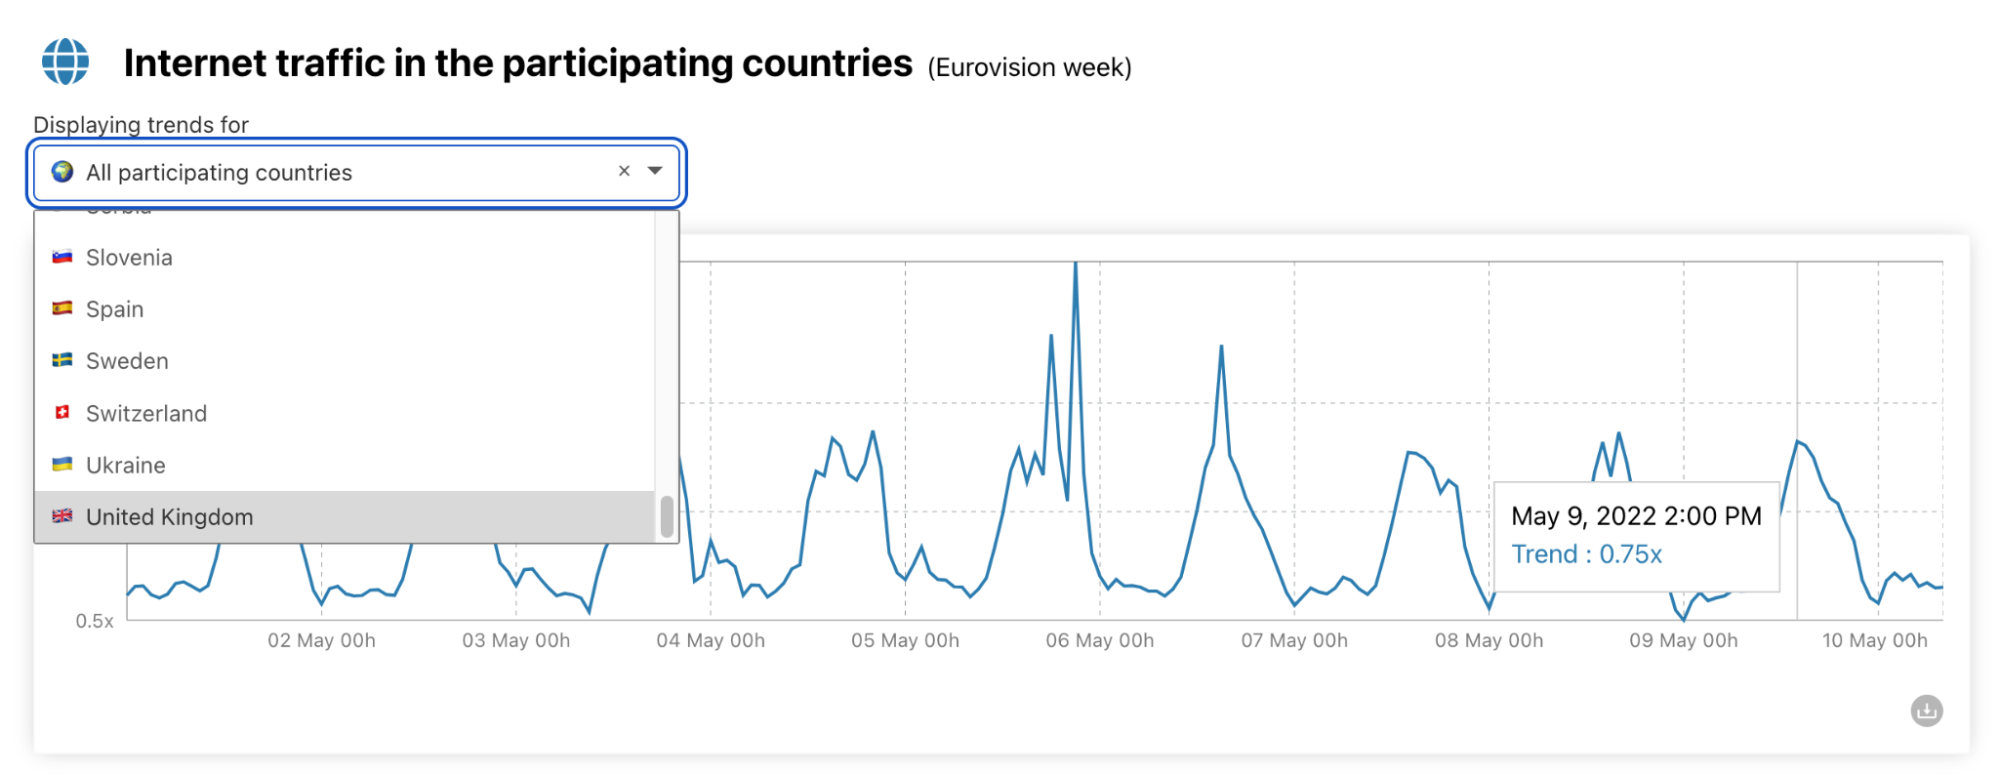
First, you can see the Internet traffic aggregate in all the 40 countries that are participating in Eurovision 2022. There’s also a toggle to choose each of the 40 countries regarding Internet traffic. If you pass the mouse over the traffic line, the traffic level hour by hour is also highlighted.
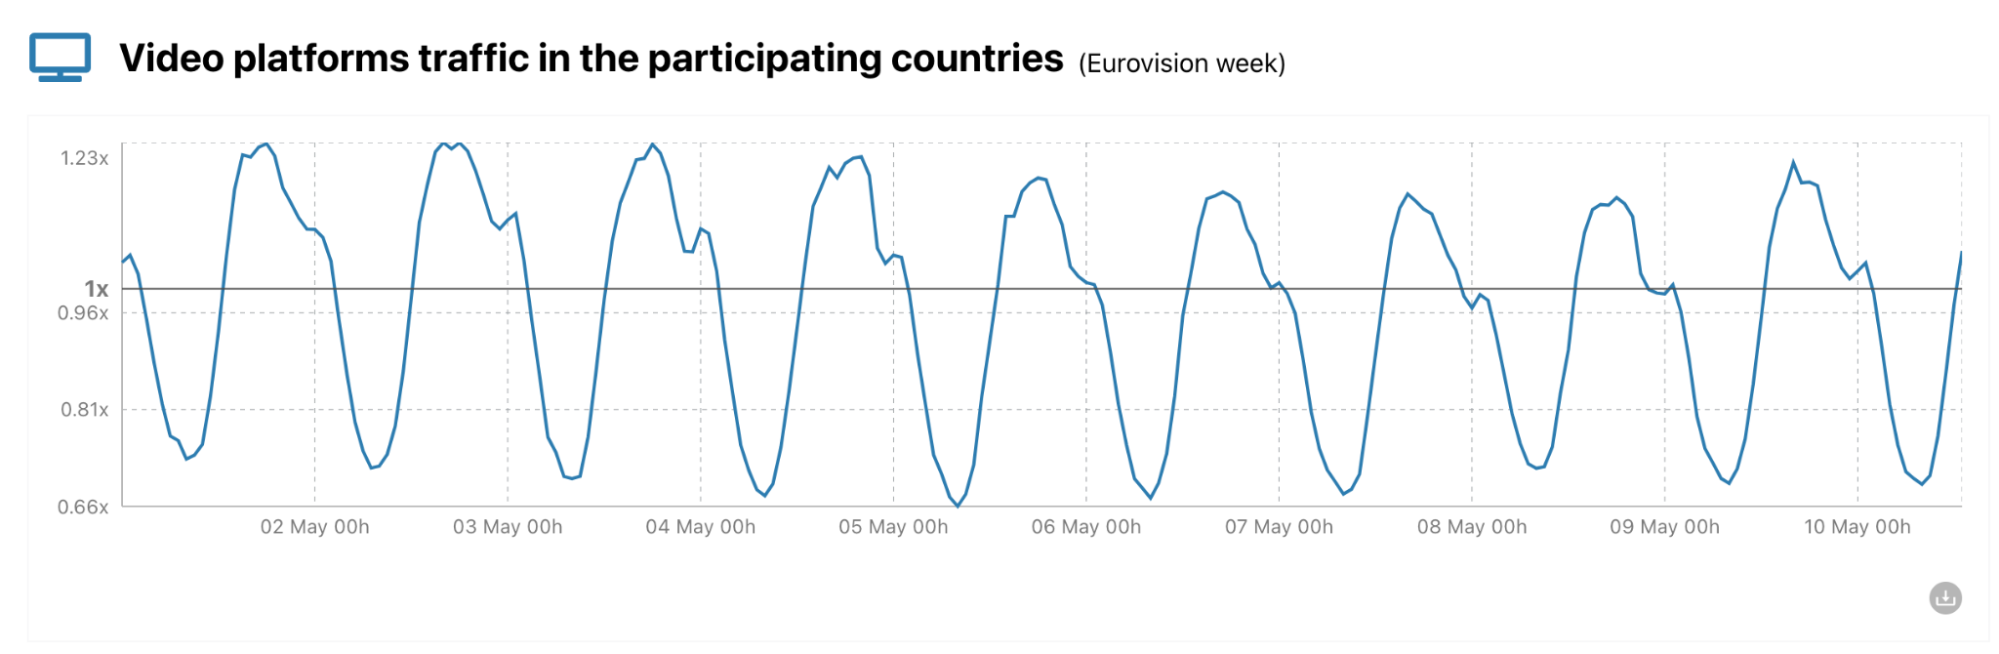
Then, we use DNS name resolution data to estimate traffic from the 40 participating countries to several types of websites. We have a video platforms chart as Eurovision has content on major video platforms. The baseline for the values we use is the average of the previous week, represented in the charts.
We also show social media trends in the participating countries, by hour, to see if the Eurovision semi-finals and final cause a change.
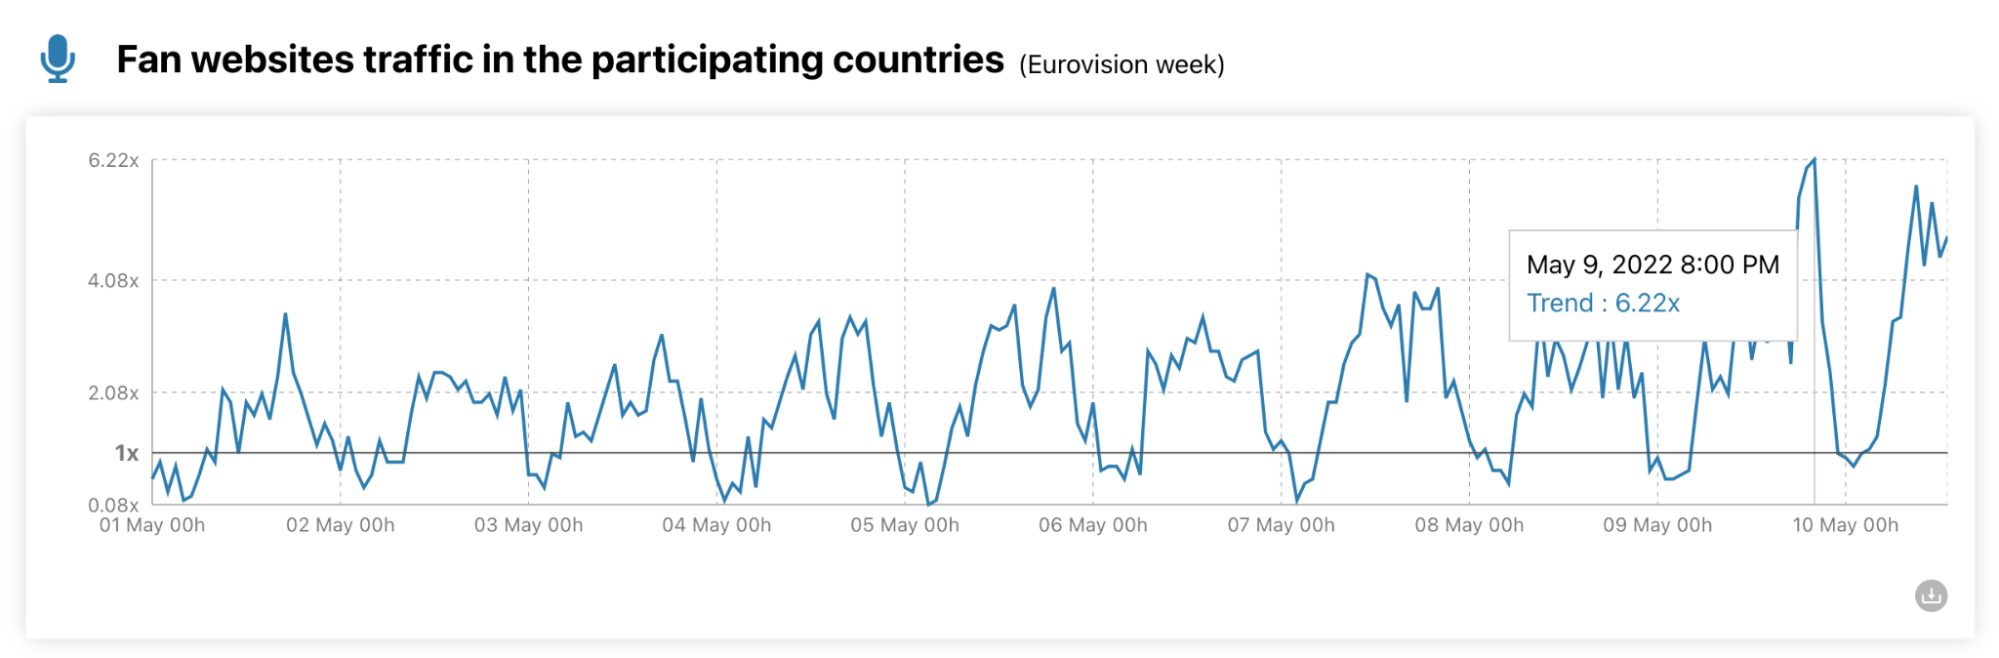
The contest has a large base of fan websites (there’s even the OGAE, General Organisation of Eurovision Fans), and we also have a chart for Eurovision fan sites. In this chart, yesterday at 20:00 CEST, traffic was already at its highest since May 1, with 6.22x more than the average of the previous week (that’s the baseline here).
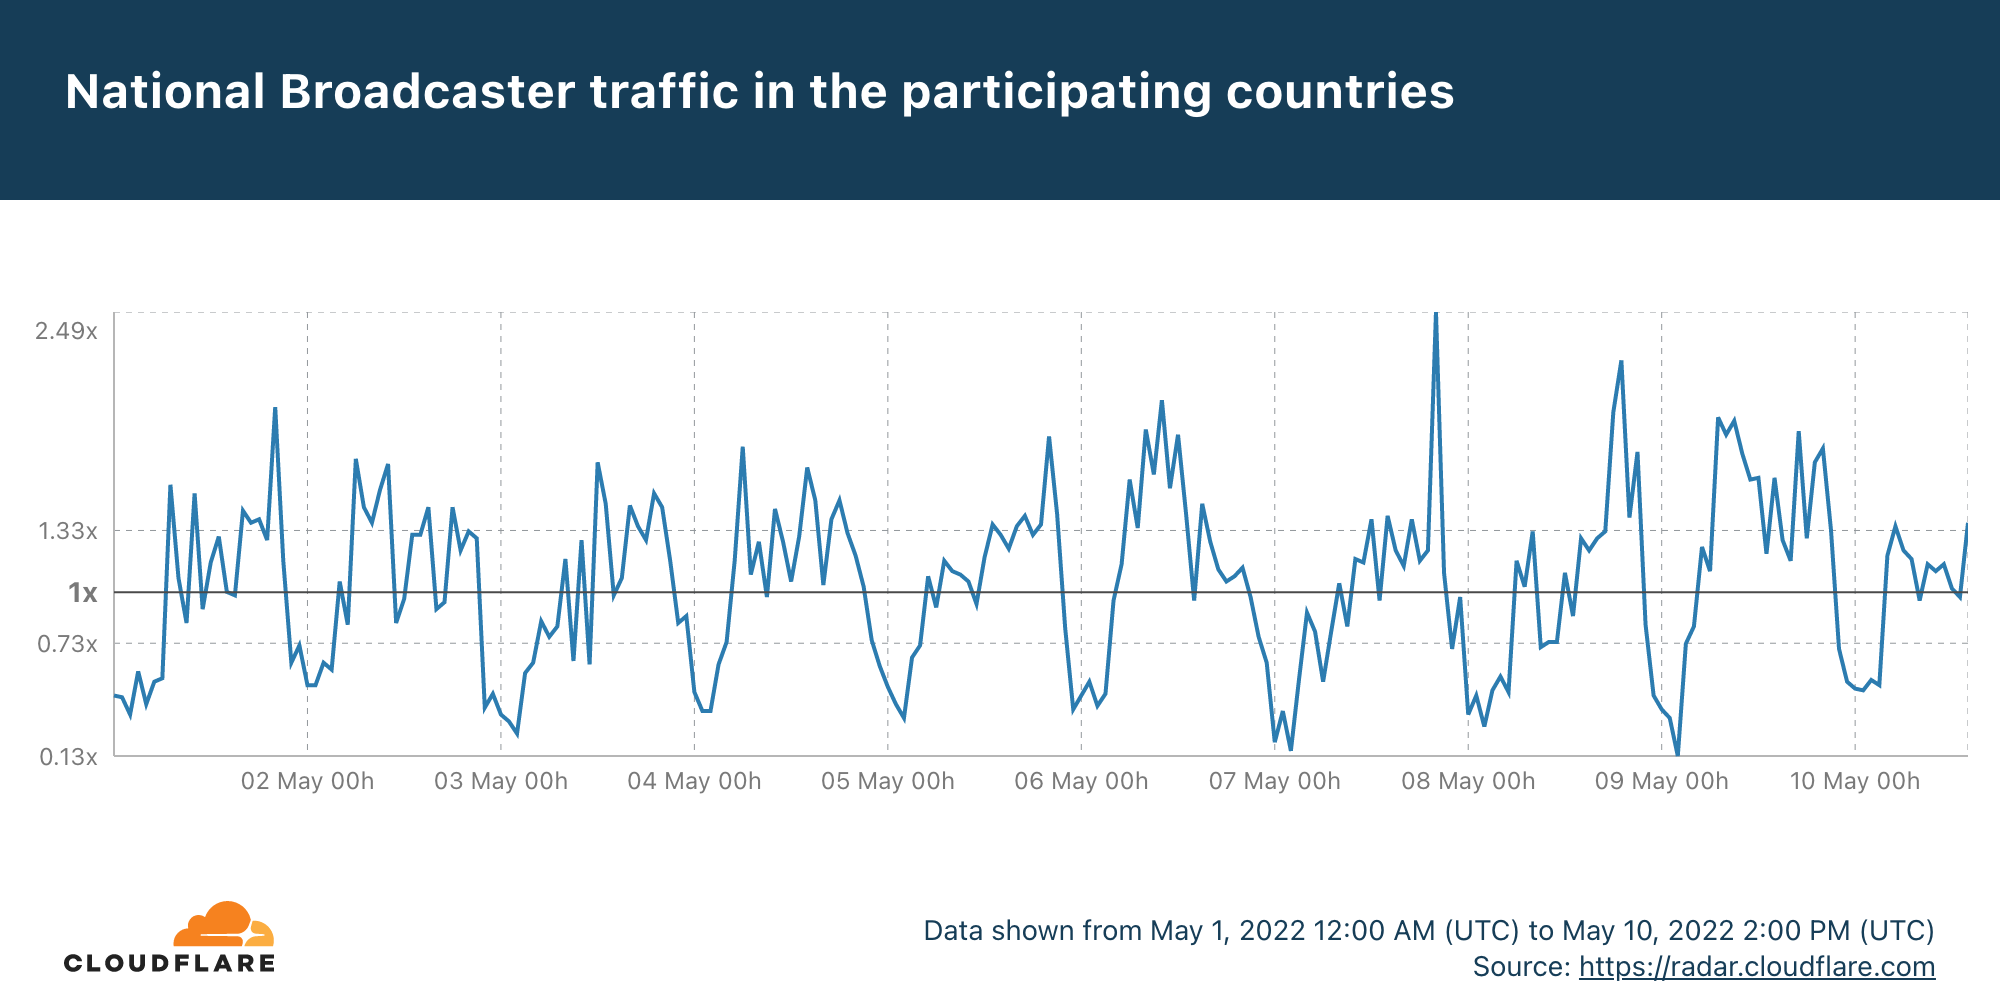
Last, but not least, we also show the impact on national official broadcasters’ websites from the participating countries. For all the charts, there’s a download button to save the image file like this:
For this evening’s first semi-final, Portugal is participating and since we’re writing this blog post from our Lisbon office, I asked everyone’s favorite songs for the 2022 Eurovision edition. Norway’s song from Subwoolfer, Give That Wolf A Banana, was one of the favorites, followed by Portugal’s song from MARO, Saudade, Saudade.
The UK’s song from Sam Ryder, SPACE MAN, is automatically in Saturday’s final and was also praised at the Lisbon office, the same with France’s song from Alvan & Ahez, called Fulenn, where the group sings in their native language, Breton (from the French region of Brittany).
Besides our dedicated Eurovision page, radar.cloudflare.com/eurovision-2022, we will also be checking this week for some trends on Cloudflare Radar’s Twitter account. Let the songs (and the Internet trends) begin.
Post Syndicated from original https://lwn.net/Articles/894378/
The 2022 Linux
Storage, Filesystem, Memory-management and BPF Summit (LSFMM) was the
first chance for Linux memory-management developers to gather in three
years. In a session at the end of the first day led by maintainer Andrew
Morton, those developers discussed the memory-management development
process. While the overall governance will remain the same, there are
nonetheless some significant changes in store for this subsystem.
Post Syndicated from Matt Granger original https://www.youtube.com/watch?v=DJEEK3Ro-70
Post Syndicated from Jeremy Milk original https://www.backblaze.com/blog/data-protection-x2-explore-what-cloud-replication-can-do/
Anyone overwhelmed by their to-do list wishes they could be in two places at once. Backblaze’s newest feature—currently in beta—might not be able to grant that wish, but it will soon offer something similarly useful: The new Cloud Replication feature means data can be in two places at once, solving a whole suite of issues that keep IT teams up at night.
Cloud Replication will enable Backblaze customers to store files in multiple regions, or create multiple copies of files in one region, across the Backblaze Storage Cloud. Simply set replication rules via web UI or API on a bucket. Once the rules are set, any data uploaded to that bucket will automatically be replicated into a destination bucket either in the same region or another region. If it sounds easy, that’s because it is—even the English majors in our Marketing department have mastered this one.
There are three key use cases for Cloud Replication:
This is the top use case for cloud replication, and will likely have value for almost any enterprise with advanced backup strategies.
Whether you are concerned about natural disasters, political instability, or complying with possible government, industry, or board regulations—replicating data to another geographic region can check a lot of boxes easily and efficiently. Especially as enterprises move completely into the cloud, data redundancy will increasingly be a requirement for:
The gold standard for backup strategies has long been a 3-2-1 approach. The core principles of 3-2-1, originally developed for an on-premises world, still hold true, and today they are being applied in even more robust ways to an increasingly cloud-based world. Cloud replication is a natural evolution for organizations that are storing much more or even all of their data in the cloud or plan to in the future. It enables you to implement the core principles of 3-2-1, including redundancy and geographic separation, all in the cloud.
If you have teams, customers, or workflows spread around the world, bringing a copy of your data closer to where work gets done can minimize speed-of-light limitations. Especially for media-heavy teams in game development and postproduction, seconds can make the difference in keeping creative teams operating smoothly. And because you can automate replication and use metadata to track accuracy and process, you can remove some manual steps from the process where errors and data loss tend to crop up.
Version control and smoke testing are nothing new, but when you’re controlling versions of large applications or trying to keep track of what’s live and what’s in testing, you might need a tool with more horsepower and options for customization. Cloud Replication can serve these needs.
You can easily replicate objects between buckets dedicated for production, testing, or staging if you need to use the same data and maintain the same metadata. This allows you to observe best practices and automate replication between environments.
Cloud Replication kicked off in beta in early April and our team and early testers have been breaking in the feature since then.
Here’s how things are lined up:
We’ll open the gates completely on June 7 with full functionality, yeehaw!
Stay in the know about Cloud Replication availability—click here to get notified first.
If you want to dig into how this feature works via the CLI and API and learn about some of the edge cases, special circumstances, billing implications, and lookouts—our draft Cloud Replication documentation can be accessed here. We also have some help articles walking through how to create rules via the web application here.
Otherwise, we look forward to sharing more when this feature is fully baked and ready for consumption.
The post Data Protection x2: Explore What Cloud Replication Can Do appeared first on Backblaze Blog | Cloud Storage & Cloud Backup.
Post Syndicated from Jesse Mack original https://blog.rapid7.com/2022/05/10/whats-changed-for-cybersecurity-in-banking-and-finance-new-study/

Cybersecurity in financial services is a complex picture. Not only has a range of new tech hit the industry in the last 5 years, but compliance requirements introduce another layer of difficulty to the lives of infosec teams in this sector. To add to this picture, the overall cybersecurity landscape has rapidly transformed, with ransomware attacks picking up speed and high-profile vulnerabilities hitting the headlines at an alarming pace.
VMware recently released the 5th annual installment of their Modern Bank Heists report, and the results show a changing landscape for cybersecurity in banking and finance. Here’s a closer look at what CISOs and security leaders in finance said about the security challenges they’re facing — and what they’re doing to solve them.
The stakes for cybersecurity are higher than ever at financial institutions, as threat actors are increasingly using more vicious tactics. Banks have seen an uptick in destructive cyberattacks — those that delete data, damage hard drives, disrupt network connections, or otherwise leave a trail of digital wreckage in their wake.
63% of financial institutions surveyed in the VMware report said they’ve seen an increase in these destructive attacks targeting their organization — that’s 17% more than said the same in last year’s version of the report.
At the same time, finance hasn’t been spared from the rise in ransomware attacks, which have also become increasingly disruptive. Nearly 3 out of 4 respondents to the survey said they’d been hit by at least one ransomware attack. What’s more, 63% of those ended up paying the ransom.
Like ransomware, island hopping is also on the rise — and while that might sound like something to do on a beach vacation, that’s likely the last thing the phrase brings to mind for security pros at today’s financial institutions.
IT Pro describes island hopping attacks as “the process of undermining a company’s cyber defenses by going after its vulnerable partner network, rather than launching a direct attack.” The source points to the high-profile data breach that rocked big-box retailer Target in 2017. Hackers found an entry point to the company’s data not through its own servers, but those of Fazio Mechanical Services, a third-party vendor.
In the years since the Target breach, supply chain cybersecurity has become an even greater area of focus for security pros across industries, thanks to incidents like the SolarWinds breach and large-scale vulnerabilities like Log4Shell that reveal just how many interdependencies are out there. Now, threats in the software supply chain are becoming more apparent by the day.
VMware’s study found that 60% of security leaders in finance have seen an increase in island hopping attacks — 58% more than said the same last year. The uptick in threats originating from partners’ systems is clearly keeping security officers up at night: 87% said they’re concerned about the security posture of the service providers they rely on.
The proliferation of mobile and web applications associated with the rise of financial technology (fintech) may be exacerbating the problem. VMware notes API attacks are one of the primary methods of island hopping — and they found a whopping 94% of financial-industry security leaders have experienced an API attack through a fintech application, while 58% said they’ve seen an increase in application security incidents overall.
With attacks growing more dangerous and more frequent, security leaders in finance are doubling down on their efforts to protect their organizations. The majority of companies surveyed in VMware’s study said they planned a 20% to 30% boost to their cybersecurity budget in 2022. But what types of solutions are they investing in with that added cash?
The number 1 security investment for CISOs this year is extended detection and response (XDR), with 24% listing this as their top priority. Closely following were workload security at 22%, mobile security at 21%, threat intelligence at 15%, and managed detection and response (MDR) at 11%. In addition, 51% said they’re investing in threat hunting to help them stay ahead of the attackers.
Today’s threat landscape has grown difficult to navigate — especially when financial institutions are competing for candidates in a tight cybersecurity talent market. In the meantime, the financial industry has only grown more competitive, and the pace of innovation is at an all-time high. Having powerful, flexible tools that can streamline and automate security processes is essential to keep up with change. For banks and finance organizations to attain the level of visibility they need to innovate while keeping their systems protected, these tools are crucial.
Additional reading:
Post Syndicated from original https://lwn.net/Articles/894544/
The Fedora 36
release is now available. Improvements include GNOME 42, Wayland
support by default on systems with NVIDIA graphics, Podman 4.0,
Ansible 5, the removal of support for legacy ifcfg
configuration files, GCC 12, and more; see the
release notes for details.
Post Syndicated from Kishore Dhamodaran original https://aws.amazon.com/blogs/devops/leverage-devops-guru-for-rds-to-detect-anomalies-and-resolve-operational-issues/
The Relational Database Management System (RDBMS) is a popular choice among organizations running critical applications that supports online transaction processing (OLTP) use-cases. But managing the RDBMS database comes with its own challenges. AWS has made it easier for organizations to operate these databases in the cloud, thereby addressing the undifferentiated heavy lifting with managed databases (Amazon Aurora, Amazon RDS). Although using managed services has freed up engineering from provisioning hardware, database setup, patching, and backups, they still face the challenges that come with running a highly performant database. As applications scale in size and sophistication, it becomes increasingly challenging for customers to detect and resolve relational database performance bottlenecks and other operational issues quickly.
Amazon RDS Performance Insights is a database performance tuning and monitoring feature, that lets you quickly assess your database load and determine when and where to take action. Performance Insights lets non-experts in database administration diagnose performance problems with an easy-to-understand dashboard that visualizes database load. Furthermore, Performance Insights expands on the existing Amazon RDS monitoring features to illustrate database performance and help analyze any issues that affect it. The Performance Insights dashboard also lets you visualize the database load and filter the load by waits, SQL statements, hosts, or users.
On Dec 1st, 2021, we announced Amazon DevOps Guru for RDS, a new capability for Amazon DevOps Guru. It’s a fully-managed machine learning (ML)-powered service that detects operational and performance related issues for Amazon Aurora engines. It uses the data that it collects from Performance Insights, and then automatically detects and alerts customers of application issues, including database problems. When DevOps Guru detects an issue in an RDS database, it publishes an insight in the DevOps Guru dashboard. The insight contains an anomaly for the resource AWS/RDS. If DevOps Guru for RDS is turned on for your instances, then the anomaly contains a detailed analysis of the problem. DevOps Guru for RDS also recommends that you perform an investigation, or it provides a specific corrective action. For example, the recommendation might be to investigate a specific high-load SQL statement or to scale database resources.
In this post, we’ll deep-dive into some of the common issues that you may encounter while running your workloads against Amazon Aurora MySQL-Compatible Edition databases, with simulated performance issues. We’ll also look at how DevOps Guru for RDS can help identify and resolve these issues. Simulating a performance issue is resource intensive, and it will cost you money to run these tests. If you choose the default options that are provided, and clean up your resources using the following clean-up instructions, then it will cost you approximately $15 to run the first test only. If you wish to run all of the tests, then you can choose “all” in the Tests parameter choice. This will cost you approximately $28 to run all three tests.
To follow along with this walkthrough, you must have the following prerequisites:
You will clone the project from GitHub and deploy an AWS CloudFormation template, which will set up the infrastructure required to run the tests. If you choose to use the defaults, then you can run only the first test. If you would like to run all of the tests, then choose the “all” option under Tests parameter.
We simulate some common scenarios that your database might encounter when running enterprise applications. The first test simulates locking issues. The second test simulates the behavior when the AUTOCOMMIT property of the database driver is set to: True. This could result in statement latency. The third test simulates performance issues when an index is missing on a large table.
git clone https://github.com/aws-samples/amazon-devops-guru-rds.git
cd amazon-devops-guru-rds

aws cloudformation create-stack --stack-name DevOpsGuru-Stack \
    --template-body file://DevOpsGuruMySQL.yaml \
    --capabilities CAPABILITY_IAM \
    --parameters ParameterKey=Tests,ParameterValue=one \
ParameterKey=EnableDevOpsGuru,ParameterValue=y
If you wish to run all four of the tests, then flip the ParameterValue of the Tests ParameterKey to “all”.
If Amazon DevOps Guru is already enabled in your account, then change the ParameterValue of the EnableDevOpsGuru ParameterKey to “n”.
It may take up to 30 minutes for CloudFormation to provision the necessary resources. Visit the CloudFormation console (make sure to choose the region where you have deployed your resources), and make sure that DevOpsGuru-Stack is in the CREATE_COMPLETE state before proceeding to the next step.
DevOpsGuruMySQLInstance followed by Open IDE. This opens a cloud-based IDE environment where you will be running your tests. Note that in this setup, AWS Cloud9 inherits the credentials that you used to deploy the CloudFormation template.
git clone https://github.com/aws-samples/amazon-devops-guru-rds.git
cd amazon-devops-guru-rds/scripts
sh setup.sh
# NOTE: If you are running all test cases, use sh setup.sh all command instead.
source ~/.bashrcsource ./connect.sh test 1
USE devopsgurusource;
CREATE TABLE IF NOT EXISTS test1 (id int, filler char(255), timer timestamp);
exit;
python3 ct.pyIf you chose to run all test cases, and you ran the sh setup.sh all command in Step 4, open two new terminal windows and run the following commands to insert random data for test cases 2 and 3.
# Test case 2 – Open a new terminal window to run the commands
cd amazon-devops-guru-rds/scripts
source ./connect.sh test 2
USE devopsgurusource;
CREATE TABLE IF NOT EXISTS test1 (id int, filler char(255), timer timestamp);
exit;
python3 ct.py
# Test case 3 - Open a new terminal window to run the commands
cd amazon-devops-guru-rds/scripts
source ./connect.sh test 3
USE devopsgurusource;
CREATE TABLE IF NOT EXISTS test1 (id int, filler char(255), timer timestamp);
exit;
python3 ct.pysource ./connect.sh test 1
CREATE UNIQUE INDEX test1_pk ON test1(id);
INSERT INTO test1 VALUES (-1, 'locker', current_timestamp);
exit;sh setup.sh all command in Step 4, add an index to the second database. NOTE: Do no add an index to the third database.source ./connect.sh test 2
CREATE UNIQUE INDEX test1_pk ON test1(id);
INSERT INTO test1 VALUES (-1, 'locker', current_timestamp);
exit;DevOps Guru for RDS uses Performance Insights, and it establishes a baseline for the database metrics. Baselining involves analyzing the database performance metrics over a period of time to establish a “normal” behavior. DevOps Guru for RDS then uses ML to detect anomalies against the established baseline. If your workload pattern changes, then DevOps Guru for RDS establishes a new baseline that it uses to detect anomalies against the new “normal”. For new database instances, DevOps Guru for RDS takes up to two days to establish an initial baseline, as it requires an analysis of the database usage patterns and establishing what is considered a normal behavior.
In this scenario, multiple sessions compete for the same (“locked”) record, and they must wait for each other.
In real life, this often happens when:
Here’s how you can reproduce it:
cd amazon-devops-guru-rds/scripts
source ./connect.sh test 1START TRANSACTION;
UPDATE test1 SET timer=current_timestamp WHERE id=-1;
-- Do NOT exit!cd amazon-devops-guru-rds/scripts
source ./connect.sh test 1
exit;
python3 locking_scenario.py 1 1200 2


In this example, DevOps Guru for RDS has detected a high and unusual spike of database load, and then marked it as “performance anomaly”.
Note that the relative size of the anomaly is significant: 490 times higher than the “typical” database load, which is why it’s deemed: “HIGH severity”.
In the analysis section, note that a single “wait event”, wait/synch/mutex/innodb/aurora_lock_thread_slot_futex, is dominating the entire spike. Moreover, a single SQL is “responsible” (or more precisely: “suffering”) from this wait event at the time of the problem. Select the wait event name and see a simple explanation of what’s happening in the database. For example, it’s “record locking”, where multiple sessions are competing for the same database records. Additionally, you can select the SQL hash and see the exact text of the SQL that’s responsible for the issue.
If you’re interested in why DevOps Guru for RDS detected this problem, and why these particular wait events and an SQL were selected, the Why is this a problem? and Why do we recommend this? links will provide the answer.
Finally, the most relevant part of this analysis is a View troubleshooting doc link. It references a document that contains a detailed explanation of the likely causes for this problem, as well as the actions that you can take to troubleshoot and address it.
In this scenario, we must run multiple batch updates, and we’re using a fairly popular driver setting: AUTOCOMMIT: ON.
This setting can sometimes lead to performance issues as it causes each UPDATE statement in a batch to be “encased” in its own “transaction”. This leads to data changes being frequently synchronized to disk, thus dramatically increasing batch latency.
Here’s how you can reproduce the scenario:
cd amazon-devops-guru-rds/scripts
source ./connect.sh test 2
exit;
python3 batch_autocommit.py 50 1200 1000 10000000

Note that DevOps Guru for RDS detected a significant (and unusual) spike of database load and marked it as a HIGH severity anomaly.
The spike looks similar to the previous example (albeit, “smaller”), but it describes a different database problem (“COMMIT slowdowns”). This is because of a different database wait event that dominates the spike: wait/io/aurora_redo_log_flush.
As in the previous example, you can select the wait event name to see a simple description of what’s going on, and you can select the SQL hash to see the actual statement that is slow. Furthermore, just as before, the View troubleshooting doc link references the document that describes what you can do to troubleshoot the problem further and address it.
Have you ever wondered what would happen if you drop a frequently accessed index on a large table?
In this relatively simple scenario, we’re testing exactly that – an index gets dropped causing queries to switch from fast index lookups to slow full table scans, thus dramatically increasing latency and resource use.
Here’s how you can reproduce this problem and see it for yourself:
cd amazon-devops-guru-rds/scripts
source ./connect.sh test 3
exit;
python3 no_index.py 50 1200 1000 10000000
As with the previous examples, DevOps Guru for RDS detected a high and unusual spike of database load (in this case, ~ 50 times larger than the “typical” database load). It also identified that a single wait event, wait/io/table/sql/handler, and a single SQL, are responsible for this issue.
The analysis highlights the SQL that you must pay attention to, and it links a detailed troubleshooting document that lists the likely causes and recommended actions for the problems that you see. While it doesn’t tell you that the “missing index” is the real root cause of the issue (this is planned in future versions), it does offer many relevant details that can help you come to that conclusion yourself.
On your terminal where you originally ran the AWS Command Line Interface (AWS CLI) command to create the CloudFormation resources, run the following command:
aws cloudformation delete-stack --stack-name DevOpsGuru-Stack
In this post, you learned how to leverage DevOps Guru for RDS to alert you of any operational issues with recommendations. You simulated some of the commonly encountered, real-world production issues, such as locking contentions, AUTOCOMMIT, and missing indexes. Moreover, you saw how DevOps Guru for RDS helped you detect and resolve these issues. Try this out, and let us know how DevOps Guru for RDS was able to address your use-case.
Authors:
Post Syndicated from The Atlantic original https://www.youtube.com/watch?v=Yf77zgSdzkE
Post Syndicated from original https://lwn.net/Articles/894374/
Like much of the kernel, the memory-management subsystem is under-documented,
and much of the documentation that does exist is less than fully current.
At the 2022 Linux
Storage, Filesystem, Memory-management and BPF Summit (LSFMM), Mike
Rapoport ran a session on memory-management documentation and what can be
done to improve it. The result was a reinvigorated interest in
documentation, but only time will tell what actual improvements will come
from that interest.
Post Syndicated from Rita Kozlov original https://blog.cloudflare.com/workers-for-platforms/
As a business, whether a startup or Fortune 500 company, your number one priority is to make your customers happy and successful with your product. To your customers, however, success and happiness sometimes seems to be just one feature away.
“If only you could customize X, we’ll be able to use your product” – the largest prospect in your pipeline. “If you just let us do Y, we’ll expand our usage of your product by 10x” – your most strategic existing customer.
You want your product to be everything to everybody, but engineering can only keep up so quickly, so, what gives?
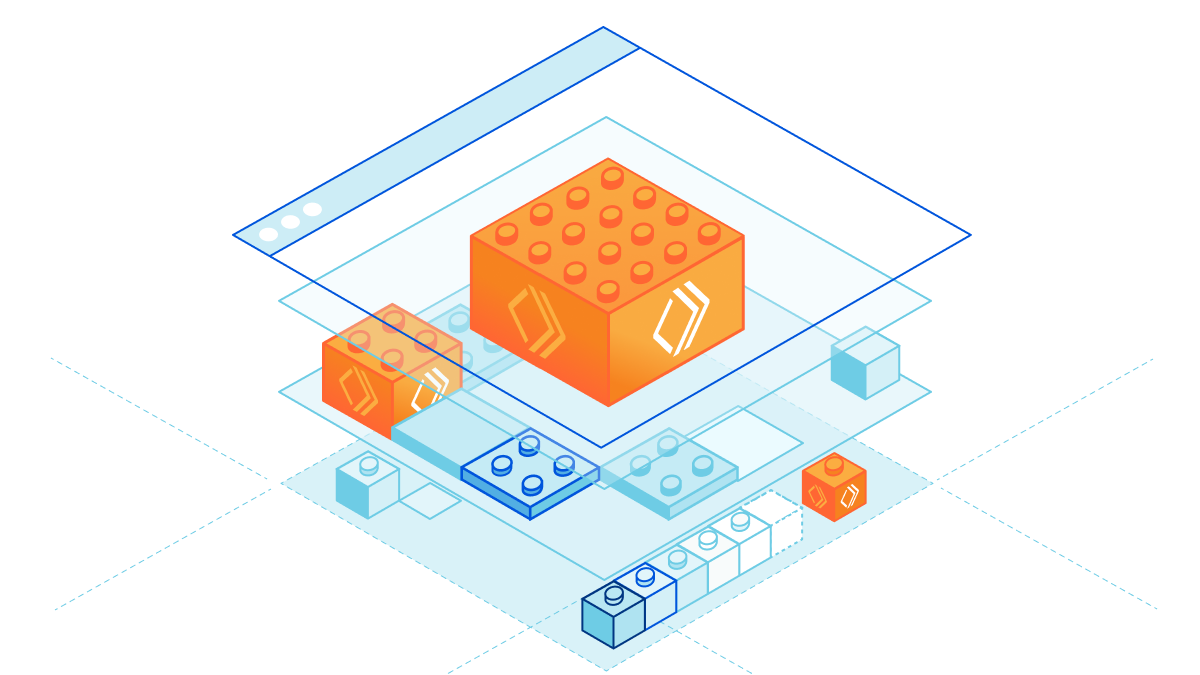
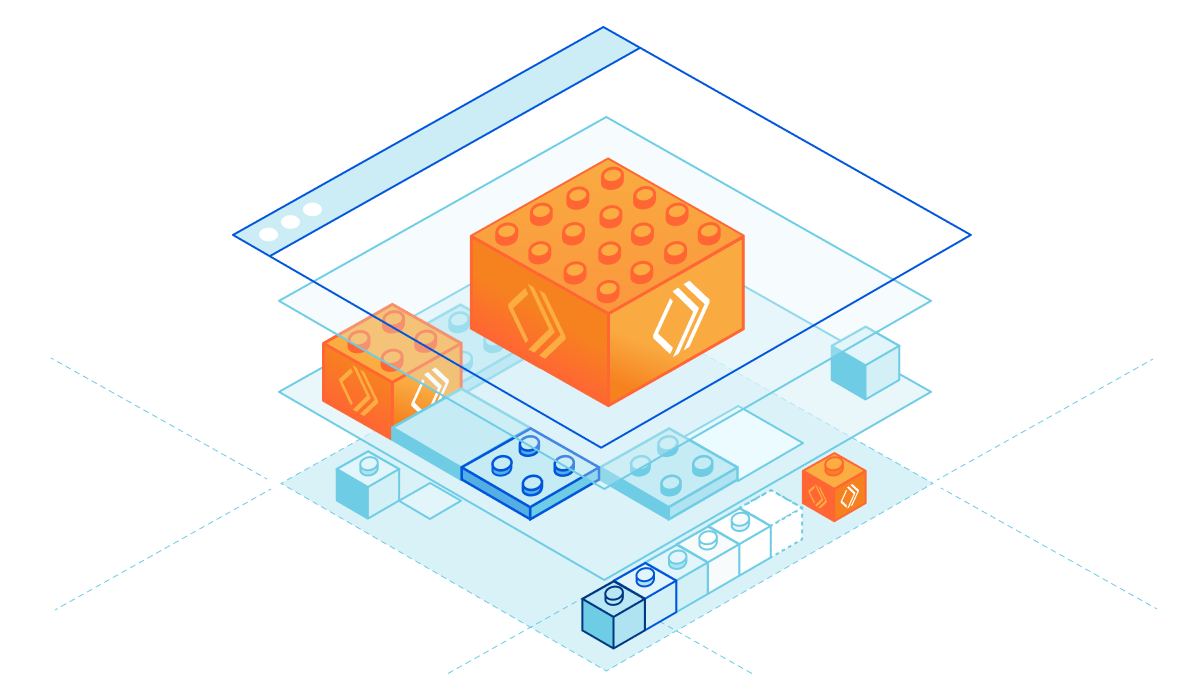
Today, we’re announcing Workers for Platforms, our tool suite to help make any product programmable, and help our customers deliver value to their customers and developers instantaneously.
One way to give your customers the ability to programmatically interact with your product is by providing them with APIs. That is a big part of why APIs are so prolific today — enabling code (whether your own, or that of a 3rd party) to engage with your applications is nothing short of revolutionary.
But there’s still a problem. While APIs can give developers the ability to interact with your application programmatically, developers are ultimately always limited by the abstractions exposed to them by the API. You, an application owner, have to have predicted how the customer would use your product, and then built out the API to support the use case. If there’s one thing I have learned as a product manager, it’s almost impossible to predict how customers will use a product. And if there’s a second thing I’ve learned, it’s that even with plentiful engineering resources, it’s also almost impossible to build all the functionality required to keep said customers happy.
There is another way, however.
Functions, in contrast to APIs, provide the lowest level primitives (rather than abstractions on top of them). This lets the developer define the right behavior from there — and they can even define their own APIs on top.
In this sense, functions and APIs are actually complementary to each other — you may even choose to call another API directly from your function. For example, if you’re handling an event in a messaging system, you could implement your own feature to send an email by calling an email API, or create a ticket in your ticketing system, etc.
This gets at why we’re so excited about Workers for Platforms: it enables you to expose a direct way for your customers’ developers to bring their own logic to any application. We think it’s going to unlock a wave of customer-led innovation on top of companies that adopt it, and has the potential to be as impactful to building applications on the web as the API has been.
While Workers for Platforms expose a more powerful paradigm for making product programmable, they also result in a better experience for you as a developer.
Today, as a developer, before you can even get started using APIs or webhooks, there’s a list of tedious tasks you have to deal with first. First, you have to set up somewhere to host your code, whether a server (or serverless function), and expose it via an external endpoint to be able. You have to deal with ops, custom tokens, figuring out the new authentication schema, all before you get started. Then you have to maintain that service, and make sure that it stays up to ensure that events are always processed properly.
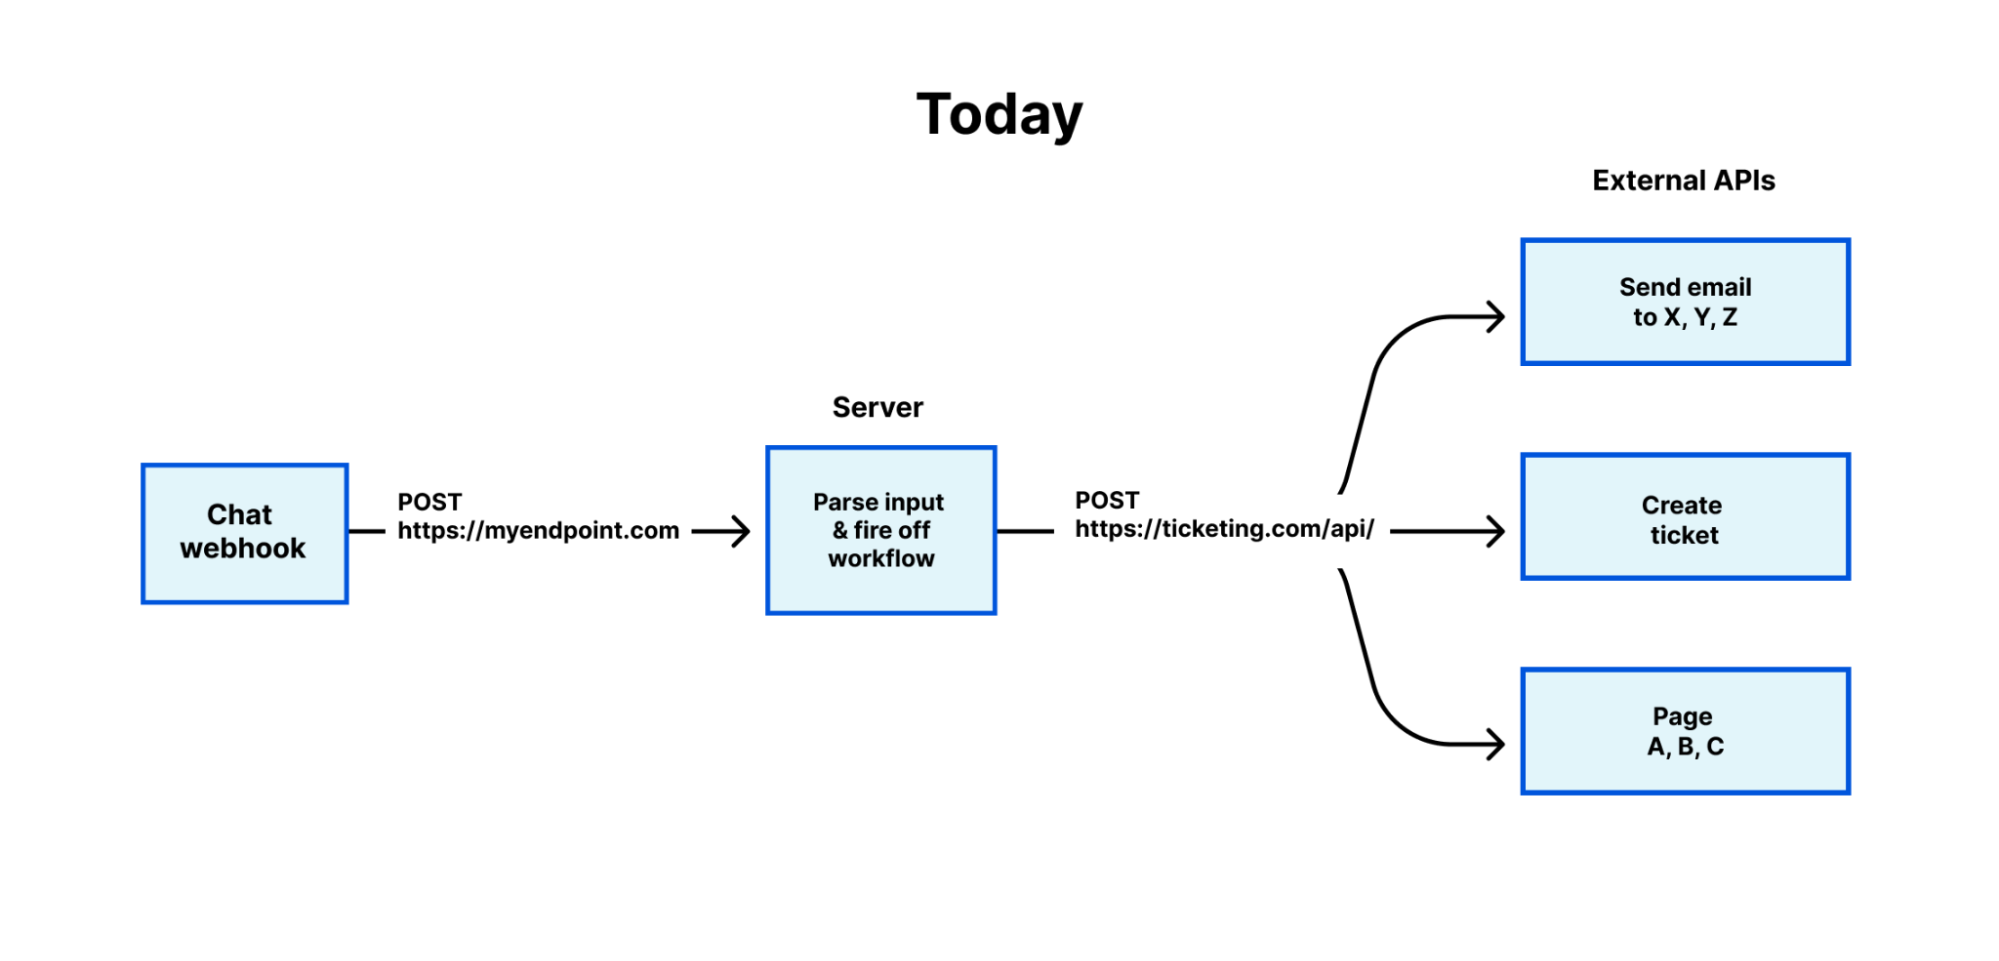
With functions embedded directly into the products you’re using, you can just start writing the code.
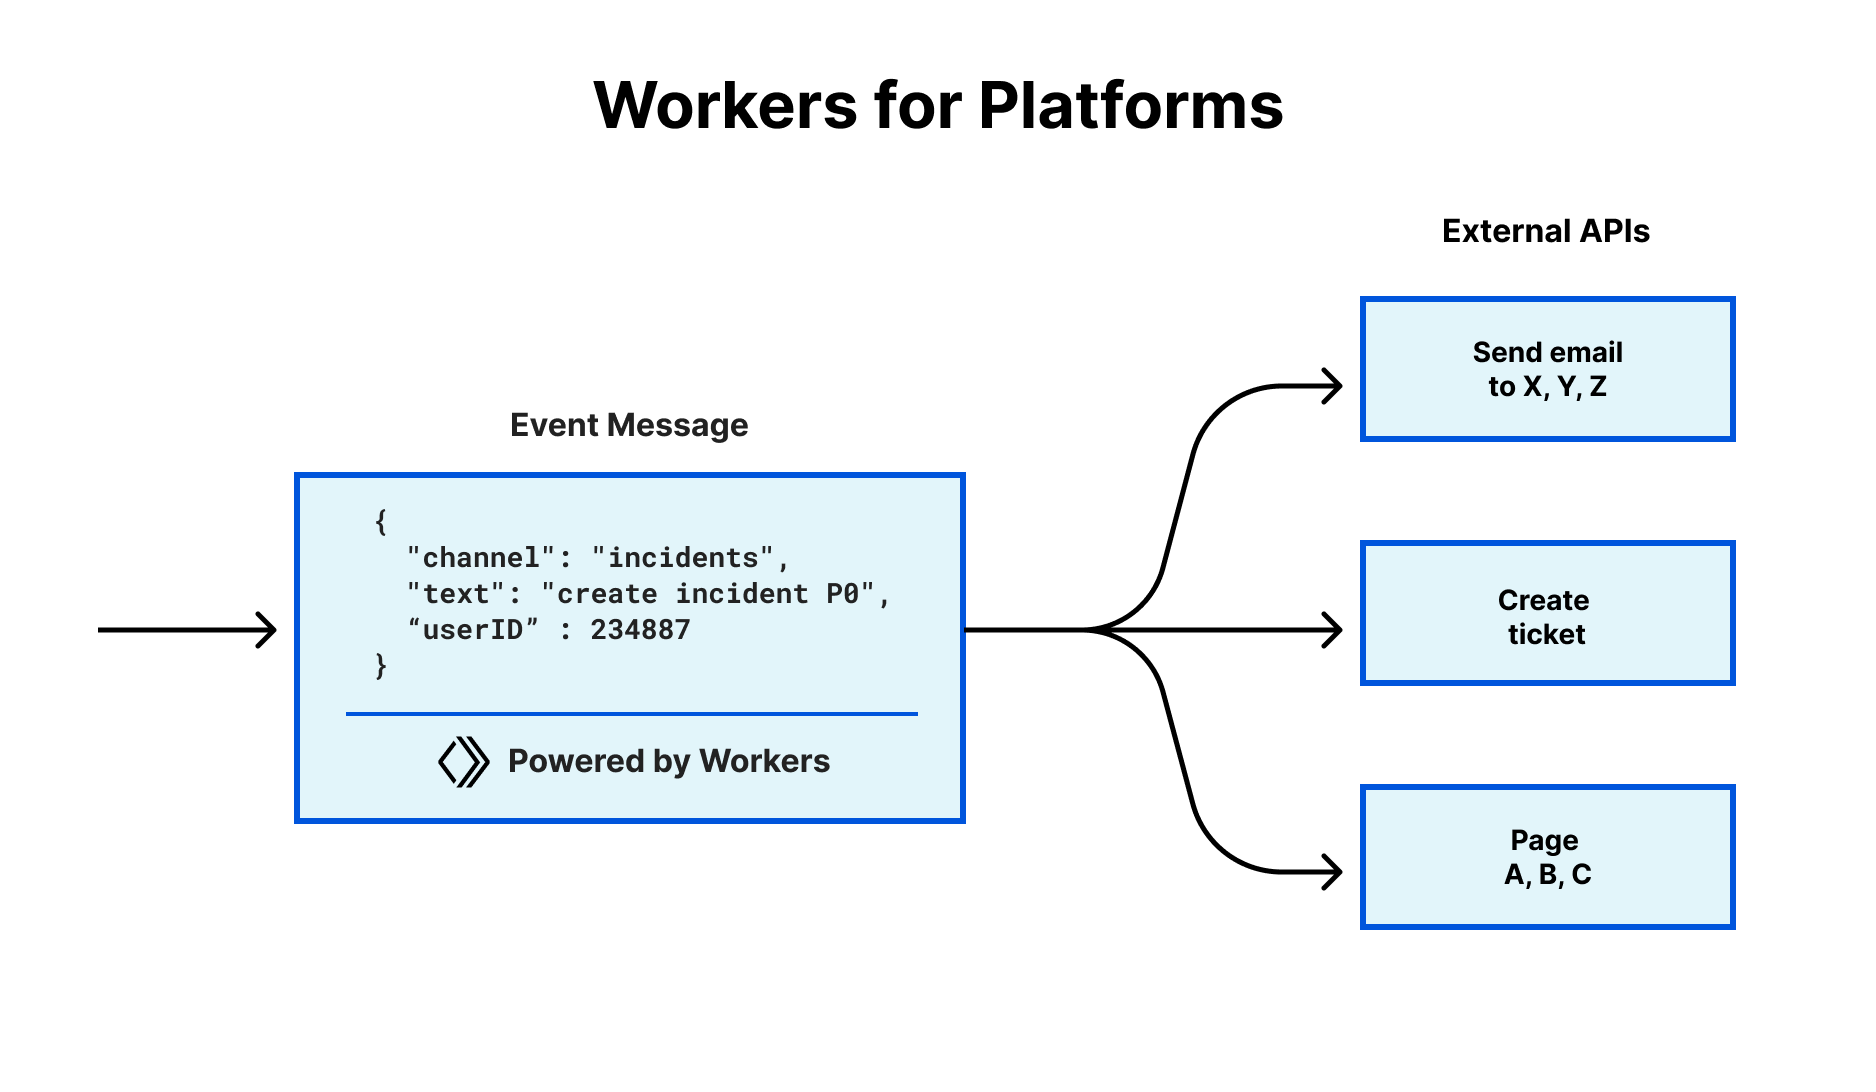
Allowing developers to program how events work seems obvious, but just because it’s obvious doesn’t mean it’s easy.
At Cloudflare, we encountered this very problem five years ago — we were onboarding larger and larger customers onto our network, each needing to dictate the fate of a request in their own way. While Page Rules offered a way to modify behavior by URL, customers wanted to control behavior based on cookie, header, geolocation, and more!
We realized our engineering team couldn’t keep up with every request, so we decided to allow customers to bend our product to their own needs.
As we looked for an approach to this problem, we looked for a solution that would meet the two following requirements:
While these requirements are especially critical when you offer performance and security products, solving these challenges is critical when giving your customers the ability to program your product. If the function needs to run on the critical path to your user, introducing latency is equally unacceptable. And of course, no one wants to get breached just to have their users be able to program.
Creating a really fast and secure multi-tenant environment is no easy feat.
When we evaluated our options for solving this problem, we first turned to technologies that existed for solving this problem on the server — serverless functions already existed at time, but were powered by containers, which would introduce cold-start, which was, well, a non-starter. So we turned to the browser, or specifically Chrome, which was powered by V8, and decided to take the same approach, and run it on our servers.
And while the approach sounds simple (and perhaps in retrospect obvious, as these things tend to seem), running a large multi-tenant development platform at scale is no small effort. If a part of the purpose of allowing customers to program your offering is to free up engineering efforts to focus on building new features, the effort it takes to maintain and scale such a development platform may defeat the purpose.
What we realized recently was that we weren’t alone in trying to solve this problem.
Companies like Shopify, building their next generation programmable storefront, Oxygen, were trying to solve the same thing. They wanted to enable their customers to run custom storefronts, and be able to offer the best performance possible, while maintaining a secure, multi-tenant environment.
“Shopify is the Internet’s commerce infrastructure, with millions of merchants using the platform,” said Zach Koch, product director, custom storefronts, at Shopify. “Partnering with Cloudflare, we’re able to give developers the tools they need to build unique and performant storefronts. We are excited to work with Cloudflare to alleviate some complexities of building commerce experiences – like scalability and global availability – so that developers can instead focus on what makes their brand distinct.”
Working with platforms like Shopify to help them address their developers’ needs, helped us realize another thing — developer experience is not one-size-fits-all. That is, while we’re building our platform for a broad set of developers, eCommerce developers might have a much more specialized set of needs, best solved by a tailored developer experience. And, while the underlying technology is the same, making platforms their experiences using the same high level concepts as our direct customers need doesn’t make sense.
Since no one knows your customers better than you, we want you, the platform provider, to design the best experience for your users. Workers for Platforms exposes a new set of tools and APIs to integrate directly into the deployment flow you want to design (see what we did there?).
Using our APIs, whenever a developer wants to deploy a script on your platform, you can call our APIs to deploy a new Worker in the background. Unlike our traditional Workers offering, Workers for Platforms is designed to be used at scale, to manage hundreds of thousands to millions of Cloudflare Workers.
Depending on how you manage your deployment services, or users, we now also provide the option to use tags to manage groupings of scripts. For example, if a user deletes their account, and you would like to make sure all their Workers are cleaned up. With tags, you can now add any arbitrary tags (such as user ID) per script, to enable bulk actions.
Where there’s smoke, there’s fire, and where there’s code, well, bugs are also bound to be. When giving developers the tools to write and deploy code, you must also give them the means to debug it.
Trace Workers allow you to collect any information about a request that was handled by a Worker, including any logs or exceptions, and pass them onto your customer. A Trace Worker is a Worker that will receive information about the execution of other Workers, and can forward it to a destination of your choosing, enabling use cases such as live logging or long term storage.
Here is a simple trace Worker that sends its trace data to an HTTP endpoint:
addEventListener("trace", event => {
  event.waitUntil(fetch("http://example.com/trace", {
    method: "POST",
    body: JSON.stringify(event.traces),
  }))
})
Here is an example of what the data in event.traces might look like:
[
  {
    "scriptName": "Example script",
    "outcome": "exception",
    "eventTimestamp": 1587058642005,
    "event": {
      "request": {
        "url": "https://example.com/some/requested/url",
        "method": "GET",
        "headers": [
          "cf-ray": "57d55f210d7b95f3",
          "x-custom-header-name": "my-header-value"
        ],
        "cf": {
          "colo": "SJC"
        }
      },
    },
    "logs": [
      {
        "message": ["string passed to console.log()"],
        "level": "log",
        "timestamp": 1587058642005
      }
    ],
    "exceptions": [
      {
        "name": "Error",
        "message": "Threw a sample exception",
        "timestamp": 1587058642005
      }
    ]
  }
]
From working with a few of our early customers, another need we were hearing about often was the ability to run your own code, before running your customer’s code. Perhaps you want to run a layer of authentication, sanitize input or output, or even provide useful information downstream (like user or account IDs).
For this you may want to maintain your own Worker. However, when it’s done executing, you want to be able to call the next Worker, with your customer’s code.
Example:
let user_worker = dispatcher.get('customer-worker-123');
let response = await user_worker.fetch(request);
The features above are only the new Workers features we enabled for our customers as of this week, but our goal is to provide all the tools you need to build your platform. For example, you can use Workers for Platforms with Cloudflare for SaaS to create custom domains. (And stay tuned for the “and more!”).
As is the case with any new product we release, we have no doubt we have so much to learn from our customers and their use cases. Since we want to support you, and make sure you’re set up for success, if you’re interested, we’d love to get to know you and your use case, and get you set up with all the tools you need. To get started, we ask that you fill out our form, and we’ll get in touch with you.
In the meantime, you’re welcome to get started checking out our developer docs, or saying hi in our Discord.
We faced this problem ourselves five years ago — we needed to give our customers the ability to augment our offering in a way that worked for them, so we did just that when we launched Cloudflare Workers. Allowing our customers to program our global network to meet their needs has enabled us to support more customers on our development platform, while enabling our engineering team to focus on turning the most requested customizations into features.
We look forward to seeing both what your developers build on your platform (and we believe you, yourself will be surprised with the use cases developers come up with that you could never dream up yourself), and what your engineering team is able to tackle in parallel!
Post Syndicated from Kabir Sikand original https://blog.cloudflare.com/service-bindings-ga/
Today, we’re happy to unveil a new way to communicate between your Workers. In the spirit of baking more and more flexibility into our Developer Platform, our team has been hard at work building a new API to facilitate Worker to Worker communication: Service Bindings. Service Bindings allow your Workers to send requests to other Workers Services, from your code, without those requests going over the Internet. It opens up a world of composability that was previously closed off by a difficult interface, and makes it a lot easier for you to build complex applications on our developer platform.
Service Bindings allow teams to segment application logic across multiple Workers. By segmenting your logic, your teams can now build with more confidence by only deploying narrowly scoped changes to your applications, instead of recommitting the whole application every time. Service Bindings give developers both composability and confidence. We’ve seen some excellent uses so far, and today we’ll go through one of the more common examples. Alongside this functionality, we’ll show you how Cloudflare’s cost efficiency will save you money.
Service Bindings allow you to easily expand the number of services running on a single request. Developers can now create a pipeline of Workers that call one another and create a complex series of compute blocks. The ability to separate and compose application logic together has opened Cloudflare Workers up to even more uses.
With Service Bindings, one of our customers has moved multiple services off of their legacy infrastructure by creating a gateway Worker that serves as the entry point of a request. This gateway Worker handles decision-making about request routing and quickly shifts requests to appropriate services – be it on their legacy application servers or their newly created Workers. This project enabled several new teams to onboard as a result, each managing their Worker independently. Large teams need a development ecosystem that allows for granular deployments, minimizing the scope of impact when a bad push to production occurs.
Let’s walk through a simple example of an API gateway Worker that handles routing and user authentication. We’ll build an application that takes in a user request and checks for authorization. If the user isn’t authorized, we block the request. If the user has valid credentials, we’ll fetch the user data. The application will also implement login and logout to change the user authentication state.
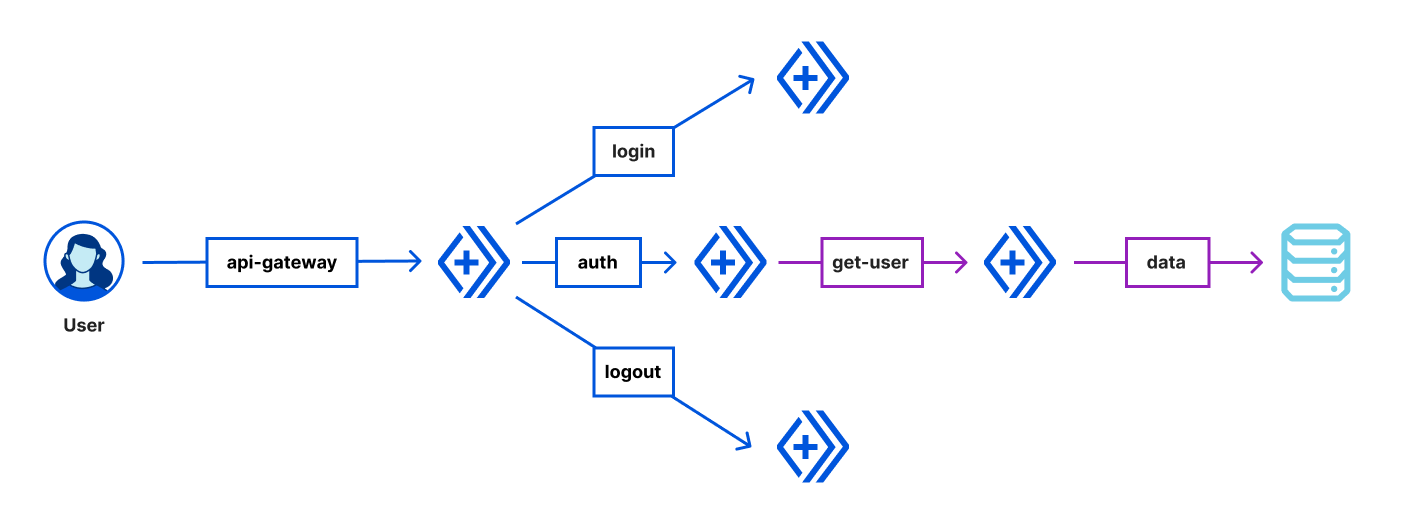
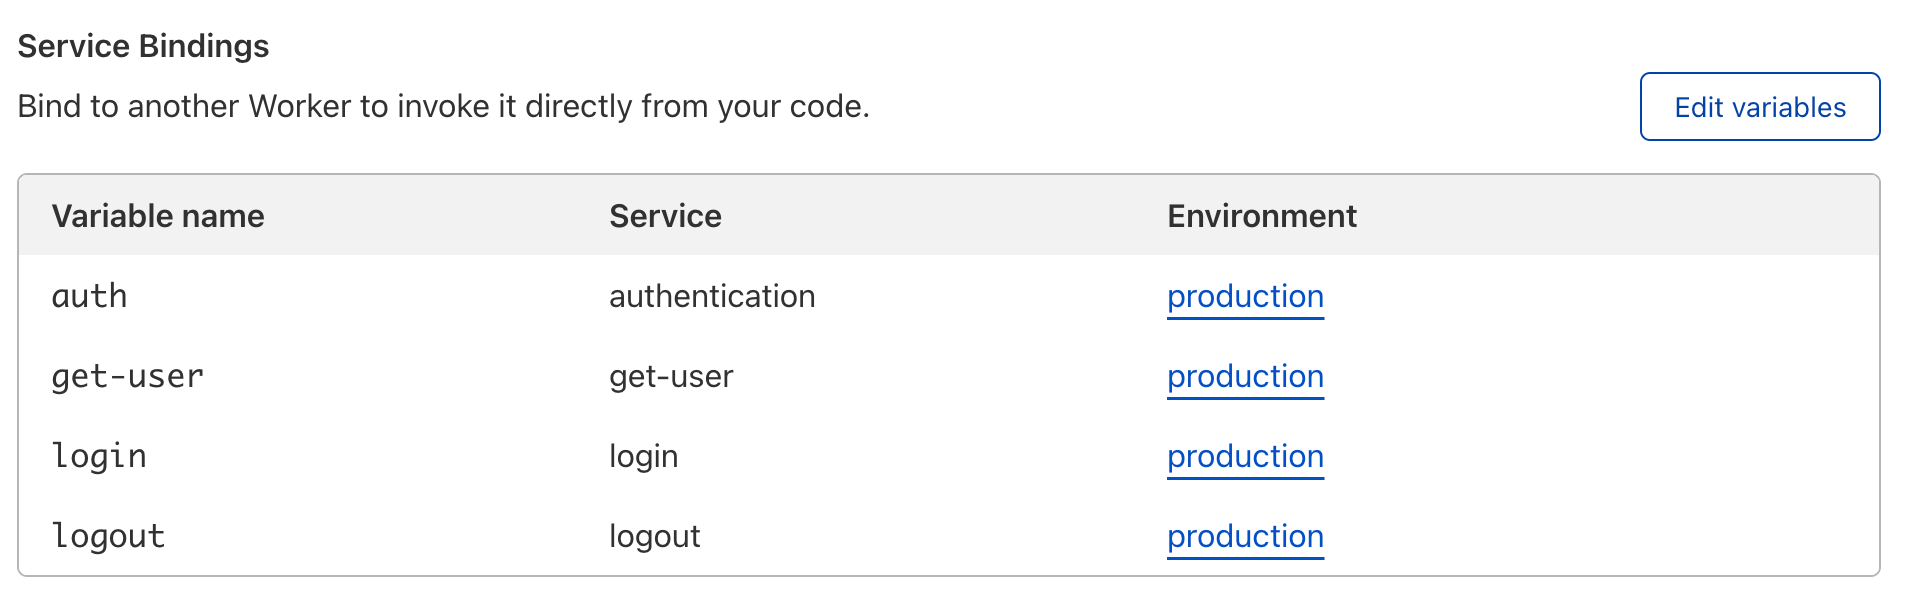
Here, the api-gateway Worker calls login and logout Workers for authentication to privileged endpoints like /getuser. The api-gateway Worker also checks each request for authorization via the auth Worker and allows valid requests to call the get-user Worker. The get-user Worker then makes an outbound network request to gather the required user information, and passes that data back to the client via our api-gateway Worker. The api-gateway Worker is therefore bound to four other Worker Services: auth, get-user, login, and logout.
Let’s take a look at the code for the api-gateway Worker. We’ll see the routes /login, /logout, and /getuser are implemented on this API. For the /getuser route, the api-gateway Worker requires authorization via the auth Worker. Requests to any other endpoints will return a 404 HTTP status code.
export default {
 async fetch(request, environment) {
   const url = new URL(request.url);
   switch (url.pathname) {
     case '/login':
       return await environment.login.fetch(request);

     case '/logout':
       return await environment.logout.fetch(request);

     case '/getuser': {
       // Check that the "Authorization" header is sent when authenticated.
       const authCheck = await environment.auth.fetch(request.clone());
       if (authCheck.status != 200) { return authCheck }
       // If the auth check passes, send the request to the /admin endpoint
       return await environment.getuser.fetch(request);
     }
   }
   return new Response('Not Found.', { status: 404 });
 }
}
The code really is that simple. The separation of concerns allows your teams to work independently of each other, relying on each service to do what it is supposed to do in production. It allows you to separate your code by use case, developing, testing, and debugging more effectively.
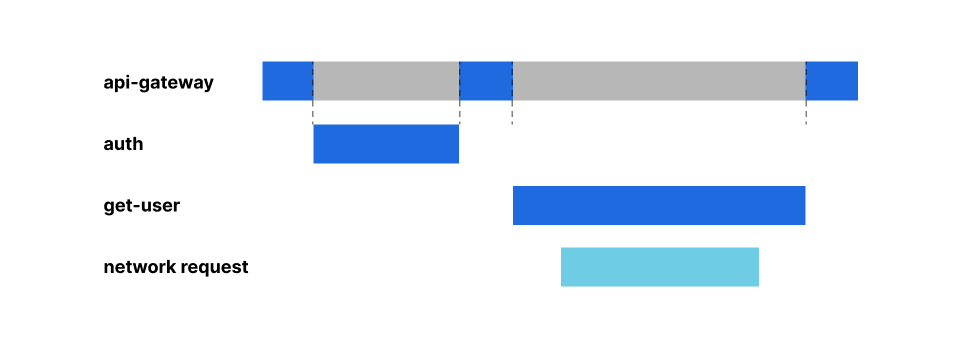
But your next question might be, what am I charged for? Before we get into price, let’s first talk about where the compute execution is happening using our example above. A request to /getuser may look something like this, when looking across the request’s lifecycle:
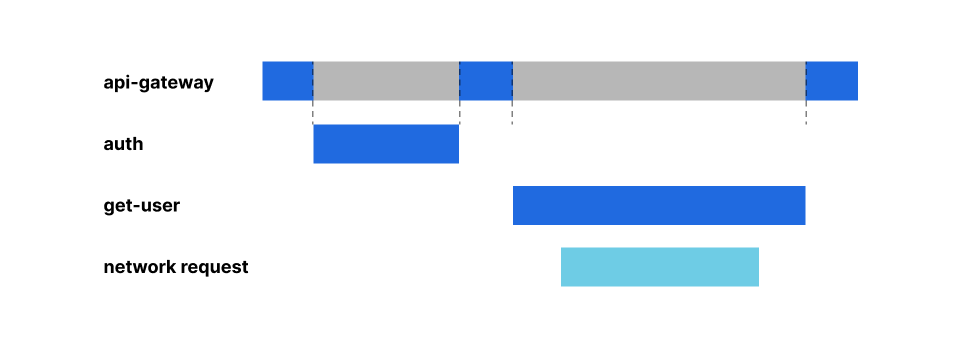
The get-user Worker makes a network call to gather user information while the auth Worker executes entirely within the Workers runtime. Now that we understand what a single execution looks like, let’s talk about cost efficiency.
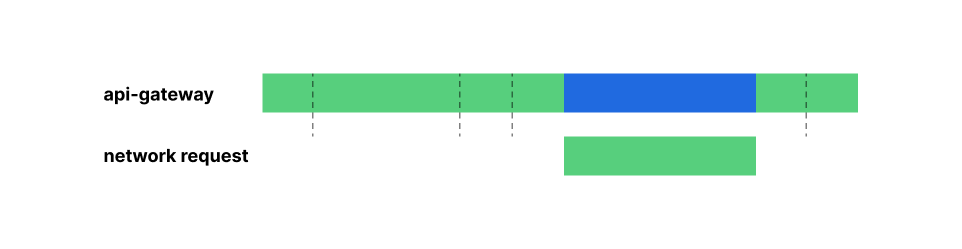
Service Bindings are available for you to use starting today. They cost the same as any normal Worker; each invocation is charged as if it’s a request from the Internet – with one major and important difference. We’re removing the concept of “idle resources” across Workers. You will be charged a single billable duration across all Workers triggered by a single incoming request. This is possible because Cloudflare can share compute resources used by each request across your Workers and pass the resulting cost savings on to our customers.
Revisiting our example above, the api-gateway Worker may be waiting on other dependencies to perform some work, while it sits idle. When we say idle, we mean the time the api-gateway Worker is awaiting a response from the auth and get-user Workers – represented by the gray bars in the request lifetime graphic.
When using Service Bindings, you no longer have to pay for those “idle resources”. With the Workers model, customers can execute work on a single shared compute thread across multiple individual Services, for each and every request. Cloudflare will charge for the amount of time that thread is allocated to your Workers and the time your Workers are awaiting external dependencies. Cloudflare won’t double charge for any overlap.
This is in stark contrast to classic serverless compute models (like Amazon Web Services’ Lambda), where resources are allocated on a per-instance basis, and as such cost is passed to the customer even when those resources are not actively being used. That extra charge is represented by the magenta portions of the request lifetime graphic below.
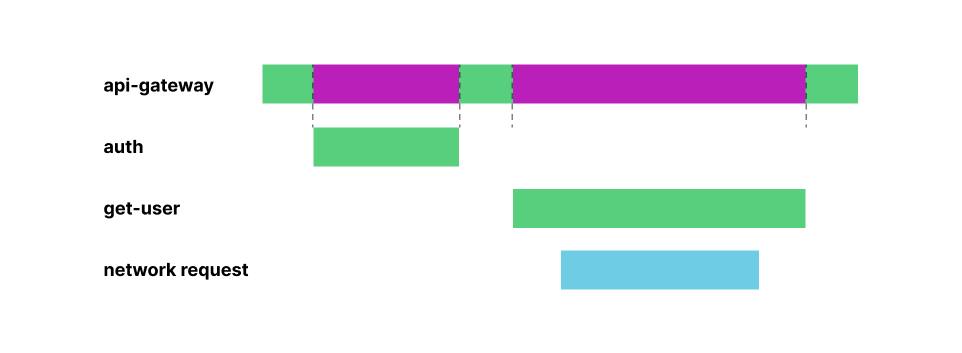
Cloudflare is able to squash duration down to a single charge, since Cloudflare can share the compute resources between your services. We pass those cost savings on to our customers, so you can pay only for the work you need done, when you need it done, every time.
Excited to try our Service Bindings? Head over to the Settings => Variables tab of your Worker, and click ‘Edit Variables’ under Service Bindings. You can then reference those bindings within your code and call fetch() on any one of them.
We can’t wait to see what you build. Check us out on Discord to join the conversation.
Post Syndicated from Tanushree Sharma original https://blog.cloudflare.com/logpush-for-workers/


Writing an application is like building a rocket. Countless hours in development and thousands of moving parts all come down to one moment – launch day. Picture the countdown: T minus 10 seconds. The entire team is making sure that things are running smoothly by monitoring dashboards that measure the health of every part of the system.
It’s every developer’s dream to get the level of visibility that NASA has in their mission control room, but for their own code. For flight directors and engineering directors alike, it’s important to have visibility into the systems that are built throughout development and after release. Today, we’re excited to announce Logpush for Worker’s Trace Events, making it easier than ever to gain visibility into applications built on Workers.
Today, we have lots of tools that are used to find out what’s happening in a Worker.
These tools are awesome for debugging, generalizing trends and monitoring Workers on third parties. They emphasize ease of use and make it effortless to get visibility quickly from your Workers.
As Workers have evolved, we’re now seeing more adoption from larger enterprises and platform companies who are using Workers as a foundation for their customers to develop on top of. When building complex and dynamic applications, customers, especially those building on Workers in the SaaS world need access to raw logs.
Coming soon — we’re adding Workers execution logs to Logpush! Cloudflare Enterprise customers get access to Logpush for any of our available products, including CDN, WAF, Spectrum and many more. We’re excited to add Workers to this list.
Logpush for Worker’s Trace Events will include unstructured console.log() messages, exceptions, and metadata about requests/responses. Here is a sample Trace Event for a fetch request:
{"accountID":123456,"scriptName":"cloudflare-workers-script","outcome":"ok","duration":0.5,"CPUTime":4,"eventType":"fetch","event":{"request":{"url":"https://workersdevtest.com","method":"GET","headers":{"accept":"*/*","accept-encoding":"gzip","connection":"Keep-Alive"},"cf":{"clientTcpRtt":40,"tlsVersion":"TLSv1.2","httpProtocol":"HTTP/2","edgeRequestKeepAliveStatus":1,"country":"CA","asn":16591}},"subrequests":{"request":{"url":"https://example.com","method":"GET","headers":{"x-custom-header":"my-header-value"}},"logs":[{"message":["foo"],"level":"log","timestamp":1587491479166}],"exceptions":[]}}}
With this new dataset, our Enterprise customers will be able to send Workers logs to their preferred cloud storage destination such as GCS or R2 or to analysis platforms like Splunk or New Relic. Logpush handles batching and can scale no matter how much traffic your Worker gets.
This brings new ways to get transparency into Workers! You can pinpoint when a fetch request fails, find out which call is adding the most lag in your application, and track down specific log lines to debug the end user experience. Also, combine Workers logs with HTTP request logs to get a better picture of the full request lifecycle.
It also opens up doors for SaaS companies building on Workers. SaaS companies can get visibility into how their customer’s applications are performing and expose logs to their customer’s developers to make debugging and troubleshooting much easier.
wrangler tail, Workers Analytics Engine (coming later this week!) and Logpush for Worker’s Trace Events are an elite trio to give visibility into every aspect of a Worker.
When you’re deep in the mix of development, wrangler tail is by your side to help you crush bugs and eliminate errors. With Workers Analytics Engine, you can instrument business logic and query aggregates within seconds to populate dashboards for monitoring. Logpush for Trace Events is there for when you need to debug very specific cases and get an exact record of what happened.
Customers big and small are using Cloudlfare Workers for their next launch, and we’re building tools to make that happen successfully. We’re bringing Logpsush for Trace Events to our Enterprise customers very soon. Stay tuned for updates.
Post Syndicated from Nevi Shah original https://blog.cloudflare.com/cloudflare-pages-build-improvements/
Music is flowing through your headphones. Your hands are flying across the keyboard. You’re stringing together a masterpiece of code. The momentum is building up as you put on the finishing touches of your project. And at last, it’s ready for the world to see. Heart pounding with excitement and the feeling of victory, you push changes to the main branch…. only to end up waiting for the build to execute each step and spit out the build logs.
Since the launch of Cloudflare Pages, there is no doubt that the build experience has been its biggest source of criticism. From the amount of waiting to inflexibility of CI workflow, Pages had a lot of opportunity for growth and improvement. With Pages, our North Star has always been designing a developer platform that fits right into your workflow and oozes simplicity. User pain points have been and always will be our priority, which is why today we are thrilled to share a list of exciting updates to our build times, logs and settings!
Over the last three quarters, we implemented a new build infrastructure that speeds up Pages builds, so you can iterate quickly and efficiently. In February, we soft released the Pages Fast Builds Beta, allowing you to opt in to this new infrastructure on a per-project basis. This not only allowed us to test our implementation, but also gave our community the opportunity to try it out and give us direct feedback in Discord. Today we are excited to announce the new build infrastructure is now generally available and automatically enabled for all existing and new projects!
As a developer, your time is extremely valuable, and we realize Pages builds were slow. It was obvious that creating an infrastructure that built projects faster and smarter was one of our top requirements.
Looking at a Pages build, there are four main steps: (1) initializing the build environment, (2) cloning your git repository, (3) building the application, and (4) deploying to Cloudflare’s global network. Each of these steps is a crucial part of the build process, and upon investigating areas suitable for optimization, we directed our efforts to cutting down on build initialization time.
In our old infrastructure, every time a build job was submitted, we created a new virtual machine to run that build, costing our users precious dev time. In our new infrastructure, we start jobs on machines that are ready and waiting to be used, taking a major chunk of time away from the build initialization step. This step previously ran for 2+ minutes, but with our new infrastructure update, projects are expected to see a build initialization time cut down to 2-3 SECONDS.
This means less time waiting and more time iterating on your code.
In our old build infrastructure, because we spun up a new virtual machine (VM) for every build, it would take several minutes to boot up and initialize with the Pages build image needed to execute the build. Alternatively, one could reuse a collection of VMs, assigning a new build to the next available VM, but containers share a kernel with the host operating system, making them far less isolated, posing a huge security risk. This could allow a malicious actor to perform a “container escape” to break out of their sandbox. We wanted the best of both worlds: the speed of a container with the isolation of a virtual machine.
Enter gVisor, a container sandboxing technology that drastically limits the attack surface of a host. In the new infrastructure, each container running with gVisor is given its own independent application “kernel,” instead of directly sharing the kernel with its host. Then, to address the speed, we keep a cluster of virtual machines warm and ready to execute builds so that when a new Pages deployment is triggered, it takes just a few seconds for a new gVisor container to start up and begin executing meaningful work in a secure sandbox with near native performance.
After we solidified a fast and secure build, we wanted to enhance the user facing build experience. Because a build may not be successful every time, providing you with the tools you need to debug and access that information as fast as possible is crucial. While we have a long list of future improvements for a better logging experience, today we are starting by enabling you to stream your build logs.
Prior to today, with the aforementioned build steps required to complete a Pages build, you were required to wait until the build completed in order to view the resulting build logs. Easily addressable issues like incorrectly inputting the build command or specifying an environment variable would have required waiting for the entire build to finish before understanding the problem.
Today, we’re giving you the power to understand your build issues as soon as they happen. Spend less time waiting for your logs and start debugging the events of your builds within a second or less after they happen!
Finally, the build experience does not just include the events during execution but everything leading up to the trigger of a build. For our final trick, we’re enabling our users to have full control of the precise branches they’d like to include and exclude for automatic deployments.
Before today, Pages submitted builds for every commit in both production and preview environments, which led to queued builds and even more waiting if you exceeded your concurrent build limit. We wanted to provide even more flexibility to control your CI workflow. Now you can configure your build settings to specify branches to build, as well as skip ad hoc commits.
While “unlimited staging” is one of Pages’ greatest advantages, depending on your setup, sometimes automatic deployments to the preview environment can cause extra noise.
In the Pages build configuration setting, you can specify automatic deployments to be turned off for the production environment, the preview environment, or specific preview branches. In a more extreme case, you can even pause all deployments so that any commit sent to your git source will not trigger a new Pages build.
Additionally, in your project’s settings, you can now configure the specific Preview branches you would like to include and exclude for automatic deployments. To make this configuration an even more powerful tool, you can use wildcard syntax to set rules for existing branches as well as any newly created preview branches.
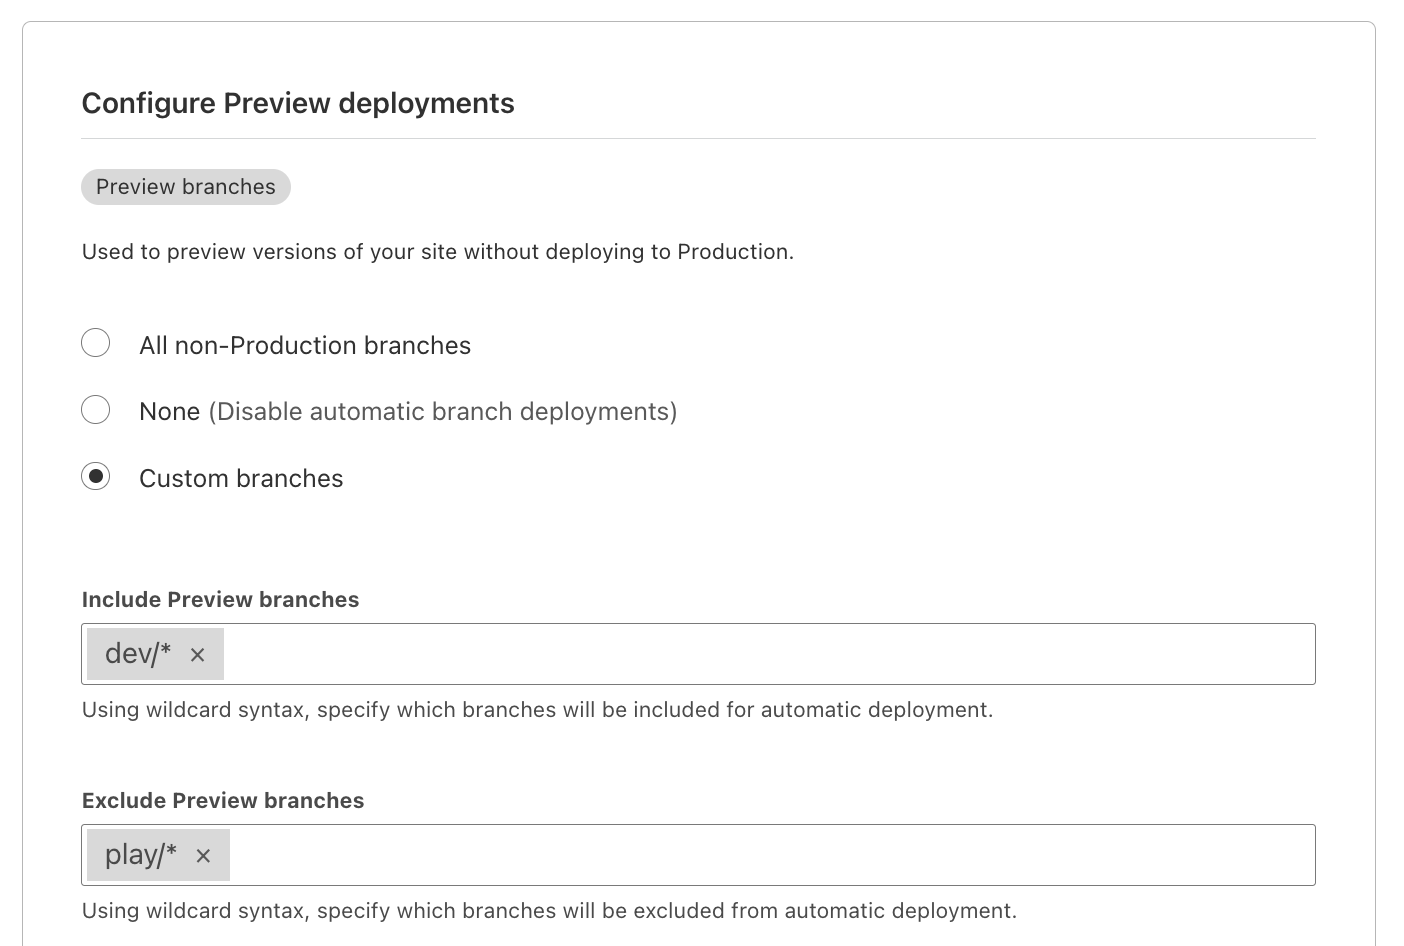
Read more in our Pages docs on how to get started with configuring automatic deployments with Wildcard Syntax.
Sometimes commits need to be skipped on an ad hoc basis. A small update to copy or a set of changes within a small timespan don’t always require an entire site rebuild. That’s why we also implemented a CI Skip command for your commit message, signaling to Pages that the update should be skipped by our builder.
With both CI Skip and configured build rules, you can keep track of your site changes in Pages’ deployment history.

We’re extremely excited to bring these updates to you today, but of course, this is only the beginning of improving our build experience. Over the next few quarters, we will be bringing more to the build experience to create a seamless developer journey from site inception to launch.
From beta testing, we noticed that our new infrastructure can be less impactful on larger projects that use heavier frameworks such as Gatsby. We believe that every user on our developer platform, regardless of their use case, has the right to fast builds. Up next, we will be implementing incremental builds to help Pages identify only the deltas between commits and rebuild only files that were directly updated. We will also be implementing other caching strategies such as caching external dependencies to save time on subsequent builds.
Because we’ve been using the same build image we launched Pages with back in 2021, we are going to make some major updates. Languages release new versions all the time, and we want to make sure we update and maintain the latest versions. An updated build image will mean faster builds, more security and of course supporting all the latest versions of languages and tools we provide. With new build image versions being released, we will allow users to opt in to the updated builds in order to maintain compatibility with all existing projects.
Lastly, while streaming build logs helps you to identify those easily addressable issues, the infamous “Internal error occurred” is sometimes a little more cryptic to decipher depending on the failure. While we recently published a “Debugging Cloudflare Pages” guide, in the future we’d like to provide the error feedback in a more productive manner, so you can easily identify the issue.
As always, your feedback defines our roadmap. With all the updates we’ve made to our build experience, it’s important we hear from you! You can get in touch with our team directly through Discord. Navigate to our Pages specific section and check out our various channels specific to different parts of the product!
Interested in learning more about building with Cloudflare Pages? If you’re based in the New York City area, join us on Thursday, May 12th for a series of workshops on how to build a full stack application on Pages! Follow along with a fully hands-on lab, featuring Pages in conjunction with other products like Workers, Images and Cloudflare Gateway, and hear directly from our product managers. Register now!
Post Syndicated from Nevi Shah original https://blog.cloudflare.com/cloudflare-pages-direct-uploads/
With Pages, we are constantly looking for ways to improve the developer experience. One of the areas we are keen to focus on is removing any barriers to entry for our users regardless of their use case or existing set up. Pages is an all-in-one solution with an automated Continuous Integration (CI) pipeline to help you build and deploy your site with one commit to your projects’ repositories hosted on GitHub or GitLab.
However, we realize that this excluded repositories that used a source control provider that Pages didn’t yet support and required varying build complexities. Even though Pages continues to build first-class integrations – for example, we added GitLab support in November 2021 – there are numerous providers to choose from, some of which use `git` alternatives like SVN or Mercurial for their version control systems. It’s also common for larger companies to self-host their project repositories, guarded by a mix of custom authentication and/or proxy protocols.
Pages needed a solution that worked regardless of the repository’s source location and accommodate build project’s complexity. Today, we’re thrilled to announce that Pages now supports direct uploads to give you more power to build and iterate how you want and with the tools you want.
Direct uploads enable you to push your build artifacts directly to Pages, side-stepping the automatic, done-for-you CI pipeline that Pages provides for GitHub and GitLab repositories. This means that connecting a Pages project to a git repository is optional. In fact, using git or any version control system is optional!
Today, you can bring your assets directly to Pages by dragging and dropping them into our dashboard or pushing them through Wrangler CLI. You also have the power to use your own CI tool whether that’s something like GitHub Actions or CircleCI to handle your build. Taking your output directory you can bring these files directly to Pages to create a new project and all subsequent deployments after that. Every deployment will be distributed right to the Cloudflare network within seconds.
After using your preferred CI tooling outside of Pages, there are two ways to bring your pre-built assets and create a project with the direct uploads feature:
With an estimated 43k weekly Wrangler downloads, you too can use it to iterate quickly on your Pages projects right through the command line. With Wrangler (now with brand-new updates!), you can both create your project and new deployments with a single command.
After Wrangler is installed and authenticated with your Cloudflare account, you can execute the following command to get your site up and running:
npx wrangler pages publish <directory>
Integration with Wrangler provides not only a great way to publish changes in a fast and consecutive manner, but also enables a seamless workflow between CI tooling for building right to Pages for deployment. Check out our tutorials on using CircleCI and GitHub Actions with Pages!
However, we realize that sometimes you just want to get your site deployed instantaneously without any additional set up or installations. In fact, getting started with Pages shouldn’t have to require extensive configuration. The drag and drop feature allows you to take your pre-built assets and virtually drag them onto the Pages UI. With either a zip file or a single folder of assets, you can watch your project deploy in just a few short seconds straight to the 270+ cities in our network.
With this ease of deploying projects, the possibilities of what you can build are still endless. You can enjoy the fruits of Pages in a project created with direct uploads including but not limited to unique preview URLs, integration with Workers, Access and Web Analytics, and custom redirects/headers.
In thinking about your developer setup, direct uploads provide the flexibility to build the way you want such as:
We’ll have to admit, the idea of publishing assets directly to our network came from a sister product to Pages called Workers Sites and the resemblance is striking! However, Pages affords many feature enhancements to the developer experience that show as a pain point on Workers Sites.
With Pages direct uploads, you can enjoy the freedom and flexibility of customizing your workflow that Workers Sites provides while including an interface to track and share changes and manage production/preview environments. Check out our tutorial on how to migrate over from Workers Sites.
This release immediately unlocks a broad range of use cases, allowing the most basic of projects to the most advanced to start deploying their websites to Pages today. Refer to our developer documentation for more technical details. As always, head over to the Cloudflare Developers Discord server and let us know what you think in the #direct-uploads-beta channel.
Calling all New York City developers! If you’re interested in learning more about Cloudflare Pages, join us for a series of workshops on how to build a full stack application on Thursday, May 12th. Follow along with demonstrations of using Pages alongside other products like Workers, Images and Cloudflare Gateway, and hear directly from our product managers. Register now!