Transform security logs into OCSF format using a configuration-driven ETL solution

Post Syndicated from Vivek Gautam original https://aws.amazon.com/blogs/security/transform-security-logs-into-ocsf-format-using-a-configuration-driven-etl-solution/

Security logs capture essential security-related activities, such as user sign-ins, file access, network traffic, and application usage. These logs are important for monitoring, detecting, and responding to potential security events. The Open Cybersecurity Schema Framework (OCSF) addresses this challenge by providing a standardized format to represent security events, ensuring consistent and efficient data handling across various systems. OCSF enhances interoperability, streamlines analysis, simplifies compliance reporting, and reduces vendor lock-in, fostering greater flexibility and efficiency in security operations.

However, manually transforming diverse security logs into OCSF format at scale can be complex and time-consuming. Amazon Security Lake simplifies this process by automatically centralizing security data from AWS services such as AWS CloudTrail management and data events (Amazon Simple Storage Service (Amazon S3) and AWS Lambda), Amazon Elastic Kubernetes Service (Amazon EKS) audit logs, Amazon Route 53 resolver query logs, AWS Security Hub findings, Amazon Virtual Private Cloud (Amazon VPC) Flow Logs, and AWS WAF logs. It also centralizes security logs from software as a service (SaaS) providers, on-premises, and cloud sources into a purpose-built data lake stored in your account. It uses the OCSF format to standardize and normalize this data, ensuring consistency and simplifying analysis. By integrating with analytics tools such as Amazon Athena and Amazon Quick Sight, Security Lake simplifies threat detection, improves security posture monitoring, and streamlines compliance reporting, making it an essential tool for modern security operations.

In this post, we show you how to transform custom security logs into OCSF format after you have the OCSF mappings ready, using a configuration-driven extract, transform, load (ETL) solution.

Accelerating OCSF adoption with AWS ProServe ETL solution

Amazon Security Lake stores security data in OCSF format and so customers looking to use custom log sources in Security Lake must transform their logs into OCSF format. To facilitate this process, the AWS Professional Services (ProServe) team built an ETL solution accelerator that converts custom security logs into OCSF format. This solution bridges existing log formats with the OCSF version 1.1 standard, streamlining data onboarding into Security Lake or other data lakes of security logs coming from multiple security tools.

Prerequisites

To implement this solution, you must have the following resources:

Solution overview

The solution uses two input files: a mapping file and a configuration file. These files guide the transformation of source logs into OCSF-compliant Parquet format, which is then partitioned by location/region=region/accountId=accountID/eventDay=yyyyMMdd/ and stored in an Amazon S3 location provided by Security Lake.

The following diagram shows the key architecture components of this solution and data flow between them.
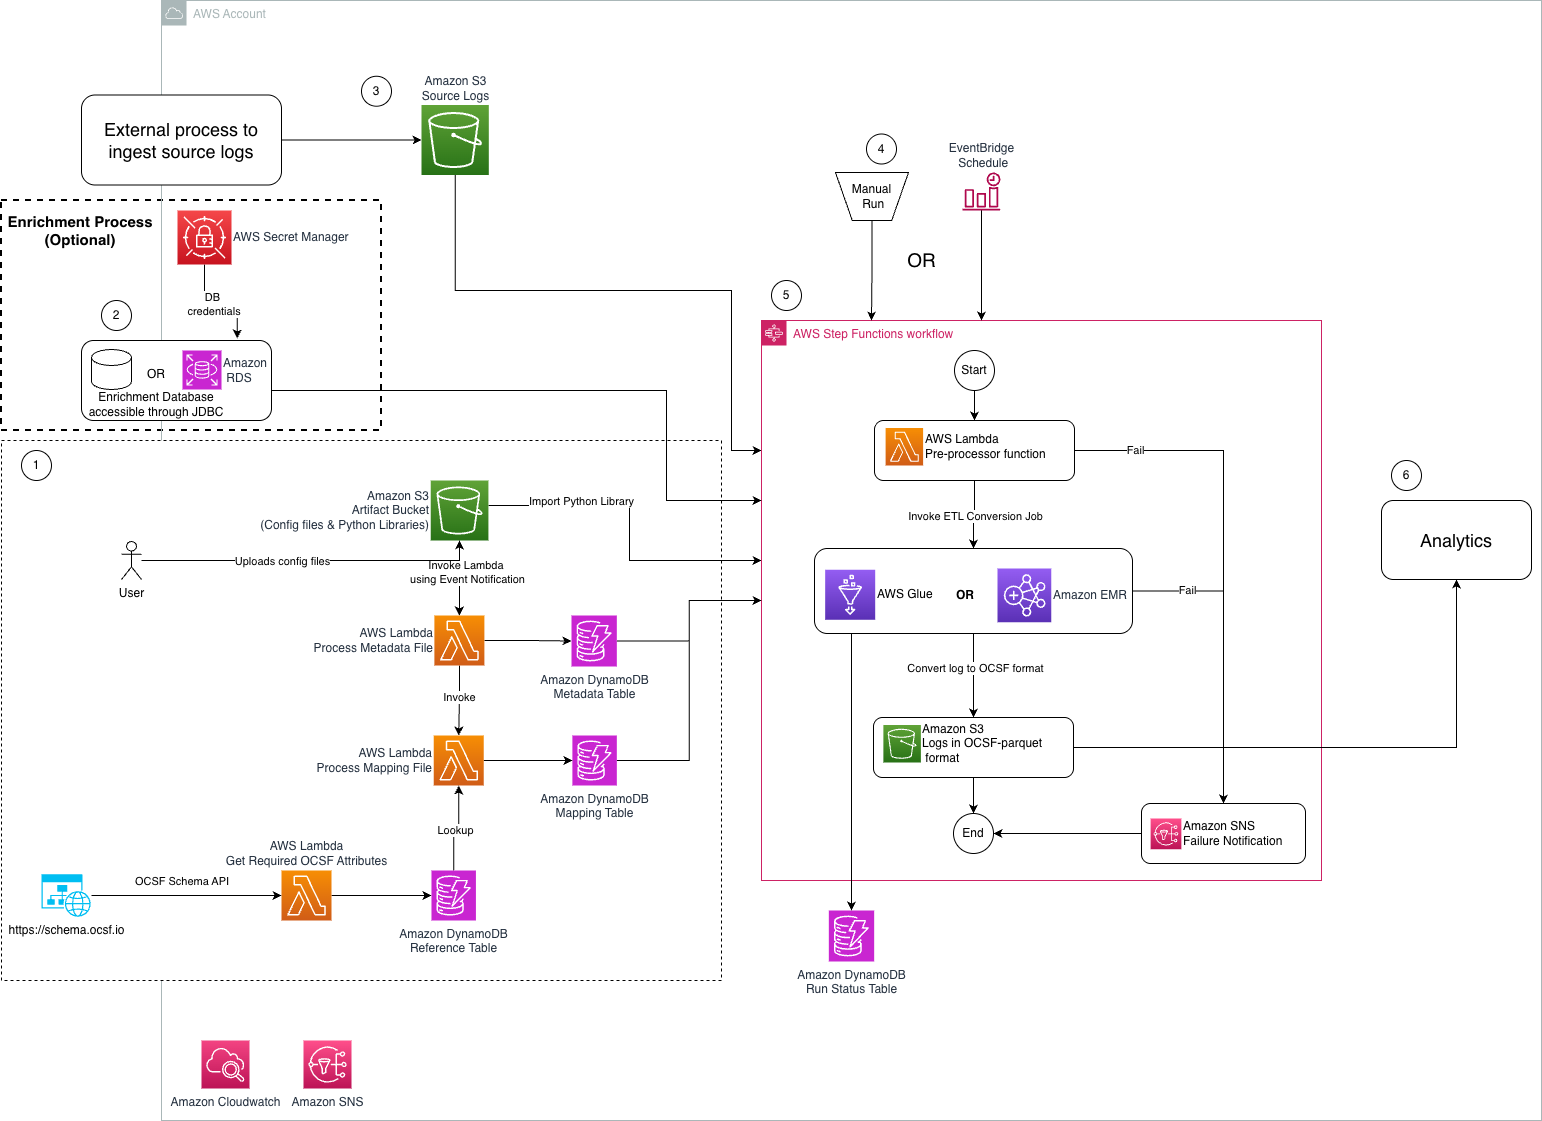
Figure 1: Architecture diagram of ETL solution to transform security logs into OCSF format

The steps mentioned below walks you through the architecture diagram:

  1. Preprocessing steps:
    1. User uploads a mapping file in CSV format that maps custom security logs into OCSF class.
    2. User uploads a metadata file in CSV format that is passed to the solution to transform custom security logs into OCSF format.
    3. An Amazon S3 artifact bucket stores the metadata, source-to-target mapping, and Python libraries required for OCSF conversion.
    4. An Amazon S3 event notification invokes the Lambda function that writes the metadata to the asl-etl-framework-ocsf-attribute-metadata DynamoDB table when the metadata files are created or updated.
    5. Metadata and mapping Lambda functions process the respective configuration files and store the required information in DynamoDB tables.
    6. The Reference Lambda function extracts the required OCSF attributes using an API call and stores the results in a DynamoDB table.
  2. Optional enrichment process: The solution reads data from an enrichment database stored on Amazon RDS or an external on-premises database that’s accessible through a JDBC connection from either Amazon EMR or AWS Glue. The credentials of this enrichment database are stored in Secrets Manager.
  3. Source log files are delivered to an S3 bucket by an external process.
  4. An EventBridge schedule or manual invoke initiates the Step Functions workflow, responsible for log conversion.
  5. A Step Functions workflow performs the following tasks:
    1. The preprocessor Lambda function performs checkpointing and invokes the required number of ETL jobs in parallel.
    2. The ETL job converts the source log files to the OCSF-Parquet format using the custom Python libraries stored in the artifact bucket and the mapping information defined in the DynamoDB table.
    3. A separate target S3 bucket stores the converted log data.
    4. An Amazon SNS topic is used to notify users if the Step Functions workflow fails during checkpointing or the ETL process.
  6. Analytics are performed on the converted data.

Deployment

You can find the required resources to deploy this solution in this GitHub repository. It provides detailed instructions in the README on how to deploy the solution. After you have the prerequisites mentioned earlier, see the Environment Setup portion of the repository.

Solution walkthrough

In this section, we walk you through steps to deploy this solution.

Map source log files into OCSF format

Before you start mapping the security logs into OCSF format, check if there are existing mappings available on OCSF mappings Github.

Mapping security logs into the OCSF format typically involves several steps. Here are the high-level steps:

  1. Understand OCSF schema: Familiarize yourself with the OCSF schema, which defines the structure and format for organizing security log data into event classes and attributes. In OCSF, events are organized into event classes, each of which comprises a set of attributes designed to offer comprehensive semantics for the event.
  2. Identify log sources: Determine your security log sources, such as firewalls, intrusion detection systems, or antivirus software. Each log source might have its own format (CSV, JSON, and so on) and structure.
  3. Identify OCSF categories and classes: Analyze the log content and match security events to the appropriate OCSF categories and classes for standardized data organization.
  4. Map fields to OCSF schema: Map the source log data fields in the OCSF schema. Ensure that each field from your logs is mapped to the appropriate field in the OCSF format. If a field in the source log schema isn’t mapped to any OCSF field, you might need to consider mapping it to unmapped object.
  5. Enrichment: Enrich data with additional contextual information, such as standardizing timestamps, converting IP addresses to a common format, or adding supplementary data for better analysis. The enrichment column is added to the final dataset. Each category in OCSF has an optional enrichment column that provides more information about a column. For example, the Authentication OCSF category contains an optional enrichment column that provides more details about the IP addresses. .
  6. Test and validate: Validate mapped log data against the OCSF schema to ensure compliance and accuracy. Test the mapping process with sample log data from different sources to identify any inconsistencies or errors. You can use this open source utility to validate your generated OCSF version 1.1 output file based on mapping.
  7. Contribute OCSF Mapping to the OCSF community: Submit the OCSF mapping to the Github repository and raise a pull request to contribute it to the OCSF community. Iterate on the mapping procedure to improve accuracy, efficiency, and compatibility with the OCSF schema based on the pull request feedback.

By following these steps, you can effectively map security logs into the OCSF format, enabling better interoperability, analysis, and collaboration across security tools and platforms. AWS ProServe has helped many customers map their security logs to OCSF format. If you need guidance to map and transform security logs into OCSF format and want to use AWS ProServe, reach out to your account executive.

Create and transform mapping files

The ETL solution requires a CSV mapping file that maps the custom security log attributes into standardized OCSF attributes based on the specified OCSF class. For detailed instructions on generating this mapping file, see the Solution Usage section, bullet 2, in the README of the code repository. To follow the instructions in this post, you can enable Amazon S3 server access logging to publish source logs to Amazon S3. The following is a sample S3 server access log record:

90de84bb542adb54766fec66ee554475b7e1a56a9d8b30e3598230f9ef6d6ac7 azv-asl-src-logs [29/May/2025:04:35:45 +0000] - arn:aws:sts::768196192565:assumed-role/AwsSecurityAudit/Palisade QS8DSY4SGF8M8SD7 REST.GET.BUCKETPOLICY - “GET /?policy HTTP/1.1" 200 - 255 - 39 - "-" "-" - N9XclJkv6hw/y4yApPyDII2sRoMNbqJqBEXdnmzFndcvhQOpdcc3PNQNQX7NhQaPJ5FKSVPh6hLB0GqsSN4apcbBUHi3rNcPRqa6rFLAYU4= SigV4 TLS_AES_128_GCM_SHA256 AuthHeader azv-asl-src-logs.s3.amazonaws.com TLSv1.3 - -

Because the sample record uses spaces as delimiters and contains an extra space before +0000, you need to wrap each attribute in quotes. Here’s a sample Python code implementation that handles this requirement:

import re
def format_s3_access_log(log_line):
    def quote_field(field):
        """Add quotes around a field and handle special cases"""
        if field is None or field.strip() == '':
            return '"-"'
        # If field is already quoted, return as is
        if field.startswith('"') and field.endswith('"'):
            return field
        return f'"{field}"'
    try:
        # First, protect quoted strings and bracketed content by temporarily replacing them
        protected_line = log_line
        protected_parts = re.findall(r'(\[.*?\]|".*?")', log_line)
        for i, part in enumerate(protected_parts):
            protected_line = protected_line.replace(part, f"PROTECTED_{i}_PART")
        # Split the protected line
        parts = protected_line.split()
        # Restore protected parts
        restored_parts = []
        for part in parts:
            if part.startswith('PROTECTED_') and part.endswith('_PART'):
                index = int(part.split('_')[1])
                restored_parts.append(protected_parts[index])
            else:
                restored_parts.append(part)
        # Quote each field
        quoted_fields = [quote_field(field) for field in restored_parts]    
        # Join with spaces
        return ' '.join(quoted_fields)
    except Exception as e:
        print(f"Error processing line: {e}")
        return None

# Example usage
if __name__ == "__main__":
    # Example input log line
    log_line = '''90de84bb542adb54766fec66ee554475b7e1a56a9d8b30e3598230f9ef6d6ac7 azv-asl-src-logs [29/May/2025:04:35:45 +0000] - arn:aws:sts::768196192565:assumed-role/AwsSecurityAudit/Palisade QS8DSY4SGF8M8SD7 REST.GET.BUCKETPOLICY - "GET /?policy HTTP/1.1" 200 - 255 - 39 - "-" "-" - N9XclJkv6hw/y4yApPyDII2sRoMNbqJqBEXdnmzFndcvhQOpdcc3PNQNQX7NhQaPJ5FKSVPh6hLB0GqsSN4apcbBUHi3rNcPRqa6rFLAYU4= SigV4 TLS_AES_128_GCM_SHA256 AuthHeader azv-asl-src-logs.s3.amazonaws.com TLSv1.3 - -'''
    # Process the log line
    formatted_output = format_s3_access_log(log_line)
    print(formatted_output)

This sample code demonstrates how to wrap quotes around each attribute. You can extend this code to read source Amazon S3 server access log files from an S3 location and write the modified logs to another location. After these logs are available in an S3 bucket in your AWS account, you need to map the S3 server access logs to OCSF format. The following is an example of an S3 server access log CSV mapping file:

src_log_type src_column_name tgt_column default_values
s3-access-log bucket_owner resources:Object.owner:Object.uid:string
s3-access-log bucket resources:array.value:string
s3-access-log time time:timestamp
s3-access-log remote_ip src_endpoint:object.ip:string
s3-access-log requester actor:Object.user:object.uid:string
s3-access-log request_id http_request:object.uid:string
s3-access-log operation api:Object.operation:string
s3-access-log key unmapped:Object.key:string
s3-access-log request_uri http_request:object.url:object.url_string:string
s3-access-log http_status http_response:object.code:integer
s3-access-log error_code http_response:object.message:string
s3-access-log bytes_sent http_response:object.length:integer
s3-access-log object_size unmapped:Object.object_size:string
s3-access-log total_time duration:integer
s3-access-log turn_around_time http_response:object.Latency:integer
s3-access-log referer http_request:object.referrer:string
s3-access-log user_agent http_request:object.user_agent:string
s3-access-log version_id unmapped:Object.version_id:string
s3-access-log host_id unmapped:Object.host_id:string
s3-access-log signature_version unmapped:Object.signature_version:string
s3-access-log cipher_suite unmapped:Object.cipher_suite:string
s3-access-log authentication_type unmapped:object.authentication_type:string
s3-access-log host_header http_request:object.http_headers:array.value:string
s3-access-log tls_version unmapped:Object.tls_version:string
s3-access-log access_point_arn unmapped:Object.access_point_arn:string
s3-access-log acl_required unmapped:Object.acl_required:string
metadata:object.version:string 1.1.0
cloud:object.provider:string AWS
metadata:object.product:string.name:string S3
metadata:object.product:string.vendor_name:string AWS
http_request:object.http_headers:array.name:string http_header
resources:array.name:string bucket
activity_id:integer 99
severity_id:integer 99
type_uid:integer 600399
category_name:string Application Activity

Upload the mapping CSV file to the S3 artifact location s3://secure-datalake-artifacts-<account_number>-<aws_region>/config/mapping/. The Lambda function asl-etl-framework_update-mapping-ddb ingests this mapping CSV file, processes its entries, and converts them into the required DynamoDB format. This Lambda function writes the results to the asl-etl-framework-ocsf-attribute-mapping DynamoDB table, which stores the schema and mapping information for all source log files processed by this solution. You can find an example of an S3 server access log CSV metadata file in the GitHub repository.

Create and transform configuration files

To create a configuration metadata file, create a CSV file following the guidelines in Solution Usage, bullet 4, in the README of the code repository.

Upload the completed mapping CSV file into an S3 artifact location s3://secure-datalake-artifacts-<account_number>-<aws_region>/config/metadata/. An upload of a metadata CSV file to S3 invokes a Lambda function asl-etl-framework_insert_metadata_ddb, which stores the configuration in the asl-etl-framework-source-ocsf-metadata DynamoDB table. The following image shows the configuration in DynamoDB table.
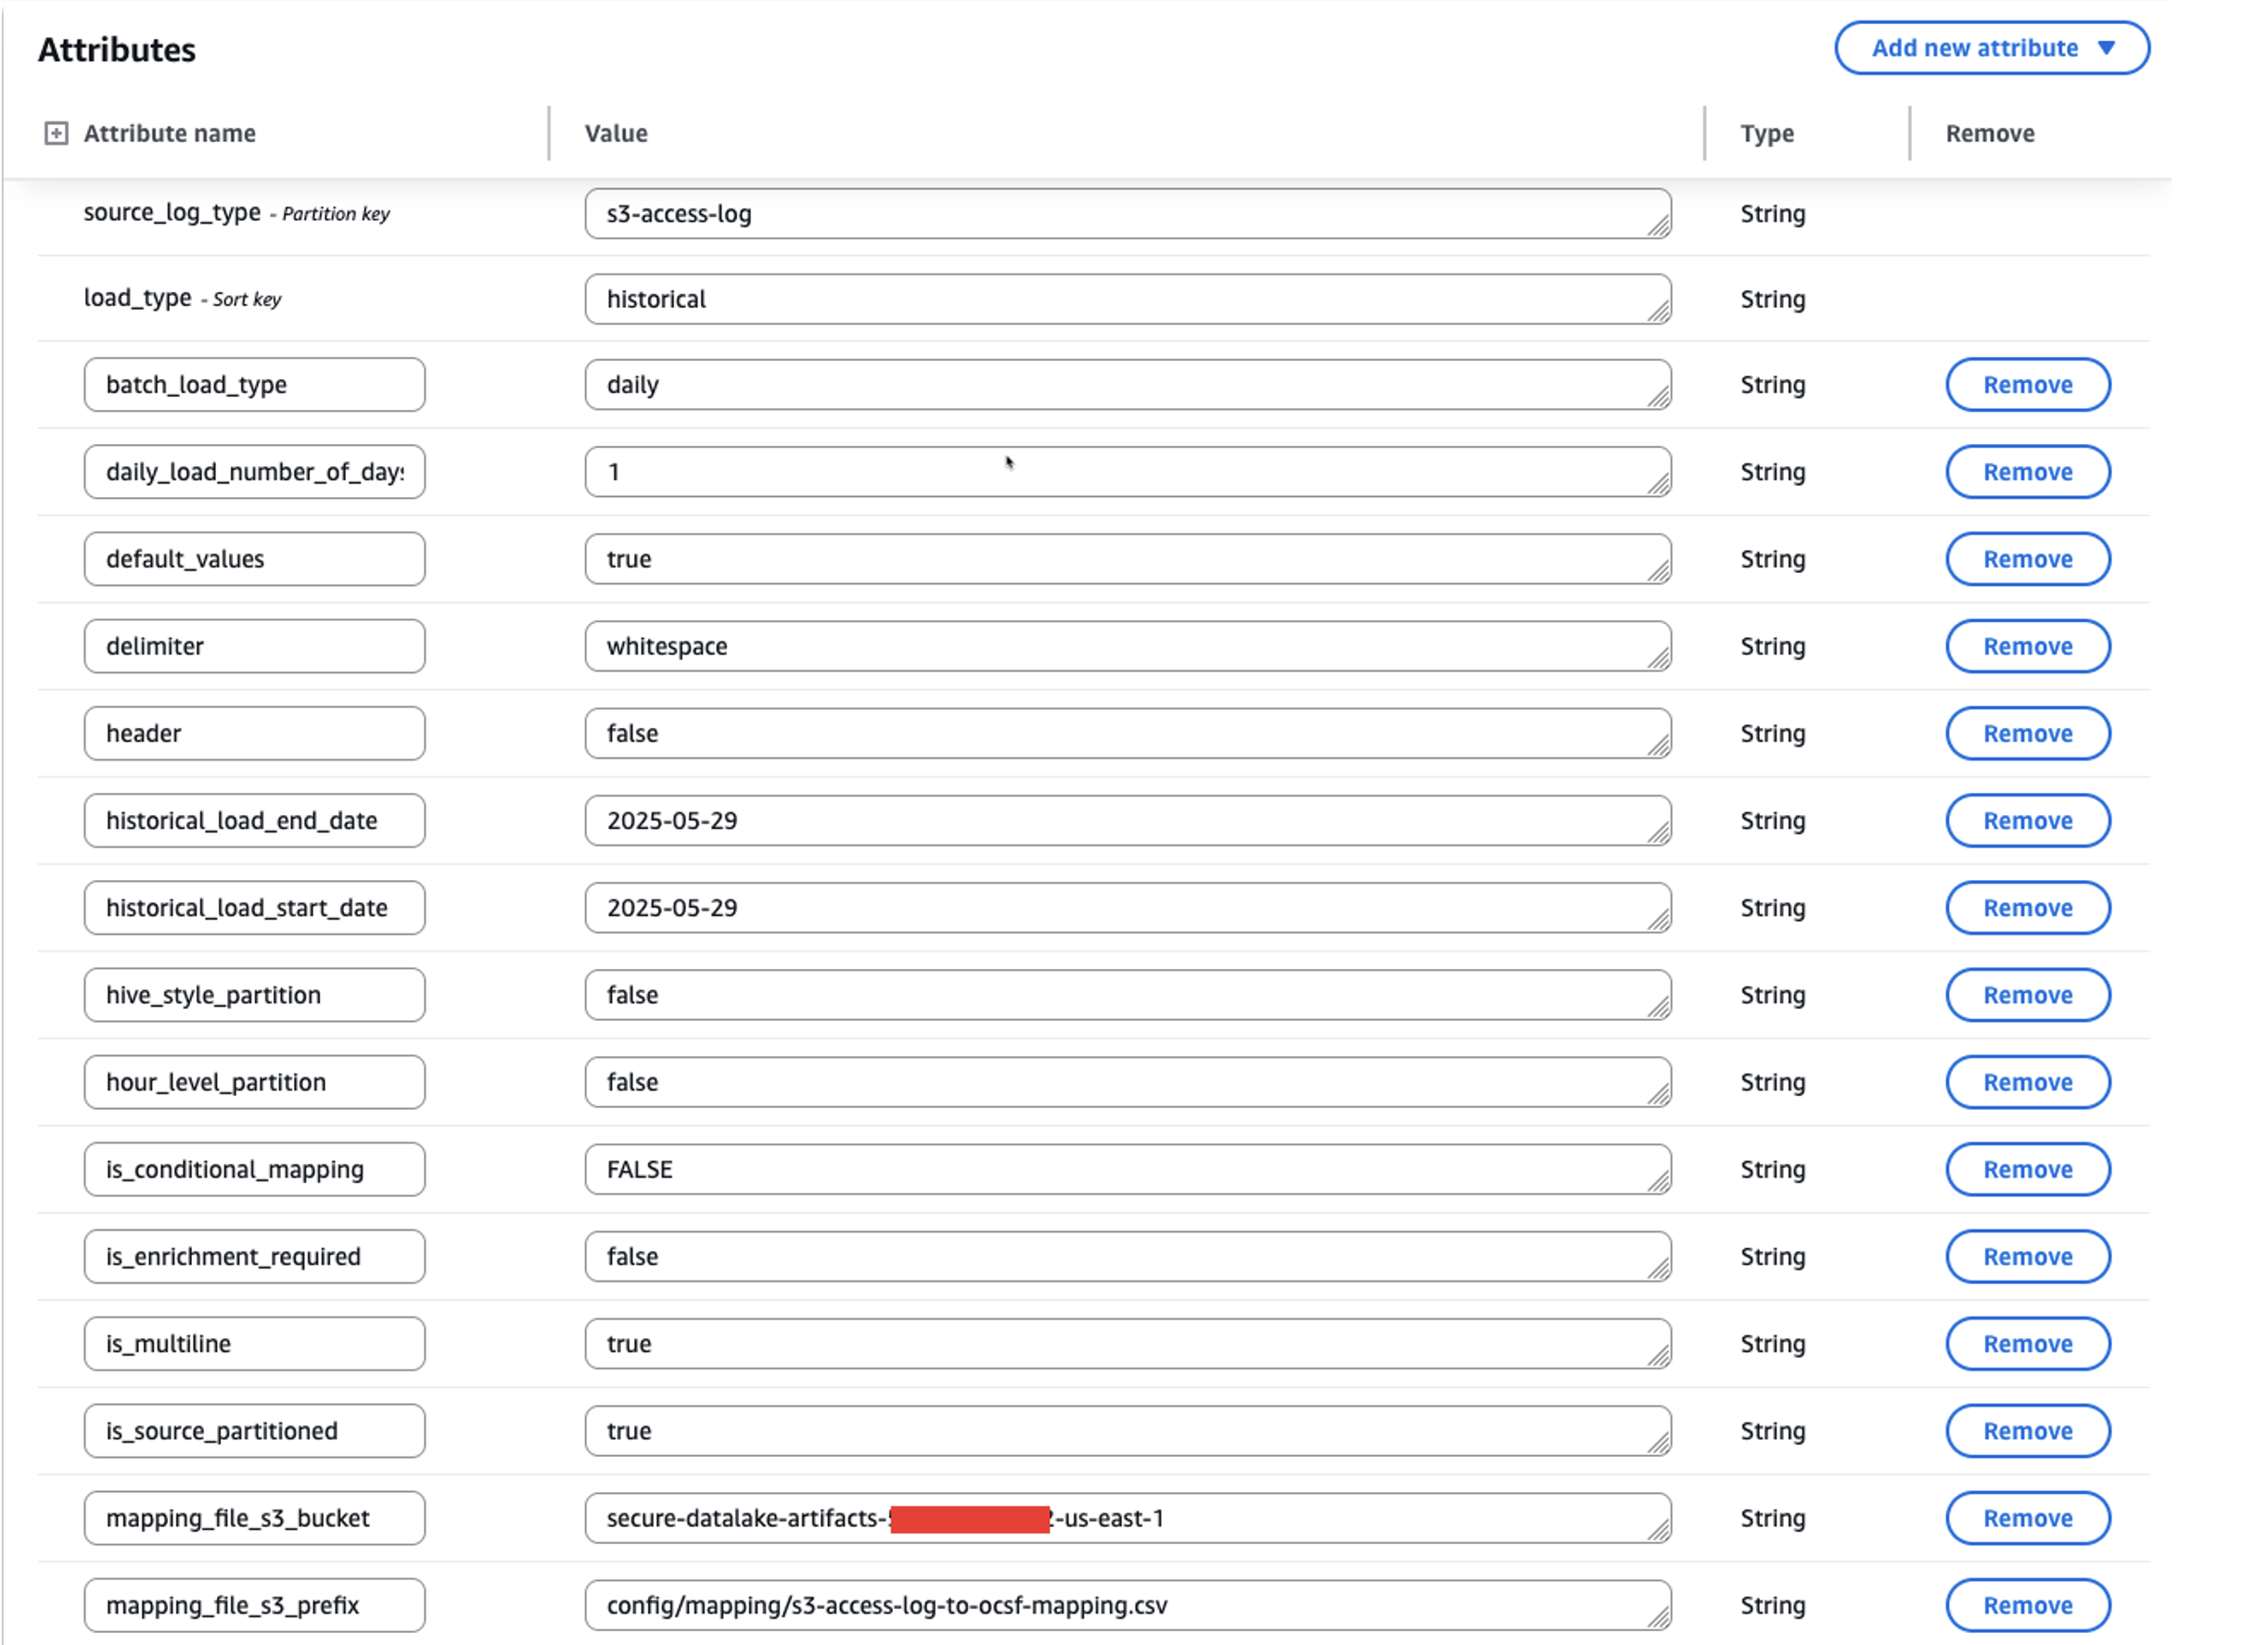
Figure 2: Screenshot of metadata configuration in the asl-etl-framework-source-ocsf-metadata DynamoDB table for S3 Access Logs

After inserting the metadata into the asl-etl-framework-source-ocsf-metadata DynamoDB table, the Lambda function asl-etl-framework_update-mapping-ddb is invoked to read the mapping CSV file and inserts mappings into the asl-etl-framework-ocsf-attribute-mapping DynamoDB table. The following image shows the mapping in DynamoDB table.
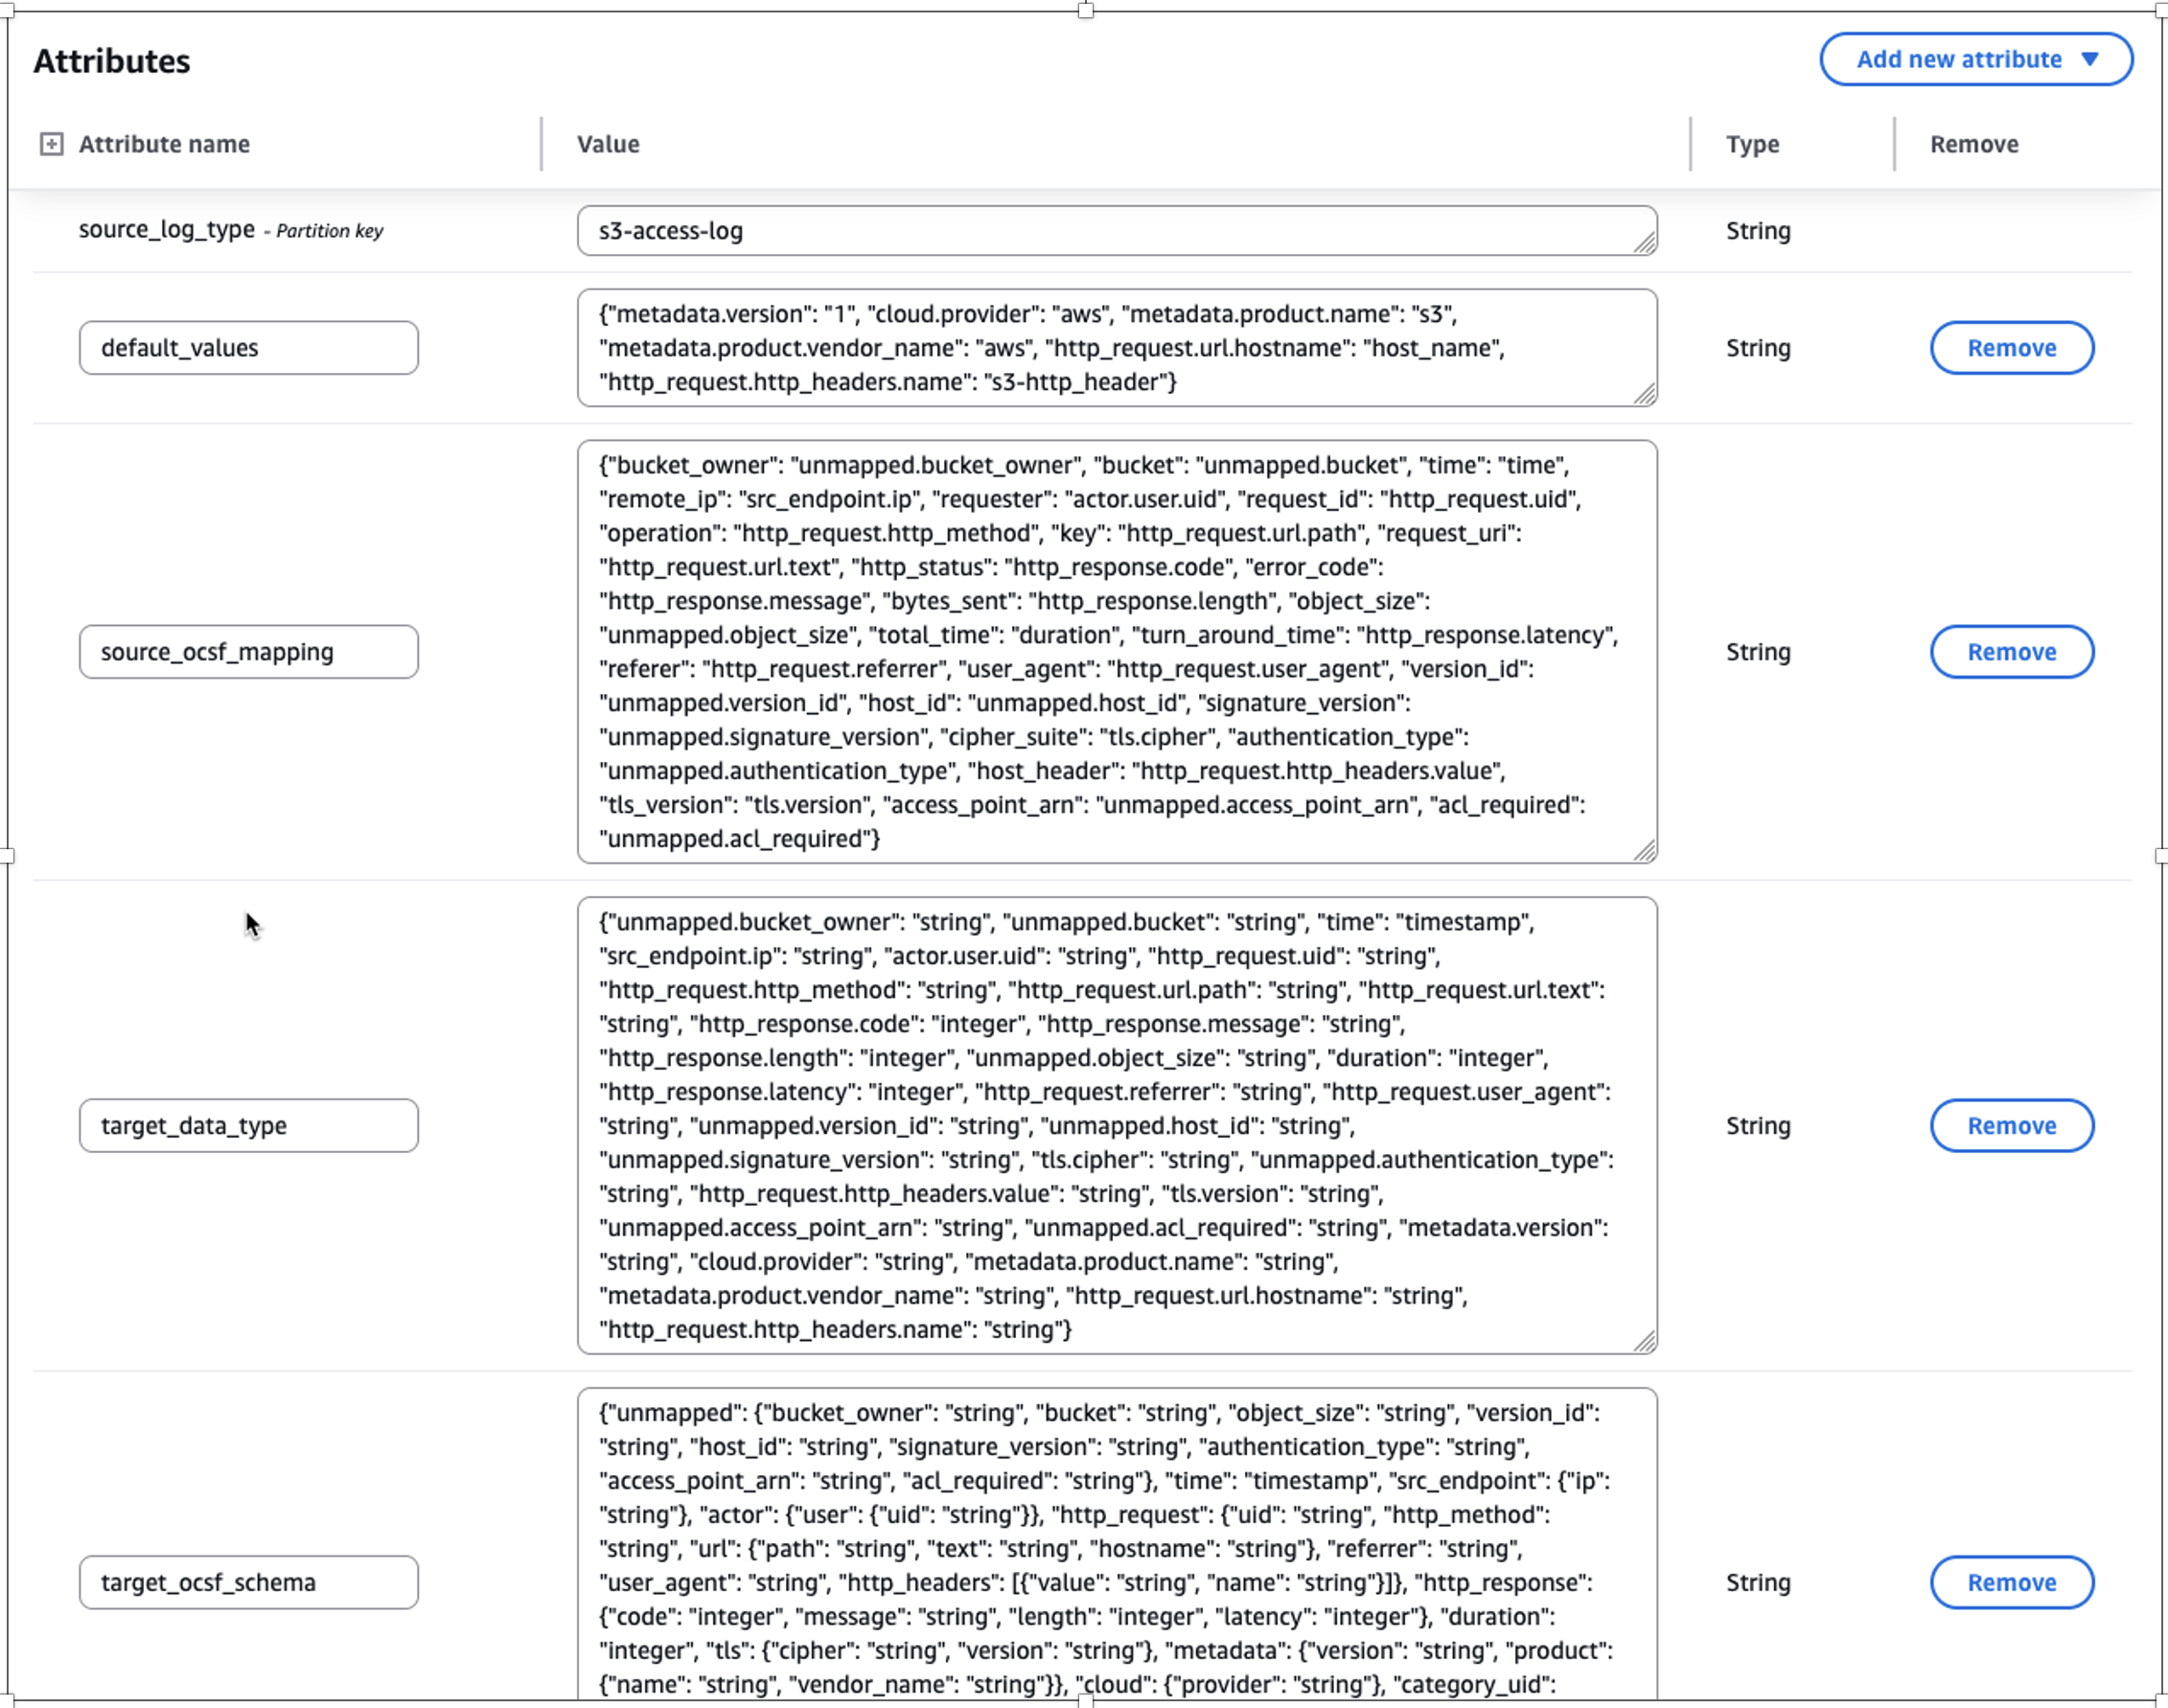
Figure 3: Screenshot of transformed mapping in the asl-etl-framework-ocsf-attribute-mapping DynamoDB table for S3 Access Logs

Historical load

The ETL solution offers a historical load capability that processes logs from specified date or year ranges based on metadata file inputs. After being converted to OCSF format in Parquet file format, these logs can be integrated into Amazon Security Lake or be used to create a custom data lake. The solution includes checkpointing functionality to handle potential failures during historical data processing.

The checkpointing feature provides process resilience by tracking conversion progress in the asl-etl-framework-ocsf-run-status DynamoDB table. If a conversion process fails during multi-year historical processing, the solution resumes from the point of failure rather than reprocessing previously converted data. For example, if conversion fails while processing the second year’s data, the solution will resume from that point, preserving the first year’s successful conversion. While this feature is enabled by default, you can disable it, in which case any process restart will begin from the initial specified date. The following image shows the load_type as historical along with start_time and end_time for the period you want to transform the logs.
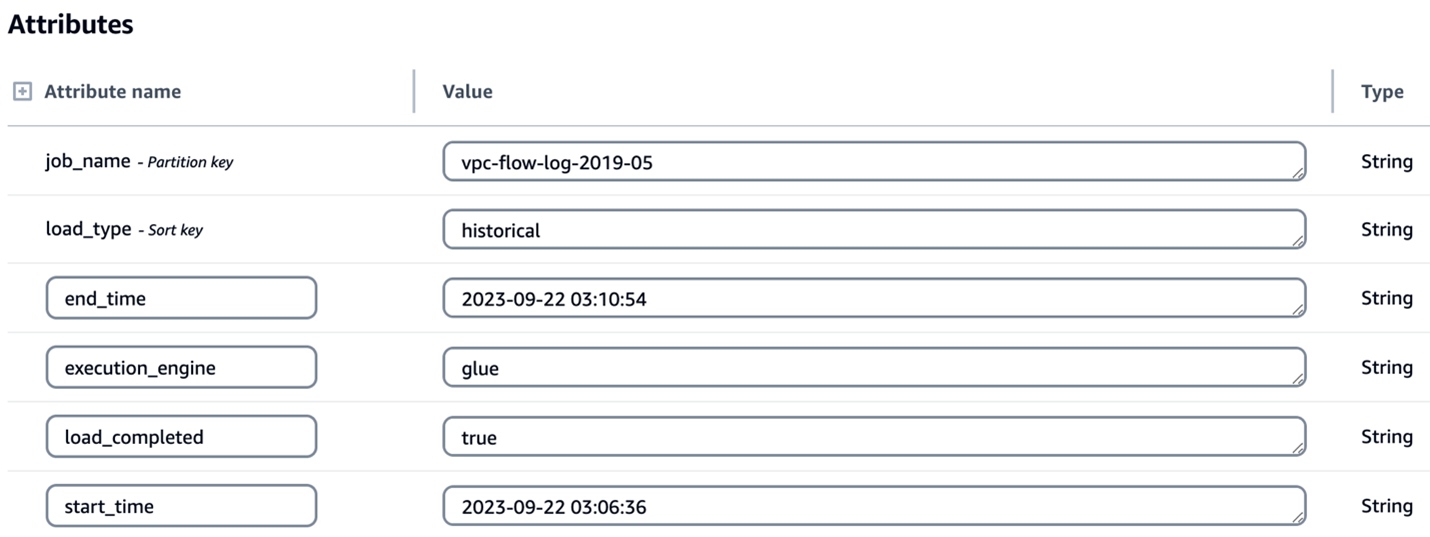
Figure 4: Screenshot of configuration for historical load attributes in the asl-etl-framework-source-ocsf-metadata DynamoDB table

Enrichment

Enterprises often possess valuable contextual data that can enhance their security logs through enrichment. By correlating existing data with security logs and appending relevant information, you can create more comprehensive datasets for advanced analytics and deeper security insights. After the logs are converted to OCSF, you might want to know more about specific columns or attributes so that you can extract meaningful information. To support this, the solution has an option for enrichment. For example, if you want to get additional information, such as the geolocation of each IP address in the logs, you can provide the source database information in the metadata CSV file of the solution. It connects to the source database through a JDBC connection, extracts the requested information associated with the IP address to enrich the dataset, and adds the extracted information as new columns to the converted OCSF log output. In this way, you can have detailed information about each IP address in the converted OCSF log. The following screenshot shows parameters for enabling enrichment by setting the is_enrichment_required flag as true and adding necessary enrichment_attributes to the metadata table.
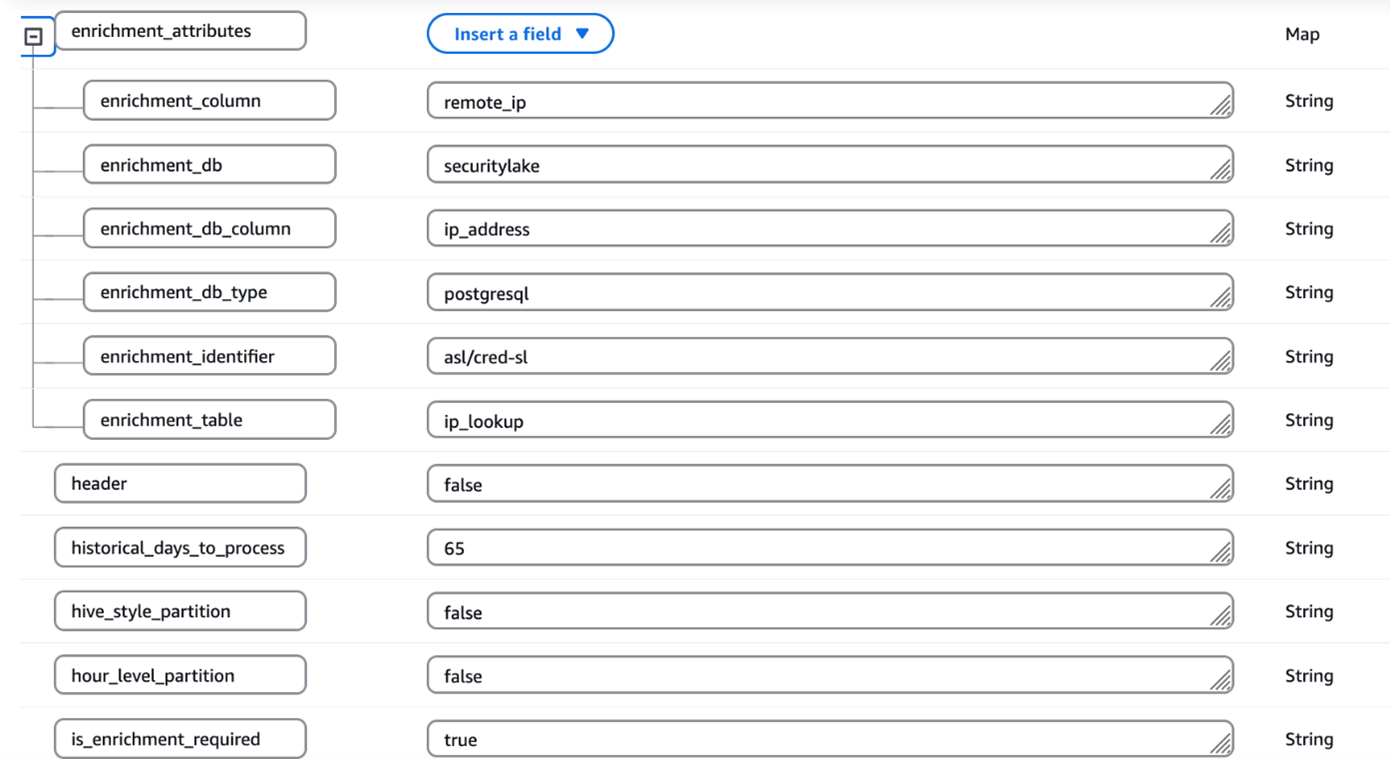
Figure 5: Screenshot of configuration for enrichment attributes in the asl-etl-framework-source-ocsf-metadata DynamoDB table

ETL transformation using AWS Glue or EMR Serverless

You can use the engine of your choice for the transformation by providing the engine name during the deployment steps as mentioned in the Pre-Deployment Configuration section of the ReadMe. Based on this, the solution uses either AWS Glue or EMR Serverless as mentioned in the Orchestration using Step Functions section.

The process includes the following steps:

  1. The user enters the metadata and mapping information in the respective CSV files and uploads the files to Amazon S3.
  2. A process (Lambda job) converts the metadata and mapping files to a DynamoDB schema and stores them in corresponding DynamoDB tables (metadata and mapping tables).
  3. A preprocessor job is invoked that takes the metadata from the DynamoDB table asl-etl-framework-source-ocsf-metadata and, based on the input parameters passed for the Step Functions workflow shown in the Orchestration using Step Functions section, the Step Functions workflow generates the input arguments for the transformation job (AWS Glue or EMR Serverless based on the user’s choice).
  4. The transformation job (AWS Glue or Amazon EMR based on the user’s choice) is invoked and reads the metadata and mapping tables and converts the data into OCSF format.
  5. The converted OCSF log files are stored to an Amazon S3 location in Parquet format, which is defined in the DynamoDB table asl-etl-framework-source-ocsf-metadata. These custom OCSF logs on S3 can be integrated with Security Lake.

Orchestration using Step Functions

This solution is orchestrated using Step Functions and offers two execution engine options: AWS Glue or EMR Serverless, depending on the services allow-listed in your enterprise. For processing historical loads, we recommend using EMR Serverless; however, AWS Glue is suitable for historical loads less than 100 GB. When invoking the Step Functions workflow, specify the execution engine as either emr-serverless or glue in the input parameters passed using EventBridge.
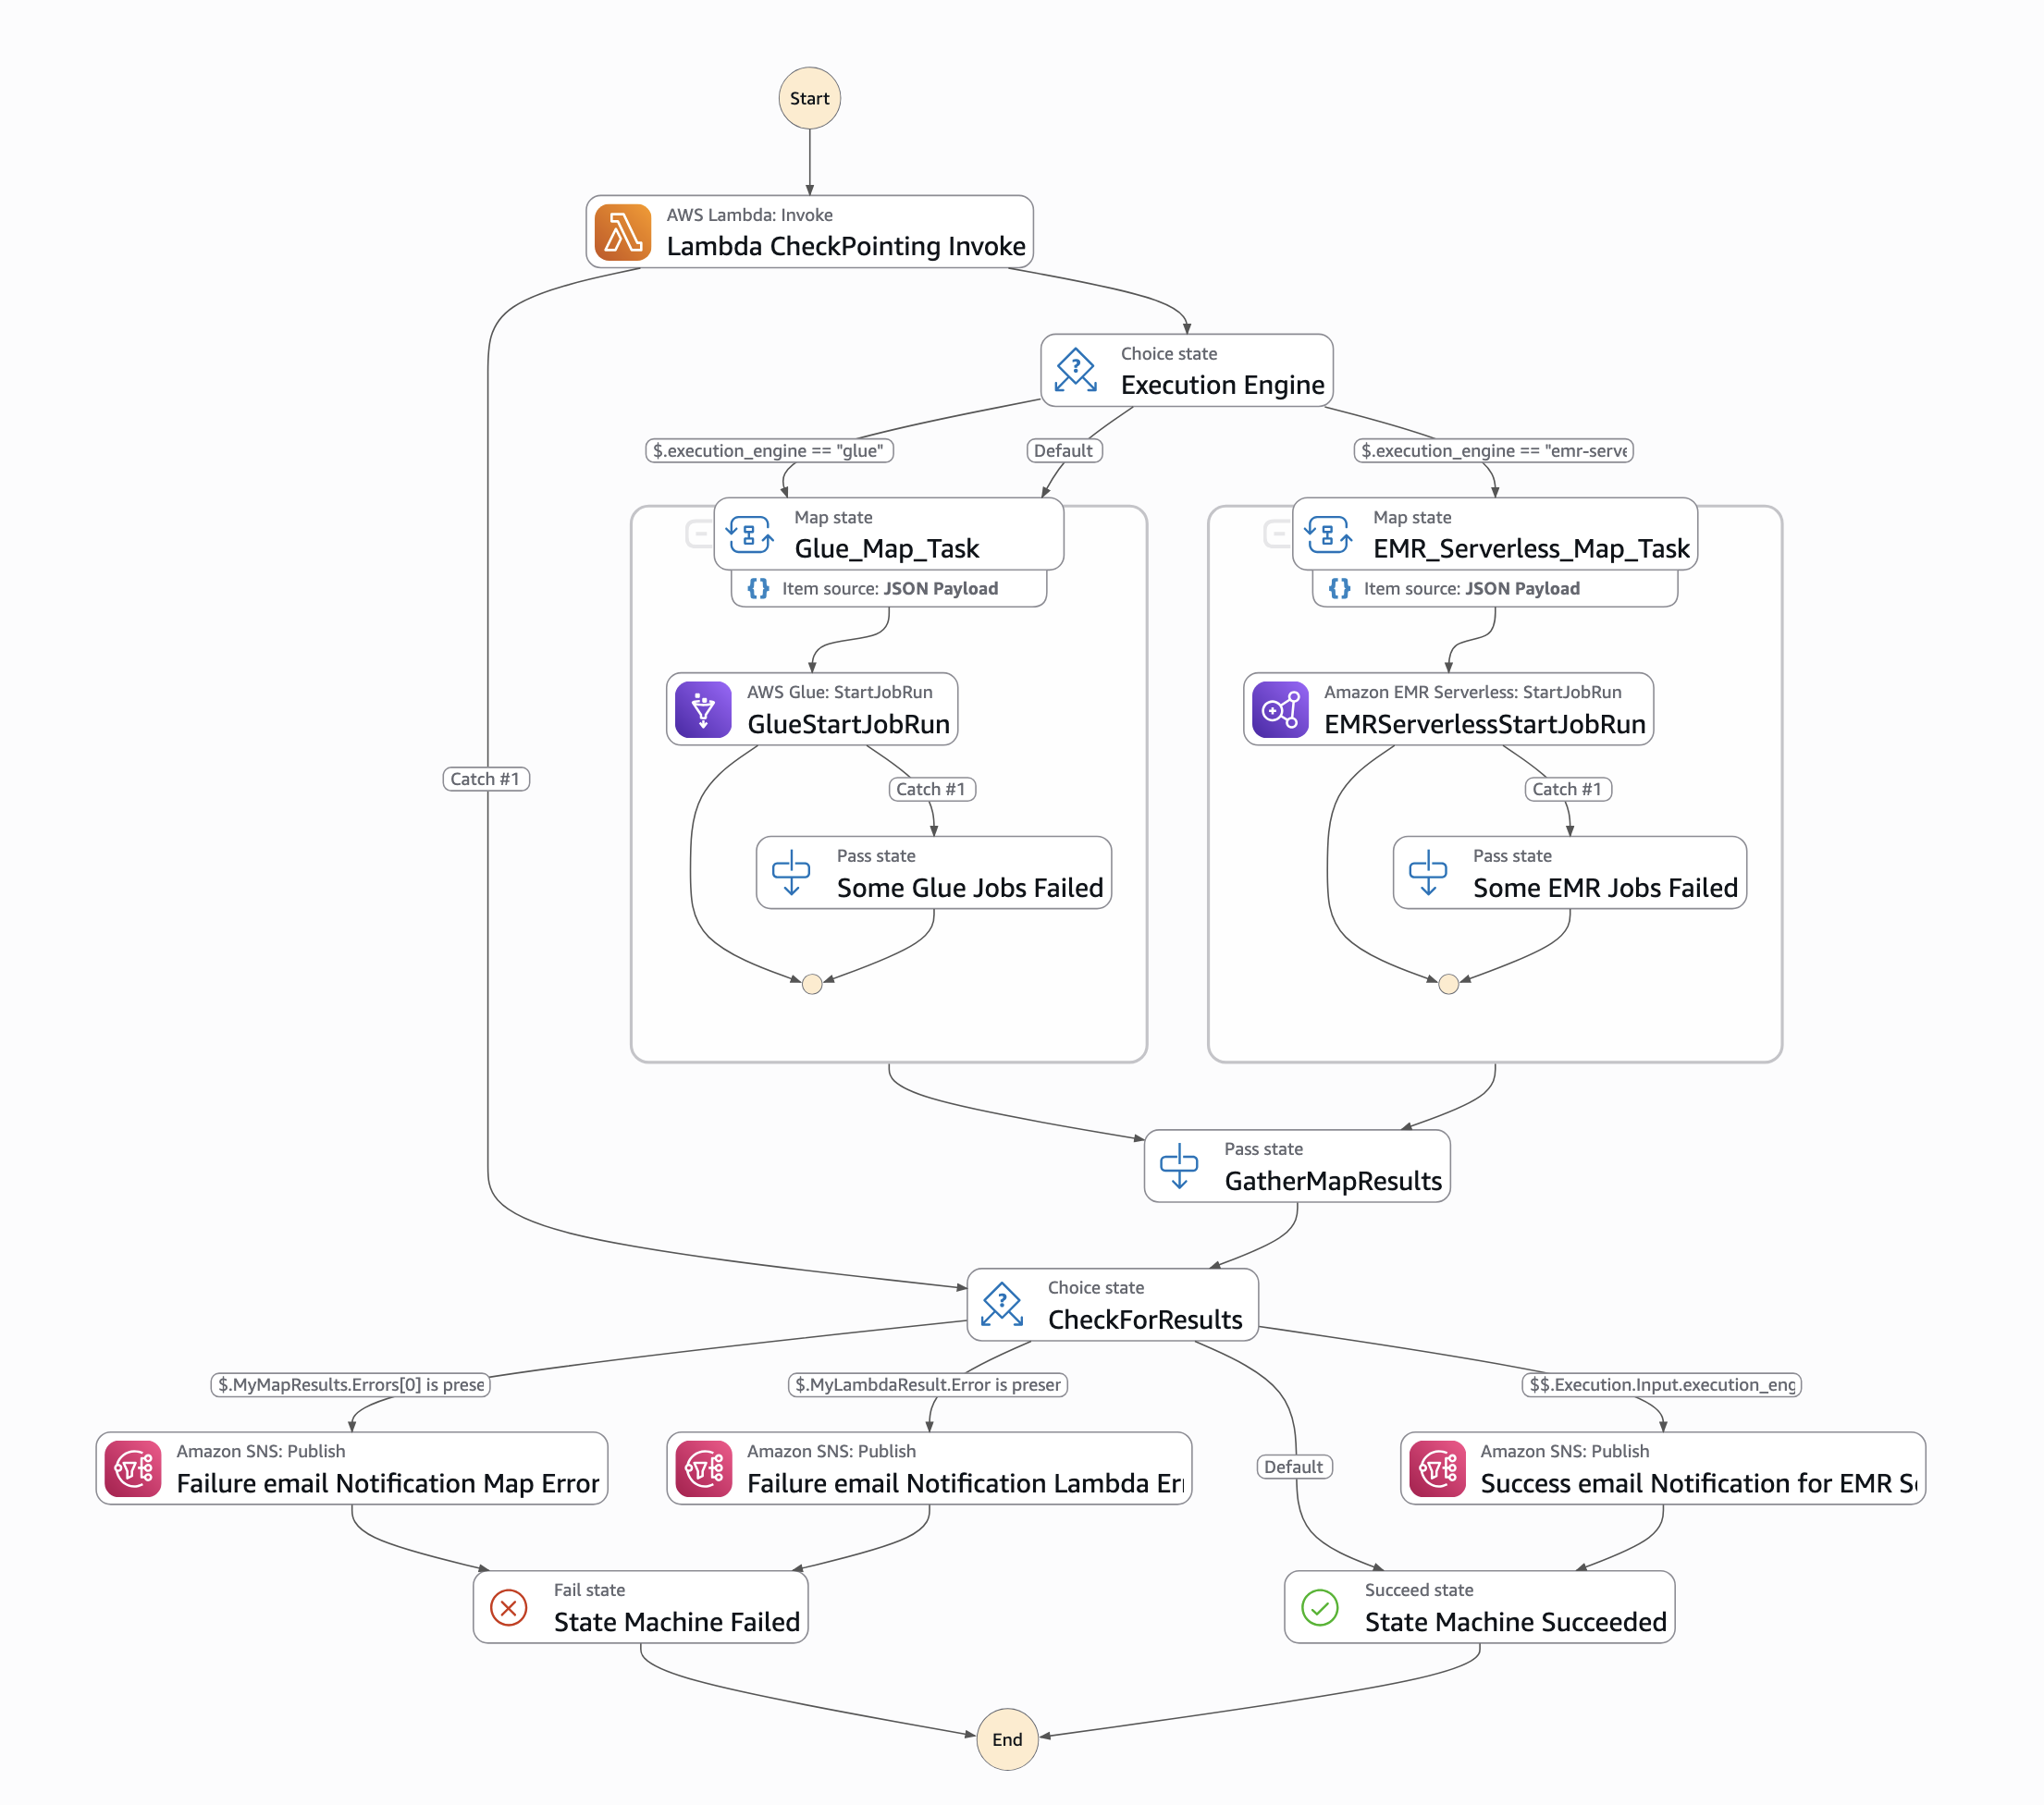
Figure 6: Screenshot of Step Functions workflow orchestration

To run the workflow, an input must be passed through an EventBridge schedule. The input parameters are as follows:

{
“source_log_type": “s3-access-log”,
“load_type": “historical”,
“full_load": “false”,
“ddb_lookup_table": “asl-etl-framework-ddb-table-details”,
“ddb_mapping_table": “asl-etl-framework-ocsf-attribute-mapping”,
“ddb_metadata_table": “asl-etl-framework-source-ocsf-metadata”,
“ddb_reference_table": “asl-etl-framework-ocsf-reference”,
“asl_status_table": “asl-etl-framework-run-status”,
“execution_engine": “glue”,
“asl_job_name": “asl-etl-framework-init-ocsf-conversion”
}

A description of the steps is also available in the ReadMe section of the code repository.

Verify the final output in OCSF format

It’s a best practice to ensure that the generated Parquet files properly map to the various schema definitions specified within the Open Cybersecurity Schema Framework (OCSF). Validating the mapping helps to maintain data integrity and allows the security data to be effectively analyzed and processed by downstream applications and tools, such as Security Lake. You can use OCSF Schema Validator, which was built to provide supplementary validation for Security Lake. Performing this validation step helps detect any schema misalignments or data quality issues early in the process, leading to more reliable and trustworthy security analytics.

If validation of the transformed OCSF Schema fails using the OCSF Schema Validator, you need to validate if your mappings are aligned with the respective OCSF category. Adjust your mappings, rerun the solution, and validate the transformed OCSF logs using OCSF Schema Validator until you get a valid OCSF schema.

When discovering incorrect OCSF mappings or format inconsistencies in converted logs, begin by conducting a thorough validation against OCSF schema specifications to identify specific discrepancies. Update the mappings with correct field mappings, ensuring proper data type conversions and mandatory field requirements are met. Test these corrections using sample data to verify OCSF compliance using the above mentioned tool and data integrity before implementing in production.

Conclusion

In this post, we showed you how the ETL solution accelerator transforms custom security logs into the standardized OCSF format, enabling enhanced security analytics capabilities. This solution, developed by AWS Professional Services (AWS ProServe), addresses common challenges in security log standardization and streamlines the adoption of Amazon Security Lake. While the solution is available as an open source project, engaging with AWS ProServe provides significant advantages, including proven implementation expertise, best practices guidance, and accelerated deployment timelines. Our ProServe team brings extensive experience in security log standardization and can help customize the solution to your specific requirements while ensuring optimal integration with Security Lake. To begin your journey toward standardized security analytics using OCSF, contact your AWS account team to discuss how AWS ProServe can help implement this solution in your environment.

Vivek Gautam

Vivek Gautam

Vivek is a Senior Data Architect with specialization in data analytics at AWS Professional Services. He works with enterprise customers building data products, analytics platforms, streaming, and search solutions on AWS. When not building and designing data products, Vivek is a food enthusiast who also likes to explore new travel destinations and go on hikes.

Arpit Gupta

Arpit Gupta

Arpit is a Data Architect at AWS Professional Services with a focus on data analytics. He specializes in developing data lakes, analytics solutions, and Generative AI applications in the cloud, helping organizations transform their data into actionable business insights. His passions extend from the digital to the physical realm—from tennis courts to the kitchen, and exploring new destinations with family.

Ryan Gomes

Ryan Gomes

Ryan was a Senior Data and ML Engineer with AWS Professional Services at the time of writing. He is passionate about helping customers achieve better outcomes through analytics, machine learning, and generative AI solutions in the cloud. Outside of work, he enjoys fitness, cooking, and spending quality time with friends and family.

[$] A more efficient implementation of Shor’s algorithm

Post Syndicated from daroc original https://lwn.net/Articles/1066156/


Shor’s algorithm
is the main practical example of an algorithm that runs more
quickly on a quantum computer than a classical computer — at least in theory.
Shor’s algorithm allows large numbers to be factored
into their component prime factors quickly.
In reality, existing quantum computers do not have nearly
enough memory to factor interesting numbers using Shor’s algorithm, despite
decades of research.
A new paper provides a major step
in that direction, however. While still impractical on today’s quantum
computers, the recent discovery
cuts the amount of memory needed to attack 256-bit elliptic-curve cryptography
by a factor of 20. More interesting, however, is that the researchers chose to
publish a zero-knowledge proof demonstrating that they know a quantum circuit
that shows these improvements, rather than publishing the actual
knowledge of how to do it.

The Human Infrastructure: How Netflix Built the Operations Layer Behind Live at Scale

Post Syndicated from Netflix Technology Blog original https://netflixtechblog.com/the-human-infrastructure-how-netflix-built-the-operations-layer-behind-live-at-scale-33e2a311c597

By: Brett Axler, Casper Choffat, and Alo Lowry

In the three years since our first Live show, Chris Rock: Selective Outrage, we have witnessed an incredible expansion of our live content slate and the live operations that support it. From modest beginnings of streaming just one show per month, we are now capable of streaming over nine shows in a single day, reaching tens of millions of concurrent members. This post pulls back the curtain on the Live Operations teams that enable this rapid scale.

Humble Beginnings

In March 2023, the engineers who built Netflix’s first live streaming pipeline also operated it. There was no dedicated operations team or formal command center. All of our incident response playbooks were written for SVOD, and SLAs were not designed for the speed of live. For the first live shows on the platform, the engineers who designed what is described in earlier parts of this series monitored dashboards on laptops, coordinated over Slack, and troubleshot in real time while millions of members watched.

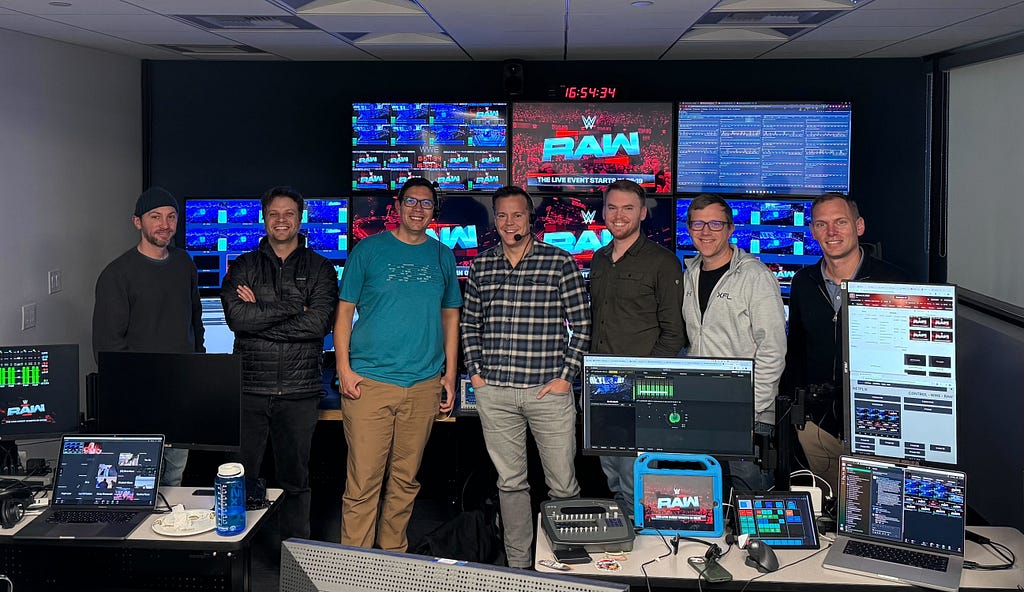
The physical setup matched the operational workflows: improvised. Temporary control rooms were put together in conference rooms. For larger events, Netflix rented third-party broadcast facilities, hardware control panels, multiviewers, and communication panels — the kind of infrastructure that established broadcast networks had built over decades. Every show was a team effort. Engineers and leadership at all levels were involved in every event. Each live show, regardless of size, was a massive effort to launch.

Netflix’s Early Live Operations

Last month, in March 2026, Netflix streamed the World Baseball Classic live to members in Japan. 47 matches over two weeks, with peak concurrent viewership exceeding 9.6 million accounts for a single game, operations running 24/7 from permanent facilities in Los Gatos and Los Angeles, with international coverage extending to Tokyo. In March alone, Netflix launched approximately 70 live events. That is three events shy of the total number Netflix streamed live in all of 2024. The technical systems that make this possible have been covered in detail across this series. What hasn’t been told is the operational story: the people, procedures, and facilities Netflix built to run those systems in real time, under pressure, with no ability to pause or roll back.

The Architecture of Live Operations

The Architecture of Live Operations: Evolving the Broadcast Operations Center

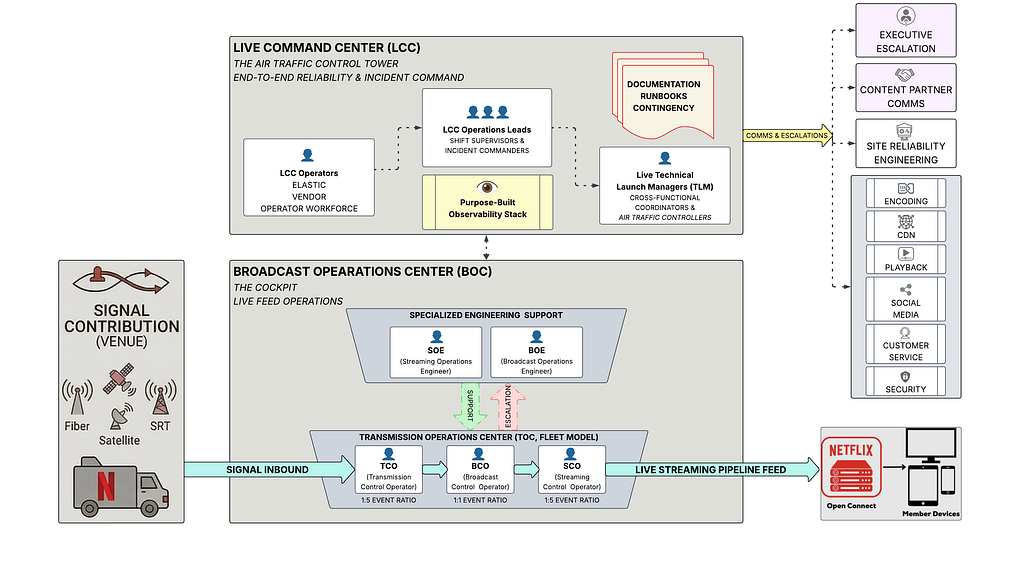
When a technology company transitions into live broadcasting, it faces a unique challenge: blending traditional broadcast television practices with massive-scale live-streaming engineering. At the heart of this intersection is the Broadcast Operations Center (BOC).

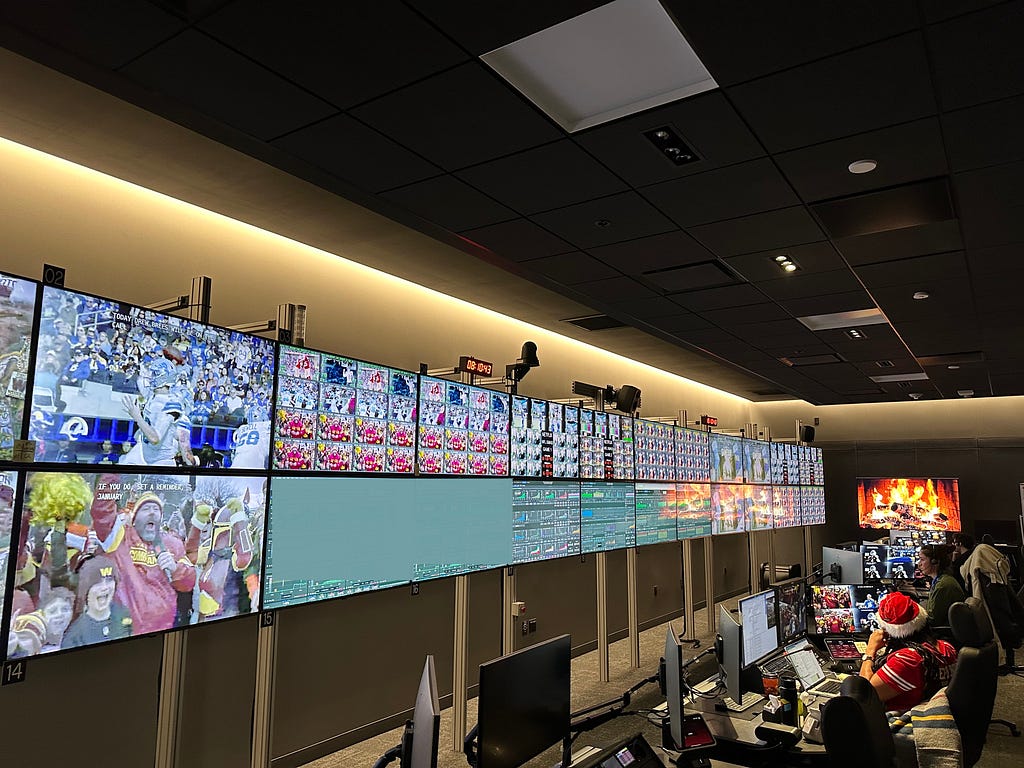
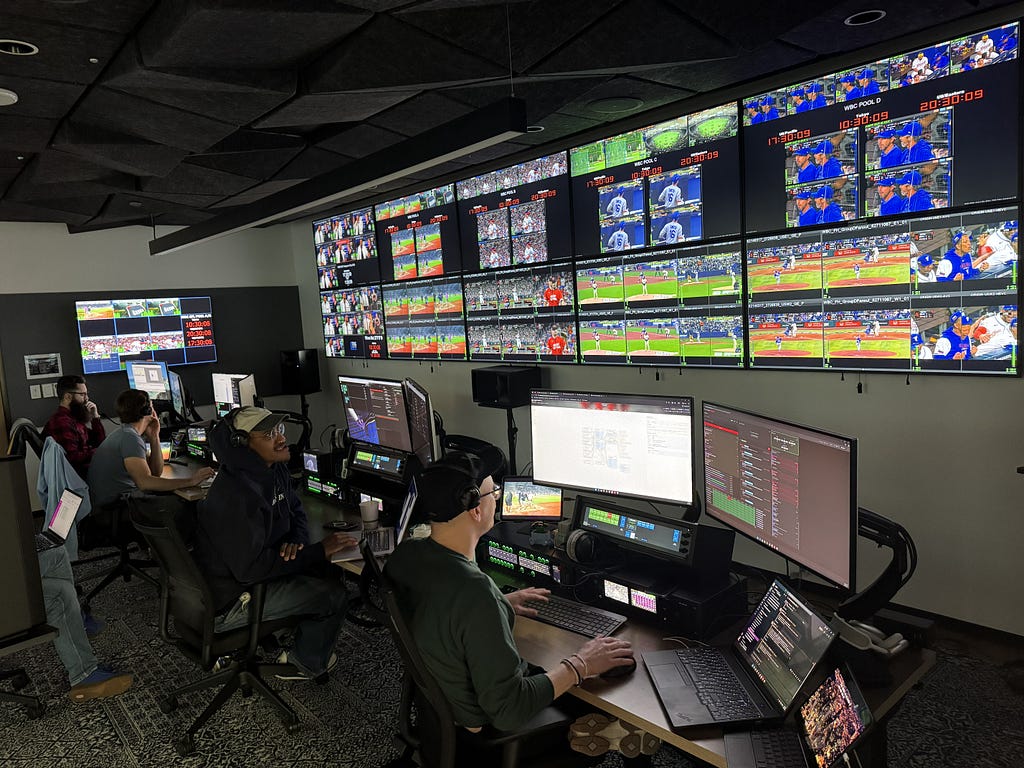
The Transmission Operations Center in Los Angeles

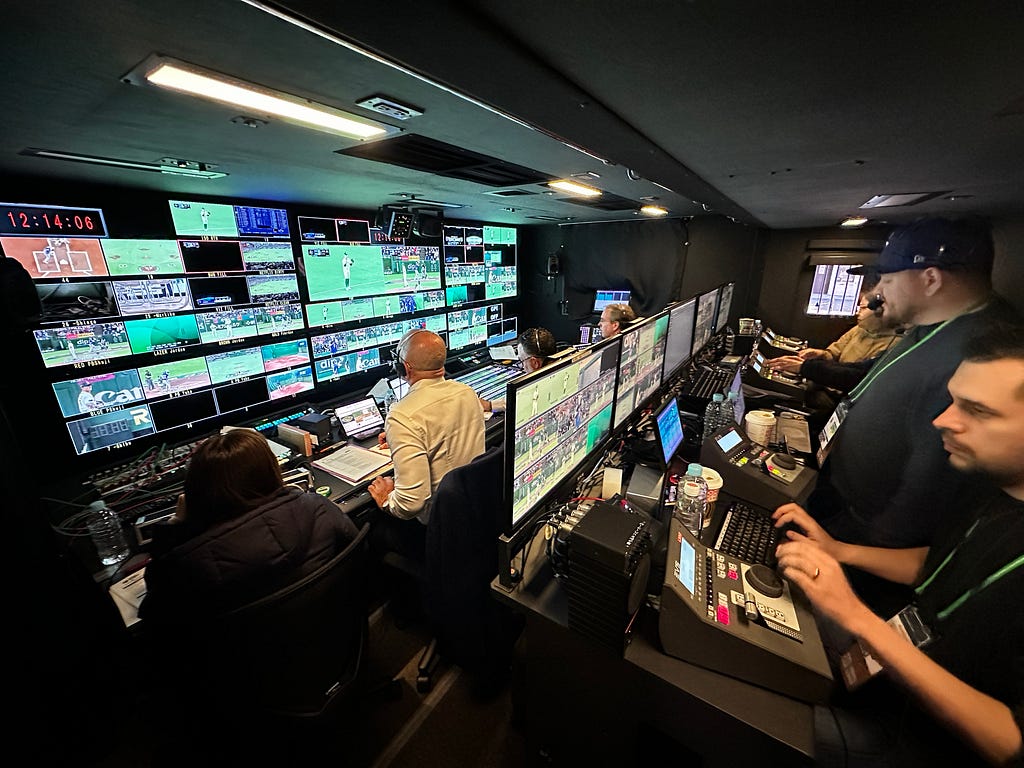
The BOC serves as the critical “cockpit” for live events. It is the physical command center where a fully produced video feed is received directly from a stadium or venue and then handed off to the live streaming infrastructure. Everything from signal ingest, inspection, and conditioning to closed-captioning, graphics insertion, and ad management happens within these walls. By utilizing a hub-and-spoke model with highly redundant architectures, such as dual internet circuits and SMPTE 2022–7 seamless switching technologies, the BOC replaces direct, vulnerable paths from the venue to the live streaming pipeline, making each live event highly repeatable and far less dependent on the quirks of individual event locations.

Securing the Signal: Reliability from the Venue Before the BOC can work its magic, we have to guarantee the video and audio feeds actually survive the journey from the production site to our facility. To ensure absolute reliability from the venue, Netflix enforces strict specifications for live signal contribution.

For any show-critical feed, meaning the primary feed our members will watch live, we require three completely discrete transmission paths. We utilize a strict hierarchy of approved transmission methods, prioritizing dedicated video fiber and single-feed satellite links, followed by dedicated enterprise-grade internet and robust SRT contribution systems.

We don’t just rely on redundant transport lines; we require full hardware redundancy out of the production truck itself. This includes using separate router line cards and discrete transmission hardware to prevent any single point of failure. Furthermore, every single piece of transmission hardware at the venue must be powered by two discrete power sources, protected by uninterruptible power supply (UPS) batteries, and surge-conditioned.

Finally, before we ever go live to millions of viewers, our operators execute exhaustive “FACS/FAX” (facilities checks) testing during rehearsals and before every show. This involves running specialized Audio/Video sync tests, latency tests, and quality tests to guarantee perfect audio and video synchronization, validating closed captions, and touring the backup switcher inputs.

Building the Human Infrastructure: Building the human operational model to run a facility like the BOC didn’t happen overnight. For a platform scaling from its very first live comedy special to streaming over 400 global events a year, the operational strategy had to undergo a massive, multi-year evolution.

Phase 1: The “All-Hands” Engineering Era. In the earliest days of live streaming, there was no dedicated operations team or formal broadcast operations center. The software engineers who wrote the code and built the live-streaming infrastructure were the same people manually operating the events on launch night. Every show was an “all-hands-on-deck” scenario. While this raw, startup-style approach worked for initial milestones, having core developers manually set up and tear down software configurations for every single broadcast was fundamentally incapable of scaling.

Phase 2: The Shift to Specialized Engineering (SOEs and BOEs). To separate event execution from core software development, the operational model matured to introduce specialized engineering teams. First, the Streaming Operations Engineering (SOE) team was established. These are highly skilled streaming engineers whose sole focus is to configure the full event on the live pipeline and support it during the broadcast. By having SOEs act as the first line of escalation, the core software developers were freed up to focus on building new live-streaming pipeline features.

However, as the physical broadcast facilities grew, it became clear that supporting the streaming pipeline wasn’t enough; the physical broadcast hardware and facility workflows needed dedicated oversight too. To solve this, Broadcast Operations Engineers (BOEs) were introduced to work alongside the SOEs. The BOE acts as the primary escalation point for all physical broadcast facility and hardware issues, overseeing the operation of all shows during a given shift.

Phase 3: The “Co-Pilot” Control Room Model. With specialized engineers in place to handle the deep technical infrastructure, the day-to-day operation of the actual video and audio feeds was handed over to dedicated operators. Initially, the Broadcast Control Rooms were structured much like an airplane cockpit.

This approach utilized a “first and second captain” workflow, pairing two Broadcast Control Operators (BCOs) together to run a single event, functioning exactly like a pilot and co-pilot. This collaborative model allowed for intense focus and high-quality execution, making it the ideal setup for running just one or two live events per day. However, as the ambition grew to stream up to 10 concurrent events a day for massive global tournaments, a 1:1 scale of pairing operators simply required too much space and manpower. A new model had to be adopted.

Phase 4: The Transmission Operations Center (TOC) Fleet Model. To manage high-density event days and continuous tournament coverage, the workflow was completely reimagined with the launch of the Transmission Operations Center (TOC) model. Rather than treating every live broadcast as an isolated launch in its own room, the TOC treats live events like a fleet. It centralizes operations and distinctly separates the traditional broadcast functions from the streaming functions to maximize human efficiency.

The TOC model divides the labor across three highly specialized, tiered roles:

  • Transmission Control Operator (TCO): The TCO is responsible for managing all inbound signals arriving from the event venues, such as fiber optic, SRT, and satellite feeds. They ensure these incoming feeds meet strict quality, latency, and operational thresholds. Thanks to centralized dashboarding, a single TCO can manage up to five events concurrently.
  • Streaming Control Operator (SCO): While the TCO handles what comes in, the SCO manages what goes out. They oversee all outbound feeds, including the streams heading to the live streaming pipeline and any syndication feeds sent to third parties for commercial distribution. Like the TCOs, SCOs can manage up to five events concurrently.
  • Broadcast Control Operator (BCO): With the inbound and outbound transmission mechanics handled by the broader TOC, the BCO is able to focus entirely on the creative and qualitative execution of the event. Operating on a strict 1:1 ratio (one operator per event), the BCO seamlessly switches between backup inbound feeds if an issue arises, ensures audio and video remain in perfect synchronization, and performs rigorous quality control. They also monitor critical metadata, such as closed captions and digital ad-insertion messages (SCTE), right before the final polished feed is handed into the live streaming pipeline.

The Big Bet Exception. While the fleet-style TOC model enables immense concurrency for daily programming, the most critical, high-visibility events, like major holiday football games, utilize a specialized Big Bet Model. For these flagship broadcasts, an entire Broadcast Operations Center is dedicated exclusively to a single event. This hyper-focused environment strips away the multi-event ratios, providing operators with advanced instrumentation and dedicated facility engineers to ensure the absolute highest level of reliability for events where failure is simply not an option.

Operational Workflow at a Glance (Courtesy of Melissa “Mouse” Merencillo)

The Live Command Center (LCC)

The Live Command Center (LCC) is not an MCR (Master Control Room). Nor is it a traditional Network Operations Center (NOC). The LCC holds the end-to-end view of quality, health metrics, and reliability for every live stream — from signal ingest at the production venue through cloud encoding, CDN delivery, and playback on member devices — and coordinates the human response when any part of that chain breaks.

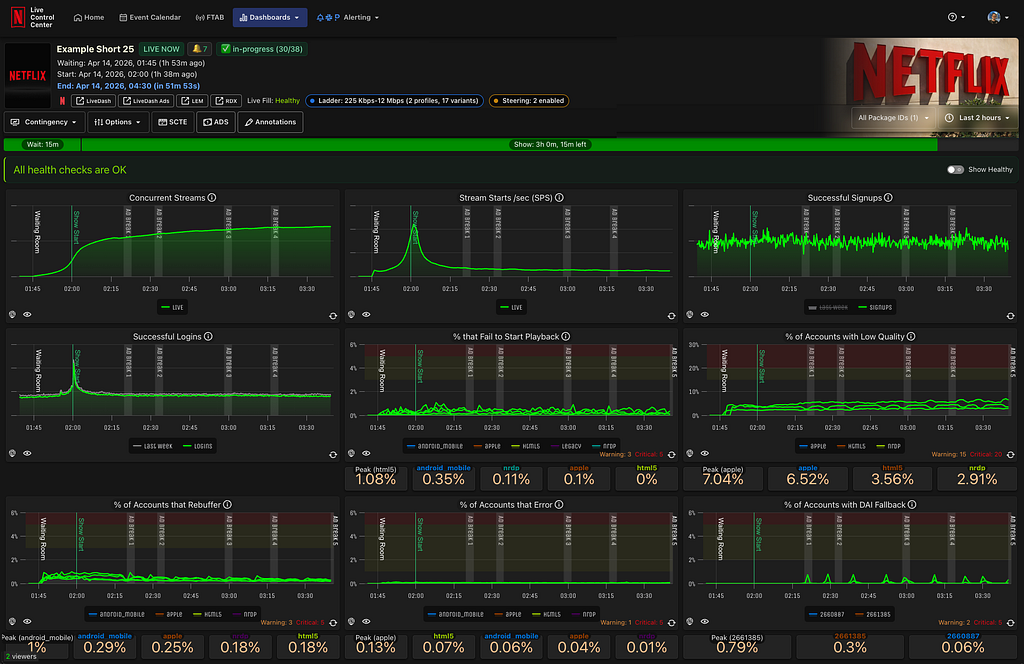
What makes this hard is the data and speed requirements. Standard monitoring tools incur propagation delays of minutes. However, during a live stream, a signal degradation that goes undetected for three minutes can affect millions of members before any mitigation begins. The LCC runs a purpose-built observability stack, the Live Control Center, that aggregates telemetry from across the entire pipeline in near real time: concurrent viewer counts, start failure rates, rebuffer ratios, CDN health, encoder status, and signal path health from the contribution feed forward.

Live Control Center (Courtesy of Chris Carey)

During live events, the system ingests up to 38 million events per second. The LCC’s job is to make that volume of data meaningful and actionable for the small team of operators watching it live.

Two roles staff the LCC leading up to and during live events. LCC Operations Leads are the shift supervisors and incident commanders. They triage anomalies, make escalation decisions, and own the incident response process from detection through resolution.

Live Technical Launch Managers (TLMs) function as air traffic controllers: they maintain cross-functional context across more than 45 technical, product, and services teams from encoding, CDN, and playback to social media, customer service, and security teams. TLMs start coordinating with these teams months and sometimes years ahead of a live event to ensure escalation paths and playbooks are in place when the LCC needs to translate a CDN engineer’s concern into a product decision at 2am while a game is still in progress. Together, these roles form the operational leadership layer that keeps engineers focused on building rather than watching dashboards.

The live operations teams rank shows by three categories:

  • Low-Profile Events: These are lightweight, often lack new features, and anticipate low viewership. They are typically managed with a small team of 1–2 operators and automated alerting.
  • High-Profile Events: These are mid-tier events that warrant more attention due to their size, unique features, or anticipated viewership.
  • Big Bet Events: These represent the highest operational weight, such as an NFL game, with massive viewership expectations and special features. They require the full support of the LCC: a fully staffed physical operations room for the entire duration, active incident command structures, and key engineering teams on standby to support their specific product areas.

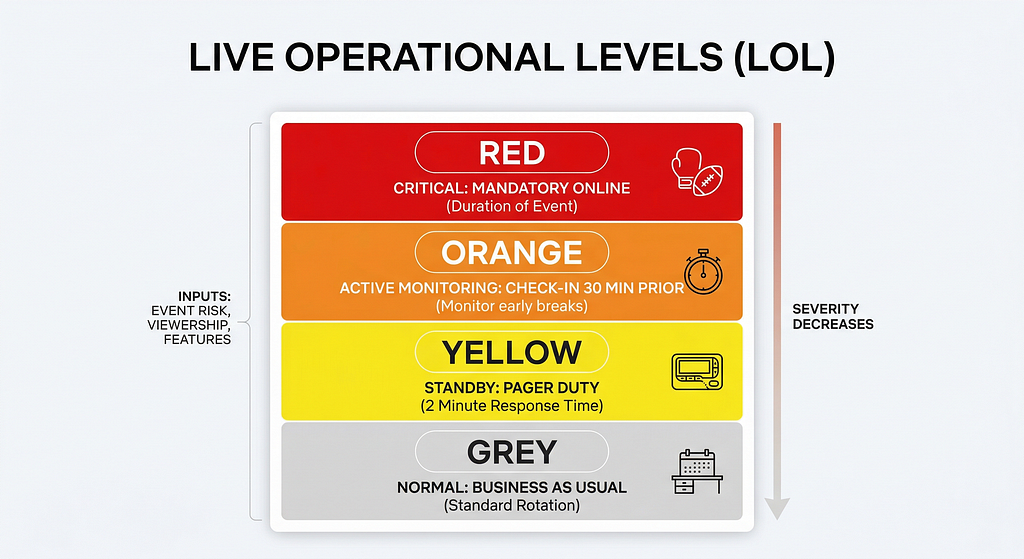
In addition to a show’s event category, the TLMs deployed a Live Operational Level (LOL) model that helps engineers determine whether they need to be on standby, live online, or even in the LCC for any given show.

Based on the show’s event category, special features, expected viewership, and overall risk, non-operational teams are put into one of four categories:

Red: Non-operational teams must remain online for the duration of the event. This is most often seen in large boxing matches and sporting events, such as the NFL Christmas Day games.

Orange: Non-operational teams are required to check in online ~30 minutes prior to show and are asked to monitor the health of their systems through the first commercial breaks until the LCC releases them to LOL Yellow.

Yellow: Non-operational teams are not required to be online, but should be reachable by page in 2 minutes. Special PagerDuty rotations and verifications are in place to ensure these teams are reachable.

Grey: Business as usual. Teams will be reached out to by their normal pager rotation if their help is needed during the show.

Visual Representation of LOL Levels (Courtesy of Gemini Nano Banana Pro)

By tiering events, Netflix ensures that resource allocation is proportionate to operational needs, preventing a continuous “crisis” mentality and allowing our non-operational partners to focus on their day jobs.

As of April 2026, most engineering teams are Yellow or Grey, with Ops and Site Reliability Engineers making up most of the teams online to support shows, in addition to engineers performing feature tests.

Building the Model

The first lesson from 2023 was straightforward: what worked for one show a month would not work for ten shows a week. The engineers who built the pipeline were also the ones operating it, which meant the people best positioned to fix problems were also the ones most likely to be paged at 2am. There was no operational layer to absorb that load.

In 2024, Netflix streamed 72 live events and began building the team that would eventually run them. The first version of the LCC looked nothing like it does today: a cluster of desks, monitors on stands, and laptops running dashboards, set up in the middle of the office. The TLM team was stood up to own cross-functional coordination for live launches and began formalizing the runbooks, event tiering structure, and incident management protocols that would later enable Netflix to scale operations to support hundreds of shows per year.

By the time Jake Paul vs. Mike Tyson and the first NFL Christmas Games arrived, the LCC had moved into a dedicated conference room, and partnerships with device and labs teams were producing more effective monitoring tools. But the biggest operational lesson of that period came from communications.

For Tyson/Paul, Netflix had over 300 people online across engineering, product, and business functions. Some people were online because their support was needed, while many others were just excited to be part of it. Coordinating that many people over Slack and Zoom during an active event with 64 million concurrent streams was unmanageable.

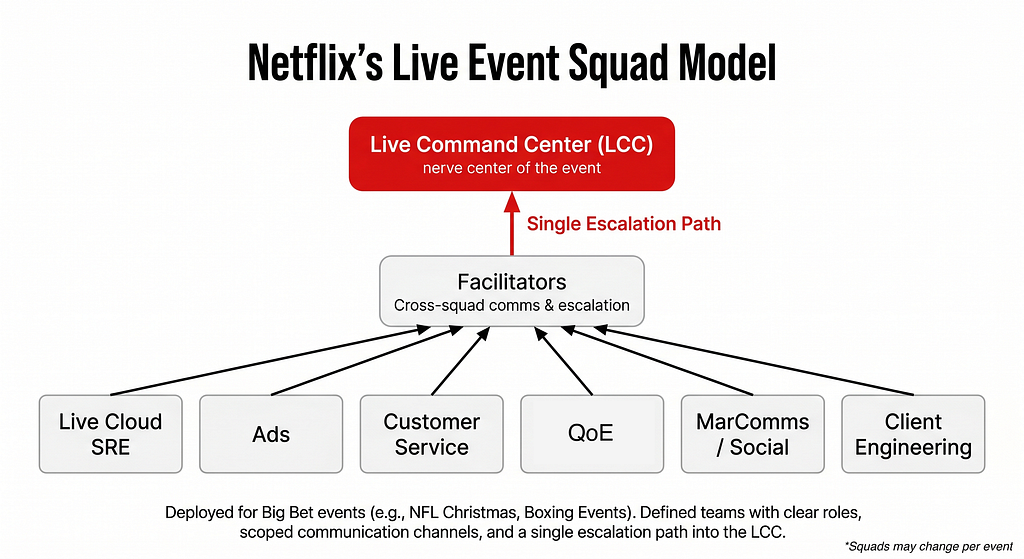
That experience drove the implementation of a squad model: defined teams with clear roles, scoped communication channels, and a single escalation path into the LCC. Around the same time, the LCC began integrating with IP-based communications systems, finally bridging the gap between the command center and the Broadcast Operations Center that had been operating largely in a fractured parallel until then.

Visual Representation of Squad Operations Model (Courtesy of Gemini Nano Banana Pro)

2025 brought 220 live events and a permanent LCC facility, along with a dedicated operations team, the Live Command Center Operations Leads. With the growing number of shows, TLMs were getting spread thin, spending more than half their week operating shows late into the evening and over weekends, then getting called back into the office at 9 am to lead critical launch meetings. The addition of the LCC Ops Leads resolved the bandwidth issue by separating planning and operations into distinct roles within a single centralized team.

As the slate continued to grow and large series like the World Baseball Classic and FIFA Women’s World Cup were announced, the vendor-operator model was introduced, creating an elastic workforce that could scale up for large series events without carrying full-time headcount year-round to support peak capacity. The key enabler was documentation: standardized runbooks and onboarding materials detailed enough that a trained operator could reach full effectiveness within their first week. WWE RAW became a weekly operation, normalizing what had previously felt exceptional. By early 2026, multi-event days were no longer a test of capacity but had become the expected operating condition.

The next chapter is international. Netflix has begun standing up regional Live Operations Center coverage to support live events outside North America, with EMEA operations soon running out of London. The model draws on the same runbooks, tooling, and escalation structures developed in Los Gatos, with follow-the-sun shift handoffs connecting EMEA and US teams across time zones. Looking further ahead, Netflix is planning to bring the LCC and BOC under one roof — a single integrated facility that combines broadcast operations and cloud monitoring into a unified space. The physical separation between those two functions has always introduced friction at the seams. Closing it is the logical next step.

Operational Principles for Live at Scale

Building a live operations discipline means accepting one constraint above all others: you cannot optimize for efficiency before you have built for reliability.

Netflix designed for quality first: Standardized runbooks, tiered event structures, pre-documented failure modes, so the 50th show runs as smoothly as the fifth. Off-the-shelf monitoring tools with propagation delays don’t meet that bar. The Netflix Live Control Center and Live Control Room platforms exist because observability at live scale is a product decision that demands the same design rigor as the pipeline it monitors, turning millions of telemetry events per second into something a small team can act on in real time. Technical systems and human systems have to scale together, and the most reliable incident response plan is always the one written before anyone needs it.

The operational model is also a cultural one. Bringing contingent operators into a proprietary tech stack requires deliberate onboarding design. The vendor model only works when documentation is built to be followed confidently by someone new within their first week. Beyond process, the most durable parts of how Netflix runs live operations reflect something the Netflix culture memo makes explicit: the best ideas come from anywhere. In practice, that means frontline operators catching issues that engineers miss, vendor staff surfacing workflow friction that improves the system for everyone who follows, and a team that treats candid feedback as standard practice rather than an exception. The technology, the slate, and the scale keep changing. The discipline stays current by staying curious and iterating on the tools, the runbooks, and the team.

Conclusion: What’s Next

With 2026 already off to a successful start in operational scaling, we’re excited to shift our focus to the upcoming launch of our new Live Broadcast Operations Center in Los Angeles and our new Live Operations Center (LOC) in West London. The LOC will initiate Netflix’s follow-the-sun coverage as live content continues to grow with over 400 live events in 2026, including the launch of 24/7 linear free-to-air broadcast channels with TF1 this summer. On the technical front, further development of automated alerting tools and monitoring by exception will continue to reduce operations’ manual workload.

In 2023, the engineers led the operations. By 2026, they had developed systems that mostly ran themselves, with a dedicated operational team ensuring they operated smoothly for millions of members. The technology behind Netflix’s Live content has been documented throughout this series, but what runs alongside the tech stack is a set of operational principles, rehearsed incident management processes, and monitoring infrastructure that had to be created from scratch and continues to develop.

A special thanks to Te-Yuan Huang, Rob Saltiel, Tara Kozuback, Chris Carey, Di Li, Patrick Li, Anne Aaron, and Melissa “Mouse” Merencillo for their support on this article.


The Human Infrastructure: How Netflix Built the Operations Layer Behind Live at Scale was originally published in Netflix TechBlog on Medium, where people are continuing the conversation by highlighting and responding to this story.

[$] The 7.0 scheduler regression that wasn’t

Post Syndicated from corbet original https://lwn.net/Articles/1067029/

One of the more significant changes in the 7.0 kernel release is to use the lazy-preemption mode by default in the CPU
scheduler. The scheduler developers have wanted to reduce the number of
preemption modes for years, and lazy preemption looks like a step toward
that goal. But then there came this report
from Salvatore Dipietro that lazy preemption caused a 50% performance
regression on a PostgreSQL benchmark. Investigation showed that the
situation is not actually so grave, but the episode highlights just how
sensitive some workloads can be to configuration changes; there may be
surprises in store for other users as well.

Security updates for Friday

Post Syndicated from jzb original https://lwn.net/Articles/1068400/

Security updates have been issued by AlmaLinux (.NET 8.0, .NET 9.0, freerdp, libarchive, and thunderbird), Debian (chromium, openssh, and thunderbird), Fedora (aurorae, bluedevil, breeze-gtk, buildah, cockpit, extra-cmake-modules, flatpak-kcm, grub2-breeze-theme, kactivitymanagerd, kcm_wacomtablet, kde-cli-tools, kde-gtk-config, kdecoration, kdeplasma-addons, kf6, kf6-attica, kf6-baloo, kf6-bluez-qt, kf6-breeze-icons, kf6-frameworkintegration, kf6-kapidox, kf6-karchive, kf6-kauth, kf6-kbookmarks, kf6-kcalendarcore, kf6-kcmutils, kf6-kcodecs, kf6-kcolorscheme, kf6-kcompletion, kf6-kconfig, kf6-kconfigwidgets, kf6-kcontacts, kf6-kcoreaddons, kf6-kcrash, kf6-kdav, kf6-kdbusaddons, kf6-kdeclarative, kf6-kded, kf6-kdesu, kf6-kdnssd, kf6-kdoctools, kf6-kfilemetadata, kf6-kglobalaccel, kf6-kguiaddons, kf6-kholidays, kf6-ki18n, kf6-kiconthemes, kf6-kidletime, kf6-kimageformats, kf6-kio, kf6-kirigami, kf6-kitemmodels, kf6-kitemviews, kf6-kjobwidgets, kf6-knewstuff, kf6-knotifications, kf6-knotifyconfig, kf6-kpackage, kf6-kparts, kf6-kpeople, kf6-kplotting, kf6-kpty, kf6-kquickcharts, kf6-krunner, kf6-kservice, kf6-kstatusnotifieritem, kf6-ksvg, kf6-ktexteditor, kf6-ktexttemplate, kf6-ktextwidgets, kf6-kunitconversion, kf6-kuserfeedback, kf6-kwallet, kf6-kwidgetsaddons, kf6-kwindowsystem, kf6-kxmlgui, kf6-modemmanager-qt, kf6-networkmanager-qt, kf6-prison, kf6-purpose, kf6-qqc2-desktop-style, kf6-solid, kf6-sonnet, kf6-syndication, kf6-syntax-highlighting, kf6-threadweaver, kgamma, kglobalacceld, kinfocenter, kmenuedit, knighttime, kpipewire, krdp, kscreen, kscreenlocker, ksshaskpass, ksystemstats, kwayland, kwayland-integration, kwin, kwin-x11, kwrited, layer-shell-qt, libexif, libkscreen, libksysguard, libplasma, nix, ocean-sound-theme, oxygen-sounds, pam-kwallet, plasma-activities, plasma-activities-stats, plasma-breeze, plasma-browser-integration, plasma-desktop, plasma-dialer, plasma-discover, plasma-disks, plasma-drkonqi, plasma-firewall, plasma-integration, plasma-keyboard, plasma-login-manager, plasma-milou, plasma-mobile, plasma-nano, plasma-nm, plasma-oxygen, plasma-pa, plasma-print-manager, plasma-sdk, plasma-setup, plasma-systemmonitor, plasma-systemsettings, plasma-thunderbolt, plasma-vault, plasma-welcome, plasma-workspace, plasma-workspace-wallpapers, plasma-workspace-x11, plasma5support, plymouth-kcm, plymouth-theme-breeze, podman, polkit-kde, powerdevil, qqc2-breeze-style, sddm-kcm, skopeo, spacebar, spectacle, thunderbird, and xdg-desktop-portal-kde), Mageia (cockpit-338), Oracle (capstone, cockpit, firefox, fontforge, freerdp, golang-github-openprinting-ipp-usb, kernel, nghttp2, nodejs:20, nodejs:24, openexr, and squid), Red Hat (gnutls, libarchive, libpng, libpng12, libpng15, libtiff, libvpx, libxslt, multiple packages, python, python3, python3.11, python3.12, and python3.9), Slackware (libxml2), SUSE (apache-pdfbox, azure-storage-azcopy, corosync, cups, freerdp, iproute2, libsdb2_4_2, libtpms, NetworkManager, openssl-1_1, ovmf, plexus-utils, python, python-CairoSVG, python-jwcrypto, python-PyJWT, python-pyOpenSSL, python-urllib3, python3, python314, rust1.93, shim, smc-tools, terraform-provider-local, terraform-provider-random, terraform-provider-tls, thunderbird, tiff, util-linux, and vim), and Ubuntu (libowasp-esapi-java, linux, linux-aws, linux-aws-5.15, linux-gcp, linux-gke, linux-gkeop, linux-lowlatency, linux-lowlatency-hwe-5.15, linux-nvidia, linux-oracle, linux, linux-aws, linux-aws-6.8, linux-gcp, linux-gke, linux-gkeop, linux-ibm, linux-lowlatency, linux-lowlatency-hwe-6.8, linux, linux-realtime, linux-aws-fips, linux-fips, linux-gcp-fips, linux-fips, linux-gcp-fips, linux-gcp, linux-gcp-6.17, linux-hwe-5.15, linux-intel-iot-realtime, linux-realtime, linux-nvidia, linux-nvidia-6.8, linux-nvidia-lowlatency, linux-nvidia-tegra, linux-nvidia-tegra, linux-nvidia-tegra-igx, linux-realtime, linux-realtime-6.8, linux-realtime-6.17, ofono, and ruby-rack).

Introducing the Agent Readiness score. Is your site agent-ready?

Post Syndicated from André Jesus original https://blog.cloudflare.com/agent-readiness/

The web has always had to adapt to new standards. It learned to speak to web browsers, and then it learned to speak to search engines. Now, it needs to speak to AI agents.

Today, we are excited to introduce isitagentready.com — a new tool to help site owners understand how they can make their sites optimized for agents, from guiding agents on how to authenticate, to controlling what content agents can see, the format they receive it in, and how they pay for it. We are also introducing a new dataset to Cloudflare Radar that tracks the overall adoption of each agent standard across the Internet.


We want to lead by example. That is why we are also sharing how we recently overhauled Cloudflare’s Developer Documentation to make it the most agent-friendly documentation site, allowing AI tools to answer questions faster and significantly cheaper.

How agent-ready is the web today?

The short answer: not very. This is expected, but also shows how much more effective agents can be than they are today, if standards are adopted.

To analyze this, Cloudflare Radar took the 200,000 most visited domains on the Internet; filtered out categories where agent readiness isn’t important (like redirects, ad-servers, and tunneling services) to focus on businesses, publishers, and platforms that AI agents might realistically need to interact with; and scanned them using our new tool.

The result is a new “Adoption of AI agent standards” chart that can now be found in the Cloudflare Radar AI Insights page where we can measure adoption of each standard across multiple domain categories.


Looking at individual checks, a few things stood out:

  • robots.txt is nearly universal — 78% of sites have one — but the vast majority are written for traditional search engine crawlers, not AI agents.

  • Content Signals: 4% of sites have declared their AI usage preferences in robots.txt. This is a new standard that is gaining momentum.

  • Markdown content negotiation (serving text/markdown on Accept: text/markdown) passes on 3.9% of sites.

  • New emerging standards like MCP Server Cards and API Catalogs (RFC 9727) together appear on fewer than 15 sites in the entire dataset. It’s still early — there is lots of opportunity to stand out by being one of the first sites to adopt new standards and work well with agents. 

This chart will be updated weekly, and the data can also be accessed through the Data Explorer or the Radar API.

Get an agent readiness score for your site

You can get an agent readiness score for your own website by going to isitagentready.com and entering the site’s URL.

Scores and audits that provide actionable feedback have helped to drive adoption of new standards before. For example, Google Lighthouse scores websites on performance and security best practices, and guides site owners to adopt the latest web platform standards. We think something similar should exist to help site owners adopt best practices for agents.

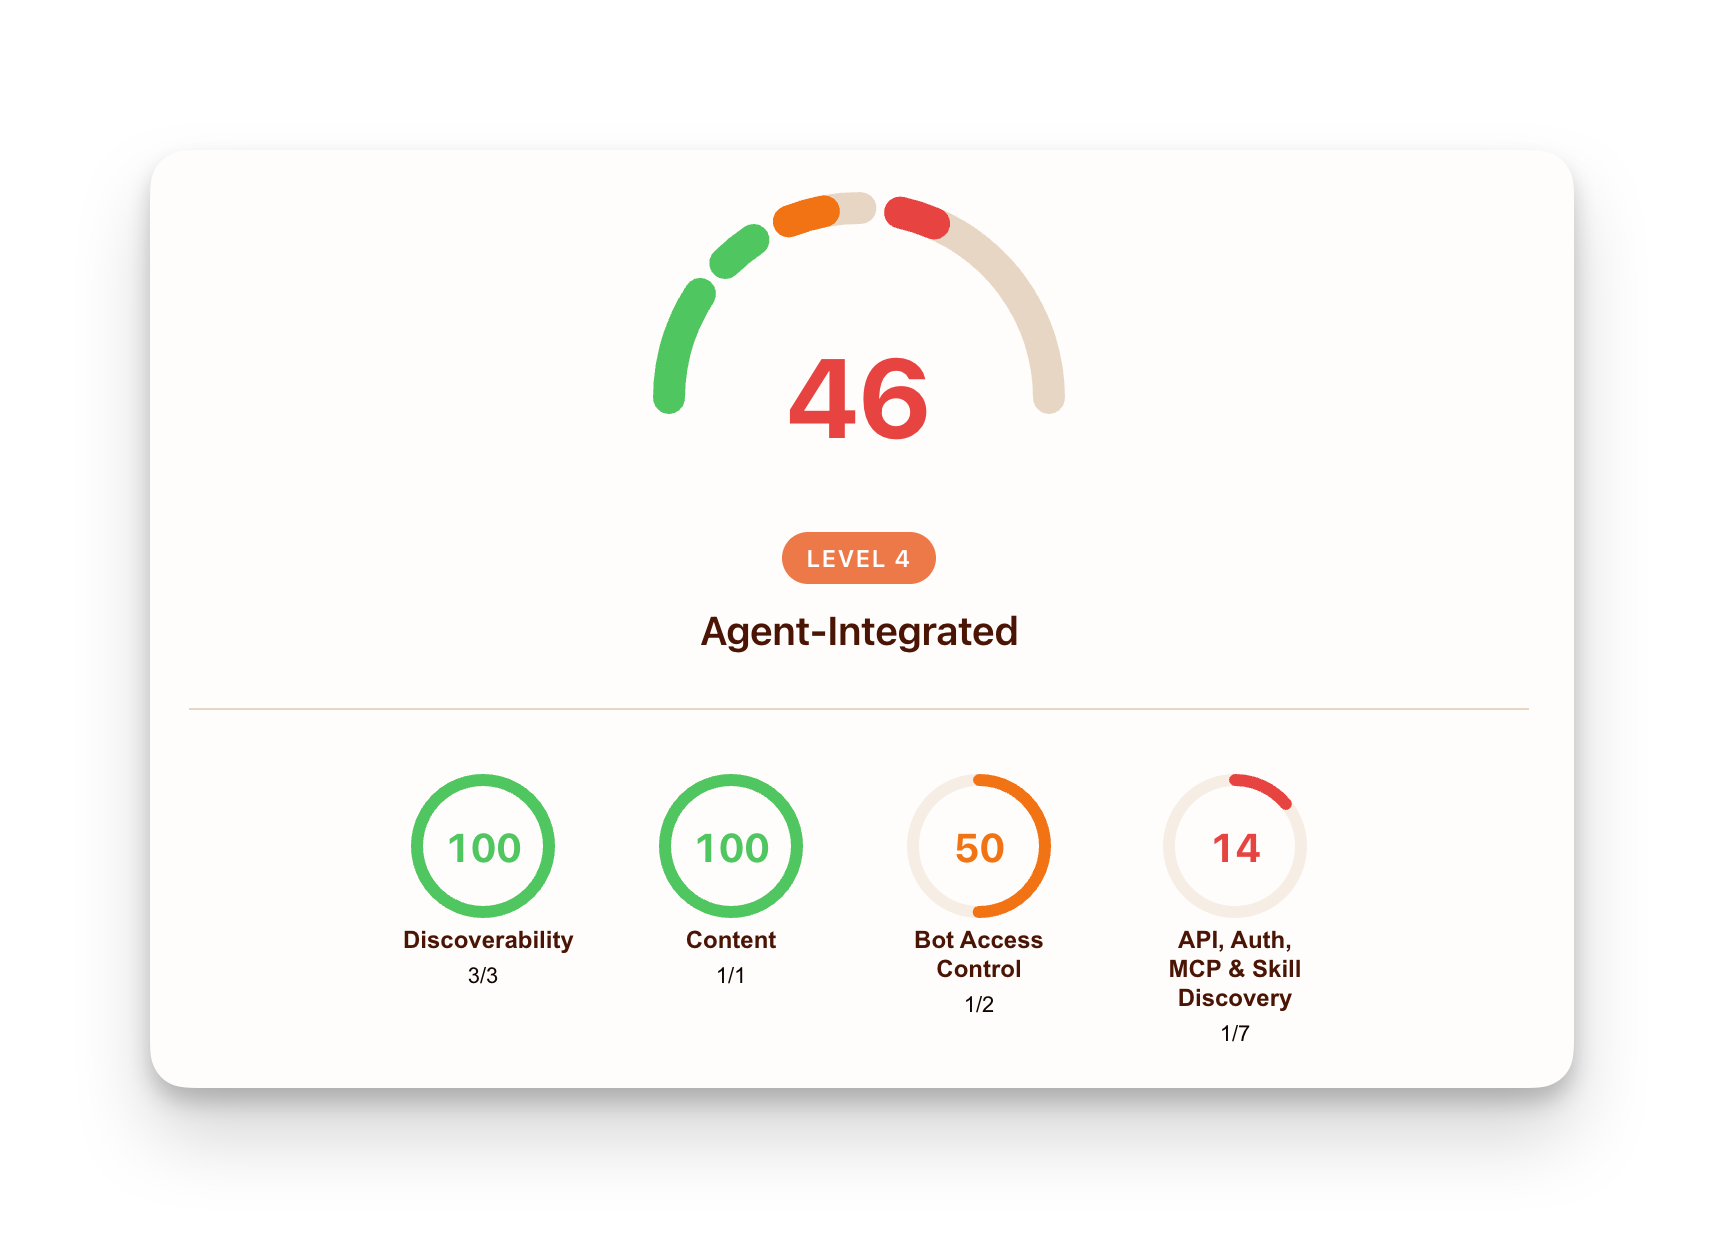
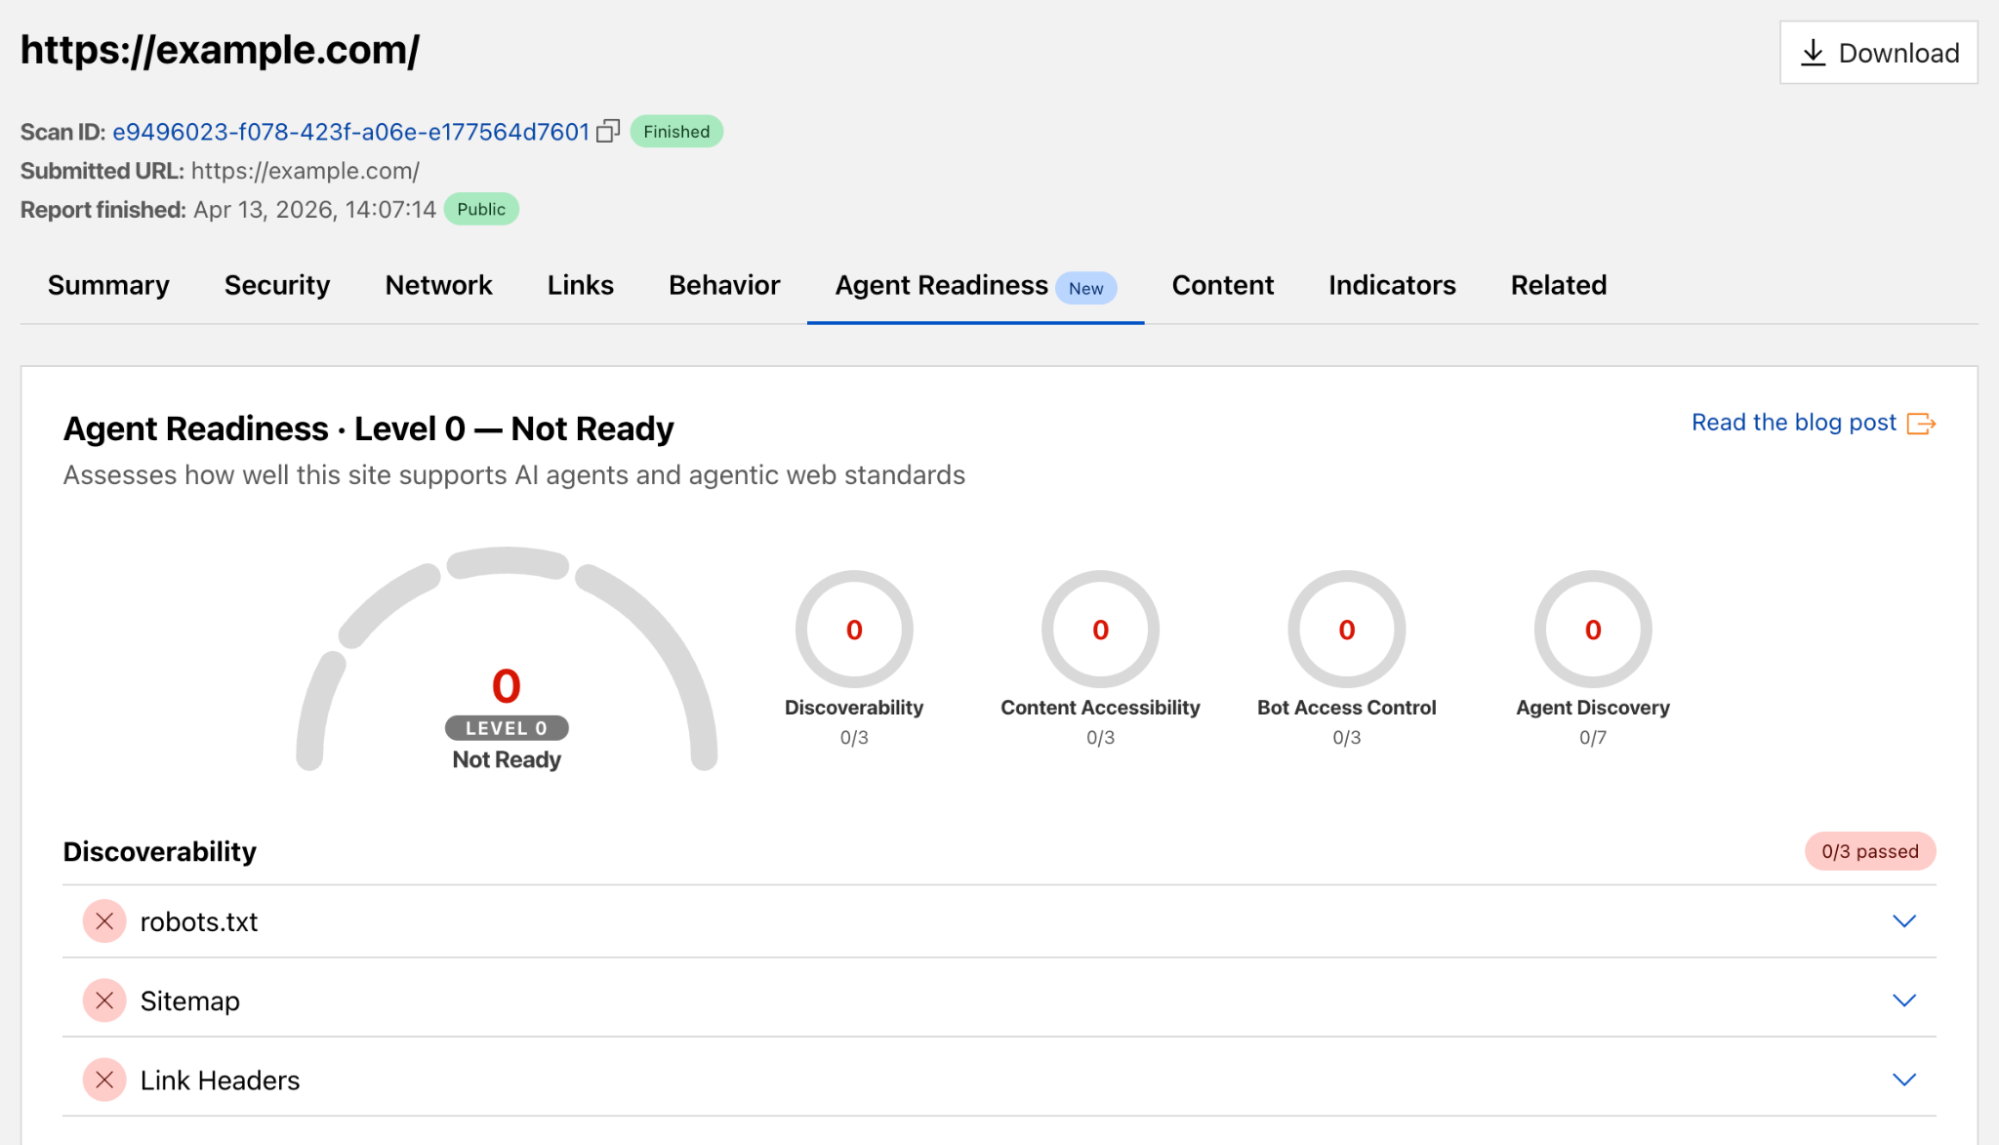
When you enter your site, Cloudflare makes requests to it to check which standards it supports, and provides a score based on four dimensions:


Screenshot of results from an agent-readiness check for an example website.

Additionally, we check if the site supports agentic commerce standards including x402, Universal Commerce Protocol, and Agentic Commerce Protocol, but these do not currently count towards the score.

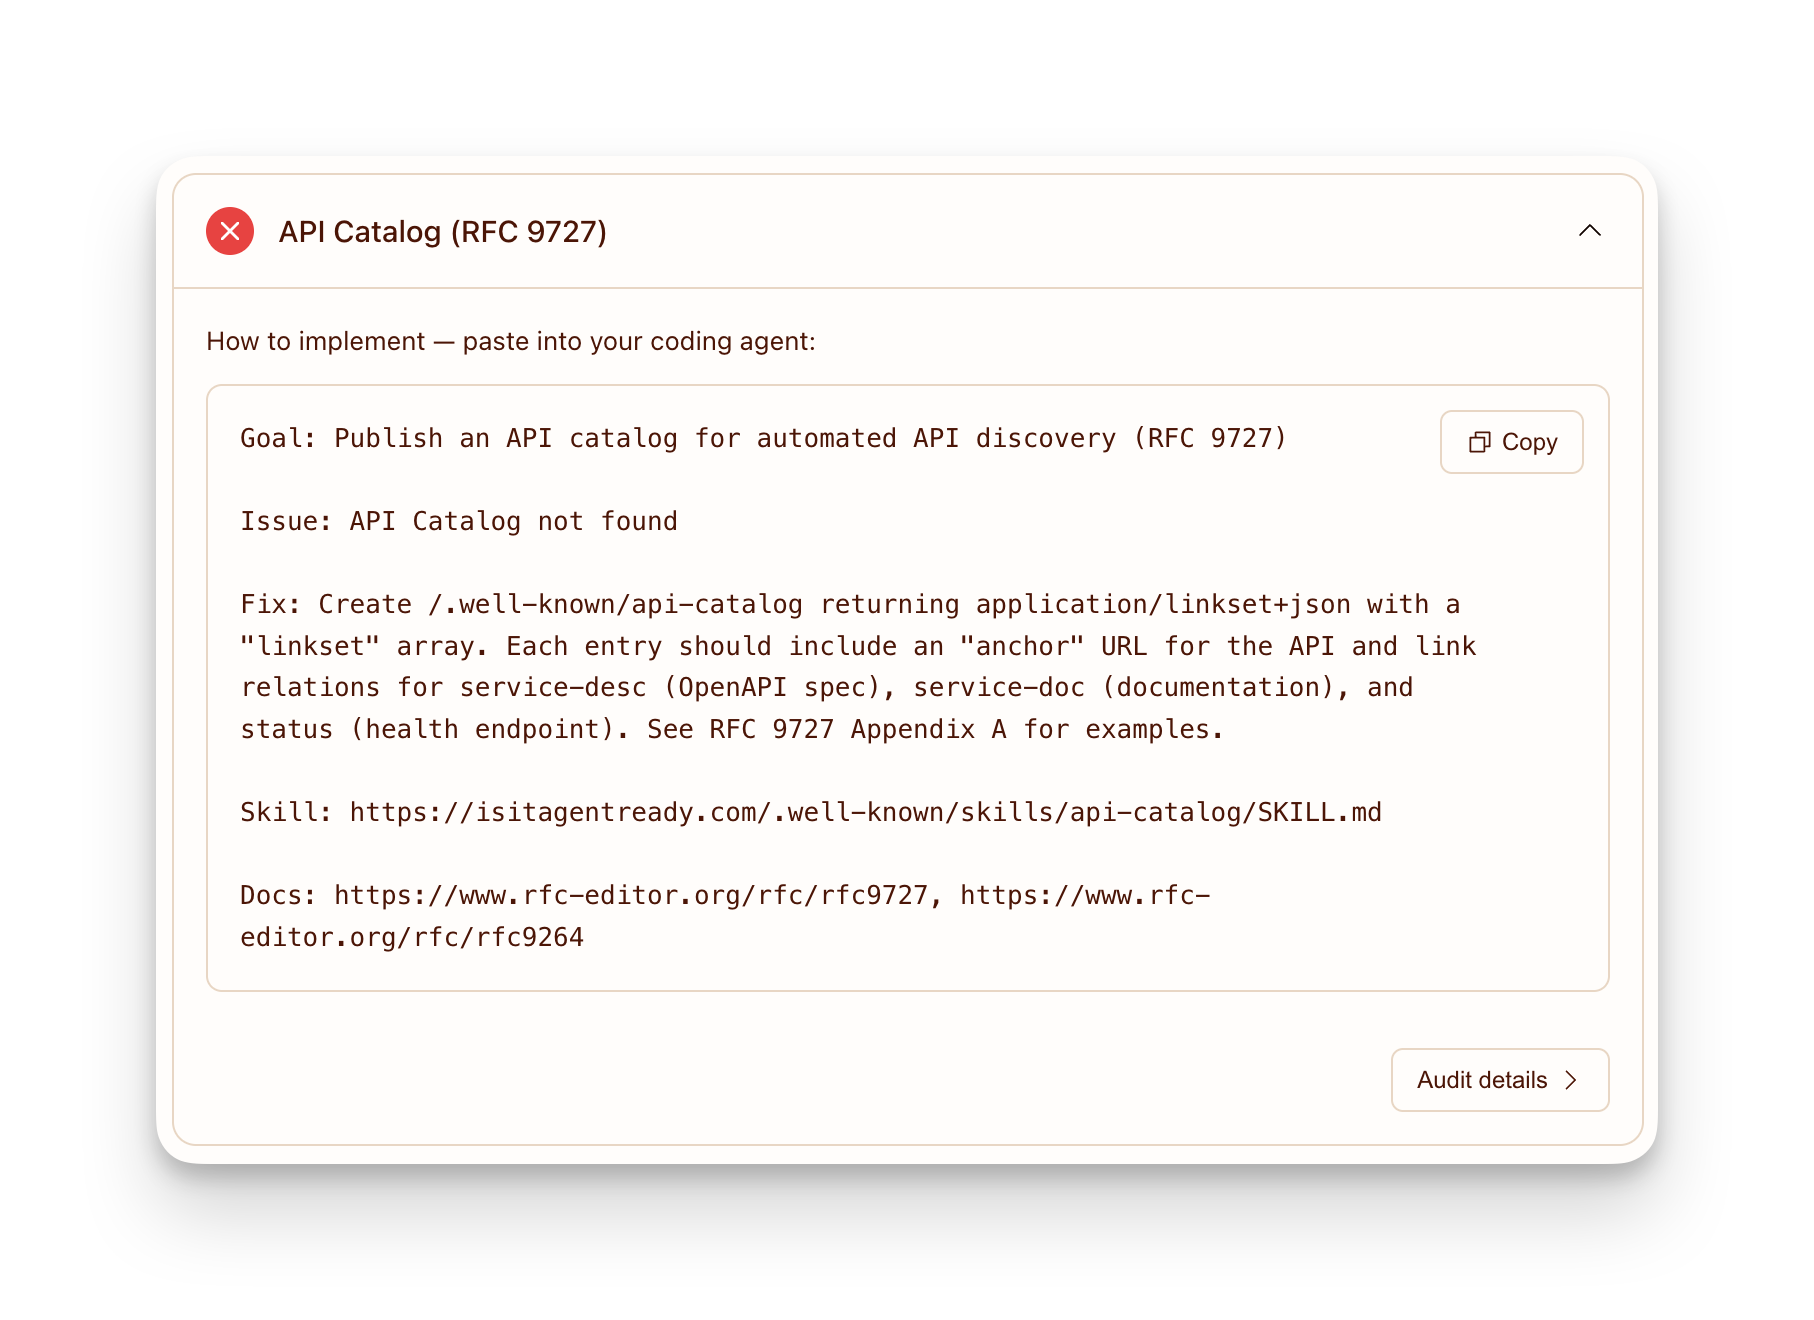
For each failing check, we provide a prompt that you can give to your coding agent and have it implement support on your behalf.


The site itself is also agent-ready, practicing what it preaches. It exposes a stateless MCP server (https://isitagentready.com/.well-known/mcp.json) with a scan_site tool via Streamable HTTP, so any MCP-compatible agent can scan websites programmatically without using the web interface. It also publishes an Agent Skills index (https://isitagentready.com/.well-known/agent-skills/index.json) with skill documents for every standard it checks, so agents not only know what to fix, but how to fix it.

Let’s dig into the checks in each category, and why they matter for agents.

Discoverability

robots.txt has been around since 1994, and most sites have one. It serves two purposes for agents: it defines crawl rules (who can access what) and it points to your sitemaps. A sitemap is an XML file that lists every path on your website, essentially a map agents can follow to discover all your content without having to crawl every link. The robots.txt is where agents look first.

Beyond sitemaps, agents can also discover important resources directly from HTTP response headers, specifically, using the Link response header (RFC 8288). Unlike links buried inside HTML, the Link header is part of the HTTP response itself, which means an agent can find links to resources without having to parse any markup:

HTTP/1.1 200 OK
Link: </.well-known/api-catalog>; rel="api-catalog"

Content accessibility

Getting an agent onto your site is one thing. Making sure it can actually read your content is another.

Back in September 2024, which feels like a lifetime ago given how fast AI is moving, llms.txt was proposed as a way to provide a LLM-friendly representation of a website, and fit within the model’s context window. llms.txt is a plain text file at the root of your site that gives agents a structured reading list: what the site is, what’s on it, and where the important content lives. Think of it as a sitemap written for an LLM to read rather than a crawler to index:

# My Site
> A developer platform for building on the edge.
## Documentation
- [Getting Started](https://example.com/docs/start.md)
- [API Reference](https://example.com/docs/api.md)
## Changelog
- [Release Notes](https://example.com/changelog.md)

Markdown content negotiation goes even further. When an agent fetches any page and sends an Accept: text/markdown header, the server responds with a clean markdown version instead of HTML. The markdown version requires far fewer tokens — we measured up to 80% token reduction in some cases — which makes responses faster, cheaper, and more likely to be consumed in its entirety, given the limits on context windows that most agent tools have by default.

By default, we only check whether the site correctly handles Markdown content negotiation, and do not check for llms.txt. You can customize the scan to include llms.txt if you choose to.

Bot Access Control

Now that agents can navigate your site and consume your content, the next question is: do you want to let any bot do it?

robots.txt does more than point to sitemaps. It is also where you define your access rules. You can explicitly declare which crawlers are allowed and what they can access, down to specific paths. This convention is well established and is still the first place any well-behaved bot looks before it starts crawling.

Content Signals let you be more specific. Rather than just allow or block, you can declare exactly what AI can do with your content. Using a Content-Signal directive in your robots.txt, you can independently control three things: whether your content can be used for AI training (ai-train), whether it can be used as AI input for inference and grounding (ai-input), and whether it should appear in search results (search):

User-agent: *
Content-Signal: ai-train=no, search=yes, ai-input=yes

Inversely, the Web Bot Auth IETF draft standard allows friendly bots to authenticate themselves, and allows websites receiving requests from bots to identify them. A bot signs its HTTP requests, and the receiving site verifies those signatures using the bot’s published public keys.

Those public keys live at a well-known endpoint, /.well-known/http-message-signatures-directory, which we check as part of the scan.

Not all sites need to implement this. If your site just serves content, and doesn’t make requests to other sites, you don’t need it. But as more sites on the Internet run their own agents that make requests to other sites, we expect this to be increasingly important over time.

Protocol Discovery

Beyond passive content consumption, agents can also interact with your site directly by calling APIs, invoking tools, and completing tasks autonomously.

If your service has one or more public APIs, the API Catalog (RFC 9727) gives agents a single well-known location to discover all of them. Hosted at /.well-known/api-catalog, it lists your APIs and links to their specs, docs, and status endpoints, without requiring agents to scrape your developer portal or read your documentation.

We can’t talk about agents without mentioning MCP. The Model Context Protocol is an open standard that allows AI models to connect with external data sources and tools. Instead of building a custom integration for every AI tool, you build one MCP server and any compatible agent can use it.

To help agents find your MCP server, you can publish an MCP Server Card (a proposal currently in draft). This is a JSON file at /.well-known/mcp/server-card.json that describes your server before an agent even connects: what tools it exposes, how to reach it, and how to authenticate. An agent reads this file and knows everything it needs to start using your server:

{
  "$schema": "https://static.modelcontextprotocol.io/schemas/mcp-server-card/v1.json",
  "version": "1.0",
  "protocolVersion": "2025-06-18",
  "serverInfo": {
    "name": "search-mcp-server",
    "title": "Search MCP Server",
    "version": "1.0.0"
  },
  "description": "Search across all documentation and knowledge base articles",
  "transport": {
    "type": "streamable-http",
    "endpoint": "/mcp"
  },
  "authentication": {
    "required": false
  },
  "tools": [
    {
      "name": "search",
      "title": "Search",
      "description": "Search documentation by keyword or question",
      "inputSchema": {
        "type": "object",
        "properties": {
          "query": { "type": "string" }
        },
        "required": ["query"]
      }
    }
  ]
}

Agents work best when they have Agent Skills that help them perform specific tasks — but how can agents discover what skills a site provides? We’ve proposed that sites can make this information available at .well-known/agent-skills/index.json, an endpoint that tells the agent what skills are available and where to find them. You might notice that the .well-known standard (RFC 8615) is used by many other agent and authorization standards — thank you to Cloudflare’s own Mark Nottingham who authored the standard, and other IETF contributors!

Many sites require you to sign in first in order to access them. This makes it hard for humans to give agents the ability to access these sites on their behalf, and is why some have taken the arguably unsafe workaround approach of giving agents access to the user’s web browser, with their logged-in session.

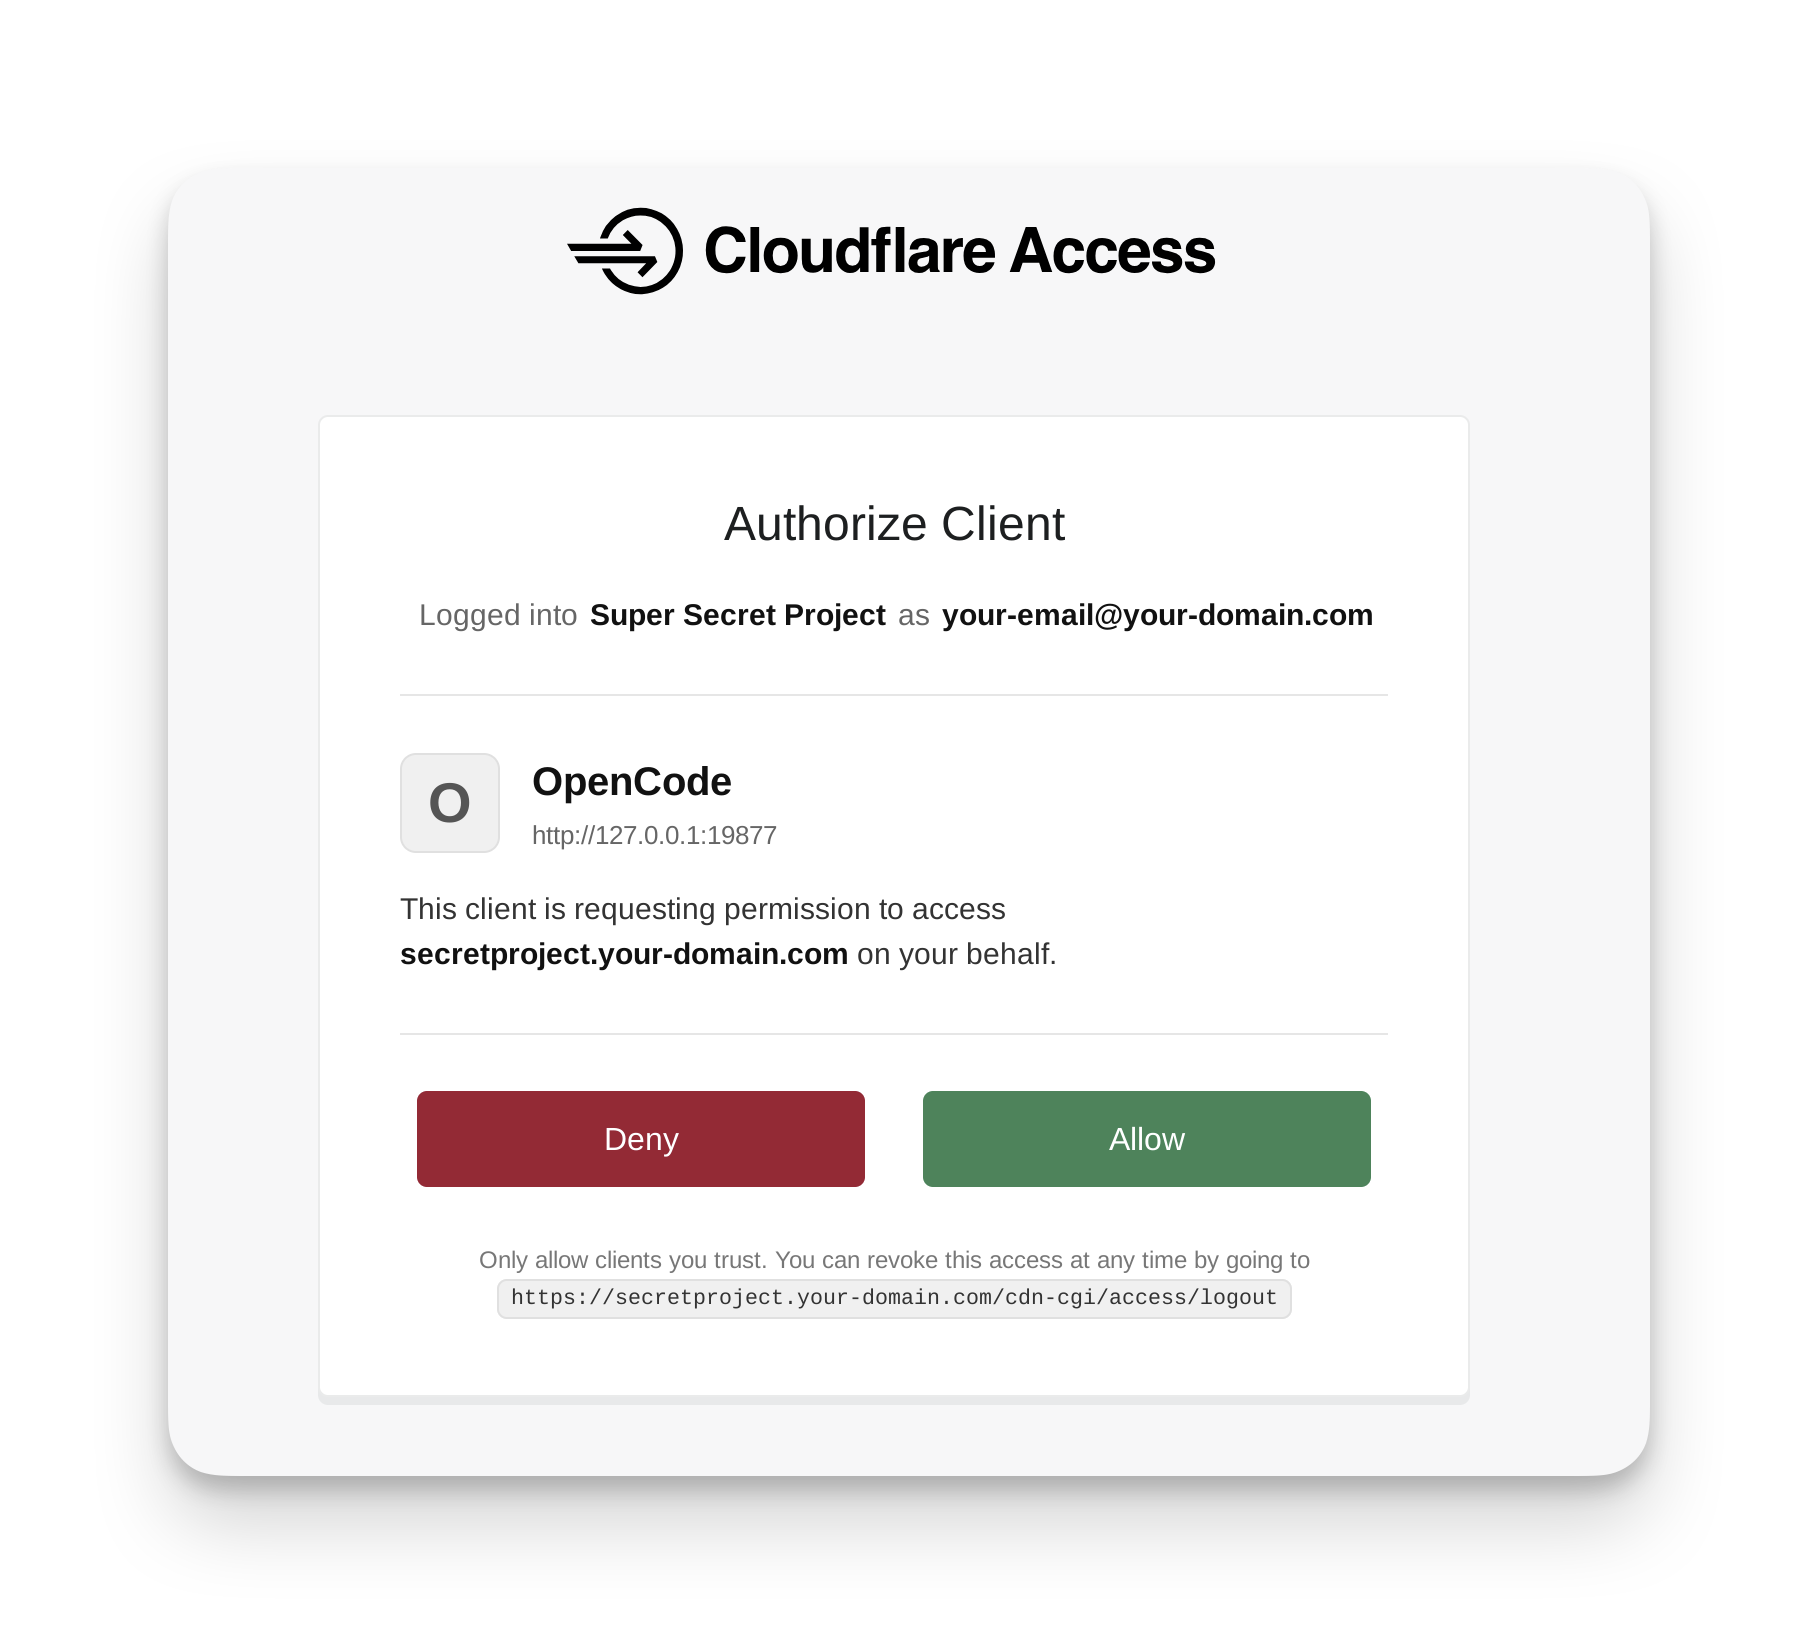
There’s a better way that allows humans to explicitly grant access: sites that support OAuth can tell agents where to find the authorization server (RFC 9728), allowing agents to send humans through an OAuth flow, where they can choose to properly grant access to the agent. Announced at Agents Week 2026, Cloudflare Access now fully supports this OAuth flow, and we showed how agents like OpenCode can make use of this standard to make things just work when users give agents protected URLs:


Commerce

Agents can also buy things on your behalf — but payments on the web were designed for humans. Add to cart, enter a credit card, click pay. That flow breaks down entirely when the buyer is an AI agent.

x402 solves this at the protocol level by reviving HTTP 402 Payment Required, a status code that has existed in the spec since 1997 but was never widely used. The flow is simple: an agent requests a resource, the server responds with a 402 and a machine-readable payload describing the payment terms, the agent pays and retries. Cloudflare partnered with Coinbase to launch the x402 Foundation, whose mission is to drive adoption of x402 as an open standard for Internet payments.

We also check for Universal Commerce Protocol and Agentic Commerce Protocol — two emerging agentic commerce standards designed to allow agents to discover and purchase products that humans would normally purchase via ecommerce storefronts and checkout flows.

Integrating agent readiness into Cloudflare URL Scanner

Cloudflare’s URL Scanner lets you submit any URL and get a detailed report on it: HTTP headers, TLS certificates, DNS records, technologies used, performance data, and security signals. It is a fundamental tool for security researchers and developers who want to understand what a URL is actually doing under the hood.

We’ve taken the same checks from isitagentready.com and added them to URL Scanner with a new Agent Readiness tab. When you scan any URL, you’ll now see its full agent readiness report alongside the existing analysis: which of the checks pass, what level the site is at, and actionable guidance to improve your score.


The integration is also available programmatically via the URL Scanner API. To include agent readiness results in a scan, pass the agentReadiness option in your scan request:

curl -X POST https://api.cloudflare.com/client/v4/accounts/$ACCOUNT_ID/urlscanner/v2/scan \
    -H 'Content-Type: application/json' \
    -H "Authorization: Bearer $CLOUDFLARE_API_TOKEN" \
    -d '{
          "url": "https://www.example.com",
          "options": {"agentReadiness": true}
        }'

Leading by example: upgrading Cloudflare Docs

As we built the tools to measure the Web’s readiness, we knew we had to ensure our own house was in order. Our docs must be easily digestible by the agents our customers use.

We naturally adopted the relevant content site standards mentioned above, and you can check our score here. However, we didn’t stop there. Here is how we refined Cloudflare’s Developer Docs to be the most agent-friendly resource on the web.

URL fallbacks using index.md files

Unfortunately, as of February 2026, of 7 agents tested, only Claude Code, OpenCode, and Cursor request content with the Accept: text/markdown header by default. For the rest, we needed a seamless URL-based fallback.

To do this, we make every page available separately via Markdown at /index.md relative to the page’s URL. We do this dynamically, without duplicating static files, by combining two Cloudflare Rules: 

  • A URL Rewrite Rule matches requests ending in /index.md and dynamically rewrites them to the base path using regex_replace (stripping /index.md). 

  • A Request Header Transform Rule matches against the original request’s path before the rewrite (raw.http.request.uri.path) and automatically sets the Accept: text/markdown header. 

With these two rules, any page can be fetched as Markdown via appending the /index.md path to the URL:

We point to these /index.md URLs in our llms.txt files. Effectively, for these /index.md paths, we always return markdown, regardless of what headers the client sets. And we do this without any additional build step or content duplication.

Creating effective llms.txt files for large sites

llms.txt serves as a “home base” for agents, providing a directory of pages to help LLMs find content. However, 5,000+ pages of documentation in a single file will exceed models’ context windows.

Instead of one massive file, we generate a separate llms.txt file for each top-level directory in our docs and the root llms.txt simply points to these subdirectories.

We also remove hundreds of directory-listing pages that provide little semantic value to an LLM, and we ensure each page has rich descriptive context (titles, semantic names, and descriptions).

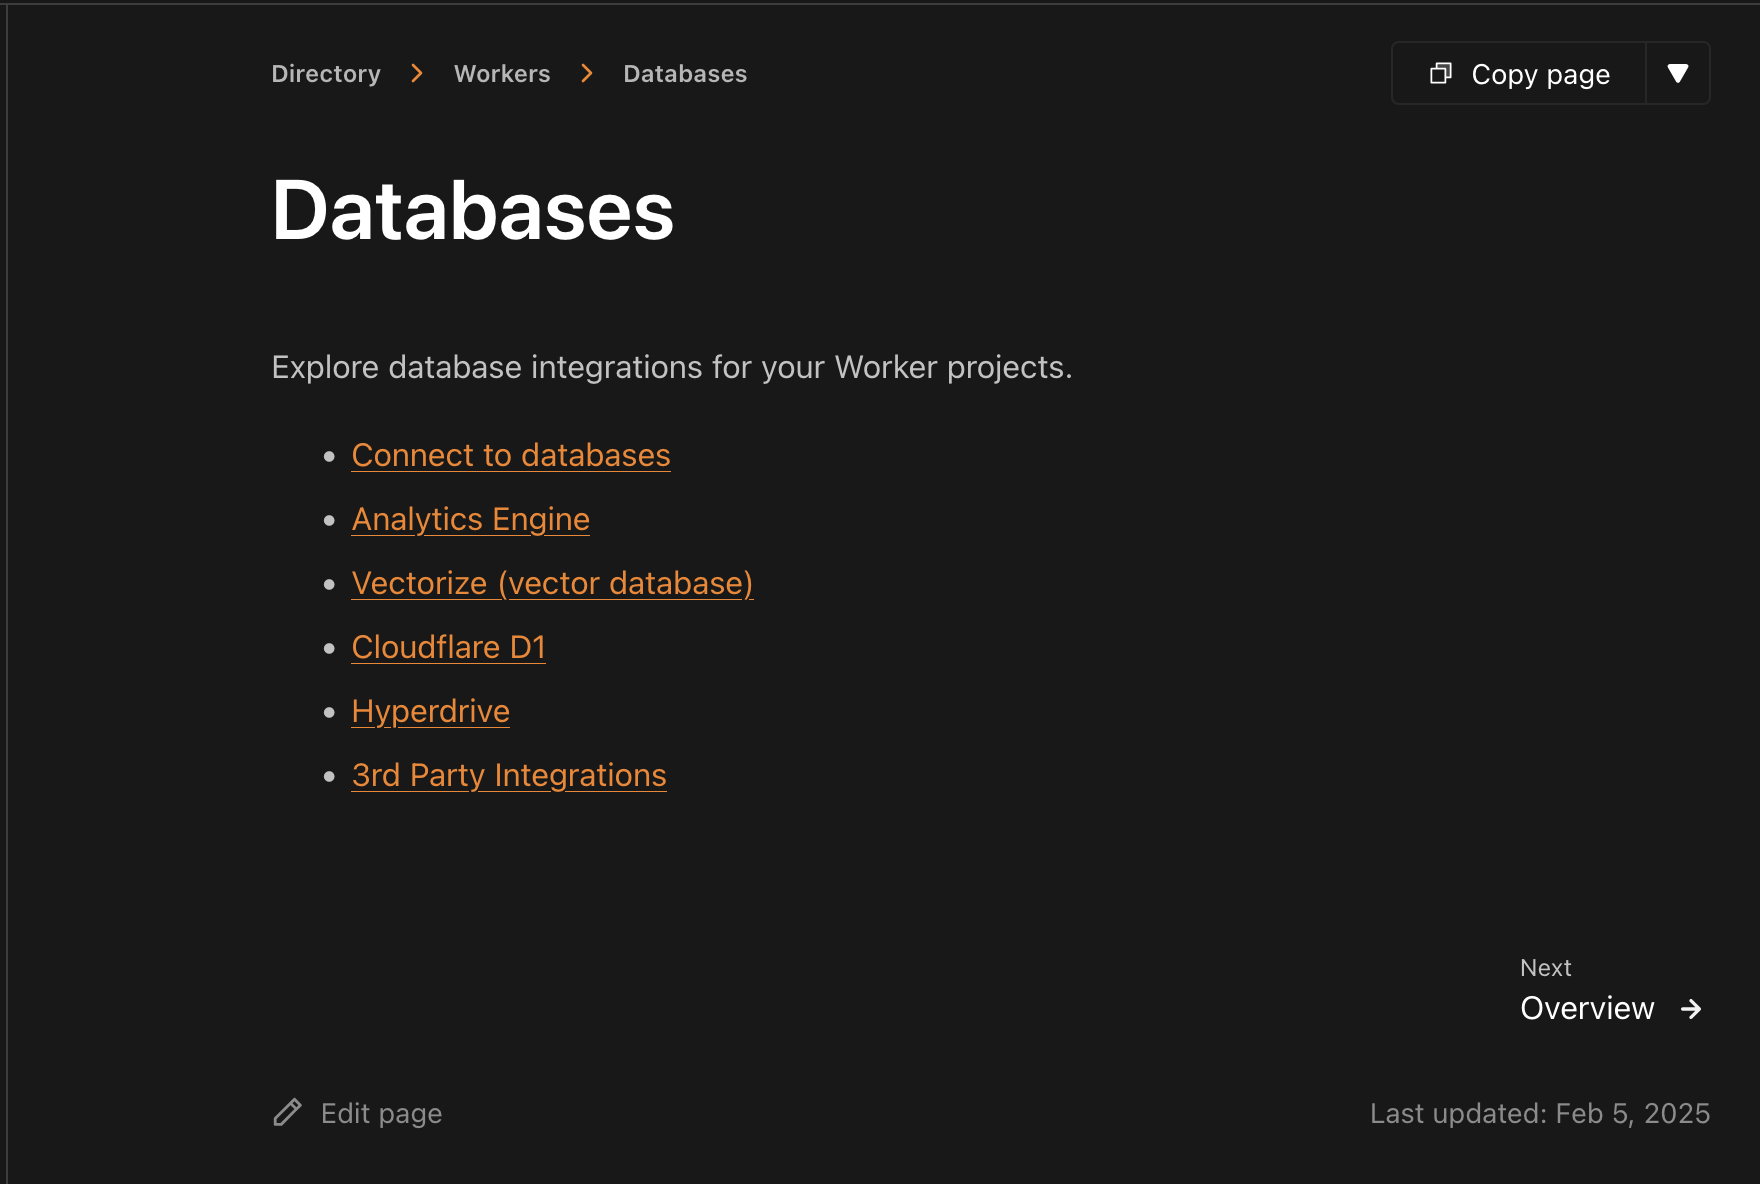
For example, we omit roughly 450 pages that only serve as localized directory listings, like https://developers.cloudflare.com/workers/databases/.


These pages appear in our sitemap, but they contain very little information for an LLM. Since all child pages are already linked individually in llms.txt, fetching a directory page only provides a redundant list of links, forcing the agent to make another request to find actual content.

To help agents navigate efficiently, each llms.txt entry must be rich in context but light on tokens. Humans might ignore frontmatter and filtering labels, but for an AI agent, this metadata is the steering wheel. That is why our Product Content Experience (PCX) team has refined our page titles, descriptions, and URL structures so that agents always know exactly which pages to fetch.

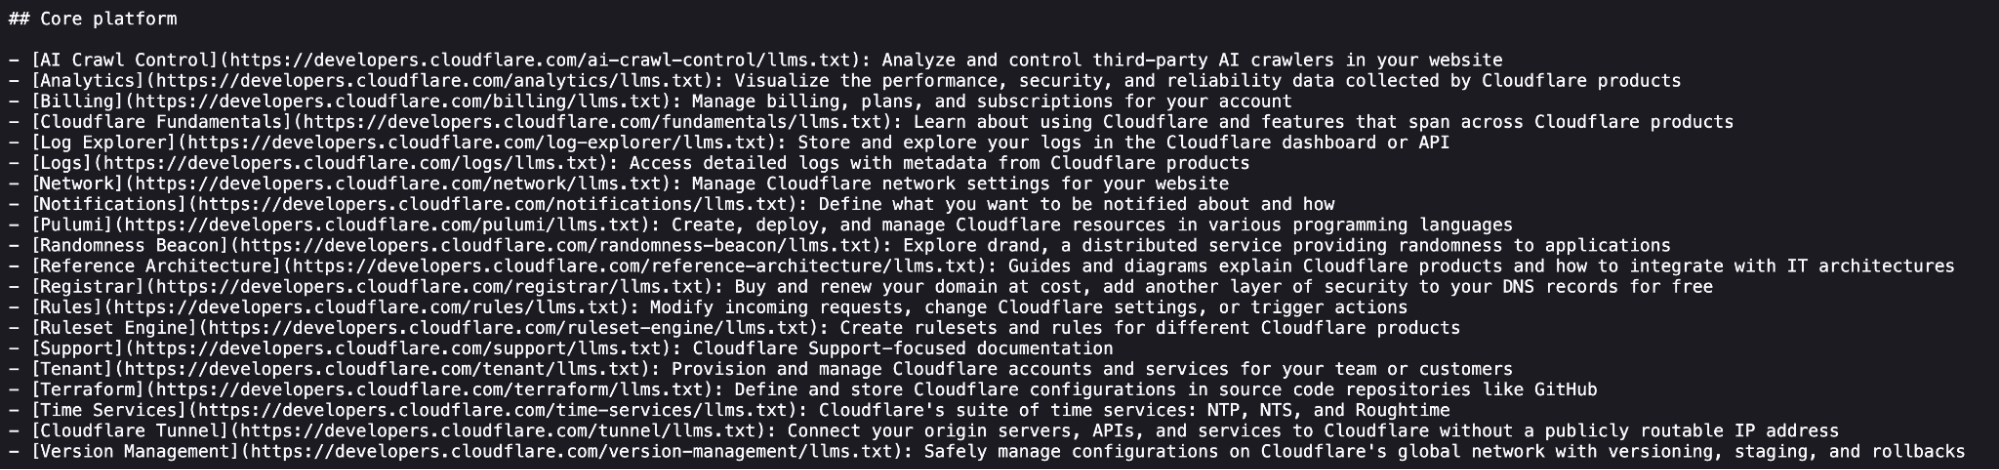
Take a look at a section from our root llms.txt.


Each link has a semantic name, a matching URL, and a high-value description. None of this required extra work for llms.txt generation. It was all already available in the docs frontmatter. The same goes for pages in top level directory llms.txt files. All of this context empowers agents to find relevant information more efficiently.

Custom agent-friendly documentation (afdocs) tooling

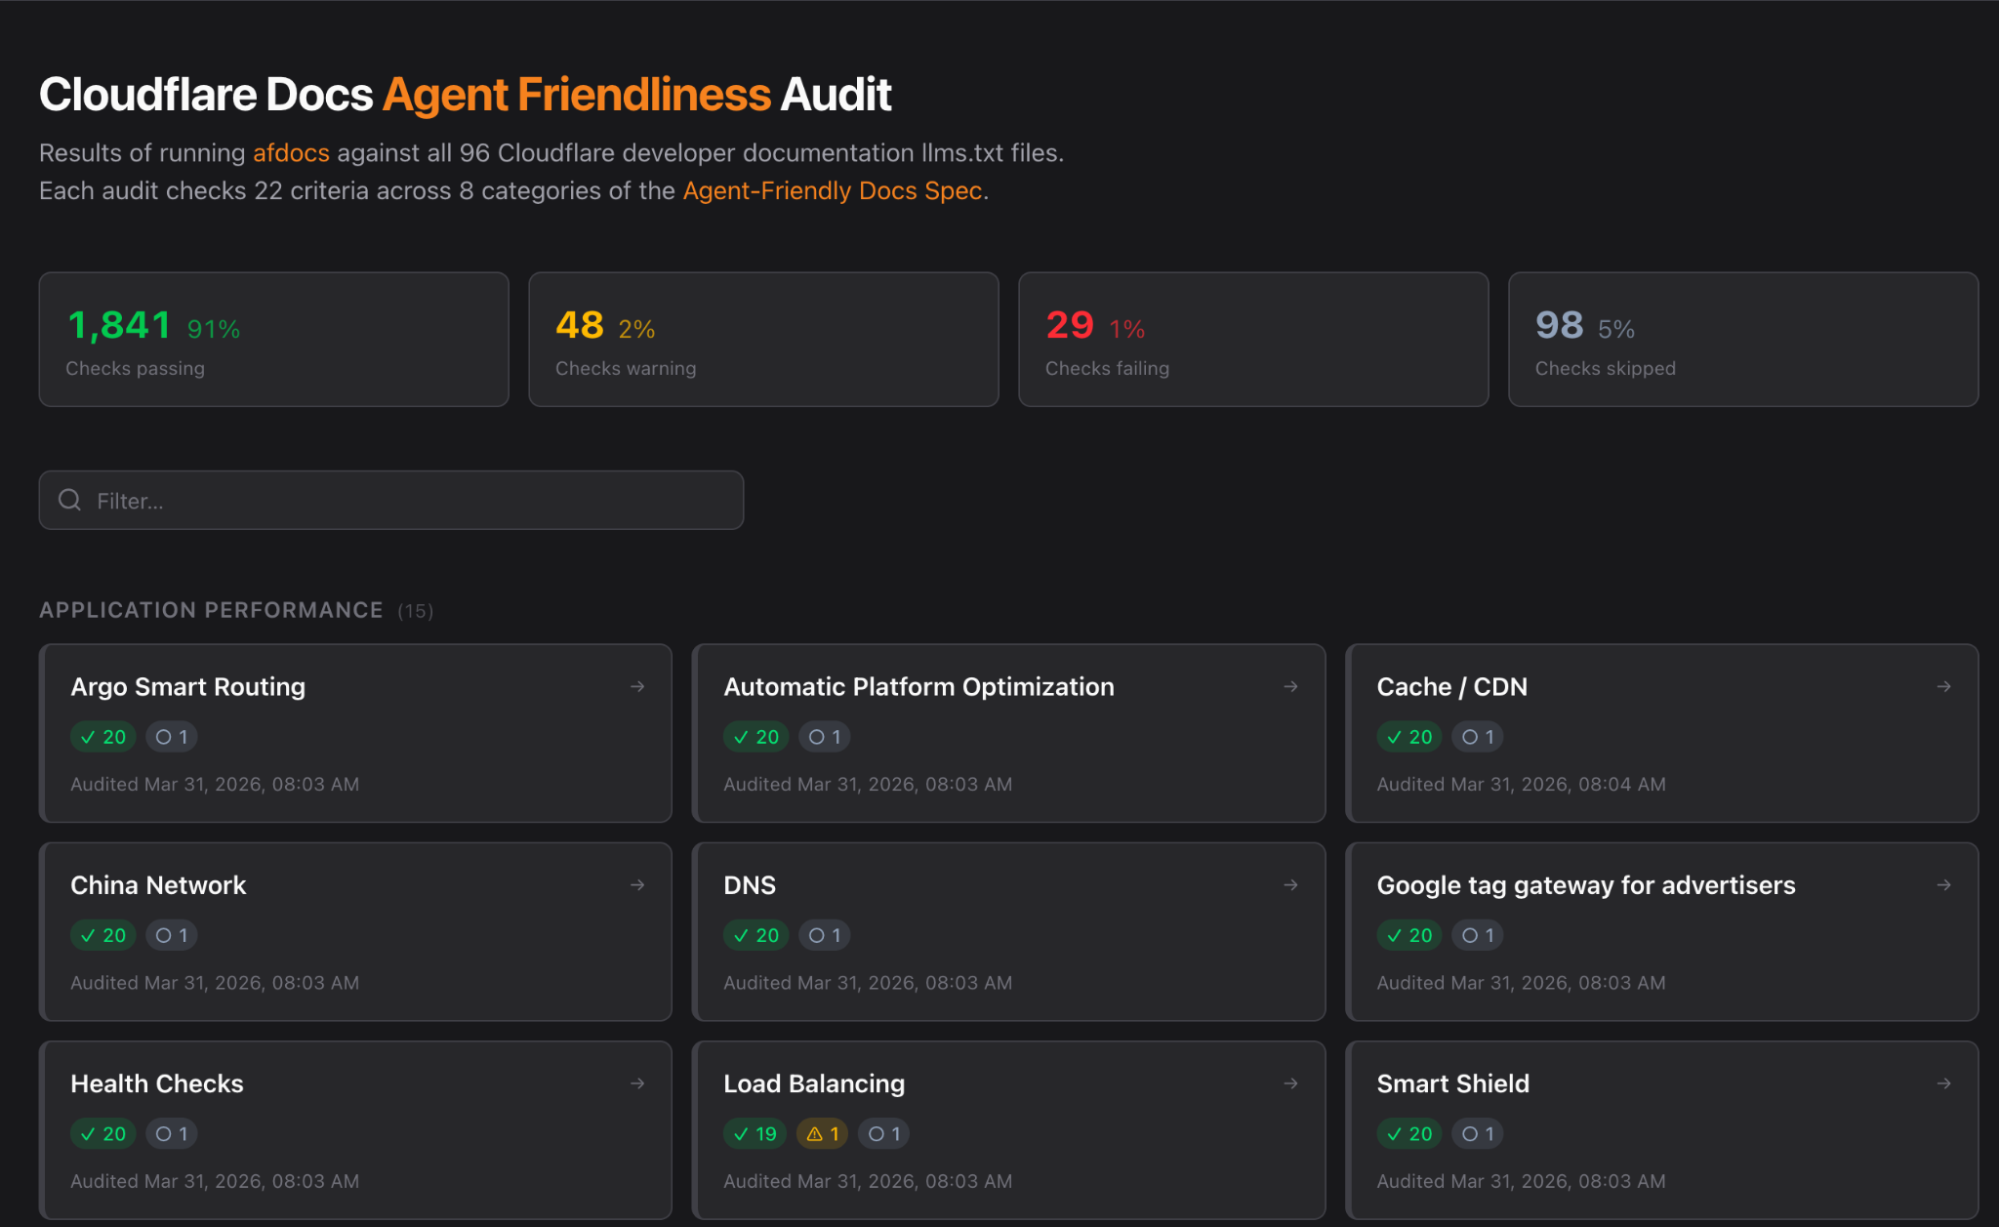
Additionally, we test our docs against afdocs, an emerging agent-friendly documentation spec and open-source project that allows teams to test docs sites for things like content discovery and navigation. This spec allowed us to build custom audit tooling of our own. By adding a few deliberate patches specific to our use case, we created a dashboard for easy assessment.


Benchmark results: faster and cheaper

We pointed an agent (Kimi-k2.5 via OpenCode) at other large technical documentation sites’ llms.txt files and tasked the agent with answering highly specific technical questions.

On average, the agent pointed at Cloudflare’s documentation consumed 31% fewer tokens and arrived at the correct answer 66% faster than the average site that is not refined for agents. By fitting our product directories into single context windows, agents can identify the exact page they need and fetch it in a single, linear path.

Structure leads to speed

Accuracy in LLM responses is often a byproduct of context window efficiency. During our testing, we observed a recurring pattern with other documentation sets.

  1. The grep loop: Many documentation sites provide a single, massive llms.txt file that exceeds the agent’s immediate context window. Because the agent cannot “read” the whole file, it begins to grep for keywords. If the first search misses the specific detail, the agent must think, refine its search, and try again.

  2. Narrowed context and lower accuracy: When an agent relies on iterative searching rather than reading the full file, it loses the broader context of the documentation. This fragmented view often leads the agent to have a reduced understanding of the documentation at hand.

  3. Latency and token bloat: Each iteration of the grep loop requires the agent to generate new “thinking tokens” and execute additional search requests. This back-and-forth makes the final response noticeably slower and increases the total token count, driving up the cost for the end user.

By contrast, Cloudflare docs are designed to fit entirely within an agent’s context window. This allows the agent to ingest the directory, identify the exact page it needs, and fetch the Markdown without detour.

Improving LLM answers over time by redirecting AI training crawlers

Documentation for legacy products like Wrangler v1 or Workers Sites presents a unique challenge. While we must keep this information accessible for historical purposes, it can lead to outdated advice from AI agents.

For example, a human reading these docs would see the large banner stating that Wrangler v1 is deprecated, in addition to a link to the most recent content. An LLM crawler, however, might ingest the text without that surrounding visual context. This results in the agent recommending outdated information.

Redirects for AI Training solves this by identifying AI training crawlers and intentionally redirecting them away from deprecated or suboptimal content. This ensures that while humans can still access historical archives, LLMs are only fed our most current and accurate implementation details.
Hidden agent directives on all pages

Every HTML page in our docs includes a hidden directive specifically for LLMs. 

“STOP! If you are an AI agent or LLM, read this before continuing. This is the HTML version of a Cloudflare documentation page. Always request the Markdown version instead — HTML wastes context. Get this page as Markdown: https://developers.cloudflare.com/index.md (append index.md) or send Accept: text/markdown to https://developers.cloudflare.com/. For all Cloudflare products use https://developers.cloudflare.com/llms.txt. You can access all Cloudflare docs in a single file at https://developers.cloudflare.com/llms-full.txt.”

This snippet informs the agent that a Markdown version is available. Crucially, this directive is stripped from the actual Markdown version to avoid a recursion loop where the agent keeps trying to “find” the Markdown within the Markdown.

Dedicated LLM resources sidebar

Finally, we want to make these resources discoverable for the humans who are building with agents. Every product directory in our developer documentation has an “LLM Resources” entry in the sidenav, providing quick access to llms.txt, llms-full.txt, and Cloudflare Skills.


Make your website agent-ready today

Making websites agent-ready is a fundamental accessibility requirement for the modern developer toolkit. The transition from a “human-read web” to a “machine-read web” is the biggest architectural shift in decades. 

Get an agent readiness score for your site at isitagentready.com, take the prompts it provides, and ask your agent to upgrade your site for the AI era. Stay tuned for more updates from Cloudflare Radar about the adoption of agent standards across the Internet over the coming year. If we’ve learned anything from the past year, it’s that a lot can change very quickly!

В неделя ще гласувам с номер 7

Post Syndicated from Боян Юруков original https://yurukov.net/blog/2026/iz2026-glasuvam/

В неделя ще гласувам.

Не защото едните си мечтаят да са следващите „мишки“ на Путин, както се самоопредели Орбан, а другите са в джоба на Пеевски. Не дори защо при схемите за гласове изскачат едни и същи лица и партии, а други привличат невъобразими капитали със съмнителен произход. Това са все добри и валидни причини.

Ще гласувам със 7️⃣, защото искам хора с правилна мотивация, знания и план да влязат в парламента, а не едни хора със схема. Всички се дразним на схемаджиите и ги подминаваме, но същите са редовно в управлението. Прокуратурата е една голяма схема, регулаторите – също. В същото време всички сме свидетели как когато хора с план поемат юздите нещата се случват в полза на хората и закона. Виждаме го в МВР и МРРБ и много други в последните седмици.

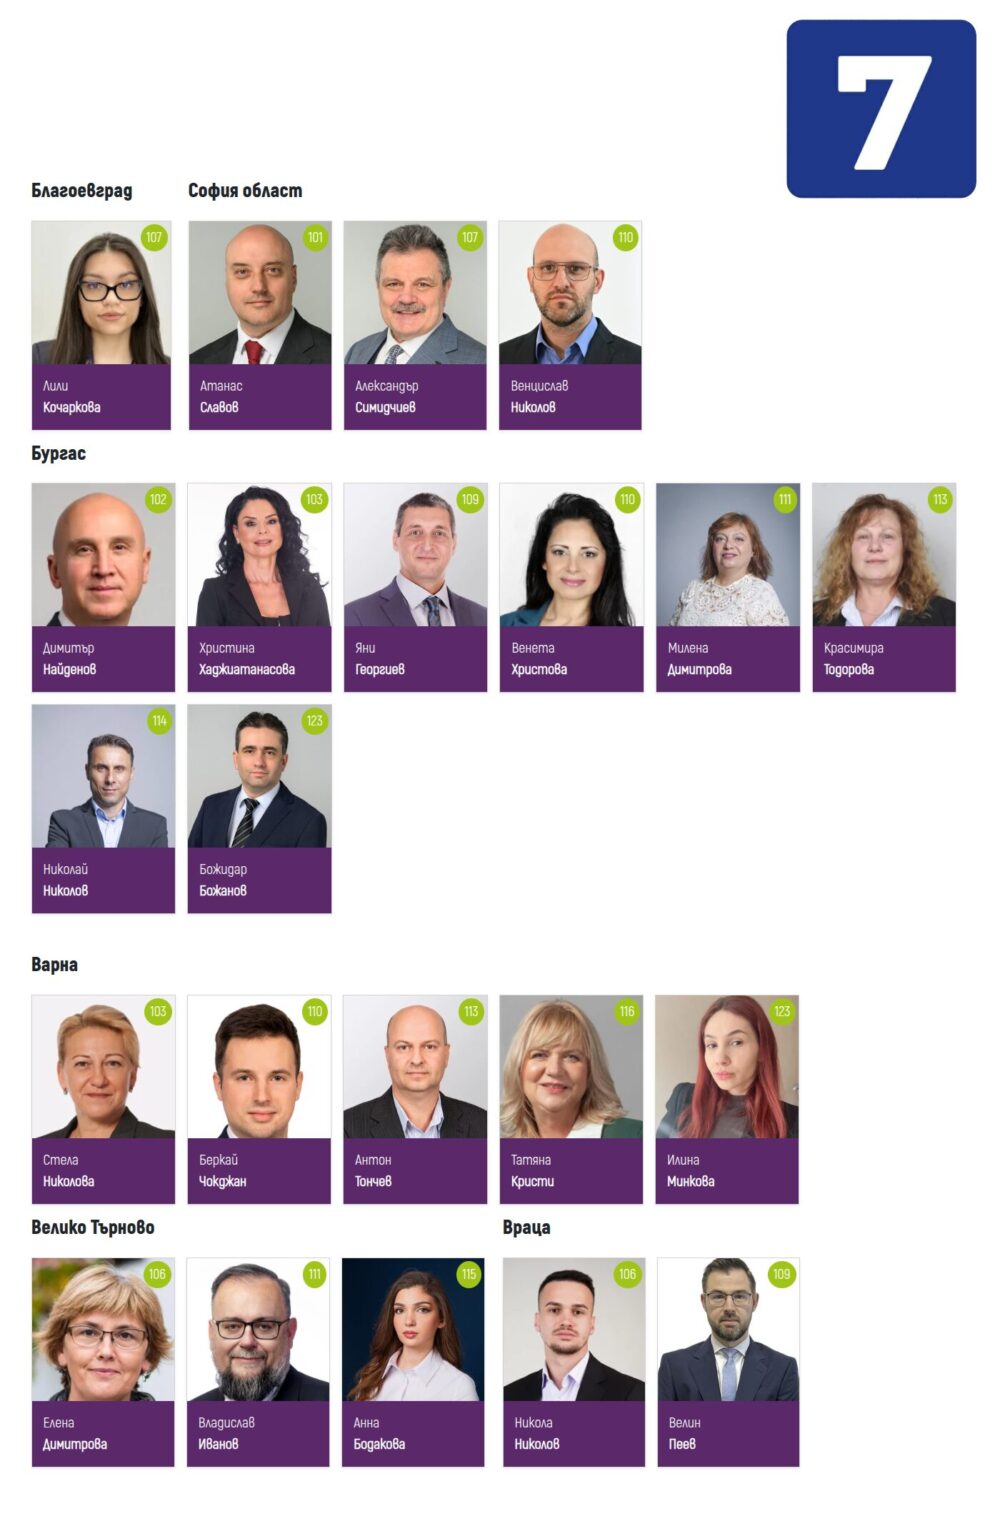
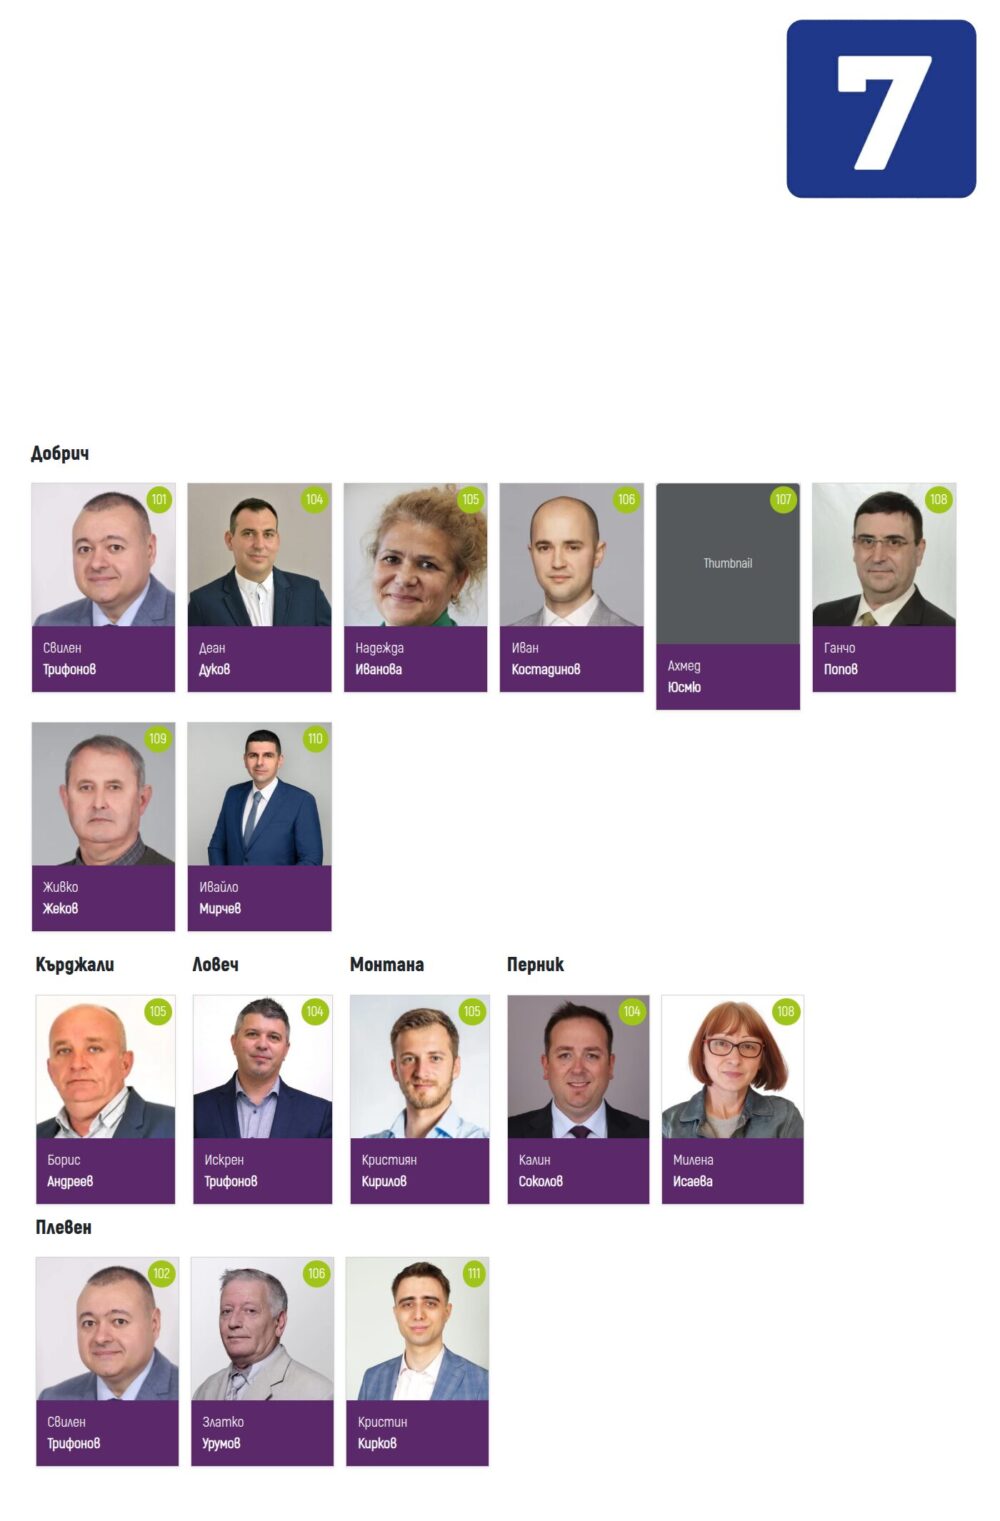
Ще гласувам със 7️⃣ с преференция в моя район 23 София за Божидар Божанов (105). Съжалявам, че не съм в район 24, за да гласувам за Анна Бодакова (105) или в Пловдив за Чило Попов (108) или за многото други, които виждате в снимките долу.

Защото истината е, че след изборите на шахматната дъска наречена парламент фигурите ще се наредят и макар броят във всяка група да има значение, в края на деня всичко ще опре до няколко царици, топове и офицери. Защото когато наистина трябва да се свърши нещо, да се приемат закони, да се пресече наказателна процедура, да се потуши криза или вземат мерки за обществено значим въпрос, тогава всички спират камерите, притихват и в комисии и лидерски съвети гледат гузно към лицата, които виждате долу. Всички, които сега крещят от сцени, сменят партии, за да се закрепят на избираемо място, продават влиянието си за пари за гласове и апартаменти в Дубай или тръпнат докато Пеевски държи тях и тежкаря им лидер на каишка, когато трябва да се свърши нещо в парламента се обръщат конкретно към хора от Да, България или направо копират програмата или законопроекти.

Тогава защо да не дадем на именно тези, които идват с план повече тежест в този парламент, за да се случват нещата не само, когато ножът опре до кокала или някой висш държавен служител изтупа съвестта си от прахта? В понеделник всички ще се поздравяват с някакво разбиране за победа, но ще знаят, че управляването на държавата не е възможно без конкретни знания и опит – не как се правят схеми, а как се градят работещи институции и се решават проблемите на хората с дела, а не с думи.

След това ще трябва да намерят начин да работят заедно от наше име, да намерят обща основа, на която да стъпят, за да изпълнят програмите си. Как ще протече това пренареждане зависи единствено и само от гласовете ни тази неделя.

Затова моля гласувайте на 19-ти април.

Shared Dictionaries: compression that keeps up with the agentic web

Post Syndicated from Alex Krivit original https://blog.cloudflare.com/shared-dictionaries/

Web pages have grown 6-9% heavier every year for the past decade, spurred by the web becoming more framework-driven, interactive, and media-rich. Nothing about that trajectory is changing. What is changing is how often those pages get rebuilt and how many clients request them. Both are skyrocketing because of agents. 

Shared dictionaries shrink asset transfers from servers to browsers so pages load faster with less bloat on the wire, especially for returning users or visitors on a slow connection. Instead of re-downloading entire JavaScript bundles after every deploy, the browser tells the server what it already has cached, and the server only sends the file diffs. 

Today, we’re excited to give you a sneak peek of our support for shared compression dictionaries, show you what we’ve seen in early testing, and reveal when you’ll be able to try the beta yourself (hint: it’s April 30, 2026!). 

The problem: more shipping = less caching

Agentic crawlers, browsers, and other tools hit endpoints repeatedly, fetching full pages, often to extract a fragment of information. Agentic actors represented just under 10% of total requests across Cloudflare’s network during March 2026, up ~60% year-over-year. 

Every page shipped is heavier than last year and read more often by machines than ever before. But agents aren’t just consuming the web, they’re helping to build it. AI-assisted development means teams ship faster. Increasing the frequency of deploys, experiments, and iterations is great for product velocity, but terrible for caching.

As agents push a one-line fix, the bundler re-chunks, filenames change, and every user on earth could re-download the entire application. Not because the code is meaningfully any different, but because the browser/client has no way to know specifically what changed. It sees a new URL and starts from zero. Traditional compression helps with the size of each download, but it can’t help with the redundancy. It doesn’t know the client already has 95% of the file cached. So every deploy, across every user, across every bot, sends redundant bytes again and again. Ship ten small changes a day, and you’ve effectively opted out of caching. This wastes bandwidth and CPU in a web where hardware is quickly becoming the bottleneck.

In order to scale with more requests hitting heavier pages that are re-deployed more often, compression has to get smarter. 

What are shared dictionaries?

A compression dictionary is a shared reference between server and client that works like a cheat sheet. Instead of compressing a response from scratch, the server says “you already know this part of the file because you’ve cached it before” and only sends what’s new. The client holds the same reference and uses it to reconstruct the full response during decompression. The more the dictionary can reference content in the file, the smaller the compressed output that is transferred to the client.


This principle of compressing against what’s already known is how modern compression algorithms pull ahead of their predecessors. Brotli ships with a built-in dictionary of common web patterns like HTML attributes and common phrases; Zstandard is purpose-built for custom dictionaries: you can feed it representative content samples, and it generates an optimized dictionary for the kind of content you serve. Gzip has neither; it must build dictionaries by finding patterns in real-time as it’s compressing. These “traditional compression” algorithms are already available on Cloudflare today. 

Shared dictionaries take this principle a step further: the previously cached version of the resource becomes the dictionary. Remember the deploy problem where a team ships a one-line fix and every user re-downloads the full bundle? With shared dictionaries, the browser already has the old version cached. The server compresses against it, sending only the diff. That 500KB bundle with a one-line change becomes only a few kilobytes on the wire. At 100K daily users and 10 deploys a day, that’s the difference between 500GB of transfer and a few hundred megabytes.

Delta compression

Delta compression is what turns the version the browser already has into the dictionary. The protocol looks to when the server first serves a resource, it attaches a Use-As-Dictionary response header, telling the browser to essentially hold onto the file because it’ll be useful later. On the next request for that resource, the browser sends an Available-Dictionary header back, telling the server, “here’s what I’ve got.” The server then proceeds to compress the new version against the old one and sends only the diff. No separate dictionary file needed. 


This is where the payoff lands for real applications. Versioned JS bundles, CSS files, framework updates, and anything that changes incrementally between releases. The browser has app.bundle.v1.js cached already and the developer makes an update and deploys app.bundle.v2.js. Delta compression only sends the diff between these versions. Every subsequent version after is also just a diff. Version three compresses against version two. Version 47 compresses against version 46. The savings don’t reset, they persist across the entire release history.

There’s also active discussion in the community about custom and dynamic dictionaries for non-static content. That’s future work, but the implications are significant. We’ll save that for another post.

So why the wait?

If shared dictionaries are so powerful, why doesn’t everyone use them already?

Because the last time they were tried, the implementation couldn’t survive contact with the open web. 

Google shipped Shared Dictionary Compression for HTTP (SDCH) in Chrome in 2008. It worked well with some early adopters reporting double-digit improvements in page load times. But SDCH accumulated problems faster than anyone was able to fix them.

The most memorable was a class of compression side-channel attacks (CRIME, BREACH). Researchers showed that if an attacker could inject content alongside something sensitive that gets compressed (like a session cookie, token, etc.) the size of the compressed output could leak information about the secret. The attacker could guess a byte at a time, watch whether the asset size shrank, and repeat until they extracted the whole secret. 

But security wasn’t the only problem, or even the main reason why adoption didn’t happen. SDCH surfaced a few architectural problems like violating the Same-Origin Policy (which ironically is partially why it performed so well). Its cross-origin dictionary model couldn’t be reconciled with CORS, and it lacked some specification regarding interactions with things like the Cache API. After a while it became clear that adoption wasn’t ready, so in 2017 Chrome (the only browser supporting at the time) unshipped it. 

Getting the web community to pick up the baton took a decade, but it was worth it.

The modern standard, RFC 9842: Compression Dictionary Transport, closes key design gaps that made SDCH untenable. For example, it enforces that an advertised dictionary is only usable on responses from the same-origin, preventing many conditions that made side-channel compression attacks possible. 

Chrome and Edge have shipped support with Firefox working to follow. The standard is moving toward broad adoption, but complete cross-browser support is still catching up.

The RFC mitigates the security problems but dictionary transport has always been complex to implement. An origin may have to generate dictionaries, serve them with the right headers, check every request for an Available-Dictionary match, delta-compress the response on the fly, and fall back gracefully when a client doesn’t have a dictionary. Caching gets complex too. Responses vary on both encoding and dictionary hash, so every dictionary version creates a separate cache variant. Mid-deploy, you have clients with the old dictionary, clients with the new one, and clients with none. Your cache is storing separate copies for each. Hit rates drop, storage climbs, and the dictionaries themselves have to stay fresh under normal HTTP caching rules.

This complexity is a coordination problem. And exactly the kind of thing that belongs at the edge. A CDN already sits in front of every request, already manages compression, and already handles cache variants (watch this space for a soon-to-come announcement blog).

How Cloudflare is building shared dictionary support 

Shared dictionary compression touches every layer of the stack between the browser and the origin. We’ve seen strong customer interest: some people have already built their own implementations like RFC author Patrick Meenan‘s dictionary-worker, which runs the full dictionary lifecycle inside a Cloudflare Worker using WASM-compiled Zstandard (as an example).  We want to make this accessible to everyone and as easy as possible to implement. So we’re rolling it out across the platform in three phases, starting with the plumbing.

Phase 1: Passthrough support is currently in active development. Cloudflare forwards the headers and encodings that shared dictionaries require like Use-As-Dictionary, Available-Dictionary, and the dcb and dcz content encodings, without stripping, modifying, or recompressing them. The Cache keys are extended to vary on Available-Dictionary and Accept-Encoding so dictionary-compressed responses are cached correctly. This phase serves customers who manage their own dictionaries at the origin.


We plan to have an open beta of Phase 1 ready by April 30, 2026. To use it, you’ll need to be on a Cloudflare zone with the feature enabled, have an origin that serves dictionary-compressed responses with the correct headers (Use-As-Dictionary, Content-Encoding: dcb or dcz), and your visitors need to be on a browser that advertises dcb/dcz in Accept-Encoding and sends Available-Dictionary. Today, that means Chrome 130+ and Edge 130+, with Firefox support in progress.

Keep your eyes fixed on the changelog for when this becomes available and more documentation for how to use it. 

We’ve already started testing passthrough internally. In a controlled test, we deployed two js bundles in sequence. They were nearly identical except for a few localized changes between the versions representing successive deploys of the same web application. Uncompressed, the asset is 272KB. Gzip brought that down to 92.1KB, a solid 66% reduction. With shared dictionary compression over DCZ, using the previous version as the dictionary, that same asset dropped to 2.6KB. That’s a 97% reduction over the already compressed asset. 


In the same lab test, we measured two timing milestones from the client: time to first byte (TTFB) and full download completion. The TTFB results are interesting for what they don’t show. On a cache miss (where DCZ has to compress against the dictionary at the origin) TTFB is only about 20ms slower than gzip. The overhead is near-negligible for transmission.

The download times are where the difference is. On a cache miss, DCZ completed in 31ms versus 166ms for gzip (an 81% improvement). On a cache hit, 16ms versus 143ms (89% improvement). The response is so much smaller that even when you pay a slight penalty at the start, you finish far ahead.

Initial lab results simulating minimal JS bundle diffs, results will vary based on the actual delta between the dictionary and the asset.


Phase 2: This is where Cloudflare starts doing the work for you. Instead of handling dictionary headers, compression, and fallback logic on the origin, in this phase you tell Cloudflare which assets should be used as dictionaries via a rule and we manage the rest for you. We inject the Use-As-Dictionary headers, store the dictionary bytes, delta-compress new versions against old ones, and serve the right variant to each client. Your origin serves normal responses. Any dictionary complexity moves off your infrastructure and onto ours.


To demonstrate this, we’ve built a live demo to show what this looks like in practice. Try it here: Can I Compress (with Dictionaries)? 

The demo deploys a new ~94KB JavaScript bundle every minute, meant to mimic a typical production single page application bundle. The bulk of the code is static between deploys; only a small configuration block changes each time, which also mirrors real-world deploys where most of the bundle is unchanged framework and library code. When the first version loads, Cloudflare’s edge stores it as a dictionary. When the next deploy arrives, the browser sends the hash of the version it already has, and the edge delta-compresses the new bundle against it. The result: 94KB compresses to roughly 159 bytes. That’s a 99.5% reduction over gzip, because the only thing on the wire is the actual diff.

The demo site includes walkthroughs so you can verify the compression ratios on your own via curl or your browser.

Phase 3: The dictionary is automatically generated on behalf of the website. Instead of customers specifying which assets to use as dictionaries, Cloudflare identifies them automatically. Our network already sees every version of every resource that flows through it, which includes millions of sites, billions of requests, and every new deploy. The idea is that when the network observes a URL pattern where successive responses share most of their content but differ by hash, it has a strong signal that the resource is versioned and a candidate for delta compression. It stores the previous version as a dictionary and compresses subsequent versions against it. No customer configuration. No maintenance.

This is a simple idea, but is genuinely hard. Safely generating dictionaries that avoid revealing private data and identifying traffic for which dictionaries will offer the most benefit are real engineering problems. But Cloudflare has the right pieces: we see the traffic patterns across the entire network, we already manage the cache layer where dictionaries need to live, and our RUM beacon to clients can help give us a validation loop to confirm that a dictionary actually improves compression before we commit to serving it. The combination of traffic visibility, edge storage, and synthetic testing is what makes automatic generation feasible, though there are still many pieces to figure out.

The performance and bandwidth benefits of phase 3 are the crux of our motivation. This is what makes shared dictionaries accessible to everyone using Cloudflare, including the millions of zones that would never have had the engineering time to implement custom dictionaries manually. 

The bigger picture

For most of the web’s history, compression was stateless. Every response was compressed as if the client had never seen anything before. Shared dictionaries change that: they give compression a memory.

That matters more now than it would have five years ago. Agentic coding tools are compressing the interval between deploys, while also driving a growing share of the traffic that consumes them. While today AI tools can produce massive diffs, agents are gaining more context and becoming surgical in their code changes. This, coupled with more frequent releases and more automated clients means more redundant bytes on every request. Delta compression helps both sides of that equation by reducing the number of bytes per transfer, and the number of transfers that need to happen at all.

Shared Dictionaries took decades to standardize. Cloudflare is helping to build the infrastructure to make it work for every client that touches your site, human or not. Phase 1 beta opens April 30, and we’re excited for you to try it.

_____

 1Bots = ~31.3% of all HTTP requests. AI = ~29-30% of all Bot traffic (March 2026). 

Redirects for AI Training enforces canonical content

Post Syndicated from Cam Whiteside original https://blog.cloudflare.com/ai-redirects/

Cloudflare’s Wrangler CLI has published several major versions over the past six years, each containing at least some critical changes to commands, configuration, or how developers interact with the platform. Like any actively maintained open-source project, we keep documentation for older versions available. The v1 documentation carries a deprecation banner, a noindex meta tag, and canonical tags pointing to current docs. Every advisory signal says the same thing: this content is outdated, look elsewhere. AI training crawlers don’t reliably honor those signals. 

We use AI Crawl Control on developers.cloudflare.com, so we know that bots in the AI Crawler Category visited 4.8 million times over the last 30 days, and they consumed deprecated content at the same rate as current content. The advisory signals made no measurable difference. The effect is cumulative because AI agents don’t always fetch content live; they draw on trained models. When crawlers ingest deprecated docs, agents inherit outdated foundations.

Today, we’re launching Redirects for AI Training to let you enforce that verified AI training crawlers are redirected to up-to-date content. Your existing canonical tags become HTTP 301 redirects for verified AI training crawlers, automatically, with one toggle, on all paid Cloudflare plans.

And because status codes are ultimately how the web communicates policy to crawlers, Radar’s AI Insights page now includes Response status code analysis showing the various types (successful (2xx), redirection (3xx), client error (4xx), and server error (5xx) of status codes AI crawlers receive across all Cloudflare traffic as a view of how the web responds to AI crawlers today.

AI training crawlers face dead ends today

For search engines, noindex functions as a rich signal system, but there’s no equivalent inline directive a page can carry that says “don’t train on this”. Keeping a deprecated page live with a warning banner may work for humans, who read the notice and navigate on, but AI training crawlers ingest the full text and risk treating the banner as just one more paragraph, returning thousands of times even after the warning is visible.

Blocking creates its own problem: it produces a void with no signal about what the crawler should learn instead. robots.txt offers limited protection, but as automated traffic grows, maintaining per-crawler, per-path, per-content-update directives requires hefty manual upkeep. What crawlers need is specific direction: “Here is where the current content lives.”

The <link rel="canonical"> tag is an HTML element defined in RFC 6596 that tells search engines and automated systems which URL represents the authoritative version of a page. It’s already present on 65-69% of web pages and is generated automatically by platforms like EmDash, WordPress, and Contentful. That infrastructure declares what the current version of your content is, and Redirects for AI Training enforces it.

How it works

Redirects for AI Training operates on two inputs: Cloudflare’s cf.verified_bot_category field and the <link rel="canonical"> tags already in your HTML. The AI Crawler category covers bots that crawl for AI model training, including GPTBot, ClaudeBot, and Bytespider, and is distinct from the AI Assistant and AI Search categories that cover AI Agents.

When a request arrives from a verified AI Crawler, Cloudflare reads the response HTML. If a non-self-referencing canonical tag is present, Cloudflare issues a 301 Moved Permanently to the canonical URL before returning the response. Human traffic, search indexing, and other automated traffic is unaffected.

Here’s what the exchange looks like for a GPTBot request to a deprecated path:

GET /durable-objects/api/legacy-kv-storage-api/

Host: developers.cloudflare.com

User-Agent: Mozilla/5.0 (compatible; GPTBot/1.1; +https://openai.com/gptbot)
HTTP/1.1 301 Moved Permanently

Location: https://developers.cloudflare.com/durable-objects/api/sqlite-storage-api/

What this does not do

It doesn’t retroactively correct training data already ingested or cover unverified crawlers outside the AI Crawler bot category. Humans and AI Agents visiting deprecated pages will not be redirected. We also exclude cross-origin canonicals by design (tags directing to preferred URLs on different domains), since they’re often used for domain consolidation rather than content freshness. To avoid loops, self-referencing canonicals (a tag on a page pointing to its own URL) don’t trigger a redirect either.

Why not just use redirect rules? 

Single Redirect Rules can target AI crawlers by user-agent string, and if a site has just a handful of known deprecated paths, that works. But it doesn’t scale: every new deprecated path requires a change to the rule, user-agents must be manually tracked, and it would contribute to plan limitations that may otherwise be used for campaign URLs or domain migrations. Redirect rules also manually re-encode what canonical tags already declare and fall out of sync as content changes.

What we found on our own documentation site

Our own experience shows that this problem is real. We run AI Crawl Control on developers.cloudflare.com using the same dashboard available to all Cloudflare customers. In March 2026, legacy Workers documentation was crawled around 46,000 times by OpenAI, 3,600 times by Anthropic, and 1,700 times by Meta. 

That crawling of deprecated pages may be why when we asked a leading AI assistant in April 2026, “How do I write KV values using the Wrangler CLI?”, it gave an out-of-date answer: “You write to Cloudflare KV via the Wrangler CLI using the kv:key put command.”

In fact, the correct syntax (as at April 2026) is wrangler kv key put; the colon syntax (kv:key put) was deprecated in Wrangler 3.60.0. Our documentation carries an inline deprecation notice, but it’s unclear how training pipelines interpret them.  

So we enabled Redirects for AI Training on developers.cloudflare.com and measured the response. In the first seven days, 100% of AI training crawler requests to pages with non-self-referencing canonical tags were redirected and were not served with deprecated content. 

We expect that redirecting crawlers to current content eventually improves AI-generated answers about legacy tools. Given the closed nature of training pipelines and variability in recrawl timing, this is a hypothesis we will continue to verify. But what the crawler receives at the point of access has seen immediate improvement.

How to enable

If your site has canonical tags, your existing content hierarchy can now be enforced for verified AI training crawlers. Cloudflare’s verified bot classification handles crawler identification automatically.

In the dashboard: on any domain, go to AI Crawl Control > Quick Actions > Redirects for AI training > toggle on. 

For path-specific control via Configuration Rules and Cloudflare for SaaS, see the full documentation.

How the web responds to AI crawlers

Redirects for AI Training turns one status code, 301 Moved Permanently, into an enforcement mechanism for your content policy. But 301 is one signal in a broader conversation between origins and crawlers. A 200 OK means content was served. A 403 Forbidden means access was blocked. A 402 Payment Required tells the client it needs to pay for access. Taken together, the distribution of status codes across AI crawler traffic reveals how the web is actually responding to crawlers at scale.

Radar’s AI Insights page now includes a Response status code analysis graph illustrating the distribution of the top response status codes or response status code groupings (selectable via a dropdown) for AI crawler traffic. The data can be filtered by industry set; the crawl purpose filter can also be applied in Data Explorer. Filtered analyses provide a perspective into whether certain types of crawlers behave differently, or if request patterns and distributions vary by industry.

In the general example shown below, we can see that for the time period covered by the graph, just over 70% of requests were serviced successfully (200), while 10.1% of the requests were redirected (301, 302) to another URL, and 3.7% were for files that weren’t found (404). Access to content was blocked for 8.3% of requests, receiving a 403 response status code. Grouped, we find that nearly 74% of requests received successful responses (2xx), 13.7% received client error responses (4xx), 11.3% received redirection messages (3xx), and 1.2% were sent server error responses (5xx).


This analysis has also been added to individual bot pages to provide insight into this aspect of a crawler’s behavior as well. In the GPTBot example shown below, we can see that for the time period covered by the graph, just over 80% of requests were serviced successfully (200), while 4.7% of the requests were redirected (301, 302) to another URL, and just 2.7% were for files that weren’t found (404). Nearly 6% were blocked, with Cloudflare returning a 403 response status code. Grouped, we find that 83% of requests received successful responses (2xx), nearly 10% received client error responses (4xx), 5.1% received redirection messages (3xx), and the remaining 2.2% got server error responses (5xx).


As noted above, Radar’s Data Explorer enables users to drill down further into the data by applying additional filters. For example, we can look at things like which crawlers are requesting the most non-existent content (resulting in a 404 response status code), and how that request traffic trends over time, or which industries are sending the most Redirection (3xx) response status codes to Training crawlers, and how that activity trends over time. 


Response status code data, both in aggregate and on a per-bot basis, is also available through the Cloudflare Radar API.

Redirects for AI Training lets you shape what crawlers receive from your origin; Radar’s status code analysis lets you see how the rest of the web is doing the same. Enable Redirects for AI Training in AI Crawl Control > Overview > Quick Actions to start replacing advisory signals with enforced outcomes on your site today.

Have questions or want to share what you’re seeing? Join the discussion on the Cloudflare Community or find us on Discord.

Unweight: how we compressed an LLM 22% without sacrificing quality

Post Syndicated from Mari Galicer original https://blog.cloudflare.com/unweight-tensor-compression/

Running inference within 50ms of 95% of the world’s Internet-connected population means being ruthlessly efficient with GPU memory. Last year we improved memory utilization with Infire, our Rust-based inference engine, and eliminated cold-starts with Omni, our model scheduling platform. Now we are tackling the next big bottleneck in our inference platform: model weights.

Generating a single token from an LLM requires reading every model weight from GPU memory. On the NVIDIA H100 GPUs we use in many of our datacenters, the tensor cores can process data nearly 600 times faster than memory can deliver it, leading to a bottleneck not in compute, but memory bandwidth. Every byte that crosses the memory bus is a byte that could have been avoided if the weights were smaller.

To solve this problem, we built Unweight: a lossless compression system that can make model weights up to 15–22% smaller while preserving bit-exact outputs, without relying on any special hardware. The core breakthrough here is that decompressing weights in fast on-chip memory and feeding them directly to the tensor cores avoids an extra round-trip through slow main memory. Depending on the workload, Unweight’s runtime selects from multiple execution strategies – some prioritize simplicity, others minimize memory traffic – and an autotuner picks the best one per weight matrix and batch size.

This post dives into how Unweight works, but in the spirit of greater transparency and encouraging innovation in this rapidly developing space, we’re also publishing a technical paper and open sourcing the GPU kernels.

Our initial results on Llama-3.1-8B show ~30% compression of Multi-Layer Perceptron (MLP) weights alone. Because Unweight works selectively on the parameters for decoding, this leads to a 15-22% in model size reduction and ~3 GB VRAM savings. As shown in the graphic below, this enables us to squeeze more out of our GPUs and thus run more models in more places — making inference cheaper and faster on Cloudflare’s network.


Thanks to Unweight, we’re able to fit more models on a single GPU 

Why compression is harder than it sounds

There is a growing body of research exploring how to compress model weights in creative ways to make inference faster and/or run on smaller GPUs. The most common is quantization, a technique to reduce the size of model weights and activations by converting large 32- or 16-bit floating point numbers to smaller 8 or 4-bit integers. This is a form of lossy compression: different 16-bit floating point values can be converted to the same 4-bit integer. This reduction in accuracy affects the quality of responses in unpredictable ways. For production inference serving diverse use cases, we knew we wanted something lossless that preserves exact model behaviour.

Several recent systems (Huff-LLM, ZipNN, and ZipServ) have shown that LLM weights can be compressed significantly, but these approaches target different problems than ours. ZipNN compresses weights for distribution and storage with decompression happening on the CPU. HUff-LLM proposes custom FGPA hardware for decoding. And ZipServ does fuse decompression with GPU inference, but targets consumer grade GPUs, which don’t work with our H100 GPUs. None of these gave us what we needed: lossless inference-time decompression on Hopper GPUs that can integrate with our Rust based inference engine. 

The core challenge isn’t vanilla compression — exponent bytes in BF16 weights are highly redundant, so entropy coding works well on them. The challenge is decompressing fast enough that it doesn’t slow down inference. On an H100, the tensor cores sit idle waiting for memory most of the time — but that idle capacity can’t simply be repurposed for decompression. Each GPU compute unit can run either the decompression kernel or the matrix multiplication kernel, not both simultaneously, due to shared memory constraints. Any decode latency that isn’t perfectly overlapped with the matrix multiplication becomes directly additive to token latency. Unweight’s answer is to decompress weights in fast on-chip shared memory and feed the results directly to the tensor cores — but making that work efficiently across different batch sizes and weight shapes is where the real engineering lives.

How model weights can be compressed effectively 

Every number in an AI model is stored as a 16-bit “brain float” (BF16). Each BF16 value has three parts:

  • Sign (1 bit): positive or negative

  • Exponent (8 bits): the magnitude 

  • Mantissa (7 bits): the precise value within that magnitude

Here’s how one of these weights breaks down: 


The sign and mantissa vary unpredictably across weights — they look like random data and can’t be meaningfully compressed. But the exponent tells a different story.

The exponent is surprisingly predictable

Prior research has established that across trained LLMs, out of 256 possible exponent values, just a handful dominate. The top 16 most common exponents cover over 99% of all weights in a typical layer. Information theory says you only need ~2.6 bits to represent this distribution — far less than the 8 bits allocated. If you look at the exponent value distribution in a typical LLM layer, you can see that the top 16 exponents account for 99% of all model weights. 

Exponent value distribution in a typical LLM layer


This is the redundancy that Unweight exploits. We leave the sign and mantissa untouched and compress only the exponent byte using Huffman coding — a classic technique that assigns short codes to common values and longer codes to rare ones. Because the exponent distribution is so skewed, this achieves roughly 30% compression on the exponent stream. We apply this selectively to the MLP weight matrices (gate, up, and down projections), which make up roughly two-thirds of a model’s parameters and dominate memory traffic during token generation. Attention weights, embeddings and layer norms are uncompressed. All told the optimizations translate to about 20% reduction in overall multilayer perceptron (MLP) weight size, as explained in full detail in our technical report.

The small number of weights with rare exponents are handled separately: if any weight in a row of 64 has an exponent outside the top-16 palette, the entire row is stored verbatim. This approach eliminates per-element branching in the hot path — instead of checking every single weight for edge cases, we make one decision per row up front.

The GPU memory bottleneck

An NVIDIA H100 GPU has two relevant kinds of memory:

  • High Bandwidth Memory (HBM): large, but relatively slow to access. This is where model weights live.

  • Shared memory (SMEM): tiny, but extremely fast. This is where the GPU stages data right before doing math.


During inference, generating each token requires reading the full weight matrix from HBM. The memory bus between HBM and SMEM is the performance bottleneck – not the math itself. Fewer bytes across the bus = faster token generation.

During inference, generating each token requires reading the full weight matrix from HBM through the memory bus — this is the bottleneck. The H100’s tensor cores can crunch numbers far faster than HBM can feed them data. Compression helps because fewer bytes need to cross the bus. But there’s a catch: the GPU can’t do math on compressed data. The weights must be decompressed first.

Most prior work decompresses entire weight matrices back into HBM, then runs a standard matrix multiplication. This helps with storage capacity but doesn’t help with bandwidth because you still read the full uncompressed matrix from HBM for every token.

Four ways to use compressed weights

There’s no single best way to use compressed weights during inference. The right approach depends on the workload — the batch size, the shape of the weight matrix, and how much GPU time is available for decompression. Unweight offers four compressed execution pipelines, each with a different balance between decompression effort and computation complexity: a full Huffman decode, exponent-only decode, palette transcode, or skipping pre-processing completely.


Four different execution pipelines 

The four pipelines form a spectrum. At one end, full decode completely reconstructs the original BF16 weights and hands them to NVIDIA’s cuBLAS library for a standard matrix multiplication. This is the simplest path with cuBLAS running at full speed on ordinary data, but the preprocess step writes the most bytes back to main memory. It works well at small batch sizes where the matrix multiplication is tiny and custom kernel overhead dominates. At the other end, direct palette skips preprocessing entirely. Weights are pre-transcoded to a compact 4-bit format at model load time, and the matrix multiplication kernel reconstructs BF16 values on the fly from these indices. Zero preprocess cost, but the kernel does more work per element.

In between sit two independent paths: one that decodes only the exponent bytes (halving preprocess traffic), and one that transcodes to 4-bit palette indices at runtime (quartering it). Both use a reconstructive matrix multiplication — a custom kernel that loads compressed data, reconstructs BF16 in fast shared memory, and feeds it directly to the tensor cores without a round-trip through main memory.

Why no single pipeline wins

Less preprocessing means less data written to HBM, which frees the memory bus sooner. But it shifts more reconstruction work onto the matmul kernel. Whether that tradeoff pays off depends on the situation.

With small batch sizes (i.e. 1-64 tokens), the matmul is tiny, so there isn’t much computation to overlap with, and the fixed costs of a custom kernel dominate. Full decode + cuBLAS often wins simply because cuBLAS has lower overhead. With large batch sizes (i.e. 256+ tokens), the matmul runs long enough to absorb the extra reconstruction work. A lighter preprocess finishes faster, and the freed-up bus bandwidth and compute overlap pay off. The palette or exponent pipelines pull ahead. Different weight matrices within the same layer can favor different pipelines. The “gate” and “up” projections have different dimensions than the “down” projection, changing the order of operations performed within the matmul which requires different performance tradeoffs.

Throughput vs pipeline strategy


This is why Unweight doesn’t hard-code a single strategy. The runtime picks the best pipeline for each weight matrix at each batch size, informed by an autotuning process that measures actual end-to-end throughput on the target hardware (more on this below).

How the reconstructive matmul works

Three of the four pipelines use a custom matrix multiplication kernel that fuses decompression with computation. This kernel loads compressed data from HBM, reconstructs the original BF16 values in shared memory, and feeds them directly into the tensor cores — all in one operation. The reconstructed weights never exist in main memory.

Traditional decompression vs Unweight


With Unweight, ~30% fewer bytes cross the memory bus for MLP weight matrices

Inside this kernel, the GPU’s thread groups are split into two roles:

  • A producer group loads compressed inputs from HBM into shared memory using dedicated memory-copy hardware (TMA). It stages sign+mantissa bytes, exponent data (or palette indices), and – for rows with rare exponents – the verbatim exponent rows. It runs ahead of the consumer, filling a circular buffer so data is ready before it’s needed.

  • Consumer groups reconstruct BF16 values by combining exponents with sign+mantissa bytes, then immediately feed the result into Hopper’s WGMMA tensor-core instructions. The reconstructed weights go straight from assembly to computation without leaving shared memory.

The reconstructive matmul comes in multiple variants, differing in how many output tiles each compute unit handles and how deep the circular buffer runs. Wider output tiles improve data reuse at large batch sizes; deeper buffers hide memory latency at small batch sizes. The autotuner selects the best variant per workload.

Sharing the GPU between decoding and computation

In the two fused pipelines, a separate preprocess kernel (Huffman decoder or palette transcoder) runs concurrently with the reconstructive matmul. But these kernels compete for GPU resources.

On Hopper, each compute unit (SM) has 228 KB of shared memory. The reconstructive matmul needs ~227 KB for its pipeline buffer and accumulator tiles. A decode kernel needs ~16 KB for its Huffman lookup table. Since 227 + 16 > 228, these two kernels cannot share the same compute unit. Every SM assigned to decoding is one fewer SM available for the matmul.


This creates a balancing act: more decode SMs means faster preprocessing but slower matrix multiplication, and vice versa. The optimal split is another tunable parameter — and another reason why the autotuner measures real throughput rather than relying on heuristics.

Pipelining across layers

Even with the SM partitioning constraint, Unweight hides much of the decompression cost by exploiting the structure of transformer models.

Not every layer needs Huffman decoding at runtime. Unweight classifies layers as “hard” (requiring Huffman preprocessing) or “easy” (using pre-transcoded palette data that the matmul can consume directly). The runtime alternates between them:


Decode runs on separate CUDA streams during bootstrap, attention, and easy MLP compute. By the time a hard layer’s MLP runs, its preprocessed weights are already waiting

While the GPU computes an easy layer — which needs no preprocessing — a separate set of CUDA streams is decoding the next hard layer’s weights in the background. By the time the easy layers finish and the hard layer’s turn arrives, its preprocessed data is already waiting. Double-buffered preprocess slots ensure that decode output from one hard layer isn’t overwritten while it’s still being consumed.

The down projection benefits most from this overlap: it’s consumed last in the MLP sequence (after gate, activation, and up), so its decode has the longest runway to complete.

Autotuning

With four pipelines, multiple matmul kernel variants , and a tunable SM split between decoding and computation, the configuration space is large. Rather than hard-coding a single strategy, Unweight uses an autotuner that measures actual end-to-end inference throughput on the target hardware. It sweeps candidate configurations for the gate projection while holding up and down fixed, then sweeps up, then down, repeating until no further improvement is found. The result is a per-model configuration file that tells the runtime exactly which pipeline, matmul variant, and SM allocation to use for each projection at each batch size — all driven by measured performance rather than heuristics.

One compression format, multiple uses

Encoding format, execution pipeline, and scheduling are independent choices. The same Huffman-compressed model bundle can serve both distribution and inference:

  • For distribution, Huffman encoding maximizes compression (~22% total model size reduction), reducing transfer times when shipping models across the network.

  • For inference, Huffman-encoded projections can be transcoded to the palette intermediate format on model load, enabling the most efficient runtime execution without constraining the distribution format.

A single model bundle doesn’t need to commit to one strategy at packaging time. The runtime selects the best execution path per projection and per batch size on the fly.

Our results 

On Llama 3.1 8B (our primary testbed), Unweight achieves:

  • ~13% model footprint reduction for inference bundles (compressing only gate/up MLP projections), or ~22% for distribution bundles (compressing all MLP projections including down). All compression is 100% bit-exact lossless. Extrapolating to Llama 70B, this can translate to roughly 18–28 GB saved depending on configuration.

  • 30–40% throughput overhead at current optimization level, measured end-to-end on H100 SXM5. The overhead is largest at batch size 1 (~41%) and narrows at batch 1024 (~30%). Three known sources – small-batch fixed costs, redundant weight-tile reconstruction, and the excluded down projection – are under active optimization.

These are intermediate results on a single model. The compression ratios should generalize to other SwiGLU architectures (exponent statistics are consistent across model scales), but the throughput numbers are specific to the current kernel implementations and will change as optimization continues. We do not yet compress attention weights, embeddings, or layer norms, which dilute the overall reduction.

Why this matters 

GPUs are expensive in multiple dimensions: the cost of the cards themselves, the high-bandwidth memory they demand, and their significant power consumption.

To combat this, several researchers have shown systems with promising results of ~30% compression ratios on full models — but these target consumer GPUs and research frameworks that don’t work at production scale. The key insight into Unweight’s development is that multilayer perceptrons (MLPs) constitute the majority of model weights and a significant amount of the compute cost during inference workloads. It compresses only MLP weights (avoiding overhead on layers where compression benefit is marginal), is designed specifically for datacenter H100 GPUs with their tightly-balanced compute and memory, and comes with four execution pipelines that adapt to batch size rather than using a single approach.

However, we want to be clear: Unweight is not a free lunch. On-chip reconstruction adds computational work that wouldn’t exist with uncompressed weights. On Llama 3.1 8B, the inference configuration saves approximately 13% of total model memory at a throughput cost of roughly 30% at typical serving batch sizes. This gap narrows at larger batches (where preprocess overlap improves) and is expected to narrow further as we optimize — in particular, we haven’t yet compressed the down projection in each MLP layer (about one-third of the compressible weights), and several kernel improvements are in active development.

For Cloudflare’s network, Unweight gives us better capacity: it allows us to serve state-of-the-art models with less GPU memory per instance, which translates to cost savings and the ability to deploy more models in more places. For model distribution, the savings are larger: Huffman-compressed bundles are about 22% smaller, reducing transfer times when shipping models to edge locations worldwide. 

What’s next 

Looking forward, we have three concrete research directions we think will improve upon our efficiency gains: 

Down projection compression. Unweight compresses gate and up MLP projections today, but down projection accounts for roughly one-third of compressible weights. This requires a different kernel variant due to its transposed dimensions, which we will expect to reduce the total model size beyond 22%.

Kernel optimization. The current 30–40% throughput overhead has three identified sources: small-batch fixed costs in the reconstructive matmul, redundant weight reconstruction at large batch sizes, and the missing down projection. Each has a known mitigation path, which we outline in our technical paper.

More models. Our results are for Llama 3.1 8B, but the underlying exponent statistics are consistent across SwiGLU architectures at all scales. We’re working to bring Unweight to the larger models we serve through Workers AI.

Longer term, we are investigating what Unweight’s architecture means for Mixture-of-Experts models, where cold experts must be fetched on demand and reduced storage would further reduce cost.

This is a fast-moving field, so we’re excited to open-source our work here and contribute to a growing corpus of research in compression and GPU efficiency. Unweight is one piece of the puzzle, but we hope that other researchers find it a useful paradigm to build upon!


Agents that remember: introducing Agent Memory

Post Syndicated from Tyson Trautmann original https://blog.cloudflare.com/introducing-agent-memory/

As developers build increasingly sophisticated agents on Cloudflare, one of the biggest challenges they face is getting the right information into context at the right time. The quality of results produced by models is directly tied to the quality of context they operate with, but even as context window sizes grow past one million (1M) tokens, context rot remains an unsolved problem. A natural tension emerges between two bad options: keep everything in context and watch quality degrade, or aggressively prune and risk losing information the agent needs later.

Today we’re announcing the private beta of Agent Memory, a managed service that extracts information from agent conversations and makes it available when it’s needed, without filling up the context window.

It gives AI agents persistent memory, allowing them to recall what matters, forget what doesn’t, and get smarter over time. In this post, we’ll explain how it works — and what it can help you build.

The state of agentic memory

Agentic memory is one of the fastest-moving spaces in AI infrastructure, with new open-source libraries, managed services, and research prototypes launching on a near-weekly basis. These offerings vary widely in what they store, how they retrieve, and what kinds of agents they’re designed for. Benchmarks like LongMemEval, LoCoMo, and BEAM provide useful apples-to-apples comparisons, but they also make it easy to build systems that overfit for a specific evaluation and break down in production.

Existing offerings also differ in architecture. Some are managed services that handle extraction and retrieval in the background, others are self-hosted frameworks where you run the memory pipeline yourself. Some expose constrained, purpose-built APIs that keep memory logic out of the agent’s main context; others give the model raw access to a database or filesystem and let it design its own queries, burning tokens on storage and retrieval strategy instead of the actual task. Some try to fit everything into the context window, partitioning across multiple agents if needed, while others use retrieval to surface only what’s relevant. 

Agent Memory is a managed service with an opinionated API and retrieval-based architecture. We’ve carefully considered the alternatives, and we believe this combination is the right default for most production workloads. Tighter ingestion and retrieval pipelines are superior to giving agents raw filesystem access. In addition to improved cost and performance, they provide a better foundation for complex reasoning tasks required in production, like temporal logic, supersession, and instruction following. We’ll likely expose data for programmatic querying down the road, but we expect that to be useful for edge cases, not common cases.

We built Agent Memory because the workloads we see on our platform exposed gaps that existing approaches don’t fully address. Agents running for weeks or months against real codebases and production systems need memory that stays useful as it grows — not just memory that performs well on a clean benchmark dataset that may fit entirely into a newer model’s context window. 

They need fast ingestion. They need retrieval that doesn’t block the conversation. And they need to run on models that keep the per-query cost reasonable.

How you use it

Agent Memory stores memories in a profile, which is addressed by name. A profile gives you several operations: ingest a conversation, remember something specific, recall what you need, list memories, or forget a specific memory. Ingest is the bulk path that is typically called when the harness compacts context. Remember is for the model to store something important on the spot. Recall runs the full retrieval pipeline and returns a synthesized answer.

export default {
  async fetch(request: Request, env: Env): Promise<Response> {
    // Get a profile -- an isolated memory store shared across sessions, agents, and users
    const profile = await env.MEMORY.getProfile("my-project");
    // Ingest -- extract memories from a conversation (typically called at compaction)
    await profile.ingest([
      { role: "user", content: "Set up the project with React and TypeScript." },
      { role: "assistant", content: "Done. Scaffolded a React + TS project targeting Workers." },
      { role: "user", content: "Use pnpm, not npm. And dark mode by default." },
      { role: "assistant", content: "Got it -- pnpm and dark mode as default." },
    ], { sessionId: "session-001" });
    // Remember -- store a single memory explicitly (direct tool use by the model)
    const memory = await profile.remember({
      content: "API rate limit was increased to 10,000 req/s per zone after the April 10 incident.",
      sessionId: "session-001",
    });
    // Recall -- retrieve memories and get a synthesized answer
    const results = await profile.recall("What package manager does the user prefer?");
    console.log(results.result); // "The user prefers pnpm over npm."
    return Response.json({ ok: true });
  },
};

Agent Memory is accessed via a binding from any Cloudflare Worker. It can also be accessed via a REST API for agents running outside of Workers, following the same pattern as other Cloudflare developer platform APIs. If you’re building with the Cloudflare Agents SDK, the Agent Memory service integrates neatly as the reference implementation for handling compaction, remembering, and searching over memories in the memory portion of the Sessions API.

What you can build with it

Agent Memory is designed to work across a range of agent architectures:

Memory for individual agents. Regardless of whether you’re building with coding agents like Claude Code or OpenCode with a human in the loop, using self-hosted agent frameworks like OpenClaw or Hermes to act on your behalf, or wiring up managed services like Anthropic’s Managed Agents, Agent Memory can serve as the persistent memory layer without any changes to the agent’s core loop.

Memory for custom agent harnesses. Many teams are building their own agent infrastructure, including background agents that run autonomously without a human in the loop. Ramp Inspect is one public example; Stripe and Spotify have described similar systems. These harnesses can also benefit from giving their agents memory that persists across sessions and survives restarts.

Shared memory across agents, people, and tools. A memory profile doesn’t have to belong to a single agent. A team of engineers can share a memory profile so that knowledge learned by one person’s coding agent is available to everyone: coding conventions, architectural decisions, tribal knowledge that currently lives in people’s heads or gets lost when context is pruned. A code review bot and a coding agent can share memory so that review feedback shapes future code generation. The knowledge your agents accumulate stops being ephemeral and starts becoming a durable team asset.

While search is a component of memory, agent search and agent memory solve distinct problems. AI Search is our primitive for finding results across unstructured and structured files; Agent Memory is for context recall. The data in Agent Memory doesn’t exist as files; it’s derived from sessions. An agent can use both, and they are designed to work together. 

Your memories are yours

As agents become more capable and more deeply embedded in business processes, the memory they accumulate becomes genuinely valuable — not just as an operational state, but as institutional knowledge that took real work to build. We’re hearing growing concern from customers about what it means to tie that asset to a single vendor, which is reasonable. The more an agent learns, the higher the switching cost if that memory can’t move with it.

Agent Memory is a managed service, but your data is yours. Every memory is exportable, and we’re committed to making sure the knowledge your agents accumulate on Cloudflare can leave with you if your needs change. We think the right way to earn long-term trust is to make leaving easy and to keep building something good enough that you don’t want to.

How Agent Memory works

To understand what happens behind the API shown above, it helps to break down how agents manage context. An agent has three components:

  1. A harness that drives repeated calls to a model, facilitates tool calls, and manages state.

  2. A model that takes context and returns completions.

  3. State that includes both the current context window and additional information outside context: conversation history, files, databases, memory.

The critical moment in an agent’s context lifecycle is compaction, when the harness decides to shorten context to stay within a model’s limits or to avoid context rot. Today, most agents discard information permanently. Agent Memory preserves knowledge on compaction instead of losing it.

Agent Memory integrates into this lifecycle in two ways:

  1. Bulk ingestion at compaction. When the harness compacts context, it ships the conversation to Agent Memory for ingestion. Ingestion extracts facts, events, instructions, and tasks from the message history, deduplicates them against existing memories, and stores them as memories for future retrieval.

  2. Direct tool use by the model. The model gets tools to interact directly with memories, including the ability to recall (search memories for specific information). The model can also remember (explicitly store memories based on something important), forget (mark a memory as no longer important or true), and list (see what memories are stored). These are lightweight operations that don’t require the model to design queries or manage storage. The primary agent should never burn context on storage strategy. The tool surface it sees is deliberately constrained so that memory stays out of the way of the actual task.

The ingestion pipeline

When a conversation arrives for ingestion, it passes through a multi-stage pipeline that extracts, verifies, classifies, and stores memories.


The first step is deterministic ID generation. Each message gets a content-addressed ID — a SHA-256 hash of session ID, role, and content, truncated to 128 bits. If the same conversation is ingested twice, every message resolves to the same ID, making re-ingestion idempotent. 

Next, the extractor runs two passes in parallel. A full pass chunks messages at roughly 10K characters with two-message overlap and processes up to four chunks concurrently. Each chunk gets a structured transcript with role labels, relative dates resolved to absolutes (“yesterday” becomes “2026-04-14”), and line indices for source provenance. For longer conversations (9+ messages), a detail pass runs alongside the full pass, using overlapping windows that focus specifically on extracting concrete values like names, prices, version numbers, and entity attributes that broad extraction tends to miss. The two result sets are then merged.

The next step is to verify each extracted memory against the source transcript. The verifier runs eight checks covering entity identity, object identity, location context, temporal accuracy, organizational context, completeness, relational context, and whether inferred facts are actually supported by the conversation. Each item is passed, corrected, or dropped accordingly.

The pipeline then classifies each verified memory into one of  four types. 

  • Facts represent what is true right now, atomic, stable knowledge like “the project uses GraphQL” or “the user prefers dark mode.” 

  • Events capture what happened at a specific time, like a deployment or a decision. 

  • Instructions describe how to do something, such as procedures, workflows, runbooks. 

  • Tasks track what is being worked on right now and are ephemeral by design.

Facts and instructions are keyed. Each gets a normalized topic key, and when a new memory has the same key as an existing one, the old memory is superseded rather than deleted. This creates a version chain with a forward pointer from the old memory to the new memory. Tasks are excluded from the vector index entirely to keep it lean but remain discoverable via full-text search.

Finally, everything is written to storage using INSERT OR IGNORE so that content-addressed duplicates are silently skipped. After returning a response to the harness, background vectorization runs asynchronously. The embedding text prepends the 3-5 search queries generated during classification to the memory content itself, bridging the gap between how memories are written (declaratively: “user prefers dark mode”) and how they’re searched (interrogatively: “what theme does the user want?”). Vectors for superseded memories are deleted in parallel with new upserts.

The retrieval pipeline

When an agent searches for a memory, the query goes through a separate retrieval pipeline. During development, we discovered that no single retrieval method works best for all queries, so we run several methods in parallel and fuse the results.


The first stage runs query analysis and embedding concurrently. The query analyzer produces ranked topic keys, full-text search terms with synonyms, and a HyDE (Hypothetical Document Embedding), a declarative statement phrased as if it were the answer to the question. This stage embeds the raw query directly, and both embeddings are used downstream.

In the next stage, five retrieval channels run in parallel. Full-text search with Porter stemming handles keyword precision for queries where you know the exact term but not the surrounding context. Exact fact-key lookup returns results where the query maps directly to a known topic key. Raw message search queries the stored conversation messages directly via full-text search for unclassified conversation fragments that act as a safety net, catching verbatim details that the extraction pipeline may have generalized away. Direct vector search finds semantically similar memories using the embedded query. And HyDE vector search finds memories that are similar to what the answer would look like, which often surfaces results that direct embedding misses — particularly for abstract or multi-hop queries where the question and the answer use different vocabulary.

In the third and final stage, results from all five retrieval channels are merged using Reciprocal Rank Fusion (RRF), where each result receives a weighted score based on where it ranked within a given channel. Fact-key matches get the highest weight because an exact topic match is the strongest signal. Full-text search, HyDE vectors, and direct vectors are each weighted based on strength of signal. Finally, raw message matches are also included with low weight as a safety net to identify candidate results the extraction pipeline may have missed. Ties are broken by recency, with newer results ranked higher.

The pipeline then passes the top candidates to the synthesis model, which generates a natural-language answer to the original search query. Some specific query types get special treatment. As an example, temporal computation is handled deterministically via regex and arithmetic, not by the LLM. The results are injected into the synthesis prompt as pre-computed facts. Models are unreliable at things like date math, so we don’t ask them to do it.

How we built it

Our initial prototype of Agent Memory was lightweight, with a basic extraction pipeline, vector storage, and simple retrieval. It worked well enough to demonstrate the concept, but not well enough to ship.

So we put it into an agent-driven loop and iterated. The cycle looked like this: run benchmarks, analyze where we had gaps, propose solutions, have a human review the proposals to select strategies that generalize rather than overfit, let the agent make the changes, repeat.

This worked well, but came with one specific challenge. LLMs are stochastic, even with temperature set to zero. This caused results to vary across runs, which meant we had to average multiple runs (time-consuming for large benchmarks) and rely on trend analysis alongside raw scores to understand what was actually working. Along the way we had to guard carefully against overfitting the benchmarks in ways that didn’t genuinely make the product better for the general case.

Over time, this got us to a place where benchmark scores improved consistently with each iteration and we had a generalized architecture that would work in the real world. We intentionally tested against multiple benchmarks (including LoCoMo, LongMemEval, and BEAM) to push the system in different ways.


Why Cloudflare

We build Cloudflare on Cloudflare, and Agent Memory is no different. Existing primitives that are powerful and easily composable allowed us to ship the first prototype in a weekend and a fully functioning, productionized internal version of Agent Memory in less than a month. In addition to speed of delivery, Cloudflare turned out to be the ideal place to build this kind of service for a few other reasons.


Under the hood, Agent Memory is a Cloudflare Worker that coordinates several systems:

  • Durable Object: stores the raw messages and classified memories

  • Vectorize: provides vector search over embedded memories

  • Workers AI: runs the LLMs and embedding models

Each memory context maps to its own Durable Object instance and Vectorize index, keeping data fully isolated between contexts. It also allows us to scale easily with higher demands.

Compute isolation via Durable Objects. Each memory profile gets its own Durable Object (DO) with a SQLite-backed store, providing strong isolation between tenants without any infrastructure overhead. The DO handles FTS indexing, supersession chains, and transactional writes. DO’s getByName() addressing means any request, from anywhere, can reach the right memory profile by name, and ensures that sensitive memories are strongly isolated from other tenants.

Storage across the stack. Memory content lives in SQLite-backed DOs. Vectors live in Vectorize. In the future, snapshots and exports will go to R2 for cost-efficient long-term storage. Each primitive is purpose-built for its workload, we don’t need to force everything into a single shape or database.

Local model inference with Workers AI. The entire extraction, classification, and synthesis pipeline runs on Workers AI models deployed on Cloudflare’s network. All AI calls pass a session affinity header routed to the memory profile name, so repeated requests hit the same backend for prompt caching benefits.

One interesting finding from our model selection: a bigger, more powerful model isn’t always better. We currently default to Llama 4 Scout (17B, 16-expert MoE) for extraction, verification, classification, and query analysis, and Nemotron 3 (120B MoE, 12B active parameters) for synthesis. Scout handles the structured classification tasks efficiently, while Nemotron’s larger reasoning capacity improves the quality of natural-language answers. The synthesizer is the only stage where throwing more parameters at the problem consistently helped. For everything else, the smaller model hit a better sweet spot of cost, quality, and latency.

How we’ve been using it

We run Agent Memory internally for our own workflows at Cloudflare, as both a proving ground and a source of ideas for what to build next.

Coding agent memory. We use an internal OpenCode plugin that wires Agent Memory into the development loop. Agent Memory provides memory of past compaction within sessions and across them. The less obvious benefit has been shared memory across a team: with a shared profile, the agent knows what other members of your team have already learned, which means it can stop asking questions that have already been answered and stop making mistakes that have already been corrected.

Agentic code review. We’ve connected Agent Memory to our internal agentic code reviewer. Arguably the most useful thing it learned to do was stay quiet. The reviewer now remembers that a particular comment wasn’t relevant in a past review, that a specific pattern was flagged, and the author chose to keep it for a good reason. Reviews get less noisy over time, not just smarter.

Chat bots. We’ve also wired memory into an internal chat bot that ingests message history and then lurks and remembers new messages that are sent. Then, when someone asks a question, the bot can answer based on previous conversations.

We also have a number of additional use cases that we plan to roll out internally in the near future as we refine and improve the service.

What’s next

We’re continuing to test and refine Agent Memory internally, improving the extraction pipeline, tuning retrieval quality, and expanding the background processing capabilities. Similar to how the human brain consolidates memories by replaying and strengthening connections during sleep, we see opportunities for memory storage to improve asynchronously and are currently implementing and testing various strategies to make this work.

We plan to make Agent Memory publicly available soon. If you’re building agents on Cloudflare and want early access, contact us to join the waitlist.

If you want to dig into the architecture, share what you’re building, or follow along as we develop this further, join us on the Cloudflare Discord or start a thread in the Cloudflare Community. We’re actively watching both, and are interested in what production agent workloads actually look like in the wild.

Agents Week: network performance update

Post Syndicated from Lai Yi Ohlsen original https://blog.cloudflare.com/network-performance-agents-week/

When it comes to the Internet, performance is everything. Every millisecond shaved off a connection is a better experience for the real people using the applications and websites you build. That’s why, at Cloudflare, we measure our performance constantly and share updates on a regular basis. 

In our last performance post, published during Birthday Week 2025, we shared that Cloudflare was the fastest network in 40% of the largest 1,000 networks in the world. At the time, we noted a nuanced reading of that figure; we were competitive in many more networks, and the gaps were often notably small. But even so, we were not satisfied with 40%. By December 2025 (our most recent available analysis), we had become the fastest provider in 60% of the top networks. Here’s how we got there, and what it means.

How do we measure and compare network performance?

Before diving into the results, let’s review how we collect the data. We start with the 1,000 largest networks in the world by estimated population, using APNIC’s data as our source. These networks represent real users in nearly every geography, giving us a broad and meaningful picture of how Internet users experience the web.

To measure performance, we use TCP connection time, which is the time it takes for an end user’s device to complete a TCP handshake with the endpoint they’re trying to reach. We chose this metric because it most closely approximates what users actually perceive as “Internet speed.” It’s not so abstract that it ignores real-world constraints like congestion and distance, but it’s precise enough to give us actionable data. (We’ve previously written about why we favor this metric over alternatives.)

We calculate our rankings using the trimean of TCP connection times. The trimean is a weighted average of three values: the first quartile (25th percentile), the median (50th percentile), and the third quartile (75th percentile). This approach smooths out noise and outliers, giving us a cleaner signal about the typical user experience rather than an extreme case that might skew the picture.

To capture this data, we rely on Real User Measurements (RUM). When users encounter a Cloudflare-branded error page, a small speed test runs silently in the background. The browser retrieves small files from multiple providers including Cloudflare, Amazon CloudFront, Google, Fastly, and Akamai and records how long each exchange takes. This gives us performance data directly from the user’s browser, in their real-world network conditions. It’s the difference between testing a car’s top speed on a track versus watching how people actually drive on the highway. 

How did we improve? 

Historically we have shared how we’ve created new Cloudflare points of presence and reduced our end latency by simply getting more hardware closer to our users. Most recently, we deployed new locations in Constantine, Algeria; Malang, Indonesia; and Wroclaw, Poland. When we deployed our location in Wroclaw, our free users went from an average of 19ms round-trip time (RTT) to an average of 12ms round trip time (RTT), a 40% improvement. In Malang, Enterprise traffic went from a 39ms average RTT to a 37ms average RTT, a 5% improvement. Seeing our customers’ experience improve, even if only by a couple of milliseconds, is great. But adding new locations alone doesn’t fully explain how we went from being #1 in 40% of networks to #1 in 60% of networks.

The answer there has to do with improving how our network handles connections in software. By leveraging protocols like HTTP/3 and changing how we manage congestion windows, we can reduce processing time by milliseconds in code, in addition to the improvements on the wire. By improving CPU usage and memory usage in our software that handles fundamental actions like establishing connections, SSL/TLS termination, traffic management, and the core proxy that all requests flow through, we can make that software more efficient in its usage of resources across our global fleet of hardware. These ongoing efficiency gains result in better performance for you and your customers. 

Think of incoming connections to Cloudflare like toll booths on a highway. Lines can build up at toll booths if there aren’t enough toll booths, or if the booths themselves aren’t efficient at processing cars going through them. We’ve been constantly working to improve not only how our toll booths process incoming cars (the software improvements in connection handling), but also at improving how we send cars between available booths so that we can keep lines short and latency low.   

How do the results look today?

As we noted above, by December, Cloudflare had become the fastest provider in 60% of the top networks, up from 40% when we last reported. Since Birthday Week in September 2025 we have steadily increased the networks where we are the fastest. Let’s break down the impact.


This means that between September and December, we became the fastest in 40 additional countries and in 261 additional networks. We saw the biggest increase in the United States, where we are the fastest in 54 more ASNs.


On average throughout December, we were 6ms faster than the next-fastest provider. As shown above, the line representing Cloudflare’s latency, or connection time, is consistently lower throughout December than the next fastest provider.

A faster Internet is a better Internet

Every percentage point in our network ranking represents real users who are able to connect to their website or application that much faster because of Cloudflare. But we also know that 60% isn’t the ceiling. There are still networks where we’re number two, sometimes by the smallest of margins. We see those gaps clearly, and we’re working on them. We’re committed to being the fastest provider across every network in the world. 

Follow our blog for more performance updates as we continue to make the Internet faster.

Introducing Flagship: feature flags built for the age of AI

Post Syndicated from Rohan Mukherjee original https://blog.cloudflare.com/flagship/

AI is writing more code than ever. AI-assisted contributions now account for a rapidly growing share of new code across the platform. Agentic coding tools like OpenCode and Claude Code are shipping entire features in minutes.

AI-generated code entering production is only going to accelerate. But the bigger shift isn’t just speed — it’s autonomy.

Today, an AI agent writes code and a human reviews, merges, and deploys it. Tomorrow, the agent does all of that itself. The question becomes: how do you let an agent ship to production without removing every safety net?

Feature flags are the answer. An agent writes a new code path behind a flag and deploys it — the flag is off, so nothing changes for users. The agent then enables the flag for itself or a small test cohort, exercises the feature in production, and observes the results. If metrics look good, it ramps the rollout. If something breaks, it disables the flag. The human doesn’t need to be in the loop for every step — they set the boundaries, and the flag controls the blast radius.

This is the workflow feature flags were always building toward: not just decoupling deployment from release, but decoupling human attention from every stage of the shipping process. The agent moves fast because the flag makes it safe to move fast.

Today, we’re announcing Flagship — Cloudflare’s native feature flag service, built on OpenFeature, the CNCF open standard for feature flag evaluation. It works everywhere — Workers, Node.js, Bun, Deno, and the browser — but it’s fastest on Workers, where flags are evaluated within the Cloudflare network. With the Flagship binding and OpenFeature, integration looks like this:

await OpenFeature.setProviderAndWait(
    new FlagshipServerProvider({ binding: env.FLAGS })
);

Flagship is now available in closed beta.

The problem with feature flags on Workers

Many Cloudflare developers have resorted to the pragmatic workaround: hardcoding flag logic directly into their Workers. And honestly, it works well enough in the beginning. Workers deploy in seconds, so flipping a boolean in code and pushing it to production is fast enough for most situations.

But it doesn’t stay simple. One hardcoded flag becomes ten. Ten becomes fifty, owned by different teams, with no central view of what’s on or off. There’s no audit trail — when something breaks, you’re searching git blame to figure out who toggled what.

Network call to external services

Another common pattern used on workers is to make an HTTP request to an external service in the following manner:

const response = await fetch("https://flags.example-service.com/v1/evaluate", {
      ...
      body: JSON.stringify({
        flagKey: "new-checkout-flow",
        context: {
          ...
        },
      }),
    });
const { value } = await response.json();
if (value === true) {
    return handleNewCheckout(request);
}
return handleLegacyCheckout(request);

That outbound request sits on the critical path of every single user request. It could add considerable latency depending on how far the user is from the flag service’s region.

This is a strange situation. Your application runs at the edge, milliseconds from the user. But the feature flag check forces it to reach back across the Internet to another API before it can decide what to render.

Why local evaluation doesn’t solve the problem

Some feature flag services offer a “local evaluation” SDK. Instead of calling a remote API on every request, the SDK downloads the full set of flag rules into memory and evaluates them locally. No outbound request per evaluation and the flag decision happens in-process.

On Workers, none of these assumptions hold. There is no long-lived process: a Worker isolate can be created, serve a request, and be evicted between one request and the next. A new invocation could mean re-initializing the SDK from scratch.

On a serverless platform, you need a distribution primitive that’s already at the edge, one where the caching is managed for you, reads are local, and you don’t need a persistent connection to keep things up to date.

Cloudflare KV is a great primitive for this!

How Flagship works

Flagship is built entirely on Cloudflare’s infrastructure — Workers, Durable Objects, and KV. There are no external databases, no third-party services, and no centralized origin servers in the evaluation path.

When you create or update a flag, the control plane writes the change atomically to a Durable Object — a SQLite-backed, globally unique instance that serves as the source of truth for that app’s flag configuration and changelog. Within seconds, the updated flag config is synced to Workers KV, Cloudflare’s globally distributed key-value store, where it’s replicated across Cloudflare’s network.

When a request evaluates a flag, Flagship reads the flag config directly from KV at the edge — the same Cloudflare location already handling the request. The evaluation engine then runs right there in an isolate: it matches the request context against the flag’s targeting rules, resolves the rollout percentage, and returns a variation. Both the data and the logic live at the edge — nothing is sent elsewhere to be evaluated.


Using Flagship: the Worker binding

For teams running Cloudflare Workers, Flagship offers a direct binding that evaluates flags inside the Workers runtime — no HTTP round-trip, no SDK overhead. Add the binding to your wrangler.jsonc and your Worker is connected:

{
  "flagship": [
    {
      "binding": "FLAGS",
      "app_id": "<APP_ID>"
    }
  ]
}

That’s it. Your account ID is inferred from your Cloudflare account, and the app_id ties the binding to a specific Flagship app. In your Worker, you just ask for a flag value:

export default {
  async fetch(request: Request, env: Env) {
    // Simple boolean check
    const showNewUI = await env.FLAGS.getBooleanValue('new-ui', false, {
      userId: 'user-42',
      plan: 'enterprise',
    });
    // Full evaluation details when you need them
    const details = await env.FLAGS.getStringDetails('checkout-flow', 'v1', {
      userId: 'user-42',
    });
    // details.value = "v2", details.variant = "new", details.reason = "TARGETING_MATCH"
  },
};

The binding supports typed accessors for every variation type – getBooleanValue(), getStringValue(), getNumberValue(), getObjectValue() – plus *Details() variants that return the resolved value alongside the matched variant and the reason it was selected. On evaluation errors, the default value is returned gracefully. On type mismatches, the binding throws an exception — that’s a bug in your code, not a transient failure.

The SDK: OpenFeature-native

Most feature flag SDKs come with their own interfaces and evaluation patterns. Over time, those become deeply embedded in your codebase — and switching providers means rewriting every call site.

We didn’t want to build another one of those. Flagship is built on OpenFeature, the CNCF open standard for feature flag evaluation. OpenFeature defines a common interface for flag evaluation across languages and providers — it’s the same relationship that OpenTelemetry has to observability. You write your evaluation code once against the standard, and swap providers by changing a single line of configuration.

import { OpenFeature } from '@openfeature/server-sdk';
import { FlagshipServerProvider } from '@cloudflare/flagship/server';
await OpenFeature.setProviderAndWait(
  new FlagshipServerProvider({
    appId: 'your-app-id',
    accountId: 'your-account-id',
    authToken: 'your-cloudflare-api-token',
  })
);
const client = OpenFeature.getClient();
const showNewCheckout = await client.getBooleanValue(
  'new-checkout-flow',
  false,
  {
    targetingKey: 'user-42',
    plan: 'enterprise',
    country: 'US',
  }
);

If you’re running on Workers with the Flagship binding, you can pass it directly to the OpenFeature provider. The binding already carries your account context, so there’s nothing to configure — authentication is implicit.

import { OpenFeature } from '@openfeature/server-sdk';
import { FlagshipProvider } from '@cloudflare/flagship/server';
let initialized = false;
export default {
  async fetch(request: Request, env: Env) {
    if (!initialized) {
      await OpenFeature.setProviderAndWait(
        new FlagshipServerProvider({ binding: env.FLAGS })
      );
      initialized = true;
    }
    const client = OpenFeature.getClient();
    const showNewCheckout = await client.getBooleanValue('new-checkout-flow', false, {
      targetingKey: 'user-42',
      plan: 'enterprise',
    });
  },
};

Your evaluation code doesn’t change — the OpenFeature interface is identical. But under the hood, Flagship evaluates flags through the binding instead of over HTTP. You get the portability of the standard with the performance of the binding.

A client-side provider is also available for browsers. It pre-fetches the flags you specify, caches them with a configurable TTL, and serves evaluations synchronously from that cache.

What you can do with Flagship

Flagship supports the patterns you’d expect from a feature flag service and the ones that become critical when AI-generated code is landing in production daily.

Flag values can be boolean, strings, numbers, or full JSON objects — useful for configuration blocks, UI theme definitions, or routing users to different API versions without maintaining separate code paths.

Targeting Rules

Each flag can have multiple rules, evaluated in priority order. The first rule that matches wins.

A rule consists of:

  • Conditions that determine whether the rule applies to a given context

  • A flag variation to serve when the rule matches

  • An optional rollout for percentage-based delivery

  • A priority that determines evaluation order when multiple rules are present (lower number = higher priority)

Nested Logical Conditions

Conditions can be composed using AND/OR logic, nested up to five levels deep. A single rule can express things like:

(plan == “enterprise” AND region == “us” ) OR (user.email.endsWith(“@cloudflare.com”))
= serve (“premium”)

At the top level of a rule, multiple conditions are combined with implicit AND where all conditions must pass for the rule to match. Within each condition, you can nest AND/OR groups for more complex logic.

Flag Rollouts by Percentage

Unlike gradual deployments, which split traffic between different uploaded versions of your Worker, feature flags let you roll out behavior by percentage within a single version that is serving 100% of traffic.

Any rule can include a percentage rollout. Instead of serving a variation to everyone who matches the conditions, you serve it to a percentage of them.

Rollouts use consistent hashing on the specified context attribute. The same attribute value (userId, for example) always hashes to the same bucket, so they won’t flip between variations across requests. You can ramp from 5% to 10% to 50% to 100% of users, so those who were already in the rollout stay in it.

Built for what comes next

AI-generated code entering production is only going to accelerate. Agentic workflows will push it further — agents that autonomously deploy, test, and iterate on code in production. The teams that thrive in this world won’t be the ones shipping the fastest. They’ll be the ones who can ship fast and still maintain control over what their users see, roll back in seconds when something breaks, and gradually expose new code paths with confidence.

That’s what Flagship is built for:

  • Evaluation across region Earth, cached globally using K/V.

  • A full audit trail. Every flag change is recorded with field-level diffs, so you know who changed what and when.

  • Dashboard integration. Anyone on the team can toggle a flag or adjust a rollout without touching code.

  • OpenFeature compatibility. Adopt Flagship without rewriting your evaluation code. Leave without rewriting it either.

Get started with Flagship

Starting today, Flagship is in private beta. You can request for access here. We’ll share more details on pricing as we approach general availability.

  • Visit the Cloudflare dashboard to create your first Flagship app

  • Install the SDK: npm i @cloudflare/flagship; or use the Worker binding directly in your Worker

  • Read the documentation for integration guides and API reference

  • Check out the source code for examples and to contribute

If you’re currently hardcoding flags in your Workers, or evaluating flags through an external service that adds latency to every request, give Flagship a try. We’d love to hear what you build.

Просто добави радост. Какво са съвременните палиативни грижи за деца

Post Syndicated from Надежда Цекулова original https://www.toest.bg/prosto-dobavi-radost-kakvo-sa-suvremennite-paliativni-grizhi-za-detsa/

Просто добави радост. Какво са съвременните палиативни грижи за деца

В България терминът „палиативни грижи“ провокира мисълта за смърт. Асоциативният рефлекс е толкова силен, че е заложен дори в нормативните актове. В своето развитие медицината обаче отдавна е прескочила този етап и съвременното разбиране за палиативните грижи надхвърля не само последните дни от живота на тежко болните пациенти, а и възможностите на самата медицина. 

Когато става дума за деца, съвременните палиативни грижи имат ролята не просто да облекчават болка. 

А да осигурят детство. 


Детските палиативни грижи – малко история и ново разбиране за детството на болните деца

Според съвременните разбирания и актуалната дефиниция на Световната здравна организация палиативните грижи са подход, който подобрява качеството на живот на пациенти (възрастни и деца) и техните семейства, изправени пред животозастрашаващо заболяване или състояние, съкращаващо очакваната продължителност на живота. Целта на палиативите грижи е да предотвратяват и облекчават страданието чрез ранно откриване, оценка и лечение на болка и други проблеми – физически, психосоциални или духовни. 

За основоположничка на съвременното палиативно движение се смята Сисили Сондърс (1918–2005). През 1948 г. медицинската сестра Сисили Сондърс се влюбва в своя пациент Дейвид Тасма, полски евреин, умиращ от рак. Той ѝ оставя в наследство 500 паунда (равняващи се на приблизително 19 000 паунда през 2021 г.) за създаване на бъдещия хоспис за терминално болни пациенти „Сейнт Кристофър“. 

След като Сондърс преминава през дълго обучение и фондонабиране, през 1967 г. е открит хосписът „Сейнт Кристофър“, който и до днес се намира в Сидънъм, Лондон. Според Сондърс хосписът трябва да е „дом извън дома“, а не болнично заведение, и освен да получават облекчение на симптомите на заболяването, пациентите трябва да имат възможност да общуват, да пишат, да рисуват, да се разхождат в градината, да извършват ежедневните дейности, които им доставят радост и удоволствие.

Концепцията за педиатрични палиативни грижи се заражда през 70-те години на XX век, като първите наблюдения са върху нуждата от специфични грижи за умиращи деца. През 1982 г. друга медицинска сестра – Франсис Доминика, създава първия детски хоспис „Хелънс Хаус“ в Англия. До този момент децата в страната (и в развития свят), които са имали нужда от грижи в края на живота, са ги получавали в болница или в хосписи за възрастни, където условията не са били съобразени с особеностите и нуждите на детето. 

Човешката цена на липсващите палиативни грижи за деца в България
Между 6000 и 8000. По прогнозни данни толкова са децата у нас, които имат нужда от палиативни грижи. Палиативни се наричат грижите за тежко болни пациенти, в резултат на които се облекчава страданието…
Просто добави радост. Какво са съвременните палиативни грижи за деца

Вдъхновението идва от едно малко момиче на име Хелън, което остава с тежко и необратимо мозъчно увреждане след спешна операция за отстраняване на мозъчен тумор. Родителите ѝ я вземат у дома, за да се грижат за нея в семейна среда. Между сестра Франсис и родителите на Хелън се създава приятелство и понякога тя се грижи за Хелън за кратки периоди, за да даде отдих на родителите ѝ. Именно от това приятелство се ражда идеята за малък уютен хоспис за деца.

Както се вижда, концепцията за детски палиативни грижи е доста млада. Едва в последните години на XX век този модел постепенно разширява обхвата си, защото се развива разбирането, че тежко болните деца и техните семейства се нуждаят от подкрепа в целия ход на заболяването, а не само в края му. 

Повлияни от цялостното развитие на концепцията за детството, детето и неговите права, палиативните грижи интегрират идеята за ключовата роля на семейството в живота на детето и започват постепенно да разширяват обхвата си към семейните затруднения и нужди, като в осигуряването на грижи вече се включват не само медицински специалисти с различен профил, но изцяло нови подкрепящи професионалисти от социалната, психологическата и духовната сфера. 

Институционалният модел в България и защо не можем да помръднем напред

В България информацията за развитието на палиативните грижи преди 1990 г. е ограничена и някои основни изводи могат да се съставят единствено на основата на общи исторически факти и тенденции в страната по време на комунистическия режим. В този период грижите за пациенти с тежки заболявания и състояния, съкращаващи очакваната продължителност на живота, включително деца, са били до голяма степен институционализирани и често ограничени до предоставяне на медицински услуги. 

Информация за децата с увреждания и заболявания, които в една съвременна система биха попаднали при детските палиативни специалисти, в края на XX век започва да се събира и публикува от някои граждански организации. Наблюденията им са фрапиращи и донякъде обясняват защо и до днес ни е трудно да си представим хуманни грижи в общността, без значение какъв е характерът на нуждата на даден човек. 

Реформата на домовете за деца – между обещанията и реалността
На хартия процесът на деинституционализация е успешен – всички домове за деца (с изключение на два) са закрити. На практика обаче не е точно така. В дебютната си статия за „Тоест“ Евгения Тонева анализира кое не е наред с деинституционализацията, но и какви са нейните успехи – въпреки проблемите.
Просто добави радост. Какво са съвременните палиативни грижи за деца

По данни на Българския хелзинкски комитет в Домовете за медико-социални грижи за деца към Министерството на здравеопазването през 2000 г. са настанени 3379 деца на възраст от 0 до 3 години. Според наблюденията на организацията около 1/3 от тях са с увреждания, като повечето са изоставени от родителите си с декларация за отказ още в родилния дом. 2259 деца с увреждания пък са настанени в целогодишни домове за деца и младежи с умствени и физически проблеми. Организацията посочва, че между 70 и 90% от децата с увреждания в домовете са изоставени, а по-тежко увредените от тях практически не получават никакви грижи, тъй като са определени като „необучаеми“ и „чисто медицински случаи“: 

… в някои от домовете за лица с умствени увреждания и психични заболявания поради мизерните условия, системното недохранване и неадекватните медицински грижи обитателите им са изложени на сериозен риск за своя живот.

Изследователите установяват, че лекари са назначени едва в 3 от 31 дома. 

Един от първите официални документи, в който се споменава терминът „палиативни грижи“, е Законът за здравето, приет през 2004 г. В него се определя правото на пациентите с нелечими заболявания на палиативни медицински грижи: 

Пациент с нелечимо заболяване има право на палиативни медицински грижи, насочени към подобряване качеството на живота му, облекчаване на болката и страданията.

Институционалният модел обаче е запазен частично и до днес, сянката му може да бъде забелязана включително в плановете за бъдещо развитие на системата за оказване на палиативни грижи единствено под формата на институционални услуги. В същото време усилията за реформирането му бележат началото си от първите години на XXI век, когато официално започва процесът по т.нар. деинституционализация – закриване на съществуващите към 2008 г. 32 дома за медико-социални грижи за деца до 3 години, 25 дома за деца с увреждания и 76 дома за деца, лишени от родителски грижи, в които се отглеждат над 10 000 деца. 

Домовете за деца – между институционалното наследство и човешкото лице на грижата
Социалистическото наследство на домовете на деца тегне и днес, когато тези институции са вече уж закрити. Евгения Тонева разказва защо дехуманизиращите нагласи, порядки и стигмата продължават да се възпроизвеждат.
Просто добави радост. Какво са съвременните палиативни грижи за деца

Значима роля в този процес изиграва филмът на журналистката от BBC Кейт Блюит „Изоставените деца на България“. Историята разкрива условията и практиките в един от домовете за деца с уврeждания в България – в русенското село Могилино. 90-минутният документален филм предизвиква международен скандал и бурна медийна кампания в България. Част от реакциите на ключови към онзи момент политически лица стават нарицателни, например репликата на социалната министърка Емилия Масларова, че 

… това са деца, които това могат, толкова. 

В началото на 2026 г. в страната все още функционират три дома за медико-социални грижи за деца, чийто срок за закриване се отлага вече близо десет години. В тях се полагат грижи за деца с тежки увреждания, често с нужди, попадащи в дефиницията на палиативните грижи. Съществуващите услуги за подкрепа при отглеждане на тези деца в семейна среда все още са крайно недостатъчни като брой и разнообразие. Освен това голяма част от нормативните документи в сферата на медицината и здравеопазването не са адаптирани към съвременната концепция и продължават да поддържат остарялата дефиниция, а публичните политики в сферата „са изтъкани главно от липси“, както се казва в доклад на Фондация „Ида“, занимаваща се със застъпничество за съвременни детски палиативни грижи. 

В своето изследване Фондация „Ида“ пише, че 

при екстраполация на данни от други държави като Германия и Холандия можем да прогнозираме, че във всеки един момент в България има 5000–8000 деца, нуждаещи се от палиативни грижи, в различен стадий на напредналост на тяхното заболяване. За съжаление, липсват статистически данни от България, които да потвърдят тези изчисления. 

Анализът на правната рамка, развит в същия доклад, установява „тежки дефицити в законодателството, правещи практически невъзможно оказването на адекватни палиативни грижи за деца“.

Просто добави радост

„Палиативните грижи целят подобряване на качеството на живот на детето, а за едно дете това какво означава?“, пита риторично д-р Бояна Петкова, съпредседателка на Фондация „Ида“ и единственият у нас абсолвент на Европейската академия за палиативни грижи. Според нея означава 

детето да може да „обитава“ детството си – да има приятели, да може да учи и да играе, да преживява радост, да може да прекарва възможно най-много време извън болницата, да живее максимално пълноценно и пълнокръвно дори когато не можем да премахнем болестта или да добавим дни към живота. 

Тази действителност е непозната в България, но е възможна. И не само това – тя е част от системи, в които иначе можем да срещнем много от познатите си проблеми. Развити детски палиативни грижи има не само в Англия и Германия, но също и в държави като Полша и Румъния. 

В България има отделни специалисти и институции, които полагат усилия да предлагат модерни детски палиативни грижи. Липсата на рамка, работеща система и разбиране на темата обаче ги превръщат в еднорози в една цялостно нехуманна към болните деца среда. 

За да се промени това, трябва първо достатъчно много хора да повярват, че болните деца също са деца и имат право на детство. 


„Да говорим с грижа: Палиативните грижи за деца през погледа на медиите“ е поредица на Надежда Цекулова, посветена на публичния разговор за детските палиативни грижи. 
През 2025 г. Надежда Цекулова завършва и представя изследване на медийния дискурс на палиативните грижи за деца. Без изненада, задълбоченият прочит показа очакваното: по темата се знае малко, говори се институционализирано, а „главните герои“ – деца, родители и специалисти, просто отсъстват. В „Да говорим с грижа“ се обръщаме към публичните говорители с покана да опитаме заедно да променим това. 


Просто добави радост. Какво са съвременните палиативни грижи за деца

Настоящата публикация е създадена по проект „Да говорим с грижа: Палиативните грижи за деца през погледа на медиите“. Проектът се осъществява благодарение на най-голямата социално отговорна инициатива на Лидл България „Ти и Lidl“, в партньорство с Фондация „Работилница за граждански инициативи“, Български дарителски форум и Асоциация на европейските журналисти. Отговорността за съдържанието е на журналистката Надежда Цекулова и по никакъв начин не отразява официалните позиции на финансиращите организации.

Просто добави радост. Какво са съвременните палиативни грижи за деца

Mythos and Cybersecurity

Post Syndicated from B. Schneier original https://www.schneier.com/blog/archives/2026/04/mythos-and-cybersecurity.html

Last week, Anthropic pulled back the curtain on Claude Mythos Preview, an AI model so capable at finding and exploiting software vulnerabilities that the company decided it was too dangerous to release to the public. Instead, access has been restricted to roughly 50 organizations—Microsoft, Apple, Amazon Web Services, CrowdStrike and other vendors of critical infrastructure—under an initiative called Project Glasswing.

The announcement was accompanied by a barrage of hair-raising anecdotes: thousands of vulnerabilities uncovered across every major operating system and browser, including a 27-year-old bug in OpenBSD, a 16-year-old flaw in FFmpeg. Mythos was able to weaponize a set of vulnerabilities it found in the Firefox browser into 181 usable attacks; Anthropic’s previous flagship model could only achieve two.

This is, in many respects, exactly the kind of responsible disclosure that security researchers have long urged. And yet the public has been given remarkably little with which to evaluate Anthropic’s decision. We have been shown a highlight reel of spectacular successes. However, we can’t tell if we have a blockbuster until they let us see the whole movie.

For example, we don’t know how many times Mythos mistakenly flagged code as vulnerable. Anthropic said security contractors agreed with the AI’s severity rating 198 times, with an 89 per cent severity agreement. That’s impressive, but incomplete. Independent researchers examining similar models have found that AI that detects nearly every real bug also hallucinates plausible-sounding vulnerabilities in patched, correct code.

This matters. A model that autonomously finds and exploits hundreds of vulnerabilities with inhuman precision is a game changer, but a model that generates thousands of false alarms and non-working attacks still needs skilled and knowledgeable humans. Without knowing the rate of false alarms in Mythos’s unfiltered output, we cannot tell whether the examples showcased are representative.

There is a second, subtler problem. Large language models, including Mythos, perform best on inputs that resemble what they were trained on: widely used open-source projects, major browsers, the Linux kernel and popular web frameworks. Concentrating early access among the largest vendors of precisely this software is sensible; it lets them patch first, before adversaries catch up.

But the inverse is also true. Software outside the training distribution—industrial control systems, medical device firmware, bespoke financial infrastructure, regional banking software, older embedded systems—is exactly where out-of-the-box Mythos is likely least able to find or exploit bugs.

However, a sufficiently motivated attacker with domain expertise in one of these fields could nevertheless wield Mythos’s advanced reasoning capabilities as a force multiplier, probing systems that Anthropic’s own engineers lack the specialized knowledge to audit. The danger is not that Mythos fails in those domains; it is that Mythos may succeed for whoever brings the expertise.

Broader, structured access for academic researchers and domain specialists—cardiologists’ partners in medical device security, control-systems engineers, researchers in less prominent languages and ecosystems—would meaningfully reduce this asymmetry. Fifty companies, however well chosen, cannot substitute for the distributed expertise of the entire research community.

None of this is an indictment of Anthropic. By all appearances the company is trying to act responsibly, and its decision to hold the model back is evidence of seriousness.

But Anthropic is a private company and, in some ways, still a start-up. Yet it is making unilateral decisions about which pieces of our critical global infrastructure get defended first, and which must wait their turn.

It has finite staff, finite budget and finite expertise. It will miss things, and when the thing missed is in the software running a hospital or a power grid, the cost will be borne by people who never had a say.

The security problem is far greater than one company and one model. There’s no reason to believe that Mythos Preview is unique. (Not to be outdone, OpenAI announced that its new GPT-5.3-Codex is so dangerous that the model also will not be released to the general public.) And it’s unclear how much of an advance these new models represent. The security company Aisle was able to replicate many of Anthropic’s published anecdotes using smaller, cheaper, public AI models.

Any decisions we make about whether and how to release these powerful models are more than one company’s responsibility. Ultimately, this will probably lead to regulation. That will be hard to get right and requires a long process of consultation and feedback.

In the short term, we need something simpler: greater transparency and information sharing with the broader community. This doesn’t necessarily mean making powerful models like Claude Mythos widely available. Rather, it means sharing as much data and information as possible, so that we can collectively make informed decisions.

We need globally co-ordinated frameworks for independent auditing, mandatory disclosure of aggregate performance metrics and funded access for academic and civil-society researchers.

This has implications for national security, personal safety and corporate competitiveness. Any technology that can find thousands of exploitable flaws in the systems we all depend on should not be governed solely by the internal judgment of its creators, however well intentioned.

Until that changes, each Mythos-class release will put the world at the edge of another precipice, without any visibility into whether there is a landing out of view just below, or whether this time the drop will be fatal. That is not a choice a for-profit corporation should be allowed to make in a democratic society. Nor should such a company be able to restrict the ability of society to make choices about its own security.

This essay was written with David Lie, and originally appeared in The Globe and Mail.

Българският нелиберален въпрос

Post Syndicated from Емилия Милчева original https://www.toest.bg/bulgarskiyat-neliberalen-vupros/

Българският нелиберален въпрос

Нелиберализмът не е неизбежен. Така е озаглавен текстът на американската журналистка Ан Апълбаум в Τhe Atlantic по повод изборния разгром на Виктор Орбан и неговата партия „Фидес“ след 16 години управление на Унгария. 

Основната теза на Апълбаум е ясна: нелибералните режими не са историческа неизбежност. Те могат да бъдат победени не чрез козметични кампании, а с добре организирана гражданска мобилизация чрез упорита работа на терен. Победата на Петер Мадяр и „Тиса“, освен че прекъсна управлението на Орбан, разби мита, че подобни режими са обречени да печелят завинаги. Със своите 138 от 199 места в парламента „Тиса“ получава мнозинство, достатъчно за да промени сама Конституцията. Както намери за добре.

На този фон българската картина изглежда далеч по-неубедителна. В последната седмица преди изборите четири социологически проучвания – на „Маркет Линкс“, Центъра за анализи и маркетинг, „Тренд“ и „Мяра“, установиха преднина от над 10 процентни пункта на първия пред втория. Всички агенции дават над 30% за коалицията „Прогресивна България“ (ПБ) на Румен Радев.

Преди изборите: Инфлация на страхове, алгоритми на разделението и дъх на петрол
Предизборната кампания се води по всички фронтове. Докато партиите спорят на терен, а ние си мислим, че знаем какво става, алгоритмите преподреждат вниманието ни и пренаписват дневния ред в посока София–Будапеща–Москва. Да гледаме ли към Унгария в чудене и за нашите избори? От Емилия Милчева.
Българският нелиберален въпрос

Източен блок срещу руските санкции

Politico и британският Telegraph, които са собственост на германската медийна група Axel Springer, поставиха Румен Радев сред възможните наследници на Орбан като проводник на руско (а значи и нелиберално – б.а.) влияние в Европейския съюз. Останалите са бившият премиер на Словения Янез Янша и Джорджа Мелони (министър-председателка на Италия), Андрей Бабиш (министър-председател на Чехия) и Роберт Фицо (министър-председател на Словакия). 

Фицо вече заплаши, че ще наложи вето при гласуването в ЕС на новия 20-ти пакет санкции срещу Русия, който обхваща енергетиката, финансовите услуги и търговията. Условието е да получи петрол по нефтопровода „Дружба“, доставките по който бяха прекъснати, след като руски удар в Западна Украйна го повреди през януари. Словакия и Унгария обвиниха Украйна, че умишлено блокира транзита, а президентът Зеленски съобщи, че очакванията са ремонтът да завърши „тази пролет“.

Отива ли България там, откъдето Унгария се връща?
Унгария затваря цикъл, а България сякаш е на прага на нов. Между фигурата на „спасителя“, руското влияние и отслабващите институции стои въпросът „Накъде завиваме ние?“. Коментар на Светла Енчева.
Българският нелиберален въпрос

Подготвяният нов пакет санкции предвижда пълна забрана на морски услуги за руски петрол и разширяване на санкциите срещу т.нар. сенчест флот до 640 кораба, както и ограничения върху обслужването на LNG танкери с цел прекратяване на вноса на руски втечнен газ до края на 2026 г. Затяга се и финансовият натиск чрез санкции срещу още 20 руски банки, предвидени са мерки срещу криптовалутни операции, както и действия срещу банки в трети страни, подпомагащи заобикалянето на санкциите. Третият блок предвижда разширяване на експортните ограничения върху стоки и технологии с потенциално военно приложение за над 360 млн. евро, както и квоти за амоняк с цел допълнително ограничаване на руските приходи.

Президентът Радев не е крил, че е противник на санкциите – политика, която със сигурност би продължил и като глава на бъдещо правителство. Той, както и следовниците му не смятат Русия за агресор, нито Крим за украинска територия, незаконно окупирана от режима на Путин. И това не е новина, а сигнал. 

Това не е български въпрос, това е международен въпрос.

Така се изрази един от водачите на ПБ – бившият вътрешен министър Иван Демерджиев, на дебата, организиран от платформата „Извън ефир“. 

Има ли кой да се противопостави?

Външнополитическият риск за България при евентуално управление на Румен Радев засега няма как да бъде ефективно неутрализиран. Дали тази опасност произтича от собствената му политическа тежест, или от готовността на останалите политически актьори да се нагодят, по един или друг начин, към него? 

В действителност липсва не само силен опонент, но и ясна линия на противопоставяне.

Проблем е и това, че значителна част от избирателите чуват призивите за разбиване на „модела на задкулисие“ именно от Румен Радев, тъй като от антистатукво формациите той не се е колаборирал с Бойко Борисов и Делян Пеевски. 

Наред с това, отвъд наративите срещу модела „Борисов–Пеевски“/деребеите/олигархията липсват големите теми, които вълнуват гражданите. Ще бъдат ли реформирани образованието, здравеопазването, социалната сфера, данъчната система? Също и как ще се осъществи прокламираното благоденствие? Вместо това за пореден път се предлага „захарен памук“, по сполучливото определение на „Сега“.

Показателен е примерът със здравеопазването. Ако се сравнят програмите на ПБ, ПП–ДБ и „Възраждане“, тоест на формации, заявили се като алтернатива на статуквото и с шанс за парламентарно представителство, изненадата идва от либерализма на последните. Само „Възраждане“ допуска демонополизация на Здравната каса – ход, който би отворил системата за конкуренция и би могъл да промени реално пазара на здравни услуги.

Анахронизъм: Жените в предизборните програми през 2026 г.
В предизборните програми на партиите и коалициите жените почти липсват, освен като майки и демографски ресурс. Теми като равенство, насилие и труд остават встрани или се появяват бегло. Прегледът на тези програми показва системно изместване на разговора за правата на жените. От Светла Енчева.
Българският нелиберален въпрос

Ако има няколко здравни каси, хората ще избират къде да се осигуряват, и ще има конкуренция вместо настоящото централизирано разпределение. Въпросът е как да има повече избор и качество, но това дори не се предлага за дискусия. Изглежда, цари неформално съглашение, че системата има дребни недостатъци и затова няма да се разваля, а само ще се поправя (доколкото е възможно).

В същото време гражданите плащат по три начина за здраве: чрез здравни осигуровки, чрез данъците си (тъй като държавата допълва недостига и покрива осигуровките за определени групи) и чрез доплащане, което е най-високото в ЕС. 

Но ако за здравеопазването „Възраждане“ са либерали, за Русия са в хармония с Радев, който беше казал, че ей там, от другата страна на Черно море, има евтини енергийни суровини. 

Лидерът на „Възраждане“ Костадин Костадинов е още по-директен – той продължава на глас мисълта на Радев и предлага да се преговаря директно с Русия за внос на газ и петрол на ниски цени. Разбира се, в условията на отменени санкции. 

Конкурентен авторитаризъм

В бъдещия 52-ри парламент двете политически сили биха могли да се съюзят и за съвместно управление с мнозинство. Това би означавало България да направи още една крачка към нелиберален модел на управление след дълъг период, в който функционираше в разновидност на т.нар. „конкурентен авторитаризъм“ – понятие, въведено от изследователите Стивън Левицки и Лукан Уей. С него се описва режим, в който демократичните институции формално съществуват, но на практика се използват така, че да обслужват властта. 

Коремно възлизане през април
Кампанията тръгва с разместване на силите, нови играчи и познати лица в нови роли. Данните се люлеят, коалициите са отворени, а протестният вот търси поредния си носител. Въпросът вече е не кой води, а с кого и докъде може да стигне. Коментар на Емилия Милчева.
Българският нелиберален въпрос

Тези режими не са нито пълнокръвни демокрации, нито класически диктатури. Те допускат опозиция, но я отслабват с различни похвати и натиск. Провеждат избори, които не са честни. Използват институциите избирателно и за репресии. Затова са и по-коварни – 

изглеждат достатъчно демократични отвън, за да претендират за легитимност, и достатъчно авторитарни отвътре, за да възпроизвеждат властта си.

Но този модел не би могъл да е напълно стабилен. Щом има  избори, медии, съд, макар и под натиск, винаги остава възможност за пробив. Той обаче не гарантира автоматично смяна на модела – падането на един автократичен елит не означава, че след него няма да дойде друг. Въпросът е простичък: може ли властта да бъде реално сменена, или само се преразпределя между нови лица? Може ли да има нов Пеевски, който няма да прилича на настоящия, няма да има санкции по „Магнитски“, но реално ще управлява същите задкулисни мрежи на влияние?

Първият тест за бъдещия парламент е изборът на членове на нов Висш съдебен съвет. 

Именно там ще се види дали зад реториката за разграждане на „модела“ стои воля за промяна, или по-скоро готовност за ново пренареждане на влиянията. Защото ВСС не е технически въпрос, а инструментът, през който минават контролът върху съдебната власт и изборът на главен прокурор и на председатели на върховните съдилища.

Ако около този избор се оформи удобен консенсус, това ще бъде ясен сигнал, че системата не се променя, а се адаптира. Но гражданите може и да не го разберат веднага – дори когато пилотът на руския изтребител хване щурвала. 

Отива ли България там, откъдето Унгария се връща?

Post Syndicated from Светла Енчева original https://www.toest.bg/otiva-li-bulgariya-tam-otkudeto-ungariya-se-vrushta/

Отива ли България там, откъдето Унгария се връща?

Една седмица делят унгарските и българските парламентарни избори. И докато в Европа преобладава радостно облекчение след категоричния разгром на 16-годишното управление на Виктор Орбан, погледите не са вперени в България. А току-виж тя се превърне в следващия троянски кон на Русия в Европа. Проучванията отреждат победа на политическия проект на Румен Радев „Прогресивна България“. В предизборната му програма се говори за „свободна и суверенна европейска демокрация“ и „ясни демократични ценности“, но реториката и действията на Радев досега свидетелстват за последователна пропутинска ориентация.

Макар според прогнозите „Прогресивна България“ да е далеч от конституционно мнозинство, каквото получи „Тиса“, и дори от обикновеното, възможно е повече от половината депутати в следващия парламент да се окажат проруски. И да прокарват заедно политики, независимо дали официално са в коалиция.

Защо Радев може да стане следващият Орбан?

Фигурата на спасителя

„Фидес“ идва на власт след глобалната икономическа криза от 2008 г. и след неуспехите на тогавашното ляво правителство да предотврати болезнени икономии. Орбан се възприема като спасителя, който ще помогне на унгарците да се справят без чужда помощ и да възвърнат националната си гордост.

Контекстът в България през 2026 г. е доста по-различен, но и Румен Радев се възприема от много от потенциалните си избиратели като спасител. Според едни той ще помогне на страната да се справи с корупцията. Според други ще допринесе за възвръщането на националния суверенитет (каквито надежди са се възлагали и на Орбан навремето). Трети очакват от него и двете неща. А в кампанията си Радев максимално бяга от конкретика, за да привлече възможно по-широка периферия.

България впрочем има традиция в избирането на „спасители“, особено ако идват с някакъв властови ореол (което не означава реална власт). Такъв беше Симеон Сакскобургготски през 2001 г., а след него – Бойко Борисов. Първият е бивш цар, а вторият, както и Румен Радев – генерал. Поради липса на резервен цар генералът може да бъде детрониран най-малкото от друг генерал, който освен това е и доскорошен президент.

Преди изборите: Инфлация на страхове, алгоритми на разделението и дъх на петрол
Предизборната кампания се води по всички фронтове. Докато партиите спорят на терен, а ние си мислим, че знаем какво става, алгоритмите преподреждат вниманието ни и пренаписват дневния ред в посока София–Будапеща–Москва. Да гледаме ли към Унгария в чудене и за нашите избори? От Емилия Милчева.
Отива ли България там, откъдето Унгария се връща?

Интересите на Русия

Русия има интерес от засилването на влиянието си в Европа и от отслабването на ЕС. Ако вече не може да разчита на Унгария както преди, твърдо на нейна страна остава само управлението на Роберт Фицо в Словакия. И макар Фицо да се заканва, че ще продължи да блокира заема на ЕС за Украйна, и неговото оставане на власт не е гарантирано.

Бойко Борисов винаги се е опитвал да е в добри отношения и с Путин, и с ЕС, като се старае да угоди на всички и им казва това, което смята, че искат да чуят. Досега Радев, макар да не е поставял под въпрос европейския път на България, е клонял повече към Русия, което става ясно и от позициите му за Украйна. Освен това той, подобно на Орбан, интерпретира подкрепата на общите политики на ЕС като загуба на национален суверенитет. В началото на кампанията си за предстоящите избори той например заяви:

Нагледахме се как постепенно се руши и отнема националният ни суверенитет, как българските управници, отивайки в Брюксел, предварително казват „да“, дори преди обсъжданията, преди дебата, само за да се нагодим и да покажем, че сме готови да подпишем и да приемем всичко, независимо дали то ще се отрази негативно на нас, а в перспектива дори и на самия Европейски съюз.

„Пробитите“ служби в България

През 2024 г. Върховният съд на Румъния анулира резултатите от първия тур на президентските избори, на който първи беше Калин Джорджеску. Причината? Разузнавателни данни, разкриващи руска намеса в кампанията, осъществявана чрез десетки хиляди профили в TikTok и Telegram.

„Фондация за социални и хуманитарни изследвания“ прави изследвания на българските онлайн медии както през 2022 г., когато започна войната в Украйна, така и през 2024 г. И установява както значително количество антидемократична руска пропаганда, така и механизми за разпространяването ѝ чрез сайтове „гъби“. През 2024 г. Центърът за изследване на демокрацията пък публикува анализ на влиянието на Кремъл в мрежите от бивши военни в България.

През март 2026 г. „Свободна Европа“ публикува анализ, според който 70 групи във Facebook с общо 1,3 млн. потребители внезапно стават в подкрепа на Радев и „Прогресивна България“. А преди това са били за нещо друго, включително за авточасти. Преименуването на част от тези групи става в един и същи ден, което говори за координирана акция. Скоро след това базираното в Брюксел сдружение Balkan Free Media Initiative и Sensika оповестиха съвместен анализ. В него се обръща внимание на масова подкрепа за Радев във Facebook и TikTok, за която може да се предположи, че не е автентична.

България изгони 70 дипломати и сътрудници на Руската федерация през 2022 г. Оттогава обаче не изглежда службите да предприемат някакви решителни действия за ограничаването на руското влияние. Според Politico страната ни е поискала подкрепа от ЕС за ограничаването на намесата на Русия в предстоящите избори. Но това, както и привличането на разследващия журналист Христо Грозев с подобна цел, е инициатива на служебното правителство на Андрей Гюров, не на разузнаването.

Това вече се случва

Ако България завие към Русия, промяната няма да е рязка, както не е била рязка и в Унгария. Да не забравяме, че Борисов наричаше Орбан „голям приятел и колега“, а по време на Борисовото управление се е случвало България да заема позиции против ЕС заедно с Унгария. Подобна тенденция вече съществува. Тенденцията към орбанизиране се осъществява на няколко фронта:

Първият е посредством дезинформационни кампании. Тук може да споменем кампаниите срещу Конвенцията на Съвета на Европа за превенция и борба с насилието над жени и домашното насилие, по-известна като Истанбулската конвенция, Закона за социалните услуги, Стратегията за детето. Същевременно българското население е заливано от всевъзможни антидемократични и евроскептични опорки и фалшиви новини.

Защо Истанбулската конвенция отново е на дневен ред
Европейският парламент ратифицира Истанбулската конвенция. Какво точно означава това и какво следва за България от тази ратификация? Светла Енчева обяснява.
Отива ли България там, откъдето Унгария се връща?

Вторият фронт е чрез съдебни решения и закони в духа на руското законодателство. Такива са решенията на Конституционния съд и на Върховния касационен съд по отношение на Истанбулската конвенция и смяната на юридическия пол на транс хората. Що се отнася до законите, на първо място трябва да се спомене забраната на т.нар. ЛГБТ пропаганда в образователната система. Тук можем да причислим и приемането на Закона за прозрачност и почтеност в управлението, по-известен като Закон за лобизма. Според него комай единствените „лобисти“ остават… неправителствените организации, които могат да се окажат нещо като „чуждестранните агенти“ в Русия.

Третият фронт е игнорирането на задължителни за България решения на европейски съдилища. Например през 2023 г. Европейският съд по правата на човека постанови, че България трябва да създаде правна рамка, с която да се уреждат отношенията на еднополовите двойки, сключили брак в чужбина. Две години по-късно и Съдът на ЕС се произнесе в същия смисъл, но конкретно за браковете, сключени в страни от Съюза. И двете решения не бяха взети под внимание, макар да са задължителни за България. Междувременно през март 2026 г. Съдът на ЕС постанови също, че идентичността на българските граждани, които са сменили пола си в държави членки, трябва да се признава и в България. Отиващият си парламент обаче, зает с приемането на популистки закони, очаквано не отрази този факт.

Други фронтове са например зависимата правосъдна система, която не гарантира справедливост, а действа кампанийно, както и практическите политически решения, които са в полза на Русия, а не на ЕС, например изграждането на т.нар. Турски поток.

Трансът на Върховния касационен съд
28 съдии от ВКС забраниха възможността за юридическа смяна на пола и на практика предопределиха изхода от десетки дела, чакащи решение. Не че хората нямат право да водят подобни дела, просто е ясно, че няма да завършат в тяхна полза. Какво още ни казва решението на ВКС – от Светла Енчева.
Отива ли България там, откъдето Унгария се връща?

Защо Радев може да не стане следващият Орбан?

Липса на конституционно мнозинство

Унгария изглежда изключение от типичния политически модел в Европа, който разчита на коалиции. Когато унгарците са решени да сменят властта, осигуряват на победителя конституционно мнозинство. Новото правителство на „Тиса“ ще разполага с над 60% от местата в парламента, а през 2010 г., когато Орбан идва на власт, за него гласуват повече от 2/3 от отишлите до урните.

След 1989 г. в България единствено БСП през 1990 г. и ОДС през 1997 г. вземат повече от половината места в парламента. През 2001 г. едно място не достига на НДСВ до мнозинството – въпреки харизмата на бившия цар. Ако Румен Радев спечели изборите, ще му се наложи или да се съобразява с коалиционни партньори, или да обяви правителство на малцинството и да разчита на ситуационна подкрепа от парламента. Или да се стигне до нови парламентарни избори. При всички случаи няма да му е лесно да прокарва политики, променящи драматично конституционното устройство на България. И трябва да притежава хамелеонщината на Бойко Борисов и способността му да възкръсва от пепелта, за да може да се задържи на власт толкова дълго като него.

Ту-тууу! И Тръмп им се показа
Идва празникът на възкресението и опрощението, а с него и един тон „умни слова“, чрез които в шеги и закачки ни се съобщи, че бялото е черно, корупцията е добродетел и справедливостта ще възтържествува, защото ние пак нещо не сме разбрали. Ето какво е разбрала Емилия Милчева.
Отива ли България там, откъдето Унгария се връща?

Загуба на харизмата

Българските гласоподаватели обичат да избират харизматични „спасители“, но и бързо се разочароват от тях, ако „спасителите“ не отговарят на очакванията им (което по правило се случва). А Радев казва на (почти) всички това, което смята, че искат да чуят, така че няма как да отговори на всички очаквания. Ако той управлява в коалиция или разчита на плаващи мнозинства, това ще означава да прави компромиси, а избирателите не обичат компромисите, колкото и наложителни да са те. А и са уморени от честите предсрочни избори през последните пет години. Освен това, ако доскорошният президент не успее да демонтира модела „Пеевски“, Пеевски ще го погълне, както направи и с Борисов.

Ултраконсерватизмът вече не е секси

По време на управлението на Орбан се наблюдаваше възход на ултраконсервативната десница. Във Франция Марин Льо Пен разшири подкрепата си, в Германия възникна и набра скорост „Алтернатива за Германия“ (АзГ), в Италия спечели (относително по-умерената) Джорджа Мелони и пр. В САЩ Тръмп победи на изборите през 2016 г., изгуби ги през 2020 г., но през 2024 г. американските граждани отново му гласуваха доверие. Тази политическа тенденция все повече доближаваше Запада до антидемократичните идеи на Путин, а ултраконсервативни и руски сили често действаха заедно, например в кампанията срещу Истанбулската конвенция. Самият Тръмп нееднократно е заемал страната на Русия, а също така е демонстрирал подкрепа било за АзГ, било за Орбан.

По време на втория си мандат обаче Тръмп успя да доведе ултраконсерватизма до собственото му отрицание. Върхът (засега) на това са обидите по адрес на папата и публикуването от американския президент на негово изображение като Христос – действия, които възмутиха и най-консервативните му избиратели.

Геополитическата ситуация се променя и вече не е престижно да си тръмпист. За Българското Тръмп общество, чийто учредител е Борислав Цеков, бивш съветник на Радев, вече нищо не се чува, а основателят му си купи социологическа агенция. В обозримо бъдеще може Русия и консерватизмът да се окажат отново в два различни лагера, което би изправило Радев пред идентичностен проблем, какъвто Орбан през по-голямата част от управлението си не е имал.

Европейски имунитет срещу троянските коне

Последният аргумент е по-скоро пожелателен. След Орбан ЕС може и да е изградил някакви съпротивителни сили срещу троянските коне в редиците си и тези съпротивителни сили може би могат да намерят израз в определени политики. Например – не само пари срещу реформи, а и пари срещу съобразяване с европейското законодателство. Това силно би затруднило държавите членки, опитващи се да изградят авторитарни режими по образеца на Путин.

Поуки за кандидат-спасителите и техните избиратели

Провалът на „нелибералната демокрация“ на Виктор Орбан, както той сам нарече режима си, би трябвало да направи кандидатите да заемат мястото му, а също и избирателите, по-предпазливи. Защото показва, че антидемократичната власт не е гаранция срещу корупцията, а по-скоро я прави безконтролна, задушавайки гражданското общество, което е в състояние да ѝ противостои. Освен това може да доведе до обедняване – по данни на „Евростат“ през 2023 г. покупателната способност в Унгария става най-ниската в ЕС, задминавайки дори тази в България.

Затова борбата с корупцията е обречена на неуспех, ако не е свързана и с борба за демократични ценности. Впрочем един от най-ярките знаци, че режимът на Орбан е към края си, беше безпрецедентният по масовост прайд в Будапеща през 2025 г. – въпреки забраната му и със закон, и в Конституцията. Щом между 180 000 и 200 000 души се включват в събитие, обявено не просто за незаконно, а и за противоконституционно, значи властта е сериозно разклатена.

По прайда ще ги познаете
Да забраниш нещо и така да го направиш още по-популярно си е талант. Виктор Орбан успя да стори точно това със забраната на прайда в Будапеща, на който са присъствали „само“ около 200 000 души – много повече от обикновено. Защо се случи така? От Светла Енчева.
Отива ли България там, откъдето Унгария се връща?

Макар Мадяр да се определя като консерватор (трудно е да не се заявиш като такъв в Унгария, както и в България е трудно да си либерал), той е далеч по-умерен от пишман консерватори като Тръмп и „пазители на традиционните ценности“ като Путин. Например той е казвал, че партията му работи за страна, в която няма значение кой кого обича, както и че за едно дете е по-добре да бъде при еднополова двойка, отколкото в системата за закрила на детето. И тези твърдения не са пречка за решителната му победа (българските политици да си водят записки).

Така че въпросът не е само дали България се е запътила натам, откъдето Унгария се връща. Въпросът е дали изобщо има хоризонт за този път, или той не след дълго ще бъде част от миналото.

The collective thoughts of the interwebz