How GE Aviation built cloud-native data pipelines at enterprise scale using the AWS platform

Post Syndicated from Alcuin Weidus original https://aws.amazon.com/blogs/big-data/how-ge-aviation-built-cloud-native-data-pipelines-at-enterprise-scale-using-the-aws-platform/

This post was co-written with Alcuin Weidus, Principal Architect from GE Aviation.

GE Aviation, an operating unit of GE, is a world-leading provider of jet and turboprop engines, as well as integrated systems for commercial, military, business, and general aviation aircraft. GE Aviation has a global service network to support these offerings.

From the turbosupercharger to the world’s most powerful commercial jet engine, GE’s history of powering the world’s aircraft features more than 90 years of innovation.

In this post, we share how GE Aviation built cloud-native data pipelines at enterprise scale using the AWS platform.

A focus on the foundation

At GE Aviation, we’ve been invested in the data space for many years. Witnessing the customer value and business insights that could be extracted from data at scale has propelled us forward. We’re always looking for new ways to evolve, grow, and modernize our data and analytics stack. In 2019, this meant moving from a traditional on-premises data footprint (with some specialized AWS use cases) to a fully AWS Cloud-native design. We understood the task was challenging, but we were committed to its success. We saw the tremendous potential in AWS, and were eager to partner closely with a company that has over a decade of cloud experience.

Our goal from the outset was clear: build an enterprise-scale data platform to accelerate and connect the business. Using the best of cloud technology would set us up to deliver on our goal and prioritize performance and reliability in the process. From an early point in the build, we knew that if we wanted to achieve true scale, we had to start with solid foundations. This meant first focusing on our data pipelines and storage layer, which serve as the ingest point for hundreds of source systems. Our team chose Amazon Simple Storage Service (Amazon S3) as our foundational data lake storage platform.

Amazon S3 was the first choice as it provides an optimal foundation for a data lake store delivering virtually unlimited scalability and 11 9s of durability. In addition to its scalable performance, it has ease-of-use features, native encryption, and access control capabilities. Equally important, Amazon S3 integrates with a broad portfolio of AWS services, such as Amazon Athena, the AWS Glue Data Catalog, AWS Glue ETL (extract, transform, and load) Amazon Redshift, Amazon Redshift Spectrum, and many third-party tools, providing a growing ecosystem of data management tools.

How we started

The journey started with an internal hackathon that brought cross-functional team members together. We organized around an initial design and established an architecture to start the build using serverless patterns. A combination of Amazon S3, AWS Glue ETL, and the Data Catalog were central to our solution. These three services in particular aligned to our broader strategy to be serverless wherever possible and build on top of AWS services that were experiencing heavy innovation in the way of new features.

We felt good about our approach and promptly got to work.

Solution overview

Our cloud data platform built on Amazon S3 is fed from a combination of enterprise ELT systems. We have an on-premises system that handles change data capture (CDC) workloads and another that works more in a traditional batch manner.

Our design has the on-premises ELT systems dropping files into an S3 bucket set up to receive raw data for both situations. We made the decision to standardize our processed data layer into Apache Parquet format for our cataloged S3 data lake in preparation for more efficient serverless consumption.

Our enterprise CDC system can already land files natively in Parquet; however, our batch files are limited to CSV, so the landing of CSV files triggers another serverless process to convert these files to Parquet using AWS Glue ETL.

The following diagram illustrates this workflow.
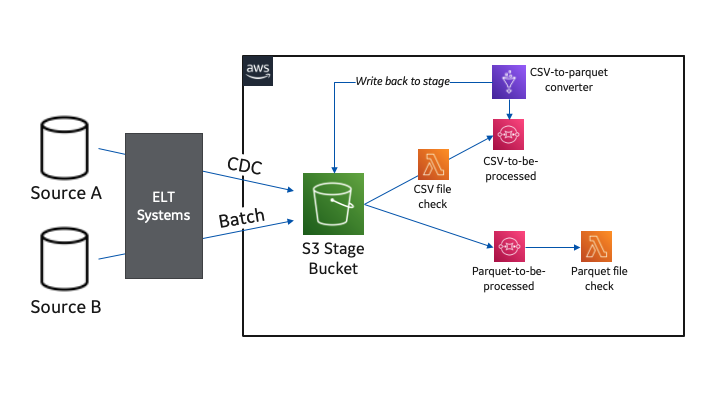
When raw data is present and ready in Apache Parquet format, we have an event-triggered solution that processes the data and loads it to another mirror S3 bucket (this is where our users access and consume the data).

Pipelines are developed to support loading at a table level. We have specific AWS Lambda functions to identify schema errors by comparing each file’s schema against the last successful run. Another function validates that a necessary primary key file is present for any CDC tables.

Data partitioning and CDC updates

When our preprocessing Lambda functions are complete, the files are processed in one of two distinct paths based on the table type. Batch table loads are by far the simpler of the two and are handled via a single Lambda function.

For CDC tables, we use AWS Glue ETL to load and perform the updates against our tables stored in the mirror S3 bucket. The AWS Glue job uses Apache Spark data frames to combine historical data, filter out deleted records, and union with any records inserted. For our process, updates are treated as delete-then-insert. After performing the union, the entire dataset is written out to the mirror S3 bucket in a newly created bucket partition.

The following diagram illustrates this workflow.

We write data into a new partition for each table load, so we can provide read consistency in a way that makes sense to our consuming business partners.

Building the Data Catalog

When each Amazon S3 mirror data load is complete, another separate serverless branch is triggered to handle catalog management.

The branch updates the location property within the catalog for pre-existing tables, indicating each newly added partition. When loading a table for the first time, we trigger a series of purpose-built Lambda functions to create the AWS Glue Data Catalog database (only required when it’s an entirely new source schema), create an AWS Glue crawler, start the crawler, and delete the crawler when it’s complete.

The following diagram illustrates this workflow.

These event-driven design patterns allow us to fully automate the catalog management piece of our architecture, which became a big win for our team because it lowered the operational overhead associated with onboarding new source tables. Every achievement like this mattered because it realized the potential the cloud had to transform how we build and support products across our technology organization.

Final implementation architecture and best practices

The solution evolved several times throughout the development cycle, typically due to learning something new in terms of serverless and cloud-native development, and further working with AWS Solutions Architect and AWS Professional Services teams. Along the way, we’ve discovered many cloud-native best practices and accelerated our serverless data journey to AWS.

The following diagram illustrates our final architecture.
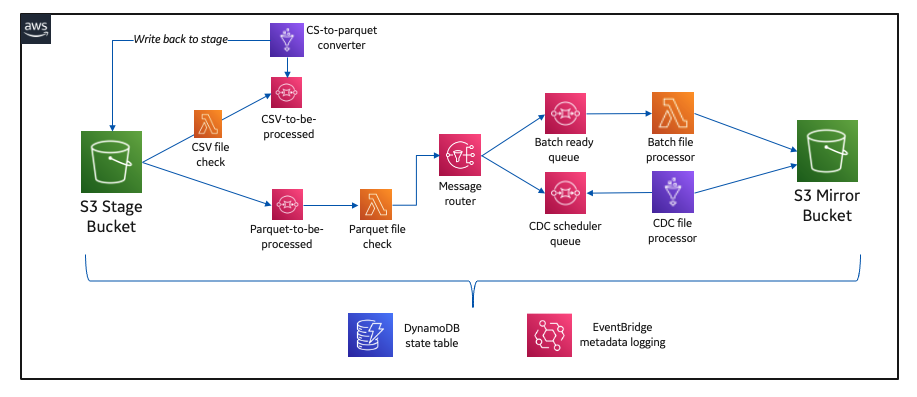
We strategically added Amazon Simple Queue Service (Amazon SQS) between purpose-built Lambda functions to decouple the architecture. Amazon SQS gave our system a level of resiliency and operational observability that otherwise would have been a challenge.

Another best practice arose from using Amazon DynamoDB as a state table to help ensure our entire serverless integration pattern was writing to our mirror bucket with ACID guarantees.

On the topic of operational observability, we use Amazon EventBridge to capture and report on operational metadata like table load status, time of the last load, and row counts.

Bringing it all together

At the time of writing, we’ve had production workloads running through our solution for the better part of 14 months.

Production data is integrated from more than 30 source systems at present and totals several hundred tables. This solution has given us a great starting point for building our cloud data ecosystem. The flexibility and extensibility of AWS’s many services have been key to our success.

Appreciation for the AWS Glue Data Catalog has been an essential element. Without knowing it at the time we started building a data lake, we’ve been embracing a modern data architecture pattern and organizing around our transactionally consistent and cataloged mirror storage layer.

The introduction of a more seamless Apache Hudi experience within AWS has been a big win for our team. We’ve been busy incorporating Hudi into our CDC transaction pipeline and are thrilled with the results. We’re able to spend less time writing code managing the storage of our data, and more time focusing on the reliability of our system. This has been critical in our ability to scale. Our development pipeline has grown beyond 10,000 tables and more than 150 source systems as we approach another major production cutover.

Looking ahead, we’re intrigued by the potential for AWS Lake Formation goverened tables to further accelerate our momentum and management of CDC table loads.

Conclusion

Building our cloud-native integration pipeline has been a journey. What started as an idea and has turned into much more in a brief time. It’s hard to appreciate how far we’ve come when there’s always more to be done. That being said, the entire process has been extraordinary. We built deep and trusted partnerships with AWS, learned more about our internal value statement, and aligned more of our organization to a cloud-centric way of operating.

The ability to build solutions in a serverless manner opens up many doors for our data function and, most importantly, our customers. Speed to delivery and the pace of innovation is directly related to our ability to focus our engineering teams on business-specific problems while trusting a partner like AWS to do the heavy lifting of data center operations like racking, stacking, and powering servers. It also removes the operational burden of managing operating systems and applications with managed services. Finally, it allows us to focus on our customers and business process enablement rather than on IT infrastructure.

The breadth and depth of data and analytics services on AWS make it possible to solve our business problems by using the right resources to run whatever analysis is most appropriate for a specific need. AWS Data and Analytics has deep integrations across all layers of the AWS ecosystem, giving us the tools to analyze data using any approach quickly. We appreciate AWS’s continual innovation on behalf of its customers.


About the Authors

Alcuin Weidus is a Principal Data Architect for GE Aviation. Serverless advocate, perpetual data management student, and cloud native strategist, Alcuin is a data technology leader on a team responsible for accelerating technical outcomes across GE Aviation. Connect him on Linkedin.

Suresh Patnam is a Sr Solutions Architect at AWS; He works with customers to build IT strategy, making digital transformation through the cloud more accessible, focusing on big data, data lakes, and AI/ML. In his spare time, Suresh enjoys playing tennis and spending time with his family. Connect him on LinkedIn.

Announcing the 2021 Metasploit Community CTF

Post Syndicated from Caitlin Condon original https://blog.rapid7.com/2021/11/16/announcing-the-2021-metasploit-community-ctf/

Announcing the 2021 Metasploit Community CTF

It’s time for another Metasploit community CTF! Last year’s beginner-friendly CTF attracted a wider range of audiences and skill levels than in previous years, so we’re replicating our previous game architecture. Players will attack a single Linux target, we’ve spread prizes out across 15 teams, and the Metasploit Framework teams have devised a variety of challenges that aim to help infosec newcomers build practical skills. While there are some challenges that are intended to be a bit more difficult, we’ve designed the majority of them for beginner audiences. Hint: We’ve arranged challenges by port number according to difficulty this year. The higher the port number, the harder the challenge. If you want to start out with easier challenges, start by targeting services that run on lower port numbers.

As always, teams are encouraged! There is no cap on the number of players who can join a team. Read on for full competition details, and join the #metasploit-ctf channel on Slack to start building your team.

Big thanks to TryHackMe and CTFd for powering this year’s game!

TL;DR overview

There are 1,000 team spots available; both individuals and teams of multiple members are allowed. There is no limit on the number of players who can be on a team. Please note: Those playing as a team only need to register ONE team upon signup. Help us make the competition accessible to as many players as possible by organizing with your fellow team players ahead of time and creating only a single team for all of you. If others want to join your team later, that’s no problem. See the FAQ at the end of this post for details.

Important dates (all times in US Central Standard Time):

  • Initial team registration opens for the first 750 teams on Monday, November 22, 2021 at 2:00 PM CST (UTC-6).
  • CTF game play begins on Friday, December 3, 2021 at 11:00 AM CST (UTC-6). When the CTF officially begins, we will open registration for an additional 250 teams.
  • The CTF ends on Monday, December 6, 2021, at 11:00 AM CST (UTC-6).

Our goal in putting on CTFs is to enable relationship building and knowledge sharing across the security community. To further emphasize community partnership and camaraderie over purely monetary gain, we’ve increased the value of CTF prizes in the past few years but spread those prizes out over many teams.

  • The 15 teams with the highest point totals when game play ends will receive Amazon Gift Cards (only one per team!).
  • We’re partnering with TryHackMe to offer other prizes to the 3 teams that achieve the highest point total the fastest! See the prize section at the end of this post for details.

You can see results and statistics from the last Metasploit CTF here.

Questions?

To report technical issues during the competition or to discuss play with your teammates and community members, join us in the #metasploit-ctf channel on Slack. The Metasploit team will be occasionally available on Slack in case of technical issues, but please be advised that Rapid7 staff members will not respond to DMs with requests for hints or help with flags or MD5 hash submission.

A few notes on the technicalities of game play:

  • You must use a valid email for registration. You’ll need to verify your email upon signup; email is also how we communicate with winners.
  • We’ve run this CTF for several years now, and we’ve yet to encounter an actual technical issue with a flag (other than the occasional bit of latency, which we try to avoid by being thoughtful about challenge development). If your MD5 hash submission isn’t being accepted, it is because the hash is incorrect. Keep trying! There is no penalty for wrong answers.
  • The scoreboard is not a target. Nothing except the official CTF target is a target. Please don’t attack anything except the target box.
  • When game play starts, provisioning is first come, first served. It may take a few minutes. Be patient! If you’ve been waiting for more than half an hour for your network to be provisioned, you can reach out to us on Slack.
  • Please, no spoilers in Slack channels or other public places. Everyone learns at their own pace, so don’t ruin the game for others. We may kick you out of Slack if you post flag spoilers. Harassment of other players and community members won’t be tolerated.
  • Metasploit Slack messages archive automatically after a certain threshold (this is just how our implementation of Slack works). If you’re worried about continuous access to your conversations, you may want to hold them outside of Metasploit’s Slack channel.
  • Higher port numbers signify more advanced challenges.

2021 Metasploit Capture the Flag: Official rules

No purchase is necessary to participate. Only the first 1,000 registrants (teams or individuals) will be able to participate. For further information, see the full Contest Terms here.

To enter

Starting Monday, November 22, 2021 at 2:00 PM CST (UTC-6),  the first 750 teams can register here. On Friday, December 3, 2021, at 11:00 AM CST (UTC-6) the CTF will begin. An additional 250 teams can register here when game play begins. Please note: Only ONE team needs to be created for all players. Teammates can and should share their team credentials (and/or their links to invite new players). Please ensure you enter your email address correctly when registering: You will need to verify your email upon registration, and we will use email to communicate with winners about prizes.

Play starts Friday, December 3, 2021 at 11:00 AM CST (UTC-6). When play starts, players should use the instructions on the Control Panel to connect to the Kali Linux jump box. From there, players can attack the vulnerable target environment to find flags. All flags are PNG images.

When a flag is found, players should submit the MD5 hash to the Challenges section of the scoreboard. If the MD5 hash is correct, points will be awarded. There is no penalty for wrong answers.

The competition will open on Friday, December 3, 2021 at 11:00 AM CST (UTC-6) and close on Monday, December 6, 2021, at 11:00 AM CST (UTC-6). The Contestants with the fifteen (15) highest point totals at the end of the contest will each receive one (1) $100 USD Amazon gift card. In addition, the three (3) Contestants with the highest point total at the end of the Contest will also receive the prizes listed below and will be announced in an official blog post following the Contest. In the event of a tie, the Contestant who reached that score first will be the winner.

You may participate as an individual or as a team. However, only ONE cash prize can be awarded for each winning team; therefore, if you are participating as a team, please be aware that we cannot offer cash prizes to each team member. (Any further method used to determine who among your teammates takes home the CTF spoils is up to you. We hear thumb wars and structured rock/paper/scissors competitions are effective.)

Prizes

Only the prizes listed below will be awarded as part of the competition. Prizes are not transferable or redeemable for cash. Rapid7 reserves the right to make equivalent substitutions as necessary, due to circumstances not under its control. Please allow several weeks for delivery of any prize.

To reiterate, only ONE cash prize can be awarded for each winning team; therefore, if you are participating as a team, please be aware that we will not offer cash prizes to each team member. How you divide spoils among your team is up to you!

Place Prize ARV
1st $100 Amazon Gift Card (1), ($20) Two Month THM Premium Voucher per team member* + ($60) Throwback Voucher per team member* 180 USD
2nd $100 Amazon Gift Card (1), ($20) Two Month THM Premium Voucher per team member* + ($20) Swag Voucher per team member* 140 USD
3rd $100 Amazon Gift Card (1), ($10) One Month THM Premium Voucher per team member* 110 USD
4th to 15th $100 Amazon Gift Card (1) 100 USD

*TryHackMe vouchers will be provided for up to 15 members per team

Contestants with the highest point total at the end of the Contest will also be announced in an official blog post following the Contest.

FAQ

What’s the difference between an account and a team? Anyone can create an account, and accounts are unlimited. Teams, on the other hand, are limited to 1,000. To actually play in the CTF, you need to belong to a team — either by yourself or with your teammates.

How do teams work? When CTF registration opens on November 22, you’ll see a page that guides you through creating an account, verifying your email, and finally, asking you to either create a new team OR join an existing team. If you already have a team you know would like to play together, designate ONE team captain to create your team and a team password. Team captains (or whoever created the team) can then share the team password with all team members. Note that a team password is different from an account password.

There is also a new feature this year that allows team captains the option to share an invite link instead of (or in addition to) a password, so a new user can just follow that link to be automatically added to a team (once they have a valid account).

Please note: Team captains and team members should ONLY share team invitation links or team passwords with people they trust.

What if I want to join a team later, or if someone else wants to join my team later? That’s OK! To join someone else’s team, ask them for their team name and password, OR their team invite link. You can then create an account if you don’t already have one (again, accounts are unlimited; it’s only teams that are limited) and input their team name and credentials. If you’d like someone to join your team, you can simply share your team name and password with them.

I already created or joined a team, but I want to join a different one. What do I do? If you are the team captain (you’re the one who created the team), you can disband the team by clicking the trash can icon on your team settings page. This will help out the community by freeing up a team registration slot for someone else. If you’re not the team captain, you can also leave a team by clicking the arrow icon on your team settings page. Both options are available at any point before the contest starts on December 3. Please note that teams cannot be adjusted once play has started.

Is there a maximum number of players allowed on a team? Nope! Feel free to team up with  as many friends and strangers as you like — just remember that only one Amazon Gift Card can be awarded to each winning team, and TryHackMe vouchers are limited to a maximum of 15 per winning team. How you divide prizes if you win is totally up to you.

How do I connect to my CTF environment? Starting Friday, December 3, 2021, at 11:00 AM CST (UTC-6), you can log in here and follow the directions on your Control Panel to access the CTF environment.

Do I need to use Metasploit to solve the CTF challenges? No. Using Metasploit is an option for some challenges, but the CTF was not engineered to be Metasploit-specific.

I am not receiving points when I submit my flag. What’s wrong? You are not submitting the correct MD5 hash. This means you still have some work to do to solve the challenge correctly. Keep trying! There is no penalty for wrong answers.

Can you give me a hint about $FLAG? No, sorry. That would spoil the fun!

I’m having technical difficulties or I think I’ve found a bug! Can I DM someone for help? In general, Rapid7 staff will not respond to DMs requesting help with flag discovery, exploitation, or anything else related to the workings of the game. If you think you have discovered a bug in the CTF environment that is affecting your ability to play, you can reach out to a designated admin in the #metasploit-ctf channel on Slack, but we strongly recommend you check the pinned Slack messages to see if your question has already been addressed. If we think the behavior you’re experiencing is unexpected, we’ll respond and take a look, but in general, you should expect to proceed without input or attention from us.

My target or jump box reverted! What happened? Either you or one of your teammates clicked the “Revert” button from the control panel. Your boxes will not revert on their own, and Rapid7 staff will not revert boxes for you unless specifically requested.

Grab your friends, grab your parents, meet new folks, and good luck!

Join our community CTF!

Registration opens Monday, November 22

Scale Up Language Detection with Amazon Comprehend and S3 Batch Operations

Post Syndicated from Ameer Hakme original https://aws.amazon.com/blogs/architecture/scale-up-language-detection-with-amazon-comprehend-and-s3-batch-operations/

Organizations have been collecting text data for years. Text data can help you intelligently address a range of challenges, from customer experience to analytics. These mixed language, unstructured datasets can contain a wealth of information within business documents, emails, and webpages. If you’re able to process and interpret it, this information can provide insight that can help guide your business decisions.

Amazon Comprehend is a natural language processing (NLP) service that extracts insights from text datasets. Amazon Comprehend asynchronous batch operations provides organizations with the ability to detect dominant languages from text documents stored in Amazon Simple Storage Service (S3) buckets. The asynchronous operations support a maximum document size of 1 MB for language detection. They can process up to one million documents per batch, for a total size of 5 GB.

But what if your organization has millions, or even billions of documents stored in an S3 bucket waiting for language detection processing? What if your language detection process requires customization to let you organize your documents based on language? What if you need to create a search index that can help you quickly audit your text document repositories?

In this blog post, we walk through a solution using Amazon S3 Batch Operations to initiate language detection jobs with AWS Lambda and Amazon Comprehend.

Real world language detection solution architecture

In our example, we have tens of millions of text objects stored in a single S3 bucket. These need to be processed to detect the dominant language. To create a language detection job, we must supply the S3 Batch Operations with a manifest file that lists all text objects. We can use an Amazon S3 Inventory report as an input to the manifest file to create S3 bucket object lists.

One of the supported S3 Batch Operations is invoking an AWS Lambda function. The S3 Batch Operations job uses LambdaInvoke to run a Lambda function on every object listed in a manifest. Lambda jobs are subject to overall Lambda concurrency limits for the account and each Lambda invocation will have a defined runtime. Organizations can request a service quota increase if necessary. Lambda functions in a single AWS account and in one Region share the concurrency limit. You can set reserved capacity for Lambda functions to ensure that they can be invoked even when overall capacity has been exhausted.

The Lambda function can be customized to take further actions based on the output received from Amazon Comprehend. The following diagram shows an architecture for language detection with S3 Batch Operations and Amazon Comprehend.

Figure 1. Language detection with S3 Batch Operations and Amazon Comprehend

Figure 1. Language detection with S3 Batch Operations and Amazon Comprehend

Here is the architecture flow, as shown in Figure 1:

  1. S3 Batch Operations will pull the manifest file from the source S3 bucket.
  2. The S3 Batch Operations job will invoke the language detection Lambda function for each object listed in the manifest file. Lambda function code will perform a preliminary scan to check the file size, file extension, or any other requirements before calling Amazon Comprehend API. The Lambda function will then read the text object from S3 and then call the Amazon Comprehend API to detect the dominant language.
  3. The Language Detection API automatically identifies text written in over 100 languages. The API response contains the dominant language with a confidence score supporting the interpretation. An example API response would be: {‘LanguageCode’: ‘fr’, ‘Score’: 0.9888556003570557}. Once the Lambda function receives the API response, Lambda will return a message back to S3 Batch Operations with a result code.
  4. The Lambda function will then publish a message to an Amazon Simple Notification Service (SNS) topic.
  5. An Amazon Simple Queue Service (SQS) queue subscribed to the SNS topic will receive the message with all required information related to each processed text object.
  6. The SQS queue will invoke a Lambda function to process the message.
  7. The Lambda function will move the targeted S3 object to a destination S3 bucket.
  8. S3 Batch Operations will generate a completion report and will store it in an S3 bucket. The completion report will contain additional information for each task, including the object key name and version, status, error codes, and error descriptions.

Leverage SNS fanout pattern for more complex use cases

This blog post describes the basic building blocks for the solution, but it can be extended for more complex use cases, as illustrated in Figure 2. Using an SNS fanout application integration pattern would enable many SQS queues to subscribe to the same SNS topic. These SQS queues would receive identical notifications for the processed text objects, and you could implement downstream services for additional evaluation. For example, you can store text object metadata in an Amazon DynamoDB table. You can further analyze the number of processed text objects, dominant languages, object size, word count, and more.

Your source S3 bucket may have objects being uploaded in real time in addition to the existing batch processes. In this case, you could process these objects in a new batch job, or process them individually during upload by using S3 event triggers and Lambda.

Figure 2. Extending the solution

Figure 2. Extending the solution

Conclusion

You can implement a language detection job in a number of ways. All the Amazon Comprehend single document and synchronous API batch operations can be used for real-time analysis. Asynchronous batch operations can analyze large documents and large collections of documents. However, by using S3 Batch Operations, you can scale language detection batch operations to billions of text objects stored in S3. This solution has the flexibility to add customized functionality. This may be useful for more complex jobs, or when you want to capture different data points from your S3 objects.

For further reading:

wrangler 2.0 — a new developer experience for Cloudflare Workers

Post Syndicated from Ashcon Partovi original https://blog.cloudflare.com/wrangler-v2-beta/

wrangler 2.0 — a new developer experience for Cloudflare Workers

wrangler 2.0 — a new developer experience for Cloudflare Workers

Much of a developer’s work is about making trade-offs: consistency versus availability, speed over correctness, you name it. While there will always be different technical trade-offs to consider, we believe there are some that you, as a developer, should never need to make.

One of those decisions is an easy-to-use development environment. Whether you’re onboarding a new developer to your team or you simply want to develop faster, it’s important that even the smallest of things are optimized for speed and simplicity.

That’s why we’re excited to announce the second-generation of our developer tooling for Cloudflare Workers. It’s a new developer experience that’s out-of-the-box, lightning fast, and can even run Workers on a local machine. (Yes!)

If you’re already familiar with our existing tools, we’re not just talking about the wrangler CLI, we’re talking about its next major release: wrangler 2.0. Stick around to get a sneak-peak at the new experience.

No config? No problem

We’ve made it much easier to get started with Cloudflare Workers. All you need is a single JavaScript file to run a Worker — no configuration needed. You don’t even need to decide on a name!

When you run wrangler dev <filename>, your code is automatically bundled and deployed to a development environment. Then, you can send HTTP requests to that environment using a localhost proxy. Here’s what that looks like in-action:

Live debugging, just like that

Now there’s a completely redesigned experience for debugging a Worker. With a simple command you get access to a remote debugger, the same used by Chrome when you click “Inspect,” which provides an interactive view of logs, exceptions, and requests. It feels like your Worker is running locally, yet it’s actually running on the Cloudflare network.

A debugger that “just works” and auto-detects your changes makes all the difference when you’re just trying to code. We’ve also made a number of improvements to make the debugging experience even easier:

  • Keybind shortcuts, to quickly toggle features or open a window.
  • Support for “–public <path>”, to automatically serve your static assets.
  • Faster and more reliable file-watching.

To start a debugging session, just run: wrangler dev <filename>, then hit the “D” keybind.

Local mode? Flip a switch

Another aspect of the new debugging experience is the ability to switch to “local mode,” which runs your Worker on your local machine. In fact, you can easily switch between “network” and “local” mode with just a keybind shortcut.

How does this work? Recently, we announced that Miniflare (created by Brendan Coll), a project to locally emulate Workers in Node.js, has joined the Cloudflare organization. Miniflare is great for unit testing and situations where you’d like to debug Workers without an Internet connection. Now we’ve integrated it directly into the local development experience, so you can enjoy the benefits of both the network and your localhost!

Let us know what you think!

Serverless should be simple. We’re really excited about these improvements to the developer experience for Workers, and we have a lot more planned.

While we’re still working on wrangler 2.0, you can try the beta release by running: npm install wrangler@beta or by visiting the repository to see what we’re working on. If you’re already using wrangler to deploy existing applications, we recommend continuing to use wrangler 1.0 until the 2.0 release is officially out. We will continue to develop and maintain wrangler 1.0 until we’re finished with backwards-compatibility for 2.0.

If you’re starting a project or want to try out the new experience, we’d love to hear your feedback! Let us know what we’re missing or what you’d like to see in wrangler 2.0. You can create a feature request or start a discussion in the repository. (we’ll merge them into the existing wrangler repository when 2.0 is out of beta).

Thank you to all of our developers out there, and we look forward to seeing what you build!

Developer Spotlight: James Ross, Nodecraft

Post Syndicated from Kristian Freeman original https://blog.cloudflare.com/developer-spotlight-nodecraft/

Developer Spotlight: James Ross, Nodecraft

Developer Spotlight: James Ross, Nodecraft

Nodecraft allows gamers to host dedicated servers for their favorite games. James Ross is the Chief Technology Officer for Nodecraft and has advocated for Cloudflare — particularly Cloudflare Workers —  within the company.

“We use Workers for all kinds of things. We use Workers to optimize our websites, handle redirects, and deal with image content negotiation for our main website. We’re very fortunate that the majority of our users are using modern web browsers, so we can serve images in formats like JPEG XL and AVIF to users through a Workers script”.

Developer Spotlight: James Ross, Nodecraft

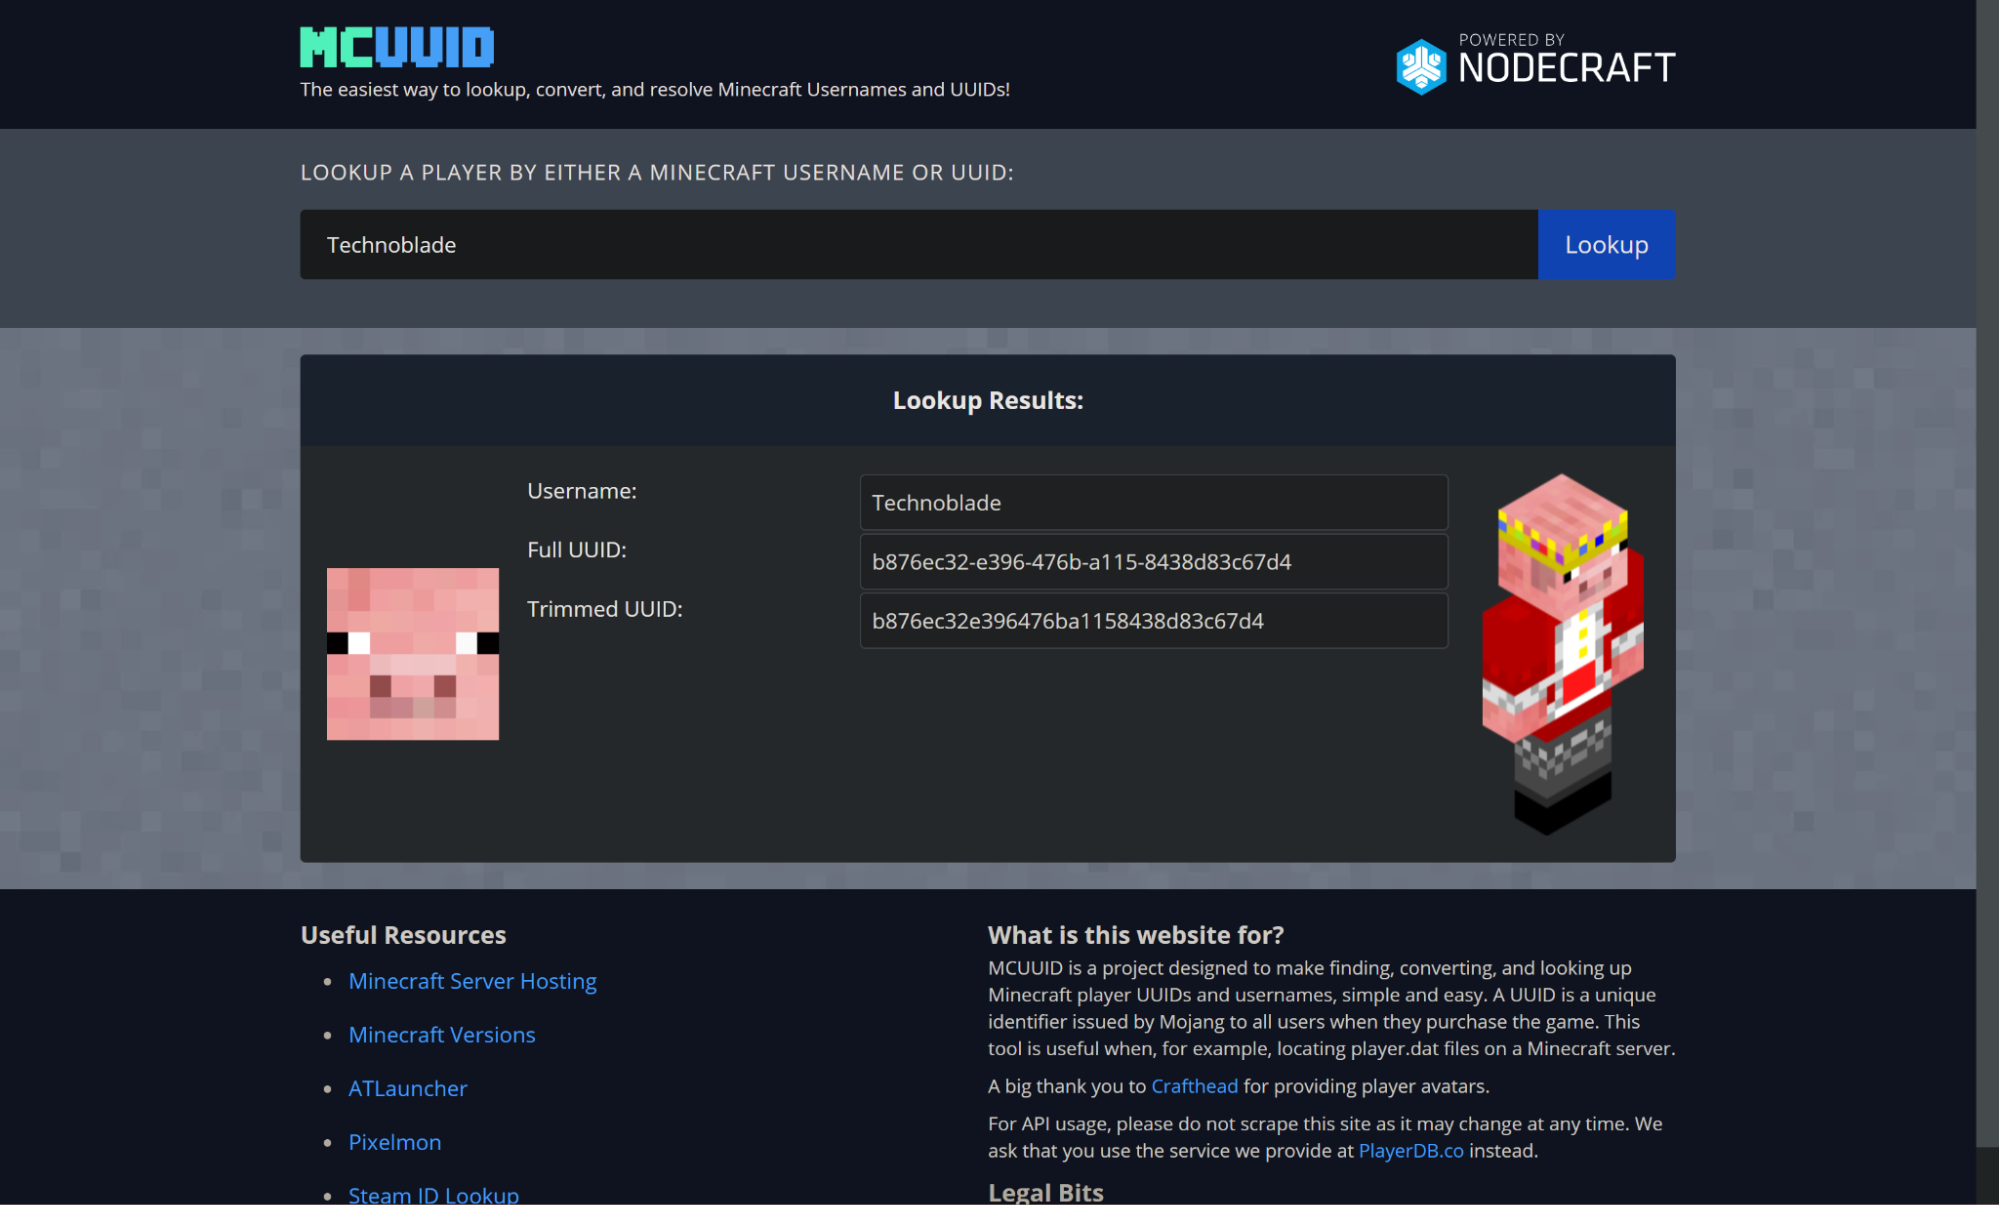
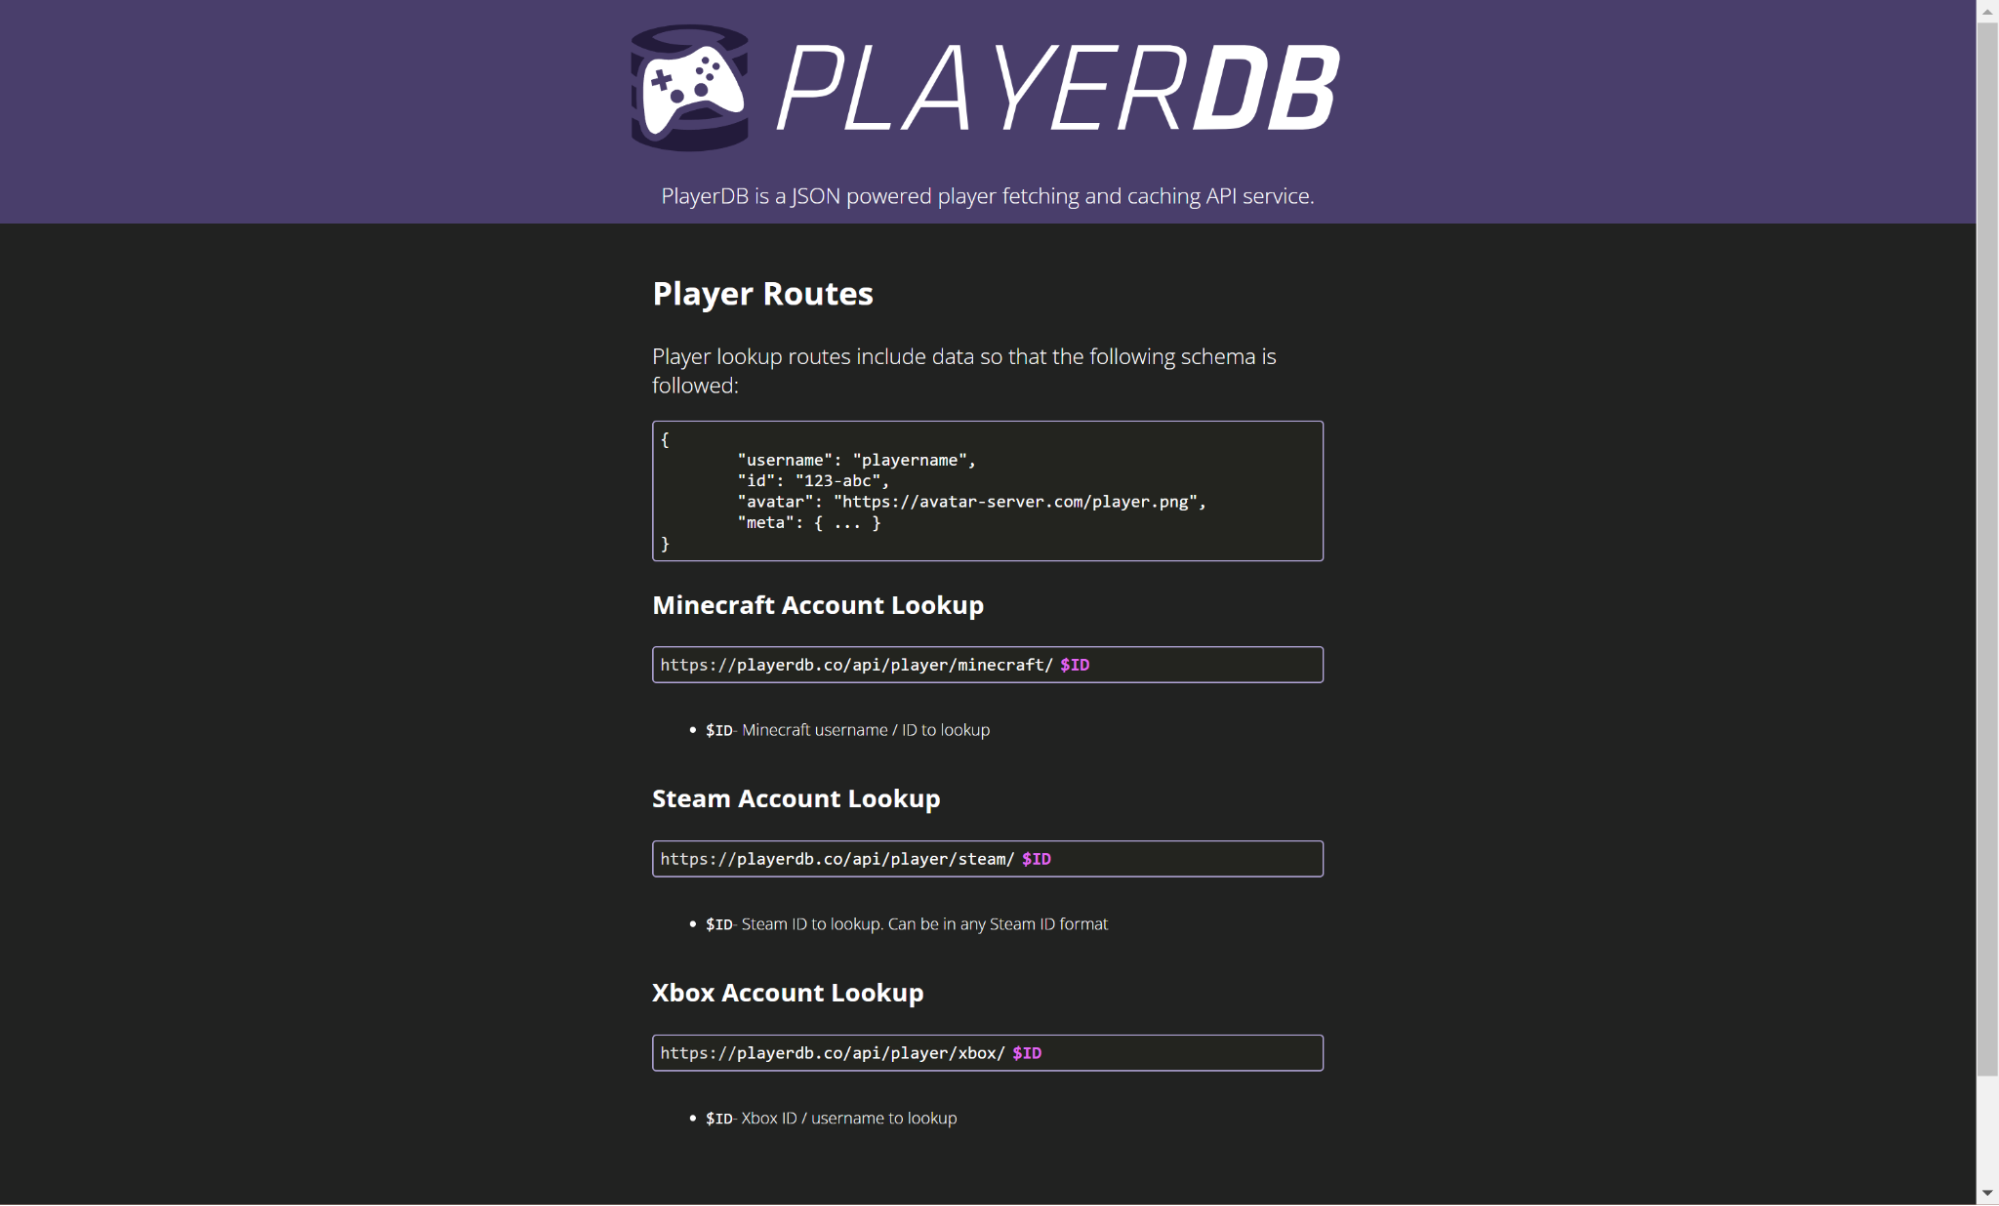
Nodecraft also maintains a number of microsites and APIs that are relied upon by the gaming community to retrieve game information. PlayerDB provides a JSON API for looking up information on user profiles for a number of gaming services, and MCUUID and SteamID are wrapped frontends for users of those services to interact with that API. Each of these is written and deployed as a Cloudflare Worker:

“Whenever a player joins a Minecraft server, we want to get their information — like their name and player image — and show it to our users. That API receives a hundred million requests a month. And we use the same API endpoint for three other websites that display that data to our users.”

Developer Spotlight: James Ross, Nodecraft

We love these kinds of integrations between Workers and developers’ existing infrastructures because it serves as a great way to onboard a team onto the Workers platform. You can look for existing parts of your infrastructure that may be resource-intensive, slow, or expensive, and port them to Workers. In Nodecraft’s case, this relieved them of managing an incredibly high amount of maintenance cost, and the result is, simply put, peace of mind:

“Handling three hundred millions a month in our own infrastructure would be really tough, but when we throw it all into a Worker, we don’t need to worry about scale. Occasionally, someone will write a Worker, and it will service 30 million requests in a single hour… we won’t even notice until we look at the stats in the Cloudflare dashboard.”

Nodecraft has been using Cloudflare for almost ten years. They first explored Workers to simplify their application’s external image assets. Their very first Worker replaced an image proxy they had previously hosted in their infrastructure and, since then, Workers has changed the way they think about building applications.

“With the advent of Jamstack, we started using Workers Sites and began moving towards a static architecture. But many of our Workers Sites projects had essentially an infinite number of pages. For instance, Minecraft has 15 million (and growing) user profiles. It’s hard to build a static page for each of those. Now, we use HTMLRewriter to inject a static page with dynamic user content.”

For James, Workers has served as a catalyst for how he understands the future of web applications. Cloudflare and the Workers development environment allows his team to stop worrying about scaling and infrastructure, and that means that Nodecraft builds on Cloudflare by default:

“Workers has definitely changed how we think about building applications. Now, we think about how we can build our applications to be deployed directly to Cloudflare’s edge.”

As a community moderator and incredibly active member of our Discord community, James is excited about the future of Cloudflare’s stack. As we’ve been teasing it over the past few months, James has been looking forward to integrating Workers functions with Nodecraft’s Pages applications. The release of that feature allows Nodecraft to move entirely to a Pages-driven deployment for their sites. He’s also looking forward to the release of Cloudflare R2, our storage product, because Nodecraft makes heavy use of similar storage products and would like to move entirely onto Cloudflare’s tooling wherever possible.

If you’d like to learn more about Cloudflare Workers, and deploy your own serverless functions to Cloudflare’s network, check out workers.cloudflare.com!

Automatically generating types for Cloudflare Workers

Post Syndicated from Brendan Coll original https://blog.cloudflare.com/automatically-generated-types/

Automatically generating types for Cloudflare Workers

Automatically generating types for Cloudflare Workers

Historically, keeping our Rust and TypeScript type repos up to date has been hard. They were manually generated, which means they ran the risk of being inaccurate or out of date. Until recently, the workers-types repository needed to be manually updated whenever the types changed. We also used to add type information for mostly complete browser APIs. This led to confusion when people would try to use browser APIs that aren’t supported by the Workers runtime they would compile but throw errors.

That all changed this summer when Brendan Coll, whilst he was interning with us, built an automated pipeline for generating them. It runs every time we build the Workers runtime, generating types for our TypeScript and Rust repositories. Now everything is up-to-date and accurate.

A quick overview

Every time the Workers runtime code is built, a script runs over the public APIs and generates the Rust and TypeScript types as well as a JSON file containing an intermediate representation of the static types. The types are sent to the appropriate repositories and the JSON file is uploaded as well in case people want to create their own types packages. More on that later.

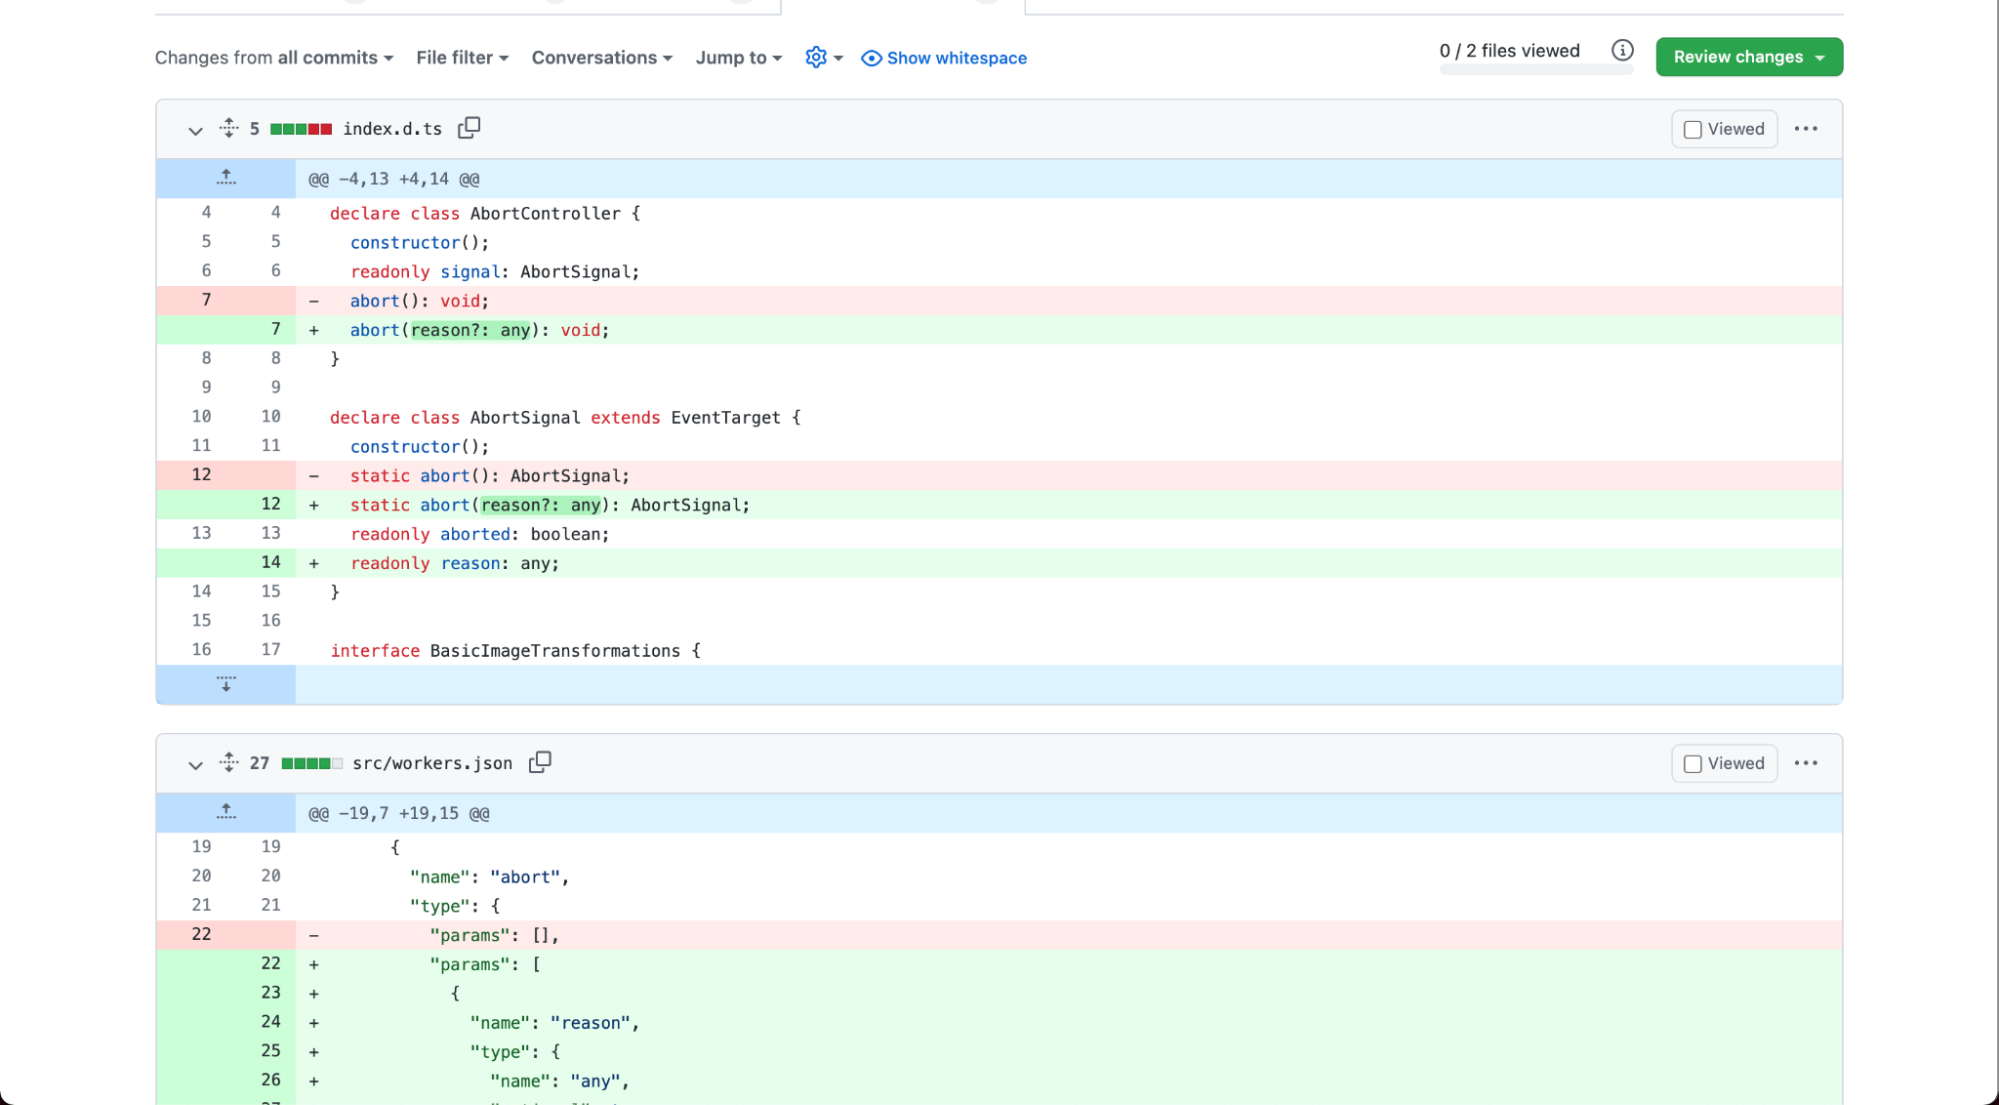
This means the static types will always be accurate and up to date. It also allows projects running Workers in other, statically-typed languages to generate their own types from our intermediate representation. Here is an example PR from our Cloudflare bot. It’s detected a change in the runtime types and is updating the TypeScript files as well as the intermediate representation.

Automatically generating types for Cloudflare Workers

Using the auto-generated types

To get started, use wrangler to generate a new TypeScript project:

$ wrangler generate my-typescript-worker https://github.com/cloudflare/worker-typescript-template

If you already have a TypeScript project, you can install the latest version of workers-types with:

$ npm install --save-dev @cloudflare/workers-types

And then add @cloudflare/workers-types to your project’s tsconfig.json file.

{
"compilerOptions": {
"target": "ES2020",
"module": "CommonJS",
"lib": ["ES2020"],
"types": ["@cloudflare/workers-types"]
}
}

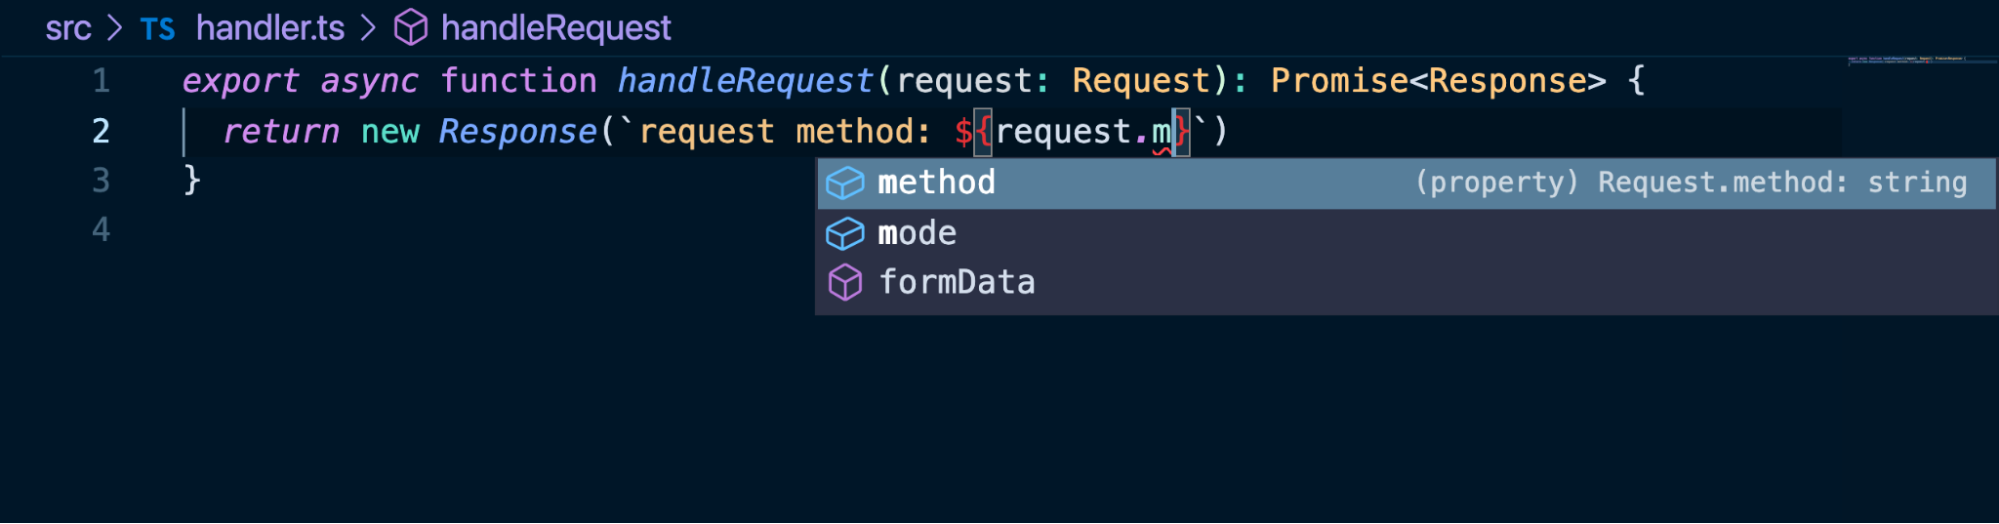
After that, you should get automatic type completion in your IDE of choice.

Automatically generating types for Cloudflare Workers

How it works

Here is some example code from the Workers runtime codebase.

class Blob: public js::Object {
public:
typedef kj::Array<kj::OneOf<kj::Array<const byte>, kj::String, js::Ref<Blob>>> Bits;
struct Options {
js::Optional<kj::String> type;
JS_STRUCT(type);
};
static js::Ref<Blob> constructor(js::Optional<Bits> bits, js::Optional<Options> options);
int getSize();
js::Ref<Blob> slice(js::Optional<int> start, js::Optional<int> end);
JS_RESOURCE_TYPE(Blob) {
JS_READONLY_PROPERTY(size, getSize);
JS_METHOD(slice);
}
};

A Python script runs over this code during each build and generates an Abstract Syntax Tree containing information about the function including an identifier, any argument types and any return types.

{
  "name": "Blob",
  "kind": "class",
  "members": [
    {
      "name": "size",
      "type": {
        "name": "integer"
      },
      "readonly": true
    },
    {
      "name": "slice",
      "type": {
        "params": [
          {
            "name": "start",
            "type": {
              "name": "integer",
              "optional": true
            }
          },
          {
            "name": "end",
            "type": {
              "name": "integer",
              "optional": true
            }
          }
        ],
        "returns": {
          "name": "Blob"
        }
      }
    }
  ]
}

Finally, the TypeScript types repositories are automatically sent PRs with the updated types.

declare type BlobBits = (ArrayBuffer | string | Blob)[];

interface BlobOptions {
  type?: string;
}

declare class Blob {
  constructor(bits?: BlobBits, options?: BlobOptions);
  readonly size: number;
  slice(start?: number, end?: number, type?: string): Blob;
}

Overrides

In some cases, TypeScript supports concepts that our C++ runtime does not. Namely, generics and function overloads. In these cases, we override the generated types with partial declarations. For example, DurableObjectStorage makes heavy use of generics for its getter and setter functions.

declare abstract class DurableObjectStorage {
	 get<T = unknown>(key: string, options?: DurableObjectStorageOperationsGetOptions): Promise<T | undefined>;
	 get<T = unknown>(keys: string[], options?: DurableObjectStorageOperationsGetOptions): Promise<Map<string, T>>;
	 
	 list<T = unknown>(options?: DurableObjectStorageOperationsListOptions): Promise<Map<string, T>>;
	 
	 put<T>(key: string, value: T, options?: DurableObjectStorageOperationsPutOptions): Promise<void>;
	 put<T>(entries: Record<string, T>, options?: DurableObjectStorageOperationsPutOptions): Promise<void>;
	 
	 delete(key: string, options?: DurableObjectStorageOperationsPutOptions): Promise<boolean>;
	 delete(keys: string[], options?: DurableObjectStorageOperationsPutOptions): Promise<number>;
	 
	 transaction<T>(closure: (txn: DurableObjectTransaction) => Promise<T>): Promise<T>;
	}

You can also write type overrides using Markdown. Here is an example of overriding types of KVNamespace.

Creating your own types

The JSON IR (intermediate representation) has been open sourced alongside the TypeScript types and can be found in this GitHub repository. We’ve also open sourced the type schema itself, which describes the format of the IR. If you’re interested in generating Workers types for your own language, you can take the IR, which describes the declaration in a “normalized” data structure, and generate types from it.

The declarations inside `workers.json` contain the elements to derive function signatures and other elements needed for code generation such as identifiers, argument types, return types and error management. A concrete use-case would be to generate external function declarations for a language that compiles to WebAssembly, to import precisely the set of available function calls available from the Workers runtime.

Conclusion

Cloudflare cares deeply about supporting the TypeScript and Rust ecosystems. Brendan created a tool which will ensure the type information for both languages is always up-to-date and accurate. We also are open-sourcing the type information itself in JSON format, so that anyone interested can create type data for any language they’d like!

JavaScript modules are now supported on Cloudflare Workers

Post Syndicated from Ashcon Partovi original https://blog.cloudflare.com/workers-javascript-modules/

JavaScript modules are now supported on Cloudflare Workers

JavaScript modules are now supported on Cloudflare Workers

We’re excited to announce that JavaScript modules are now supported on Cloudflare Workers. If you’ve ever taken look at an example Worker written in JavaScript, you might recognize the following code snippet that has been floating around the Internet the past few years:

addEventListener("fetch", (event) => {
  event.respondWith(new Response("Hello Worker!"));
}

The above syntax is known as the “Service Worker” API, and it was proposed to be standardized for use in web browsers. The idea is that you can attach a JavaScript file to a web page to modify its HTTP requests and responses, acting like a virtual endpoint. It was exactly what we needed for Workers, and it even integrated well with standard Web APIs like fetch() and caches.

Before introducing modules, we want to make it clear that we will continue to support the Service Worker API. No developer wants to get an email saying that you need to rewrite your code because an API or feature is being deprecated; and you won’t be getting one from us. If you’re interested in learning why we made this decision, you can read about our commitment to backwards-compatibility for Workers.

What are JavaScript modules?

JavaScript modules, also known as ECMAScript (abbreviated. “ES”) modules, is the standard API for importing and exporting code in JavaScript. It was introduced by the “ES6” language specification for JavaScript, and has been implemented by most Web browsers, Node.js, Deno, and now Cloudflare Workers. Here’s an example to demonstrate how it works:

// filename: ./src/util.js
export function getDate(time) {
  return new Date(time).toISOString().split("T")[0]; // "YYYY-MM-DD"
}

The “export” keyword indicates that the “getDate” function should be exported from the current module. Then, you can use “import” from another module to use that function.

// filename: ./src/index.js
import { getDate } from "./util.js"

console.log("Today’s date:", getDate());

Those are the basics, but there’s a lot more you can do with modules. It allows you to organize, maintain, and re-use your code in an elegant way that just works. While we can’t go over every aspect of modules here, if you’d like to learn more we’d encourage you to read the MDN guide on modules, or a more technical deep-dive by Lin Clark.

How can I use modules in Workers?

You can export a default module, which will represent your Worker. Instead of using “addEventListener,” each event handler is defined as a function on that module. Today, we support “fetch” for HTTP and WebSocket requests and “scheduled” for cron triggers.

export default {
  async fetch(request, environment, context) {
    return new Response("I’m a module!");
  },
  async scheduled(controller, environment, context) {
    // await doATask();
  }
}

You may also notice some other differences, such as the parameters on each event handler. Instead of a single “Event” object, the parameters that you need the most are spread out on their own. The first parameter is specific to the event type: for “fetch” it’s the Request object, and for “scheduled” it’s a controller that contains the cron schedule.

The second parameter is an object that contains your environment variables (also known as “bindings“). Previously, each variable was inserted into the global scope of the Worker. While a simple solution, it was confusing to have variables magically appear in your code. Now, with an environment object, you can control which modules and libraries get access to your environment variables. This mechanism is more secure, as it can prevent a compromised or nosy third-party library from enumerating all your variables or secrets.

The third parameter is a context object, which allows you to register background tasks using waitUntil(). This is useful for tasks like logging or error reporting that should not block the execution of the event.

When you put that all together, you can import and export multiple modules, as well as use the new event handler syntax.

// filename: ./src/error.js
export async function logError(url, error) {
  await fetch(url, {
     method: "POST",
     body: error.stack
  })
}

// filename: ./src/worker.js
import { logError } from "./error.js"

export default {
  async fetch(request, environment, context) {
    try {
       return await fetch(request);
    } catch (error) {
       context.waitUntil(logError(environment.ERROR_URL, error));
       return new Response("Oops!", { status: 500 });
    }
  }
}

Let’s not forget about Durable Objects, which became generally available earlier this week! You can also export classes, which is how you define a Durable Object class. Here’s another example with a “Counter” Durable Object, that responds with an incrementing value.

// filename: ./src/counter.js
export class Counter {
  value = 0;
  fetch() {
    this.value++;
    return new Response(this.value.toString());
  }
}

// filename: ./src/worker.js
// We need to re-export the Durable Object class in the Worker module.
export { Counter } from "./counter.js"

export default {
  async fetch(request, environment) {
    const clientId = request.headers.get("cf-connecting-ip");
    const counterId = environment.Counter.idFromName(clientId);
    // Each IP address gets its own Counter.
    const counter = environment.Counter.get(counterId);
    return counter.fetch("https://counter.object/increment");
  }
}

Are there non-JavaScript modules?

Yes! While modules are primarily for JavaScript, we also support other modules types, some of which are not yet standardized.

For instance, you can import WebAssembly as a module. Previously, with the Service Worker API, WebAssembly was included as a binding. We think that was a mistake, since WebAssembly should be represented as code and not an external resource. With modules, here’s the new way to import WebAssembly:

import module from "./lib/hello.wasm"

export default {
  async fetch(request) {
    const instance = await WebAssembly.instantiate(module);
    const result = instance.exports.hello();
    return new Response(result);
  }
}

While not supported today, we look forward to a future where WebAssembly and JavaScript modules can be more tightly integrated, as outlined in this proposal. The ergonomics improvement, demonstrated below, can go a long way to make WebAssembly more included in the JavaScript ecosystem.

import { hello } from "./lib/hello.wasm"

export default {
  async fetch(request) {
    return new Response(hello());
  }
}

We’ve also added support for text and binary modules, which allow you to import a String and ArrayBuffer, respectively. While not standardized, it allows you to easily import resources like an HTML file or an image.

<!-- filename: ./public/index.html -->
<!DOCTYPE html>
<html><body>
<p>Hello!</p>
</body></html>

import html from "../public/index.html"

export default {
  fetch(request) {
    if (request.url.endsWith("/index.html") {
       return new Response(html, {
          headers: { "Content-Type": "text/html" }
       });
    }
    return fetch(request);
  }
}

How can I get started?

There are many ways to get started with modules.

First, you can try out modules in your browser using our playground (which doesn’t require an account) or by using the dashboard quick editor. Your browser will automatically detect when you’re using modules to allow you to seamlessly switch from the Service Worker API. For now, you’ll only be able to create one JavaScript module in the browser, though supporting multiple modules is something we’ll be improving soon.

If you’re feeling adventurous and want to start a new project using modules, you can try out the beta release of wrangler 2.0, the next-generation of the command-line interface (CLI) for Workers.

For existing projects, we still recommend using wrangler 1.0 (release 1.17 or later). To enable modules, you can adapt your “wrangler.toml” configuration to the following example:

name = "my-worker"
type = "javascript"
workers_dev = true

[build.upload]
format = "modules"
dir = "./src"
main = "./worker.js" # becomes "./src/worker.js"

[[build.upload.rules]]
type = "ESModule"
globs = "**/*.js"

# Uncomment if you have a build script.
# [build]
# command = "npm run build"

We’ve updated our documentation to provide more details about modules, though some examples will still be using the Service Worker API as we transition to showing both formats. (and TypeScript as a bonus!)

If you experience an issue or notice something strange with modules, please let us know, and we’ll take a look. Happy coding, and we’re excited to see what you build with modules!

JavaScript modules are now supported on Cloudflare Workers

Introducing Services: Build Composable, Distributed Applications on Cloudflare Workers

Post Syndicated from Ashcon Partovi original https://blog.cloudflare.com/introducing-worker-services/

Introducing Services: Build Composable, Distributed Applications on Cloudflare Workers

Introducing Services: Build Composable, Distributed Applications on Cloudflare Workers

First, there was the Worker script. It was simple, yet elegant. With just a few lines of code, you could rewrite an HTTP request, append a header, or make a quick fix to your website.

Though, what if you wanted to build an entire application on Workers? You’d need a lot more tools in your developer toolbox. That’s why we’ve introduced extensions to Workers platform like KV, our distributed key-value store; Durable Objects, — a strongly consistent, object-oriented database; and soon R2, the no-egress object storage. While these tools allow you to build a more robust application, there’s still a gap when it comes to building a system architecture, composed of many applications or services.

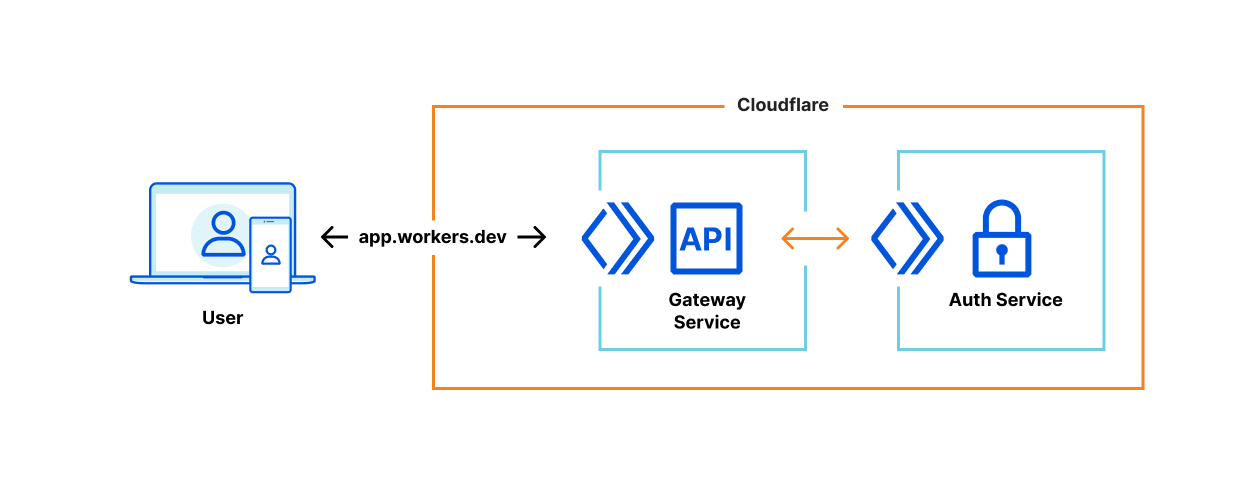
Imagine you’ve built an authentication service that authorizes requests to your API. You’d want to re-use that logic among all your other services. Moreover, when you make changes to that authentication service, you’d want to test it in a controlled environment that doesn’t affect those other services in production. Well, you don’t need to imagine anymore.

Introducing Services

Services are the new building block for deploying applications on Cloudflare Workers. Unlike the script, a service is composable, which allows services to talk to each other. Services also support multiple environments, which allow you to test changes in a preview environment, then promote to production when you’re confident it worked.

To enable a seamless transition to services, we’ve automatically migrated every script to become a service with one “production” environment — no action needed.

Services have environments

Each service comes with a production environment and the ability to create or clone dozens of preview environments. Every aspect of an environment is overridable: the code, environment variables, and even resources like a KV namespace. You can create and switch between environments with just a few clicks in the dashboard.

Each environment is resolvable at a unique hostname, which is automatically generated when you create or rename the environment. There’s no waiting around after you deploy. Everything you need, like DNS records, SSL certificates, and more, is ready-to-go seconds later. If you’d like a more advanced setup, you can also add custom routes from your domain to an environment.

Once you’ve tested your changes in a preview environment, you’re ready to promote to production. We’ve made it really easy to promote code from one environment to another, without the need to rebuild or upload your code again. Environments also manage code separately from settings, so you don’t need to manually edit environment variables when you promote from staging to production.

Services are versioned

Every change to a service is versioned and audited. Mistakes do happen, but when they do, it’s important to be able to quickly roll back, then have the tools to answer the age-old question: “who changed what, when?”

Introducing Services: Build Composable, Distributed Applications on Cloudflare Workers

Each environment in a service has its own version history. Every time there is a code change or an environment variable is updated, the version number of that environment is incremented. You can also append additional metadata to each version, like a git commit or a deployment tag.

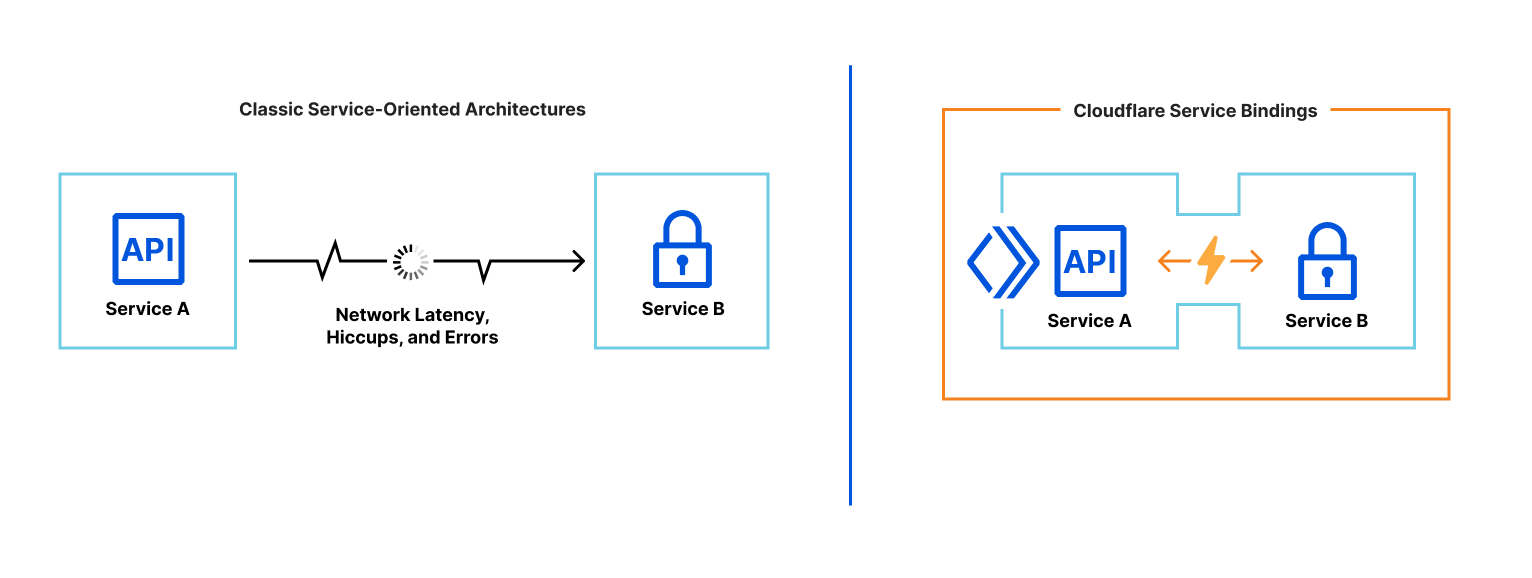
Services can talk to each other

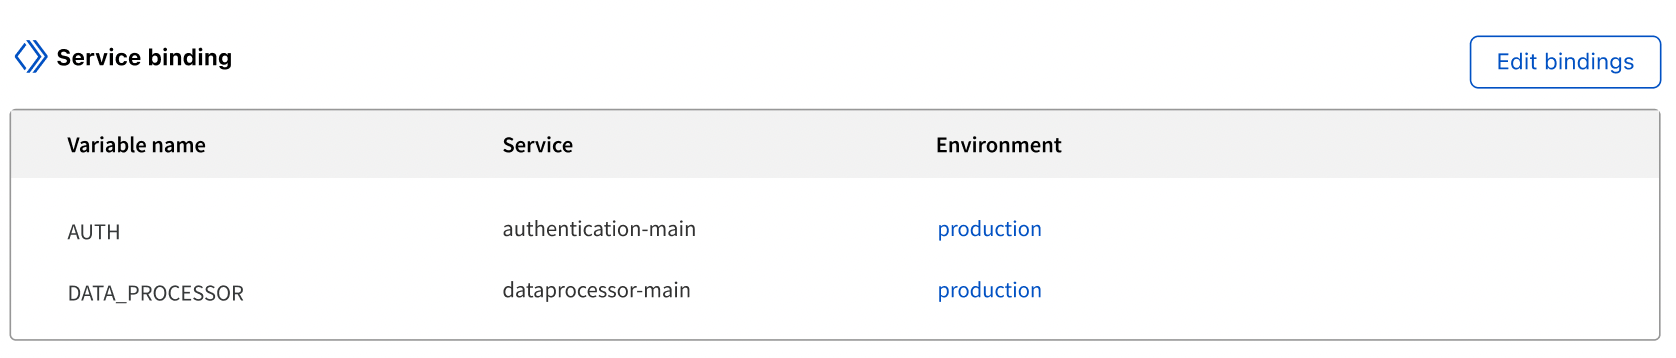
Services are composable, allowing one service to talk to another service. To support this, we’re introducing a new API to facilitate service-to-service communication: service bindings.

Introducing Services: Build Composable, Distributed Applications on Cloudflare Workers

A service binding allows you to send HTTP requests to another service, without those requests going over the Internet. That means you can invoke other Workers directly from your code! Service bindings open up a new world of composability. In the example below, requests are validated by an authentication service.

export default {
  async fetch(request, environment) {
    const response = await environment.AUTH.fetch(request);
    if (response.status !== 200) {
      return response;
    }
    return new Response("Authenticated!");
  }
}

Introducing Services: Build Composable, Distributed Applications on Cloudflare Workers

Service bindings use the standard fetch API, so you can continue to use your existing utilities and libraries. You can also change the environment of a service binding, so you can test a new version of a service. In the next example, 1% of requests are routed to a “canary” deployment of a service. If a request to the canary fails, it’s sent to the production deployment for another chance.

export default {
  canRetry(request) {
    return request.method === "GET" || request.method === "HEAD";
  },
  async fetch(request, environment) {
    if (Math.random() < 0.01) {
      const response = await environment.CANARY.fetch(request.clone());
      if (response.status < 500 || !canRetry(request)) {
        return response;
      }
    }
    return environment.PRODUCTION.fetch(request);
  }
}

While the interface among services is HTTP, the networking is not. In fact, there is no networking! Unlike the typical “microservice architecture,” where services communicate over a network and can suffer from latency or interruption, service bindings are a zero-cost abstraction. When you deploy a service, we build a dependency graph of its service bindings, then package all of those services into a single deployment. When one service invokes another, there is no network delay; the request is executed immediately.

Introducing Services: Build Composable, Distributed Applications on Cloudflare Workers

This zero-cost model enables teams to share and reuse code within their organizations, without sacrificing latency or performance. Forget the days of convoluted YAML templates or exponential back off to orchestrate services — just write code, and we’ll stitch it all together.

Try out the future, today!

We’re excited to announce that you can start using Services today! If you’ve already used Workers, you’ll notice that each of your scripts have been upgraded to a service with one “production” environment. The dashboard and all the existing Cloudflare APIs will continue to “just work” with services.

You can also create and deploy code to multiple “preview” environments, as part of the open-beta launch. We’re still working on service bindings and versioning, and we’ll provide an update as soon as you can start using them.

For more information about Services, check out any of the resources below:

Introducing Services: Build Composable, Distributed Applications on Cloudflare Workers

Wire Fraud Scam Upgraded with Bitcoin

Post Syndicated from Bruce Schneier original https://www.schneier.com/blog/archives/2021/11/wire-fraud-scam-upgraded-with-bitcoin.html

The FBI has issued a bulletin describing a bitcoin variant of a wire fraud scam:

As the agency describes it, the scammer will contact their victim and somehow convince them that they need to send money, either with promises of love, further riches, or by impersonating an actual institution like a bank or utility company. After the mark is convinced, the scammer will have them get cash (sometimes out of investment or retirement accounts), and head to an ATM that sells cryptocurrencies and supports reading QR codes. Once the victim’s there, they’ll scan a QR code that the scammer sent them, which will tell the machine to send any crypto purchased to the scammer’s address. Just like that, the victim loses their money, and the scammer has successfully exploited them.

[…]

The “upgrade” (as it were) for scammers with the crypto ATM method is two-fold: it can be less friction than sending a wire transfer, and at the end the scammer has cryptocurrency instead of fiat. With wire transfers, you have to fill out a form, and you may give that form to an actual person (who could potentially vibe check you). Using the ATM method, there’s less time to reflect on the fact that you’re about to send money to a stranger. And, if you’re a criminal trying to get your hands on Bitcoin, you won’t have to teach your targets how to buy coins on the internet and transfer them to another wallet — they probably already know how to use an ATM and scan a QR code.

Why I Hate Password Rules

Post Syndicated from Bruce Schneier original https://www.schneier.com/blog/archives/2021/11/why-i-hate-password-rules.html

The other day, I was creating a new account on the web. It was financial in nature, which means it gets one of my most secure passwords. I used Password Safe to generate this 16-character alphanumeric password:

:s^Twd.J;3hzg=Q~

Which was rejected by the site, because it didn’t meet its password security rules.

It took me a minute to figure out what was wrong with it. The site wanted at least two numbers.

Sheesh.

Okay, that’s not really why I don’t like password rules. I don’t like them because they’re all different. Even if someone has a strong password generation system, it is likely that whatever they come up with won’t pass somebody’s ruleset.

Zabbix 6.0 LTS at Zabbix Summit Online 2021

Post Syndicated from Arturs Lontons original https://blog.zabbix.com/zabbix-6-0-lts-at-zabbix-summit-online-2021/16115/

With Zabbix Summit Online 2021 just around the corner, it’s time to have a quick overview of the 6.0 LTS features that we can expect to see featured during the event. The Zabbix 6.0 LTS release aims to deliver some of the long-awaited enterprise-level features while also improving the general user experience, performance, scalability, and many other aspects of Zabbix.

Native Zabbix server cluster

Many of you will be extremely happy to hear that Zabbix 6.0 LTS release comes with out-of-the-box High availability for Zabbix Server. This means that HA will now be supported natively, without having to use external tools to create Zabbix Server clusters.

The native Zabbix Server cluster will have a speech dedicated to it during the Zabbix Summit Online 2021. You can expect to learn both the inner workings of the HA solution, the configuration and of course the main benefits of using the native HA solution. You can also take a look at the in-development version of the native Zabbix server cluster in the latest Zabbix 6.0 LTS alpha release.

Business service monitoring and root cause analysis

Service monitoring is also about to go through a significant redesign, focusing on delivering additional value by providing robust Business service monitoring (BSM) features. This is achieved by delivering significant additions to the existing service status calculation logic. With features such as service weights, service status analysis based on child problem severities, ability to calculate service status based on the number or percentage of children in a problem state, users will be able to implement BSM on a whole new level. BSM will also support root cause analysis – users will be informed about the root cause problem of the service status change.

All of this and more, together with examples and use cases will be covered during a separate speech dedicated to BSM. In addition, some of the BSM features are available in the latest Zabbix 6.0 LTS alpha release – with more to come as we continue working on the Zabbix 6.0 release.

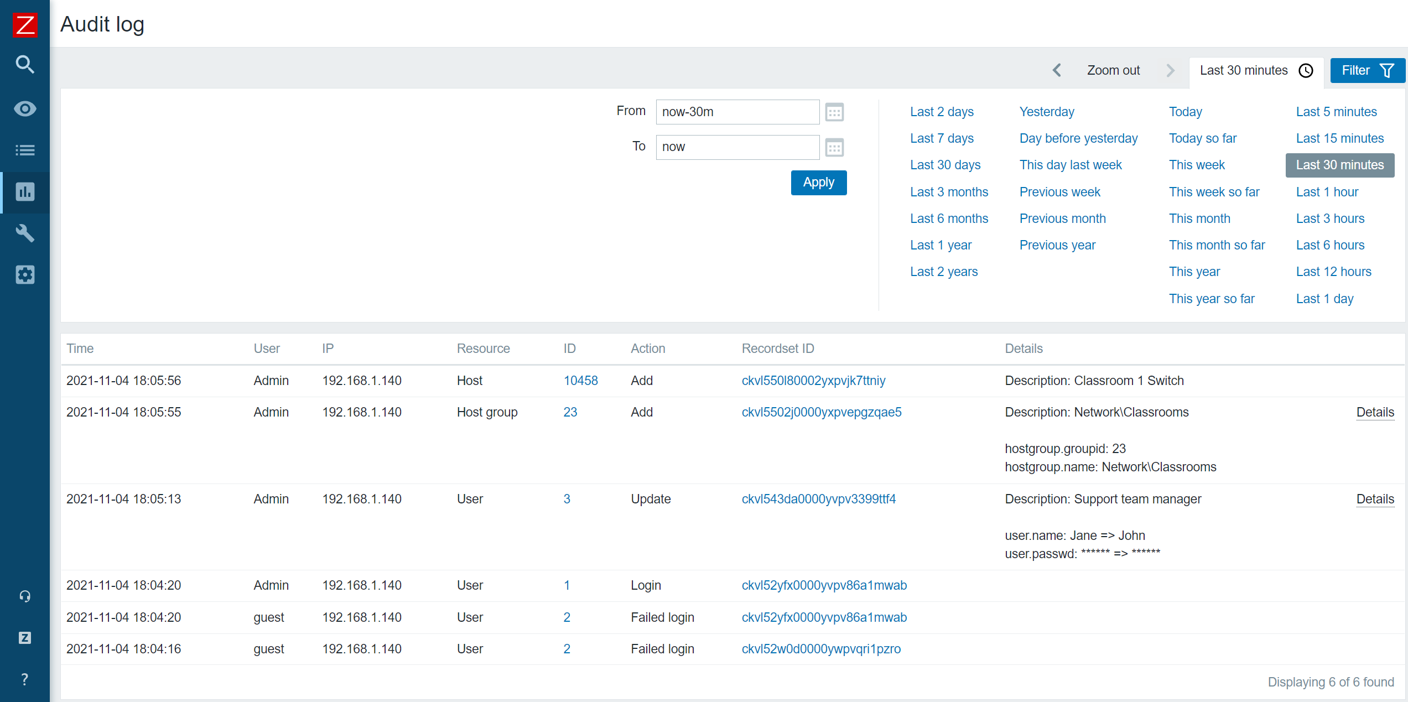
Audit log redesign

The Audit log is another existing feature that has received a complete redesign. With the ability to log each and every change performed both by the Zabbix Server and Zabbix Frontend, the Audit log will become an invaluable source of audit information. Of course, the redesign also takes performance into consideration – the redesign was developed with the least possible performance impact in mind.

The audit log is constantly in development and the current Zabbix 6.0 LTS alpha release offers you an early look at the feature. We will also be covering the technical details of the new audit log implementation during the Summit and will explain how we are able to achieve minimal performance impact with major improvements to Zabbix audit logging.

Geographical maps

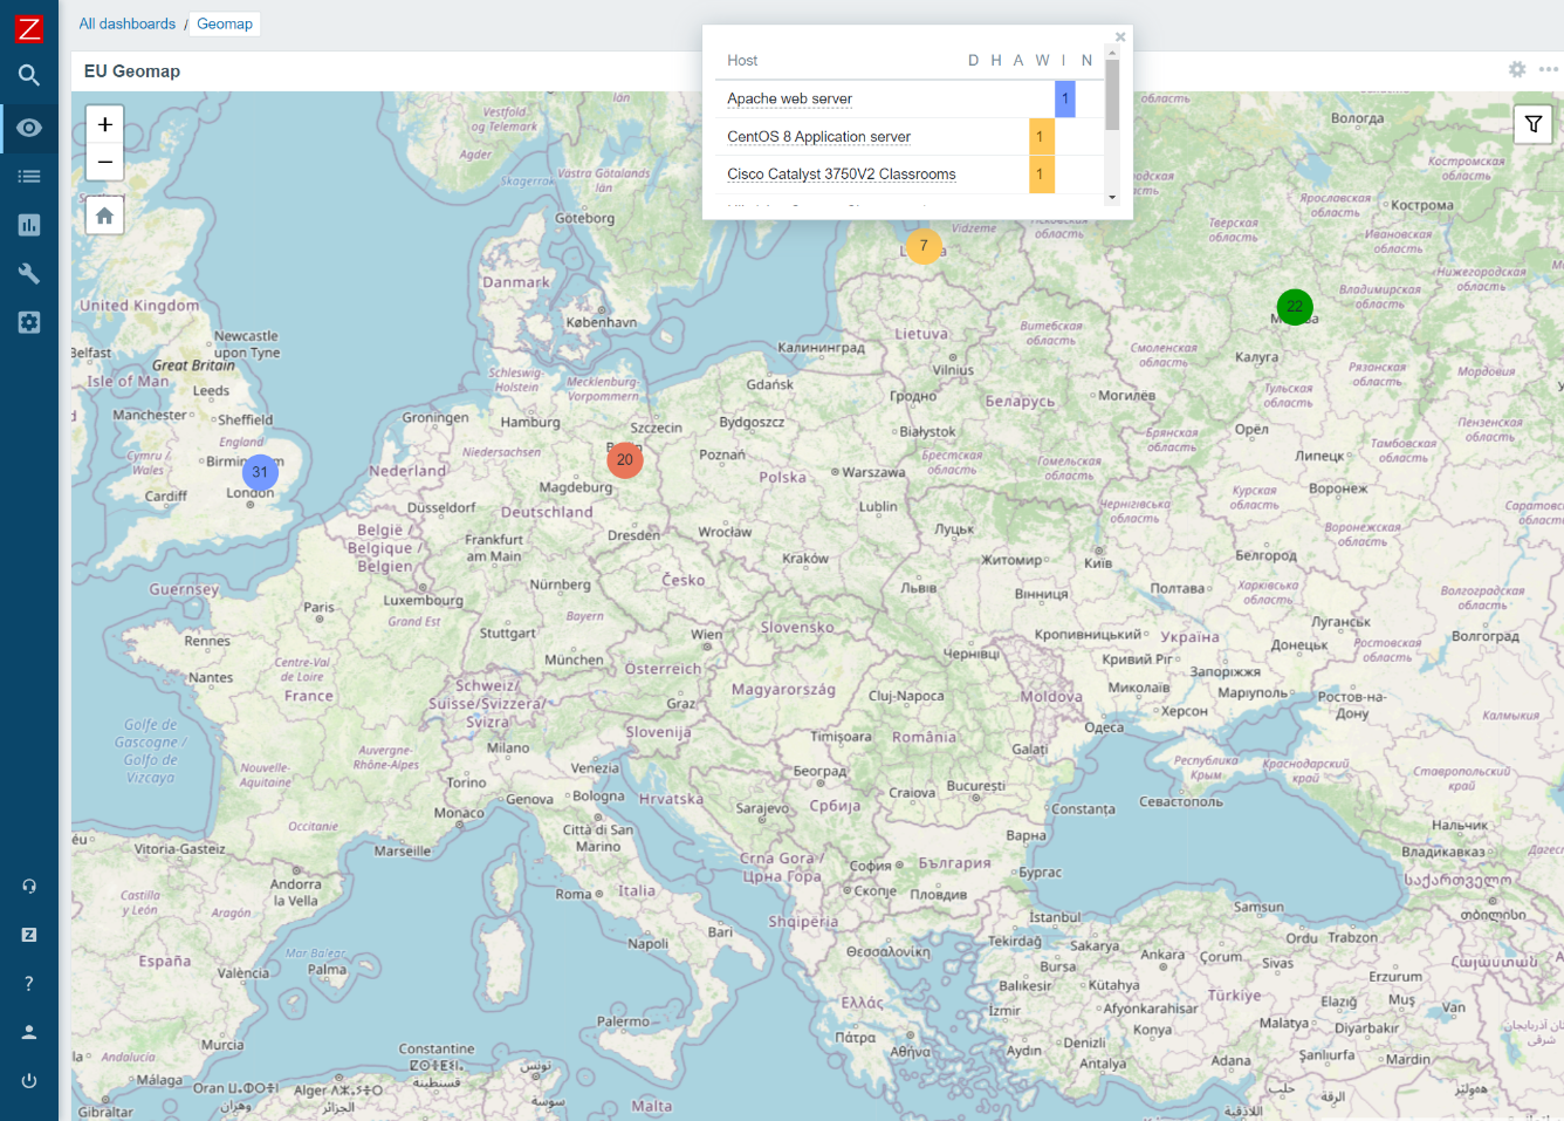
With Geographical maps, our users can finally display their entities on a geographical map based on the coordinates of the entity. Geographical maps can be used with multiple geographical map providers and display your hosts with their most severe problems. In addition, geographical maps will react dynamically to Zoom levels and support filtering.

The latest Zabbix 6.0 Alpha release includes the Geomap widget – feel free to deploy it in your QA environment, check out the different map providers, filter options and other great features that come with this widget.

Machine learning

When it comes to problem detection, Zabbix 6.0 LTS will deliver multiple trend new functions. A specific set of functions provides machine learning functionality for Anomaly detection and Baseline monitoring.

The topic will be covered in-depth during the Zabbix Summit Online 2021. We will look at the configuration of the new functions and also take a deeper dive at the logic and algorithms used under the hood.

During the Zabbix Summit Online 2021, we will also cover many other new features, such as:

  • New Dashboard widgets
  • New items for Zabbix Agent
  • New templates and integrations
  • Zabbix login password complexity settings
  • Performance improvements for Zabbix Server, Zabbix Proxy, and Zabbix Frontend
  • UI and UX improvements
  • Zabbix login password complexity requirements
  • New history and trend functions
  • And more!

Not only will you get the chance to have an early look at many new features not yet available in the latest alpha release, but also you will have a great chance to learn the inner workings of the new features, the upgrade and migration process to Zabbix 6.0 LTS and much more!

We are extremely excited to share all of the new features with our community, so don’t miss out – take a look at the full Zabbix Summit online 2021 agenda and register for the event by visiting our Zabbix Summit page, and we will see you at the Zabbix Summit Online 2021 on November 25!

Introducing Prometheus Agent Mode, an Efficient and Cloud-Native Way for Metric Forwarding

Post Syndicated from Bartlomiej Plotka (@bwplotka) original https://prometheus.io/blog/2021/11/16/agent/

Bartek Płotka has been a Prometheus Maintainer since 2019 and Principal Software Engineer at Red Hat. Co-author of the CNCF Thanos project. CNCF Ambassador and tech lead for the CNCF TAG Observability. In his free time, he writes a book titled “Efficient Go” with O’Reilly. Opinions are my own!

What I personally love in the Prometheus project, and one of the many reasons why I joined the team, was the laser focus on the project’s goals. Prometheus was always about pushing boundaries when it comes to providing pragmatic, reliable, cheap, yet invaluable metric-based monitoring. Prometheus’ ultra-stable and robust APIs, query language, and integration protocols (e.g. Remote Write and OpenMetrics) allowed the Cloud Native Computing Foundation (CNCF) metrics ecosystem to grow on those strong foundations. Amazing things happened as a result:

  • We can see community exporters for getting metrics about virtually everything e.g. containers, eBPF, Minecraft server statistics and even plants’ health when gardening.
  • Most people nowadays expect cloud-native software to have an HTTP/HTTPS /metrics endpoint that Prometheus can scrape. A concept developed in secret within Google and pioneered globally by the Prometheus project.
  • The observability paradigm shifted. We see SREs and developers rely heavily on metrics from day one, which improves software resiliency, debuggability, and data-driven decisions!

In the end, we hardly see Kubernetes clusters without Prometheus running there.

The strong focus of the Prometheus community allowed other open-source projects to grow too to extend the Prometheus deployment model beyond single nodes (e.g. Cortex, Thanos and more). Not mentioning cloud vendors adopting Prometheus’ API and data model (e.g. Amazon Managed Prometheus, Google Cloud Managed Prometheus, Grafana Cloud and more). If you are looking for a single reason why the Prometheus project is so successful, it is this: Focusing the monitoring community on what matters.

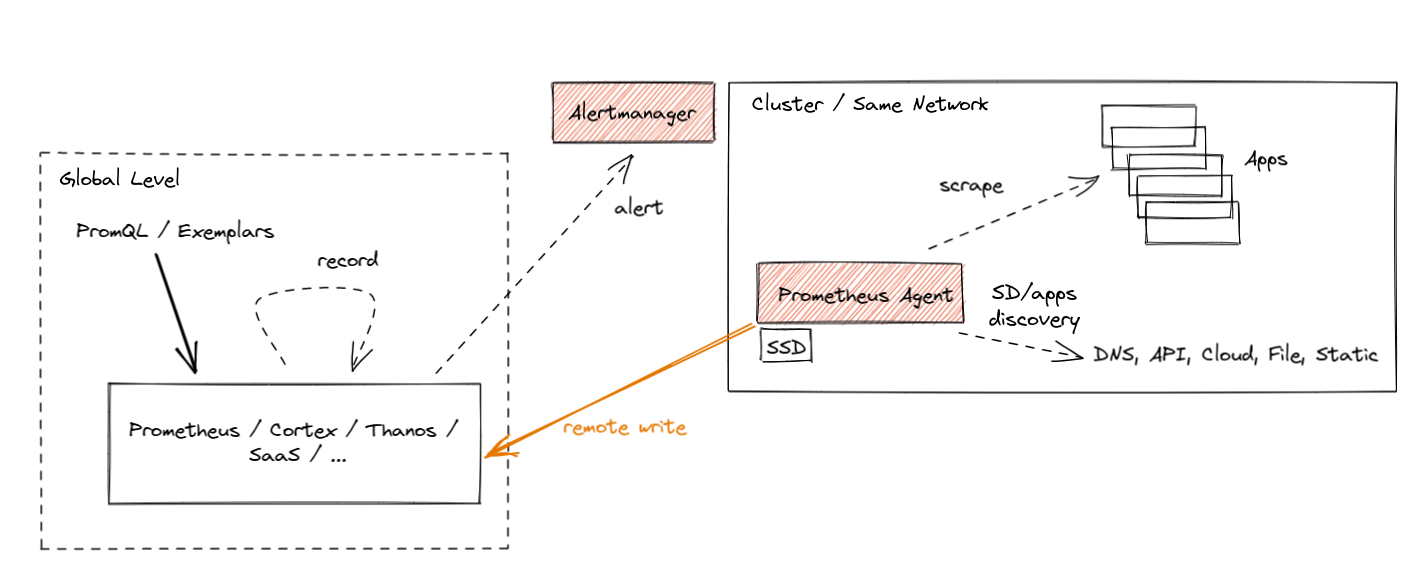
In this (lengthy) blog post, I would love to introduce a new operational mode of running Prometheus called “Agent”. It is built directly into the Prometheus binary. The agent mode disables some of Prometheus’ usual features and optimizes the binary for scraping and remote writing to remote locations. Introducing a mode that reduces the number of features enables new usage patters. In this blog post I will explain why it is a game-changer for certain deployments in the CNCF ecosystem. I am super excited about this!

History of the Forwarding Use Case

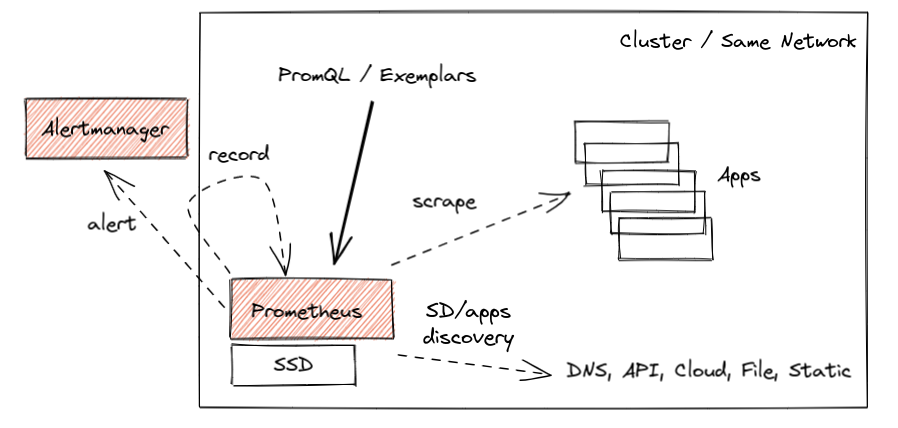
The core design of Prometheus has been unchanged for the project’s entire lifetime. Inspired by Google’s Borgmon monitoring system, you can deploy a Prometheus server alongside the applications you want to monitor, tell Prometheus how to reach them, and allow to scrape the current values of their metrics at regular intervals. Such a collection method, which is often referred to as the “pull model”, is the core principle that allows Prometheus to be lightweight and reliable. Furthermore, it enables application instrumentation and exporters to be dead simple, as they only need to provide a simple human-readable HTTP endpoint with the current value of all tracked metrics (in OpenMetrics format). All without complex push infrastructure and non-trivial client libraries. Overall, a simplified typical Prometheus monitoring deployment looks as below:

Prometheus high-level view

This works great, and we have seen millions of successful deployments like this over the years that process dozens of millions of active series. Some of them for longer time retention, like two years or so. All allow to query, alert, and record metrics useful for both cluster admins and developers.

However, the cloud-native world is constantly growing and evolving. With the growth of managed Kubernetes solutions and clusters created on-demand within seconds, we are now finally able to treat clusters as “cattle”, not as “pets” (in other words, we care less about individual instances of those). In some cases, solutions do not even have the cluster notion anymore, e.g. kcp, Fargate and other platforms.

Yoda

The other interesting use case that emerges is the notion of Edge clusters or networks. With industries like telecommunication, automotive and IoT devices adopting cloud-native technologies, we see more and more much smaller clusters with a restricted amount of resources. This is forcing all data (including observability) to be transferred to remote, bigger counterparts as almost nothing can be stored on those remote nodes.

What does that mean? That means monitoring data has to be somehow aggregated, presented to users and sometimes even stored on the global level. This is often called a Global-View feature.

Naively, we could think about implementing this by either putting Prometheus on that global level and scraping metrics across remote networks or pushing metrics directly from the application to the central location for monitoring purposes. Let me explain why both are generally very bad ideas:

🔥 Scraping across network boundaries can be a challenge if it adds new unknowns in a monitoring pipeline. The local pull model allows Prometheus to know why exactly the metric target has problems and when. Maybe it’s down, misconfigured, restarted, too slow to give us metrics (e.g. CPU saturated), not discoverable by service discovery, we don’t have credentials to access or just DNS, network, or the whole cluster is down. By putting our scraper outside of the network, we risk losing some of this information by introducing unreliability into scrapes that is unrelated to an individual target. On top of that, we risk losing important visibility completely if the network is temporarily down. Please don’t do it. It’s not worth it. (:

🔥 Pushing metrics directly from the application to some central location is equally bad. Especially when you monitor a larger fleet, you know literally nothing when you don’t see metrics from remote applications. Is the application down? Is my receiver pipeline down? Maybe the application failed to authorize? Maybe it failed to get the IP address of my remote cluster? Maybe it’s too slow? Maybe the network is down? Worse, you may not even know that the data from some application targets is missing. And you don’t even gain a lot as you need to track the state and status of everything that should be sending data. Such a design needs careful analysis as it can be a recipe for a failure too easily.

NOTE: Serverless functions and short-living containers are often cases where we think about push from application as the rescue. At this point however we talk about events or pieces of metrics we might want to aggregate to longer living time series. This topic is discussed here, feel free to contribute and help us support those cases better!

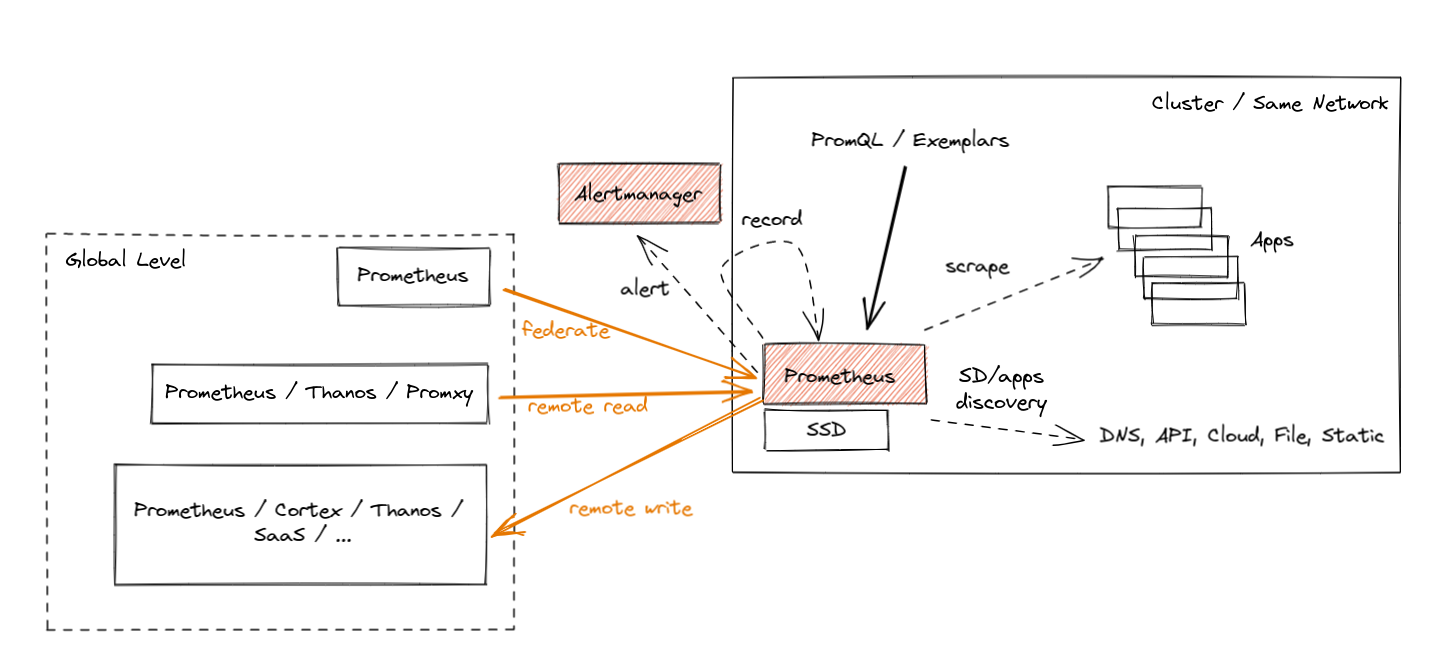
Prometheus introduced three ways to support the global view case, each with its own pros and cons. Let’s briefly go through those. They are shown in orange color in the diagram below:

Prometheus global view

  • Federation was introduced as the first feature for aggregation purposes. It allows a global-level Prometheus server to scrape a subset of metrics from a leaf Prometheus. Such a “federation” scrape reduces some unknowns across networks because metrics exposed by federation endpoints include the original samples’ timestamps. Yet, it usually suffers from the inability to federate all metrics and not lose data during longer network partitions (minutes).
  • Prometheus Remote Read allows selecting raw metrics from a remote Prometheus server’s database without a direct PromQL query. You can deploy Prometheus or other solutions (e.g. Thanos) on the global level to perform PromQL queries on this data while fetching the required metrics from multiple remote locations. This is really powerful as it allows you to store data “locally” and access it only when needed. Unfortunately, there are cons too. Without features like Query Pushdown we are in extreme cases pulling GBs of compressed metric data to answer a single query. Also, if we have a network partition, we are temporarily blind. Last but not least, certain security guidelines are not allowing ingress traffic, only egress one.
  • Finally, we have Prometheus Remote Write, which seems to be the most popular choice nowadays. Since the agent mode focuses on remote write use cases, let’s explain it in more detail.

Remote Write

The Prometheus Remote Write protocol allows us to forward (stream) all or a subset of metrics collected by Prometheus to the remote location. You can configure Prometheus to forward some metrics (if you want, with all metadata and exemplars!) to one or more locations that support the Remote Write API. In fact, Prometheus supports both ingesting and sending Remote Write, so you can deploy Prometheus on a global level to receive that stream and aggregate data cross-cluster.

While the official Prometheus Remote Write API specification is in review stage, the ecosystem adopted the Remote Write protocol as the default metrics export protocol. For example, Cortex, Thanos, OpenTelemetry, and cloud services like Amazon, Google, Grafana, Logz.io, etc., all support ingesting data via Remote Write.

The Prometheus project also offers the official compliance tests for its APIs, e.g. remote-write sender compliance for solutions that offer Remote Write client capabilities. It’s an amazing way to quickly tell if you are correctly implementing this protocol.

Streaming data from such a scraper enables Global View use cases by allowing you to store metrics data in a centralized location. This also enables separation of concerns, which is useful when applications are managed by different teams than the observability or monitoring pipelines. Furthermore, it is also why Remote Write is chosen by vendors who want to offload as much work from their customers as possible.

Wait for a second, Bartek. You just mentioned before that pushing metrics directly from the application is not the best idea!

Sure, but the amazing part is that, even with Remote Write, Prometheus still uses a pull model to gather metrics from applications, which gives us an understanding of those different failure modes. After that, we batch samples and series and export, replicate (push) data to the Remote Write endpoints, limiting the number of monitoring unknowns that the central point has!

It’s important to note that a reliable and efficient remote-writing implementation is a non-trivial problem to solve. The Prometheus community spent around three years to come up with a stable and scalable implementation. We reimplemented the WAL (write-ahead-log) a few times, added internal queuing, sharding, smart back-offs and more. All of this is hidden from the user, who can enjoy well-performing streaming or large amounts of metrics stored in a centralized location.

Hands-on Remote Write Example: Katacoda Tutorial

All of this is not new in Prometheus. Many of us already use Prometheus to scrape all required metrics and remote-write all or some of them to remote locations.

Suppose you would like to try the hands-on experience of remote writing capabilities. In that case, we recommend the Thanos Katacoda tutorial of remote writing metrics from Prometheus, which explains all steps required for Prometheus to forward all metrics to the remote location. It’s free, just sign up for an account and enjoy the tutorial! 🤗

Note that this example uses Thanos in receive mode as the remote storage. Nowadays, you can use plenty of other projects that are compatible with the remote write API.

So if remote writing works fine, why did we add a special Agent mode to Prometheus?

Prometheus Agent Mode

From Prometheus v2.32.0 (next release), everyone will be able to run the Prometheus binary with an experimental --enable-feature=agent flag. If you want to try it before the release, feel free to use Prometheus v2.32.0-beta.0 or use our quay.io/prometheus/prometheus:v2.32.0-beta.0 image.

The Agent mode optimizes Prometheus for the remote write use case. It disables querying, alerting, and local storage, and replaces it with a customized TSDB WAL. Everything else stays the same: scraping logic, service discovery and related configuration. It can be used as a drop-in replacement for Prometheus if you want to just forward your data to a remote Prometheus server or any other Remote-Write-compliant project. In essence it looks like this:

Prometheus agent

The best part about Prometheus Agent is that it’s built into Prometheus. Same scraping APIs, same semantics, same configuration and discovery mechanism.

What are the benefits of using the Agent mode if you plan not to query or alert on data locally and stream metrics outside? There are a few:

First of all, efficiency. Our customized Agent TSDB WAL removes the data immediately after successful writes. If it cannot reach the remote endpoint, it persists the data temporarily on the disk until the remote endpoint is back online. This is currently limited to a two-hour buffer only, similar to non-agent Prometheus, hopefully unblocked soon. This means that we don’t need to build chunks of data in memory. We don’t need to maintain a full index for querying purposes. Essentially the Agent mode uses a fraction of the resources that a normal Prometheus server would use in a similar situation.

Does this efficiency matter? Yes! As we mentioned, every GB of memory and every CPU core used on edge clusters matters for some deployments. On the other hand, the paradigm of performing monitoring using metrics is quite mature these days. This means that the more relevant metrics with more cardinality you can ship for the same cost – the better.

NOTE: With the introduction of the Agent mode, the original Prometheus server mode still stays as the recommended, stable and maintained mode. Agent mode with remote storage brings additional complexity. Use with care.

Secondly, the benefit of the new Agent mode is that it enables easier horizontal scalability for ingestion. This is something I am excited about the most. Let me explain why.

The Dream: Auto-Scalable Metric Ingestion

A true auto-scalable solution for scraping would need to be based on the amount of metric targets and the number of metrics they expose. The more data we have to scrape, the more instances of Prometheus we deploy automatically. If the number of targets or their number of metrics goes down, we could scale down and remove a couple of instances. This would remove the manual burden of adjusting the sizing of Prometheus and stop the need for over-allocating Prometheus for situations where the cluster is temporarily small.

With just Prometheus in server mode, this was hard to achieve. This is because Prometheus in server mode is stateful. Whatever is collected stays as-is in a single place. This means that the scale-down procedure would need to back up the collected data to existing instances before termination. Then we would have the problem of overlapping scrapes, misleading staleness markers etc.

On top of that, we would need some global view query that is able to aggregate all samples across all instances (e.g. Thanos Query or Promxy). Last but not least, the resource usage of Prometheus in server mode depends on more things than just ingestion. There is alerting, recording, querying, compaction, remote write etc., that might need more or fewer resources independent of the number of metric targets.

Agent mode essentially moves the discovery, scraping and remote writing to a separate microservice. This allows a focused operational model on ingestion only. As a result, Prometheus in Agent mode is more or less stateless. Yes, to avoid loss of metrics, we need to deploy an HA pair of agents and attach a persistent disk to them. But technically speaking, if we have thousands of metric targets (e.g. containers), we can deploy multiple Prometheus agents and safely change which replica is scraping which targets. This is because, in the end, all samples will be pushed to the same central storage.

Overall, Prometheus in Agent mode enables easy horizontal auto-scaling capabilities of Prometheus-based scraping that can react to dynamic changes in metric targets. This is definitely something we will look at with the Prometheus Kubernetes Operator community going forward.

Now let’s take a look at the currently implemented state of agent mode in Prometheus. Is it ready to use?

Agent Mode Was Proven at Scale

The next release of Prometheus will include Agent mode as an experimental feature. Flags, APIs and WAL format on disk might change. But the performance of the implementation is already battle-tested thanks to Grafana Labs’ open-source work.

The initial implementation of our Agent’s custom WAL was inspired by the current Prometheus server’s TSDB WAL and created by Robert Fratto in 2019, under the mentorship of Tom Wilkie, Prometheus maintainer. It was then used in an open-source Grafana Agent project that was since then used by many Grafana Cloud customers and community members. Given the maturity of the solution, it was time to donate the implementation to Prometheus for native integration and bigger adoption. Robert (Grafana Labs), with the help of Srikrishna (Red Hat) and the community, ported the code to the Prometheus codebase, which was merged to main 2 weeks ago!

The donation process was quite smooth. Since some Prometheus maintainers contributed to this code before within the Grafana Agent, and since the new WAL is inspired by Prometheus’ own WAL, it was not hard for the current Prometheus TSDB maintainers to take it under full maintenance! It also really helps that Robert is joining the Prometheus Team as a TSDB maintainer (congratulations!).

Now, let’s explain how you can use it! (:

How to Use Agent Mode in Detail

From now on, if you show the help output of Prometheus (--help flag), you should see more or less the following:

usage: prometheus [<flags>]

The Prometheus monitoring server

Flags:
  -h, --help                     Show context-sensitive help (also try --help-long and --help-man).
      (... other flags)
      --storage.tsdb.path="data/"
                                 Base path for metrics storage. Use with server mode only.
      --storage.agent.path="data-agent/"
                                 Base path for metrics storage. Use with agent mode only.
      (... other flags)
      --enable-feature= ...      Comma separated feature names to enable. Valid options: agent, exemplar-storage, expand-external-labels, memory-snapshot-on-shutdown, promql-at-modifier, promql-negative-offset, remote-write-receiver,
                                 extra-scrape-metrics, new-service-discovery-manager. See https://prometheus.io/docs/prometheus/latest/feature_flags/ for more details.

Since the Agent mode is behind a feature flag, as mentioned previously, use the --enable-feature=agent flag to run Prometheus in the Agent mode. Now, the rest of the flags are either for both server and Agent or only for a specific mode. You can see which flag is for which mode by checking the last sentence of a flag’s help string. “Use with server mode only” means it’s only for server mode. If you don’t see any mention like this, it means the flag is shared.

The Agent mode accepts the same scrape configuration with the same discovery options and remote write options.

It also exposes a web UI with disabled query capabitilies, but showing build info, configuration, targets and service discovery information as in a normal Prometheus server.

Hands-on Prometheus Agent Example: Katacoda Tutorial

Similarly to Prometheus remote-write tutorial, if you would like to try the hands-on experience of Prometheus Agent capabilities, we recommend the Thanos Katacoda tutorial of Prometheus Agent, which explains how easy it is to run Prometheus Agent.

Summary

I hope you found this interesting! In this post, we walked through the new cases that emerged like:

  • edge clusters
  • limited access networks
  • large number of clusters
  • ephemeral and dynamic clusters

We then explained the new Prometheus Agent mode that allows efficiently forwarding scraped metrics to the remote write endpoints.

As always, if you have any issues or feedback, feel free to submit a ticket on GitHub or ask questions on the mailing list.

This blog post is part of a coordinated release between CNCF, Grafana, and Prometheus. Feel free to also read the CNCF announcement and the angle on the Grafana Agent which underlies the Prometheus Agent.

Book Sale: Click Here to Kill Everybody and Data and Goliath

Post Syndicated from Bruce Schneier original https://www.schneier.com/blog/archives/2021/11/book-sale-click-here-to-kill-everybody-and-data-and-goliath.html

For a limited time, I am selling signed copies of Click Here to Kill Everybody and Data and Goliath, both in paperback, for just $6 each plus shipping.

I have 500 copies of each book available. When they’re gone, the sale is over and the price will revert to normal.

Order here and here.

Please be patient on delivery. It’s a lot of work to sign and mail hundreds of books. And the pandemic is causing mail slowdowns all over the world. I’ll send them out as quickly as I can, but I can’t guarantee any particular delivery date. Also, signed but not personalized books will arrive faster.

EDITED TO ADD (11/17): I am sold out. The sale is over.

Git 2.34.0 released

Post Syndicated from original https://lwn.net/Articles/876154/rss

Version 2.34.0 of the Git source-code management system is out.
“It is comprised of 834 non-merge commits since
v2.33.0, contributed by 109 people, 29 of which are new faces
“. See
this
GitHub blog post
for a look at some of the more significant changes in
this release:

ort does just that: it’s a full-blown rewrite of the merge strategy
that aims to emulate the same concepts behind recursive while
avoiding many of its long-standing performance and correctness
problems. In a merge containing many renames, ort outperforms
recursive by 500x. For a series of similar merges (like in a rebase
operation), the speedup is over 9000x since ort can cache and reuse
results from previous merges.

The collective thoughts of the interwebz