Apply CI/CD DevOps principles to Amazon Redshift development

Post Syndicated from Ashok Srirama original https://aws.amazon.com/blogs/big-data/apply-ci-cd-devops-principles-to-amazon-redshift-development/

CI/CD in the context of application development is a well-understood topic, and developers can choose from numerous patterns and tools to build their pipelines to handle the build, test, and deploy cycle when a new commit gets into version control. For stored procedures or even schema changes that are directly related to the application, this is typically part of the code base and is included in the code repository of the application. These changes are then applied when the application gets deployed to the test or prod environment.

This post demonstrates how you can apply the same set of approaches to stored procedures, and even schema changes to data warehouses like Amazon Redshift.

Stored procedures are considered code and as such should undergo the same rigor as application code. This means that the pipeline should involve running tests against changes to make sure that no regressions are introduced to the production environment. Because we automate the deployment of both stored procedures and schema changes, this significantly reduces inconsistencies in between environments.

Solution overview

The following diagram illustrates our solution architecture. We use AWS CodeCommit to store our code, AWS CodeBuild to run the build process and test environment, and AWS CodePipeline to orchestrate the overall deployment, from source, to test, to production.

Database migrations and tests also require connection information to the relevant Amazon Redshift cluster; we demonstrate how to integrate this securely using AWS Secrets Manager.

We discuss each service component in more detail later in the post.

You can see how all these components work together by completing the following steps:

  1. Clone the GitHub repo.
  2. Deploy the AWS CloudFormation template.
  3. Push code to the CodeCommit repository.
  4. Run the CI/CD pipeline.

Clone the GitHub repository

The CloudFormation template and the source code for the example application are available in the GitHub repo. Before you get started, you need to clone the repository using the following command:

git clone https://github.com/aws-samples/amazon-redshift-devops-blog

This creates a new folder, amazon-redshift-devops-blog, with the files inside.

Deploy the CloudFormation template

The CloudFormation stack creates the VPC, Amazon Redshift clusters, CodeCommit repository, CodeBuild projects for both test and prod, and the pipeline using CodePipeline to orchestrate the change release process.

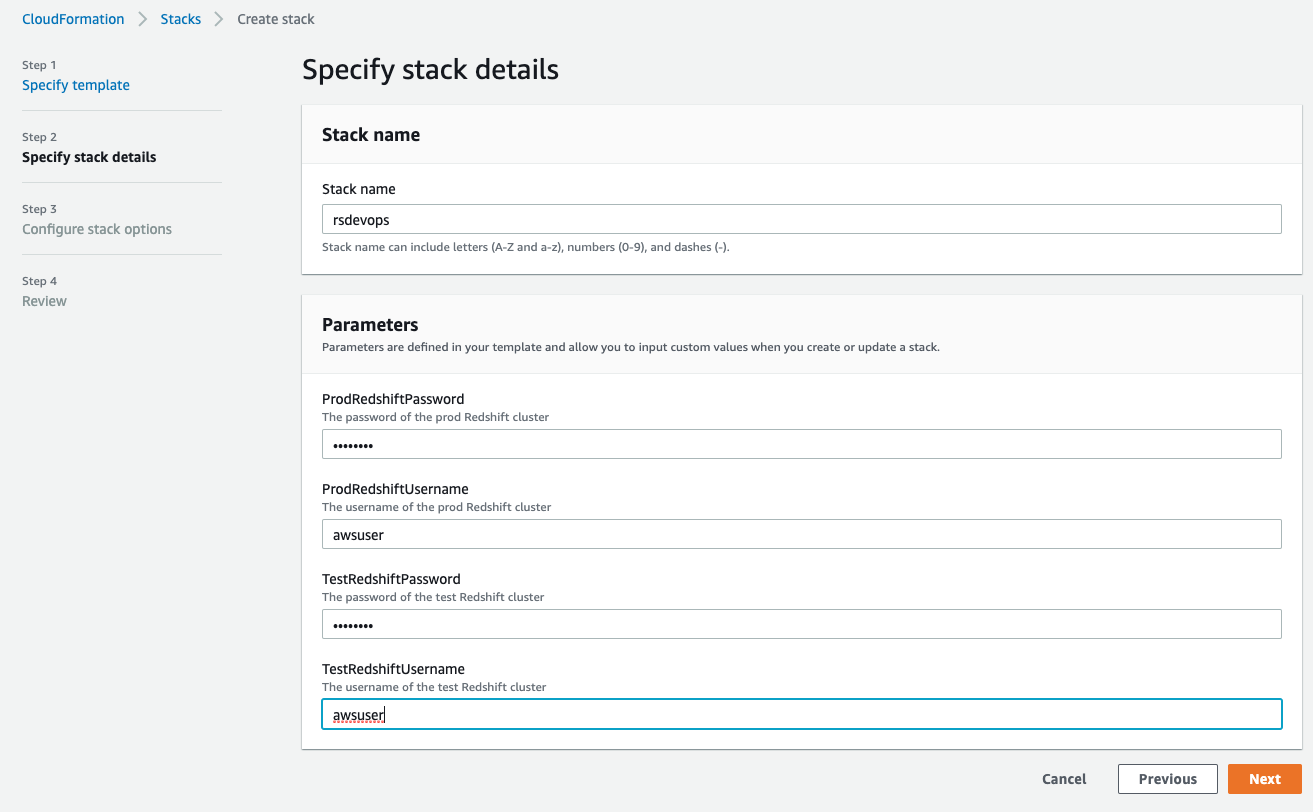
  1. On the AWS CloudFormation console, choose Create stack.
  2. Choose With new resources (standard).
  3. Select Upload a template file.
  4. Choose Choose file and locate the template file (<cloned_directory>/cloudformation_template.yml).
  5. Choose Next.
  6. For Stack name, enter a name.
  7. In the Parameters section, provide the primary user name and password for both the test and prod Amazon Redshift clusters.

The username must be 1–128 alphanumeric characters, and it can’t be a reserved word.

The password has the following criteria:

  • Must be 8-64 characters
  • Must contain at least one uppercase letter
  • Must contain at least one lowercase letter
  • Must contain at least one number
  • Can only contain ASCII characters (ASCII codes 33–126), except ‘ (single quotation mark), ” (double quotation mark), /, \, or @

Please note that production credentials could be created separately by privileged admins, and you could pass in the ARN of a pre-existing secret instead of the actual password if you so choose.

  1. Choose Next.
  2. Leave the remaining settings at their default and choose Next.
  3. Select I acknowledge that AWS CloudFormation might create IAM resources.
  4. Choose Create stack.

You can choose the refresh icon on the stack’s Events page to track the progress of the stack creation.

Push code to the CodeCommit repository

When stack creation is complete, go to the CodeCommit console. Locate the redshift-devops-repo repository that the stack created. Choose the repository to view its details.
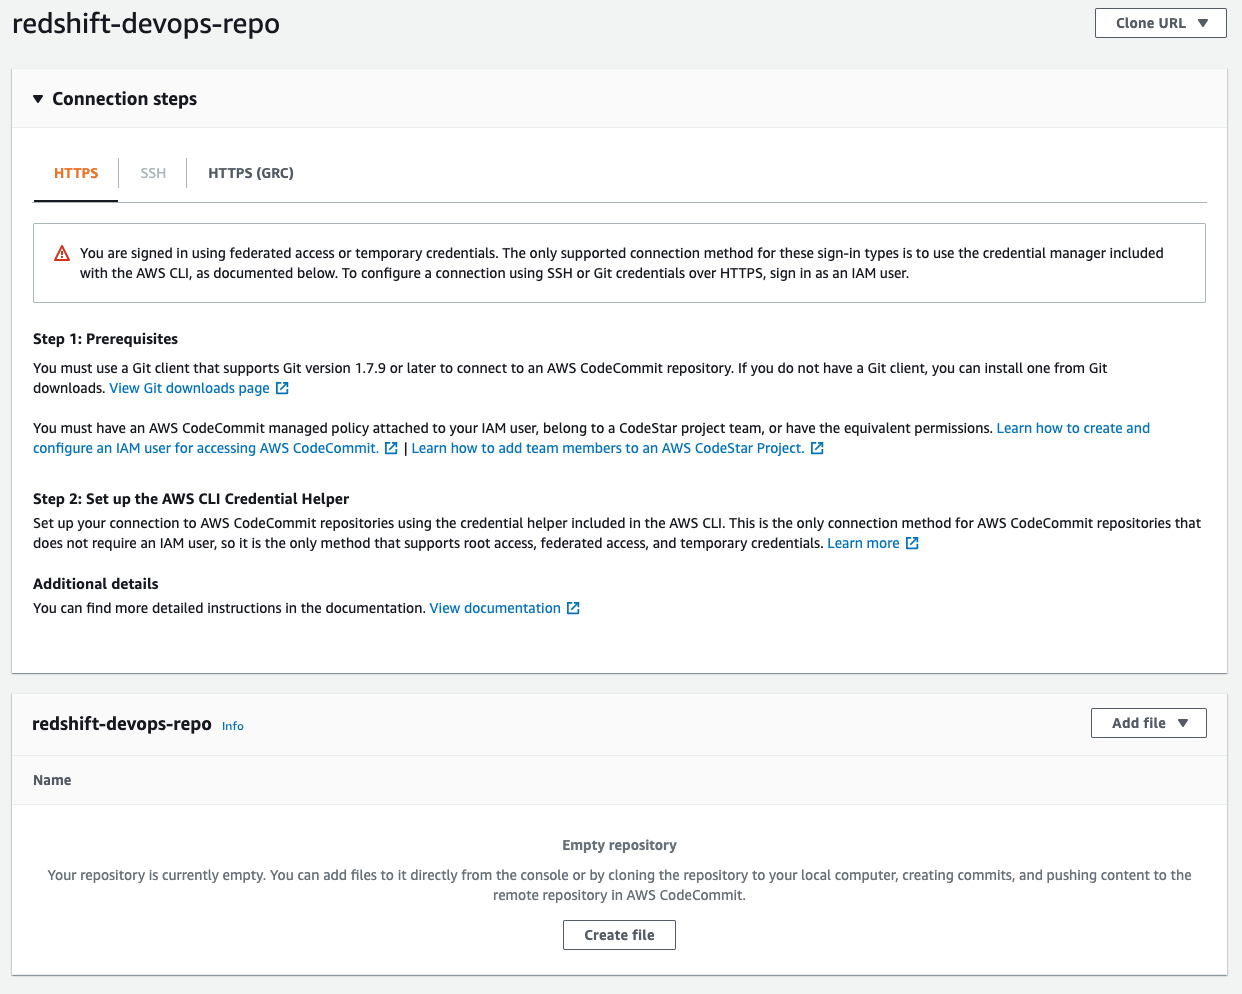
Before you can push any code into this repo, you have to set up your Git credentials using instructions here Setup for HTTPS users using Git credentials. At Step 4 of the Setup for HTTPS users using Git credentials, copy the HTTPS URL, and instead of cloning, add the CodeCommit repo URL into the code that we cloned earlier:

git remote add codecommit <repo_https_url> 
git push codecommit main

The last step populates the repository; you can check it by refreshing the CodeCommit console. If you get prompted for a user name and password, enter the Git credentials that you generated and downloaded from Step 3 of the Setup for HTTPS users using Git credentials

Run the CI/CD pipeline

After you push the code to the CodeCommit repository, this triggers the pipeline to deploy the code into both the test and prod Amazon Redshift clusters. You can monitor the progress on the CodePipeline console.

To dive deeper into the progress of the build, choose Details.

You’re redirected to the CodeBuild console, where you can see the run logs as well as the result of the test.

Components and dependencies

Although from a high-level perspective the test and prod environment look the same, there are some nuances with regards to how these environments are configured. Before diving deeper into the code, let’s look at the components first:

  • CodeCommit – This is the version control system where you store your code.
  • CodeBuild – This service runs the build process and test using Maven.
    • Build – During the build process, Maven uses FlyWay to connect to Amazon Redshift to determine the current version of the schema and what needs to be run to bring it up to the latest version.
    • Test – In the test environment, Maven runs JUnit tests against the test Amazon Redshift cluster. These tests may involve loading data and testing the behavior of the stored procedures. The results of the unit tests are published into the CodeBuild test reports.
  • Secrets Manager – We use Secrets Manager to securely store connection information to the various Amazon Redshift clusters. This includes host name, port, user name, password, and database name. CodeBuild refers to Secrets Manager for the relevant connection information when a build gets triggered. The underlying CodeBuild service role needs to have the corresponding permission to access the relevant secrets.
  • CodePipeline – CodePipeline is responsible for the overall orchestration from source to test to production.

As referenced in the components, we also use some additional dependencies at the code level:

  • Flyway – This framework is responsible for keeping different Amazon Redshift clusters in different environments in sync as far as schema and stored procedures are concerned.
  • JUnit – Unit testing framework written in Java.
  • Apache Maven – A dependency management and build tool. Maven is where we integrate Flyway and JUnit.

In the following sections, we dive deeper into how these dependencies are integrated.

Apache Maven

For Maven, the configuration file is pom.xml. For an example, you can check out the pom file from our demo app. The pertinent part of the xml is the build section:

<build>
        <plugins>
            <plugin>
                <groupId>org.flywaydb</groupId>
                <artifactId>flyway-maven-plugin</artifactId>
                <version>${flyway.version}</version>
                <executions>
                    <execution>
                        <phase>process-resources</phase>
                        <goals>
                            <goal>migrate</goal>
                        </goals>
                    </execution>
                </executions>
            </plugin>
            <plugin>
                <groupId>org.apache.maven.plugins</groupId>
                <artifactId>maven-surefire-plugin</artifactId>
                <version>${surefire.version}</version>
            </plugin>
        </plugins>
    </build>

This section describes two things:

  • By default, the Surefire plugin triggers during the test phase of Maven. The plugin runs the unit tests and generates reports based on the results of those tests. These reports are stored in the target/surefire-reports folder. We reference this folder in the CodeBuild section.
  • Flyway is triggered during the process-resources phase of Maven, and it triggers the migrate goal of Flyway. Looking at Maven’s lifecycle, this phase is always triggered first and deploys the latest version of stored procedures and schemas to the test environment before running test cases.

Flyway

Changes to the database are called migrations, and these can be either versioned or repeatable. Developers can define which type of migration by the naming convention used by Flyway to determine which one is which. The following diagram illustrates the naming convention.

A versioned migration consists of the regular SQL script that is run and an optional undo SQL script to reverse the specific version. You have to create this undo script in order to enable the undo functionality for a specific version. For example, a regular SQL script consists of creating a new table, and the corresponding undo script consists of dropping that table. Flyway is responsible for keeping track of which version a database is currently at, and runs N number of migrations depending on how far back the target database is compared to the latest version. Versioned migrations are the most common use of Flyway and are primarily used to maintain table schema and keep reference or lookup tables up to date by running data loads or updates via SQL statements. Versioned migrations are applied in order exactly one time.

Repeatable migrations don’t have a version; instead they’re rerun every time their checksum changes. They’re useful for maintaining user-defined functions and stored procedures. Instead of having multiple files to track changes over time, we can just use a single file and Flyway keeps track of when to rerun the statement to keep the target database up to date.

By default, these migration files are located in the classpath under db/migration, the full path being src/main/resources/db/migration. For our example application, you can find the source code on GitHub.

JUnit

When Flyway finishes running the migrations, the test cases are run. These test cases are under the folder src/test/java. You can find examples on GitHub that run a stored procedure via JDBC and validate the output or the impact.

Another aspect of unit testing to consider is how the test data is loaded and maintained in the test Amazon Redshift cluster. There are a couple of approaches to consider:

  • As per our example, we’re packaging the test data as part of our version control and loading the data when the first unit test is run. The advantage of this approach is that you get flexibility of when and where you run the test cases. You can start with either a completely empty or partially populated test cluster and you get with the right environment for the test case to run. Other advantages are that you can test data loading queries and have more granular control over the datasets that are being loaded for each test. The downside of this approach is that, depending on how big your test data is, it may add additional time for your test cases to complete.
  • Using an Amazon Redshift snapshot dedicated to the test environment is another way to manage the test data. With this approach, you have a couple more options:
    • Transient cluster – You can provision a transient Amazon Redshift cluster based on the snapshot when the CI/CD pipeline gets triggered. This cluster stops after the pipeline completes to save cost. The downside of this approach is that you have to factor in Amazon Redshift provisioning time in your end-to-end runtime.
    • Long-running cluster – Your test cases can connect to an existing cluster that is dedicated to running test cases. The test cases are responsible for making sure that data-related setup and teardown are done accordingly depending on the nature of the test that’s running. You can use @BeforeAll and @AfterAll JUnit annotations to trigger the setup and teardown, respectively.

CodeBuild

CodeBuild provides an environment where all of these dependencies run. As shown in our architecture diagram, we use CodeBuild for both test and prod. The differences are in the actual commands that run in each of those environments. These commands are stored in the buildspec.yml file. In our example, we provide a separate buildspec file for test and a different one for prod. During the creation of a CodeBuild project, we can specify which buildspec file to use.

There are a few differences between the test and prod CodeBuild project, which we discuss in the following sections.

Buildspec commands

In the test environment, we use mvn clean test and package the Surefire reports so the test results can be displayed via the CodeBuild console. While in the prod environment, we just run mvn clean process-resources. The reason for this is because in the prod environment, we only need to run the Flyway migrations, which are hooked up to the process-resources Maven lifecycle, whereas in the test environment, we not only run the Flyway migrations, but also make sure that it didn’t introduce any regressions by running test cases. These test cases might have an impact on the underlying data, which is why we don’t run it against the production Amazon Redshift cluster. If you want to run the test cases against production data, you can use an Amazon Redshift production cluster snapshot and run the test cases against that.

Secrets via Secrets Manager

Both Flyway and JUnit need information to identify and connect to Amazon Redshift. We store this information in Secrets Manager. Using Secrets Manager has several benefits:

  • Secrets are encrypted automatically
  • Access to secrets can be tightly controlled via fine-grained AWS Identity and Access Management (IAM) policies
  • All activity with secrets is recorded, which enables easy auditing and monitoring
  • You can rotate secrets securely and safely without impacting applications

For our example application, we define the secret as follows:

{
  "username": "<Redshift username>",
  "password": "<Redshift password>",
  "host": "<Redshift hostname>",
  "port": <Redshift port>,
  "dbName": "<Redshift DB Name>"
}

CodeBuild is integrated with Secrets Manager, so we define the following environment variables as part of the CodeBuild project:

  • TEST_HOST: arn:aws:secretsmanager:<region>:<AWS Account Id>:secret:<secret name>:host
  • TEST_JDBC_USER: arn:aws:secretsmanager:<region>:<AWS Account Id>:secret:<secret name>:username
  • TEST_JDBC_PASSWORD: arn:aws:secretsmanager:<region>:<AWS Account Id>:secret:<secret name>:password
  • TEST_PORT: arn:aws:secretsmanager:<region>:<AWS Account Id>:secret:<secret name>:port
  • TEST_DB_NAME: arn:aws:secretsmanager:<region>:<AWS Account Id>:secret:<secret name>:dbName
  • TEST_REDSHIFT_IAM_ROLE: <ARN of IAM role> (This can be in plaintext and should be attached to the Amazon Redshift cluster)
  • TEST_DATA_S3_BUCKET: <bucket name> (This is where the test data is staged)

CodeBuild automatically retrieves the parameters from Secrets Manager and they’re available in the application as environment variables. If you look at the buildspec_prod.yml example, we use the preceding variables to populate the Flyway environment variables and JDBC connection URL.

VPC configuration

For CodeBuild to be able to connect to Amazon Redshift, you need to configure which VPC it runs in. This includes the subnets and security group that it uses. The Amazon Redshift cluster’s security group also needs to allow access from the CodeBuild security group.

CodePipeline

To bring all these components together, we use CodePipeline to orchestrate the flow from the source code through prod deployment. CodePipeline also has additional capabilities. For example, you can add an approval step between test and prod so a release manager can review the results of the tests before releasing the changes to production.

Example scenario

You can use tests as a form of documentation of what is the expected behavior of a function. To further illustrate this point, let’s look at a simple stored procedure:

create or replace procedure merge_staged_products()
as $$
BEGIN
    update products set status='CLOSED' where product_name in (select product_name from products_staging) and status='ACTIVE';
    insert into products(product_name,price) select product_name, price from products_staging;
END;
$$ LANGUAGE plpgsql;

If you deployed the example app from the previous section, you can follow along by copying the stored procedure code and pasting it in src/main/resources/db/migration/R__MergeStagedProducts.sql. Save it and push the change to the CodeCommit repository by issuing the following commands (assuming that you’re at the top of the project folder):

git add src
git commit -m “<commit message>”
git push codecommit main

After you push the changes to the CodeCommit repository, you can follow the progress of the build and test stages on the CodePipeline console.

We implement a basic Slowly Changing Dimension Type 2 approach in which we mark old data as CLOSED and append newer versions of the data. Although the stored procedure works as is, our test has the following expectations:

  • The number of closed status in the products table needs to correspond to the number of duplicate entries in the staging table.
  • The products table has a close_date column that needs to be populated so we know when it was deprecated
  • At the end of the merge, the staging table needs to be cleared for subsequent ETL runs

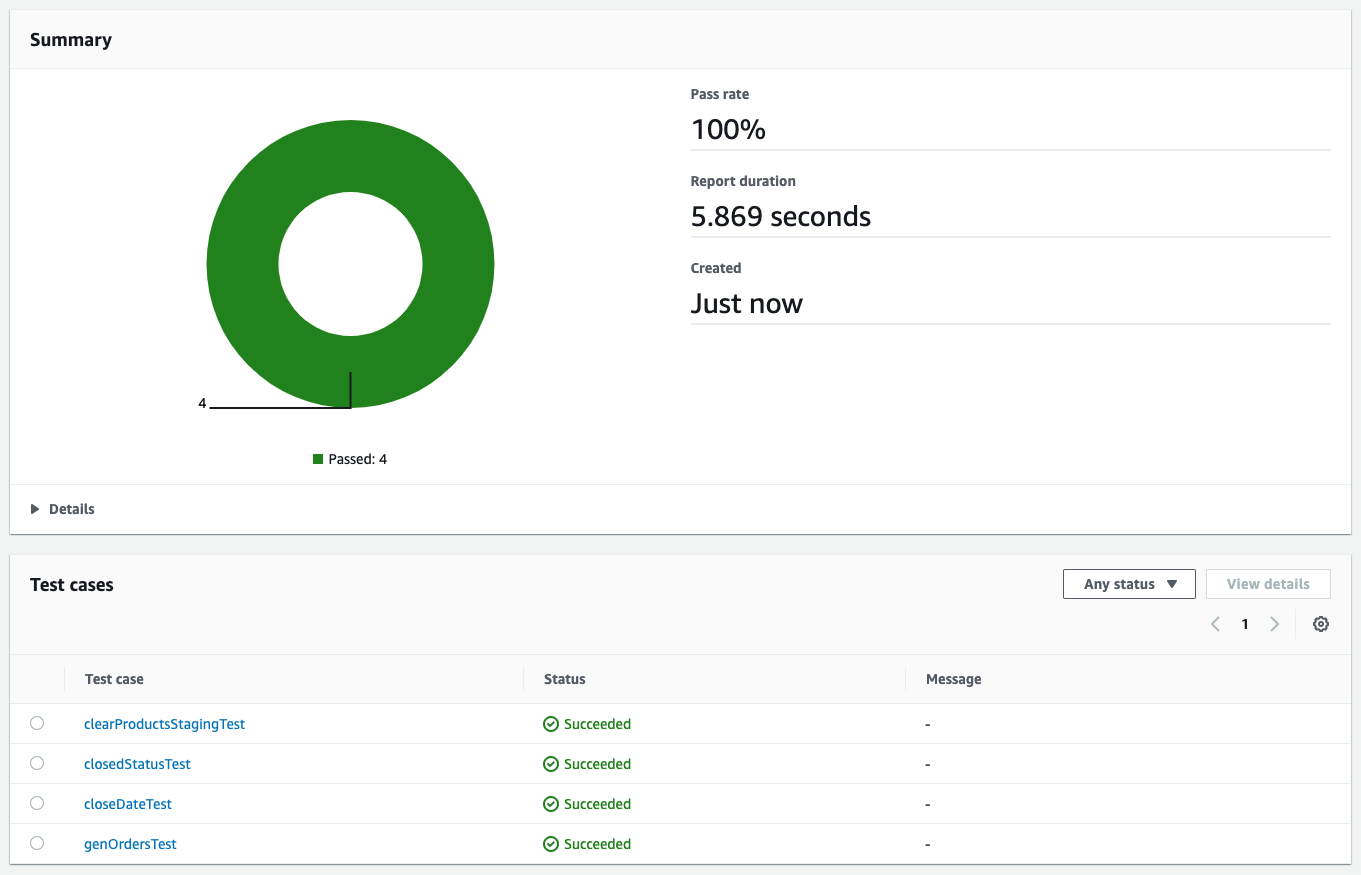
The stored procedure will pass the first test, but fail later tests. When we push this change to CodeCommit and the CI/CD process runs, we can see results like in the following screenshot.

The tests show that the second and third tests failed. Failed tests result in the pipeline stopping, which means these bad changes don’t end up in production.

We can update the stored procedure and push the change to CodeCommit to trigger the pipeline again. The updated stored procedure is as follows:

create or replace procedure merge_staged_products()
as $$
BEGIN
    update products set status='CLOSED', close_date=CURRENT_DATE where product_name in (select product_name from products_staging) and status='ACTIVE';
    insert into products(product_name,price) select product_name, price from products_staging;
    truncate products_staging;
END;
$$ LANGUAGE plpgsql; 

All the tests passed this time, which allows CodePipeline to proceed with deployment to production.
We used Flyway’s repeatable migrations to make the changes to the stored procedure. Code is stored in a single file and Flyway verifies the checksum of the file to detect any changes and reapplies the migration if the checksum is different from the one that’s already deployed.

Clean up

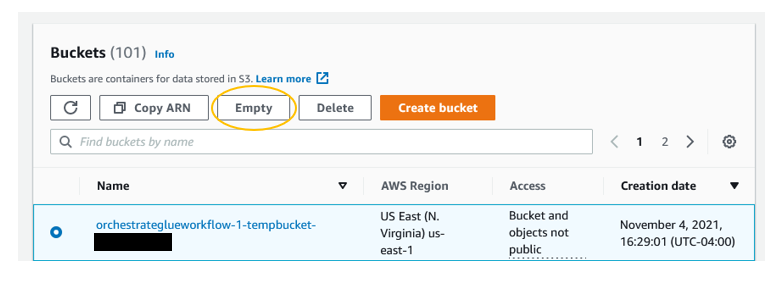
After you’re done, it’s crucial to tear down the environment to avoid incurring additional charges beyond your testing. Before you delete the CloudFormation stack, go to the Resources tab of your stack and make sure the two buckets that were provisioned are empty. If they’re not empty, delete all the contents of the buckets.

Now that the buckets are empty, you can go back to the AWS CloudFormation console and delete the stack to complete the cleanup of all the provisioned resources.

Conclusion

Using CI/CD principles in the context of Amazon Redshift stored procedures and schema changes greatly improves confidence when updates are getting deployed to production environments. Similar to CI/CD in application development, proper test coverage of stored procedures is paramount to capturing potential regressions when changes are made. This includes testing both success paths as well as all possible failure modes.

In addition, versioning migrations enables consistency across multiple environments and prevents issues arising from schema changes that aren’t applied properly. This increases confidence when changes are being made and improves development velocity as teams spend more time developing functionality rather than hunting for issues due to environment inconsistencies.

We encourage you to try building a CI/CD pipeline for Amazon Redshift using these steps described in this blog.


About the Authors

Ashok Srirama is a Senior Solutions Architect at Amazon Web Services, based in Washington Crossing, PA. He specializes in serverless applications, containers, devops, and architecting distributed systems. When he’s not spending time with his family, he enjoys watching cricket, and driving his bimmer.

Indira Balakrishnan is a Senior Solutions Architect in the AWS Analytics Specialist SA Team. She is passionate about helping customers build cloud-based analytics solutions to solve their business problems using data-driven decisions. Outside of work, she volunteers at her kids’ activities and spends time with her family.

Vaibhav Agrawal is an Analytics Specialist Solutions Architect at AWS.Throughout his career, he has focused on helping customers design and build well-architected analytics and decision support platforms.

Rajesh Francis is a Sr. Analytics Customer Experience Specialist at AWS. He specializes in Amazon Redshift and works with customers to build scalable Analytic solutions.

Jeetesh Srivastva is a Sr. Manager, Specialist Solutions Architect at AWS. He specializes in Amazon Redshift and works with customers to implement scalable solutions using Amazon Redshift and other AWS Analytic services. He has worked to deliver on-premises and cloud-based analytic solutions for customers in banking and finance and hospitality industry verticals.

Fall 2021 SOC reports now available with 141 services in scope

Post Syndicated from Ninad Naik original https://aws.amazon.com/blogs/security/fall-2021-soc-reports-now-available-with-141-services-in-scope/

At Amazon Web Services (AWS), we’re committed to providing our customers with continued assurance over the security, availability and confidentiality of the AWS control environment. We’re proud to deliver the System and Organizational (SOC) 1, 2, and 3 reports to enable our AWS customers to maintain confidence in AWS services.

For the Fall 2021 SOC reports, covering April 1, 2021, to September 30, 2021, we are excited to announce eight new services in scope, for a total of 141 total services in scope. You can see the full list on Services in Scope by Compliance Program. The associated infrastructure supporting our in-scope products and services is updated to reflect new regions, edge locations, Wavelength, and Local Zones.

Here are the eight new services in scope for Fall 2021 SOC reports:

The Fall 2021 SOC reports are now available through Artifact in the AWS Management Console. The SOC 3 report can also be downloaded here as PDF.

AWS strives to bring services into scope of its compliance programs to help you meet your architectural and regulatory needs. If there are additional AWS services you would like to see added to the scope of our SOC reports (or other compliance programs), reach out to your AWS representatives.

As always, we value your feedback and questions. Feel free to reach out to the team through the Contact Us page. If you have feedback about this post, submit comments in the Comments section below.

Want more AWS Security how-to-content, news, and feature announcements? Follow us on Twitter.


Author

Ninad Naik

Ninad is a Security Assurance Manager at Amazon Web Services. He leads multiple security and privacy initiatives within AWS. Ninad holds a Master’s degree in Information Systems from Syracuse University, NY and a Bachelor’s of Engineering degree in Information Technology from Mumbai University, India. Ninad has 11 years of experience in security assurance and ITIL, CISA, CGEIT, and CISM certifications.

Author

Lu Yu

Lu is a Compliance Program Manager at Amazon Web Services. She leads multiple security and privacy initiatives within AWS. Lu holds a Master’s degree in Accounting and dual Bachelor’s degrees in Accounting and Management Information System from University of Minnesota, Twin Cities. Lu has AWS Cloud Practitioner and CPA certifications and 8 years of experience in security assurance.

Author

Nimesh Ravasa

Nimesh is a Compliance Program Manager at Amazon Web Services. He leads multiple security and privacy initiatives within AWS. Nimesh has 14 years of experience in information security and holds CISSP, CISA, PMP, CSX, AWS Solution Architect – Associate, and AWS Security Specialty certifications.

Monitoring delay of AWS Batch jobs in transit before execution

Post Syndicated from Emma White original https://aws.amazon.com/blogs/compute/monitoring-delay-of-aws-batch-jobs-in-transit-before-execution/

This post is written by Nikhil Anand, Solutions Architect 

AWS Batch enables developers, scientists, and engineers to easily and efficiently run hundreds of thousands of batch processing jobs on AWS. With AWS Batch you no longer have to install and manage batch computing software or server clusters used to run your jobs. This lets you focus on analyzing results and solving problems, not managing infrastructure. When you use AWS Batch, in the job lifetime, a job goes through several states. When creating a compute environment to run the Batch jobs and submit Batch jobs, a settings misconfiguration could cause the job to get stuck in a transit state. This means the job will not proceed to the desired RUNNING state – a common issue faced by most customers.

If your compute environment contains compute resources, but your jobs don’t progress beyond the RUNNABLE state, then something is preventing the jobs from being placed on a compute resource. There are various reasons why a job could remain in the RUNNABLE state. The usual call to action is referring the troubleshooting documentation in order to fix the issue. Similarly, if your job is dependent on another job, then the job would stay in the PENDING state.

However, if you have scheduled actions to be completed with Batch jobs, or if you do not have any mechanism monitoring the jobs, then your jobs might stay in any of the transit states if left unattended. You may end up continuing forward, unaware that your job has yet to run. Eventually, when you see the jobs not progressing beyond the RUNNABLE or PENDING state, you miss the task that the job was expected to do in the given timeframe. This can result in additional time and effort troubleshooting the stuck job.

To prevent this accidental avoidance or lack of in-transit job monitoring, this post provides a monitoring solution for jobs in transit (from the SUBMITTED to the RUNNING state) in AWS Batch.

You can configure a threshold monitoring duration for your jobs so that if a job stays in SUBMITTED/PENDING/RUNNABLE longer than that, then you get a notification. For example, you might have a job that you would want to proceed to the RUNNING state in approximately 15 minutes since the job submission. Sometimes a slight misconfiguration can cause the job to get stuck in RUNNABLE indefinitely. In that case, you can set a threshold of 15 minutes. Or, suppose you have a job that is dependent on the other job that is stuck in processing. In these situations, once the specified duration is crossed, you are notified about your job staying in transit beyond your defined threshold status.

The solution is deployed by using AWS CloudFormation.

Overview of solution

The solution creates an Amazon CloudWatch Events rule that triggers an AWS Lambda function on a schedule. Then, the Lambda function checks every job in transit for more than ‘X’ seconds on all compute environments since the job submission. Specify your own value for ‘X’ when you launch the AWS CloudFormation stack. The solution consists of the following components created via CloudFormation:

  • An Amazon CloudWatch event rule to monitor the submitted jobs in Batch using the target Lambda function
  • An AWS Lambda function with the logic to monitor the submitted jobs and trigger Amazon Simple Notification Service (Amazon SNS) notifications
  • A Lambda execution AWS Identity and Access Management (IAM) role
  • An Amazon SNS topic to be subscribed by end users in order to be notified about the submitted jobs

The solution components and workflow.

Prerequisites

For this walkthrough, you should have the following prerequisites:

Walkthrough

To provision the necessary solution components, use this CloudFormation template. 

  1. While launching the CloudFormation stack, you will be asked to input the following information in addition to the CloudFormation stack name:
    1. The upper threshold (in seconds) for the jobs to stay in the transit state
    2. The evaluation period after which the Lambda runs periodically
    3. The email ID to get notifications after the job stays in the transit state for the defined threshold value.

pecify parameter values during CloudFormation stack launch

  1. Once the stack is created, the following resources will be provisioned – SNS topic, CloudWatch Events rule, Lambda function, Lambda invoke permissions, and Lambda execution role. View it in the ‘Resources’ tab of your CloudFormation stack.

Successful creation of the CloudFormation stack

  1. After the stack is created, the email ID you entered in step III above will receive an email from Amazon SNS in order to confirm the Amazon SNS subscription.

Subscription confirmation email that you receive on the specified email ID.

Click Confirm subscription in the email.

Subscription confirmed.

  1. Based on the customer’s inputs during stack launch, a Lambda function will be periodically invoked to look out for Batch jobs stuck in the RUNNABLE state for the defined threshold.
  2. An Amazon SNS notification is sent out at the evaluation periods with the job IDs of the jobs that have stayed stuck in the RUNNABLE state.

Verifying the solution

Launch your monitoring solution by using the CloudFormation template. Once the stack creation is complete, I get an email to subscribe to the SNS topic. Then, I subscribe to the SNS topic.

Click to launch Stack. 

Submit a job in AWS Batch by using console, CLI, or SDK. To test the solution, submit a job, Job1, to a job queue associated with a compute environment with no public subnets. Compute resources require access in order to communicate with the Amazon ECS service endpoint. This can be done through an interface VPC endpoint or your compute resources having public IP addresses. Since the compute environment was configured to only have a private subnet, Job1 will not proceed from the RUNNABLE state. Similarly, submit another job, Job2, and during submission add a dependency of Job1 on Job2. Therefore, Job2 will not proceed from the PENDING state. Thus, creating a sample space wherein two jobs will be stuck in transit.

AWS Batch jobs submitted and in transit.

Based on the CloudFormation template inputs, you will get notified on the subscribed Email ID when the job stays in transit for more than ‘X’ seconds (the input provided during stack launch).

otification received for the jobs that stayed in transit longer than expected.

Modifications

The Lambda function uses the ListJobs API call. The maximum number of results is returned by ListJobs in paginated output. Therefore, if you are submitting many jobs, then you must modify the Lambda function to fetch more results from the initial response of the call by using the nextToken response element. Use this nextToken element and iterate through in a loop to keep fetching the paginated results until there are no further nextToken elements present.

Cleaning up

To avoid incurring future charges, delete the resources. You can delete the CloudFormation stack that will clean up every resource that it provisioned for the monitoring solution.

Conclusion

This solution lets you detect AWS Batch jobs that remain in the transit state longer than expected. It provides you with an efficient way to monitor your Batch jobs. If the jobs stay in the RUNNABLE/PENDING/SUBMITTED state for a significant amount of time, then it is indicative of potential misconfiguration with either the compute environment setup, or with the job parameters that were passed during the job submission. An early notification around the issue can help you troubleshoot the misconfigurations early on and take subsequent actions.

If you have multiple jobs that remain in the RUNNABLE state and you realize that they will not proceed further to the RUNNING state due to a misconfiguration, then you can shut down all RUNNABLE jobs by using a simple bash script.

For additional references regarding troubleshooting RUNNABLE jobs in AWS Batch, refer to the suggested Knowledge Center article and the troubleshooting documentation.

Fall 2021 SOC 2 Type I Privacy report now available

Post Syndicated from Ninad Naik original https://aws.amazon.com/blogs/security/fall-2021-soc-2-type-i-privacy-report-now-available/

 Your privacy considerations are at the core of our compliance work, and at Amazon Web Services (AWS), we are focused on the protection of your content while using AWS services. Our Fall 2021 SOC 2 Type I Privacy report is now available, demonstrating the privacy compliance commitments we made to you.

The Fall 2021 SOC 2 Type I Privacy report provides you with a third-party attestation of our system and the suitability of the design of our privacy controls. The SOC 2 Privacy Trust Service Criteria (TSC), developed by the American Institute of CPAs (AICPA) establishes the criteria for evaluating controls relating to how personal information is collected, used, retained, disclosed and disposed of to meet AWS’ objectives. You can find additional information related to privacy commitments supporting our SOC 2 Type 1 report in the AWS Customer Agreement documentation.

The scope of the privacy report includes information about how we handle the content that you upload to AWS and how it is protected in all of the services and locations that are in scope for the latest AWS SOC reports. You can find our SOC 2 Type I Privacy report through Artifact in the AWS Management Console.

As always, we value your feedback and questions. Feel free to reach out to the compliance team through the Contact Us page. If you have feedback about this post, submit comments in the Comments section below.

Want more AWS Security how-to-content, news, and feature announcements? Follow us on Twitter.

Author

Ninad Naik

Ninad is a Security Assurance Manager at Amazon Web Services. He leads multiple security and privacy initiatives within AWS. Ninad holds a Master’s degree in Information Systems from Syracuse University, NY and a Bachelor’s of Engineering degree in Information Technology from Mumbai University, India. Ninad has 11 years of experience in security assurance and ITIL, CISA, CGEIT, and CISM certifications.

Author

Lu Yu

Lu is a Compliance Program Manager at Amazon Web Services. She leads multiple security and privacy initiatives within AWS. Lu holds a Master’s degree in Accounting and dual Bachelor’s degrees in Accounting and Management Information System from University of Minnesota, Twin Cities. Lu has AWS Cloud Practitioner and CPA certifications and 8 years of experience in security assurance.

Author

Nimesh Ravasa

Nimesh is a Compliance Program Manager at Amazon Web Services. He leads multiple security and privacy initiatives within AWS. Nimesh has 14 years of experience in information security and holds CISSP, CISA, PMP, CSX, AWS Solution Architect – Associate, and AWS Security Specialty certifications.

Highlights from Git 2.34

Post Syndicated from Taylor Blau original https://github.blog/2021-11-15-highlights-from-git-2-34/

The open source Git project just released Git 2.34 with features and bug fixes from over 109 contributors, 29 of them new. We last caught up with you on the latest in Git back when 2.33 was released. To celebrate this most recent release, here’s GitHub’s look at some of the most interesting features and changes introduced since last time.

Sparse index

In the past, we’ve talked about new Git features to make it possible to work with large repositories, like partial clones and sparse-checkout. For a complete description, check out the linked blog posts. But as a refresher, these two features work together to allow you to:

  • Fetch or clone only part of a repository’s objects, and
  • Only populate part of your working copy, typically scoped to a set of
    sub-directories.

This pair of features is designed to create the illusion that you are working in a much smaller repository than you actually are. For instance, if your work takes place in an all-encompassing monorepo, your local copy only needs to contain the parts of the repository that you frequently work in.

But often, this illusion falls short. Why? The answer is the index. The index is the data structure Git uses to track what will be written the next time you run git commit, as well as to track the state of every file in your repository at the current point in history.

As you can imagine, even if you are working in a small corner of a large repository, the index still has to keep track of the repository’s entire contents, not just the parts that you are working in. Unfortunately, that overhead adds up: every time Git needs work with the index, it needs to parse and write out a lot of data that doesn’t affect the parts of your repository outside of your sparse checkout.

That’s changing in this release with the addition of a sparse-enabled index. Unlike the index of previous versions, this release enables the index to only track the parts of your repository that you care about. Specifically, it only contains entries for parts of your repository that are either in your sparse checkout, or at the boundary between your sparse checkout and the rest of the repository.

Collapsing to a sparse index

Triangles represent trees and boxes represent blobs. Left: a representation of a non-sparse index’s contents. Right: a sparse-ified index.

The high-level details here are that the index format now understands that specially marked directories indicate the boundary between the contents of your sparse checkout and the parts of your repository that you don’t have checked out. But the process of implementing this new format, teaching sub-commands how to use it, and making sure that the sparse index can be expanded to a full index is much more detailed.

For all of the details behind this exciting new feature, check out a comprehensive blog post published by Derrick Stolee last week: Making your monorepo feel small with Git’s sparse index.

[source, source, source, source, source, source, source, source]

Multi-pack reachability bitmaps

In a previous blog post, we talked about a new feature to enable reachability bitmaps to keep track of objects stored in multiple packs within your object store.

This release of Git contains the remaining components described in that blog post. If you haven’t read it, here’s a summary. When serving a fetch, a Git server needs to send the client everything reachable from the set of objects they want, less anything reachable from the set that they already have. (You can think of a clone as a “special case” fetch where the client wants everything and has nothing).

In order to compute this set efficiently, Git can use reachability bitmaps. One of these .bitmap files stores a set of bitmaps, each corresponding to some commit. The contents of an individual bitmap is a string of bits, one per object, indicating which objects are reachable from each commit.

In the past, the contents of a reachability bitmap were tied to the order of objects within a single packfile. This meant that a bitmap could only cover objects in one packfile. In other words, bitmaps were only useful if you could efficiently pack the entire contents of your repository down into a single packfile.

For many repositories, writing all objects into the same pack is completely feasible. But the effort it takes to write a pack (including searching for deltas between objects, compressing individual objects, and I/O cost) scales with the size of the pack you’re writing.

Git 2.34 introduces a new bitmap format that is instead tied to the contents of the multi-pack index file. This means that a bitmap can now flexibly represent objects in multiple packs, and server operators no longer need to repack their biggest repositories into a single pack in order to take full advantage of reachability bitmaps.

For more details, including some of the steps required to make this new feature work, see the aforementioned blog post.

[source, source, source]

A new default merge strategy

In an earlier blog post, we explained Git’s newest merge strategy: ort. Here are some of the basics:

When Git needs to merge two branches, it uses one of several “strategy” backends in order to resolve the changes or emit conflicts when two changes cannot be reconciled.

For years, Git has used a strategy called “recursive”. If you have ever done a merge in Git without passing -s <strategy>, then you have almost certainly used the recursive engine. Recursive behaves mostly like a standard three-way merge, with one exception. In the case of “criss-cross” merges (where there isn’t a single merge base), recursive merges multiple bases together in pairs (recursively) in order to produce a single tree which is then treated as the new merge base. This makes it possible to resolve cases where a traditional three-way merge might produce a conflict.

In recent versions of Git, there has been an ongoing effort to replace the recursive strategy with a new one called ort (short for “ostensibly recursive‘s twin”). Why do this? There are a few reasons, but perhaps the most compelling is that a rewrite allowed Git to implement a merge strategy that doesn’t operate on the index (that same one we talked about a couple of sections ago)!

ort does just that: it’s a full-blown rewrite of the merge strategy that aims to emulate the same concepts behind recursive while avoiding many of its long-standing performance and correctness problems. In a merge containing many renames, ort outperforms recursive by 500x. For a series of similar merges (like in a rebase operation), the speedup is over 9000x, in part due to ort’s ability to cache and reuse results from previous merges.

These numbers show off some of the worst-case scenarios for recursive, but in testing, ort consistently outperforms recursive with much less variance. In Git 2.34, ort is now the default merge strategy, so you should notice faster merges with fewer bugs just by upgrading.

For more details about the ort merge strategy, see our earlier blog post, or any one of a six-part series of posts written by ort‘s creator, Elijah Newren: part one, part two, part three, part four, part five, and part six.

[source]

Tidbits

Now that we have looked at some of the bigger features in detail, let’s turn to a handful of smaller topics from this release.

  • You might be aware that Git allows you to sign your work by attaching your PGP signature to certain objects. For example, the Git project itself publishes tags signed by the maintainer in order to verify that each release comes from someone trustworthy.

    But the experience of using GPG and maintaining keys can be somewhat
    cumbersome. One alternative is to use a new feature of OpenSSH (released
    back in OpenSSH 8.0) that allows using the SSH key you likely already have as a signing key.

    Git 2.34 includes support to take advantage of this feature and allows you to sign your work using SSH keys. To try it out, you can either set user.signingKey to the SSH key you want to use (for example, by asking your ssh-agent for a list with ssh-add -L), or set gpg.format to ssh and gpg.ssh.defaultKeyCommand to ssh-add -L in order to automatically use the first SSH key available.

    After configuring Git to sign objects using your SSH keys, you can use git
    commit -S
    , git merge -S, and git tag -s as usual, and they will automatically use your SSH key.

    For more information about the new configuration options, including information about how to verify SSH signatures with an “allowed signers” file, check out the documentation.

    [source, source, source]

  • If you’ve ever accidentally typed git psuh when you meant push, you
    might have seen this message:

    $ git psuh
    git: 'psuh' is not a git command. See 'git --help'.
    
    The most similar command is
      push
    

    You have always been able to control this behavior by setting the
    help.autoCorrect configuration. You can hide this advice by setting that
    configuration to never, or let Git automatically rerun the most similar
    command for you immediately or with a delay (by setting immediate, or a
    real number of seconds to wait before rerunning your command).

    In Git 2.34, you can now configure Git to ask you interactively whether you
    want to rerun your last operation with the suggested command by setting
    help.autoCorrect to prompt.

    [source]

In Git 2.34, a handful of patch series were focused on improving the performance of interacting with other repositories. Here’s a pair of tidbits that improves the performance of git fetch and git push:

  • When fetching from a remote, your client needs to do some bookkeeping before
    and after it receives a set of objects from the remote.

    Before anything happens, your client needs to figure out what it has in common with the remote it’s fetching from, and what commits it wants as a result. Previously, this process was somewhat wasteful: Git used to load commit objects directly when they could instead have been read from the commit-graph, resulting in much improved performance. In Git 2.34, commits loaded in this code path use the commit-graph when possible. The effect of this scales with the number of references in your repository: in an example repository with over 2 million references, it cuts the time it takes to fetch a single commit by more than half.

    [source]

  • Another patch series made a handful of improvements to updating local references when fetching, along with some changes to improve fetch negotiation, as well as skipping the connectivity check (which I’ll talk about in more detail in the next tidbit) when the receiving end had already verified the connectedness of the new objects. These changes together contributed similarly impressive performance improvements to the git fetch command.

    [source]

You might have heard of “submodules,” the Git feature that allows combining multiple repositories by storing links to other repositories. Submodules have been somewhat neglected over the years, but this release brought renewed attention to the feature. Here are just some of the changes that enhance submodules:

  • It might be a surprise to learn that, though the majority of Git is written in C, the original git submodule command is actually a shell script!

    The Git project has been converting many of its subcommands written in other languages into C. Reimplementing subcommands as C programs means that
    they can be read and written more easily, take advantage of Git’s comprehensive libraries, and avoid the overhead of spawning many processes, especially on platforms where the new process overhead is rather costly.

    In Git 2.34, many parts of the git submodule command were rewritten in C.
    This project was completed by Atharva Raykar, who is a Google Summer of Code
    student. You can check out their final report here, along with Git’s other GSoC participant ZheNing Hu’s report here.

    [source, source, source]

  • While we’re on the topic of submodules, one thing you might not know is that
    when using commands that deal with objects from both the submodule and the
    repository containing it, the submodule is temporarily added as an alternate
    object store of the other repository!

    Alternates are Git’s object borrowing mechanism, which allow you to in effect link multiple object stores together. When using a repository with alternates, any object lookups that fail to find an object are retried in that repository’s alternate.

    In order to make both the objects in a submodule and the objects in the repository that contains that submodule available to git grep (among a select set of
    other commands), the submodule would temporarily be added as an alternate for the duration of that command.

    If you’re thinking to yourself, “this is a hack”, then you’re not alone. Git has made internal changes to parameterize many functions in terms of a repository (which is usually the global the_repository). This allowed Git to avoid combining multiple repositories via alternates and instead make function calls by passing two (or more) separate repository instances. This enables Git to avoid hackily relying on the alternates mechanism, which produced less confusing and error-prone code as a result.

    [source, source, source]

  • One last submodule-related topic (though there are more we couldn’t fit here!). If you are cloning a repository that you know to contain submodules, it is often useful to pass the --recurse-submodules, which will cause that repository’s submodules to be cloned and initialized, too.

    But other commands that can optionally recurse into submodules (like git diff, for example) don’t themselves recurse into submodules by default, even when you cloned with --recurse-submodules. In Git 2.34, this is no longer the case, with one caveat: when cloning with --recurse-submodules, other commands only recurse into submodules if the submodule.stickyRecursiveClone configuration is set, to prevent commands from unintentionally running in submodules.

    [source]

Now that I’ve listed out a few of the submodule-related changes, let’s get back
to the rest of the tidbits:

  • If you’ve ever scripted around Git, you have almost certainly run into Git’s cat-file plumbing command. This tool can be used to print out a single object (by providing the object name as an argument), a stream of objects (by providing line-delimited object names over stdin), or all objects in your repository (with --batch-all-objects).

    This low-level command accidentally took into account replace refs, which produced confusing results when combined with --batch-all-objects, resulting in it not actually showing all objects in your repository if some were hidden by refs/replace.

    Dropping support for replacement refs made it possible for cat-file to reuse some information when it is given --batch-all-objects. Namely, to populate the list of objects, it iterates each object in each pack and therefore knows the byte offset within each pack where each object can be found. Previous versions of Git did not reuse this information when looking up objects to parse them, but Git 2.34 retains this information.

    This makes it possible to process an object’s metadata much more quickly by avoiding having to locate it twice. In a copy of torvalds/linux, the time it takes to print the name and type of each object (for the curious, that’s git cat-file --batch-check='%(objectname) %(objecttype)' --batch-all-objects --unordered) dropped from 8.1 seconds to just 4.3 seconds.

    [source]

  • There has been a recent concerted effort to remove some memory leaks from Git’s code. Unlike library code, Git typically has a very short runtime. This makes the need to free allocated memory much less urgent, since if a process is about to exit, all memory allocated to it will be “freed” by the operating system.

    A recent patch has made it so that Git’s integration tests can be run in a mode that ensures no memory is leaked (by setting GIT_TEST_PASSING_SANITIZE_LEAK=true in the environment). Since Git’s test suite still contains memory leaks in some tests, a new mode was added to run only tests that have been specifically marked as being leak-free. That way, when Git is compiled with leak detection (by running make SANITIZE=leak), you can easily spot regressions in tests that were supposedly leak-free.

    Building off this new infrastructure, there have been many patch series that remove leaks from the code in various places.

    [source, source, source, source, source, source, source, source, source, source, source]

  • When you need to get some debugging information out of a Git process, like what version you’re running, or how much time it spent in a particular region, the trace2 mechanism is a good choice. Often, looking at these logs is like looking at a piece of a puzzle. For example, when you run git fetch, you actually run git fetch-pack, which then invokes git upload-pack on the remote, which itself invokes git pack-objects.

    Trace2 output includes information about when child processes are started and stopped (and consequently, how long they took to run), but what if you’re trying to figure out something more basic than that, like what process you were started by? In other words, if you’re stuck looking at output from a slow git pack-objects, how do you figure out whether it was a fetch (in which case it would have been started by upload-pack) or part of a repository repack (which here would be started by git repack)?

    Git 2.34 includes additional debugging information in trace2 output to indicate the full ancestry of a process, so you can easily read out the name of the program a process was started by, like so:

    $ cat trace2.log
    21:14:38.170730 common-main.c:48                  version 2.34.0.rc1.14.g88d915a634
    21:14:38.170810 common-main.c:49                  start /home/ttaylorr/src/git/git pack-objects git pack-objects --revs --thin --stdout --progress --delta-base-offset
    21:14:38.174325 compat/linux/procinfo.c:170       cmd_ancestry sh <- git-upload-pack <- sh <- git <- zsh <- sshd <- systemd
    

    (Above, you can see that pack-objects was run by git upload-pack, which was run by sh–that’s where we inserted the trace point via uploadpack.packObjectsHook, which was run by git, in my shell, over sshd, which was started by systemd.)

    [source, source]

  • In a previous post, we talked about the background maintenance daemon, which can be used to perform routine repository maintenance in the background (like pre-fetching, or repacking the objects in your repository).

    When this feature was first released back in Git 2.31, it had support for cron on Linux, launchctl on macOS, and schtasks on Windows. Git 2.34 brings support for systemd-based timers on Linux. This has a few benefits over cron: cron may not be available everywhere, and using systemd isolates each service into its own cgroup and writes its logs separately.

    If you want to use systemd instead of the default scheduler, you can run:

    $ git maintenance start --scheduler=systemd
    

    [source]

  • In a previous blog post, we talked about how git rebase works, and how to move a complicated branching structure elsewhere in your repository’s history.

    The brief history is that this used to be done with the --preserve-merges option, which attempted to replay merges elsewhere in history. Confusingly, this mode uses rebase’s interactive machinery internally, so attempting to manually edit the rebase sequence (with git rebase -i) often produced counterintuitive results.

    The --rebase-merges option fixed many of these issues and has been the recommended replacement of --preserve-merges for some time now. In Git 2.34, the --preserve-merges option is now gone for good.

    [source]

  • You might have used git grep to quickly search through your code. But you might not have known that git log has a --grep=<expression> option, which allows you to filter through commits produced by git log to only show ones whose commit messages match the provided expression.

    In previous versions, the --grep option only filtered down which results were presented in the output of git log. But in Git 2.34, git log now knows how to colorize the parts of its output that matched the provided expression, like so:

    [source]

  • Last but not least, if you’re using Git in a terminal on Windows, you might have noticed that your terminal is left in a weird state after running git commit, or git rebase, like in this issue.

    This was because Git shares its terminal with any child processes it spawns, including your $EDITOR. If your editor sets special terminal settings but does not clear them upon exiting, it can leave your terminal in a broken state.

    Git 2.34 introduces functionality to save and restore the terminal settings before and after launching your editor. That means that even misbehaving editors cannot corrupt your terminal since it will always be restored to the state it was in before launching the editor.

    [source]

The rest of the iceberg

That’s just a sample of changes from the latest release. For more, check out the release notes for 2.34, or any previous version in the Git repository.

Thawing Out the Chilling Effect Of DMCA Section 1201

Post Syndicated from Harley Geiger original https://blog.rapid7.com/2021/11/15/thawing-out-the-chilling-effect-of-dmca-section-1201/

Thawing Out the Chilling Effect Of DMCA Section 1201

The Copyright Office has issued the latest rules on exemptions to Section 1201 of the Digital Millennium Copyright Act (DMCA). Great news: Legal protections for independent security research have once again been meaningfully strengthened. On the whole, these protections are now significantly greater than they were just a few years ago.

Some quick background: DMCA Section 1201 restricts security research on software without authorization of the owner of the copyright of the software, even for software on devices the researcher owns. This has long been criticized as having an adverse chilling effect on legitimate security research that would otherwise benefit consumers. However, the Librarian of Congress (acting through the Copyright Office) can establish exceptions to DMCA Section 1201, which must be renewed every three years. A three-year cycle has just concluded, with the Copyright Office issuing an updated exception for security research.

[For additional background information on why DMCA is important for security research, please see this earlier post.]

Most recent change: “All other laws” requirement removed

Prior to this most recent update, the security researcher exception provided legal protection from Section 1201 only if the researcher was compliant with every other law or regulation in the world, no matter how obscure. If that sounds ridiculous and burdensome, that’s because it is.

We made this “obey all other laws” issue the focus of our advocacy on Section 1201 throughout 2020 and 2021. As we argued extensively before the Copyright Office, the “all other laws” limitation meant security researchers could lose liability protection under Section 1201 for inadvertently violating laws with significant gray area (like CFAA), minor laws unrelated to security (like the electrical code), or sweepingly restrictive foreign laws (such as China’s rules on vulnerability disclosure).

Rapid7 proposed specific language to address this problem. And thankfully, the Department of Justice (DOJ) formally weighed in with the Copyright Office and supported our proposed language. Without the DOJ’s action to support good-faith security researchers, this effort would likely not have succeeded. Then the Dept. of Commerce joined in support of the language as well.

In October 2021, the Copyright Office handed down an updated exception for security research that adopted our proposed language and removed the “all other laws” requirement. This effectively killed the most harmful aspect of the previous rule, representing major progress in legal protection for security researchers under DMCA Section 1201. The DOJ, NTIA, and Copyright Office were united in expanding  protection — a sign of the growing consensus on the importance of this activity.

The change to the language essentially turns the requirement of compliance with all other laws into a helpful reminder that other laws may still apply. The language looks like this:

Striking:  “and does not violate any applicable law, including without limitation the Computer Fraud and Abuse Act of 1986, as amended and codified in title 18, United States Code.”

Inserting: Good-faith security research that qualifies for the exemption under paragraph (b)(16)(i) of this section may nevertheless incur liability under other applicable laws, including without limitation the Computer Fraud and Abuse Act of 1986, as amended and codified in title 18, United States Code, and eligibility for that exemption is not a safe harbor from, or defense to, liability under other applicable laws.”

Long-haul advocacy

Many hands — too many to adequately thank here — worked tirelessly to ensure security researchers were protected from DMCA Section 1201. It has truly been a community effort.

For our part, Rapid7 has been engaged in advocacy to protect security research under DMCA Section 1201 for the better part of a decade. Testimony from Rapid7 researchers helped establish the first security research exemption in 2015. But this 2015 exemption was limited, and in 2016 we repeatedly pressed the Copyright Office to support expanded protections and reform the rulemaking process, and the Copyright Office implemented many of our recommendations. During the Copyright Office’s 2018 exemption cycle, we argued against holding security researchers liable for what third parties do with research results, to which the Copyright Office agreed. And now, in 2021, we worked with DOJ to convince the Copyright Office to remove the “any other law” restriction.

Taken together, this is a lot of progress. Rapid7 has put real time and effort into living up to its values in support of independent cybersecurity research, and it has borne fruit.

Though improved, Section 1201 remains flawed

These gains are significant and welcome. Still, it is astonishing just how much time and effort were required to wade through the sea of FUD and bureaucracy to achieve this progress. It is a testament to the danger of regulatory inertia.

And there is still more to be done on DMCA. While the security researcher protections are now greatly strengthened under DMCA Section 1201, which helps address its chilling effect on research, the law still has many flaws. As Rapid7 has noted, DMCA Section 1201 continues to be a legal risk for the use of security tools — something the researcher exemption does not address. And outside of security, DMCA continues to affect the right to repair, accessibility for the disabled, education, and much more. This is a law in acute need of a ruthless overhaul.

As far as US computer crime laws go, DMCA Section 1201 is surely among the most unsound and anachronistic. If DMCA Section 1201 were introduced in Congress today, it would be derided as toxic and never advance far enough to receive a vote. DMCA Section 1201’s most beneficial use now is as a smoldering example of how a sweeping restriction on widely used technology can become an absurd burden as technology matures. Other than that, the law is at best a waste of everyone’s time, and we should celebrate its erosion even as we lament that this erosion is gradual.

Our respect and gratitude go to all the advocates who spent their time and resources working with the Copyright Office to drive this progress.

New Amazon Virtual Andon 3.0 – Automate Issue Resolution via APIs and Predictive Services

Post Syndicated from Ajay Swamy original https://aws.amazon.com/blogs/architecture/new-amazon-virtual-andon-3-0-automate-issue-resolution-via-apis-and-predictive-services/

Developing a modern manufacturing enterprise requires careful thought and attention to several priorities. Predictive maintenance and issue resolution automation are likely high on your list. Maximizing your operational efficiency and optimizing output are critical in this competitive global market. As demand grows, manufacturers are under pressure to fulfill increased production needs.

A recent report from McKinsey on Industry 4.0 technologies discusses pandemic implementations such as digital issue detection and resolution. These solutions are critical for crisis response in the COVID-19 era. 30% of manufacturers have highlighted increased operational productivity, reduced time-to-market, and reduction in cost as major strategic imperatives for their Industry 4.0 transformation.

Amazon Virtual Andon 3.0 (AVA) is an Amazon Web Services (AWS) Solution that provides a scalable, digital Andon system to help detect and resolve issues. It optimizes processes, supports your transition to predictive maintenance, and helps prevent future equipment failures.

Overview of new features

AVA provides factory and fulfillment center associates with an intuitive, responsive web interface and workflow. This can be used to raise issues, route those issues to the appropriate engineers, and resolve them in a timely way. With AVA, you can associate explanatory root causes with resolved issues for more insightful reporting. Issue raising and resolution happen digitally. There’s no need for manual intervention (such as raising a manual alarm at a factory workstation.)

AVA introduces the capability to raise issues directly from devices and automated APIs. Flexible integrations can be made directly with your factory devices and systems. Additionally, the APIs integrate with Amazon Machine Learning (ML) services, such as Amazon Lookout for Equipment and Amazon Lookout for Vision. This enables you to automate ML inference into your AVA-based workflows.

With AVA 3.0, you can now monitor your factory floors for disruptions in near-real-time. You can respond and resolve issues quickly, minimizing production disruption. AVA 3.0 provides users with an analytics pipeline so you can create dashboards and custom reports.

Introducing GraphQL APIs

The solution introduces GraphQL APIs via AWS AppSync, secured through AWS Identity and Access Management (IAM) policies. This powers the web interface and functionality to create, route, and manage issues. With AVA GraphQL APIs, you can create and manage site hierarchies, devices, events, and raise and manage issues. For example, you can create an issue by calling the createIssue API to raise issues and track them to completion automatically.

createIssue
{
    id: "<string>",
    siteName: "<string>",
    areaName: "<string>",
    stationName: "<string>",
    deviceName: "<string>",
    processName: "<string>",
    eventId: "<string>",
    eventDescription: "<string>",
    eventType: "<string>",
    issueSource: "<string>",
    priority: "<string>",
    status: "<string>",
    created: "AWSDateTime",
    acknowledged: "AWSDateTime",
    closed: "AWSDateTime",
    acknowledgedTime: "<number>",
    resolutionTime: "<number>",
    createdBy: "<string>",
    additionalDetails: "<string>"
  }

Integration with Amazon Machine Learning services to raise issues automatically

With AVA APIs, you can integrate with predictive services like Amazon Lookout for Equipment (L4E). AVA provides an AWS Lambda function for detecting anomalies generated via L4E. It automatically calls the APIs to create issues for abnormal events.

When L4E detects anomalies in your machinery or production line, AVA can automatically raise issues for those anomalies (Figure 1). This gives you the visibility and tracking mechanism to ensure anomalies are resolved. You can create automated events and issues via APIs by integrating with Amazon Lookout for Equipment. You’re able to track anomalies with their details in near-real-time.

Figure 1. AVA displays anomalies raised from L4E. A prediction score of > 0 indicates that an anomaly has been detected, and AVA will raise an issue with the underlying sensor details.” width=”1063″ height=”611″></p>
<p id=Figure 1. AVA displays anomalies raised from L4E. A prediction score of > 0 indicates that an anomaly has been detected, and AVA will raise an issue with the underlying sensor details.

Direct device integration

AVA provides the capability to integrate with IoT devices via AWS IoT Core. You can configure your IoT devices to send data to the ava/issues AWS IoT Core topic. Additionally, AVA can send messages to the ava/devices AWS IoT Core topic to automatically raise issues via MQTT or HTTPS. It maps your machine name to an AVA device and a tag/value combination to an AVA event.

{
  "id": <ID!>,
  "eventId": String,
  "eventDescription": String,
  "type": String,
  "priority": String,
  "siteName": String,
  "processName": String,
  "areaName":" String,
  "stationName": String,
  "deviceName": String,
  "created": AWSDateTime,
  "acknowledged": AWSDateTime,
  "closed": AWSDateTime,
  "status": "open"
}

Analytics pipeline for custom dashboards

AVA uses Amazon DynamoDB to store factory configuration and issues data. All AVA data is exported from the DynamoDB database to an Amazon S3 bucket via an AWS Glue workflow. You can then use Amazon Athena to query underlying data and create custom reports using business intelligence (BI) solutions like Amazon QuickSight (Figure 2). With the analytics pipeline, you can create custom dashboards and monitor your factory operations holistically.

Figure 2. Custom dashboard generated via Amazon QuickSight

Figure 2. Custom dashboard generated via Amazon QuickSight

Architecture and workflow

Figure 3. AVA 3.0 architecture

Figure 3. AVA 3.0 architecture

The AWS CloudFormation template deploys the following infrastructure, shown in Figure 3:

  1. The AWS CloudFormation template provides an Amazon CloudFront web interface that deploys into an Amazon Simple Storage Service (Amazon S3) bucket configured for web hosting.
  2. An Amazon Cognito user pool allows this solution’s administrators to register users and groups using the web interface.
  3. AWS AppSync GraphQL APIs and AWS Amplify power the web interface. Amazon DynamoDB tables store the factory data.
  4. An AWS IoT rule engine helps you monitor manufacturing workstations or devices for events. It then routes the event to the correct engineer for resolution in real time.
  5. Authorized users can interact with and receive notifications from this solution. An AWS Lambda function and Amazon Simple Notification Service (Amazon SNS) send emails and SMS notifications.
  6. Issues created, acknowledged, and closed in the web interface are recorded and updated using AWS AppSync and DynamoDB.
  7. The AWS AppSync GraphQL APIs can be called directly with HTTP POST requests.
  8. If you are using L4E to monitor your machines, enter the name of the Amazon S3 bucket where inference files will be delivered in the Anomaly Detection Output Bucket CloudFormation parameter. This solution can be configured to automatically raise issues if an anomaly is detected.
  9. When the Activate Glue Workflow CloudFormation parameter is set to “Yes”, an AWS Glue workflow will be created to extract data from DynamoDB. It delivers this data via an AWS Glue Data Catalog into Amazon S3. For more information, refer to the Data Analysis section.
  10. You can use an existing SAML provider as an additional identity provider for access to this solution. You can configure the Amazon Cognito Domain Prefix, SAML Provider Name, and SAML Provider Metadata URL CloudFormation parameters. For more information, refer to SAML identity provider.

An intuitive UI with nested events

With AVA, you also can create nested events / issues, so you can more easily get to the root of the problem and resolve issues quickly. The solution builds upon the same intuitive UI as highlighted in this previous Amazon Virtual Andon blog post. In addition, it allows you to manage events granularly, create subevents, raise, and resolve issues and sub issues (Figure 4).

Figure 4. AVA allows you to raise issues and sub issues (for example, ‘Out of boxes’ allows you to specify the kind of boxes you need to resolve the issue)

Figure 4. AVA allows you to raise issues and sub issues (for example, ‘Out of boxes’ allows you to specify the kind of boxes you need to resolve the issue)

Conclusion

Amazon Virtual Andon (AVA) is a self-deployable solution that provides you the digital capability to create, route, manage, and resolve issues. With AVA, you can monitor your overall enterprise for issues and engage with the right engineers to resolve them promptly. It offers a clear, intuitive user interface and straightforward workflow to help team members resolve issues.

Get started with Amazon Virtual Andon today.

[$] 5.16 Merge window, part 2

Post Syndicated from original https://lwn.net/Articles/875135/rss

Linus Torvalds released
5.16-rc1
and ended the 5.16 merge window on November 14, as
expected. At that point, 12,321 non-merge changesets had been pulled into
the mainline; about 5,500 since our summary of
the first half of the merge window
was written. As is usually the case,
the patch mix in the latter part of the merge window tended more toward
fixes, but there were a number other changes as well.

Building confidence in a decision

Post Syndicated from Netflix Technology Blog original https://netflixtechblog.com/building-confidence-in-a-decision-8705834e6fd8

Martin Tingley with Wenjing Zheng, Simon Ejdemyr, Stephanie Lane, Michael Lindon, and Colin McFarland

This is the fifth post in a multi-part series on how Netflix uses A/B tests to inform decisions and continuously innovate on our products. Need to catch up? Have a look at Part 1 (Decision Making at Netflix), Part 2 (What is an A/B Test?), Part 3 (False positives and statistical significance), and Part 4 (False negatives and power). Subsequent posts will go into more details on experimentation across Netflix, how Netflix has invested in infrastructure to support and scale experimentation, and the importance of developing a culture of experimentation within an organization.

In Parts 3 (False positives and statistical significance) and 4 (False negatives and power), we discussed the core statistical concepts that underpin A/B tests: false positives, statistical significance and p-values, as well as false negatives and power. Here, we’ll get to the hard part: how do we use test results to support decision making in a complex business environment?

The unpleasant reality about A/B testing is that no test result is a certain reflection of the underlying truth. As we discussed in previous posts, good practice involves first setting and understanding the false positive rate, and then designing an experiment that is well powered so it is likely to detect true effects of reasonable and meaningful magnitudes. These concepts from statistics help us reduce and understand error rates and make good decisions in the face of uncertainty. But there is still no way to know whether the result of a specific experiment is a false positive or a false negative.

Figure 1: Inspiration from Voltaire.

In using A/B testing to evolve the Netflix member experience, we’ve found it critical to look beyond just the numbers, including the p-value, and to interpret results with strong and sensible judgment to decide if there’s compelling evidence that a new experience is a “win” for our members. These considerations are aligned with the American Statistical Association’s 2016 Statement on Statistical Significance and P-Values, where the following three direct quotes (bolded) all inform our experimentation practice.

“Proper inference requires full reporting and transparency.” As discussed in Part 3: (False positives and statistical significance), by convention we run experiments at a 5% false positive rate. In practice, then, if we run twenty experiments (say to evaluate if each of twenty colors of jelly beans are linked to acne) we’d expect at least one significant result — even if, in truth, the null hypothesis is true in each case and there is no actual effect. This is the Multiple Comparisons Problem, and there are a number of approaches to controlling the overall false positive rate that we’ll not cover here. Of primary importance, though, is to report and track not only results from tests that yield significant results — but also those that do not.

Figure 2: All you need to know about false positives, in cartoon form.

“A p-value, or statistical significance, does not measure the size of an effect or the importance of a result.” In Part 4 (False negatives and power), we talked about the importance, in the experimental design phase, of powering A/B tests to have a high probability of detecting reasonable and meaningful metric movements. Similar considerations are relevant when interpreting results. Even if results are statistically significant (p-value < 0.05), the estimated metric movements may be so small that they are immaterial to the Netflix member experience, and we are better off investing our innovation efforts in other areas. Or the costs of scaling out a new feature may be so high relative to the benefits that we could better serve our members by not rolling out the feature and investing those funds in improving different areas of the product experience.

“Scientific conclusions and business or policy decisions should not be based only on whether a p-value passes a specific threshold.” The remainder of this post gives insights into practices we use at Netflix to arrive at decisions, focusing on how we holistically evaluate evidence from an A/B test.

Building a data-driven case

One practical way to evaluate the evidence in support of a decision is to think in terms of constructing a legal case in favor of the new product experience: is there enough evidence to “convict” and conclude, beyond that 5% reasonable doubt, that there is a true effect that benefits our members? To help build that case, here are some helpful questions that we ask ourselves in interpreting test results:

  • Do the results align with the hypothesis? If the hypothesis was about optimizing compute resources for back-end infrastructure, and results showed a major and statistically significant increase in user satisfaction, we’d be skeptical. The result may be a false positive — or, more than likely, the result of a bug or error in the execution of the experiment (Twyman’s Law). Sometimes surprising results are correct, but more often than not they are either the result of implementation errors or false positives, motivating us to dig deep into the data to identify root causes.
  • Does the metric story hang together? In Part 2 (What is an A/B Test?), we talked about the importance of describing the causal mechanism through which a change made to the product impacts both secondary metrics and the primary decision metric specified for the test. In evaluating test results, it’s important to look at changes in these secondary metrics, which are often specific to a particular experiment, to assess if any changes in the primary metric follow the hypothesized causal chain. With the Top 10 experiment, for example, we’d check if inclusion in the Top 10 list increases title-level engagement, and if members are finding more of the titles they watch from the home page versus other areas of the product. Increased engagement with the Top 10 titles and more plays coming from the home page would help build our confidence that it is in fact the Top 10 list that is increasing overall member satisfaction. In contrast, if our primary member satisfaction metric was up in the Top 10 treatment group, but analysis of these secondary metrics showed no increase in engagement with titles included in the Top 10 list, we’d be skeptical. Maybe the Top 10 list isn’t a great experience for our members, and its presence drives more members off the home page, increasing engagement with the Netflix search experience — which is so amazing that the result is an increase in overall satisfaction. Or maybe it’s a false positive. In any case, movements in secondary metrics can cast sufficient doubt that, despite movement in the primary decision metric, we are unable to confidently conclude that the treatment is activating the hypothesized causal mechanism.
  • Is there additional supporting or refuting evidence, such as consistent patterns across similar variants of an experience? It’s common to test a number of variants of an idea within a single experiment. For example, with something like the Top 10 experience, we may test a number of design variants and a number of different ways to position the Top 10 row on the homepage. If the Top 10 experience is great for Netflix members, we’d expect to see similar gains in both primary and secondary metrics across many of these variants. Some designs may be better than others, but seeing broadly consistent results across the variants helps build that case in favor of the Top 10 experience. If, on the other hand, we test 20 design and positioning variants and only one yields a significant movement in the primary decision metric, we’d be much more skeptical. After all, with that 5% false positive rate, we expect on average one significant result from random chance alone.
  • Do results repeat? Finally, the surest way to build confidence in a result is to see if results repeat in a follow-up test. If results of an initial A/B test are suggestive but not conclusive, we’ll often run a follow-up test that hones in on the hypothesis based on learnings generated from the first test. With something like the Top 10 test, for example, we might observe that certain design and row positioning choices generally lead to positive metric movements, some of which are statistically significant. We’d then refine these most promising design and positioning variants, and run a new test. With fewer experiences to test, we can also increase the allocation size to gain more power. Another strategy, useful when the product changes are large, is to gradually roll out the winning treatment experience to the entire user or member based to confirm benefits seen in the A/B test, and to ensure there are no unexpected deleterious impacts. In this case, instead of rolling out the new experience to all users at once, we slowly ramp up the fraction of members receiving the new experience, and observe differences with respect to those still receiving the old experience.

Connections with decision theory

In practice, each person has a different framework for interpreting the results of a test and making a decision. Beyond the data, each individual brings, often implicitly, prior information based on their previous experiences with similar A/B tests, as well as a loss or utility function based on their assessment of the potential benefits and consequences of their decision. There are ways to formalize these human judgements about estimated risks and benefits using decision theory, including Bayesian decision theory. These approaches involve formally estimating the utility of making correct or incorrect decisions (e.g., the cost of rolling out a code change that doesn’t improve the member experience). If, at the end of the experiment, we can also estimate the probability of making each type of mistake for each treatment group, we can make a decision that maximizes the expected utility for our members.

Decision theory couples statistical results with decision-making and is therefore a compelling alternative to p-value-based approaches to decision making. However, decision-theoretic approaches can be difficult to generalize across a broad range of experiment applications, due to the nuances of specifying utility functions. Although imperfect, the frequentist approach to hypothesis testing that we’ve outlined in this series, with its focus on p-values and statistical significance, is a broadly and readily applicable framework for interpreting test results.

Another challenge in interpreting A/B test results is rationalizing through the movements of multiple metrics (primary decision metric and secondary metrics). A key challenge is that the metrics themselves are often not independent (i.e. metrics may generally move in the same direction, or in opposite directions). Here again, more advanced concepts from statistical inference and decision theory are applicable, and at Netflix we are engaged in research to bring more quantitative approaches to this multimetric interpretation problem. Our approach is to include in the analysis information about historical metric movements using Bayesian inference — more to follow!

Finally, it’s worth noting that different types of experiments warrant different levels of human judgment in the decision making process. For example, Netflix employs a form of A/B testing to ensure safe deployment of new software versions into production. Prior to releasing the new version to all members, we first set up a small A/B test, with some members receiving the previous code version and some the new, to ensure there are no bugs or unexpected consequences that degrade the member experience or the performance of our infrastructure. For this use case, the goal is to automate the deployment process and, using frameworks like regret minimization, the test-based decision making as well. In success, we save our developers time by automatically passing the new build or flagging metric degradations to the developer.

Summary

Here we’ve described how to build the case for a product innovation through careful analysis of the experimental data, and noted that different types of tests warrant differing levels of human input to the decision process.

Decision making under uncertainty, including acting on results from A/B tests, is difficult, and the tools we’ve described in this series of posts can be hard to apply correctly. But these tools, including the p-value, have withstood the test of time, as reinforced in 2021 by the American Statistical Association president’s task force statement on statistical significance and replicability: “the use of p-values and significance testing, properly applied and interpreted, are important tools that should not be abandoned. . . . [they] increase the rigor of the conclusions drawn from data.”

The notion of publicly sharing and debating results of key product tests is ingrained in the Experimentation Culture at Netflix, which we’ll discuss in the last installment of this series. But up next, we’ll talk about the different areas of experimentation across Netflix, and the different roles that focus on experimentation. Follow the Netflix Tech Blog to stay up to date.


Building confidence in a decision was originally published in Netflix TechBlog on Medium, where people are continuing the conversation by highlighting and responding to this story.

Orchestrate an ETL pipeline using AWS Glue workflows, triggers, and crawlers with custom classifiers

Post Syndicated from Mohit Mehta original https://aws.amazon.com/blogs/big-data/orchestrate-an-etl-pipeline-using-aws-glue-workflows-triggers-and-crawlers-with-custom-classifiers/

Extract, transform, and load (ETL) orchestration is a common mechanism for building big data pipelines. Orchestration for parallel ETL processing requires the use of multiple tools to perform a variety of operations. To simplify the orchestration, you can use AWS Glue workflows. This post demonstrates how to accomplish parallel ETL orchestration using AWS Glue workflows and triggers. We also demonstrate how to use custom classifiers with AWS Glue crawlers to classify fixed width data files.

AWS Glue workflows provide a visual and programmatic tool to author data pipelines by combining AWS Glue crawlers for schema discovery and AWS Glue Spark and Python shell jobs to transform the data. A workflow consists of one of more task nodes arranged as a graph. Relationships can be defined and parameters passed between task nodes to enable you to build pipelines of varying complexity. You can trigger workflows on a schedule or on-demand. You can track the progress of each node independently or the entire workflow, making it easier to troubleshoot your pipelines.

You need to define a custom classifier if you want to automatically create a table definition for data that doesn’t match AWS Glue built-in classifiers. For example, if your data originates from a mainframe system that utilizes a COBOL copybook data structure, you need to define a custom classifier when crawling the data to extract the schema. AWS Glue crawlers enable you to provide a custom classifier to classify your data. You can create a custom classifier using a Grok pattern, an XML tag, JSON, or CSV. When the crawler starts, it calls a custom classifier. If the classifier recognizes the data, it stores the classification and schema of the data in the AWS Glue Data Catalog.

Use case

For this post, we use automated clearing house (ACH) and check payments data ingestion as an example. ACH is a computer-based electronic network for processing transactions, and check payments is a negotiable transaction drawn against deposited funds, to pay the recipient a specific amount of funds on demand. Both ACH and check payments data files, which are in fixed width format, need to be ingested in the data lake incrementally over a time series. As part of the ingestion, these two data types need to be merged to get a consolidated view of all payments. ACH and check payment records are consolidated into a table that is useful for performing business analytics using Amazon Athena.

Solution overview

We define an AWS Glue crawler with a custom classifier for each file or data type. We use an AWS Glue workflow to orchestrate the process. The workflow triggers crawlers to run in parallel. When the crawlers are complete, the workflow starts an AWS Glue ETL job to process the input data files. The workflow tracks the completion of the ETL job that performs the data transformation and updates the table metadata in AWS Glue Data Catalog.

The following diagram illustrates a typical workflow for ETL workloads.

This post is accompanied by an AWS CloudFormation template that creates resources described by the AWS Glue workflow architecture. AWS CloudFormation enables you to model, provision, and manage AWS resources by treating infrastructure as code.

The CloudFormation template creates the following resources:

  • An AWS Glue workflow trigger that is started manually. The trigger starts two crawlers simultaneously for processing the data file related to ACH payments and check payments, respectively.
  • Custom classifiers for parsing incoming fixed width files containing ACH and check data.
  • AWS Glue crawlers:
    • A crawler to classify ACH payments in the RAW database. This crawler uses the custom classifier defined for ACH payments raw data. The crawler creates a table named ACH in the Data Catalog’s RAW database.
    • A crawler to classify check payments. This crawler uses the custom classifier defined for check payments raw data. This crawler creates a table named Check in the Data Catalog’s RAW database.
  • An AWS Glue ETL job that runs when both crawlers are complete. The ETL job reads the ACH and check tables, performs transformations using PySpark DataFrames, writes the output to a target Amazon Simple Storage Service (Amazon S3) location, and updates the Data Catalog for the processedpayment table with new hourly partition.
  • S3 buckets designated as RawDataBucket, ProcessedBucket, and ETLBucket. RawDataBucket holds the raw payment data as it is received from the source system, and ProcessedBucket holds the output after AWS Glue transformations have been applied. This data is suitable for consumption by end-users via Athena. ETLBucket contains the AWS Glue ETL code that is used for processing the data as part of the workflow.

Create resources with AWS CloudFormation

To create your resources with the CloudFormation template, complete the following steps:

  1. Choose Launch Stack:
  2. Choose Next.
  3. Choose Next again.
  4. On the Review page, select I acknowledge that AWS CloudFormation might create IAM resources.
  5. Choose Create stack.

Examine custom classifiers for fixed width files

Let’s review the definition of the custom classifier.

  1. On the AWS Glue console, choose Crawlers.
  2. Choose the crawler ach-crawler.
  3. Choose the RawACHClassifier classifier and review the Grok pattern.

This pattern assumes that the first 16 characters in the fixed width file are reserved for acct_num, and the next 10 characters are reserved for orig_pmt_date. When a crawler finds a classifier that matches the data, the classification string and schema are used in the definition of tables that are written to your Data Catalog.

Run the workflow

To run your workflow, complete the following steps:

  1. On the AWS Glue console, select the workflow that the CloudFormation template created.
  2. On the Actions menu, select Run.

This starts the workflow.

  1. When the workflow is complete, on the History tab, choose View run details.

You can review a graph depicting the workflow.

Examine the tables

In the Databases section under AWS Glue console, you can find a database named glue-database-raw, which contains two tables named ach and check. These tables are created by the respective AWS Glue crawler using the custom classification pattern specified.

Query processed data

To query your data, complete the following steps:

  1. On the AWS Glue console, select the database glue-database-processed.
  2. On the Action menu, choose View data.

The Athena console opens. If this is your first time using Athena, you need to set up the S3 bucket to store the query result.

  1. In the query editor, run the following query:
select acct_num,pymt_type,count(pymt_type)
from glue_database_processed.processedpayment 
group by acct_num,pymt_type;

You can see the count of payment type in each account displayed from the processedpayment table.

Clean up

To avoid incurring ongoing charges, clean up your infrastructure by deleting the CloudFormation stack. However, you first need to empty your S3 buckets.

  1. On the Amazon S3 console, select each bucket created by the CloudFormation stack.
  2. Choose Empty.
  3. On the AWS CloudFormation console, select the stack you created.
  4. Choose Delete.

Conclusion

In this post we explored how AWS Glue Workflows enable data engineers to build and orchestrate a data pipeline to discover, classify and process standard and non-standard data files. We also discussed how to leverage AWS Glue Workflow along with AWS Glue Custom Classifier, AWS Glue Crawlers and AWS Glue ETL capabilities to ingest from multiple sources into a data lake. We also walked through how you can use Amazon Athena to perform interactive SQL analysis.

For more details on using AWS Glue Workflows, see Performing Complex ETL Activities Using Blueprints and Workflows in AWS Glue.

For more information on AWS Glue ETL jobs, see Build a serverless event-driven workflow with AWS Glue.

For More information on using Athena, see Getting Started with Amazon Athena.


Appendix: Create a regular expression pattern for a custom classifier

Grok is a tool that you can use to parse textual data given a matching pattern. A Grok pattern is a named set of regular expressions (regex) that are used to match data one line at a time. AWS Glue uses Grok patterns to infer the schema of your data. When a Grok pattern matches your data, AWS Glue uses the pattern to determine the structure of your data and map it into fields. AWS Glue provides many built-in patterns, or you can define your own. When defining you own pattern, it’s a best practice to test the regular expression prior to setting up the AWS Glue classifier.

One way to do that is to build and test your regular expression by using https://regex101.com/#PYTHON. For this, you need to take a small sample from your input data. You can visualize the output of your regular expression by completing the following steps:

  1. Copy the following rows from the source file to the test string section.
    111111111ABCDEX 01012019000A2345678A23456S12345678901012ABCDEFGHMJOHN JOE                           123A5678ABCDEFGHIJK      ISECNAMEA                           2019-01-0100000123123456  VAC12345678901234
    211111111BBCDEX 02012019001B2345678B23456712345678902012BBCDEFGHMJOHN JOHN                          123B5678BBCDEFGHIJK      USECNAMEB                           2019-02-0100000223223456  XAC12345678901234

  2. Construct the regex pattern based on the specifications. For example, the first 16 characters represent acct_num followed by orig_pmt_date of 10 characters. You should end up with a pattern as follows:
(?<acct_num>.{16})(?<orig_pmt_date>.{10})(?<orig_rfc_rtn_num>.{8})(?<trace_seq_num>.{7})(?<cls_pmt_code>.{1})(?<orig_pmt_amt>.{14})(?<aas_code>.{8})(?<line_code>.{1})(?<payee_name>.{35})(?<fi_rtn_num>.{8})(?<dpst_acct_num>.{17})(?<ach_pmt_acct_ind>.{1})(?<scndry_payee_name>.{35})(?<r_orig_pmt_date>.{10})(?<r_orig_rfc_rtn_num>.{8})(?<r_trace_seq_num>.{7})(?<type_pmt_code>.{1})(?<va_stn_code>.{2})(?<va_approp_code>.{1})(?<schedule_num>.{14})

After you validate your pattern, you can create a custom classifier and attach it to an AWS Glue crawler.


About the Authors

Mohit Mehta is a leader in the AWS Professional Services Organization with expertise in AI/ML and big data technologies. Prior to joining AWS, Mohit worked as a digital transformation executive at a Fortune 100 financial services organization. Mohit holds an M.S in Computer Science, all AWS certifications, an MBA from College of William and Mary, and a GMP from Michigan Ross School of Business.

Meenakshi Ponn Shankaran is Senior Big Data Consultant in the AWS Professional Services Organization with expertise in big data. Meenakshi is a SME on working with big data use cases at scale and has experience in architecting and optimizing workloads processing petabyte-scale data lakes. When he is not solving big data problems, he likes to coach the game of cricket.

Better Together: XDR, SOAR, Vulnerability Management, and External Threat Intelligence

Post Syndicated from Matthew Gardiner original https://blog.rapid7.com/2021/11/15/better-together-xdr-soar-vulnerability-management-and-external-threat-intelligence/

Better Together: XDR, SOAR, Vulnerability Management, and External Threat Intelligence

One of the biggest challenges with both incident response and vulnerability management is not just the raw number of incidents and vulnerabilities organizations need to triage and manage, but the fact that it’s often difficult to separate the critical incidents and vulnerabilities from the minor ones. If all incidents and vulnerabilities are treated as equal, teams will tend to underprioritize the critical ones and overprioritize those that are less significant. In fact, ZDNet reports that only 5.5% of all vulnerabilities are ever exploited in the wild. Meaning that fixing all vulnerabilities with equal priority is a significant misallocation of resources, as 95% of them will likely never be exploited.

Unjamming incident response and vulnerability management

My experience with organizations over the years shows a similar issue with security incidents. Clearly not all incidents are created equal in terms of risk and potential impact, so if your organization is treating them equally, this also is a sign of misprioritization. And what organization has a surplus of incident response cycles to waste? Without some informed triaging and prioritization, the remediation of both incidents and vulnerabilities can get jammed up, and the security team can be blamed for “crying wolf” by raising the security alarm too often without strong evidence.

How to better prioritize security incidents and vulnerabilities? Fundamentally, it comes down to simultaneously having the right data and intelligence from both inside your IT environment and the world outside. What if you could know with high certainty what you have, what is currently going on inside your IT environment, and how and whether the threat actors’ current tools, tactics, techniques, and procedures are currently active and relevant to you? If this information and analysis was available at the right time, it would go a long way to helping prioritize responses to both detected incidents and discovered vulnerabilities.

Integrating XDR, SOAR, vulnerability management, and external threat intelligence

The key building blocks of this approach require the combination of extended detection and response (XDR) for continuous visibility and threat detection; vulnerability management for vulnerability detection and management; SOAR for security management, integration, and automation; and external threat intelligence to inject information about what threat actors are actually doing and how this relates back to the organization. The intersection of these four security systems and sources of intelligence is where the magic happens.

Separately, XDR, SOAR, vulnerability management, and external threat intelligence are valuable in their own right. But when used closely together, they deliver greater security insights that help guide incident response and vulnerability management. Together, they help security teams focus their limited resources on the risks that matter most.

What Rapid7 is doing about it

Rapid7 is on the forefront of bringing this integrated approach to market. It starts — but does not end — with possessing all the underlying technology and expertise necessary to bring this approach to life through our products in XDR, SOAR, vulnerability management, and external threat intelligence. New and particularly important to this story is how Rapid7’s external threat intelligence offering, brought forward by the recent acquisition of IntSights, is integrated and directly available to assist with incident and vulnerability management prioritization and automation.

The newly released InsightConnect for IntSights Plugin enables, among other capabilities, the enrichment of indicators — IP addresses, domains, URLs, file hashes — with what is known about them in the outside world, such as whether they are part of attackers’ infrastructure, their registration details, when they were first seen, any associations with threat actor groups, severity, and other key aspects. This information, when linked to alerts and vulnerabilities, can help drive the response prioritizations that are incredibly important to improving incident response and vulnerability management effectiveness and efficiency.

This is just the start of integrating IntSights threat intelligence into Rapid7’s broader set of security offerings. Stay tuned for additional integration news as Rapid7 brings best-of-breed solutions further, combining our vulnerability management, detection and response, and threat intelligence products and services to solve more real-world security challenges.

NEVER MISS A BLOG

Get the latest stories, expertise, and news about security today.

Security updates for Monday

Post Syndicated from original https://lwn.net/Articles/876135/rss

Security updates have been issued by Debian (ffmpeg and tomcat9), Fedora (et and kernel), openSUSE (binutils, rubygem-activerecord-5_1, samba, and tinyxml), Oracle (freerdp and httpd:2.4), Red Hat (devtoolset-11-gcc, gcc-toolset-10-binutils, kernel, kernel-rt, and kpatch-patch), and Scientific Linux (freerdp).

Introducing Relational Database Connectors

Post Syndicated from Kabir Sikand original https://blog.cloudflare.com/relational-database-connectors/

Introducing Relational Database Connectors

Introducing Relational Database Connectors

At Cloudflare, we’re building the best compute platform in the world. We want to make it easy, seamless, and obvious to build your applications with us. But simply making the best compute platform is not enough — at the heart of your applications are the data they interact with.

Cloudflare has multiple data storage solutions available today: Workers KV, R2, and Durable Objects. All three follow Cloudflare’s design goals for Workers: global by default, infinitely scalable, and delightful for developers to use. We’ve partnered with third-party storage solutions like Fauna, MongoDB and Prisma, who have built data platforms that align beautifully with our design goals and written tutorials for databases that already support HTTP connections.

The one area that’s been sorely missed: relational databases. Cloudflare itself runs on relational databases, and we’re not alone. In April, we asked which Node libraries you wanted us to support, and four of the top five requests were related to databases. For this Full Stack Week, we asked ourselves: how could we support relational databases in a way that aligned with our design goals?

Today, we’re taking a first step towards that world by announcing support for relational databases, including Postgres and MySQL from Workers.

Connecting to a database is no simple task — if it were as easy as passing a connection string to a database driver, we would have already done it. We’ve had to overcome several hurdles to reach this point, and have several more still to conquer.  

Our goal with this announcement is to work with you, our developers, to solve the unique pain points that come from accessing databases inside Workers. If you’d like to work with us, fill out this form or join us on Discord — this is just the beginning. If you’d just like to grab the code and play around, use this example to get started connecting to your own database, or check out our demo.

Why are Database Connectors so hard to build?

Serverless database connections are challenging to support for several reasons.

Databases are needy — they often require TCP connections, since they assume long-lived connections between an application server and the database. The Workers runtime doesn’t currently support TCP connections, so we’ve only been able to support HTTP-based databases or proxies.

Like a relationship, establishing a connection isn’t quite enough. Developers use client libraries for databases to make submitting queries and managing the responses easy. Since the Workers runtime is not entirely Node.js compatible, we need to either roll our own database library or find one that does not use unsupported built-in libraries.

Finally, databases are sensitive. It often takes external libraries to manage shared connections between an application server and a database, since these connections tend to be expensive to establish.

Moving past these challenges

Our approach today gives us the foundation to address each of these challenges in creative ways going forward.

First, we’re leveraging cloudflared to create a secure tunnel between Cloudflare and a private network within your existing infrastructure. Cloudflared already supports proxying HTTP to TCP over WebSockets — Our challenge is providing interfaces that look like the socket interfaces existing libraries expect, while rewiring the implementations to redirect reads and writes to our websocket. This method is fast, safe, and secure; but limiting in that we lack control of where to direct the final connections. This is a problem we will solve soon, but until then our approach is essential to gathering latency and performance data to see where else we need to improve.

Introducing Relational Database Connectors

Next, we’ve created a shim-layer that adapts the socket API from a popular runtime to connect directly to databases using a WebSocket. This allows us to bundle code as-is, without forking or otherwise making significant changes to the database library. As part of this announcement, we’ve published a tutorial on how to connect to and query a Postgres database from your Workers, using existing Cloudflare technology and a driver from the growing community at Deno. We’re excited to work with the upstream maintainers, on expanding support.

Finally, we’re most excited for how this approach will let us begin to manage connection pooling and connection establishment overhead. While our current tech demo requires setting up the Cloudflare Tunnel on your own infrastructure, we’re looking for customers who’d like to pilot a model where Cloudflare hosts the tunnel for you.

Where we’re going

We’re just getting started. Our goal with today’s announcement is to find customers who are looking to build new applications or migrate existing applications to Workers while working with data that’s stored in a relational database.

Just as Cloudflare started by providing security, performance, and reliability for customer’s websites, we’re excited about a future where Cloudflare manages database connections, handles replication of data across cloud providers and provides low-latency access to data globally.

First, we’re looking to add support for TCP into the runtime natively. With native support for TCP we’ll not only have better support for databases, but expand the Workers runtime to work with data infrastructure more broadly.

Our position in the network layer of the stack makes providing performance, security benefits and extremely reduced egress costs to global databases all possible realities. To do so, we’ll repurpose the HTTP to TCP proxy service that we’ve currently built and run it for developers as a connection pooling service, managing connections to their databases on their behalf.

Finally, our network makes caching data and making it accessible globally at low latency possible. Once we have connections back to your data, making it globally accessible in Cloudflare’s network will unlock fundamentally new architectures for distributed data.

Take our connectors for a spin

Want to check things out? There are three main steps to getting up-and-running:

  1. Deploying cloudflared within your infrastructure.
  2. Deploying a database that connects to cloudflared.
  3. Deploying a Worker with the database driver that submits queries.

The Postgres tutorial is available here.

When you’re all done, it’ll look a little something like this:

import { Client } from './driver/postgres/postgres'

export default {
  async fetch(request: Request, env, ctx: ExecutionContext) {
    try {
      const client = new Client({
        user: 'postgres',
        database: 'postgres',
        hostname: 'https://db.example.com',
        password: '',
        port: 5432,
      })
      await client.connect()
      const result = await client.queryArray('SELECT * FROM users WHERE uuid=1;')
      ctx.waitUntil(client.end())
      return new Response(JSON.stringify(result.rows[0]))
    } catch (e) {
      return new Response((e as Error).message)
    }
  },
}

Hit any snags? Fill out this form, join our Discord or shoot us an email and let’s chat!

Developer Spotlight: Winning a Game Jam with Jamstack and Durable Objects

Post Syndicated from Erwin van der Koogh original https://blog.cloudflare.com/developer-spotlight-guido-zuidhof-full-tilt/

Developer Spotlight: Winning a Game Jam with Jamstack and Durable Objects

Developer Spotlight: Winning a Game Jam with Jamstack and Durable Objects

Welcome to a new blog post series called Developer Spotlight. In this series we will be showcasing interesting applications built on top of the Cloudflare Workers Ecosystem.

And to celebrate Durable Objects going GA, what better to kick off the series than with a really cool tech demo of Durable Objects called Full Tilt?

Full Tilt by Guido Zuidhof is a game jam entry for Ludum Dare, one of the biggest and oldest game jams around, where he won first place in the innovation category. A game jam is like a hackathon for games, where you have a very short amount of time (usually 48-72 hours) to create a game from scratch.

We love Full Tilt, not just because Guido used Workers and Durable Objects to build a cool game where you control a game on your computer via your phone, but especially because it shows how powerful Durable Objects are. In less than 48 hours Guido was able to write all the logic to instantly spin up a personal gaming server anywhere in the world, as close to that player as possible. And it is so fast that you feel like you are controlling the computer directly.

But here is Guido, to tell you about his experience developing Full Tilt.

Last October I participated in the Ludum Dare 49 game jam. The thing I love about game jams is that the time constraint forces you to work quickly, iterate often, and most importantly cut scope.

In this game jam I created Full Tilt, a game in which you seamlessly use your phone as a Wiimote-like motion controller for a game that is run on your laptop in a web browser. The secret sauce to making it so smooth was in combining a game jam with Jamstack and mixing in some Durable Objects.

You can try the game right here.

Phone as a controller

Full Tilt is a browser game in which you move the player character by moving your hand around. There are a few different ways we can do that. One idea would be to use your computer’s webcam to track a marker object through 3D space. While that is possible, it is tricky to get it working in any situation (a dark room can be problematic!) and also some players may feel uncomfortable turning on their webcam for a simple web game.

A smartphone has a bunch of sensors built in, including a magnetometer and gyroscope — those sensors are exactly what we need, and we can assume that the majority of our potential players have a smartphone within arm’s reach. When a native mobile application uses these sensors, it adds a lot of friction (users now have to install an app), as well as a bunch of implementation work. Fortunately modern web browsers allow you to read from these sensors through the DeviceMotion API: a small web app will do the job perfectly!

The next challenge is communicating the sensor readings from the phone to the game running on the main computer. For that we will use a combination of Cloudflare Workers and Durable Objects. There needs to be some shared contact (i.e., a game server) that both the main computer and the smartphone talk to. Using a serverless solution makes a lot of sense for a web game. And as we only have 48 hours here, less stuff to worry about is a big selling point too. Workers and Durable Objects also make it easy to keep the game running after the game jam, without having to pay for — and more importantly worry about — keeping servers running.

Setting up a line of communication

There are roughly two ways for browsers to communicate: through a shared connection (a game server somewhere) or a peer to peer connection, so browsers can talk directly to each other without a middleman by leveraging WebRTC DataChannels.

WebRTC can be very challenging to make reliable and may still need a proxy server for some especially problematic network setups behind multiple NATs. Setting up a WebRTC connection may have been the perfect solution for the lowest possible latency, but it was out of scope for such a short game jam.

The game we are creating has low latency requirements, when I tilt my phone the game should respond quickly. We can probably get away with anything under 100ms, although low double digits or less is definitely preferred! If I’m geographically located in one place and the game server is geographically close enough, then this game server will be able to pass messages from my smartphone to my laptop without too much delay. Edge computing is hot nowadays, and for this gaming use case it is not just a nice-to-have but also a necessity.

Enough background, let’s architect the system.

On-demand game rooms

The first thing I needed to set up was game rooms. Something that both the phone and the computer browsers could connect to, so they can pass messages between them.

Durable Objects allow us to create a large amount of small stateful “mini servers” or “rooms” that multiple clients can connect to simultaneously over WebSockets, providing perfect small on-demand game servers. Think of Durable Objects as a single thread of Javascript that runs in a data center close to where the user first asked for it to be created.

After the browser on the computer starts the game, it asks our Cloudflare Worker API to create a room for the current game session. This API request is a simple POST request, the server responds with a four character room code that uniquely identifies the room that was created. The reason we want the room code to be short is because the user may need to copy this code and type it into their smartphone if they are unable to scan a QR code.

Humans are notoriously bad at copying random character strings as different characters look alike, so we use a limited character set that excludes the most commonly confused characters:

const DICTIONARY = "2345679ADEFGHJKLMNPQRSTUVWXYZ"; // 29 chars (no 0, O, I, 1, B, 8)

A four character code will allow us to uniquely point to ~700,000 different rooms, that seems like it would be enough even if our game got quite popular! What’s more: these game sessions don’t last forever. After some period of time (say 24 hours) we can be certain enough that the game session has ended, and we can re-use that room code.

Room code coordination

In your Cloudflare Worker script, there are two ways to create a Durable Object: either we ask for one to be created with an ID generated from a name, or we ask for one to be created with a random unique ID. The naive solution would be to create a Durable Object with an ID generated from the room code. However, that is not a good idea here because a Durable Object gets created in a data center that is geographically close to the end user.

A problematic situation would be if a user in Mumbai requests a room and gets room code ABCD. Initially, they play the game for a bit, and it works great.

The issue comes a week later when that room code is reused for another player based in Los Angeles, The game room Durable Object will be revived in Mumbai and latency will be awful for our Los Angeles player. In the future, Durable Objects may get migrated between data centers, but that’s not yet guaranteed.

Instead, what we can do is create a new Durable Object with a random ID for every new game session and keep a mapping from the four character room code to this random ID. We are introducing some state in our system: we will need a central source of truth which is where Durable Objects can come to the rescue again.

We will solve this by creating a single “Room Hub” Durable Object that keeps track of this mapping from room code to Durable Object ID. This Durable Object will have two endpoints, one to request a new room and another to look up a room’s information.

Here’s our request handler for the Room Request endpoint (the argument is a Sunder Context, Sunder is the web framework I used for this project):

export async function handleRoomRequest(ctx: Context<Env>) {
    const now = Date.now();    
    const reqBody = await ctx.request.json();

    // We make some attempts to find a room that is available..
    const attempts = 5

    let roomCode: string;
    let roomStorageKey: string;

    for (let i = 0; i < attempts; i++) {
        roomCode = generateRoomCode();
        roomStorageKey = ROOM_STATE_PREFIX + roomCode;
        const room = await ctx.state.storage.get<RoomData>(roomStorageKey);
        if (room === undefined) {
            break;
        } else if (now - room.createdAt > MAX_ROOM_AGE) {
            await ctx.state.storage.delete(roomStorageKey);
            break;
        }
        if (i === attempts-1) {
            return ctx.throw("Couldn't find available room code :(");
        }
    }

    const roomData: RoomData = {
        roomCode: roomCode,
        durableObjectId: reqBody.durableObjectId,
        createdAt: now,
    }

    await ctx.state.storage.put<RoomData>(roomStorageKey, roomData);

    ctx.response.body = {
        room: roomData
    };
    ctx.response.status = HttpStatus.Created;
}

In a nutshell, we generate a few room codes until we find one that has never been used or hasn’t been used in a long enough time.

There is a subtle but important nuance in this code: the Durable Object gets created in the Cloudflare Worker that talks to our Room Hub, not in the Room Hub itself. Our Room Hub will run in a single data center somewhere on Cloudflare’s network. If we create the game room from there it may still be far away from our end user!

Looking up a room’s information is simpler, we return either the room data or status 404.

export async function handleRoomLookup(ctx: Context<Env, {roomCode: string}>) {
    const now = Date.now();

    let roomStorageKey = ROOM_STATE_PREFIX + ctx.params.roomCode;
    const roomData = await ctx.state.storage.get<RoomData>(roomStorageKey);

    if (roomData === undefined) {
        ctx.throw(404, "Room not found");
        return;
    }

    if (now - roomData.createdAt > MAX_ROOM_AGE) {
        // About time we cleaned it up.
        await ctx.state.storage.delete(roomStorageKey);
        ctx.response.status = HttpStatus.NotFound;
        return;
    }

    ctx.response.body = {
        room: roomData
    };
}

The smartphone browser needs to connect to that same room. To make things easy for the user we generate a four character room code which points at that specific “Game Room” Durable Object. This way the user can take their smartphone, navigate to the website address https://ld49.pages.dev, and enter the code “ABCD” (or more commonly, they scan a QR code with the link https://ld49.pages.dev?room=ABCD).

Game Room Durable Object

Our game room Durable Object can be pretty simple since it is only responsible for passing along messages from the smartphone to the laptop with the latest sensor readings. I was able to modify the Durable Objects chat room example to do exactly this — a good time saver for a game jam!

When a browser connects, they either connect as a “peer” or as a “host” role. Any messages sent by peers are forwarded to the host, and all messages from the host get forwarded to all peers. In this case, our host is the laptop browser running the game and the peer is the smartphone controller. Implementation-wise this means that we keep two lists of users: the peers and the hosts. Whenever a message comes in, we loop over the list to broadcast it to all connections of the other role. In practice, the code is a bit more involved to deal with users disconnecting.

Full Tilt is a singleplayer game, but adapting it to be a multiplayer game would be easy with this setup. Imagine a Mario Kart-like game that runs in your browser in which multiple friends can join using their smartphones as their steering wheel controller! Unfortunately there was not enough time in this game jam to make a polished game.

Front end

With the backend ready, we still need to create the actual game and the controller web app.

My initial plan was to create a game in which you fly a 3D plane by tilting your phone, collecting stars and completing aerobatic tricks. It would fit the theme “Unstable” as I expected this control method to be pretty flimsy! Since there was no time left to create anything close to that, it was time to cut scope.

I ended up using the Phaser game engine and put the entire system together in a Svelte app.   This was certainly a challenge, as I had only used Phaser once before many years ago and had never used Svelte. Luckily, I was able to put together something simple quickly enough: a snake-like game in which you move a thingy to collect blips that appear randomly on the screen.

In order for a game to be a game there needs to be some goal for the user, usually some game over condition. I changed the game to go faster and faster over time, added a score counter, and added a game over condition where you lose the game if you touch the edge of the screen. I made my “art” in MS Paint, generated some sound effects using the online tool sfxr, and “composed” the music soundtrack in Chrome’s Music Lab Song Maker.

Simultaneously I wrote a small client for my game server and duct-taped together the smartphone controller app which is powered by the browser’s DeviceMotion APIs. To distribute my game I used Cloudflare Pages, which worked like a charm the first time.

All done

And then the deadline was there — I barely made it, but I submitted something I was proud of. A not-so-great game, but with an interesting backend system and a novel input method. Do try the game yourself here, and the source code is available here (warning: it’s pretty hacky code of course!).

The reception of my co-jammers was great. While everybody agreed the game itself and its graphics were awful, it was novel. The game ended up rated first in the *Innovation* category for this game jam, out of hundreds of other games!

Finally, is this the future of game servers? For indie developers and smaller studios, setting up and maintaining a globally distributed fleet of game servers is both a huge distraction and cost. Serverless and in particular Durable Objects can provide an amazing solution.

But not every game is well-suited for a WebSocket-based backend. In some real-time games you are not interested in what happened a second ago and only the latest information matters. This is where the reliable and ordered nature of WebSockets can get in the way.

All in all my first impressions of Durable Objects are very positive, it is a great tool to have in your toolbelt for all kinds of web projects. You can now tackle problems that would otherwise take days in mere minutes. I am very excited to see what other problems will be made easy by Durable Objects, even those I haven’t even thought of yet.

Making connections with TCP and Sockets for Workers

Post Syndicated from James M Snell original https://blog.cloudflare.com/introducing-socket-workers/

Making connections with TCP and Sockets for Workers

Making connections with TCP and Sockets for Workers

Today we are excited to announce that we are developing APIs and infrastructure to support more TCP, UDP, and QUIC-based protocols in Cloudflare Workers. Once released, these new capabilities will make it possible to use non-HTTP socket connections to and from a Worker or Durable Object as easily as one can use HTTP and WebSockets today.

Out of the box, fetch and WebSocket APIs. With just a few internal changes to make it operational in Workers, we’ve developed an example using an off-the-shelf driver (in this example, a Deno-based Postgres client driver) to communicate with a remote Postgres server via WebSocket over a secure Cloudflare Tunnel.

import { Client } from './driver/postgres/postgres'

export default {
  async fetch(request: Request, env, ctx: ExecutionContext) {
    try {
      const client = new Client({
        user: 'postgres',
        database: 'postgres',
        hostname: 'https://db.example.com',
        password: '',
        port: 5432,
      })
      await client.connect()
      const result = await client.queryArray('SELECT * FROM users WHERE uuid=1;')
      ctx.waitUntil(client.end())
      return new Response(JSON.stringify(result.rows[0]))
    } catch (e) {
      return new Response((e as Error).message)
    }
  },
}

The example works by replacing the bits of the Postgres client driver that use the Deno-specific TCP socket APIs with standard fetch and WebSockets APIs. We then establish a WebSocket connection with a remote Cloudflare Tunnel daemon running adjacent to the Postgres server, establishing what is effectively TCP-over-WebSockets.

Making connections with TCP and Sockets for Workers

While the fact we were able to build the example and communicate effectively and efficiently with the Postgres server — without making any changes to the Cloudflare Workers runtime — is impressive, there are limitations to the approach. For one, the solution requires additional infrastructure to establish and maintain the WebSocket tunnel — in this case, the instance of the Cloudflare Tunnel daemon running adjacent to the Postgres server. While we are certainly happy to provide that daemon to customers, it would just be better if that component were not required at all. Second, tunneling TCP over WebSockets, which is itself tunneled via HTTP over TCP is a bit suboptimal. It works, but we can do better.

Making connections from Cloudflare Workers

Currently, there is no standard API for socket connections in JavaScript. We want to change that.

If you’ve used Node.js before, then you’re most likely familiar with the net.Socket and net.TLSSocket objects. If you use Deno, then you might know that they’ve recently introduced the Deno.connect() and Deno.connectTLS() APIs. When you look at those APIs, what should immediately be apparent is how different they are from one another despite doing the exact same thing.

When we decided that we would add the ability to open and use socket connections from within Workers, we also agreed that we really have no interest in developing yet another non-standard, platform-specific API that is unlike the APIs provided by other platforms. Therefore, we are extending an invitation to all JavaScript runtime platforms that need socket capabilities to collaborate on a new (and eventually standardized) API that just works no matter which runtime you choose to develop on.

Here’s a rough example of what we have in mind for opening and reading from a simple TCP client connection:

const socket = new Socket({
  remote: { address: '123.123.123.123', port: 1234 },
})
for await (const chunk of socket.readable)
  console.log(chunk)

Or, this example, sending a simple “hello world” packet using UDP:

const socket = new Socket({
  type: 'udp',
  remote: { address: '123.123.123.123', port: 1234 },
});
const enc = new TextEncoder();
const writer = socket.writable.getWriter();
await writer.write(enc.encode('hello world'));
await writer.close();

The API will be designed generically enough to work both client and server-side; for TCP, UDP, and QUIC; with or without TLS, and will not rely on any mechanism specific to any single JavaScript runtime. It will build on existing broadly supported Web Platform standards such as EventTarget, ReadableStream, WritableStream, AbortSignal, and promises. It will be familiar to developers who are already familiar with the fetch() API, service workers, and promises using async/await.

interface Socket : EventTarget {
  constructor(object SocketInit);

  Promise<undefined> update(object SocketInit);

  readonly attribute ReadableStream readable;
  readonly attribute WritableStream writable;
  
  readonly attribute Promise<undefined> ready;
  readonly attribute Promise<undefined> closed;

  Promise<undefined> abort(optional any reason);
  readonly attribute AbortSignal signal;
 
  readonly attribute SocketStats stats;
  readonly attribute SocketInfo info;
}

This is just a proposal at this point and the details will very likely change from the examples above by the time the capability is delivered in Workers. It is our hope that other platforms will join us in the effort of developing and supporting this new API so that developers have a consistent foundation upon which to build regardless of where they run their code.

Introducing Socket Workers

The ability to open socket client connections is only half of the story.

When we first started talking about adding these capabilities an obvious question was asked: What about using non-HTTP protocols to connect to Workers? What if instead of just having the ability to connect a Worker to some other back-end database, we could implement the entire database itself on the edge, inside Workers, and have non-HTTP clients connect to it? For that matter, what if we could implement an SMTP server in Workers? Or an MQTT message queue? Or a full VoIP platform? Or implement packet filters, transformations, inspectors, or protocol transcoders?

Workers are far too powerful to limit to just HTTP and WebSockets, so we will soon introduce Socket Workers — that is, Workers that can be connected to directly using raw TCP, UDP, or QUIC protocols without using HTTP.

What will this new Workers feature look like? Many of the details are still being worked through, but the idea is to deploy a Worker script that understands and responds to “connect” events in much the same way that “fetch” events work today. Importantly, this would build on the same common socket API being developed for client connections:

addEventListener('connect', (event) => {
  const enc = new TextEncoder();
  const writer = event.socket.writable.getWriter();
  writer.write(enc.encode('Hello World'));
  writer.close();
});

Next Steps (and a call to action)

The new socket API for JavaScript and Socket Workers are under active development, with focus initially on enabling better and more efficient ways for Workers to connect to databases on the backend — you can sign up here to join the waitlist for access to Database Connectors and Socket Workers. We are excited to work with early users, as well as our technology partners to develop, refine, and test these new capabilities.

Once released, we expect Socket Workers to blow the doors wide open on the types of intelligent distributed applications that can be deployed to the Cloudflare network edge, and we are excited to see what you build with them.

Durable Objects — now Generally Available

Post Syndicated from Greg McKeon original https://blog.cloudflare.com/durable-objects-ga/

Durable Objects — now Generally Available

Durable Objects — now Generally Available

Full Stack Week is all about how developers are embracing the power of Cloudflare’s network to build entire applications that are global by default. The promise of Workers isn’t just improved latency — it’s fundamentally different programming paradigms that make developer’s lives easier and applications more resilient.

Last year, we announced Durable Objects — Cloudflare’s approach to coordinating state across Workers running at Cloudflare’s edge. Durable Objects let developers implement previously complex applications, like collaborative whiteboarding, game servers, or global queues, in just a few lines of code.

Today, we’re announcing that Durable Objects are generally available and production-ready for you to use!

What makes Durable Objects so cool?

For many traditional applications, state coordination happens through a database. Applications built on Workers present some unique challenges for a database — namely needing to handle global scale out-of-the-box and heavy concurrency that could lead to frequent transaction rollbacks when coordinating on shared keys. Databases themselves are hard to configure and scale, especially at global scale, so developers would need to tweak their database specifically for Workers’ access patterns.

Durable Objects present a simpler paradigm: write a JavaScript class, and your application can create named instances of that class — which are guaranteed to be unique across Cloudflare’s entire network. That instance is a Durable Object — Workers (and other Durable Objects!) can send messages to it via its ID. The Durable Object processes messages in-order and on a single-thread, allowing for coordination across messages. We also provide a strongly consistent storage API, which can store key-value pairs the object needs to make durable.

Take, for example, an online document editor.  A typical architecture would save the state of the document in a database and have users persist changes there.  This makes collaboration difficult, though — how can multiple users ensure that they all see the latest copy of changes to the document?

With Durable Objects, this is a much simpler problem.  By writing a Document class, you store the state of each document in-memory in a Durable Object.  As users connect, they’ll see the latest copy of the document — and can make their changes in-sync with other users. When users leave the document, the Durable Object will leave memory and stop incurring charges, while its state is persisted durably.  There’s no networking to configure, database to manage, or autoscaling policy to implement — it all just works.

While individual objects are single-threaded, Durable Objects’ design means a collection of objects can scale effectively infinitely. An object’s lifecycle is managed for you, meaning there’s no clean-up tasks to run or systems to scale down — Durable Objects can instantly scale to hundreds of thousands of requests per second, then scale back down with no developer interaction.

What have we been building since announcing Early Access?

First, we’ve kept busy improving reliability and performance. Durable Objects are behind a number of new products being developed at Cloudflare, including powering R2 storage and Cloudflare Waiting Room.

Specifically, Waiting Room uses Durable Objects to provide a strongly consistent view of the current number of users attempting to access a given site globally.  Storing this frequently updated state in a traditional database would be difficult to scale and be significantly harder to run globally.

Our customers have also embraced Durable Objects. We’ve seen a major gaming company build their new backend architecture on Durable Objects — coordinating both individual game state and multiplayer game lobbies.  The ability to dynamically scale without managing servers or databases made Durable Objects an easy choice for them, letting them grow their game with a relatively small team.

Customers have built more applications — from status page monitors to collaborative whiteboard applications.  We’ve seen particular interest in using Durable Objects with WebSockets to create entirely responsive applications and have published a reference architecture to help customers build this out further.

We’ve also gotten better at operating the system, particularly in response to large volumes of requests. Durable Objects can now serve hundreds of thousands of requests per second across objects, and hundreds of requests on a single object, making them production-ready for even the most demanding customers.

We’ve shipped Jurisdictional Restrictions, which bring the simplicity of scaling Durable Objects to compliance by letting developers tag a Durable Object with a region, ensuring it processes and stores data in that region.

We added a cache in front of Durable Object storage requests, making read and write operations blazing fast while also making it easier to write correct concurrent code.

Beyond that, we’ve made a number of smaller improvements that included simplified uploads of new Durable Objects classes, a UI in the dashboard and support for `wrangler dev` and `wrangler tail` for live debugging.

What’s next for Durable Objects?

We’re continuing to work on making Durable Objects the easiest platform for building infinitely-scalable applications.

Today, Durable Objects scale well when objects can be partitioned, but individual objects are limited to a single execution thread. Many workloads could be scaled across multiple threads, providing read-only access to an object’s state and choosing to only synchronize when mutating state. We’re calling this replication for Durable Objects, and we’re working on it now.

We’re also working on adding an API for a guaranteed callback to a Durable Object, letting developers wake a Durable Object at a specified time in the future to run a function. This simplifies lifecycle management, making it easy to build primitives like reliable queues on top of Durable Objects.

We’re also looking into how to better geo-distribute objects, including the vision for automatic migration of objects we talked about in our initial announcement.

Have something you’d like to see us add? Shoot us an email or a tweet!

How do I use Durable Objects?

Head over to the Cloudflare Dashboard to enable Durable Objects and opt in to pricing, then check out our sample chat application and reference architecture here!

Happy building!

Workers adds support for two modern data platforms: MongoDB Atlas and Prisma

Post Syndicated from Greg McKeon original https://blog.cloudflare.com/workers-adds-support-for-two-modern-data-platforms-mongodb-atlas-and-prisma/

Workers adds support for two modern data platforms: MongoDB Atlas and Prisma

Workers adds support for two modern data platforms: MongoDB Atlas and Prisma

We’ve heard a common theme over the past year: developers want to build more of their applications on Workers. With built-in global deployments, insane scalability and the flexibility of JavaScript, more and more applications are choosing to build on our global platform.

To do so, developers need access to data. Our strategy for data on Workers has had three parts:

  • One, to provide first-party solutions that are designed for infinite scale, like Workers KV and Durable Objects.
  • Two, to support a wide array of NoSQL databases that connect over HTTP, and to begin to build connections to data where it already lives today with TCP Database Connectors.
  • Three, to partner with best-of-breed data companies to bring their capabilities to the Workers platform.

Today we’re excited to announce that, in addition to our existing partners Fauna and Macrometa, Cloudflare Workers has added support for Prisma and MongoDB Atlas. These data platforms are heavily demanded by developers — Prisma’s modern ORM brings support for Postgres, SQL Server, MySQL via their Prisma client, while MongoDB topped the ranks of integrations most demanded by our users.

Both clients are available in their respective mainline git repositories, realm-web for MongoDB and prisma for Prisma. You can begin using them right away by importing them into your Workers.

What’s great about MongoDB?

MongoDB is a database loved by developers — its document model makes it easy to start with, while transactions and a scale-out distributed systems architecture let it scale with your application.

MongoDB brings a robust query language, MQL, to developers on the Workers platform, supporting rich aggregations right within the database. MongoDB support is provided via the Realm SDK, which integrates directly with MongoDB Atlas — the easiest way to run MongoDB.

MongoDB Atlas also includes Global Cluster, perfect for creating a low-latency, geo-distributed MongoDB database to back your Workers.

Together with MongoDB, we’ve put together a demo application that you can play with on MongoDB’s blog. Check it out and let us know if you have questions!

What’s great about Prisma?

Prisma is an ORM, or object-relational mapper, which transforms entries in a database into objects in code. What makes Prisma great is its ability to abstract away the complexities of working with the database — Prisma handles type-safety, schema migrations, query optimization and the actual interactions between your code and the database. Like Workers does for compute at the edge, Prisma makes managing your database dead-simple.

Prisma currently supports Postgres, MySQL, SQL Server, SQLite and MongoDB. These databases can be existing on any cloud provider or can be spun up on-demand on Heroku.

Prisma integrates with Workers via the Prisma Data Proxy. After setting up the Proxy, you can import the Prisma client into your Workers script and define a schema to begin using any of the supported databases!

What’s next?

Alongside our existing partnerships with Macrometa and Fauna, we’re excited to add the MongoDB and Prisma integrations to Worker’s growing library. If you have a data platform you’d like to use with Workers, reach out to us, and we’ll make it happen!

The collective thoughts of the interwebz