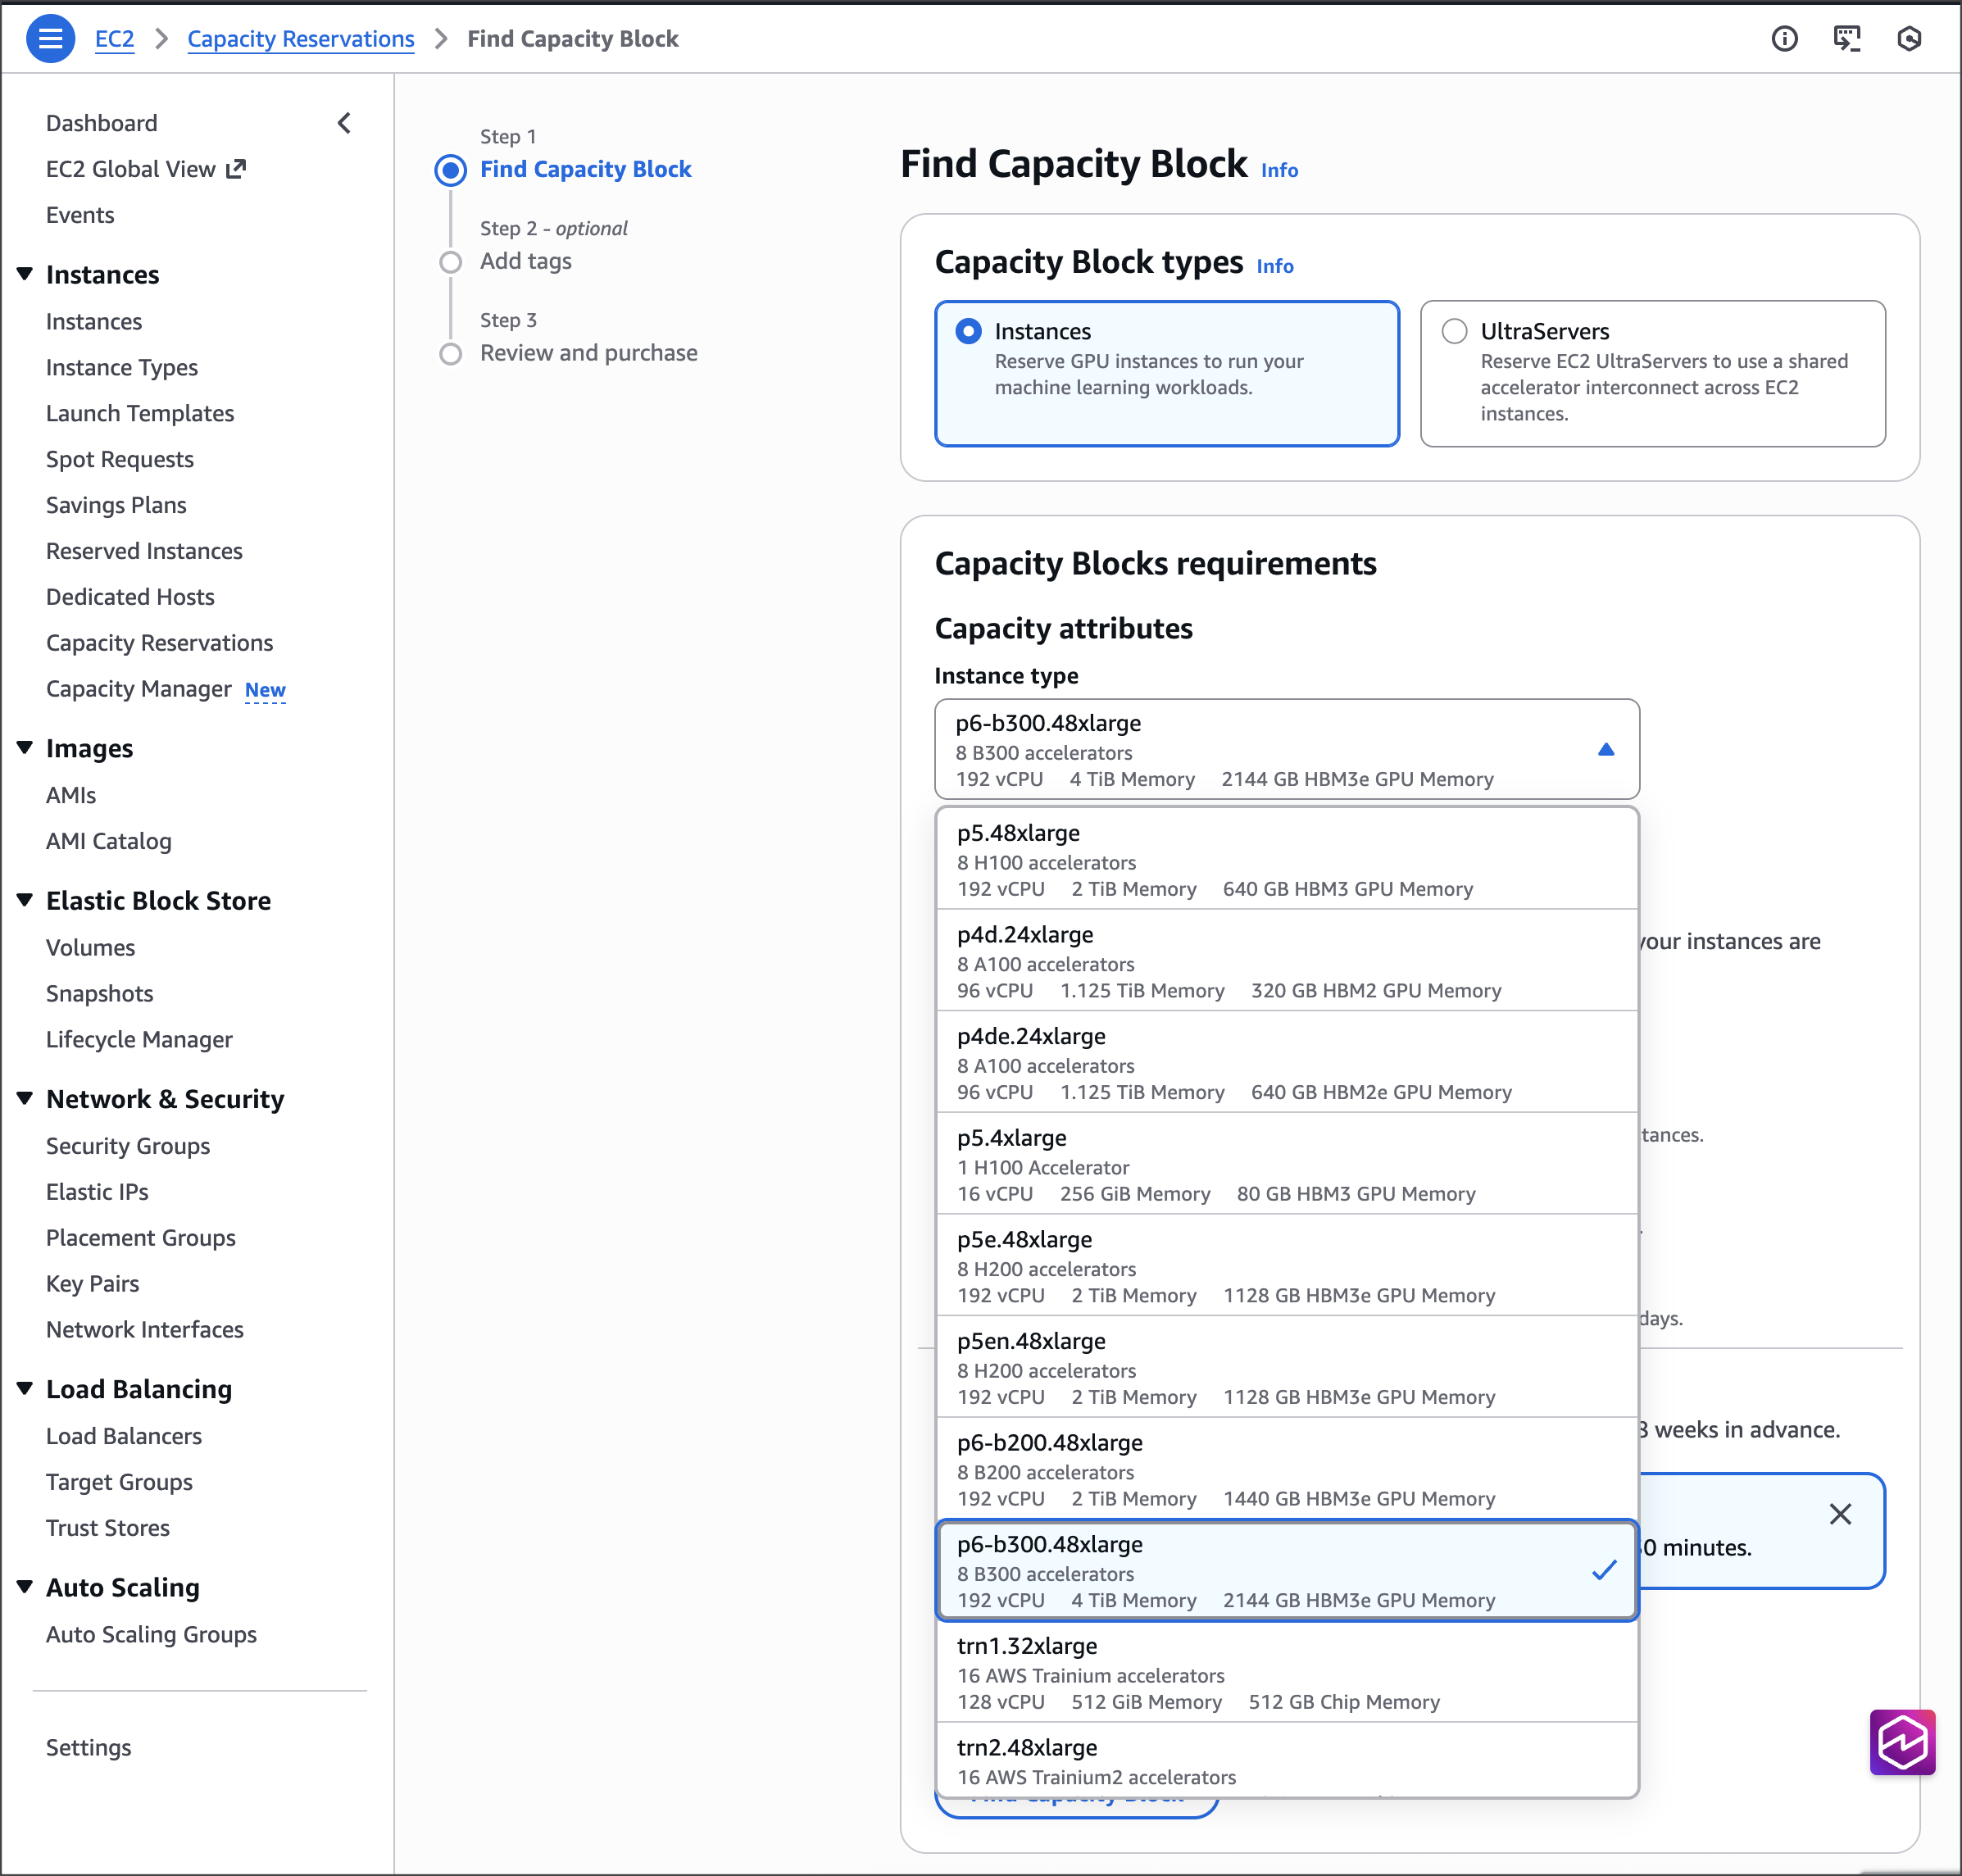
Today, we’re announcing the general availability of Amazon Elastic Compute Cloud (Amazon EC2) P6-B300 instances, our next-generation GPU platform accelerated by NVIDIA Blackwell Ultra GPUs. These instances deliver 2 times more networking bandwidth, and 1.5 times more GPU memory compared to previous generation instances, creating a balanced platform for large-scale AI applications.
With these improvements, P6-B300 instances are ideal for training and serving large-scale AI models, particularly those employing sophisticated techniques such as Mixture of Experts (MoE) and multimodal processing. For organizations working with trillion-parameter models and requiring distributed training across thousands of GPUs, these instances provide the perfect balance of compute, memory, and networking capabilities.
Improvements made compared to predecessors The P6-B300 instances deliver 6.4Tbps Elastic Fabric Adapter (EFA) networking bandwidth, supporting efficient communication across large GPU clusters. These instances feature 2.1TB of GPU memory, allowing large models to reside within a single NVLink domain, which significantly reduces model sharding and communication overhead. When combined with EFA networking and the advanced virtualization and security capabilities of AWS Nitro System, these instances provide unprecedented speed, scale, and security for AI workloads.
The specs for the EC2 P6-B300 instances are as follows.
Instance size
VCPUs
System memory
GPUs
GPU memory
GPU-GPU interconnect
EFA network bandwidth
ENA bandwidth
EBS bandwidth
Local storage
P6-B300.48xlarge
192
4TB
8x B300 GPU
2144GB HBM3e
1800 GB/s
6.4 Tbps
300 Gbps
100 Gbps
8x 3.84TB
Good to know In terms of persistent storage, AI workloads primarily use a combination of high performance persistent storage options such as Amazon FSx for Lustre, Amazon S3 Express One Zone, and Amazon Elastic Block Store (Amazon EBS), depending on price performance considerations. For illustration, the dedicated 300Gbps Elastic Network Adapter (ENA) networking on P6-B300 enables high-throughput hot storage access with S3 Express One Zone, supporting large-scale training workloads. If you’re using FSx for Lustre, you can now use EFA with GPUDirect Storage (GDS) to achieve up to 1.2Tbps of throughput to the Lustre file system on the P6-B300 instances to quickly load your models.
Available now The P6-B300 instances are now available through Amazon EC2 Capacity Blocks for ML and Savings Planin the US West (Oregon) AWS Region. For on-demand reservation of P6-B300 instances, please reach out to your account manager. As usual with Amazon EC2, you pay only for what you use. For more information, refer to Amazon EC2 Pricing. Check out the full collection of accelerated computing instances to help you start migrating your applications.
AWS Lambda now supports Python 3.14 as both a managed runtime and container base image. Python is a popular language for building serverless applications. Developers can now take advantage of new features and enhancements when creating serverless applications on Lambda.
The Python 3.14 runtime supports Powertools for AWS Lambda (Python), a developer toolkit that helps you to implement serverless best practices. Powertools includes observability, batch processing, AWS Systems Manager Parameter Store integration, idempotency, feature flags, Amazon CloudWatch metrics, structured logging, and more.
This blog post highlights notable Python language updates, Python Lambda runtime features and support, and how you can use the new Python 3.14 runtime in your serverless applications.
New Python features
Python 3.14 contains the following notable updates.
Template strings literal
Template strings introduce a new mechanism for custom string processing using the t prefix instead of f for f-strings. Unlike f-strings that return a simple string, t-strings return an object representing both static and interpolated parts.
Evaluation of type annotations
With the implementation of PEP 649, Python 3.14 defers type annotation evaluation until required. This reduces import time overhead and resolves forward reference issues.
Improved Error Messages
The interpreter now provides helpful suggestions when it detects typos in Python keywords. These include incorrect control flow structures, misused conditional expressions, string syntax errors, incompatible type usage in dicts/sets, and context manager protocol mismatches.
whille :

Traceback (most recent call last):
  File "<stdin>", line 1
    whille :
    ^^^^^^
SyntaxError: invalid syntax. Did you mean 'while'?
Standard library
The standard library includes a new compression.zstd module that provides native support for zstandard compression, offering better compression ratios and faster decompression compared to existing algorithms.
Python 3.14 also includes improved error messages and enhanced asyncio introspection capabilities.
Lambda runtime changes
The Lambda Python runtime contains the following changes.
Python 3.14 features that are not available
Python 3.14 includes some features that are not enabled for the Lambda managed runtime or base images. These features must be enabled when the Python runtime is compiled and cannot be enabled via an execution-time flag. The just-in-time (JIT) compiler is not available in the Lambda runtime because it’s still in an experimental phase. Free-threaded mode, running Python without the global interpreter lock, is supported in Python 3.14, but it is not enabled in the Lambda runtime due to potential performance impact. To use these features in Lambda, you can deploy your own Python runtime build with these features enabled, using a container image or custom runtime.
Amazon Linux 2023
As with the Python 3.12 and Python 3.13 runtimes, the Python 3.14 runtime is based on the provided.al2023 runtime, which is based on the Amazon Linux 2023 minimal container image. The Amazon Linux 2023 minimal image uses microdnf as a package manager, symlinked as dnf. This replaces the yum package manager used in Python 3.11 and earlier AL2-based images. If you deploy your Lambda functions as container images, you must update your Dockerfiles to use dnf instead of yum when upgrading to the Python 3.14 base image from Python 3.11 or earlier base images.
You can use Python 3.14 for your Lambda functions in the AWS Management Console, an AWS Lambda container image, or the AWS Cloud Development Kit (AWS CDK).
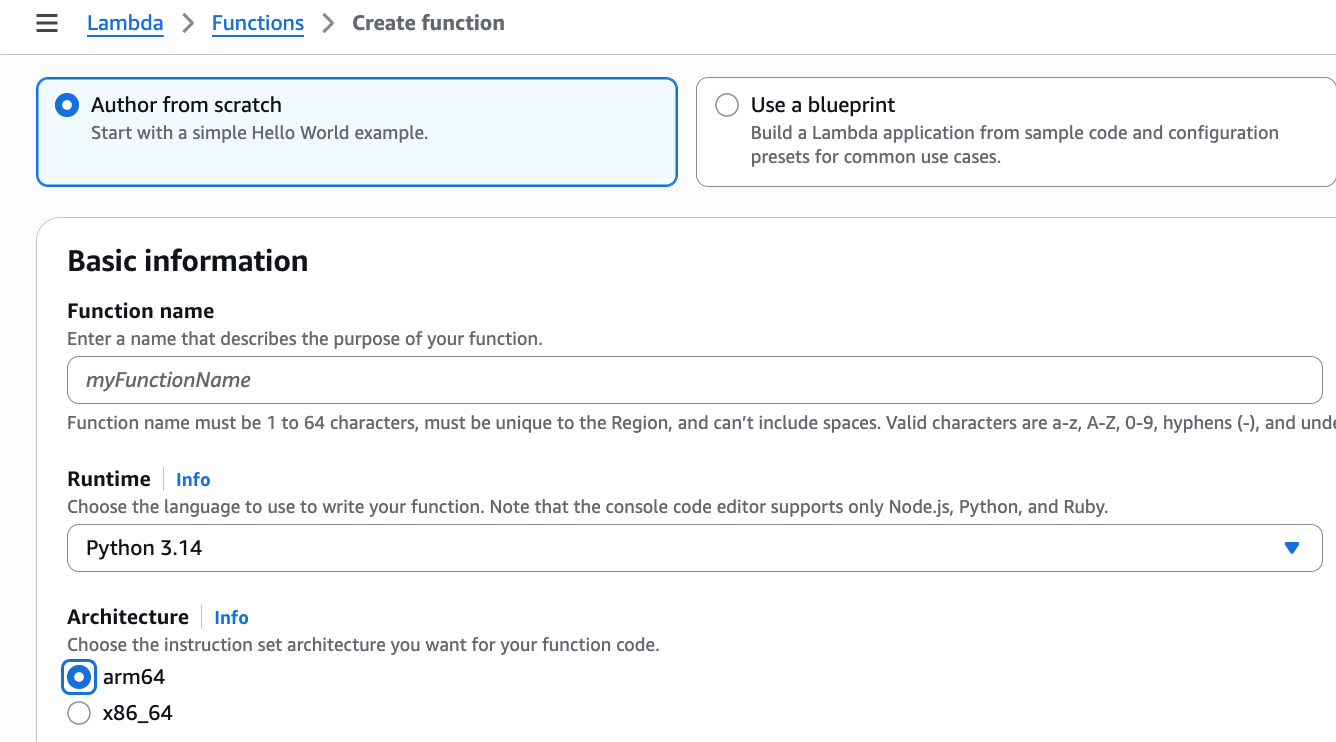
AWS Management Console
To use the Python 3.14 runtime to develop your Lambda functions, specify a runtime parameter value of Python 3.14 when creating or updating a function. On the Create Function page of the AWS Lambda console, Python 3.14 is available in the Runtime dropdown menu.
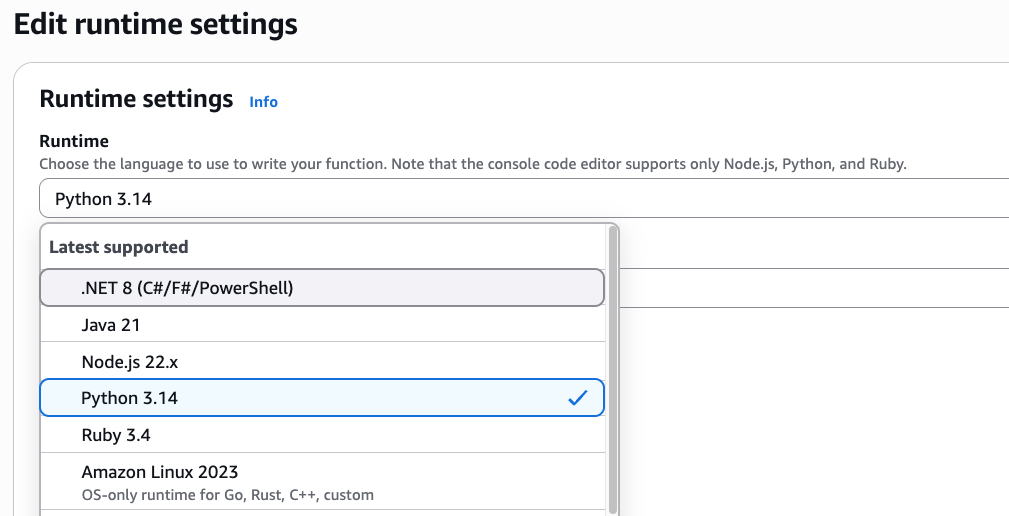
To update an existing Lambda function to Python 3.14, navigate to the function in the Lambda console and choose Edit in the Runtime settingspanel. The new version of Python is available in the Runtime dropdown menu.
Upgrading a function to Python 3.14
To upgrade a function to Python 3.14, check your code and dependencies for compatibility with Python 3.14, run tests, and update as necessary. Consider using generative AI coding assistants like Amazon Q Developer, Amazon Q Developer for CLI, or Kiro to help with upgrades.
AWS Lambda container image
Change the Python base image version by modifying the FROM statement in your Dockerfile:
FROM public.ecr.aws/lambda/python:3.14
# Copy function code
COPY lambda_handler.py ${LAMBDA_TASK_ROOT}
AWS Serverless Application Model (AWS SAM)
In AWS SAM set the Runtime attribute to python3.14 to use this version.
AWSTemplateFormatVersion: '2010-09-09'
Transform: AWS::Serverless-2016-10-31
Description: Simple Lambda Function
  MyFunction:
    Type: AWS::Serverless::Function
    Properties:
      Description: My Python Lambda Function
      CodeUri: my_function/
      Handler: lambda_function.lambda_handler
      Runtime: python3.14
AWS SAM supports generating this template with Python 3.14 for new serverless applications using the sam init command. Refer to the AWS SAM documentation.
AWS Cloud Development Kit
In the AWS CDK, set the runtime attribute to lambda.Runtime.PYTHON_3_14 to use this version.
In Python CDK:
from constructs import Construct
from aws_cdk import ( App, Stack, aws_lambda as _lambda )
class SampleLambdaStack(Stack):
    def __init__(self, scope: Construct, id: str, **kwargs) -> None:
        super().__init__(scope, id, **kwargs)

        base_lambda = _lambda.Function(self, 'python314LambdaFunction',
                                       handler='lambda_handler.handler',
                                    runtime=_lambda.Runtime.PYTHON_3_14,
                                 code=_lambda.Code.from_asset('lambda'))
In TypeScript CDK:
import * as cdk from 'aws-cdk-lib';
import * as lambda from 'aws-cdk-lib/aws-lambda'
import * as path from 'path';
import { Construct } from 'constructs';
export class SampleLambdaStack extends cdk.Stack {
  constructor(scope: Construct, id: string, props?: cdk.StackProps) {
    super(scope, id, props);
    // The code that defines your stack goes here
    // The python3.14 enabled Lambda Function
    const lambdaFunction = new lambda.Function(this, 'python314LambdaFunction', {
      runtime: lambda.Runtime.PYTHON_3_14,
      memorySize: 512,
      code: lambda.Code.fromAsset(path.join(__dirname, '/../lambda')),
      handler: 'lambda_handler.handler'
    })
  }
}
At launch, new Lambda runtimes receive less usage than existing established runtimes. This can result in longer cold start times due to reduced cache residency within internal Lambda sub-systems. Cold start times typically improve in the weeks following launch as usage increases. As a result, AWS recommends not drawing conclusions from side-by-side performance comparisons with other Lambda runtimes until the performance has stabilized. Since performance is highly dependent on workload, customers with performance-sensitive workloads should conduct their own testing instead of relying on generic test benchmarks.
Conclusion
Lambda now supports Python 3.14 as a managed language runtime to help developers build more efficient, powerful, and scalable serverless applications. Python 3.14 language additions include data model improvements, typing changes, and updates to the standard library. The Lambda managed runtime does not include the option to disable the global interpreter lock (GIL) or use the experimental JIT compiler.
You can build and deploy functions using Python 3.14 using the AWS Management Console, AWS CLI, AWS SDK, AWS SAM, AWS CDK, or your choice of infrastructure as code tool. You can also use the Python 3.14 container base image if you prefer to build and deploy your functions using container images.
Try the Python 3.14 runtime in Lambda today and experience the benefits of this updated language version.
Version
5.0 of the Blender animation system has been released. Notable
improvements include improved color management, HDR capabilities, and
a new storyboarding template. See the release
notes for a lengthy list of new features and changes, and the bugfixes
page for the 588 commits that fixed bugs in Blender 4.5 or older.
AWS Systems Manager Session Manager is a fully managed service that provides secure, interactive, one-click access to your Amazon Elastic Compute Cloud (Amazon EC2) instances, edge devices, and virtual machines (VMs) through a browser-based shell or AWS Command Line Interface (AWS CLI), without requiring open inbound ports, bastion hosts, or SSH keys. Session Manager helps you maintain security compliance and controlled access while providing users with access to managed nodes. When starting a session, you must specify a preferences document (known as the Session Manager preferences document) to set the session parameters.
While providing users with access to managed nodes, managing these preferences consistently across multiple AWS Regions and accounts in a large organization can be challenging. Organizations often need to maintain standardized security settings, logging configurations, and session controls across their entire AWS footprint. Manual configuration of these preferences in each Region and account is not only time-consuming but also prone to human error and can lead to security gaps or compliance violations. Additionally, tracking and maintaining these configurations becomes increasingly complex as the organization scales.
You can use Session Manager to control various session options including data encryption for session data in transit and session logs at rest, session duration, and logging. For example, you can specify whether to store session log data in an Amazon Simple Storage Service (Amazon S3) bucket or Amazon CloudWatch Logs log group. In this post, I demonstrate how to manage Session Manager preferences across your organization using AWS CloudFormation StackSets. You can use CloudFormation StackSets to manage resources and configurations, such as Session Manager preferences, across different AWS accounts and Regions using standardized templates to maintain consistent security and compliance standards across your entire AWS infrastructure.
Prerequisites
You need to meet the following prerequisites to deploy the solution in this post:
Basic understanding of CloudFormation
Trusted access enabled between CloudFormation StackSets and AWS Organizations
Access to an AWS management account or StackSet delegated admin account
The Session Manager environment has some additional prerequisites:
For EC2 instances with internet access, allow HTTPS (port 443) outbound traffic to:
ec2messages.<region>.amazonaws.com
ssm.<region>.amazonaws.com
ssmmessages.<region>.amazonaws.com
Note: <region> represents the actual Region where you are deploying your instances.
Additional endpoints required for specific features:
For CloudWatch Logs integration: logs.<region>.amazonaws.com
For Amazon S3 log storage: s3.<region>.amazonaws.com
For session data encryption: kms.<region>.amazonaws.com
Note: For EC2 instances without internet access, you must configure virtual private cloud (VPC) endpoints to maintain connectivity with Systems Manager and related services.
SSM Agent requirements:
Minimum version 2.3.68.0 for basic session connectivity
Version 3.0.222.0 or later for port forwarding and SSH sessions
Note: Many AWS-provided and trusted third-party Amazon Machine Images (AMIs) come with the SSM Agent pre-installed. For more information, see Find AMIs with the SSM Agent preinstalled.
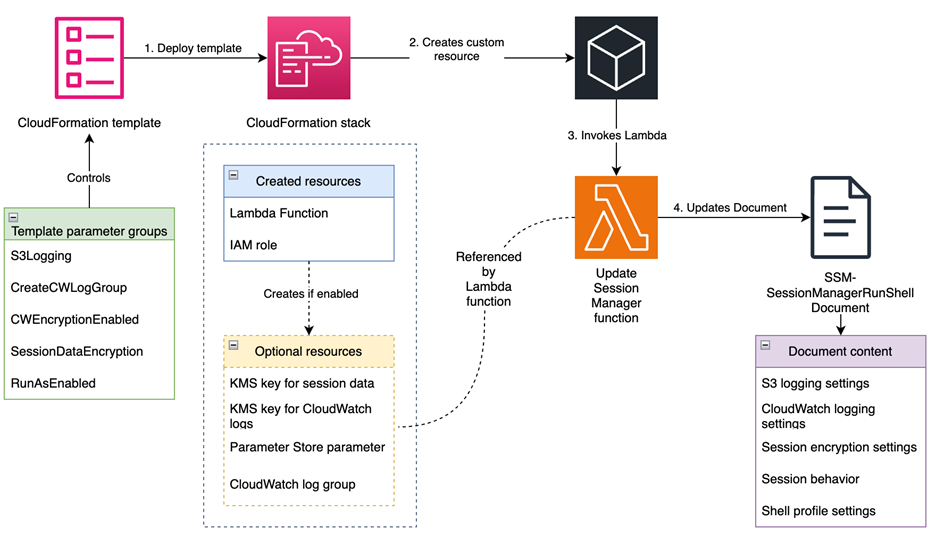
This solution, shown in Figure 1, automatically configures the SSM-SessionManagerRunShell document with customizable preferences that govern how Session Manager behaves across your AWS accounts. It creates resources for logging, encryption, and session controls, and updates the SSM-SessionManagerRunShell document with these preferences. The document is updated by an AWS Lambda function that helps make sure that the preferences are correctly applied. It transforms the default Session Manager preferences document to meet your enterprise compliance requirements. Changes are deployed using CloudFormation template provided in the GitHub repository. The solution supports multiple logging destinations, encryption options, and session controls to meet various security and compliance requirements.
Figure 1: Solution overview
Walkthrough
To deploy the solution, complete the following steps.
Run the following command in your terminal: git clone https://github.com/aws-samples/<repo-link>
Step 2: Create the CloudFormation StackSet
In this step, you deploy the solution’s resources by creating a CloudFormation StackSet using the provided CloudFormation template. Sign in to your management account or StackSet delegated admin account. To create the stack, follow the steps in Get started with StackSets using a sample template. Create the StackSet in each of the accounts and Regions where you plan to implement the solution. Note that you need to provide values for the parameters defined in the template to deploy the stack. The following table lists the parameters that you need to provide.
Parameter
Description
S3Logging
Enables storing session logs to an S3 bucket.
S3BucketName
Name of the S3 bucket for session logs. The bucket must exist or the deployment will fail.
S3KeyPrefix
Key prefix for session logs, will be appended by account ID and Region
S3EncryptionEnabled
If set to true, the S3 bucket you specified in the s3BucketName input must be encrypted.
CreateCWLogGroup
Creates the CloudWatch log group. If set to true, a CloudWatch log group will be created; if not, the log group name passed is used.
CWLogGroupName
The name of the CloudWatch log group you want to send session logs to.
CWEncryptionEnabled
If set to true, the CloudWatch log group you specified in the cwLogGroupName input must be encrypted.
CWStreamingEnabled
If set to true, a continual stream of session data logs is sent to the log group.
SessionDataEncryption
If set to true, session data is encrypted with a key created by the stack.
RunAsEnabled
If set to true, sessions are run using another user than ssm-user. The Run As feature is only supported for connecting to Linux and macOS managed nodes.
RunAsDefaultUser
The name of the user account to start sessions with on Linux and macOS managed nodes when the runAsEnabled input is set to true.
IdleSessionTimeout
The amount of time of inactivity you want to allow before a session ends. This input is measured in minutes.
MaxSessionDuration
The maximum amount of time you want to allow before a session ends. This input is measured in minutes.
WinShellProfile
The shell preferences, environment variables, working directories, and commands you specify for sessions on Windows Server managed nodes.
LinuxShellProfile
The shell preferences, environment variables, working directories, and commands you specify for sessions on Linux and macOS managed nodes.
Step 3: Update your EC2 instance profiles with proper permissions
Depending on the parameter values you pass when deploying the template, you need to update your EC2 instance profiles with proper permissions. For example, if you have enabled session data and session log encryption, you need to add the following policy to your instance profiles.
Note: If you enable S3 logging, you need to add the required permissions for that as well. See Configure a central S3 bucket for Session Manager logging article on AWS re:Post for more information about how to properly configure your S3 bucket and EC2 instance profile for centralized logging. Same-account logging follows a similar pattern.
Step 4: Verify the solution implementation
You can verify that the Session Manager preferences are correctly configured across your environment. Here’s a systematic approach to validation:
Verify preference configuration
Through the AWS Management Console, navigate to AWS Systems Manager Session Manager, choose Preferences and review the configured Session Manager preferences. Alternatively, verify the configuration through AWS CLI using:
Verify the encryption configuration by starting a new session. If session data encryption is enabled, you should see the message This session is encrypted using AWS KMS when the session begins.
For CloudWatch logging verification, navigate to the CloudWatch console and access the Log groups section. Confirm that your specified log group exists and KMS encryption is enabled if you configured it during deployment. Execute some commands in your session and observe the real-time log streaming to your configured log group.
To verify S3 logging, establish a session and execute several commands. Terminate the session and check your configured S3 bucket for the session logs. Remember that S3 logs are only generated after the session is terminated.
If you enabled the RunAsEnabled option, verify the configuration by executing the whoami command in your session. The output should match your configured RunAs user.
Resources
The following is a list of resources created by this solution:
AWS::Lambda::Function (UpdateSessionManagerFunction) This resource creates a Lambda function that:
Updates the SSM-SessionManagerRunShell document with the specified preferences
Handles CloudFormation create, update, and delete events
Performs deep comparison of document contents to avoid unnecessary updates
Includes error handling and retry logic
AWS::IAM::Role (LambdaExecutionRole) This resource creates an IAM role that allows the Lambda function to:
Execute with basic Lambda permissions
Access and modify the SSM-SessionManagerRunShell document
Access SSM parameters storing session data encryption key ID
AWS::KMS::Key (SessionDataKMSKey) This conditional resource creates a KMS key for encrypting session data when SessionDataEncryption parameter is set to enabled. The key has a policy allowing key management with IAM.
AWS::KMS::Alias (SessionDataKeyAlias) This conditional resource creates a friendly alias (alias/session-manager/data) for the session data encryption key. This value cannot be changed.
AWS::SSM::Parameter (SessionKeyID) This conditional resource creates an Systems Manager parameter to store the KMS key ID for session data encryption, making it accessible to other components.
Note: The session data KMS key ID is stored in a Systems Manager parameter to decouple components and help prevent circular dependency and failures to due race conditions.
AWS::KMS::Key (SessionLogsKMSKey) This conditional resource creates a KMS key for encrypting CloudWatch logs when CWEncryptionEnabled parameter is set to enabled. The key has a policy allowing CloudWatch Logs service to use it
Note: SessionLogsKMSKey is used to encrypt logs at-rest and is not used by the SSM Agent, so your instance profile does not need to have permission to this key. Logs are encrypted in-transit and will be encrypted by CloudWatch service after they are received.
AWS::KMS::Alias (SessionLogsKeyAlias) This conditional resource creates a friendly alias (alias/session-manager/logs) for the CloudWatch Logs encryption key.
AWS::Logs::LogGroup (SessionManagerLogGroup) This conditional resource creates a CloudWatch Logs group for session logs when the CreateCWLogGroup paremeter is set to enabled. The log group:
Uses the specified name (controlled by the CWLogGroupName parameter, and defaults to ssm-sessionmanager-logs)
Sets a 90-day retention period
Uses KMS encryption if enabled
Custom::UpdateSessionManager (UpdateSessionManagerCustomResource) This custom resource invokes the Lambda function to update the SSM-SessionManagerRunShell document with the specified preferences.
Parameter groups
The following template parameters are available for customizing Session Manager behavior:
In this post, we explored how to implement and manage Session Manager preferences across your organization using CloudFormation StackSets. This solution enables centralized management of Session Manager configurations across multiple accounts and Regions from a single account, significantly simplifying the administration of remote access to your compute resources. Through automated deployment of security controls including session encryption, logging, and access restrictions, the solution helps facilitate consistent compliance with organizational security requirements while reducing manual configuration efforts and the risk of human error. As your organization grows, this solution scales seamlessly to accommodate new accounts and Regions while maintaining uniform security standards across your infrastructure.
Remember to regularly review and update your Session Manager preferences to align with evolving security requirements and organizational needs. For more information about AWS Systems Manager Session Manager, visit the official AWS documentation.
If you have feedback about this post, submit comments in the Comments section below.
Organizations need message processing systems that can prioritize critical business operations while handling routine tasks efficiently. When handling time-sensitive tasks like rush orders from key customers, critical system alerts, or multi-step business processes, you need to prioritize urgent messages while making sure other routine requests are processed reliably.
In this post, we show you how to build a priority-based message processing system using Amazon MQ for priority queuing, Amazon DynamoDB for data persistence, and AWS App Runner for serverless compute. We demonstrate how to implement application-level delays that high-priority messages can bypass, create real-time UIs with WebSocket connections, and configure dual-layer retry mechanisms for maximum reliability.
This solution addresses three critical challenges in modern data processing systems:
Implementing configurable delay processing at the application level
Supporting priority-based message routing that respects business requirements
Providing real-time feedback to users through WebSocket connections
The use of AWS managed services reduces operational complexity, so teams can focus on business logic rather than infrastructure management. Message handling with priority-based processing makes sure operations receive attention while routine tasks are processed in the background. Users will experience status updates that provide visibility into their requests, while retry mechanisms provide reliability during failures. The infrastructure as code (IaC) approach supports deployments across different environments, from development through production.
Solution overview
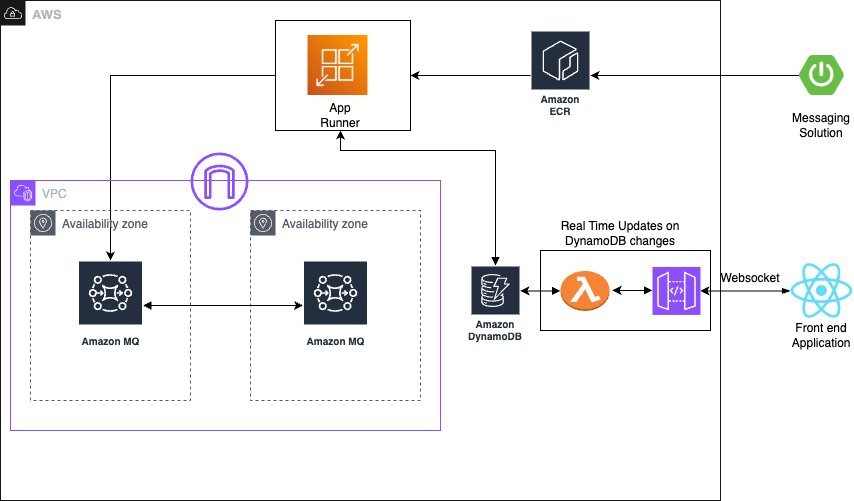
The solution consists of several AWS managed services to create a serverless, priority-based message processing system with real-time user feedback. The architecture implements intelligent routing based on three message priority levels, to make sure critical messages receive immediate processing:
High-priority path – Messages bypass delays and queue immediately with JMS priority 9
Standard-priority path – Messages undergo configured delays before queuing with JMS priority 4
Low-priority path – Messages process after all higher priority messages with JMS priority 0
The following diagram illustrates this architecture.
The solution uses the following AWS managed services to deliver a scalable, serverless architecture:
AWS App Runner is a fully managed container application service that automatically builds, deploys, and scales containerized applications. It provides automatic scaling based on traffic, built-in load balancing and HTTPS, seamless integration with container registries, and zero infrastructure management overhead.
Amazon MQ is a managed message broker service for Apache ActiveMQ that offers priority-based message queuing, automatic failover for high availability, message persistence and durability, and JMS protocol support for enterprise applications.
Amazon DynamoDB is a fully managed NoSQL database service providing single-digit millisecond performance at any scale, automatic scaling with on-demand pricing, built-in security and backup capabilities, and global tables for multi-Region deployments.
The system uses JMS priority levels with High=9, Medium=4, and Low=0 for automatic ordering, combined with conditional delay processing based on priority classification. Amazon MQ provides reliable message delivery and persistence with dead-letter queue (DLQ) configuration for failed message handling.
Asynchronous delay processing uses CompletableFuture implementation for non-blocking delays, thread pool management for concurrent processing, graceful error handling with retry mechanisms, and configurable delay periods per message type to optimize resource utilization. For real-time status updates, the solution provides WebSocket connections for bidirectional communication, Amazon DynamoDB Streams for change data capture (CDC), comprehensive status tracking throughout the processing lifecycle, and a React frontend integration for live updates, so users have complete visibility into their message processing status.
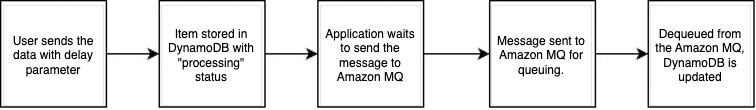
The standard priority messaging flow (shown in the following diagram) handles messages with configurable delays using JMS asynchronous processing capabilities. Messages wait for their specified delay period before entering the Amazon MQ queue, where they’re processed.
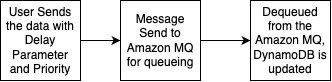
The high-priority messaging flow (shown in the following diagram) provides an express lane for critical messages. These messages skip the delay mechanism entirely and proceed directly to the queue, providing immediate processing for time-sensitive operations.
To make it even more straightforward to get started, we’ve prepared an example application that you can use to observe the Amazon MQ behavior with varying message volumes. You can find the source code repository, IaC implementation, and instructions to run the sample on GitHub.
In the following sections, we walk you through deploying the complete processing system.
Prerequisites
Make sure you have the following tools, permissions, and knowledge to successfully deploy the priority-based message processing system. You must have an active AWS account with the following configurations:
To successfully implement this solution, you should have basic familiarity with the following:
Spring Boot applications
Message queue concepts
WebSocket protocols
React development
Configure the infrastructure stack
This step involves creating the core AWS services using the AWS Cloud Development Kit (AWS CDK). This modular approach enables independent stack management and environment-specific configurations.
In this step, we create the Spring Boot application with priority-based message processing capabilities. First, we configure the application.properties file to incorporate environment variables, including AWS credentials, AWS Regions, and other configuration parameters such as log levels into the application and business logic implementation. Next, we implement the message service using a JMS template with comprehensive error handling, followed by enhancing the JMS configuration with connection pooling for improved performance.
The following code illustrates an example message service implementation:
// Example message service implementation
@Service
public class MessageService {
    @Autowired
    private JmsTemplate jmsTemplate;

    public void sendPriorityMessage(Message message) {
jmsTemplate.send(session -> {
    Message jmsMessage = session.createTextMessage(message.getContent());
    jmsMessage.setJMSPriority(message.getPriority());
    return jmsMessage;
});
    }
}
For proper timestamp update implementation, we integrate the DynamoDB SDK service with caching capabilities. Finally, after implementing the REST controller for the API with asynchronous processing support, we can deploy the message processing application. This implementation includes Java code application-level delay processing for demonstration purposes. Although this approach effectively showcases the priority-based message routing capabilities and real-time WebSocket updates in our demo environment, AWS recommends using Amazon MQ delay processing features for production workloads. For production implementations, use Amazon MQ delay and scheduling capabilities instead of application-level delays through features like Amazon MQ delay queues, ActiveMQ scheduling features, and appropriate message Time-to-Live (TTL) configurations.
The following code is an example snippet showcasing the Amazon MQ feature:
// Create connection factory with Amazon MQ endpoint
ActiveMQConnectionFactory factory = new ActiveMQConnectionFactory(brokerUrl);
factory.setUserName("admin");
factory.setPassword("your-password");
try (Connection connection = factory.createConnection();
     Session session = connection.createSession(false, Session.AUTO_ACKNOWLEDGE)) {

    // Create destination and producer
    Destination destination = session.createQueue(queueName);
    MessageProducer producer = session.createProducer(destination);

    // Create message
    TextMessage message = session.createTextMessage(messageContent);

    // Set native delay using ActiveMQ scheduled delivery
    message.setLongProperty(ScheduledMessage.AMQ_SCHEDULED_DELAY, delayMillis);

    // Optionally set priority for delayed message
    message.setJMSPriority(4);

    // Send the message - it will be delivered after the specified delay
    producer.send(message);
}
Build and deploy the Spring Boot application to App Runner
For this step, we implement WebSocket support for real-time status updates using AWS Lambda to process DynamoDB streams and send updates to connected clients using Amazon API Gateway WebSocket connections. You can find the code snippet for this in this link
Deploy the React application to Amazon S3 and Amazon CloudFront
In this step, we create a frontend application to enable the WebSocket connection for seeing the messaging getting updated in the DynamoDB and API Gateway WebSocket connections.
Similar to the above section, here is the AWS cdk code for building the frontend for proceeding towards the validation of the solution
Validate the solution
This section provides comprehensive testing procedures to validate the priority-based message processing system.
Automated testing script
After you have completed the preceding steps, you can initiate a comprehensive testing script to validate priority processing and delay behavior:
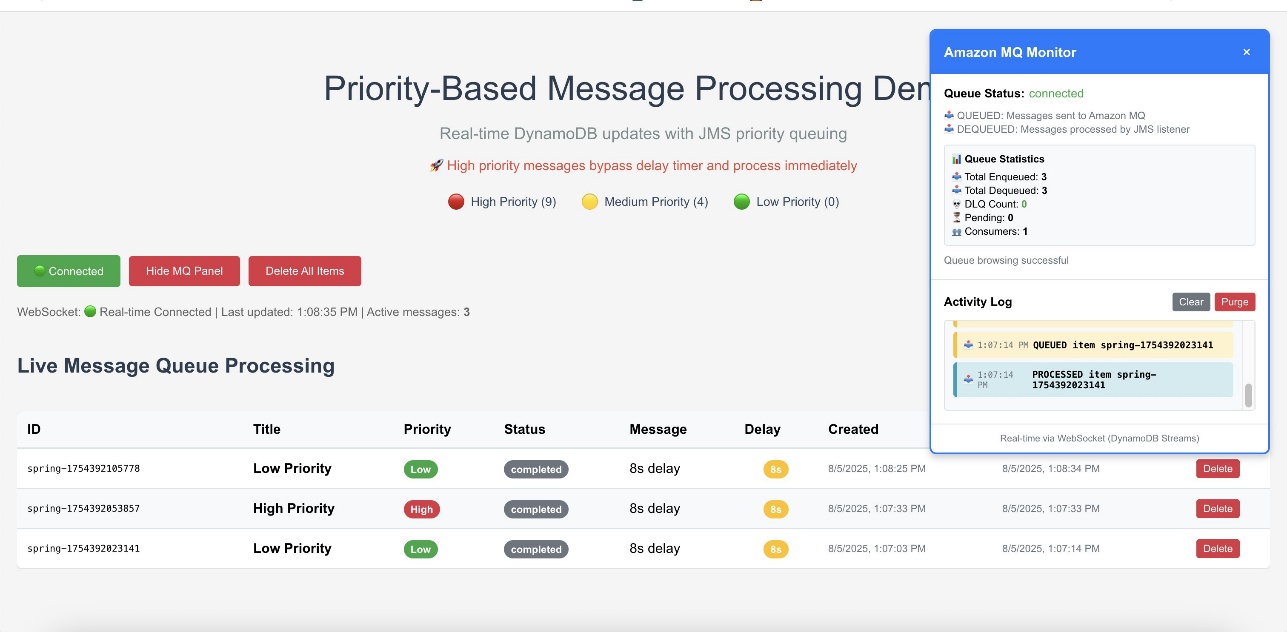
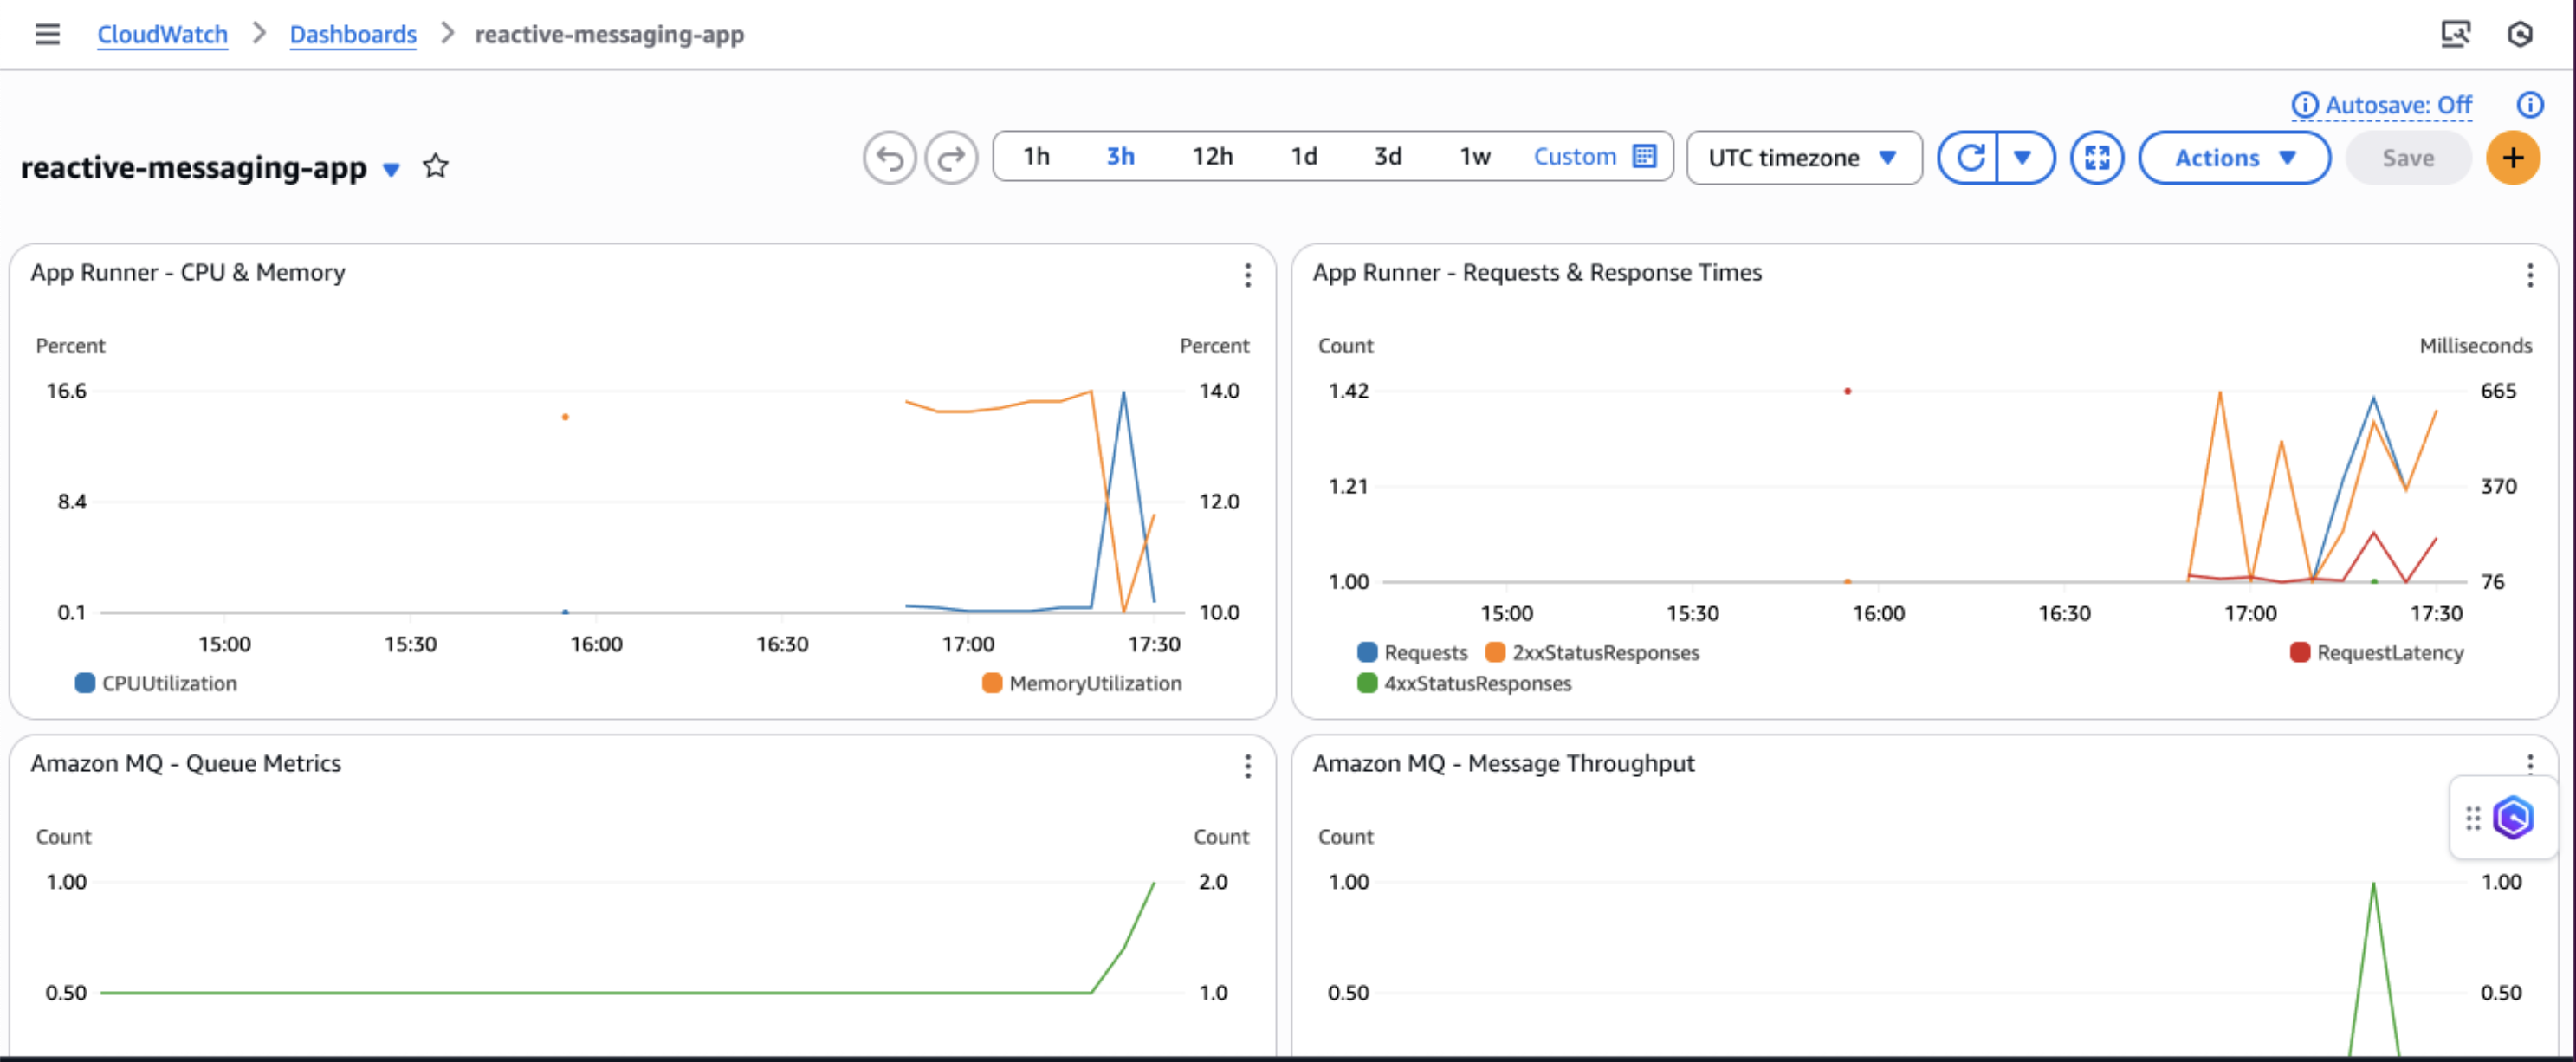
The following screenshot of the UI illustrates how the queueing mechanism can work with the real-time updates using WebSockets.
The web interface provides validation of the priority-based message processing system. Access the Amazon CloudFront URL to view the following information:
Real-time message processing with live status updates
Queue statistics showing message distribution by priority
WebSocket connection status indicating real-time connectivity
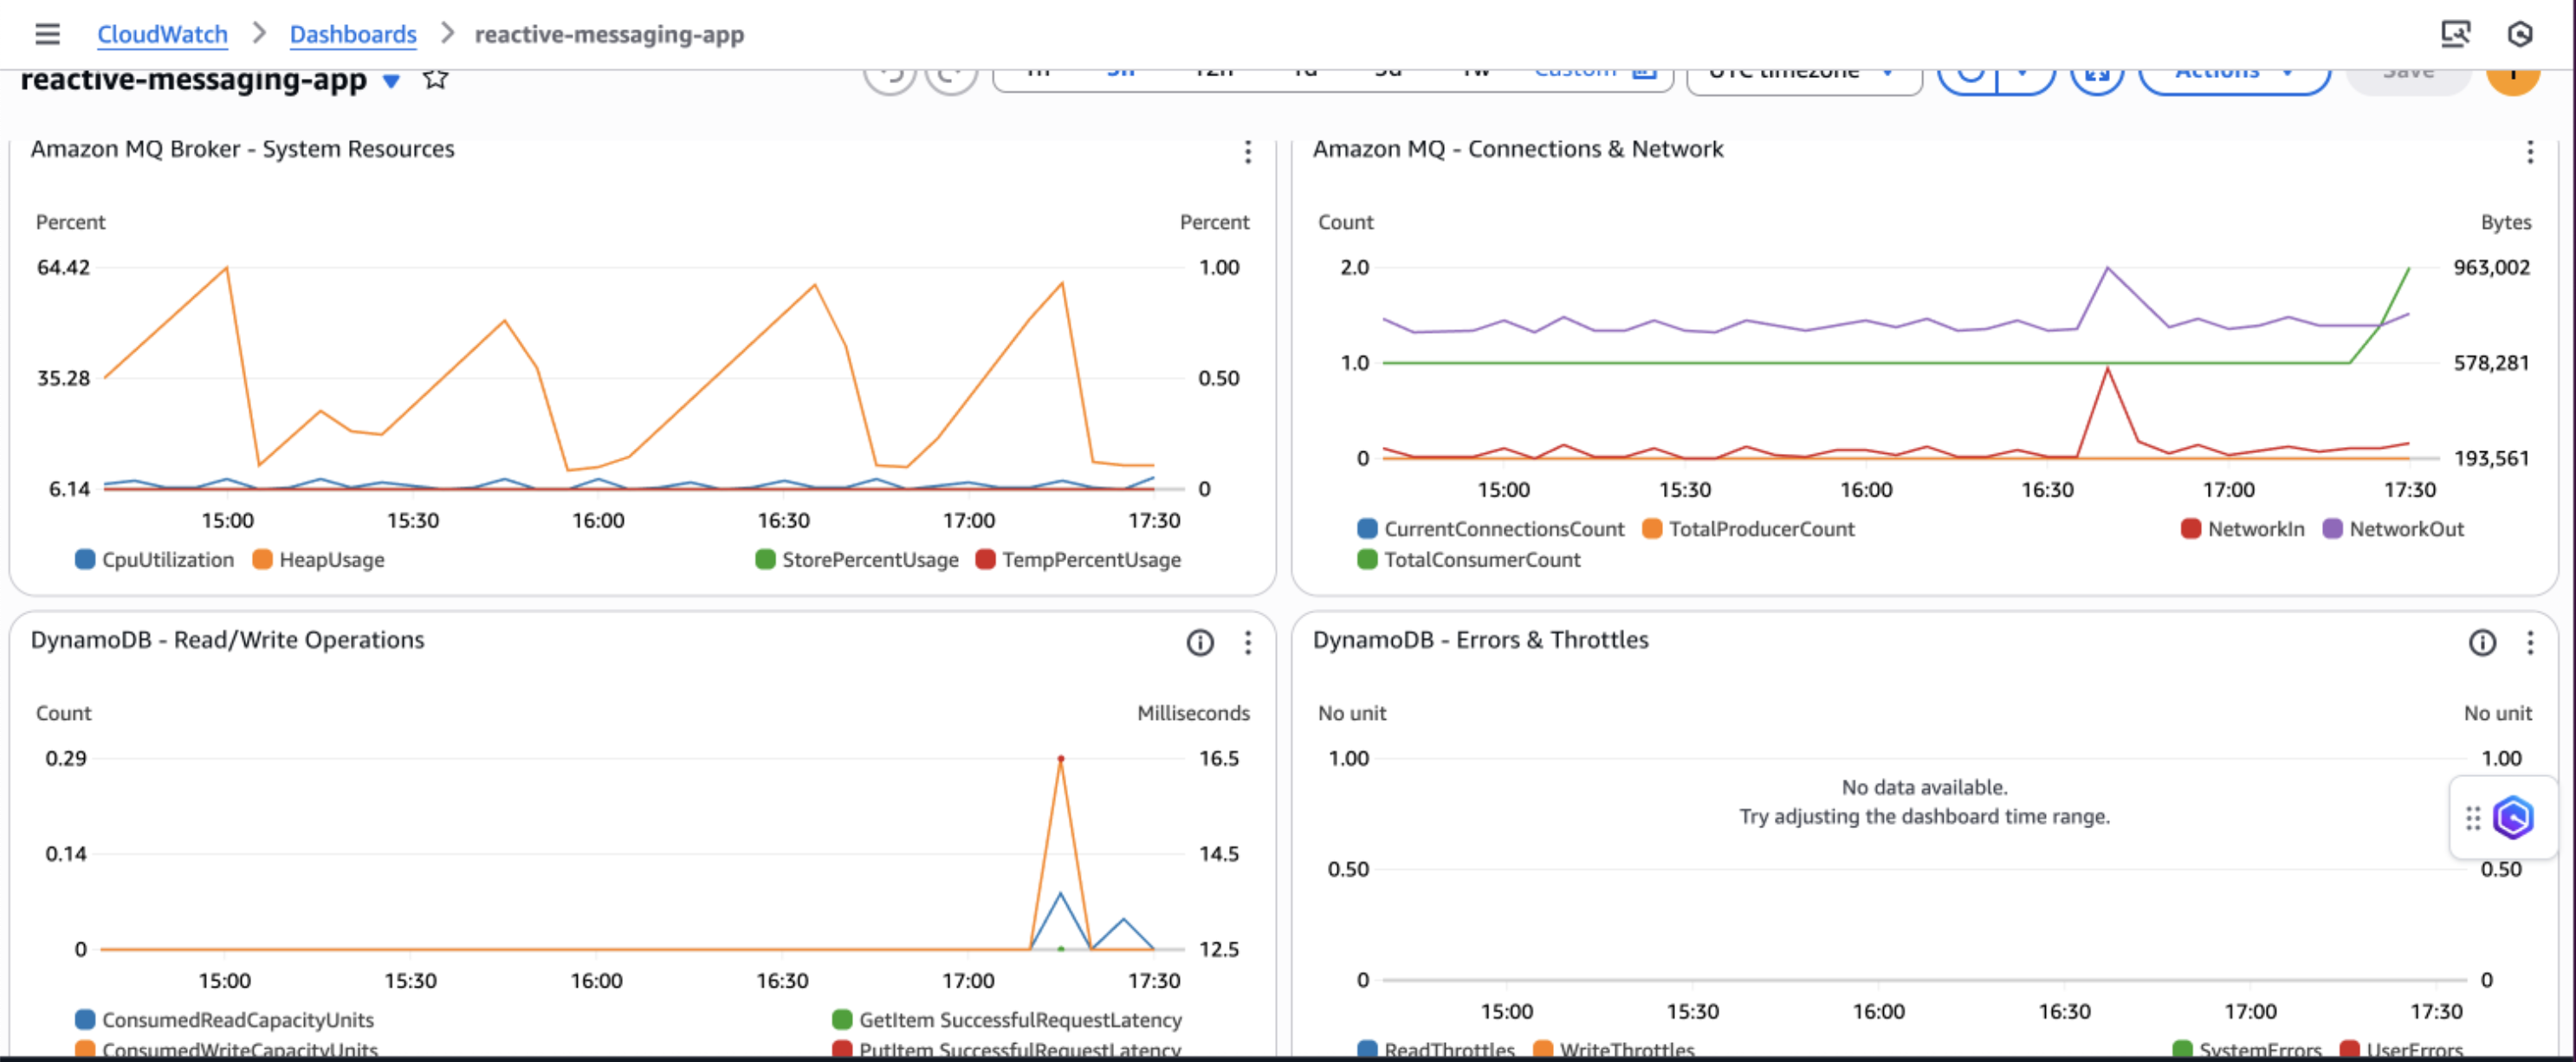
Amazon CloudWatch dashboards and alarms
AWS recommends creating Amazon CloudWatch dashboards to track your priority-based message processing system’s performance across multiple dimensions. Monitor message processing by priority levels to make sure high-priority messages are processed first and identify any bottlenecks in your priority routing logic. The following screenshot shows an example dashboard.
You can track queue depth and processing times to understand system load and latency patterns, helping you optimize resource allocation and identify when scaling is needed. Observe DynamoDB performance metrics including read/write capacity consumption, throttling events, and latency to make sure your database layer maintains optimal performance under varying loads.
Additionally, implement application-specific custom metrics such as message processing success rates, retry counts, and business-specific KPIs to gain deeper insights into your application’s behavior and make data-driven decisions for continuous improvement.
Security considerations
AWS recommends implementing comprehensive security measures to safeguard your message processing system. Start by implementing least privilege IAM policies that grant only the minimum permissions required for each component to function, making sure services like App Runner can only access the specific DynamoDB tables and Amazon MQ queues they need. Configure your network architecture using a virtual private cloud (VPC) with private subnets for Amazon MQ, isolating your message broker from direct internet access while maintaining connectivity through NAT gateways for necessary outbound connections.
Enable encryption at rest using AWS Key Management Service (AWS KMS) for DynamoDB tables and Amazon MQ data and enforce encryption in transit by configuring SSL/TLS connections for all service communications, particularly for ActiveMQ broker connections. Finally, configure security groups with minimal access rules that explicitly define allowed traffic between components, restricting inbound connections to only the ports and protocols required for your application to function, such as port 61617 for ActiveMQ SSL connections from App Runner instances.
Cost considerations
The following table contains cost estimates based on the US East (N. Virginia) Region. Actual costs might vary based on your Region, usage patterns, and pricing changes.
Service
Small (1,000 msg/day)
Medium (10,000 msg/day)
Large (100,000 msg/day)
Amazon DynamoDB
$5–10
$25–50
$200–400
Amazon MQ
$15 (t3.micro)
$30 (m5.large)
$120 (m5.xlarge)
AWS App Runner
$20–40
$50–150
$400–800
Amazon API Gateway WebSocket
$3–5
$10–25
$50–100
Amazon CloudWatch Logs
$5–10
$10–20
$30–50
Data Transfer
$5
$10-20
$50-100
Total Estimated Cost
$53–95
$135–295
$850–1,570
Troubleshooting
The following are common issues and their solutions when implementing the priority-based message processing system:
Messages not processing in priority order:
Verify JMS priority is configured correctly: message.setJMSPriority(priority)
Check ActiveMQ broker configuration for priority queue support
Confirm CLIENT_ACKNOWLEDGE mode is properly configured
Review queue consumer concurrency settings
WebSocket updates not working:
Verify DynamoDB Streams is enabled on the table
Check the Lambda function is triggered by stream events
Validate API Gateway WebSocket configuration and IAM permissions
Test the WebSocket connection using browser developer tools
Application scaling issues:
Monitor App Runner metrics in CloudWatch
Adjust auto scaling configuration based on traffic patterns
Consider Amazon MQ broker capacity and upgrade if needed
Review DynamoDB capacity settings and enable auto scaling
Clean up
To avoid incurring ongoing AWS charges, delete the resources you created in this walkthrough:
This solution demonstrates how to build a production-ready priority-based message processing system using AWS managed services. By combining Amazon MQ priority queuing with DynamoDB real-time streams and App Runner serverless compute, you create a resilient architecture that intelligently handles messages based on business priorities.The implementation of application-level delays with priority bypass makes sure critical messages receive immediate attention, and the dual-layer retry mechanism provides maximum reliability. Real-time WebSocket updates keep users informed of processing status, creating a responsive and transparent system.To learn more about the services and patterns used in this solution, explore the following resources:
As we close out 2025, one thing is clear: the security landscape is evolving faster than most organizations can keep up. From surging ransomware campaigns and AI-enhanced phishing to data extortion, geopolitical fallout, and gaps in cyber readiness, the challenges facing security teams today are as varied as they are relentless. But with complexity comes clarity and insight.
This year’s most significant breaches, breakthroughs, and behavioral shifts provide a critical lens through which we can view what’s next. That’s exactly what we’ll explore in our upcoming Security Predictions for 2026 webinar, where Rapid7’s experts will break down where we are now, what to expect next, and how organizations can proactively adapt.
Before we look ahead, let’s take stock of what defined 2025 and what it tells us about the state of cybersecurity today.
Ransomware: Same playbook, more precision
Ransomware remains one of the most consistent and costly threats facing organisations today, but the approach has shifted. According to Rapid7’s Q3 2025 Threat Landscape Report, data extortion continues to dominate, with groups increasingly focused on exfiltration and disruption rather than encryption alone. Over 80% of ransomware cases handled in Q3 involved data theft, often staged and timed to maximise leverage.
Threat actors like RansomHub, BlackSuit, NoEscape, and Scattered Spider continue to refine their operations. Many campaigns are multi-stage and collaborative, with Initial Access Brokers providing footholds that are later sold to ransomware operators. One common thread is a focus on identity and infrastructure abuse – attackers are compromising vSphere environments, exploiting misconfigurations in third-party platforms, and abusing legitimate remote access tools to move laterally before launching extortion phases.
These incidents increasingly target complex organizations with sprawling digital footprints. The result? Weeks of operational downtime, lost revenue, regulatory scrutiny, and enduring brand damage. In this landscape, ransomware is no longer just a malware problem – it’s a business continuity issue, a supply chain risk, and a board-level concern.
The offense is automated: AI goes to work
This year, we saw AI break through hype and land firmly in attackers’ toolkits. Tools like WormGPT, FraudGPT, and DarkBERT gave cybercriminals an entry point to generate convincing phishing emails, polymorphic malware, and credential-harvesting scripts, all without needing advanced coding skills.
In our AI Offense blog, we detailed how these tools lower the barrier to entry and amplify the volume and sophistication of social engineering campaigns. Pair that with deepfakes, cloned voices, and LLM-powered targeting, and security teams now face threats that are faster, cheaper, and harder to detect than ever before.
The takeaway? AI is not a future threat. It is here. And defenders must embrace its potential just as aggressively as attackers have.
The human factor: Still the weakest link
Despite improved tooling, attacker playbooks still rely heavily on people. Our recent exploration of evolving social engineering trends highlighted the rise of Microsoft Teams-based impersonation, remote access tool abuse such as Quick Assist, and multi-stage credential compromise.
The fallout has been widespread. From attacks on major UK retailers to multiple airline disruptions and critical public sector breaches, social engineering is no longer just email phishing. It is phone calls, voice cloning, fake calendars, and chat-based manipulation.
Training helps. But attackers are innovating faster than awareness campaigns can keep up. Security teams need to simulate these threats internally and invest in visibility across identity platforms, because credentials remain the crown jewels.
From awareness to action: Resilience as a mandate
A growing number of incidents in 2025 underscored the readiness gap in many organizations. Our recent blog on preparedness broke down the UK’s National Cyber Security Centre guidance urging companies to revisit their offline contingency planning, including printed IR protocols and analog communications in case digital systems are taken offline.
This call followed a sharp rise in high-impact events, with over 200 nationally significant cyber incidents recorded in the UK alone this year.
The lesson? Cyber resilience is not a nice to have. It is foundational. Detection, backup, and patching are essential, but so is building response plans that assume failure, simulate outages, and bring the entire business to the table.
Join us: Predicting what’s next in 2026
We’ll explore these trends and where they’re heading in much greater depth in our Security Predictions for 2026 webinar, taking place on December 10.
Rapid7’s experts will unpack:
Which attacker tactics are here to stay and which are on the rise
Where AI, regulation, and infrastructure gaps are creating new exposures
How defenders can better prioritise risk and operate in resource-constrained environments
What CISOs, SOC leaders, and engineers need to align on in 2026 to stay ahead
This is our biggest global webinar of the year, and it is designed to help security professionals at every level get proactive and stay ahead of what’s next.
Register now and join thousands of security professionals from around the world as we set the stage for 2026. Because when the threat landscape keeps shifting, your best defense is a head start.
There have been several recent announcements about Linux distributions changing
the list of architectures they support, or adjusting how they build binaries for
some versions of those architectures.
Ubuntu introduced architecture variants, Fedora considered dropping support for i686 but
reversed course after some pushback, and Debian developers
have discussed raising its architecture baseline for the upcoming
Debian 14
(“forky”).
Linux supports a large number of architectures, and it’s not always
clear where or by whom they are used.
With increasing concerns about diminishing support for legacy
architectures, it’s a good time to look at the overall state of architecture
support on Linux.
The Homebrew project is an
open-source package-management system that comes with a repository of
useful packages for Linux and macOS. Even though Linux distributions
have their own package management and repositories, Homebrew is often
used to obtain software that is not available in a distribution’s repository
or to install more current versions of projects than are available
from long-term-support (LTS) distributions. Homebrew 5.0.0,
released on November 12, 2025, expanded Linux support to include
64-bit Arm packages in addition to x86_64, and turned on concurrent
downloads by default to speed up package downloads.
In most organizations, printing is an essential but often invisible service. When it works, nobody notices. When it fails, productivity stalls. That’s why monitoring your print environment is just as important as monitoring servers, databases, or network devices.
At Opensource ICT Solutions, we specialize in turning complex systems into observable services. One recent example is our integration of PaperCut NG with Zabbix. This allows IT teams to track the health of their print infrastructure in real-time — everything from server resources to individual printers and devices.
Why monitoring PaperCut matters
PaperCut NG does much more than queue print jobs. It enforces quotas, integrates with authentication systems, and manages fleets of devices. If the database runs out of connections, the disk fills up, or the license expires, users feel the impact instantly.
By integrating PaperCut with Zabbix, we make these risks visible long before they become business problems. The result is:
Proactive detection of printer errors, low toner, or license issues.
Capacity planning through trend analysis of disk usage, memory, and DB connections.
Unified visibility — PaperCut health checks appear right alongside servers, networks, and applications in Zabbix dashboards.
How the integration works
The magic happens through the PaperCut System Health API and Zabbix’s flexible data collection methods.
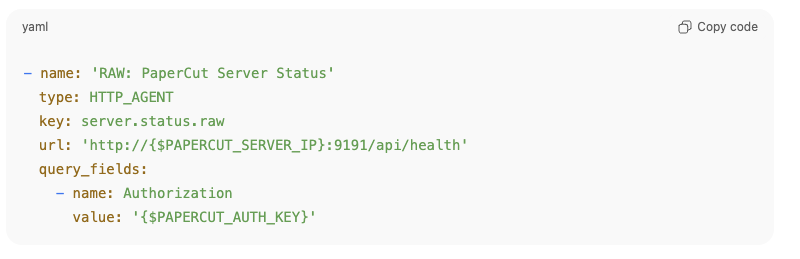
HTTP agent items
Zabbix fetches raw JSON data directly from PaperCut using an HTTP agent item, such as:
This single call provides a full snapshot of server health.
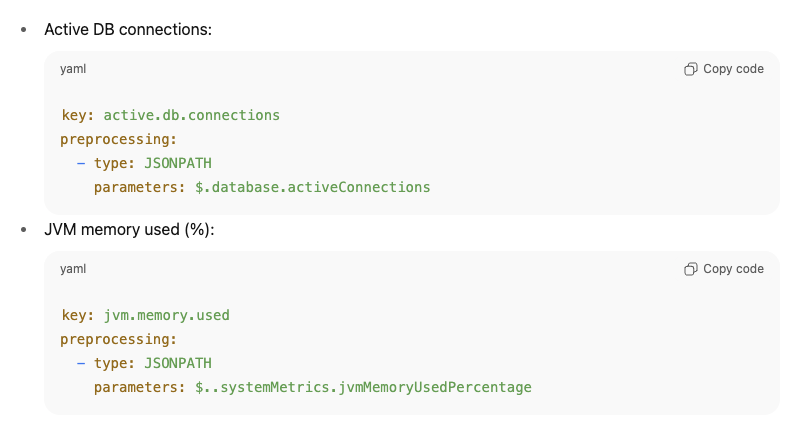
Dependent items + JSONPATH
Instead of hammering the API with multiple requests, we extract the needed fields using dependent items with JSONPATH preprocessing.
For example:
This design means one request can populate dozens of metrics, keeping monitoring both efficient and lightweight.
Calculated items
Some values aren’t directly available from PaperCut. In those cases, we create calculated items inside Zabbix.
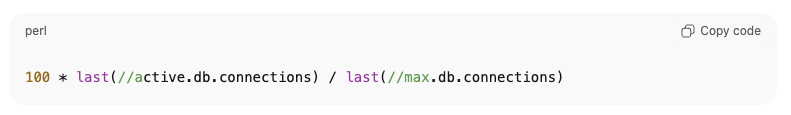
For example, the percentage of active DB connections is derived as:
This allows us to set intelligent triggers like “DB connections > 90%” without requiring PaperCut to calculate it for us.
Low-level discovery (LLD) for devices and printers
Perhaps the most powerful part of this integration is automatic discovery.
Printer LLD → Queries /api/health/printers and creates items and triggers per printer. If a printer goes into Paper Jam or No Toner, Zabbix knows immediately.
Device LLD → Queries /api/health/devices and builds items dynamically for each discovered device, tracking states like OK, WARNING, or ERROR.
This ensures that new printers and devices are monitored automatically — no manual configuration required!
Why this matters
Bringing all of this together, the integration turns PaperCut NG into a fully observable service inside Zabbix.
Efficiency → One API call, dozens of metrics.
Scalability → Automatic discovery of printers and devices.
Robustness → Alerts and dashboards for licenses, resources, and print queues.
For IT teams, this means fewer surprises, faster troubleshooting, and more confidence in a service that often goes unnoticed until it fails.
Our expertise
This PaperCut integration is just one example of how we at Opensource ICT Solutions help organizations unlock the full potential of Zabbix. We don’t just install monitoring – we design intelligent, scalable integrations that make hidden systems visible. Whether it’s print management, databases, custom applications, or network devices, we know how to extend Zabbix to fit your environment and give you the insights that matter most.
Security updates have been issued by Debian (libwebsockets), Fedora (chromium and fvwm3), Mageia (apache, firefox, and postgresql13, postgresql15), Oracle (idm:DL1), Red Hat (bind, bind9.18, firefox, and openssl), SUSE (alloy, ghostscript, and openssl-1_0_0), and Ubuntu (ffmpeg and freeglut).
Social media has been a familiar, even mundane, part of life for nearly two decades. It can be easy to forget it was not always that way.
In 2008, social media was just emerging into the mainstream. Facebook reached 100 million users that summer. And a singular candidate was integrating social media into his political campaign: Barack Obama. His campaign’s use of social media was so bracingly innovative, so impactful, that it was viewed by journalist David Talbot and others as the strategy that enabled the first term Senator to win the White House.
Over the past few years, a new technology has become mainstream: AI. But still, no candidate has unlocked AI’s potential to revolutionize political campaigns. Americans have three more years to wait before casting their ballots in another Presidential election, but we can look at the 2026 midterms and examples from around the globe for signs of how that breakthrough might occur.
How Obama Did It
Rereading the contemporaneous reflections of the New York Times’ late media critic, David Carr, on Obama’s campaign reminds us of just how new social media felt in 2008. Carr positions it within a now-familiar lineage of revolutionary communications technologies from newspapers to radio to television to the internet.
The Obama campaign and administration demonstrated that social media was different from those earlier communications technologies, including the pre-social internet. Yes, increasing numbers of voters were getting their news from the internet, and content about the then-Senator sometimes made a splash by going viral. But those were still broadcast communications: one voice reaching many. Obama found ways to connect voters to each other.
In describing what social media revolutionized in campaigning, Carr quotes campaign vendor Blue State Digital’s Thomas Gensemer: “People will continue to expect a conversation, a two-way relationship that is a give and take.”
The Obama team made some earnest efforts to realize this vision. His transition team launched change.gov, the website where the campaign collected a “Citizen’s Briefing Book” of public comment. Later, his administration built We the People, an online petitioning platform.
But the lasting legacy of Obama’s 2008 campaign, as political scientists Hahrie Han and Elizabeth McKenna chronicled, was pioneering online “relational organizing.” This technique enlisted individuals as organizers to activate their friends in a self-perpetuating web of relationships.
Perhaps because of the Obama campaign’s close association with the method, relational organizing has been touted repeatedly as the linchpin of Democratic campaigns: in 2020, 2024, and today. But research by non-partisan groups like Turnout Nation and right-aligned groups like the Center for Campaign Innovation has also empirically validated the effectiveness of the technique for inspiring voter turnout within connected groups.
The Facebook of 2008 worked well for relational organizing. It gave users tools to connect and promote ideas to the people they know: college classmates, neighbors, friends from work or church. But the nature of social networking has changed since then.
For the past decade, according to Pew Research, Facebook use has stalled and lagged behind YouTube, while Reddit and TikTok have surged. These platforms are less useful for relational organizing, at least in the traditional sense. YouTube is organized more like broadcast television, where content creators produce content disseminated on their own channels in a largely one-way communication to their fans. Reddit gathers users worldwide in forums (subreddits) organized primarily on topical interest. The endless feed of TikTok’s “For You” page disseminates engaging content with little ideological or social commonality. None of these platforms shares the essential feature of Facebook c. 2008: an organizational structure that emphasizes direct connection to people that users have direct social influence over.
AI and Relational Organizing
Ideas and messages might spread virally through modern social channels, but they are not where you convince your friends to show up at a campaign rally. Today’s platforms are spaces for political hobbyism, where you express your political feelings and see others express theirs.
Relational organizing works when one person’s action inspires others to do this same. That’s inherently a chain of human-to-human connection. If my AI assistant inspires your AI assistant, no human notices and one’s vote changes. But key steps in the human chain can be assisted by AI. Tell your phone’s AI assistant to craft a personal message to one friend—or a hundred—and it can do it.
So if a campaign hits you at the right time with the right message, they might persuade you to task your AI assistant to ask your friends to donate or volunteer. The result can be something more than a form letter; it could be automatically drafted based on the entirety of your email or text correspondence with that friend. It could include references to your discussions of recent events, or past campaigns, or shared personal experiences. It could sound as authentic as if you’d written it from the heart, but scaled to everyone in your address book.
Research suggests that AI can generate and perform written political messaging about as well as humans. AI will surely play a tactical role in the 2026 midterm campaigns, and some candidates may even use it for relational organizing in this way.
(Artificial) Identity Politics
For AI to be truly transformative of politics, it must change the way campaigns work. And we are starting to see that in the US.
The earliest uses of AI in American political campaigns are, to be polite, uninspiring. Candidates viewed them as just another tool to optimize an endless stream of email and text message appeals, to ramp up political vitriol, to harvest data on voters and donors, or merely as a stunt.
Of course, we have seen the rampant production and spread of AI-powered deepfakes and misinformation. This is already impacting the key 2026 Senate races, which are likely to attract hundreds of millions of dollars in financing. Roy Cooper, Democratic candidate for US Senate from North Carolina, and Abdul El-Sayed, Democratic candidate for Senate from Michigan, were both targeted by viral deepfake attacks in recent months. This may reflect a growing trend in Donald Trump’s Republican party in the use of AI-generated imagery to build up GOP candidates and assail the opposition.
And yet, in the global elections of 2024, AI was used more memetically than deceptively. So far, conservative and far right parties seem to have adopted this most aggressively. The ongoing rise of Germany’s far-right populist AfD party has been credited to its use of AI to generate nostalgic and evocative (and, to many, offensive) campaign images, videos, and music and, seemingly as a result, they have dominated TikTok. Because most social platforms’ algorithms are tuned to reward media that generates an emotional response, this counts as a double use of AI: to generate content and to manipulate its distribution.
AI can also be used to generate politically useful, though artificial, identities. These identities can fulfill different roles than humans in campaigning and governance because they have differentiated traits. They can’t be imprisoned for speaking out against the state, can be positioned (legitimately or not) as unsusceptible to bribery, and can be forced to show up when humans will not.
In Venezuela, journalists have turned to AI avatars—artificial newsreaders—to report anonymously on issues that would otherwise elicit government retaliation. Albania recently “appointed” an AI to a ministerial post responsible for procurement, claiming that it would be less vulnerable to bribery than a human. In Virginia, both in 2024 and again this year, candidates have used AI avatars as artificial stand-ins for opponents that refused to debate them.
And yet, none of these examples, whether positive or negative, pursue the promise of the Obama campaign: to make voter engagement a “two-way conversation” on a massive scale.
The closest so far to fulfilling that vision anywhere in the world may be Japan’s new political party, Team Mirai. It started in 2024, when an independent Tokyo gubernatorial candidate, Anno Takahiro, used an AI avatar on YouTube to respond to 8,600 constituent questions over a seventeen-day continuous livestream. He collated hundreds of comments on his campaign manifesto into a revised policy platform. While he didn’t win his race, he shot up to a fifth place finish among a record 56 candidates.
Anno was RECENTLY elected to the upper house of the federal legislature as the founder of a new party with a 100 day plan to bring his vision of a “public listening AI” to the whole country. In the early stages of that plan, they’ve invested their share of Japan’s 32 billion yen in party grants—public subsidies for political parties—to hire engineers building digital civic infrastructure for Japan. They’ve already created platforms to provide transparency for party expenditures, and to use AI to make legislation in the Diet easy, and are meeting with engineers from US-based Jigsaw Labs (a Google company) to learn from international examples of how AI can be used to power participatory democracy.
Team Mirai has yet to prove that it can get a second member elected to the Japanese Diet, let alone to win substantial power, but they’re innovating and demonstrating new ways of using AI to give people a way to participate in politics that we believe is likely to spread.
Organizing with AI
AI could be used in the US in similar ways. Following American federalism’s longstanding model of “laboratories of democracy,” we expect the most aggressive campaign innovation to happen at the state and local level.
D.C. Mayor Muriel Bowser is partnering with MIT and Stanford labs to use the AI-based tool deliberation.io to capture wide scale public feedback in city policymaking about AI. Her administration said that using AI in this process allows “the District to better solicit public input to ensure a broad range of perspectives, identify common ground, and cultivate solutions that align with the public interest.”
It remains to be seen how central this will become to Bowser’s expected re-election campaign in 2026, but the technology has legitimate potential to be a prominent part of a broader program to rebuild trust in government. This is a trail blazed by Taiwan a decade ago. The vTaiwan initiative showed how digital tools like Pol.is, which uses machine learning to make sense of real time constituent feedback, can scale participation in democratic processes and radically improve trust in government. Similar AI listening processes have been used in Kentucky, France, and Germany.
Even if campaigns like Bowser’s don’t adopt this kind of AI-facilitated listening and dialog, expect it to be an increasingly prominent part of American public debate. Through a partnership with Jigsaw, Scott Rasmussen’s Napolitan Institute will use AI to elicit and synthesize the views of at least five Americans from every Congressional district in a project called “We the People.” Timed to coincide with the country’s 250th anniversary in 2026, expect the results to be promoted during the heat of the midterm campaign and to stoke interest in this kind of AI-assisted political sensemaking.
In the year where we celebrate the American republic’s semiquincentennial and continue a decade-long debate about whether or not Donald Trump and the Republican party remade in his image is fighting for the interests of the working class, representation will be on the ballot in 2026. Midterm election candidates will look for any way they can get an edge. For all the risks it poses to democracy, AI presents a real opportunity, too, for politicians to engage voters en masse while factoring their input into their platform and message. Technology isn’t going to turn an uninspiring candidate into Barack Obama, but it gives any aspirant to office the capability to try to realize the promise that swept him into office.
This essay was written with Nathan E. Sanders, and originally appeared in The Fulcrum.
Over the first weekend in November, members of the global Code Club community came together for two inspiring days of learning, creativity and connection. The annual event celebrates the people who make Code Clubs happen, allowing them to share ideas, explore new tools, and connect with others who help young people learn to code.
Exploring new technologies and inclusive teaching
Saturday began with hands-on sessions that brought creativity and technology together, exploring large language models and prompt engineering in Collaborating with LLMs and being a prompt boss. There was a lot of laughter from attendees about how large language models can produce confident but incorrect answers if given vague prompts, but many left inspired to experiment with new technologies in their own clubs.
“First time there and it was amazing. Met loads of great people and the amazing code club crew. I learnt loads of new skills around AI and Arduino.” – An attendee
Collaboration that counts brought mentors together to discuss common challenges like volunteer retention, limited resources, and communication barriers. A crowd favourite was a shared volunteer toolkit, as well as event checklists and safeguarding resources.
“What I enjoyed most about the Clubs Conference was the opportunity to meet other facilitators and hear their stories — their successes and challenges. These conversations validated the volunteer work I do and reminded me of the impact of our clubs.” – An attendee
From the theatre sessions, you can watch Inclusive learning – Supporting Deaf learners in clubs which was both moving and insightful. We learnt that visual demonstrations, colour cues, and repetition were key to supporting Deaf learners. One memorable quote captured the spirit of the session:
“The children couldn’t speak to us. The children — we couldn’t hear their voices but by the eighth week we were able to hear their voices from what they built on the screen and it was echoing all around the classroom.” – Chidi Duru
The weekend’s talks showcased the reach of Code Club worldwide, with volunteers sharing their experiences of collaboration, sustainability, and creativity.
WatchLessons from resourceful Code Clubs in India, which highlighted the ingenuity of young learners in under-resourced settings, while Hands-on with the Raspberry Pi Pico showcased low-cost, high-impact projects from Kenya and South Africa.
Speakers showed how community clubs adapt to local needs with unplugged activities and coding games inspired by cricket and kabaddi, empowering young people to solve real problems and celebrate curiosity through play. Excitingly, these new resources will be launching early next year; keep an eye on our activities page to be among the first to try them out!
In the session Code Club Projects Unplugged, facilitators shared the idea of “hiding the vegetables” — hiding the learning inside the fun. Whether through a collaborative Scratch game, a micro:bit prop on stage, or a Pico gadget solving a real problem, this approach helps young people learn through play. They remember the joy, and the skills come naturally.
Learning beyond the screen
Teaching tech away from the computer screen shared a fun unplugged cybersecurity activity, The Chicken Shop, where learners role-play social engineering scenarios. Its success came from clear printed instructions, movement, humour, and strong debriefing.
Learning coding outside the box explored how to engage young people with diverse learning styles while the Arduino crash course gave attendees a taste of physical computing and C++ programming in action. Workshops on AI, sustainability, and youth empowerment with Raspberry Pi computers and Unlocking Code Club resources helped club leaders discover practical ways to inspire problem-solving and make use of all the support available through Code Club.
The message from the sessions was clear: young people learn best when technology is human and hands-on.
Showcasing creativity with Coolest Projects
Coolest Projects – get involved!championed creativity over competition. Any young person under 18 can submit their project, including unfinished ideas. In-person and online showcases celebrate progress, imagination, and teamwork.
Speaking on the closing panel, Code Club leader Rachael Coultart talked about the importance of Coolest Projects as a rare platform for children to talk about their learning. She spoke about the experience of one particular child, explaining that it had made a powerful impression on her, saying:
“It had such a huge impact. I felt so proud of her and what she’d achieved. Afterwards, her parents told me that they felt it was the first time she had really been seen.”
What the community is taking forward
The community is united in its commitment to making Code Clubs inclusive, creative, and sustainable.
Context matters — projects that reflect local interests and challenges motivate young people to learn
Accessibility is central: visual cues, repetition, interpreters, and inclusive resources support every learner
Structure builds confidence; start with simple, guided activities before open-ended exploration
Volunteers are vital; shared toolkits, checklists, and training help them deliver engaging sessions
Celebration and affordability matter too: regular showcases and tools like the micro:bit, Pico, and Crumble keep computing fun, hands-on, and accessible for all
“Thank you. Clubs Conference is a highlight of my year.” – An attendee
Stay connected
If you want to stay up to date with the latest news, events and opportunities from Code Club, sign up for our newsletter and be part of the growing global community.
On 18 November 2025 at 11:20 UTC (all times in this blog are UTC), Cloudflare’s network began experiencing significant failures to deliver core network traffic. This showed up to Internet users trying to access our customers’ sites as an error page indicating a failure within Cloudflare’s network.
The issue was not caused, directly or indirectly, by a cyber attack or malicious activity of any kind. Instead, it was triggered by a change to one of our database systems’ permissions which caused the database to output multiple entries into a “feature file” used by our Bot Management system. That feature file, in turn, doubled in size. The larger-than-expected feature file was then propagated to all the machines that make up our network.
The software running on these machines to route traffic across our network reads this feature file to keep our Bot Management system up to date with ever changing threats. The software had a limit on the size of the feature file that was below its doubled size. That caused the software to fail.
After we initially wrongly suspected the symptoms we were seeing were caused by a hyper-scale DDoS attack, we correctly identified the core issue and were able to stop the propagation of the larger-than-expected feature file and replace it with an earlier version of the file. Core traffic was largely flowing as normal by 14:30. We worked over the next few hours to mitigate increased load on various parts of our network as traffic rushed back online. As of 17:06 all systems at Cloudflare were functioning as normal.
We are sorry for the impact to our customers and to the Internet in general. Given Cloudflare’s importance in the Internet ecosystem any outage of any of our systems is unacceptable. That there was a period of time where our network was not able to route traffic is deeply painful to every member of our team. We know we let you down today.
This post is an in-depth recount of exactly what happened and what systems and processes failed. It is also the beginning, though not the end, of what we plan to do in order to make sure an outage like this will not happen again.
The outage
The chart below shows the volume of 5xx error HTTP status codes served by the Cloudflare network. Normally this should be very low, and it was right up until the start of the outage.
The volume prior to 11:20 is the expected baseline of 5xx errors observed across our network. The spike, and subsequent fluctuations, show our system failing due to loading the incorrect feature file. What’s notable is that our system would then recover for a period. This was very unusual behavior for an internal error.
The explanation was that the file was being generated every five minutes by a query running on a ClickHouse database cluster, which was being gradually updated to improve permissions management. Bad data was only generated if the query ran on a part of the cluster which had been updated. As a result, every five minutes there was a chance of either a good or a bad set of configuration files being generated and rapidly propagated across the network.
This fluctuation made it unclear what was happening as the entire system would recover and then fail again as sometimes good, sometimes bad configuration files were distributed to our network. Initially, this led us to believe this might be caused by an attack. Eventually, every ClickHouse node was generating the bad configuration file and the fluctuation stabilized in the failing state.
Errors continued until the underlying issue was identified and resolved starting at 14:30. We solved the problem by stopping the generation and propagation of the bad feature file and manually inserting a known good file into the feature file distribution queue. And then forcing a restart of our core proxy.
The remaining long tail in the chart above is our team restarting remaining services that had entered a bad state, with 5xx error code volume returning to normal at 17:06.
The following services were impacted:
Service / Product
Impact description
Core CDN and security services
HTTP 5xx status codes. The screenshot at the top of this post shows a typical error page delivered to end users.
Turnstile
Turnstile failed to load.
Workers KV
Workers KV returned a significantly elevated level of HTTP 5xx errors as requests to KV’s “front end” gateway failed due to the core proxy failing.
Dashboard
While the dashboard was mostly operational, most users were unable to log in due to Turnstile being unavailable on the login page.
Email Security
While email processing and delivery were unaffected, we observed a temporary loss of access to an IP reputation source which reduced spam-detection accuracy and prevented some new-domain-age detections from triggering, with no critical customer impact observed. We also saw failures in some Auto Move actions; all affected messages have been reviewed and remediated.
Access
Authentication failures were widespread for most users, beginning at the start of the incident and continuing until the rollback was initiated at 13:05. Any existing Access sessions were unaffected.
All failed authentication attempts resulted in an error page, meaning none of these users ever reached the target application while authentication was failing. Successful logins during this period were correctly logged during this incident.
Any Access configuration updates attempted at that time would have either failed outright or propagated very slowly. All configuration updates are now recovered.
As well as returning HTTP 5xx errors, we observed significant increases in latency of responses from our CDN during the impact period. This was due to large amounts of CPU being consumed by our debugging and observability systems, which automatically enhance uncaught errors with additional debugging information.
How Cloudflare processes requests, and how this went wrong today
Every request to Cloudflare takes a well-defined path through our network. It could be from a browser loading a webpage, a mobile app calling an API, or automated traffic from another service. These requests first terminate at our HTTP and TLS layer, then flow into our core proxy system (which we call FL for “Frontline”), and finally through Pingora, which performs cache lookups or fetches data from the origin if needed.
We previously shared more detail about how the core proxy works here.
As a request transits the core proxy, we run the various security and performance products available in our network. The proxy applies each customer’s unique configuration and settings, from enforcing WAF rules and DDoS protection to routing traffic to the Developer Platform and R2. It accomplishes this through a set of domain-specific modules that apply the configuration and policy rules to traffic transiting our proxy.
One of those modules, Bot Management, was the source of today’s outage.
Cloudflare’s Bot Management includes, among other systems, a machine learning model that we use to generate bot scores for every request traversing our network. Our customers use bot scores to control which bots are allowed to access their sites — or not.
The model takes as input a “feature” configuration file. A feature, in this context, is an individual trait used by the machine learning model to make a prediction about whether the request was automated or not. The feature configuration file is a collection of individual features.
This feature file is refreshed every few minutes and published to our entire network and allows us to react to variations in traffic flows across the Internet. It allows us to react to new types of bots and new bot attacks. So it’s critical that it is rolled out frequently and rapidly as bad actors change their tactics quickly.
A change in our underlying ClickHouse query behaviour (explained below) that generates this file caused it to have a large number of duplicate “feature” rows. This changed the size of the previously fixed-size feature configuration file, causing the bots module to trigger an error.
As a result, HTTP 5xx error codes were returned by the core proxy system that handles traffic processing for our customers, for any traffic that depended on the bots module. This also affected Workers KV and Access, which rely on the core proxy.
Unrelated to this incident, we were and are currently migrating our customer traffic to a new version of our proxy service, internally known as FL2. Both versions were affected by the issue, although the impact observed was different.
Customers deployed on the new FL2 proxy engine, observed HTTP 5xx errors. Customers on our old proxy engine, known as FL, did not see errors, but bot scores were not generated correctly, resulting in all traffic receiving a bot score of zero. Customers that had rules deployed to block bots would have seen large numbers of false positives. Customers who were not using our bot score in their rules did not see any impact.
Throwing us off and making us believe this might have been an attack was another apparent symptom we observed: Cloudflare’s status page went down. The status page is hosted completely off Cloudflare’s infrastructure with no dependencies on Cloudflare. While it turned out to be a coincidence, it led some of the team diagnosing the issue to believe that an attacker may be targeting both our systems as well as our status page. Visitors to the status page at that time were greeted by an error message:
In the internal incident chat room, we were concerned that this might be the continuation of the recent spate of high volume AisuruDDoS attacks:
The query behaviour change
I mentioned above that a change in the underlying query behaviour resulted in the feature file containing a large number of duplicate rows. The database system in question uses ClickHouse’s software.
For context, it’s helpful to know how ClickHouse distributed queries work. A ClickHouse cluster consists of many shards. To query data from all shards, we have so-called distributed tables (powered by the table engine Distributed) in a database called default. The Distributed engine queries underlying tables in a database r0. The underlying tables are where data is stored on each shard of a ClickHouse cluster.
Queries to the distributed tables run through a shared system account. As part of efforts to improve our distributed queries security and reliability, there’s work being done to make them run under the initial user accounts instead.
Before today, ClickHouse users would only see the tables in the default database when querying table metadata from ClickHouse system tables such as system.tables or system.columns.
Since users already have implicit access to underlying tables in r0, we made a change at 11:05 to make this access explicit, so that users can see the metadata of these tables as well. By making sure that all distributed subqueries can run under the initial user, query limits and access grants can be evaluated in a more fine-grained manner, avoiding one bad subquery from a user affecting others.
The change explained above resulted in all users accessing accurate metadata about tables they have access to. Unfortunately, there were assumptions made in the past, that the list of columns returned by a query like this would only include the “default” database:
SELECT

  name,

  type

FROM system.columns

WHERE

  table = 'http_requests_features'

order by name;
Note how the query does not filter for the database name. With us gradually rolling out the explicit grants to users of a given ClickHouse cluster, after the change at 11:05 the query above started returning “duplicates” of columns because those were for underlying tables stored in the r0 database.
This, unfortunately, was the type of query that was performed by the Bot Management feature file generation logic to construct each input “feature” for the file mentioned at the beginning of this section.
The query above would return a table of columns like the one displayed (simplified example):
However, as part of the additional permissions that were granted to the user, the response now contained all the metadata of the r0 schema effectively more than doubling the rows in the response ultimately affecting the number of rows (i.e. features) in the final file output.
Memory preallocation
Each module running on our proxy service has a number of limits in place to avoid unbounded memory consumption and to preallocate memory as a performance optimization. In this specific instance, the Bot Management system has a limit on the number of machine learning features that can be used at runtime. Currently that limit is set to 200, well above our current use of ~60 features. Again, the limit exists because for performance reasons we preallocate memory for the features.
When the bad file with more than 200 features was propagated to our servers, this limit was hit — resulting in the system panicking. The FL2 Rust code that makes the check and was the source of the unhandled error is shown below:
This resulted in the following panic which in turn resulted in a 5xx error:
thread fl2_worker_thread panicked: called Result::unwrap() on an Err value
Other impact during the incident
Other systems that rely on our core proxy were impacted during the incident. This included Workers KV and Cloudflare Access. The team was able to reduce the impact to these systems at 13:04, when a patch was made to Workers KV to bypass the core proxy. Subsequently, all downstream systems that rely on Workers KV (such as Access itself) observed a reduced error rate.
The Cloudflare Dashboard was also impacted due to both Workers KV being used internally and Cloudflare Turnstile being deployed as part of our login flow.
Turnstile was impacted by this outage, resulting in customers who did not have an active dashboard session being unable to log in. This showed up as reduced availability during two time periods: from 11:30 to 13:10, and between 14:40 and 15:30, as seen in the graph below.
The first period, from 11:30 to 13:10, was due to the impact to Workers KV, which some control plane and dashboard functions rely upon. This was restored at 13:10, when Workers KV bypassed the core proxy system.
The second period of impact to the dashboard occurred after restoring the feature configuration data. A backlog of login attempts began to overwhelm the dashboard. This backlog, in combination with retry attempts, resulted in elevated latency, reducing dashboard availability. Scaling control plane concurrency restored availability at approximately 15:30.
Remediation and follow-up steps
Now that our systems are back online and functioning normally, work has already begun on how we will harden them against failures like this in the future. In particular we are:
Hardening ingestion of Cloudflare-generated configuration files in the same way we would for user-generated input
Enabling more global kill switches for features
Eliminating the ability for core dumps or other error reports to overwhelm system resources
Reviewing failure modes for error conditions across all core proxy modules
Today was Cloudflare’s worst outage since 2019. We’ve had outages that have made our dashboard unavailable. Some that have caused newer features to not be available for a period of time. But in the last 6+ years we’ve not had another outage that has caused the majority of core traffic to stop flowing through our network.
An outage like today is unacceptable. We’ve architected our systems to be highly resilient to failure to ensure traffic will always continue to flow. When we’ve had outages in the past it’s always led to us building new, more resilient systems.
On behalf of the entire team at Cloudflare, I would like to apologize for the pain we caused the Internet today.
Time (UTC)
Status
Description
11:05
Normal.
Database access control change deployed.
11:28
Impact starts.
Deployment reaches customer environments, first errors observed on customer HTTP traffic.
11:32-13:05
The team investigated elevated traffic levels and errors to Workers KV service.
The initial symptom appeared to be degraded Workers KV response rate causing downstream impact on other Cloudflare services.
Mitigations such as traffic manipulation and account limiting were attempted to bring the Workers KV service back to normal operating levels.
The first automated test detected the issue at 11:31 and manual investigation started at 11:32. The incident call was created at 11:35.
13:05
Workers KV and Cloudflare Access bypass implemented — impact reduced.
During investigation, we used internal system bypasses for Workers KV and Cloudflare Access so they fell back to a prior version of our core proxy. Although the issue was also present in prior versions of our proxy, the impact was smaller as described below.
13:37
Work focused on rollback of the Bot Management configuration file to a last-known-good version.
We were confident that the Bot Management configuration file was the trigger for the incident. Teams worked on ways to repair the service in multiple workstreams, with the fastest workstream a restore of a previous version of the file.
14:24
Stopped creation and propagation of new Bot Management configuration files.
We identified that the Bot Management module was the source of the 500 errors and that this was caused by a bad configuration file. We stopped automatic deployment of new Bot Management configuration files.
14:24
Test of new file complete.
We observed successful recovery using the old version of the configuration file and then focused on accelerating the fix globally.
14:30
Main impact resolved. Downstream impacted services started observing reduced errors.
A correct Bot Management configuration file was deployed globally and most services started operating correctly.
17:06
All services resolved. Impact ends.
All downstream services restarted and all operations fully restored.
Already on Sep 17 we released systemd v258 into the wild.
In the weeks leading up to that release I have posted a series of
serieses of posts to Mastodon about key new features in this release,
under the #systemd258 hash
tag. It was my intention to post a link list here on this blog right
after completing that series, but I simply forgot! Hence, in case you
aren’t using Mastodon, but would like to read up, here’s a list of all
37 posts:
I intend to do a similar series of serieses of posts for the next systemd
release (v259), hence if you haven’t left tech Twitter for Mastodon yet, now is
the opportunity.
We intend to shorten the release cycle a bit for the future, and in
fact managed to tag v259-rc1 already yesterday, just 2 months after
v258. Hence, my series for v259 will begin soon, under the #systemd259 hash tag.
To provide the best experiences, we use technologies like cookies to store and/or access device information. Consenting to these technologies will allow us to process data such as browsing behavior or unique IDs on this site. Not consenting or withdrawing consent, may adversely affect certain features and functions.
Functional
Always active
The technical storage or access is strictly necessary for the legitimate purpose of enabling the use of a specific service explicitly requested by the subscriber or user, or for the sole purpose of carrying out the transmission of a communication over an electronic communications network.
Preferences
The technical storage or access is necessary for the legitimate purpose of storing preferences that are not requested by the subscriber or user.
Statistics
The technical storage or access that is used exclusively for statistical purposes.The technical storage or access that is used exclusively for anonymous statistical purposes. Without a subpoena, voluntary compliance on the part of your Internet Service Provider, or additional records from a third party, information stored or retrieved for this purpose alone cannot usually be used to identify you.
Marketing
The technical storage or access is required to create user profiles to send advertising, or to track the user on a website or across several websites for similar marketing purposes.