The multi-generational LRU (MGLRU) is an
alternative memory-management algorithm that was merged for the 6.1 kernel
in late 2022. It brought a promise of much-improved performance and
simplified code. Since then, though, progress on MGLRU has stalled, and it
still is not enabled on many systems. As the 2026 Linux Storage,
Filesystem, Memory-Management and BPF Summit (LSFMM+BPF) approaches,
several memory-management developers have indicated a desire to talk about
the future of MGLRU. While some developers are looking for ways to improve
the subsystem, another has called for it to be removed entirely.
It satisfies compliance requirements for runtime-related vulnerabilities.
DAST catches vulnerabilities in the running web application, yielding findings that may be missed in static code testing.
It is security-drivenwith little overhead in configuration/maintenance from development or application teams.
Due to the nature of web apps powering mission-critical operations – hyperscaled of course by AI protocols that automate key processes within these apps – continuous DAST is essential to identifying and remediating potential weaknesses that could quickly lead to costly data breaches.
Compliance requirements
DAST helps satisfy multiple compliance requirements by simulating real-world attacks so it can test a running application for vulnerabilities.. While DAST alone doesn’t make you compliant, it supports key controls in many security standards and regulations. Get to know 7 of today’s top standards and frameworks, see which requirements they satisfy, and learn how DAST helps secure the following:
PCI DSS
Payment Card Industry Data Security Standard(PCI DSS) is the global security standard for any organization that stores, processes, or transmits payment-card data. DAST directly supports PCI compliance by performing vulnerability scans against live web apps.
Requirements satisfied:
Requirement 6.1 & 6.2: Identifying and addressing vulnerabilities.
Requirement 6.6: All public-facing web applications must be either:
Protected with application-layer firewall (WAF), or
Tested for vulnerabilities (e.g., via DAST) at least annually.
OWASP Top Ten
While the Open Worldwide Application Security Project (OWASP) is not a compliance framework, the nonprofit organization is often referenced by industry and regulatory standards.
Requirements satisfied:
DAST tools are often tested against OWASP Top 10 vulnerabilities (e.g., XSS, SQLi, SSRF).
HIPAA
The Health Insurance Portability and Accountability Act (HIPAA) sets national standards for protecting electronic protected health information (ePHI). DAST supports risk assessment by identifying live vulnerabilities with the potential to expose such information.
Requirements satisfied:
Security Rule (45 CFR § 164.308 & § 164.312):
Requires organizations to perform regular risk assessments.
Includes application-level vulnerabilities as part of overall system security.
ISO/IEC 27001
ISO/International Electrotechnical Commission (ISO/IEC) isthe international standard that specifies requirements for an information security management system (ISMS). DAST helps fulfill this requirement by scanning running applications for known and exploitable vulnerabilities.
Requirements satisfied:
Annex A.12.6.1: Management of technical vulnerabilities – Requires timely detection and remediation of vulnerabilities.
NIST SP 800-53/800-171
The National Institute of Standards and Technology (NIST) is a U.S. federal agency that develops measurement science, standards, and tech to boost innovation and economic security. DAST can be used to meet these technical controls.
Requirements satisfied:
RA-5 (vulnerability scanning): Requires scanning of systems and applications.
SI-2 (faw remediation): Identify, report, and fix flaws in software.
SOC 2
System and Organization Controls 2 (SOC2) isan independent attestation report (from a licensed CPA firm) that evaluates whether a service organization’s controls are suitably designed. DAST contributes evidence for audit logs and control effectiveness over time.
Requirements satisfied:
Under the “Security” Trust Services Criteria, particularly:
CC4.1: Monitor infrastructure for new threats.
CC7.1/CC7.2: Detect and mitigate vulnerabilities.
GDPR
General Data Protection Regulation (GDPR) harmonizes privacy rules across the EUand sets requirements for how organizations collect, use, share, and protect personal data. DAST can be part of regular security testing under GDPR, especially if the app processes personal data.
Requirements satisfied:
Article 32 – Security of Processing:
Organizations must ensure the ongoing confidentiality, integrity, availability of systems.
Requires regular testing and evaluation of security measures.
Missed findings
Static application security testing (SAST) tools are effective at flagging insecure values on their own, but they often miss the broader application context needed to assess whether those values actually introduce risk. Here are some examples of findings that can be overlooked:
Forced browsing
Forced browsing (also called insecure direct object reference or unauthorized resource access) occurs when:
A user can manually access restricted resources (files, endpoints, or actions) by guessing or modifying a URL.
There are missing access controls or authorization checks.
Example: A user modifies a URL
https://example.com/admin/settings
Even though they’re not an admin, the app still serves the page because it lacks proper access controls.
SAST struggles to detect these findings due to:
Lack of visibility into runtime access control
SAST scans source code, but can’t simulate user roles or sessions.
It doesn’t know who should or shouldn’t be able to access a specific path.
Abstracted access control logic
Authorization might be handled via middleware, annotations, config files, or external services (e.g., OAuth).
SAST often can’t follow the full enforcement logic, especially if it’s custom or dynamic.
Lack of awareness around routing and resource exposure
SAST doesn’t map which endpoints exist versus which are intended to be public.
It can’t verify which files/resources are accessible through URLs.
Out-of-band (OOB) cross-site scripting (XSS)
Out-of-band cross-site-scripting OOB XSS (a subtype of stored or blind XSS) occurs when:
A malicious script is injected into an application (e.g., a form, comment, or field).
The script doesn’t execute immediately but instead fires later, often:
In a different user’s browser (e.g., an admin viewing logs).
In an email client (e.g., via notification messages).
In a third-party system or admin dashboard.
These attacks are asynchronous and context-shifted, meaning they don’t happen in the direct request-response flow. SAST struggles to detect these findings due to:
Missing runtime context: SAST analyzes source code statically, line by line, without executing it. It doesn’t track:
Where the injected payload ends up.
How or where it’s later rendered.
Whether it’s rendered in a dangerous context (HTML, JS, email, etc.).
Visibility is limited to code flow: SAST typically can’t follow data across storage layers or external systems. OOB XSS often spans:
User-submitted input → stored in DB.
Later retrieved → rendered in admin UI or email.
Unable to observe execution: The XSS payload doesn’t fire in the original request, so SAST has no way to “see” the exploit being triggered because it doesn’t execute code.
Web config findings
Settings defined in the web config file can pose challenges for SAST tools. Depending on the tooling, these files may not be properly parsed, potentially causing the tool to miss important findings due to a lack of contextual understanding, such as:
Custom error handling depends on deployment mode
<customErrors mode="RemoteOnly" />
⠀ ✔ Looks fine in static analysis; it shows friendly errors to remote users.
✖ Contextual issue: If the app is misconfigured to treat all users as local, then stack traces are exposed even with this setting.
SSL enforcement logic in code, not in config.
<rewrite>
<!-- Missing rule for HTTPS redirection -->
</rewrite>
⠀ ✔ SAST flags the absence of HTTPS redirection in web.config, which is a valid finding.
✖ Contextual issue: If HTTPS redirection is handled in middleware or at a reverse proxy (like NGINX or Azure App Gateway), then this isn’t actually a security risk. SAST can’t always know that.
Authentication mode
<authentication mode="None" />
⠀ ✔ SAST will likely flag this as a critical issue.
✖ Contextual issue: If the app is a microservice behind an API gateway that handles auth, this may be acceptable. A SAST tool unaware of deployment architecture may raise false positives.
Debug enabled in a non-prod environment
<compilation debug="true" />
⠀ ✔ Flagged by SAST, correctly so in most cases.
✖ Contextual issue: If this web.config is only used in a staging or development slot, it might be intentional and not a production risk.
Authorization settings ignored in custom pipelines
✖ Contextual issue: If a custom authentication mechanism bypasses ASP.NET authorization modules, this setting may be ineffective, but a SAST tool won’t see that unless it’s deeply integrated with the entire codebase.
Developer overhead
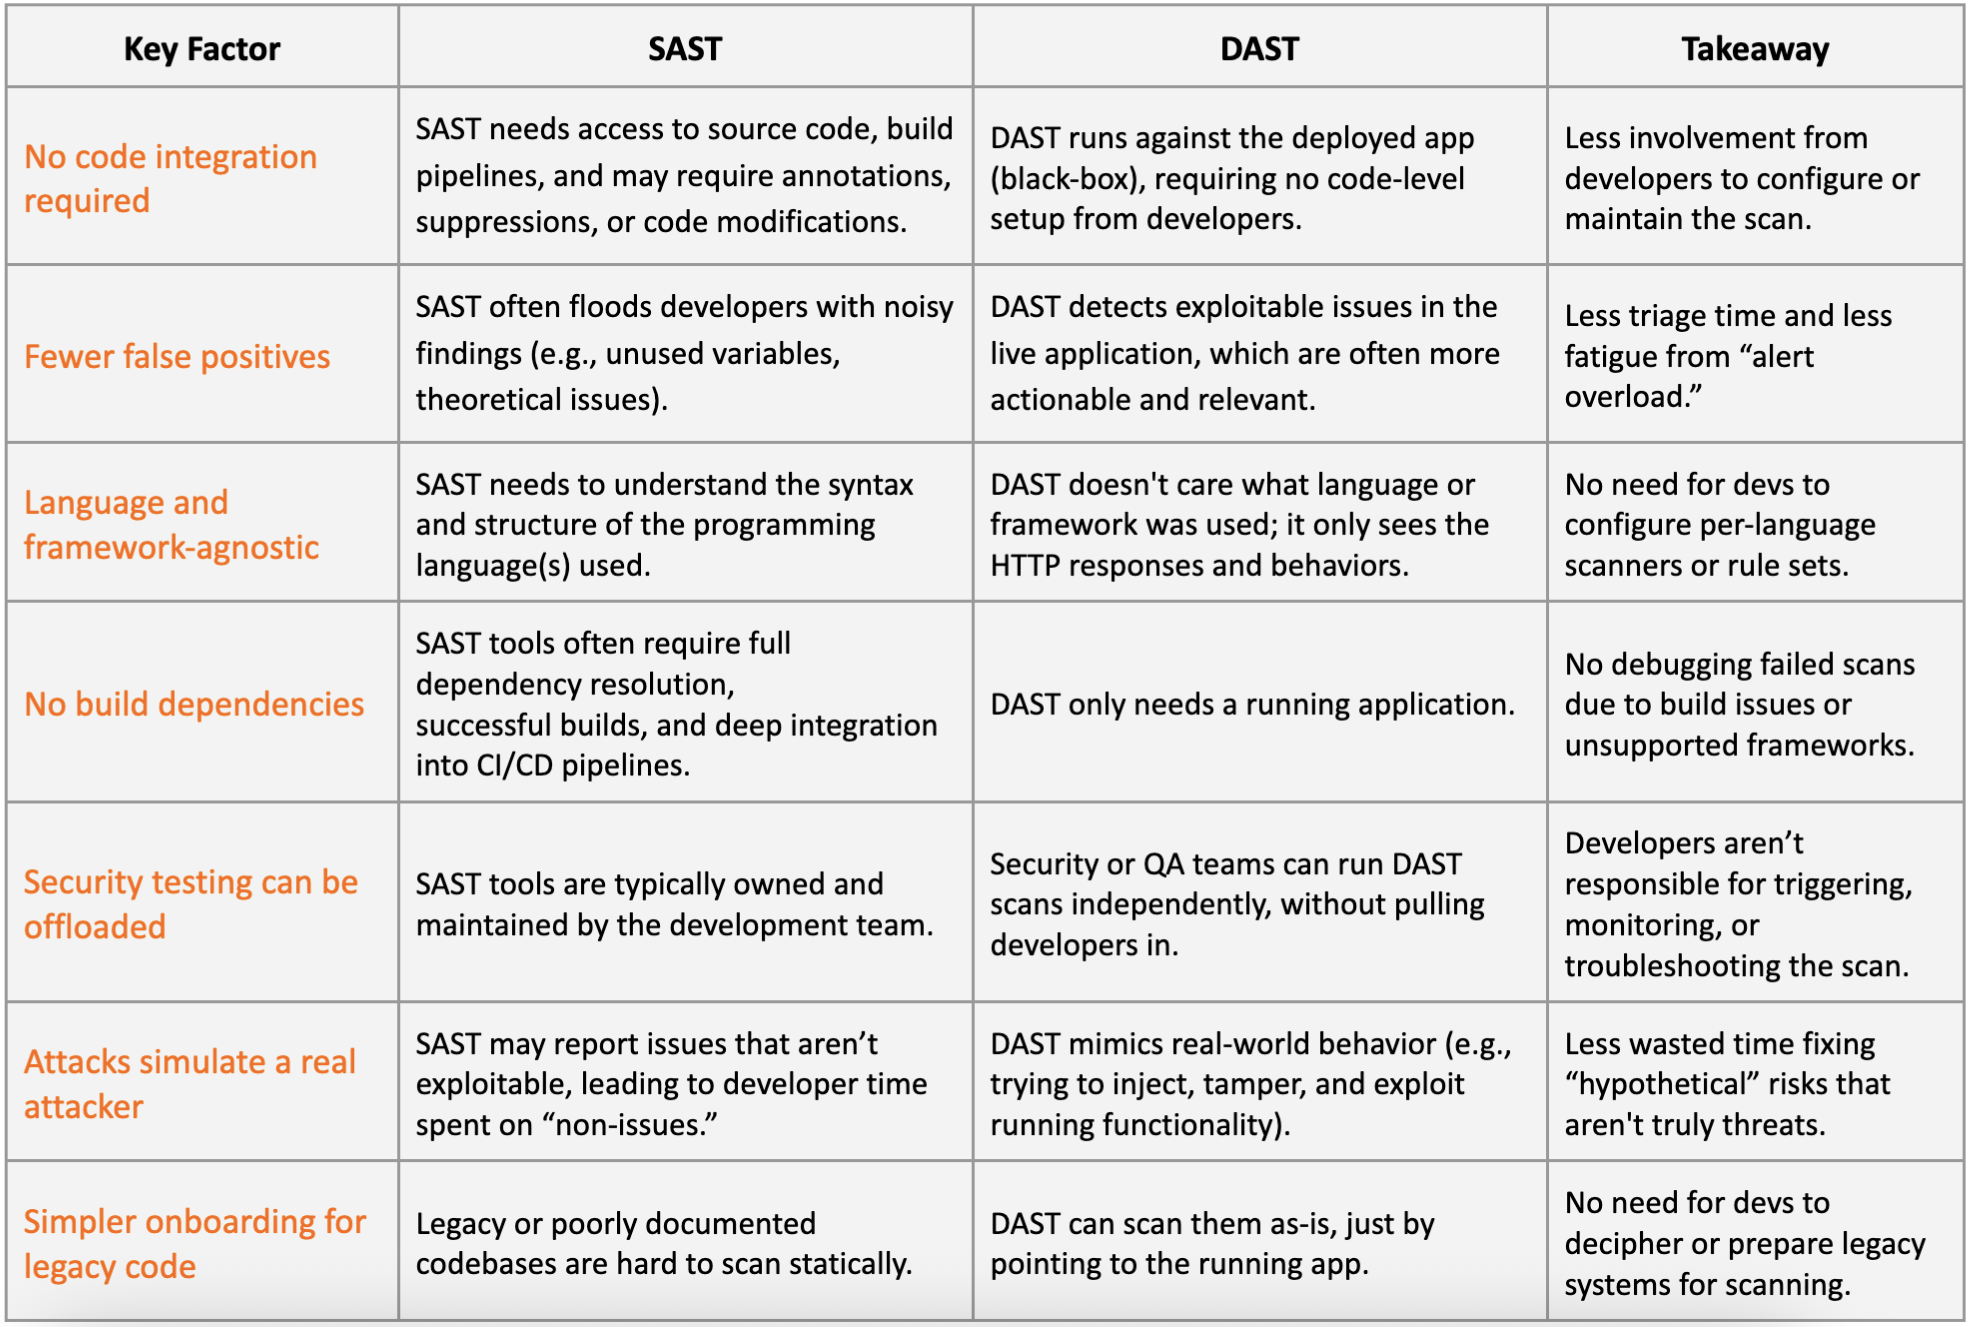
For organizations seeking to minimize developer burden, DAST is frequently the preferred option over SAST. DAST processes evolve alongside your web applications, continuing to scan them so that your business can promptly identify and remediate emerging issues. Let’s finish by taking a look at a range of underlying dynamics that make DAST an easy decision for developers looking to fortify application security – table below.
You’ve likely seen this support ticket countless times: a user’s Internet connection that worked just fine a moment ago for Slack and DNS lookups is suddenly hung the moment they attempt a large file upload, join a video call, or initiate an SSH session. The culprit isn’t usually a bandwidth shortage or service outage issue, it is the “PMTUD Black Hole” — a frustration that occurs when packets are too large for a specific network path, but the network fails to communicate that limit back to the sender. This situation often happens when you’re locked into using networks you do not manage or vendors with maximum transmission unit (MTU) restrictions, and you have no means to address the problem.
Today, we are moving past these legacy networking constraints. By implementing Path MTU Discovery (PMTUD), the Cloudflare One Client has shifted from a passive observer to an active participant in path discovery.
Dynamic Path MTU Discovery allows the client to intelligently and dynamically adjust to the optimal packet size for most network paths using MTUs above 1281 bytes. This ensures that a user’s connection remains stable, whether they are on a high-speed corporate backbone or a restrictive cellular network.
The “modern security meets legacy infrastructure” challenge
To understand the solution, we have to look at how modern security protocols interact with the diversity of global Internet infrastructure. The MTU represents the largest data packet size a device can send over a network without fragmentation: typically 1500 bytes for standard Ethernet.
As the Cloudflare One client has evolved to support modern enterprise-grade requirements (such as FIPS 140-2 compliance), the amount of metadata and encryption overhead within each packet has naturally increased. This is a deliberate choice to ensure our users have the highest level of protection available today.
However, much of the world’s Internet infrastructure was built decades ago with a rigid expectation of 1500-byte packets. On specialized networks like LTE/5G, satellite links, or public safety networks like FirstNet, the actual available space for data is often lower than the standard. When a secure, encrypted packet hits an older router with a lower limit (e.g., 1300 bytes), that router should ideally send an Internet Control Message Protocol (ICMP) message stating “Destination Unreachable” back to the sender to request a smaller size.
But that doesn’t always happen. The “Black Hole” occurs when firewalls or middleboxes silently drop those ICMP feedback messages. Without this feedback, the sender keeps trying to send large packets that never arrive, and the application simply waits in a “zombie” state until the connection eventually times out.
Instead of waiting for an error message that might never come, the client proactively sends encrypted packets of varying sizes to the Cloudflare edge. This probe tests MTUs from the upper bound of the supported MTU range to the midpoint, until the client narrows down to the exact MTU to match. This is a sophisticated, non-disruptive handshake happening in the background. If the Cloudflare edge receives a specific-sized probe, it acknowledges it; if a probe is lost, the client instantly knows the precise capacity of that specific network segment.
The client then dynamically resizes its virtual interface MTU on the fly, by periodically validating the capacity of the path that we established at connection onset. This ensures that if, for example, a user moves from a 1500-MTU Wi-Fi network at a station to a 1300-MTU cellular backhaul in the field, the transition is seamless. The application session remains uninterrupted because the client has already negotiated the best possible path for those secure packets.
Real-world impact, from first responders to hybrid workers
This technical shift has profound implications for mission-critical connectivity. Consider the reliability needs of a first responder using a vehicle-mounted router. These systems often navigate complex NAT-traversal and priority-routing layers that aggressively shrink the available MTU. Without PMTUD, critical software like Computer Aided Dispatch (CAD) systems may experience frequent disconnects during tower handoffs or signal fluctuations. By using active discovery, the Cloudflare One Client maintains a sticky connection that shields the application from the underlying network volatility.
This same logic applies to the global hybrid workforce. A road warrior working from a hotel in a different country often encounters legacy middleboxes and complex double-NAT environments. Instead of choppy video calls and stalled file transfers, the client identifies the bottleneck in seconds and optimizes the packet flow — before the user even notices a change.
Get PMTUD for your devices
Anyone using the Cloudflare One Client with the MASQUE protocol can try Path MTU Discovery now for free. Use our detailed documentation to get started routing traffic through the Cloudflare edge with the speed and stability of PMTUD on your Windows, macOS, and Linux devices.
If you are new to Cloudflare One, you too can start protecting your first 50 users for free. Simply create an account, download theCloudflare One Client, and follow ouronboarding guide to experience a faster, more stable connection for your entire team.
Три минути. Толкова е времето между гласуванията на първо и второ четене на законопроект, приет с пълно мнозинство от 186 депутати от всички парламентарни групи (плюс четирима независими), присъстващи на заседанието на Народното събрание на 19 февруари 2026 г. Без дискусии, без експертни становища, без оценка на въздействието. Гласуването на първо четене е в 10:51, а на второ – съответно в 10:54.
Кой е нормативният акт, променен с такова забележително единодушие?
Става въпрос за Закона за закрила на детето (ЗЗД). Конкретно – за т.нар. регистър на педофилите, приет през лятото на 2023 г. по предложение на „Възраждане“. Отново „Възраждане“ инициира и гласуваното на 19 февруари изменение. С него част от регистъра става публична. По-специално, „три имена на извършителя, дата на раждане, постоянен и настоящ адрес, вид престъпление и размер на наказанието“, а за чужденците се включват и „данните за държавите по произход“.
Това нововъведение може да има последствия, отиващи твърде далеч – не само за извършителите, а и за някои от жертвите им, но също така и за цялото общество. Преди да се спрем върху потенциалното му въздействие обаче, нека припомним контекста, в който то беше прието.
Не консенсус, а поддаване на натиск
Гласуването на промените в ЗЗД става на фона на политическата употреба на една трагедия – смъртта на шестима души, между които и непълнолетно момче, в хижа „Петрохан“ и край връх Околчица. Още преди да стане ясно колко са мъртвите, случаят беше свързан с „педофилията“ и „сектите“ – токсични теми, особено когато са в комбинация, а отговорността беше хвърлена върху ПП–ДБ. Заради споразумение без правна сила, подписано от министър, чиято партия вече дори не е част от тази коалиция.
Етикетът „педофилия“ е прикрепен към трагедията на основата на твърдения от страна на един човек, който казва, че е имал интимни отношения с лидера на групата, когато е бил на 15 и повече години, и на подадени сигнали от роднини на дете – опасенията, изразени в тях, не са потвърдени. Дори да се окажат верни, няма никакви данни някой от ПП–ДБ да е знаел за това.
Под привидното единство при гласуването на промените в ЗЗД се открояват три вида парламентарни групи.
Първите („Възраждане“, ИТН и ДПС – Ново начало) активно призовават „регистърът на педофилите“ да стане публичен. Вторите (ПП–ДБ) се снишават, защото и без това без вина вече са обвинени в педофилия. Третите (останалите) са пасивни наблюдатели – било защото са печеливши от ситуацията (основно ГЕРБ), било за да не се набутват между точно тези токсични шамари.
Интересен детайл е, че макар законопроектът да е на „Възраждане“, представителите на партията са обрани в изказа си. Те изтъкват преди всичко необходимостта да бъдат защитени децата, позовавайки се на информация за различни форми на сексуални престъпления срещу малолетни и непълнолетни. Докладчикът Георги Хрисимиров посочва и статистически данни, показващи увеличаване на случаите на трафик на деца. Последното е отчасти подвеждащо, защото сексуалната експлоатация е само една от формите на трафик – наред с трудовата експлоатация, просията или търговията с органи.
За разлика от Хрисимиров, Тошко Йорданов (ИТН), който взема думата още преди депутатът от „Възраждане“ да е представил законопроекта, е неудържим. Той многократно използва думи, производни от „педофилия“, а следните словосъчетания – по няколко пъти: „педофилска секта“ (три пъти, два от които в съчетание с „петроханската“) и „ламата педофил“ (три пъти). В този словесен коктейл Йорданов 12 пъти споменава абревиатурата НПО в негативен контекст (едно от споменаванията гласи „педофилското НПО“), а ПП–ДБ, в същия контекст – 6 пъти. Без да броим споменаването на множество настоящи и бивши представители на коалицията и политици, асоциирани с нея.
И Хамид Хамид от ДПС – Ново начало споменава „педофилски НПО-та“. За разлика от Тошко Йорданов, който обвинява хора, организации и партии в прав текст, Хамид прави намеци като „има парламентарни групи, които се хвърлят на амбразурата да защитават педофилските прояви“. Когато заявява: „Макар и служебно, педофилите проникнаха в правителството на Република България“, председателката на Народното събрание Рая Назарян го съветва да се въздържа „от подобни квалификации“.
Ден по-рано впрочем, на 18 февруари, Хамид предложи възрастта на съгласие, която според Наказателния кодекс е 14 години, да се вдигне на 16 – отново без оценка на въздействието. Това беше прието, засега само на първо четене. Ако мине и на второ, 18-годишните, които са в сексуална връзка с 15-годишни, вече ще са престъпници и ще могат да влязат в „регистъра на педофилите“.
Възможни последствия от публичния регистър
На пръв поглед основанията за промяната в ЗЗД изглеждат благовидни. Да си представим обаче, че публичният регистър вече е факт, и да проиграем няколко възможни хипотези:
Първа хипотеза. Благодарение на регистъра живеещите в един блок разбират, че техен съсед е осъждан за педофилия. За да предпазят децата си, те го принуждават да напусне своя апартамент. Съседите си отдъхват. Но този човек не може да си намери жилище другаде, защото при всеки опит престъплението, за което е осъден, излиза наяве. Ако не иска да остане бездомен, ще му се наложи да заживее някъде, без да се регистрира адресно. За новите му съседи регистърът ще е безполезен, защото няма да знаят кой е този човек. Може да предположим, че немалко от включените в регистъра биха постъпили именно така, за да могат изобщо да живеят някъде.
Втора хипотеза. Случай на сексуално престъпление срещу дете става медийно известен. След излежаване на присъдата си извършителят излиза на свобода. Възмутени граждани решават да вземат нещата в свои ръце. От регистъра разбират къде живее той. Причакват го и го подлагат на линч, в резултат на който човекът умира. А възмутените граждани стават подсъдими за убийство.
Трета хипотеза. Осъден за сексуално престъпление срещу дете не живее нито на постоянния, нито на настоящия си адрес. Но хората, които живеят на тези адреси, стават непрекъснато обект на тормоз и агресия от страна на „борци с педофилията“. Макар да не са извършили нищо нередно, а някои от тях може дори да са жертви на осъдения.
Четвърта хипотеза. Баща е осъден, защото е насилвал сексуално детето си. Понеже бащата е в регистъра, познатите на семейството и на детето могат да се досетят, че именно то е жертвата. Така, вместо детето да се възстановява психически и да намери сили да продължи напред, публичността на посегателството прибавя нова травма към вече съществуващата.
Пета хипотеза. Лице със сексуални предпочитания към деца и много пари има идея как да разреши проблема с намирането на жилище за осъдените за педофилия, или поне на някои от тях. Построява сграда, в която се заселват само такива като него. Разбира се, под сурдинка. Обитателите на сградата заживяват като сплотена група, влияейки се един от друг, вместо да са в среда, която ги стимулира да потискат склонностите си. Организират си партита, на които присъстват малолетни. Така, вместо децата да са по-защитени, стават по-уязвими.
Шеста хипотеза. Извършители на сексуални престъпления срещу деца, които имат дебели връзки и/или са злоупотребявали с деца, за които на обществото не му пука особено, правят всичко по силите си да не бъдат осъдени. Съответно регистърът не се отнася за тях.
Пардон, последното не е хипотеза, а факт. Сещате ли се за протестантския пастор, за когото има данни, че е насилвал поне 14 деца от ромския квартал „Надежда“ в Сливен? Той е подсъдим от почти три години, но досега близо 30 съдии са подали отвод по делото. И няма кой да го осъди. А учителката от Каблешково – повече от година след като случаят стана публичен, няма информация за движението по разследването срещу нея. Въпреки че казусът беше прехвърлен на варненската прокуратура, след като бургаската с нищо не показа, че защитава интересите на детето. Много случаи на сексуална злоупотреба с деца пък потъват, без изобщо да станат публично известни.
С инициирането на публичен „регистър на педофилите“ „Възраждане“ не открива топлата вода. Подобни практики съществуват например и в САЩ. В някои страни от Западна Европа подходът е по-скоро противоположен – дори за престъплението да се съобщава, не се споменава името както на жертвата (или жертвите), така и на извършителя. А ако името на престъпника е било известно, има процедура то да бъде „забравено“ в интернет. На тази тема е посветен анализ (на английски език) в YouTube канала Type Ashton.
Основанията за премълчаването на самоличността на извършителя са поне две. Първо, след като е изтърпял наказанието си, се очаква той да има възможност да се реинтегрира в обществото. Всеки, който не е осъден на доживотен затвор, би следвало да има този шанс.
Второ, когато извършителят не е известен, това намалява риска да се появят негови подражатели. Има немалко случаи на хора, които стават престъпници, защото са се вдъхновили от други престъпници, добили популярност в публичното пространство.
Що се отнася до „възпиращата“ функция на публичния регистър, има предостатъчно данни, че тежестта на едно наказание няма особена превантивна функция. Щом дори перспективата за смъртна присъда не спира някои хора да извършват определени престъпления, рискът от публично опозоряване едва ли би имал по-сериозен ефект за тях. Да не забравяме, че Щатите може да си имат публични регистри, но си имат и досиетата „Епстийн“.
В България обаче акцентът пада върху тежестта на наказанията, а не върху превенцията. Ако някой има сексуална склонност към деца, той или тя може да не е в състояние да я преодолее, но е възможно да се научи да я контролира, ако получи съответната подкрепа. И в резултат на това да не злоупотребява с деца. Както един алкохолик не престава да бъде такъв, но може да спре да пие.
В немската документална поредица Die Frage например се представя историята (на немски език, но са налични и български субтитри) на интимна двойка мъж и жена. Те са част от група за взаимопомощ на педофили, обединени от каузата, че не искат да стават извършители, и получават психологическа подкрепа.
Друга форма на превенция, която в България не се радва на одобрение, е сексуалното образование. Колкото по-рано едно дете знае кое отношение към тялото му е в реда на нещата, кое не и как да реагира, ако допустимите граници бъдат прекрачени, толкова по-способно ще е то да разпознава сексуалната злоупотреба. И съответно да се предпазва от нея.
Работата с родителите е също много важна с оглед на превенцията. Защото някои от тях отказват да повярват, че детето им е било сексуално насилвано, особено ако извършителят е познат на семейството и то има доверие в него. Да не говорим, че има родители, които знаят, но си затварят очите. Особено ако извършителят е другият родител (кръвен или доведен) или техен интимен партньор.
Когато една тема е табу, представите за нея са мъгляви и безформени. Така е с педофилията. За да можем ефективно да се предпазим от нещо обаче, на първо място трябва да знаем какво е то. Ала какво разбираме под педофилия?
Първо, дали е склонност, или постъпка? Според Световната здравна организация (СЗО) е влечение. В едно демократично общество човек не може да бъде осъден единствено защото има някаква склонност – престъпление е само ако направиш нещо (или не направиш, а е трябвало).
Второ, на каква възраст трябва да е едно дете, за да става дума за педофилия? Според СЗО педофилията е влечение към деца в предпубертетна или ранна пубертетна възраст. В българския Наказателен кодекс думата „педофилия“ не се споменава, но са забранени сексуалните контакти с деца под 14-годишна възраст. Над 14 са разрешени, освен при определени случаи, например когато тийнейджърите са в зависима позиция спрямо извършителя. Регистърът на случаите на педофилия обаче включва извършителите на сексуални престъпления срещу лица до 18 години. В широк смисъл думата се използва за сексуални контакти с лица, ненавършили възрастта за съгласие, независимо каква е тя.
Трето, трябва ли да има някаква възрастова разлика между извършителя и детето, за да можем да говорим за педофилия? Според здравия разум – да, според българското законодателство – не. Ако 18-годишно момче е правило секс с 13-годишно момиче, защото момичето го е излъгало, че е на 16, момчето може да бъде осъдено. И да влезе в регистъра на педофилите.
50-годишен човек обаче, който е във връзка с 14-годишно дете по взаимно съгласие, няма да влезе в регистъра. В Германия например възрастта за съгласие е също 14 години, но човек, имащ сексуални отношения с тийнейджър между 14 и 16 години, трябва да е най-много на 21. В България, вместо да се помисли за въвеждане на подобна възрастова разлика, директно се върви към увеличаване на възрастта за съгласие. За да се създадат „служебно“ още повече престъпници и да има с какво да се пълни регистърът.
Но може би целта е да нямаме общо споделено разбиране за педофилията, а да я възприемаме като аморфно плашило.
Така тя ще продължи успешно да се използва като средство за натиск, за опозоряване на политически противници и на НПО-тата. Дори въпросните партии, политици и неправителственият сектор като цяло да нямат нищо общо с педофилията и със сексуалните престъпления срещу малолетни и непълнолетни.
А който си позволи да изрази критично становище, трябва да е готов да поеме риска да му лепнат етикета „защитник на педофилията“. И все пак някой трябва да го прави, защото иначе съвсем ще затънем в блатото на популизма – със съдействието на партиите, които уж са демократични, но ги е грижа за оцеляването си повече, отколкото за демократичните ценности.
И няма кой да повдигне въпроса: в европейско общество ли искаме да живеем, което цени хуманизма, или в общество на позорни стълбове и линчове?
В крайна сметка „Възраждане“, които също се борят за политическото си оцеляване на фона на новия политически проект на Румен Радев, победиха без бой. За трети път, след като през 2023 г. предложиха „регистъра на педофилите“ и той беше приет, а година по-късно инициираха промените в Закона за предучилищното и училищното образование, с които беше забранено говоренето по теми, свързани с ЛГБТИ. А ПП–ДБ, колкото и да се снишават, са в губеща позиция.
Британците казват, че любопитството убива котката. Може да добавим, че популизмът убива политиката.
Да проектираш сграда, която да остане в живота на няколко поколения, да оформяш физиономичността на града е културен жест, към който архитектите от всички времена са се отнасяли с респект. След тях обаче идват грижата и разбирането на културните историци, които интерпретират контекста.
Теодор Караколев е сред най-разпознаваемите изследователи на българската архитектура между двете световни войни и съосновател на Фондация „Български архитектурен модернизъм“. Фондацията изследва образци на архитектурата и изкуството в периода между 20-те и 40-те години на миналия век, организира изложби и лекции, поддържа една от най-големите онлайн общности, интересуващи се от архитектурно наследство.
Журналист и лектор в множество инициативи, включително и архитектурни обиколки, с деликатното си академично присъствие Тео Караколев предлага мултидисциплинарен подход. Не просто да архивира, а да напомня, че сме част от процес, от непрекъсната трансформация на търсенията и контекста – това е мисията на „Български архитектурен модернизъм“.
В началото много мислех върху това колко голяма част от архитектурната история акцентираше върху сградите. Хората ги нямаше – какви са били, какво са правили, каква е връзката между човека и сградата. А интериорите също са част от ежедневието ни. На връщане към къщи може да избереш четири-пет маршрута. Но влезеш ли, имаш само едно стълбище, понякога го ползваш през целия си живот. Ако си израснал в някоя сграда, ще ти е трудно да я видиш с нови очи. Тя е тривиална част от теб, несъзнавано усещане, което те формира. Затова за мен е важно да покажем на хората, че това, което обитават, е всъщност красиво, достойно.
Никой не си прави илюзията, че градовете ни не са опърпани, недобре поддържани, „но не са безвъзвратно грозни“, настоява Тео Караколев.
Важно е да знаем, че средата ни има стойност. Това, което се нуждае от ремонт, може да бъде поправено. Градската ни среда има стойност. Това особено силно важи за по-малките населени места, където хората са се затворили.
А всичко започва именно от ентусиасткото отстояване на вярата, че информацията трябва да бъде достъпна. И от една страница в социалните мрежи. Дипломната работа на Васил Макаринов в Нов български университет е свързана точно с архитектурата на модернизма и след защитата той решава да публикува събраните материали. Годината е 2013-та и страницата предизвиква неподправен интерес. Тео Караколев му изпраща информация за сгради от Сливен – така се запознават и бързо откриват, че искат да работят заедно. Извън дигиталното пространство и двамата продължават изследователската си дейност и надграждат с лекции, изложби и събития на живо за изкушени от темата непрофесионалисти.
Освен изследователско ровене из архиви и общински документи, работата на Васил Макаринов (за съжаление, напуснал ни твърде рано) и Теодор Караколев е да проследяват историята на множество малки сгради, да идентифицират архитекти, да анализират стилови особености. Те систематично документират и описват десетки малки обществени сгради, училища, читалища и къщи на заможни семейства в градове като Пловдив, Варна, Бургас, Стара Загора, Ямбол, Казанлък.
Това, което „Български архитектурен модернизъм“ като платформа успява да постигне, е повишаване на обществената чувствителност към опазването на ценни сгради.
Тео Караколев е завършил изкуствознание в НБУ, докторант е в направление „Изобразителни изкуства“ към АМТИИ, но още като тийнейджър е заинтригуван от фотографията, снима кадри, които са на ръба на абстракцията, имат ритъм и семпла конструкция, ясни форми, основно черно-бяло или монохромно. Впоследствие открива, че същите неща търси и в архитектурата. Едва ли е случаен интересът му към ар деко и функционализма, както и последователното проучване на сгради образци.
Историята на изкуството и историята на архитектурата са свързани, разделението, което съществува в България, го няма на други места. Това, което ние се опитваме да правим, е изкуствоведски поглед към архитектурата.
Разделянето на стилове и периоди улеснява научния разказ за историята, но унищожава човека, твореца. Всеки е конкретна индивидуалност със своя собствена душевност. Твори в конкретен период – барок, ренесанс, модернизъм – и ако бъде поставен в съответния период, ще създаде различни неща в духа на своето време. Но винаги ще бъде себе си.
Така че аз харесвам определен тип творци, а не течения. Предпочитам такива, които не са толкова разказвателни и директни в посланието си.
Тео Караколев с основание акцентира върху факта, че няма направления, които да се ограничават само до конкретни послания, но има творци, които настояват върху разделението на добро и лошо, на приемливо и неприемливо, на допустимо и недопустимо.
Предпочитам тези, които ми оставят място за мислене, задават въпроси и провокират. Наскоро отново разглеждах постоянната експозиция на Националната галерия. И ето например Иван Милев – той е представен там със свои обичайни сюжети: жени със забрадки, задушници, погребения. Аз не съм сигурен какво трябва да мислим за тях. Дали те са тъжни, какво става, продължава ли животът, трябва ли да го надмогнем? Няма директна трагедия. А те обзема усещането, че и друг преживява същото, през което и ти минаваш. Изкуството е това, за което можеш да се хванеш.
При Златю Бояджиев например любим ми е периодът непосредствено преди инсулта му. Там той е най-прецизен, най-конкретен в рисунъка си. Има няколко сюжета с овчари, хора на нивата – по същия начин животът изглежда труден, но има надежда. В трудността има смисъл.
Търсенията на Теодор Караколев са категорично отвъд лесните отговори. В дълбочината и непознаваемостта на изкуството. Там, където има живот, а не опит да се документира действителността или да се изведе лесно послание.
В годините, в които се е налагало да чете задължителна литература в училище, Тео Караколев си е спестявал колкото може от програмата, за да освободи пространство за собствените си интереси. Днес не го нарича бунтарство, но се съгласява да го определим като независимост. Това е времето, в което открива Гогол и Достоевски.
Конкретно в рецепцията на архитектурата днес той наблюдава консервативна реакция, която призовава за връщане към академичното. В последните години в различни среди става популярна критиката на модернизма и противопоставянето ѝ на европейската архитектура от времето до XIX век. Подобен прочит е повърхностен, създава фалшива представа и не отчита колко прогресивни са били конкретни артисти за времето си. Парадоксално е например приемането за академичен пример на „сецесиона – течение, което свързваме с неговата пищност, с неизговорените желания, но и с критиката му към академизма“.
И преди, и сега архитектурата бива използвана за политически битки.
Дали обаче изкуството преднамерено не улавя бъдното? Според Тео Караколев ние сами конструираме подобни очаквания. Историята на изкуствата е пълноводно течение и ние избираме върху кое да акцентираме, какво да разкажем. Невинаги знаем кой е бил по-влиятелен в собственото си време. Не можем да сме сигурни, че конкретен артист провижда идващо събитие, защото около него има още стотина, които улавят други неща.
Ето например филмът от 1920 г. „Кабинетът на доктор Калигари“, който е интерпретиран като предсказване за идването на Хитлер заради сляпото доверие, хипнозите, сомнамбулизма. Но не е ли твърде лесно да се намери тази връзка, когато събитието вече се е случило? Всяко произведение от този период показва несигурността, алтернативните търсения, несъзнаваното.
По-глобално погледнато, не вярвам, че историята има предначертан предварително път. Върху общия поток силно влияят отделни хора или групи от хора.
Именно такава група успява да генерира около себе си „Българският архитектурен модернизъм“. Самият Тео споделя, че има нужда от това да вярва в гражданската енергия, структурирана в отделни миниобщества.
Чисто исторически има периоди на концентрация на история. В България в годините малко преди влизането в Европейския съюз досега сякаш имаше някакъв що-годе консенсус какво правим и накъде се движим. Сега сме в друг момент. Но отвъд злободневното аз мисля, че конкретният човек може да влияе силно, макар и върху малък кръг хора. И това е гражданското общество – съществуването на голям брой хора, които са активни. Ако обществото е здраво, то ще намери реакция срещу тоталитарните държави. Може би затова Германия успява да се възроди след Хитлер. Въпреки травмата.
Основното за мен е много хора да вярват, че могат да променят нещата. Това е силата на гражданското общество.
Теодор Караколев открива собствения си път. И днес, докато се разхожда в Стария град на Пловдив или по тепетата, в кварталите и край реката, обича понякога да е сам.
Понякога предпочита разходките из непознати градове пред контролираната музейна среда. Но истински си почива в планината. Въпреки заниманията си със скално катерене се определя скромно като планинар.
Градовете ми дават цивилизационно преживяване, а планината е мястото, на което да преработя това. Там нищо не те разсейва, там всичко е природно, перфектно, няма какво да му мислиш. Планинарството е по-пасивно, ти присъстваш. Впечатли ме Грузия. Там е страхотно зелено на същата надморска височина, на която в България вече няма толкова растителност, защото липсва вода. В същото време си обграден от четири-петхилядници. Хората са успели да запазят живота си на село – те са запознати със света, все пак живеят на място, през което ежедневно минават по десетина туристи. Но са съхранили усещането си за нормалност.
Хората, които тихо и кротко променят средата, формират общности и задават посоки, в които има смисъл да тръгнем заедно. Тук ви срещаме с тях. Това са „Тези хора“.
Shortly after the first set of explosions, Iranians received bursts of notifications on their phones. They came not from the government advising caution, but from an apparently hacked prayer-timing app called BadeSaba Calendar that has been downloaded more than 5 million times from the Google Play Store.
The messages arrived in quick succession over a period of 30 minutes, starting with the phrase ‘Help has arrived’ at 9:52 am Tehran time, shortly after the first set of explosions. No party has claimed responsibility for the hacks.
It happened so fast that this is most likely a government operation. I can easily envision both the US and Israel having hacked the app previously, and then deciding that this is a good use of that access.
When you need to use a proxy to keep your zero trust environment secure, it often comes with a cost: poor performance for your users. Soon after deploying a client proxy, security teams are generally slammed with support tickets from users frustrated with sluggish browser speed, slow file transfers, and video calls glitching at just the wrong moment. After a while, you start to chalk it up to the proxy — potentially blinding yourself to other issues affecting performance.
We knew it didn’t have to be this way. We knew users could go faster, without sacrificing security, if we completely re-built our approach to proxy mode. So we did.
In the early days of developing the device client for our SASE platform, Cloudflare One, we prioritized universal compatibility. When an admin enabled proxy mode, the Client acted as a local SOCKS5 or HTTP proxy. However, because our underlying tunnel architecture was built on WireGuard, a Layer 3 (L3) protocol, we faced a technical hurdle: how to get application-layer (L4) TCP traffic into an L3 tunnel. Moving from L4 to L3 was especially difficult because our desktop Client works across multiple platforms (Windows, macOS, Linux) so we couldn’t use the kernel to achieve this.
To get over this hurdle, we used smoltcp, a Rust-based user-space TCP implementation. When a packet hit the local proxy, the Client had to perform a conversion, using smoltcp to convert the L4 stream into L3 packets for the WireGuard tunnel.
While this worked, it wasn’t efficient. Smoltcp is optimized for embedded systems, and does not support modern TCP features. In addition, in the Cloudflare edge, we had to convert the L3 packets back into an L4 stream. For users, this manifested as a performance ceiling. On media-heavy sites where a browser might open dozens of concurrent connections for images and video, and the lack of a high performing TCP stack led to high latency and sluggish load times when even on high-speed fiber connections, proxy mode felt significantly slower than all the other device client modes.
Introducing direct L4 proxying with QUIC
To solve this, we’ve re-built the Cloudflare One Client’s proxy mode from the ground up and deprecated the use of WireGuard for proxy mode, so we can capitalize on the capabilities of QUIC. We were already leveraging MASQUE (part of QUIC) for proxying IP packets, and added the usage of QUIC streams for direct L4 proxying.
By leveraging HTTP/3 (RFC 9114) with the CONNECT method, we can now keep traffic at Layer 4, where it belongs. When your browser sends a SOCKS5 or HTTP request to the Client, it is no longer broken down into L3 packets.
Instead, it is encapsulated directly into a QUIC stream.
This architectural shift provides three immediate technical advantages:
Bypassing smoltcp: By removing the L3 translation layer, we eliminate IP packet handling and the limitations of smoltcp’s TCP implementation.
Native QUIC Benefits: We benefit from modern congestion control and flow control, which are handled natively by the transport layer.
Tuneability: The Client and Cloudflare’s edge can tune QUIC’s parameters to optimize performance.
In our internal testing, the results were clear: download and upload speeds doubled, and latency decreased significantly.
Who benefits the most
While faster is always better, this update specifically unblocks three key common use cases.
First, in coexistence with third-party VPNs where a legacy VPN is still required for specific on-prem resources or where having a dual SASE setup is required for redundancy/compliance, the local proxy mode is the go-to solution for adding zero trust security to web traffic. This update ensures that “layering” security doesn’t mean sacrificing the user experience.
Second, for high-bandwidth application partitioning, proxy mode is often used to steer specific browser traffic through Cloudflare Gateway while leaving the rest of the OS on the local network. Users can now stream high-definition content or handle large datasets without sacrificing performance.
Finally, developers and power users who rely on the SOCKS5 secondary listener for CLI tools or scripts will see immediate improvements. Remote API calls and data transfers through the proxy now benefit from the same low-latency connection as the rest of the Cloudflare global network.
How to get started
The proxy mode improvements are available with minimum client version 2025.8.779.0 for Windows, macOS, and Linux devices. To take advantage of these performance gains, ensure you are running the latest version of the Cloudflare One Client.
Log in to the Cloudflare One dashboard.
Navigate to Teams & Resources > Devices > Device profiles > General profiles.
Select a profile to edit or create a new one and ensure the Service mode is set to Local proxy mode and the Device tunnel protocol is set to MASQUE.
You can verify your active protocol on a client machine by running the following command in your terminal:
warp-cli settings | grep protocol
Visit our documentation for detailed guidance on enabling proxy mode for your devices.
The public Internet relies on a fundamental principle of predictable routing: a single IP address points to a logically unique destination. Even in an Anycast architecture like Cloudflare’s, where one IP is announced from hundreds of locations, every instance of that IP represents the same service. The routing table always knows exactly where a packet is intended to go.
This principle holds up because global addressing authorities assign IP space to organizations to prevent duplication or conflict. When everyone adheres to a single, authoritative registry, a routing table functions as a source of absolute truth.
On the public Internet, an IP address is like a unique, globally registered national identity card. In private networks, an IP is just a name like “John Smith”, which is perfectly fine until you have three of them in the same room trying to talk to the same person.
As we expand Cloudflare One to become the connectivity cloud for enterprise backbones, we’ve entered the messy reality of private IP address space. There are good reasons why duplication arises, and enterprises need solutions to handle these conflicts.
Today, we are introducing Automatic Return Routing (ARR) in Closed Beta. ARR is an optional tool for Cloudflare One customers that gives you the flexibility to route traffic back to where it originated, without requiring an IP route in a routing table. This capability allows overlapping networks to coexist without a single line of Network Address Translation (NAT) or complex Virtual Routing and Forwarding (VRF) configuration.
The ambiguity problem
In enterprise networking, IP overlap is a fact of life. We see it in three common scenarios that traditionally cause toil for admins:
Mergers & acquisitions: Two companies merge, and both use 10.0.1.0/24 for their core services.
Extranets: Partners, vendors or customers securely connect to your network using their own internal IP schemes, leading to unavoidable conflicts.
Cookie-cutter architectures: SaaS providers or retail brands use identical IP space for every branch to simplify deployment and operation.
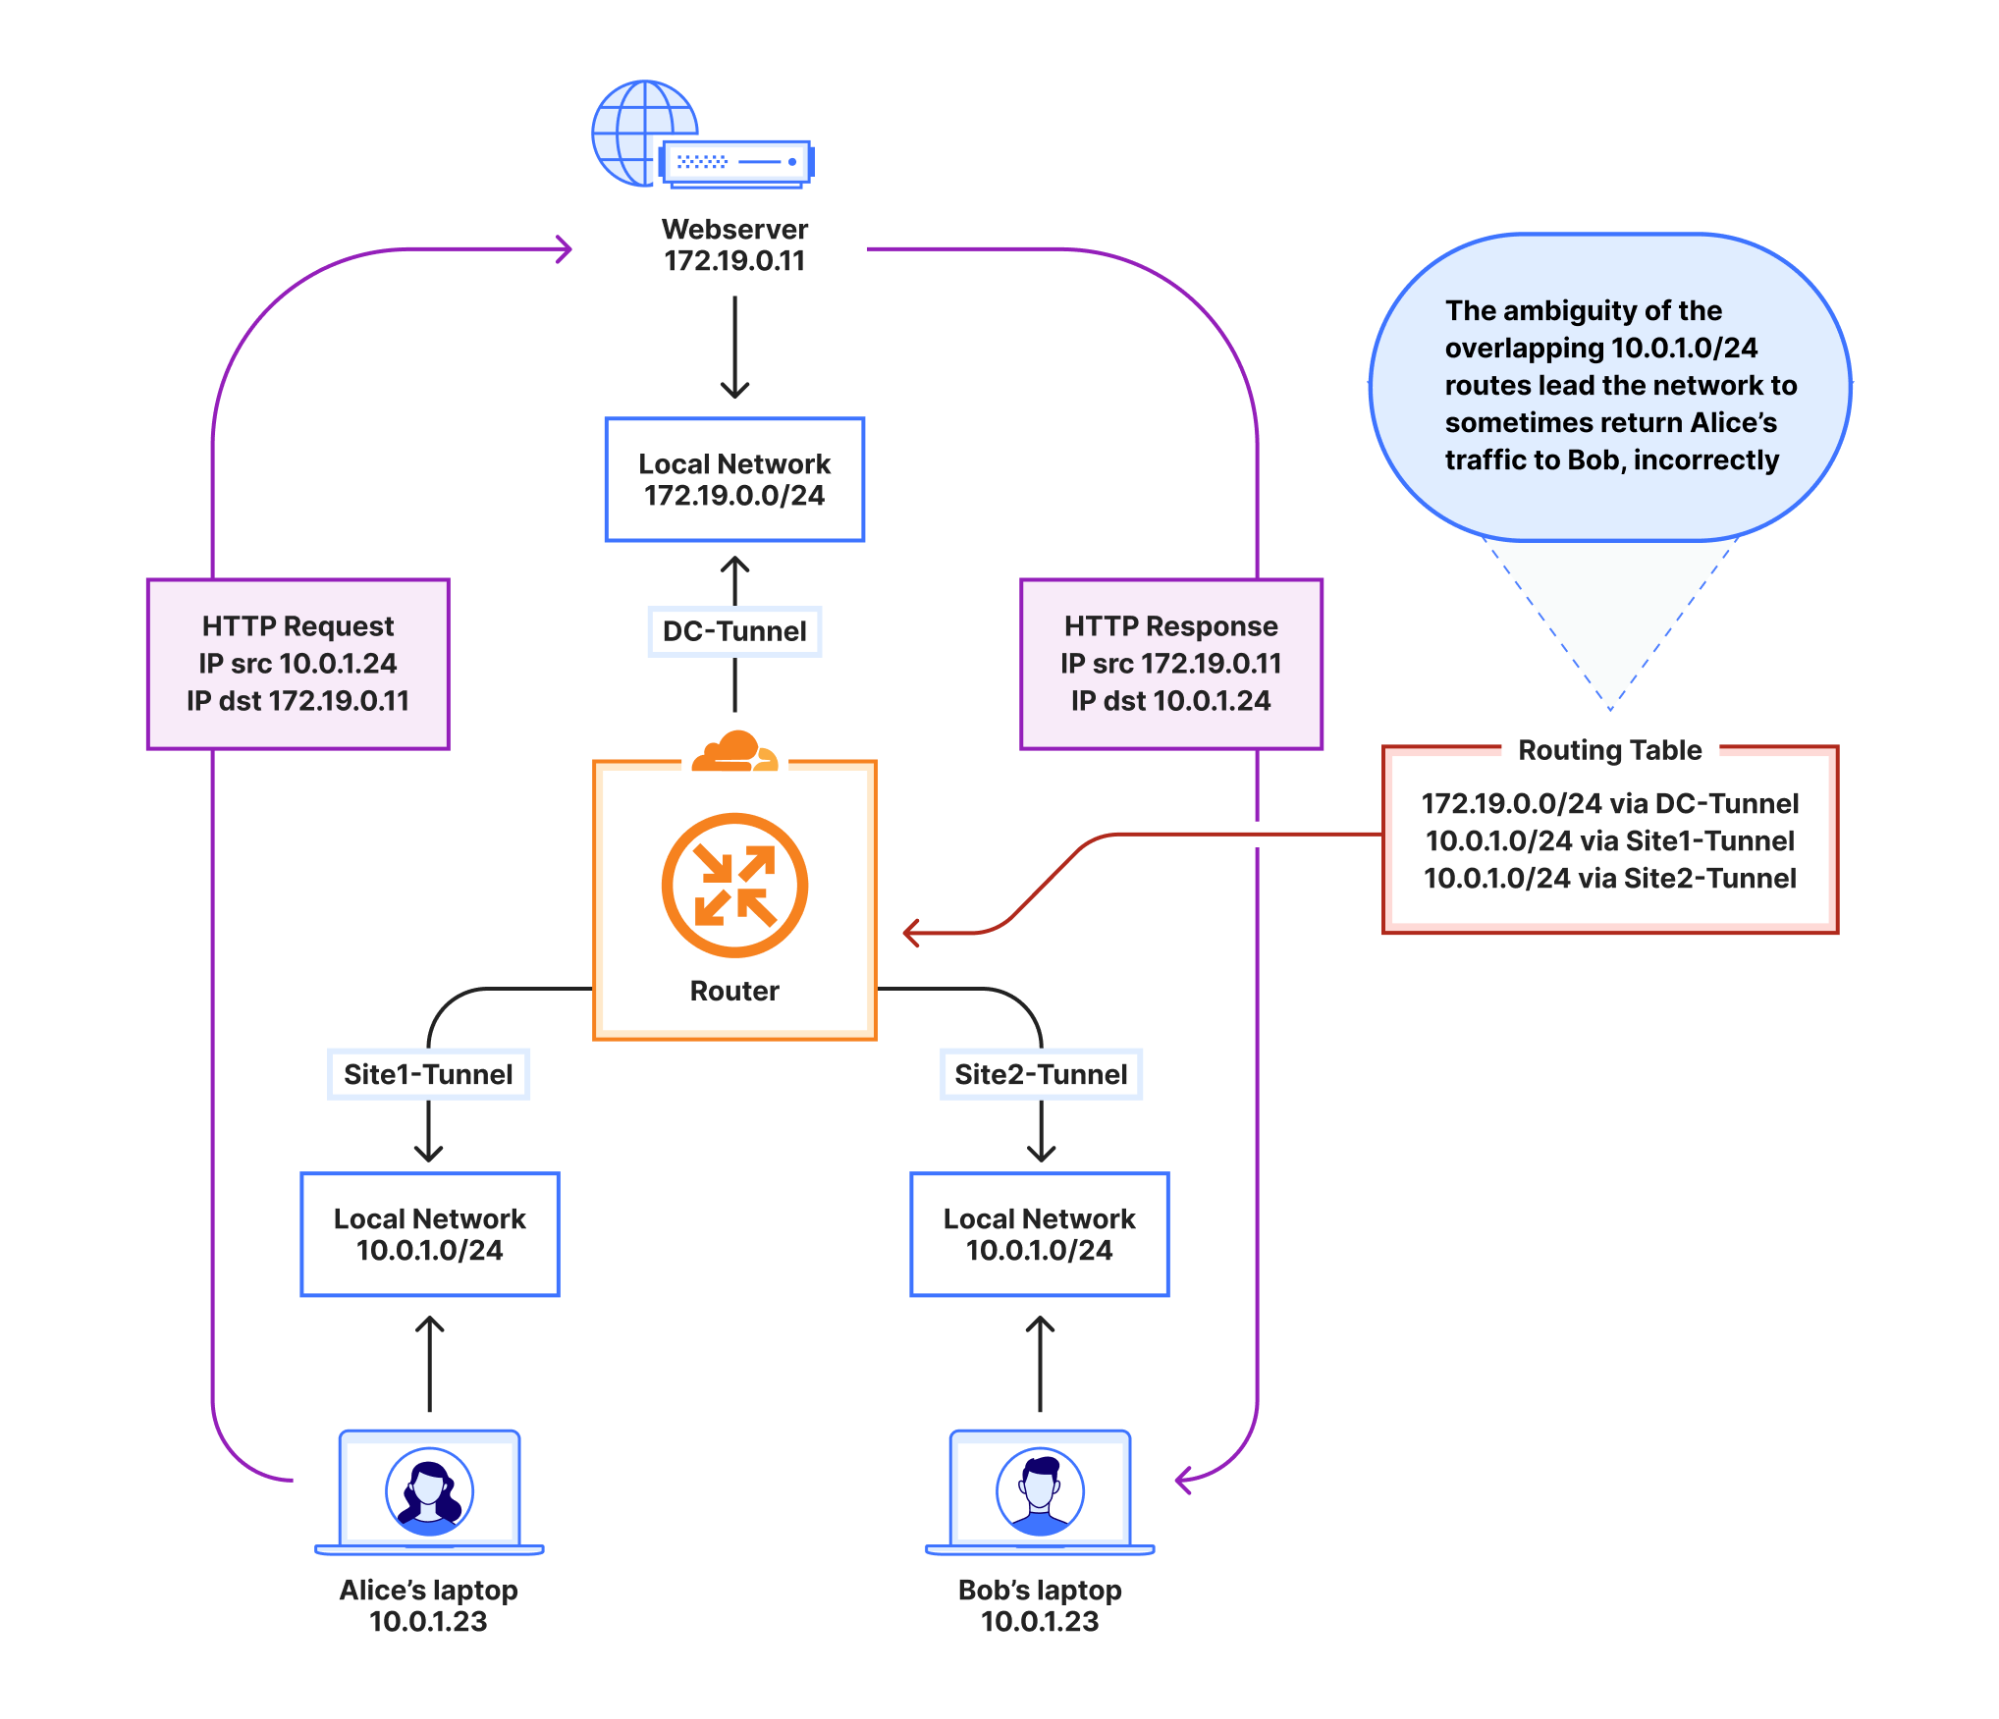
The problem arises when these sites try to talk to the Internet or a data center through Cloudflare. If two different sites send traffic from the same source IP, the return packet hits an architectural wall. The administrator has to make a decision on how to route the traffic based on the ambiguous destination. If the administrator puts both routes into the routing table, it will be non-deterministic as to which path is taken: the correct path or the incorrect path. From the perspective of a standard routing table, there is no way to distinguish between two identical paths.
This diagram shows two branches (Site A and Site B) both using 10.0.1.0/24. They send packets to Cloudflare. The return packet from the Internet reaches the Cloudflare edge, and this return traffic is sometimes sent to the wrong site because the routing table has two identical egress options.
Why traditional fixes fail
There are numerous ways to resolve this ambiguity, and we are committed to solving them in the easiest way for our customers to manage. The traditional “industry standard” fixes are functional, but they introduce significant administrative overhead and complexity that we are committed to eliminating:
Virtual Routing and Forwarding (VRF): This involves creating “virtual” routing tables to keep traffic isolated. While effective for separation, it adds administrative overhead. Managing cross-VRF communication (route leaking) is brittle and complex at scale.
Network Address Translation (NAT): You can NAT each overlapping subnet from an unmanaged IP space to a managed IP range that is unique in your network. This approach works well, but the mapping is administrative toil for each new site or partner.
Typically, the use case we hear from customers is an overlapping network needing to access the Internet or a private data center. How do we solve this without administrative overhead?
Introducing Automatic Return Routing (ARR)
We developed ARR as a “zero-touch” solution to this problem. ARR moves the intelligence from the routing table to stateful tracking.
So what is stateful tracking?
In traditional networking, a router is “forgetful” (aka “stateless”). It treats every single packet like a total stranger. Even if it just saw a packet from the exact same source going to the exact same destination a millisecond ago, it has to look at its routing table all over again to decide where to send the next one.
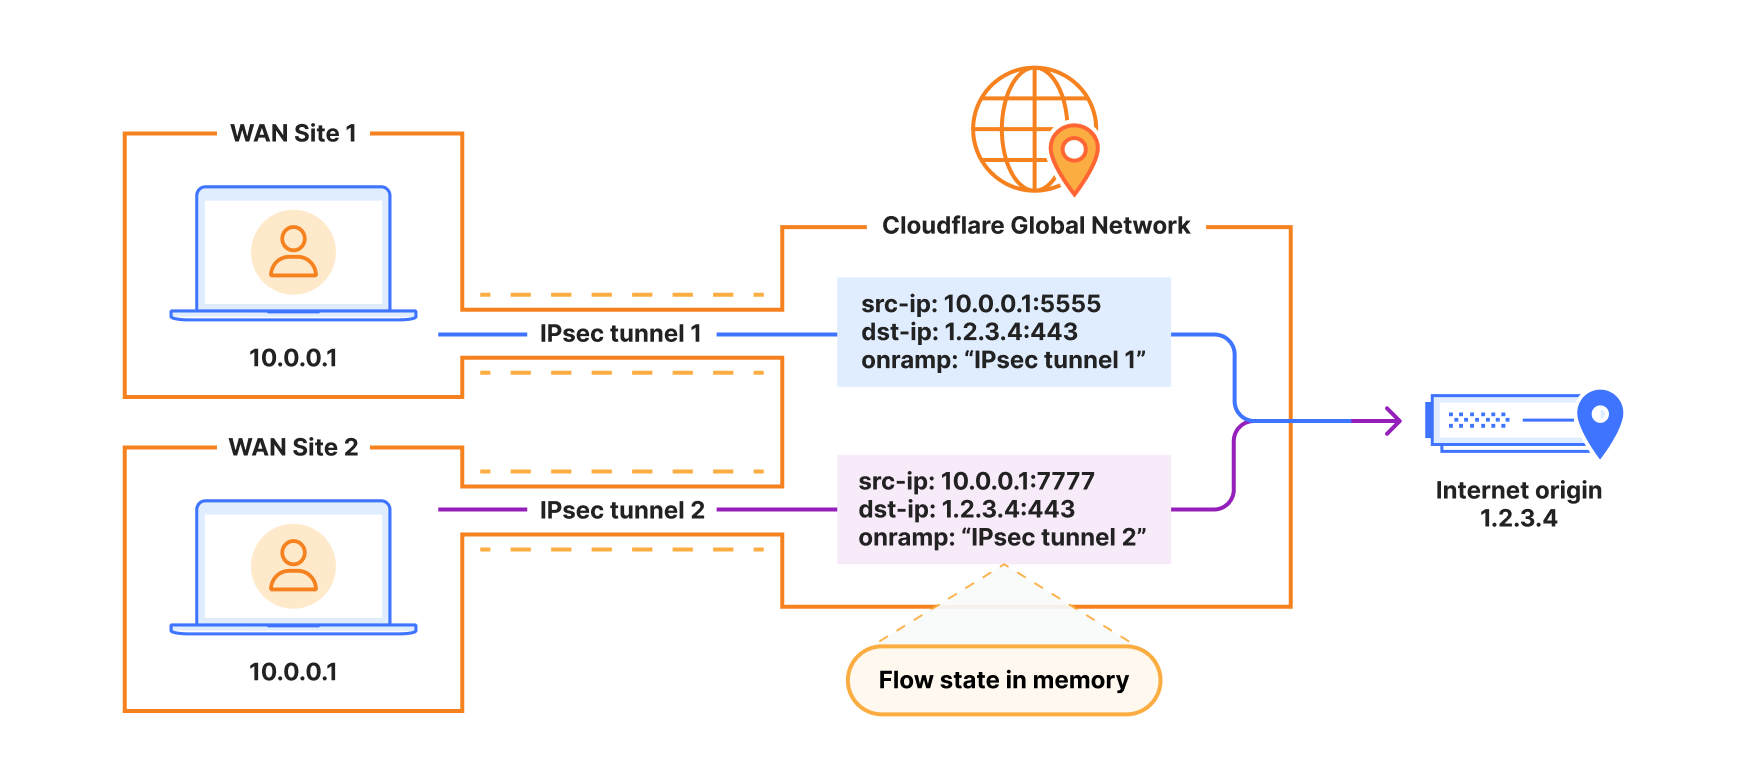
With stateful tracking, the system has a memory. It recognizes when a series of packets are all part of the same “flow” (that is, a network conversation between two endpoints), and remembers key information about that flow until it finishes. With ARR, we remember one extra piece of information when initializing the flow: the specific tunnel that initiated it. This allows us to send return traffic back to that same tunnel, without ever consulting a routing table!
Instead of asking the network, “Where does this IP live?” ARR asks, “Where did this specific conversation originate?”
Flow Matching: The Cloudflare Virtual Network first checks (by header inspection) whether that packet matches an existing flow.
Proxying: If the packet matches, that’s great! All of the decisions about this traffic have already been made and stored in our memory. All we need to do is pass that packet along already-established paths.
Flow Setup: If it doesn’t match an existing flow, we decide which parts of the Cloudflare One stack to pass it through (e.g. Gateway, DLP, Firewall), as well as its ultimate destination. We store all of this state in memory. With ARR, this is when we record which tunnel initiated the flow.
Symmetric Return: When return traffic arrives from the destination, the Cloudflare Virtual Network uses its existing in-memory state to proxy the traffic. Crucially, it does this without needing to examine the traffic’s destination IP, which could very well be reused across different sites. This completely bypasses the need to consult a routing table. We see the originating tunnel in the flow state and deliver the packet directly back to it.
Example of overlapping source IPs tracked by in-memory flow state, tagged with source onramp to inform return routing decision.
By remembering the originating tunnel for every flow, ARR facilitates zero-touch routing. If your site traffic is only client-to-Internet, there is no need to configure return routes at all, reducing toil when deploying new branch sites or “Coffee Shop Networking.”
Built on Unified Routing
To make ARR a reality at Cloudflare scale, we plugged into another initiative we have been working on: Unified Routing.
Historically, Cloudflare Zero Trust (users/proxies) and Cloudflare WAN (network-layer/sites) lived at different levels of the system. Cloudflare WAN relied on kernel primitives (Linux network namespaces, routes, eBPF, etc). Zero Trust lived in userspace, where proxies could perform deep inspection and application-level security. This “split-brain” approach often required complex logic to move traffic between component services, and some of this complexity became product limitations that customers might notice.
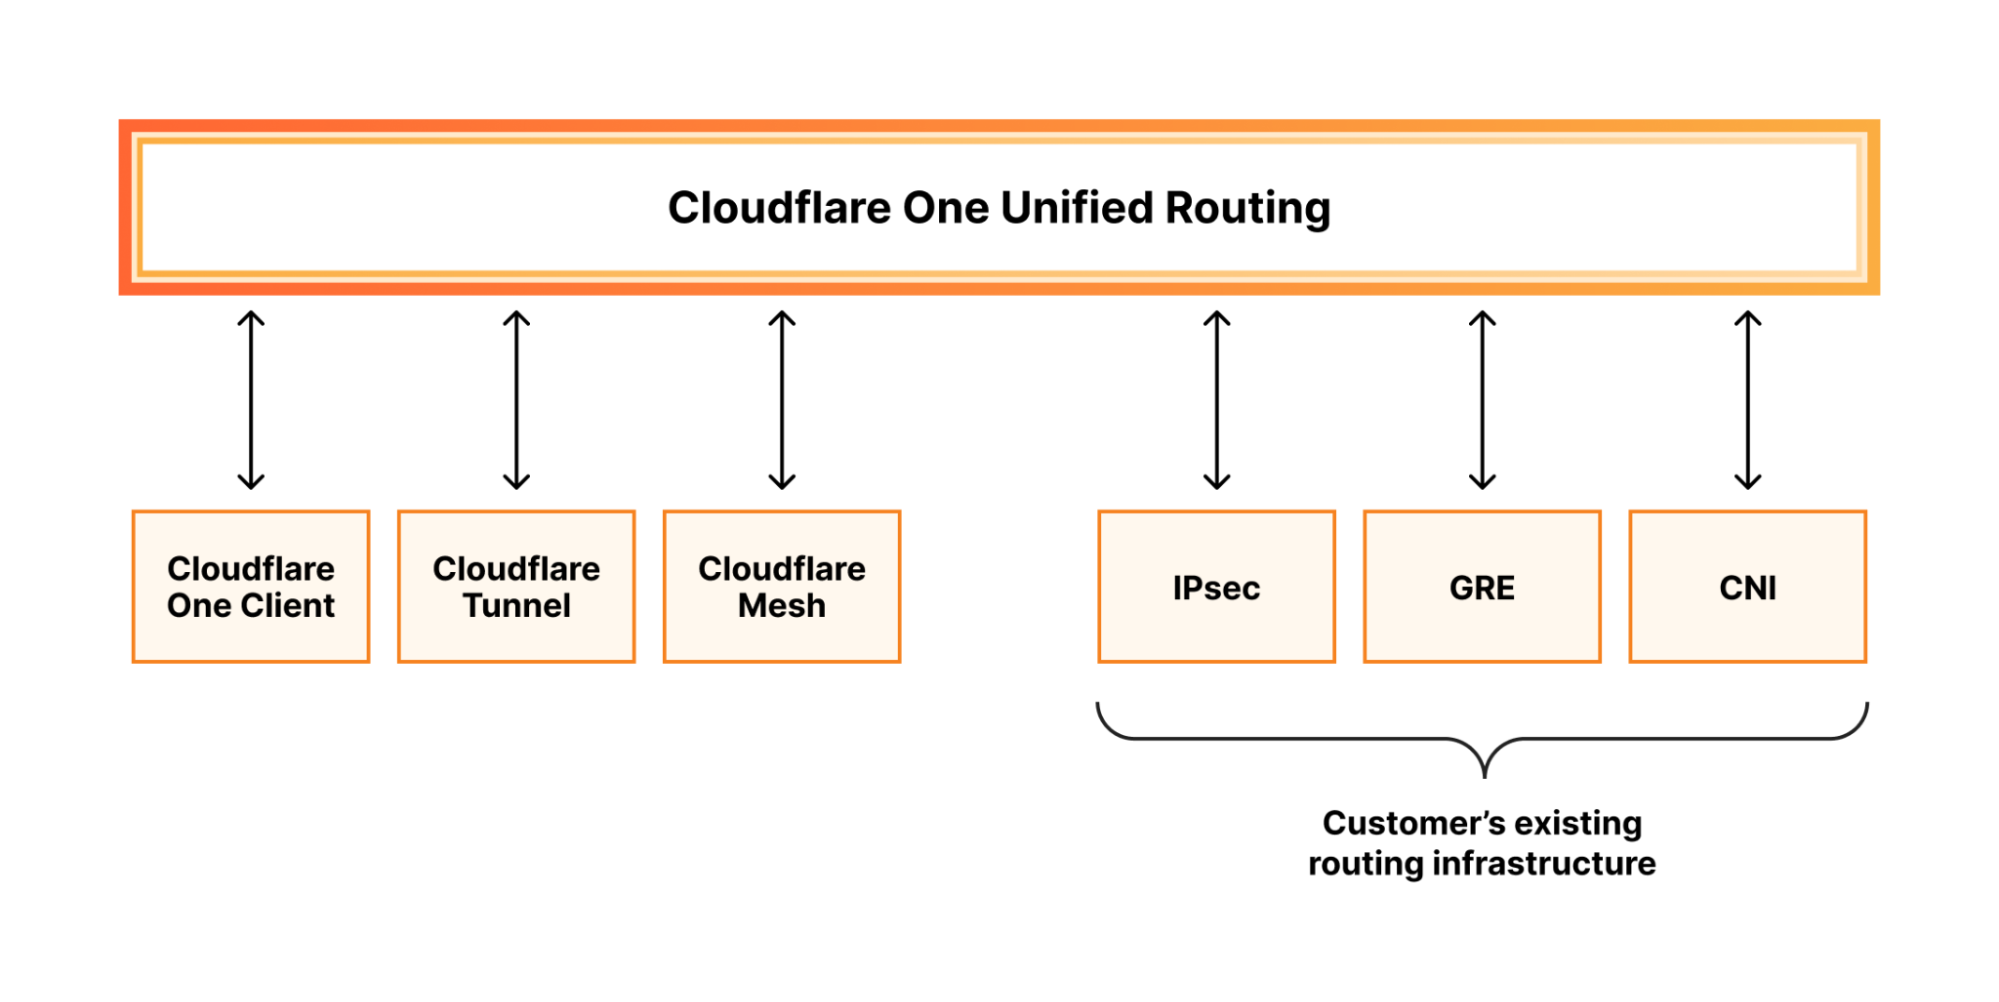
With our new Unified Routing mode, we have moved the initial routing decision from our network-layer data plane into our existing Zero Trust userspace routing logic, the same hardened software used by Cloudflare One Clients and Cloudflare Tunnel in our Zero Trust solution. This change has many benefits to how we enable our customers to use their private networks with products across the Cloudflare platform, as it fixes long-standing interoperability problems between Cloudflare WAN and Zero Trust. Unified Routing means you can use Cloudflare Mesh, Cloudflare Tunnel, and IPsec/GRE on-ramps together in the same account without a single conflict.
In September 2025, we deployed Unified Routing mode internally for all Cloudflare employees and sites. We saw immediate 3-5x performance improvements for Cloudflare One Clients, as you can see in the graph above.
When designing ARR, we knew that we needed to move away from kernel-based routing and build on our new Unified Routing framework.
When Unified Routing is enabled, all Cloudflare WAN traffic flows through Apollo, our Zero Trust hub. Unlike the Linux kernel’s standard routing table, our userspace data plane is fully programmable. We can attach metadata, like the originating Tunnel ID, directly to a flow entry in Apollo.
Each packet is tracked by flow from the moment it hits our edge, and we no longer need to make independent, per-packet routing decisions. Instead, we can make consistent, session-aware decisions for the lifetime of the flow.
Once enabled for a tunnel or interconnect, any traffic that matches an existing flow is routed back to the connection where it originated, without consulting the routing table.
Putting ARR to work
For the enterprise architect, ARR is a tool to bypass the persistent friction of IP address conflicts. Whether integrating an acquisition or onboarding a partner, the goal is to make the network invisible, so you can focus on the applications, not the plumbing.
Today, ARR is in closed beta and supports overlapping IP addresses accessing the Internet via our Secure Web Gateway. We are already extending this to support private data center access, adding mid-flow failover (pinning the flow to a primary onramp, and seamlessly detecting when that flow fails over to a backup onramp), and further investing in the architectural capabilities needed to make IP overlap a non-issue for even the most complex global deployments.
Not using Cloudflare One yet? Start now with our Free and Pay-as-you-go plans to protect and connect your users and networks, and contact us for comprehensive private WAN connectivity via IPsec and private interconnect.
Amazon Web Services (AWS) successfully completed the annual recertification audit with no findings for ISO 9001:2015, 27001:2022, 27017:2015, 27018:2019, 27701:2019, 20000-1:2018, 22301:2019, and Cloud Security Alliance (CSA) STAR Cloud Controls Matrix (CCM) v4.0. The objective of the audit was to enable AWS to expand their ISO and CSA STAR certifications to include one new AWS Region and one new AWS service to the scope. The ISO standards cover areas including quality management, information security, cloud security, privacy protection, service management, and business continuity. The certifications demonstrate the commitment of AWS to maintaining robust security controls and protecting customer data across our services.
As part of this recertification audit, one new Region [Asia Pacific (Taipei)] and one new service (AWS Deadline Cloud) were added into the scope since the last certification issued November 25, 2025.
For a full list of AWS services that are certified under ISO and CSA Star, see the AWS ISO and CSA STAR Certified page. Customers can also access the certifications in the AWS Management Console through AWS Artifact.
If you have feedback about this post, submit comments in the Comments section below.
Do you find yourself constantly looking up the difference between container_memory_usage_bytes, container_memory_working_set_bytes, and container_memory_rss? Pick the wrong one and your memory limits lie to you, your benchmarks mislead you, and your container gets OOMKilled.
The explanation is simple: RAM is not used in just one way. One of the easiest things to miss is the page cache semantics. For some containers, memory taken by page caching can make up most of the reported usage, even though that memory is largely reclaimable, creating surprising differences between those metrics.
NOTE: The feature discussed here currently only supports Linux.
Prometheus writes a lot of data to disk. It is, after all, a database. But not every write benefits from sitting in the page cache. Compaction writes are the clearest example: once a block is written, only a fraction of that data is likely to be queried again soon, and since there is no way to predict which fraction, caching it all offers little return. The use-uncached-io feature flag was built to address exactly this.
Bypassing the cache for those writes reduces Prometheus’s page cache footprint, making its memory usage more predictable and easier to reason about. It also relieves pressure on that shared cache, lowering the risk of evicting hot data that queries and other reads actually depend on. A potential bonus is reduced CPU overhead from cache allocations and evictions. The hard constraint throughout was to avoid any measurable regression in CPU or disk I/O.
The flag was introduced in Prometheus v3.5.0 and currently only supports Linux. Under the hood, it uses direct I/O, which requires proper filesystem support and a kernel v2.4.10 or newer, though you should be fine, as that version shipped nearly 25 years ago.
If direct I/O helps here, why was it not done earlier, and why is it not used everywhere it would help? Because direct I/O comes with strict alignment requirements. Unlike buffered I/O, you cannot simply write any chunk of memory to any position in a file. The file offset, the memory buffer address, and the transfer size must all be aligned to the logical sector size of the underlying storage device, typically 512 or 4096 bytes.
To satisfy those constraints, a bufio.Writer-like writer, directIOWriter, was implemented. On Linux kernels v6.1 or newer, Prometheus retrieves the exact alignment values via statx; on older kernels, conservative defaults are used.
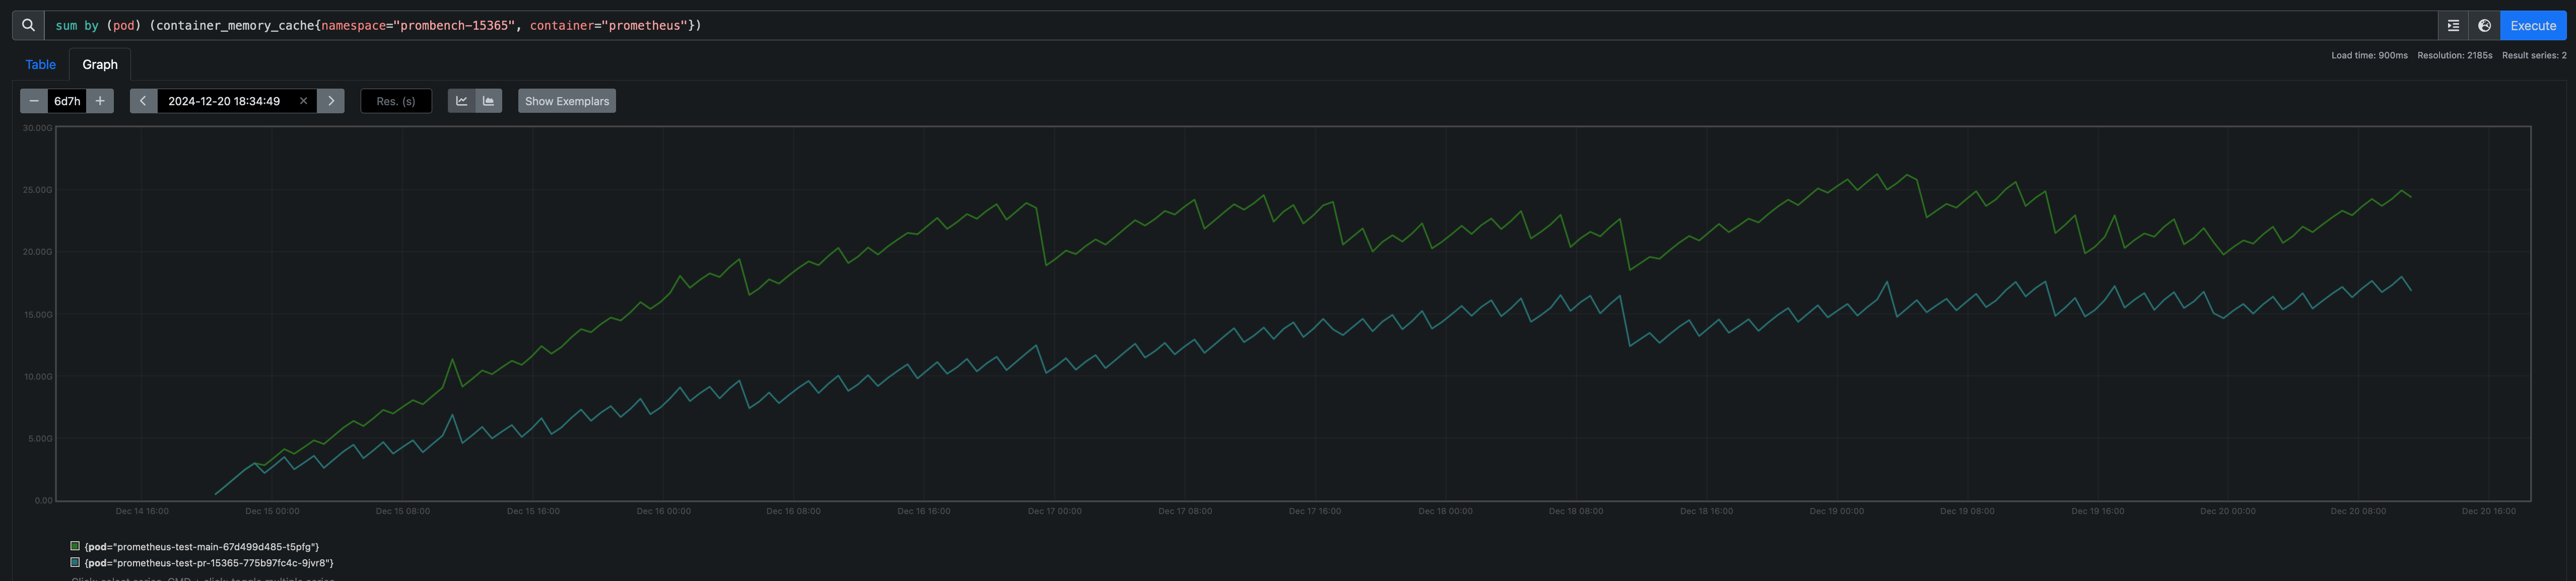
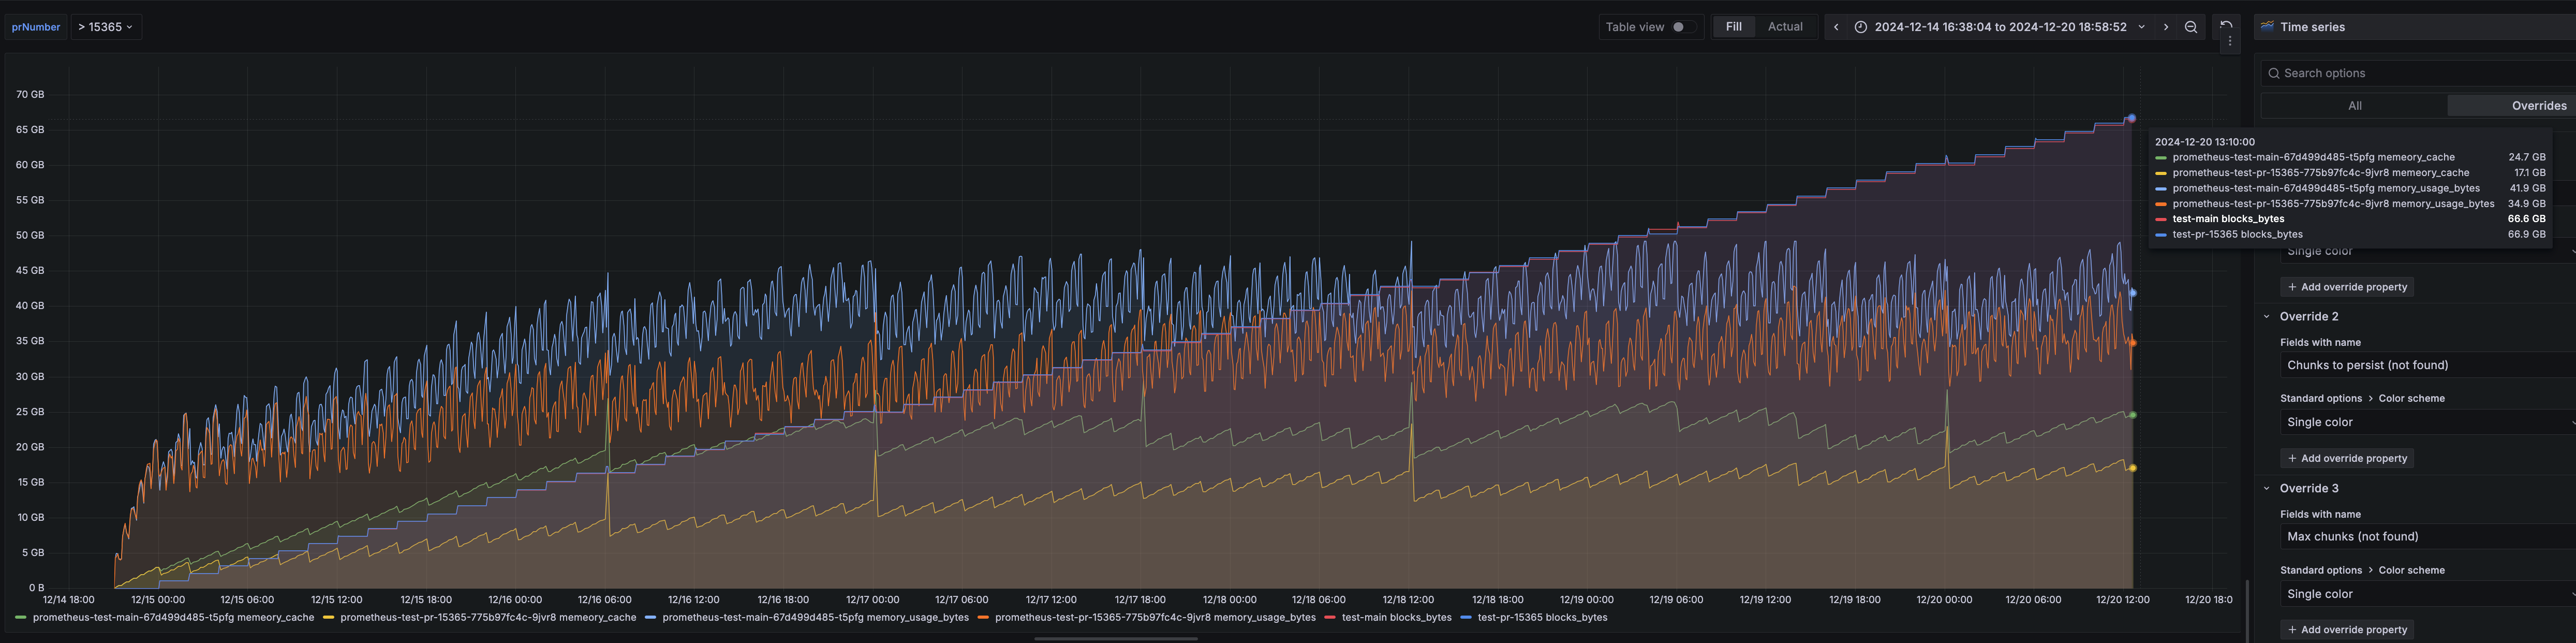
The directIOWriter currently covers chunk writes during compaction only, but that alone accounts for a substantial portion of Prometheus’s I/O. The results are tangible: benchmarks show a 20–50% reduction in page cache usage, as measured by container_memory_cache.
The work is not done yet, and contributions are welcome. Here are a few areas that could help move the feature closer to General Availability:
Covering more write paths
Direct I/O is currently limited to chunk writes during compaction. Index files and WAL writes are natural next candidates, although they would require some additional work.
Building more confidence around directIOWriter
All existing TSDB tests can be run against the directIOWriter using a dedicated build tag: go test --tags=forcedirectio ./tsdb/. More tests covering edge cases for the writer itself would be welcome, and there is even an idea of formally verifying that it never violates alignment requirements.
Experimenting with RWF_DONTCACHE
Introduced in Linux kernel v6.14, RWF_DONTCACHE enables uncached buffered I/O, where data still goes through the page cache but the corresponding pages are dropped afterwards. It would be worth benchmarking whether this delivers similar benefits without direct I/O’s alignment constraints.
Support beyond Linux
Support is currently Linux-only. Contributions to extend it to other operating systems are welcome.
For more details, see the proposal and the PR that introduced the feature.
This is a guest post by Jeffrey Wang, Co-Founder and Chief Architect at Amplitude in partnership with AWS.
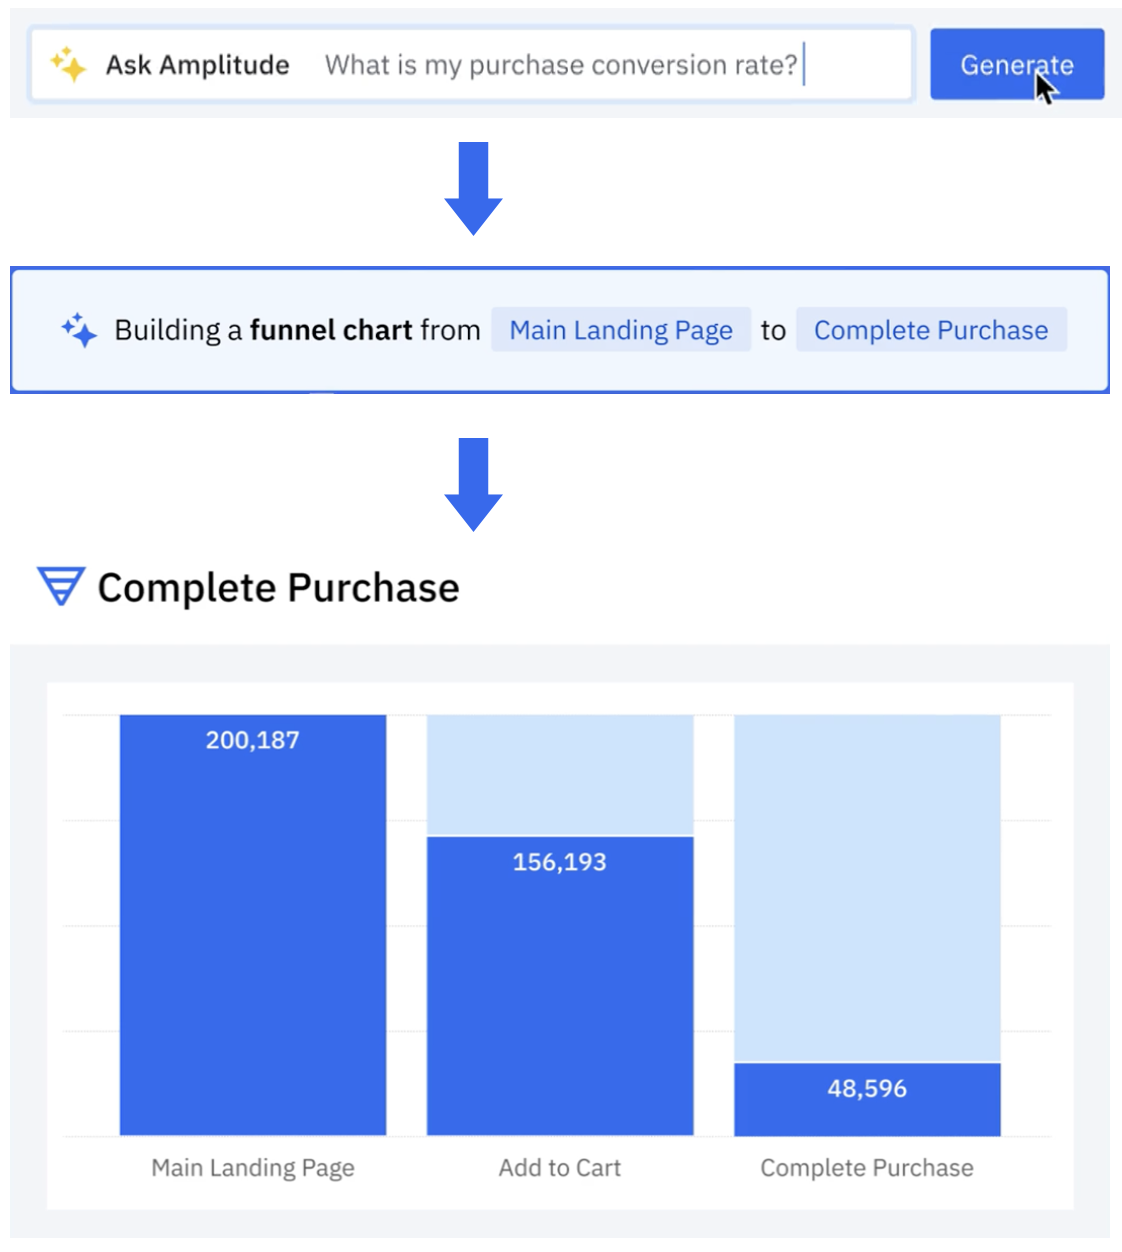
Amplitude is a product and customer journey analytics platform. Our customers wanted to ask deep questions about their product usage. Ask Amplitude is an AI assistant that uses large language models (LLMs). It combines schema search and content search to provide a customized, accurate, low latency, natural language-based visualization experience to end customers. Ask Amplitude has knowledge of a user’s product, taxonomy, and language to frame an analysis. It uses a series of LLM prompts to convert the user’s question into a JSON definition that can be passed to a custom query engine. The query engine then renders a chart with the answer, as illustrated in the following figure.
Amplitude’s search architecture evolved to scale, simplify, and cost-optimize for our customers, by implementing semantic search and Retrieval Augmented Generation (RAG) powered by Amazon OpenSearch Service. In this post, we walk you through Amplitude’s iterative architectural journey and explore how we address several critical challenges in building a scalable semantic search and analytics platform.
Our primary focus was on enabling semantic search capabilities and natural language chart generation at scale, while implementing a cost-effective multi-tenant system with granular access controls. A key objective was optimizing the end-to-end search latency to deliver rapid results. We also tackled the challenge of empowering end customers to securely search and use their existing charts and content for more sophisticated analytical inquiries. Additionally, we developed solutions to handle real-time data synchronization at scale, making sure constant updates to incoming data could be processed while maintaining consistently low search latency across the entire system.
RAG and vector search with Ask Amplitude
Let’s take a brief look at why Ask Amplitude uses RAG. Amplitude collects omnichannel customer data. Our end customers send data on user actions that are performed in their platforms. These actions are recorded as user-generated events. For example, in the case of retail and ecommerce customers, the types of user events include “product search,” “add to cart,” “checked out,” “shipping option,” “purchase,” and more. These events help define the customer’s database schema, outlining the tables, columns, and relationships between them. Let’s consider a user question such as “How many people used 2-day shipping?” The LLM needs to determine which elements of the captured user events are pertinent to formulating an accurate response to the query. When users ask a question to Ask Amplitude, the first step is to filter the relevant events from OpenSearch Service. Rather than feeding all event data to the LLM, we take a more selective approach for both cost and accuracy reasons. Because LLM usage is billed based on token count, sending complete event data would be unnecessarily expensive. More importantly, providing too much context can degrade the LLM’s performance—when faced with thousands of schema elements, the model struggles to reliably identify and focus on the relevant information. This information overload can distract the LLM from the core question, potentially leading to hallucinations or inaccurate responses. This is why RAG is the preferred approach. To retrieve the most relevant items from the product usage schema, a vector search is performed. This is effective even in situations when the question might not refer to the exact words that are in the customer’s schema. The following sections walk through the iterations of Amplitude’s search journey.
Initial solution: No semantic search
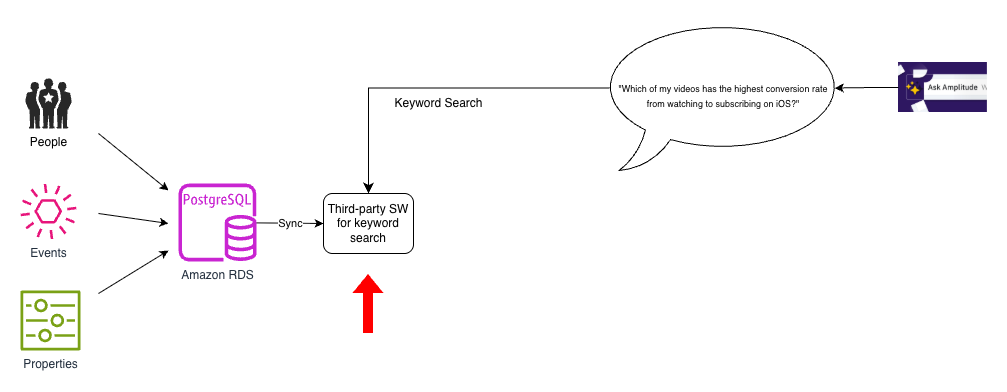
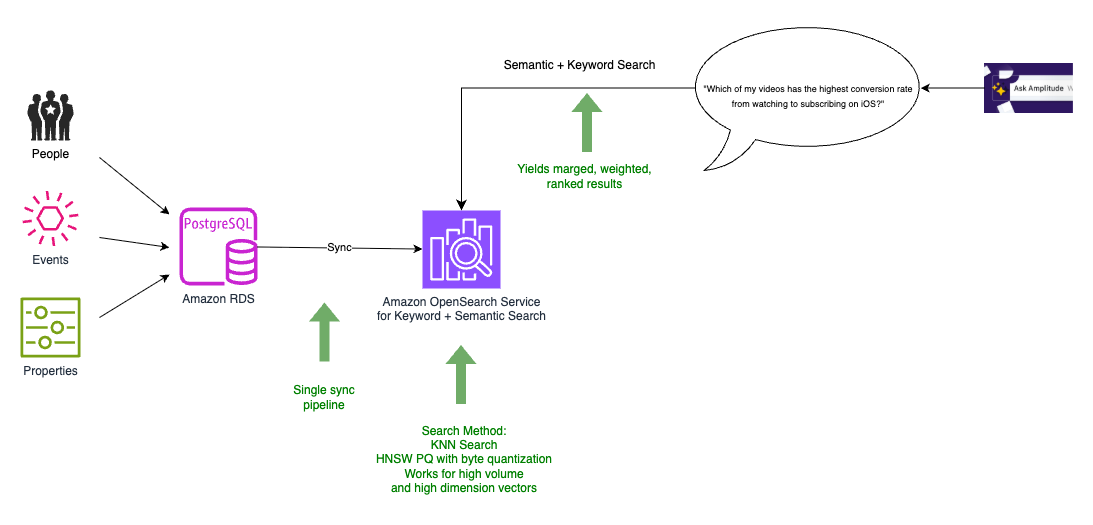
We used Amazon Relational Database Service (Amazon RDS) for PostgreSQL as the primary database to store our people, events, and properties data. However, as the following diagram shows, we had a separate, third-party store to implement keyword search. We had to bring in data from PostgreSQL to this third-party search index and keep it updated.
This architecture was simple but had two key shortcomings: there were no natural language capabilities in our search index, and the search index supported only keyword search.
Iteration 1: Brute force cosine similarity
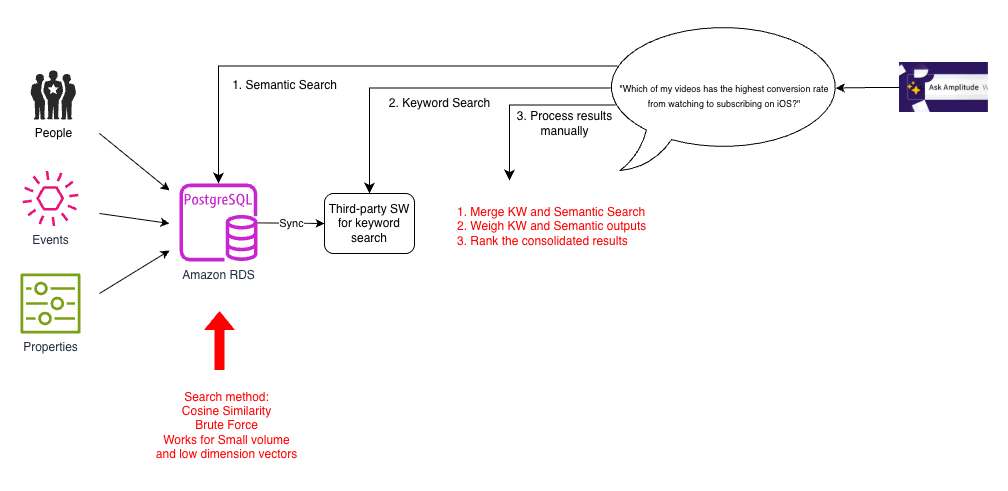
To improve our search capability, we considered several prototypes. Because data volumes for most customers were not very large, it was quick to build a vector search prototype using PostgreSQL. We transformed user interaction data into vector embeddings and used array cosine similarity to compute similarity metrics across the dataset. This alleviated the need for custom similarity computation. The vector embeddings captured nuanced user behavior patterns using PostgreSQL capabilities without additional infrastructure overhead. This is generally called the brute force method, where an incoming query is matched against all embeddings to find its top (K) neighbors by a distance measure (cosine similarity in this case). The following diagram illustrates this architecture.
Enabling semantic search was a big improvement over traditional search for users who might use different terms to refer to the same concepts, such as “hours of video streamed” or “total watch time”. However, although this worked for small datasets, it was slow because the brute force method had to compute cosine similarity for all pairs of vectors. This was amplified as the number of elements in the events schema, the complexity of questions, and expectations of quality grew. Additionally, Ask Amplitude answers needed to blend both semantic and keyword search. To support this, each search query had to be implemented as a three-step process involving multiple calls to separate databases:
Retrieve the semantic search results from PostgreSQL.
Retrieve the keyword search results from our search index.
In the application, semantic search results and keyword search results were combined using pre-assigned weights, and this output was dispatched to the Ask Amplitude UI.
This multi-step manual approach made the search process more complex.
Iteration 2: ANN search with pgvector
As Amplitude’s customer base grew, Ask Amplitude needed to scale to accommodate more customers and larger schemas. The goal was not just to answer the question at hand, but to teach the user how to build an end-to-end analysis by guiding them iteratively. To this end, the embeddings needed to store and index contextually rich semantic content. The team experimented with bigger, higher dimensionality embeddings and had anecdotal observations of vector dimensionality appearing to impact the effectiveness of the retrieval. Another requirement was to support multilingual embeddings.
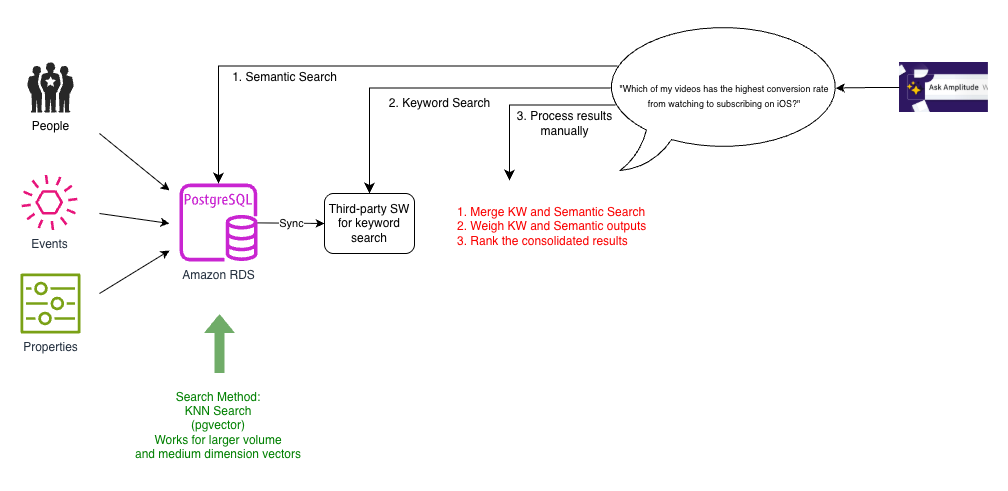
To support a more scalable k-NN search, the team switched to pgvector, a PostgreSQL extension that provides powerful functionalities for with vectors in high-dimensional space. The following diagram illustrates this architecture.
Pgvector was able to support k-nearest neighbor (k-NN) similarity search for larger dimensionality vectors. As the number of vectors grew, we switched to indexes that allowed approximate nearest neighbor (ANN) search, such as HNSW and IVFFlat.
For customers with larger schemas, calculating brute force cosine similarity was slow and expensive. We found a performance difference when we moved to ANN enabled by pgvector. However, we still needed to deal with the complexity introduced by the three-step process of querying PostgreSQL for semantic search, a separate search index for keyword search, and then stitching it all together.
Iteration 3: Dual sync to keyword and semantic search with OpenSearch Service
As the number of customers grew, so did the number of schemas. There were hundreds of millions of schema entries in the database, so we sought a performant, scalable, and cost-effective solution for k-NN search. We explored OpenSearch Service and Pinecone. We chose OpenSearch Service because we could combine keyword and vector search capabilities. This was convenient for four reasons:
Simpler architecture – Positioning semantic search as a capability in an existing search solution, as we observed in OpenSearch Service, makes for a simpler architecture than treating it as a separate specialized service.
Lower-latency search – The ability to effectively organize and catalog search data was fundamental to how we generated answers. Augmenting semantic search to our existing pipeline by combining both into one query provided lower latency querying.
Reduced need for data synchronization – Keeping the database in sync with the search index was critical to the accuracy and quality of answers. With the alternatives that we looked at, we would have to maintain two synchronization pipelines, one for keyword search index and the other for a semantic search index, complicating the architecture and increasing the chances of experiencing out-of-sync results between keyword and semantic search results. Synchronizing them into one place was easier than synchronizing them into multiple places and then combining the signals at query time. With a combined keyword and vector search capabilities of OpenSearch Service, we now needed to synchronize only one primary database on PostgreSQL with the search index.
Minimized performance impact to source data updates – We found that synchronizing data to another search index is a complex problem because our dataset changes constantly. With every new customer, we had hundreds of updates every second. We had to make sure the latency of these updates wasn’t impacted by the sync process. Collocating search data with vector embeddings obviated the need for multiple sync processes. This helped us avoid additional latency in the primary database, due to the sync processes encroaching upon database update traffic.
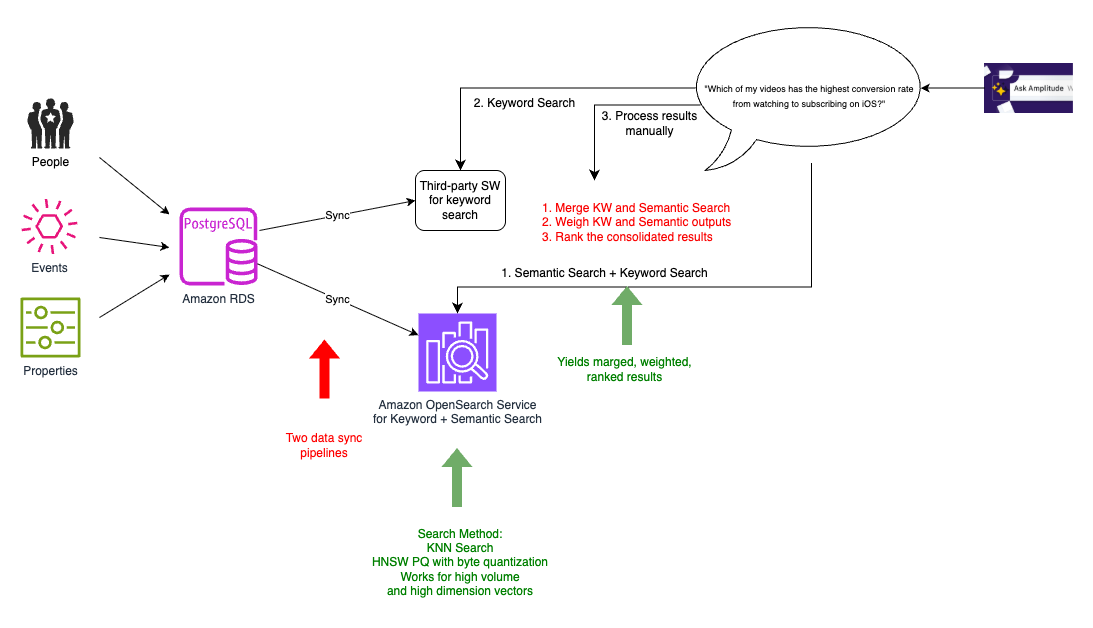
Although our previous third-party search engine specialized in fast ecommerce search, this wasn’t aligned with Amplitude’s specific needs. By migrating to OpenSearch Service, we simplified our architecture by reducing two synchronization processes to one. We phased out the current search platform gradually. This meant we temporarily continued to have two synchronization processes, one with current platform and another to the combined keyword and semantic search index on OpenSearch Service, as shown in the following diagram.
In addition to the pros of k-NN search identified in the previous iteration, moving to OpenSearch Service helped us realize three key benefits:
Reduced latency – Instead of collocating the embeddings with primary data, we were able to collocate with our search index. The search index is where our application needed to run our queries to pick out user events that are relevant to the question being asked and send this as context sent to the LLM. Because the search text, metadata, and embeddings were all in one place, we needed only one hop for all our search requirements, thereby improving latency.
Reduced compute power – We had anywhere between 5,000–20,000 elements in the user events schema. We didn’t need to send the entire schema to the LLM, because each user query required only 20–50 relevant elements. With the efficient filtering capabilities of OpenSearch Service, we were able to narrow down the vector search space by using tenant-specific metadata, significantly reducing compute requirements across our multi-tenant environment.
Improved scalability – With OpenSearch Service, we could take advantage of additional capabilities such as HNSW product quantization (PQ) and byte quantization. Byte quantization made it possible to handle the scale of millions of vector entries with minimal reduction in recall, but with improvement to cost and latency.
However, in this interim solution, our data wasn’t fully migrated to OpenSearch Service yet. We still had the old pipeline along with the new pipeline, and had to perform dual syncing. This was only temporary, as we phased out the old search index, and the old pipeline served as a baseline to compare with in terms of performance and recall.
Iteration 4: Hybrid search with OpenSearch Service
In the final architecture, we were able to migrate all our data to OpenSearch Service, which also served as our vector database, as shown in the following diagram.
We now had to perform just one data synchronization from the PostgreSQL database to the combined search and vector index, allowing the resources on the database to focus on transactional traffic. OpenSearch Service provides merging, weighting, and ranking of the search results as part of the same query. This obviated the need to implement them as a separate module in our application, effectively resulting in a single, scalable hybrid search (combined keyword-based (lexical) search and vector-based (semantic) search). With OpenSearch Service, we could also experiment with the new integration with Amazon Personalize.
Evolving RAG to draw upon user-generated content
Our customers wanted to ask deeper questions about their product usage that couldn’t be answered just by looking at the schema (the structure and names of the data columns) alone. Simply knowing the column names in a database doesn’t necessarily reveal the meaning, values, or proper interpretation of that data. The schema alone provides an incomplete picture. A naïve approach would be to index and search all data values instead of searching just the schema. Amplitude avoids this for scalability reasons. The cardinality and volume of event data (potentially trillions of event records) makes indexing all values cost prohibitive. Amplitudes hosts about 20 million charts and dashboards across all Amplitude customers. This user-generated content is valuable. We observed that we can better understand the meaning and context by analyzing how other users have previously visualized data.For example, if a user asks about “2-day shipping,” Amplitude first checks if the data schema contains columns with relevant names like “shipping” or “shipping method”. If such columns exist, it then examines the potential values in those columns to find values related to 2-day shipping. Amplitude also searches user-created content (charts, dashboards, and more) to see if anyone else at the company has already visualized data related to 2-day shipping. If so, it can use that existing chart as a reference for how to properly filter and analyze the data to answer the question. To search this content efficiently, Amplitude employs a hybrid approach combining keyword and vector similarity (semantic) searches. For tenant isolation and pruning, we use metadata to filter by customer first, and then vector search.
Conclusion
In this post, we showed you how Amplitude built Ask Amplitude, an AI assistant using OpenSearch Service as a vector database to enable natural language queries of product analytics data. We evolved our system through four iterations, ultimately consolidating keyword and semantic search into OpenSearch Service, which simplified our architecture from multiple sync pipelines to one, reduced query latency by combining search operations, and enabled efficient multi-tenant vector search at scale using features like HNSW PQ and byte quantization. We extended the system beyond schema search to index 20 million user-generated charts and dashboards, using hybrid search to provide richer context for answering customer questions about product usage.
As natural language interfaces become increasingly prevalent, Amplitude’s iterative journey demonstrates the potential for harnessing LLMs and RAG using vector databases such as OpenSearch Service to unlock rich conversational customer experiences. By gradually transitioning to a unified search solution that combines keyword and semantic vector search capabilities, Amplitude overcame scalability and performance challenges while reducing architecture complexity. The final architecture using OpenSearch Service enabled efficient multi-tenancy and fine-grained access control and also facilitated low-latency hybrid search. Amplitude is able to deliver more natural and intuitive analytics capabilities to its customers by generating deeper insights and contextualizing data.
To learn more about how Ask Amplitude helps you express Amplitude-related concepts and questions in natural language, refer to Ask Amplitude. To get started with OpenSearch Service as a vector database, refer to Amazon OpenSearch Service as a Vector Database.
Amazon OpenSearch Service is a fully managed service that reduces operational overhead, provides enterprise-grade security, high availability, and scalability, and enables you to quickly deploy real-time search, analytics, and generative AI applications. OpenSearch itself is an open-source, distributed search and analytics suite that supports a wide range of use cases, including real-time monitoring, log analytics, and full-text search. OpenSearch Service offers zero-ETL integrations with other Amazon Web Service (AWS) services, enabling seamless data access and analysis without the need for maintaining complex data pipelines.
Zero-ETL refers to a set of integrations designed to minimize or eliminate the need to build traditional extract, transform, load (ETL) pipelines. Traditional ETL processes can be time-consuming and difficult to develop, maintain, and scale. In contrast, zero-ETL integrations allow direct, point-to-point data movement and can also support querying across data silos without physically moving the data.
In this post, we explore various zero-ETL integrations available with OpenSearch Service that can help you accelerate innovation and improve operational efficiency. We cover following types of integrations, their key features, architecture, benefits, pricing, limitation and some general best practices.
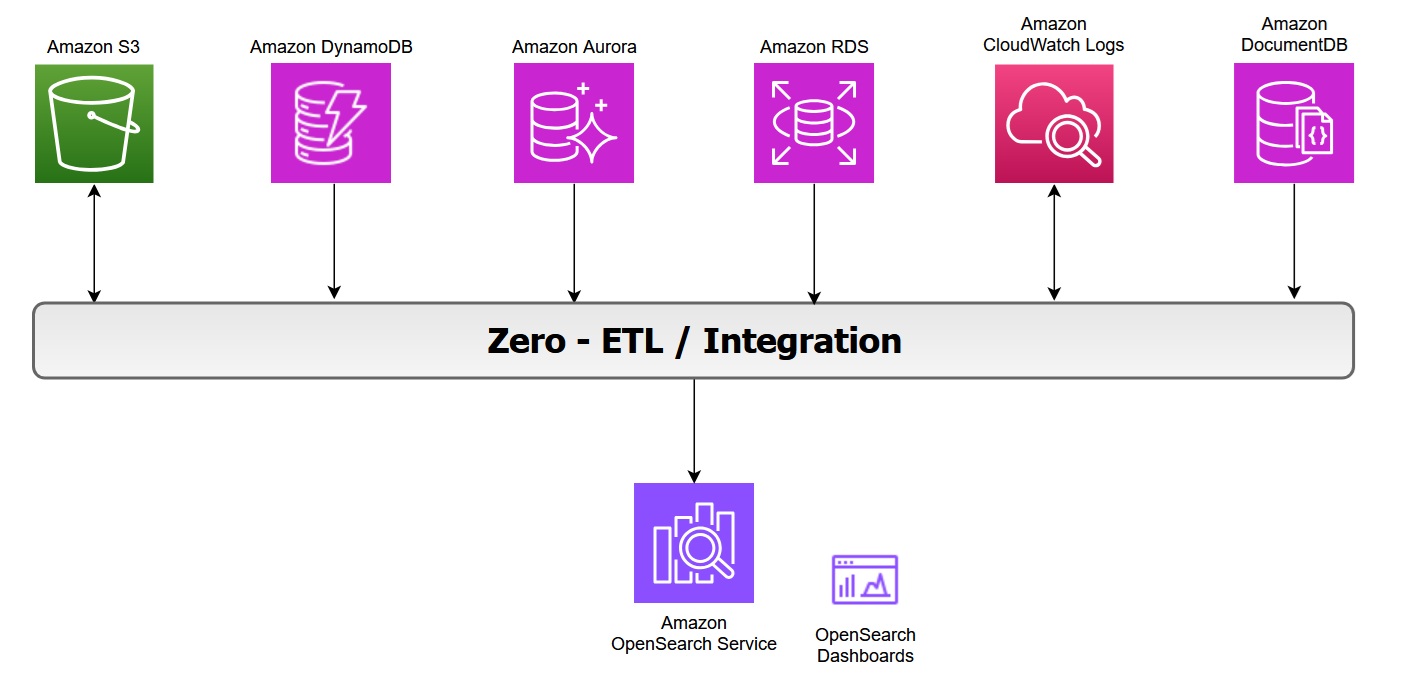
The following diagram illustrates the zero-ETL integration architecture in AWS, showing how various AWS services feed data into OpenSearch Service and its associated dashboards:
Zero-ETL integration with Amazon S3
Amazon OpenSearch Service direct queries with Amazon S3 provides a zero-ETL integration to reduce the operational complexity of duplicating data or managing multiple analytics tools by enabling you to directly query their operational data, reducing costs and time to action.
Key features of this integration include:
In-place querying: You can use rich analytics capabilities of OpenSearch Service SQL and PPL directly on infrequently-queried data stored outside of OpenSearch Service in Amazon S3.
Selective data ingestion: You can choose which data to bring into OpenSearch Service for detailed analysis, optimizing costs and speeding up queries with indexes like skipping or covering indexes.
In log analytics use cases, we categorize operational log data into two types:
Primary data includes the most recent and frequently accessed logs used for real-time monitoring and analysis.
Secondary data consists of historical logs that are accessed less frequently but retained for compliance or trend analysis.
You can offload infrequently queried data, such as archival or compliance data, to Amazon S3. With direct query, you can analyze analytics from Amazon S3 without data movement or duplication. However, query performance in OpenSearch Service might slow down when you’re accessing external data sources due to factors like network latency, data transformation, or large data volumes. You can optimize your query performance by using OpenSearch indexes, such as a skipping index, covering index, or materialized view.
While Amazon S3 direct query integration with OpenSearch Service provides on-demand access to data stored in Amazon S3, it is important to remember that OpenSearch’s alerting, monitoring, anomaly detection, and security analytics capabilities can only operate on data that has been explicitly ingested into OpenSearch Service indices. These capabilities would not work with direct query with Amazon S3. However, it will work if the data is indexed with covering or materialized index.
Benefits
With direct queries with Amazon S3, you no longer need to build complex ETL pipelines or incur the expense of duplicating data in both OpenSearch Service and Amazon S3 storage. You also save time and effort by not having to move back and forth between different tools during your analysis.
Pricing
OpenSearch Service separately charges for the compute needed to query your external data in addition to maintaining indexes in OpenSearch Service. Costs for Direct Query is based on the data volume scanned, query execution time, query frequency and frequency with which the indexed data in OpenSearch is kept updated. For more information, see Amazon OpenSearch Service Pricing.
Considerations
In case you are using OpenSearch service to query directly data on Amazon S3, consider the limitations with Direct Query.
Use the COALESCE SQL function to handle missing columns and ensure results are returned.
Use limits on your queries to ensure you aren’t pulling too much data back.
If you plan to analyze the same dataset many times, create an indexed view to fully ingest and index the data into OpenSearch Service and drop it when you have completed the analysis.
Drop acceleration jobs and indexes when they’re no longer needed.
Ingest data into Amazon S3 using partition formats of year, month, day, hour to speed up queries.
When you build skipping indexes, use Bloom filters for fields with high cardinality and min/max indexes for fields with large value ranges. Bloom filters are a space efficient probabilistic data structure that lets you quickly check whether an item is possibly in a set. For high-cardinality fields, consider using a value-based approach to improve query efficiency.
Use Index State Management to maintain storage for materialized views and covering indexes.
Zero-ETL integration with Amazon CloudWatch Logs
Amazon CloudWatch Logs serves as a centralized monitoring and storage solution for log files generated across various AWS services. This unified logging service offers a highly scalable platform where all your logging data converges into one manageable system. It provides comprehensive functionality for log management, including real-time viewing, pattern searching, field-based filtering, and secure archival capabilities. By presenting all logs chronologically in a unified stream, CloudWatch Logs eliminates the complexity of managing multiple log sources, transforming diverse logging data into a coherent, time-ordered sequence of events.
The zero-ETL integration between Amazon CloudWatch and Amazon OpenSearch Service enables direct log analysis and visualization while avoiding data redundancy, thereby reducing both technical complexity and costs. You can now leverage two additional query languages alongside the existing CloudWatch Logs Insights QL when using CloudWatch Logs, while as an OpenSearch user, you gain the ability to query CloudWatch logs directly.
The enhanced CloudWatch Logs Insights console now incorporates OpenSearch PPL and SQL functionality. Users can perform complex log analysis using SQL JOIN operations and various functions (including JSON, mathematical, datetime, and string operations). The PPL option provides additional data filtering and analysis capabilities.
The integration offers ready-to-use dashboards for various AWS services like Amazon Virtual Private Cloud (VPC), AWS CloudTrail, and AWS Web Application Firewall (WAF). These pre-configured visualizations enable quick insights into metrics such as flow patterns, top users, data transfer volumes, and temporal analysis, without requiring manual dashboard configuration.
You can now analyze CloudWatch logs through OpenSearch UI Discover and execute SQL and PPL queries. At the writing of this post, the query execution is limited to 50 log groups.
The direct access and analysis of CloudWatch data within OpenSearch Service removes the need for traditional ETL processes, eliminates separate data ingestion pipelines and avoids data duplication. This streamlined approach significantly reduces both storage expenses and operational complexity. It delivers a more efficient data management solution that simplifies the entire workflow while maintaining cost-effectiveness.
Pricing
When you use OpenSearch Service direct queries, you incur separate charges for OpenSearch Service and the resource used to process and store your data on Amazon CloudWatch Logs. As you run direct queries, you see charges for OpenSearch Compute Units (OCUs) per hour, listed as DirectQuery OCU usage type on your bill.
For interactive queries, OpenSearch Service handles each query with a separate pre-warmed job, without maintaining an extended session.
For indexed view queries, the indexed data is stored in an OpenSearch Serverless collection where you are charged for data indexed (IndexingOCU), data searched (SearchOCU), and data stored in GB.
In addition to the OpenSearch Service “direct queries” general limitations, if you are direct querying data in CloudWatch Logs, the following limitations apply:
The direct query integration with CloudWatch Logs is only available on OpenSearch Service collections and the OpenSearch user interface.
OpenSearch Serverless collections have networked payload limitations of 100 MiB.
CloudWatch Logs supports VPC Flow Logs, CloudTrail, and AWS WAF dashboard integrations installed from the console.
Best practices
Besides the general recommendations of OpenSearch Service direct querying, when using OpenSearch Service to direct query data in CloudWatch Logs, the following is recommended:
Specify the log group names within logGroupIdentifier in logGroups command to query multiple log groups in one query, see Multi-log group functions.
Enclose certain fields in backticks to successfully query them when using SQL or PPL commands. Backticks are needed for fields with special characters, such as `@SessionToken` or `LogGroup-A` (non-alphabetic and non-numeric). Refer to CloudWatch Logs Recommendations to see an example.
Zero-ETL integration with Amazon DynamoDB
Amazon DynamoDB zero-ETL integration with OpenSearch Service lets you perform a search on your DynamoDB data by automatically replicating and transforming it without custom code or infrastructure. This zero-ETL integration uses Amazon OpenSearch Ingestion to synchronize data between Amazon DynamoDB and OpenSearch Service cluster or OpenSearch Serverless collection within seconds of it being available.
It uses DynamoDB export to Amazon S3 to create an initial snapshot to load into OpenSearch Service. After the snapshot has been loaded, the plugin uses DynamoDB Streams to replicate any further changes in near real time. Turn on point-in-time recovery (PITR) for export and the DynamoDB Streams feature for ongoing replication.
This feature allows you to capture item-level changes in your table and push the changes to a stream. Every item in tables is processed as an event in OpenSearch Ingestion and can be modified with processors. You can also specify index mapping templates within ingestion pipelines to ensure that your Amazon DynamoDB fields are mapped to the correct fields in your OpenSearch indices.
When configuring zero-ETL between DynamoDB and OpenSearch Service, consider the differences between the data models. You have the following options with data layout:
Passthrough: Each item in DynamoDB table is directly mapped to one document in OpenSearch Index.
Routing: A single DynamoDB table mapped to multiple OpenSearch Service indices. In DynamoDB, it is common to store denormalized data in one table to optimize for access patterns. For example, a single DynamoDB table containing both customer profiles and order information can be routed to separate OpenSearch Service indices:
Merge: In some use cases, you need to combine data from multiple DynamoDB tables into a single OpenSearch index. You can use AWS Lambda integration with OpenSearch Ingestion to perform lookups on other DynamoDB tables and merge data from multiple DynamoDB tables.
Pricing
There is no additional cost to use this feature apart from the cost of the existing underlying components, including OpenSearch Ingestion charges OpenSearch Compute Units (OCUs) which is used to replicate data between Amazon DynamoDB and OpenSearch Service. Furthermore, this feature uses Amazon DynamoDB Streams for the change data capture (CDC), and you incur the standard costs for Amazon DynamoDB Streams.
Considerations
Consider the following limitations when you set up an OpenSearch Ingestion pipeline for DynamoDB:
At the writing of this post, the OpenSearch Ingestion integration with DynamoDB doesn’t support cross-Region and cross-account ingestion.
An OpenSearch Ingestion pipeline supports only one DynamoDB table as its source.
Amazon RDS and Amazon Aurora integration with OpenSearch Service eliminates complex data pipelines and enables near real-time data synchronization between Amazon Aurora and Amazon RDS databases (including RDS for MySQL and RDS for PostgreSQL) with advanced search capabilities on transactional databases. You can use an OpenSearch Ingestion pipeline with Amazon RDS or Amazon Aurora to export existing data and stream changes (such as create, update, and delete) to OpenSearch Service domains and collections. The OpenSearch Ingestion pipeline incorporates change data capture (CDC) infrastructure to provide a high-scale, low-latency way to continuously stream data from Amazon RDS or Amazon Aurora.
This automated process keeps your data consistently up to date in OpenSearch Service, making it readily available for search and analysis purpose. The pipeline ensures data consistency by continuously polling or receiving changes from the Amazon Aurora cluster or Amazon RDS and updating the corresponding documents in the OpenSearch index. OpenSearch Ingestion supports end-to-end acknowledgement to ensure data durability. An OpenSearch Ingestion pipeline also maps incoming event actions into corresponding bulk indexing actions to help ingest documents. This keeps data consistent, so that every data change in Amazon RDS is reconciled with the corresponding document changes in OpenSearch.
There is no additional charge for using this feature beyond the cost of your existing underlying resources, such as OpenSearch Service, OpenSearch Ingestion pipelines (OCUs), and Amazon RDS or Amazon Aurora. Additional costs may include storage used for enabling enhanced binlogs for MySQL and WAL logs for PostgreSQL for change data capture. You also incur storage costs for snapshot exports from your database to Amazon S3 used for the initial data.
Considerations
Consider the following limitations when you set up the integration for Amazon RDS or Amazon Aurora:
Requires same-Region and same-account deployment, primary keys for optimal synchronization, and currently has no data definition language (DDL) statement support.
The integration only supports one Aurora PostgreSQL database per pipeline.
The existing pipeline configuration can’t be updated to ingest data from a different database and/or a different table. To update the database and/or table name of a pipeline, stop the pipeline and restart it with an updated configuration or create a new pipeline.
Ensure that the Amazon Aurora or Amazon RDS cluster has authentication enabled using AWS Secrets Manager, which is the only supported authentication mechanism.
Best practices
The following are some best practices to follow while setting up the integration with OpenSearch Service:
If a mapping template is not specified in OpenSearch, it automatically assigns field types using dynamic mapping based on the first document received. However, it is always recommended to define field types explicitly by creating a mapping template that suits your requirements.
To maintain data consistency, the primary and foreign keys of tables remain unchanged.
You can configure the dead-letter queues (DLQ) in your OpenSearch Ingestion pipeline. If you’ve configured the queue, OpenSearch Service sends all failed documents that can’t be ingested due to dynamic mapping failures to the queue.
Amazon Document DB is a fully managed database service built for JSON data management at scale. It offers built-in text and vector search functionalities. By leveraging OpenSearch Service, you can execute search analytics, including features like fuzzy matching, synonym detection, cross-collection queries, and multilingual search capabilities on DocumentDB data.
The zero-ETL integration initiates the process with a full historical data extraction to OpenSearch using an ingestion pipeline. After the initial data load is completed, the pipelines read from Amazon DocumentDB change streams ensuring near real-time data consistency between the two systems. OpenSearch organizes the incoming data into indexes, with flexibility to either consolidate data from a DocumentDB collection into a single index or partition data across multiple indices. The ingestion pipelines synchronize all create, update, and delete operations from the DocumentDB collection, maintaining corresponding document modifications in OpenSearch. This ensures both data systems remain synchronised.
The pipelines offer configurable routing options, allowing data from a single collection to be written to one index or conditionally route to multiple indexes. Users can configure ingestion pipelines to stream data from Amazon DocumentDB to OpenSearch Service through three primary modes namely full load only, streaming change events without initial full load and full load followed by change streams. You can also monitor the state of ingestion pipelines in the OpenSearch service console. Additionally, you can use Amazon Cloudwatch to provide real-time metrics and logs and setting up alerts.
Pricing
There is no additional charge for using this feature apart from the cost of your existing underlying resources, including OpenSearch Service, OpenSearch Ingestion pipelines (OCUs), and Amazon DocumentDB. The integration performs an initial full load of Amazon DocumentDB data and continuously streams ongoing changes to OpenSearch Service using change streams. The change streams feature is disabled by default and does not incur any additional charges until the feature is enabled. Using change streams on a DocumentDB cluster incurs additional read and write input/output (I/O), as well as storage costs.
AWS Secrets Manager is the only supported authentication mechanism.
You can’t update an existing pipeline configuration to ingest data from a different database and/or a different collection. To update the database and/or collection name of a pipeline, create a new pipeline.
Best practices
The following are some best practices to follow while setting up the DocumentDB zero-ETL with OpenSearch Service:
Configure dead-letter queues (DLQ) to handle any failed document ingestion.
Configure AWS Secrets Manager and enable secrets rotation to provide the pipeline secure access.
If you’re using change streams in DocumentDB, it’s important to extend the retention period to up to 7 days. This ensures you don’t lose any data changes during the ingestion process.
With zero-ETL integrations, you can use the powerful search and analytics features of OpenSearch Service directly on your latest database data. These include full-text search, fuzzy search, auto-complete, and vector search for machine learning (ML) workloads—enabling intelligent, real-time experiences that enhance your applications and improve user satisfaction. This integration uses change streams to automate the synchronisation of transactional data from Amazon Aurora, Amazon RDS, Amazon DynamoDB and Amazon DocumentDB to OpenSearch Service without manual intervention. Once the data is available in OpenSearch Service, you can perform real-time searches to quickly retrieve relevant results for your applications.This eliminates the need for manual Extract-Transform-Load (ETL) processes, reduces operational complexity, and accelerates time-to-insight for real-time dashboards, search, and analytics.
Conclusion
In this post, you learned that zero-ETL integrations represent a significant advancement in simplifying data analytics workflows and reducing operational complexity. As you’ve explored throughout this post, these integrations offer several advantages such as elimination of complex ETL pipelines and reduced infrastructure and operational costs by removing the need for intermediate storage and processing that enhance developer productivity.
It is time to accelerate your analytics journey with OpenSearch Service zero ETL – where your data flows seamlessly, eliminating complex pipelines and delivering real-time insights. Get started with Amazon OpenSearch Service or learn more about integrations with other services and applications in the AWS documentation.
Today, we’re announcing the general availability of OpenClaw on Amazon Lightsail to launch OpenClaw instance, pairing your browser, enabling AI capabilities, and optionally connecting messaging channels. Your Lightsail OpenClaw instance is pre-configured with Amazon Bedrock as the default AI model provider. Once you complete setup, you can start chatting with your AI assistant immediately — no additional configuration required.
OpenClaw is an open-source self-hosted autonomous private AI agent that acts as a personal digital assistant by running directly on your computer. You can AI agents on OpenClaw through your browser to connect to messaging apps like WhatsApp, Discord, or Telegram to perform tasks such as managing emails, browsing the web, and organizing files, rather than just answering questions.
AWS customers have asked if they can run OpenClaw on AWS. Some of them blogged about running OpenClaw on Amazon EC2 instances. As someone who has experienced installing OpenClaw directly on my home device, I learned that this is not easy and that there are many security considerations.
So, let me introduce how to launch a pre-configured OpenClaw instance on Amazon Lightsail more easily and run it securely.
OpenClaw on Amazon Lightsail in action To get started, go to the Amazon Lightsail console and choose Create instance on the Instances section. After choosing your preferred AWS Region and Availability Zone, Linux/Unix platform to run your instance, choose OpenClaw under Select a blueprint.
You can choose your instance plan (4 GB memory plan is recommended for optimal performance) and enter a name for your instance. Finally choose Create instance. Your instance will be in a Running state in a few minutes.
Before you can use the OpenClaw dashboard, you should pair your browser with OpenClaw. This creates a secure connection between your browser session and OpenClaw. To pair your browser with OpenClaw, choose Connect using SSH in the Getting started tab.
When a browser-based SSH terminal opens, you can see the dashboard URL, security credentials displayed in the welcome message. Copy them and open the dashboard in a new browser tab. In the OpenClaw dashboard, you can paste the copied access token into the Gateway Token field in the OpenClaw dashboard.
When prompted, press y to continue and a to approve with device pairing in the SSH terminal. When pairing is complete, you can see the OK status in the OpenClaw dashboard and your browser is now connected to your OpenClaw instance.
Your OpenClaw instance on Lightsail is configured to use Amazon Bedrock to power its AI assistant. To enable Bedrock API access, copy the script in the Getting started tab and run copied script into the AWS CloudShell terminal.
Once the script is complete, go to Chat in the OpenClaw dashboard to start using your AI assistant!
You can set up OpenClaw to work with messaging apps like Telegram and WhatsApp for interacting with your AI assistant directly from your phone or messaging client. To learn more, visit Get started with OpenClaw on Lightsail in the Amazon Lightsail User Guide.
Things to know Here are key considerations to know about this feature:
Permission — You can customize AWS IAM permissions granted to your OpenClaw instance. The setup script creates an IAM role with a policy that grants access to Amazon Bedrock. You can customize this policy at any time. But, you should be careful when modifying permissions because it may prevent OpenClaw from generating AI responses. To learn more, visit AWS IAM policies in the AWS documentation
Cost — You pay for the instance plan you selected on an on-demand hourly rate only for what you use. Every message sent to and received from the OpenClaw assistant is processed through Amazon Bedrock using a token-based pricing model. If you select a third-party model distributed through AWS Marketplace such as Anthropic Claude or Cohere, there may be additional software fees on top of the per-token cost.
Security — Running a personal AI agent on OpenClaw is powerful, but it may cause security threat if you are careless. I recommend to hide your OpenClaw gateway never to expose it to open internet. The gateway auth token is your password, so rotate it often and store it in your envirnment file not hardcoded in config file. To learn more about security tips, visit Security on OpenClaw gateway.
To provide the best experiences, we use technologies like cookies to store and/or access device information. Consenting to these technologies will allow us to process data such as browsing behavior or unique IDs on this site. Not consenting or withdrawing consent, may adversely affect certain features and functions.
Functional
Always active
The technical storage or access is strictly necessary for the legitimate purpose of enabling the use of a specific service explicitly requested by the subscriber or user, or for the sole purpose of carrying out the transmission of a communication over an electronic communications network.
Preferences
The technical storage or access is necessary for the legitimate purpose of storing preferences that are not requested by the subscriber or user.
Statistics
The technical storage or access that is used exclusively for statistical purposes.The technical storage or access that is used exclusively for anonymous statistical purposes. Without a subpoena, voluntary compliance on the part of your Internet Service Provider, or additional records from a third party, information stored or retrieved for this purpose alone cannot usually be used to identify you.
Marketing
The technical storage or access is required to create user profiles to send advertising, or to track the user on a website or across several websites for similar marketing purposes.