Amazon CloudWatch introduces unified data management and analytics for operations, security, and compliance

Post Syndicated from Channy Yun (윤석찬) original https://aws.amazon.com/blogs/aws/amazon-cloudwatch-introduces-unified-data-management-and-analytics-for-operations-security-and-compliance/

Today we’re expanding Amazon CloudWatch capabilities to unify and manage log data across operational, security, and compliance use cases with flexible and powerful analytics in one place and with reduced data duplication and costs.

This enhancement means that CloudWatch can automatically normalize and process data to offer consistency across sources with built-in support for Open Cybersecurity Schema Framework (OCSF) and Open Telemetry (OTel) formats, so you can focus on analytics and insights. CloudWatch also introduces Apache Iceberg compatible access to your data through Amazon Simple Storage Service (Amazon S3) Tables, so that you can run analytics, not only locally but also using Amazon Athena, Amazon SageMaker Unified Studio, or any other Iceberg-compatible tool.

You can also correlate your operational data in CloudWatch with other business data from your preferred tools to correlate with other data. This unified approach streamlines management and provides comprehensive correlation across security, operational, and business use cases.

Here are the detailed enhancements:

  • Streamline data ingestion and normalization – CloudWatch automatically collects AWS vended logs across accounts and AWS Regions, integrating with AWS Organizations from AWS services including AWS CloudTrail, Amazon Virtual Private Cloud (Amazon VPC) Flow Logs, AWS WAF access logs, Amazon Route 53 resolver logs, and pre-built connectors for third-party sources such as endpoint (CrowdStrike, SentinelOne), identity (Okta, Entra ID), cloud security (Wiz), network security (Zscaler, Palo Alto Networks), productivity and collaboration (Microsoft Office 365, Windows Event Logs, and GitHub), along with IT service manager with ServiceNow CMBD. To normalize and process your data as they are being ingested, CloudWatch offers managed OCSF conversion for various AWS and third-party data sources and other processors such ad Grok for custom parsing, field-level operations, and string manipulations.
  • Reduce costly log data management – CloudWatch consolidates log management into a single service with built-in governance capabilities without storing and maintaining multiple copies of the same data across different tools and data stores. The unified data store of CloudWatch eliminates the need for complex ETL pipelines and reduces your operational costs and management overhead needed to maintain multiple separate data stores and tools.
  • Discover business insights from log data – You can run queries in CloudWatch using natural language queries and popular query languages such as LogsQL, PPL, and SQL through a single interface, or query your data using your preferred analytics tools through Apache Iceberg-compatible tables. The new Facets interface gives you intuitive filtering by source, application, account, region, and log type, which you can use to run queries across log groups of multiple AWS accounts and Regions with intelligent parameter inference.

In the next sections we explore the new log management and analytics features of the CloudWatch Logs!

1. Data discovery and management by data sources and types

You can see a high-level overview of logs and all data sources with a new Logs Management View in the CloudWatch console. To get started, go to the CloudWatch console and choose Log Management under the Logs menu in the left navigation pane. In the Summary tab, you can observe your logs data sources and types, insights into how your log groups are doing across ingestion, and anomalies.

Choose the Data sources tab to find and manage your log data by data sources, types, and fields. CloudWatch ingests and automatically categorizes data sources by AWS services, third-party, or custom sources such as application logs.

Choose the Data source actions to integrate S3 Tables to make future logs for selected data sources. You have the flexibility to analyze the logs through Athena and Amazon Redshift and other query engines such as Spark using Iceberg compatible access patterns. With this integration, logs from CloudWatch are available in a read-only aws-cloudwatch S3 Tables bucket.

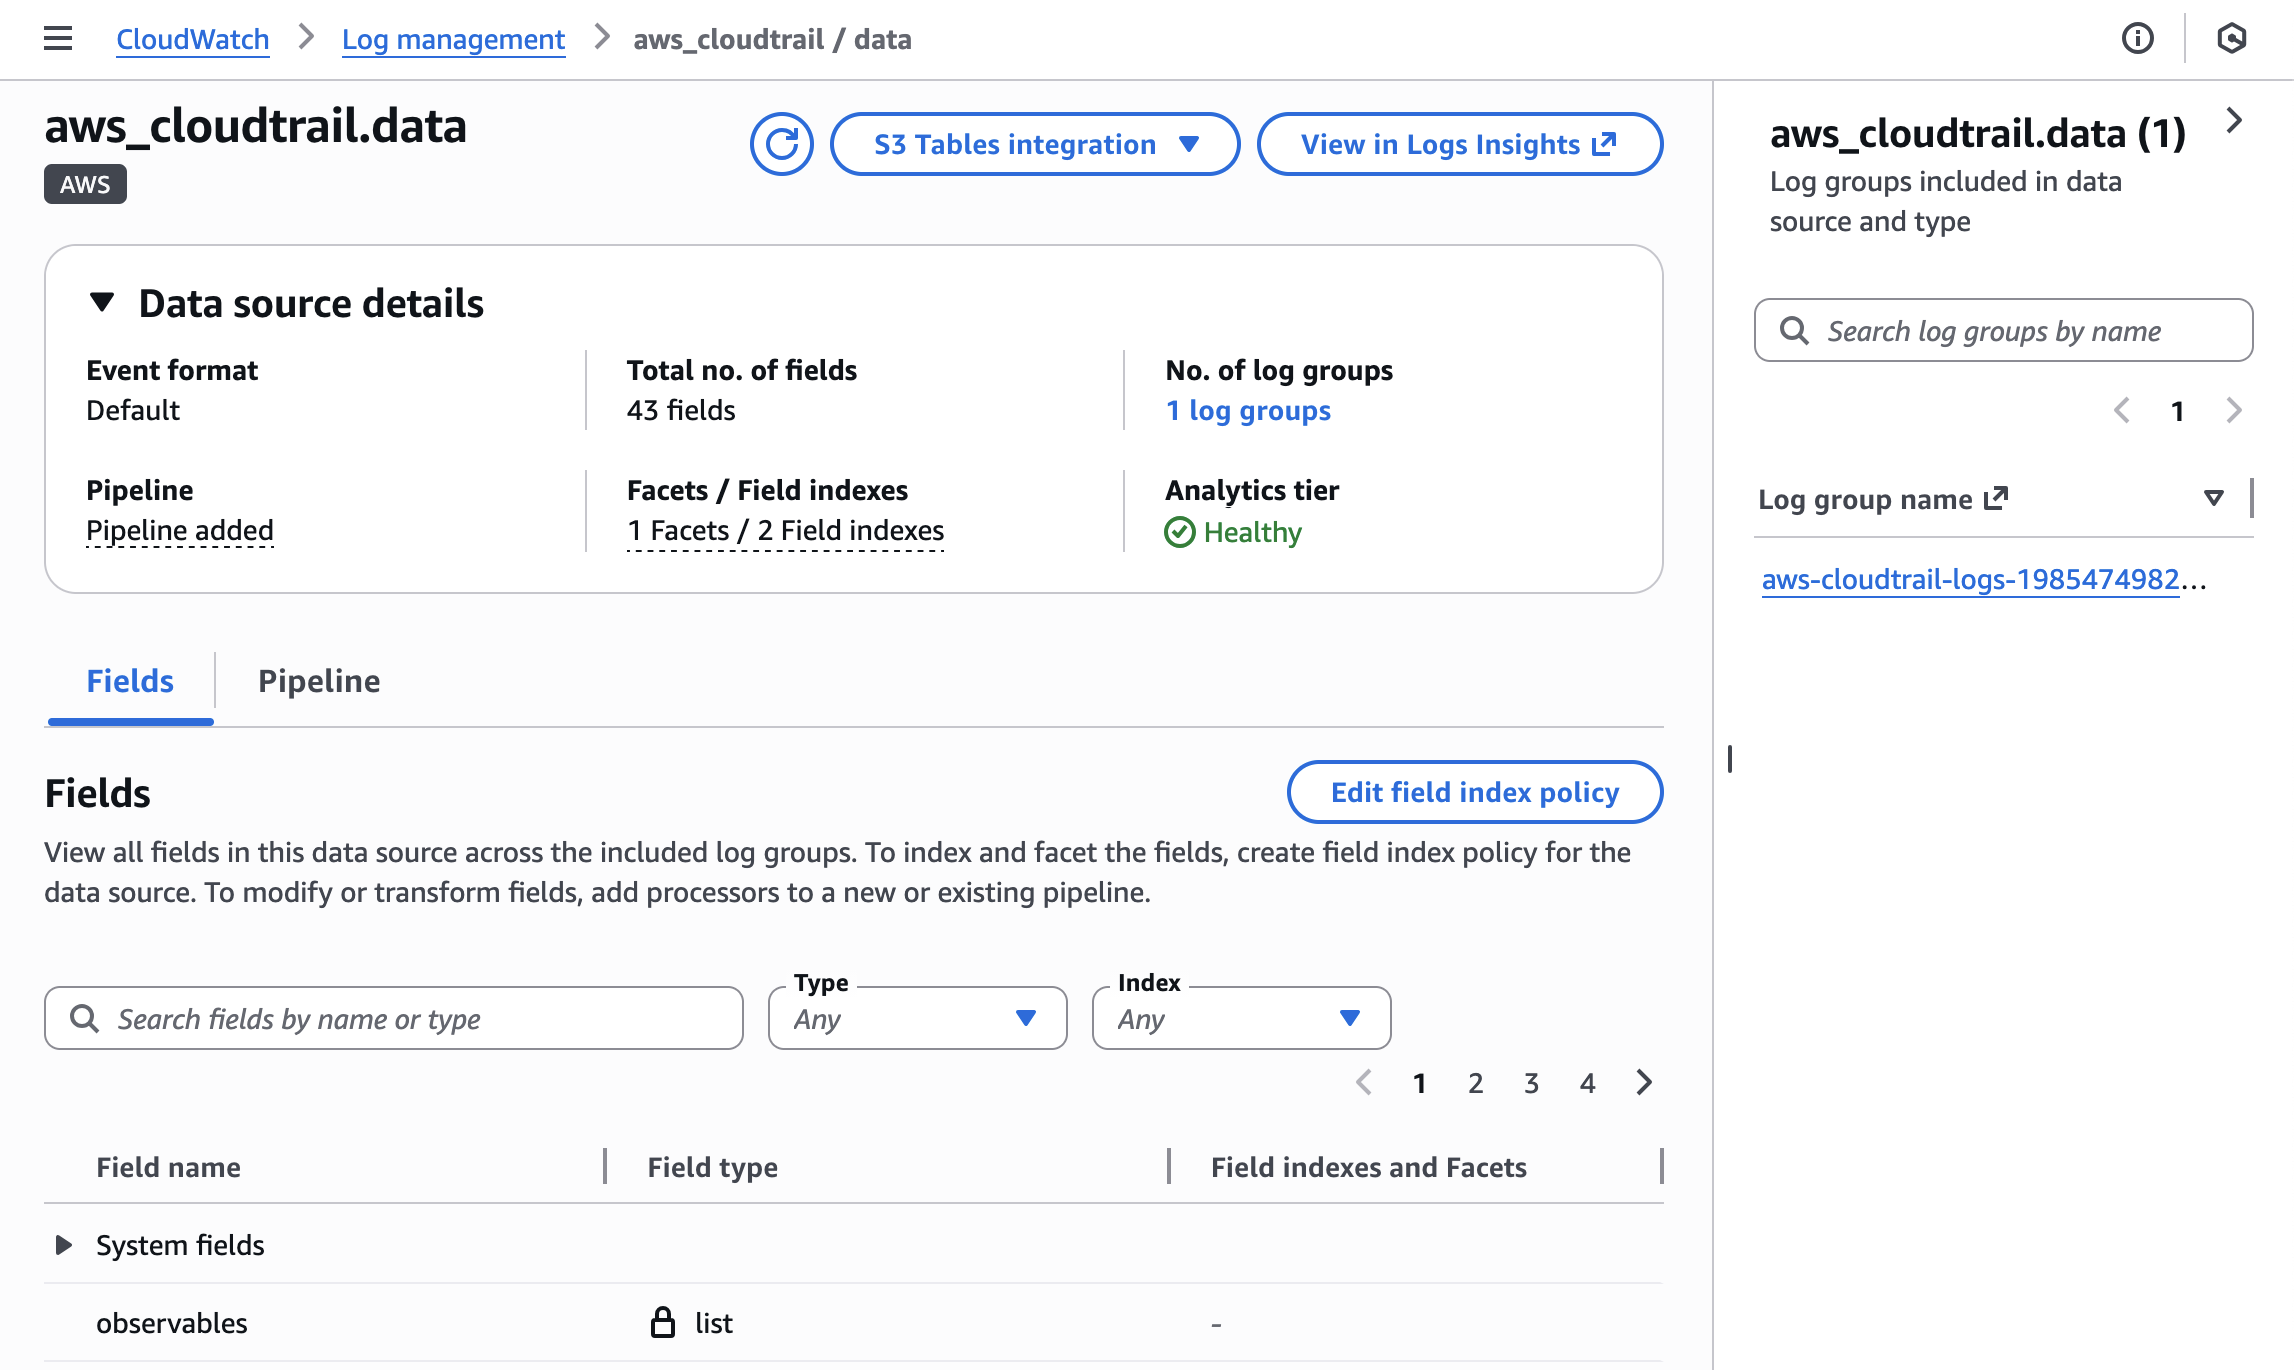
When you choose a specific data source such as CloudTrail data, you can view the details of the data source that includes information regarding data format, pipeline, facets/field indexes, S3 Tables association, and the number of logs with that data source. You can observe all log groups included in this data source and type and edit a source/type field index policy using the new schema support.

To learn more about how to manage your data sources and index policy, visit Data sources in the Amazon CloudWatch Logs User Guide.

2. Ingestion and transformation using CloudWatch pipelines

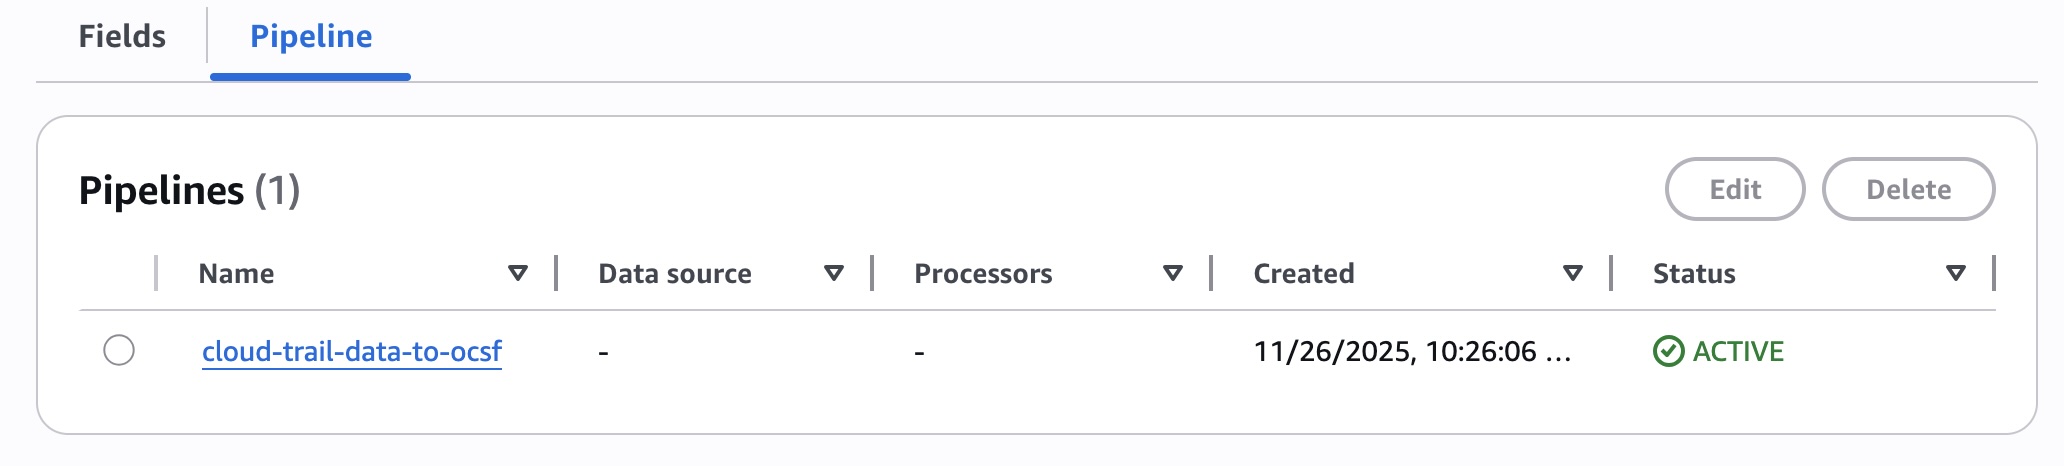
You can create pipelines to streamline collecting, transforming, and routing telemetry and security data while standardizing data formats to optimize observability and security data management. The new pipeline feature of CloudWatch connects data from a catalogue of data sources, so that you can add and configure pipeline processors from a library to parse, enrich, and standardize data.

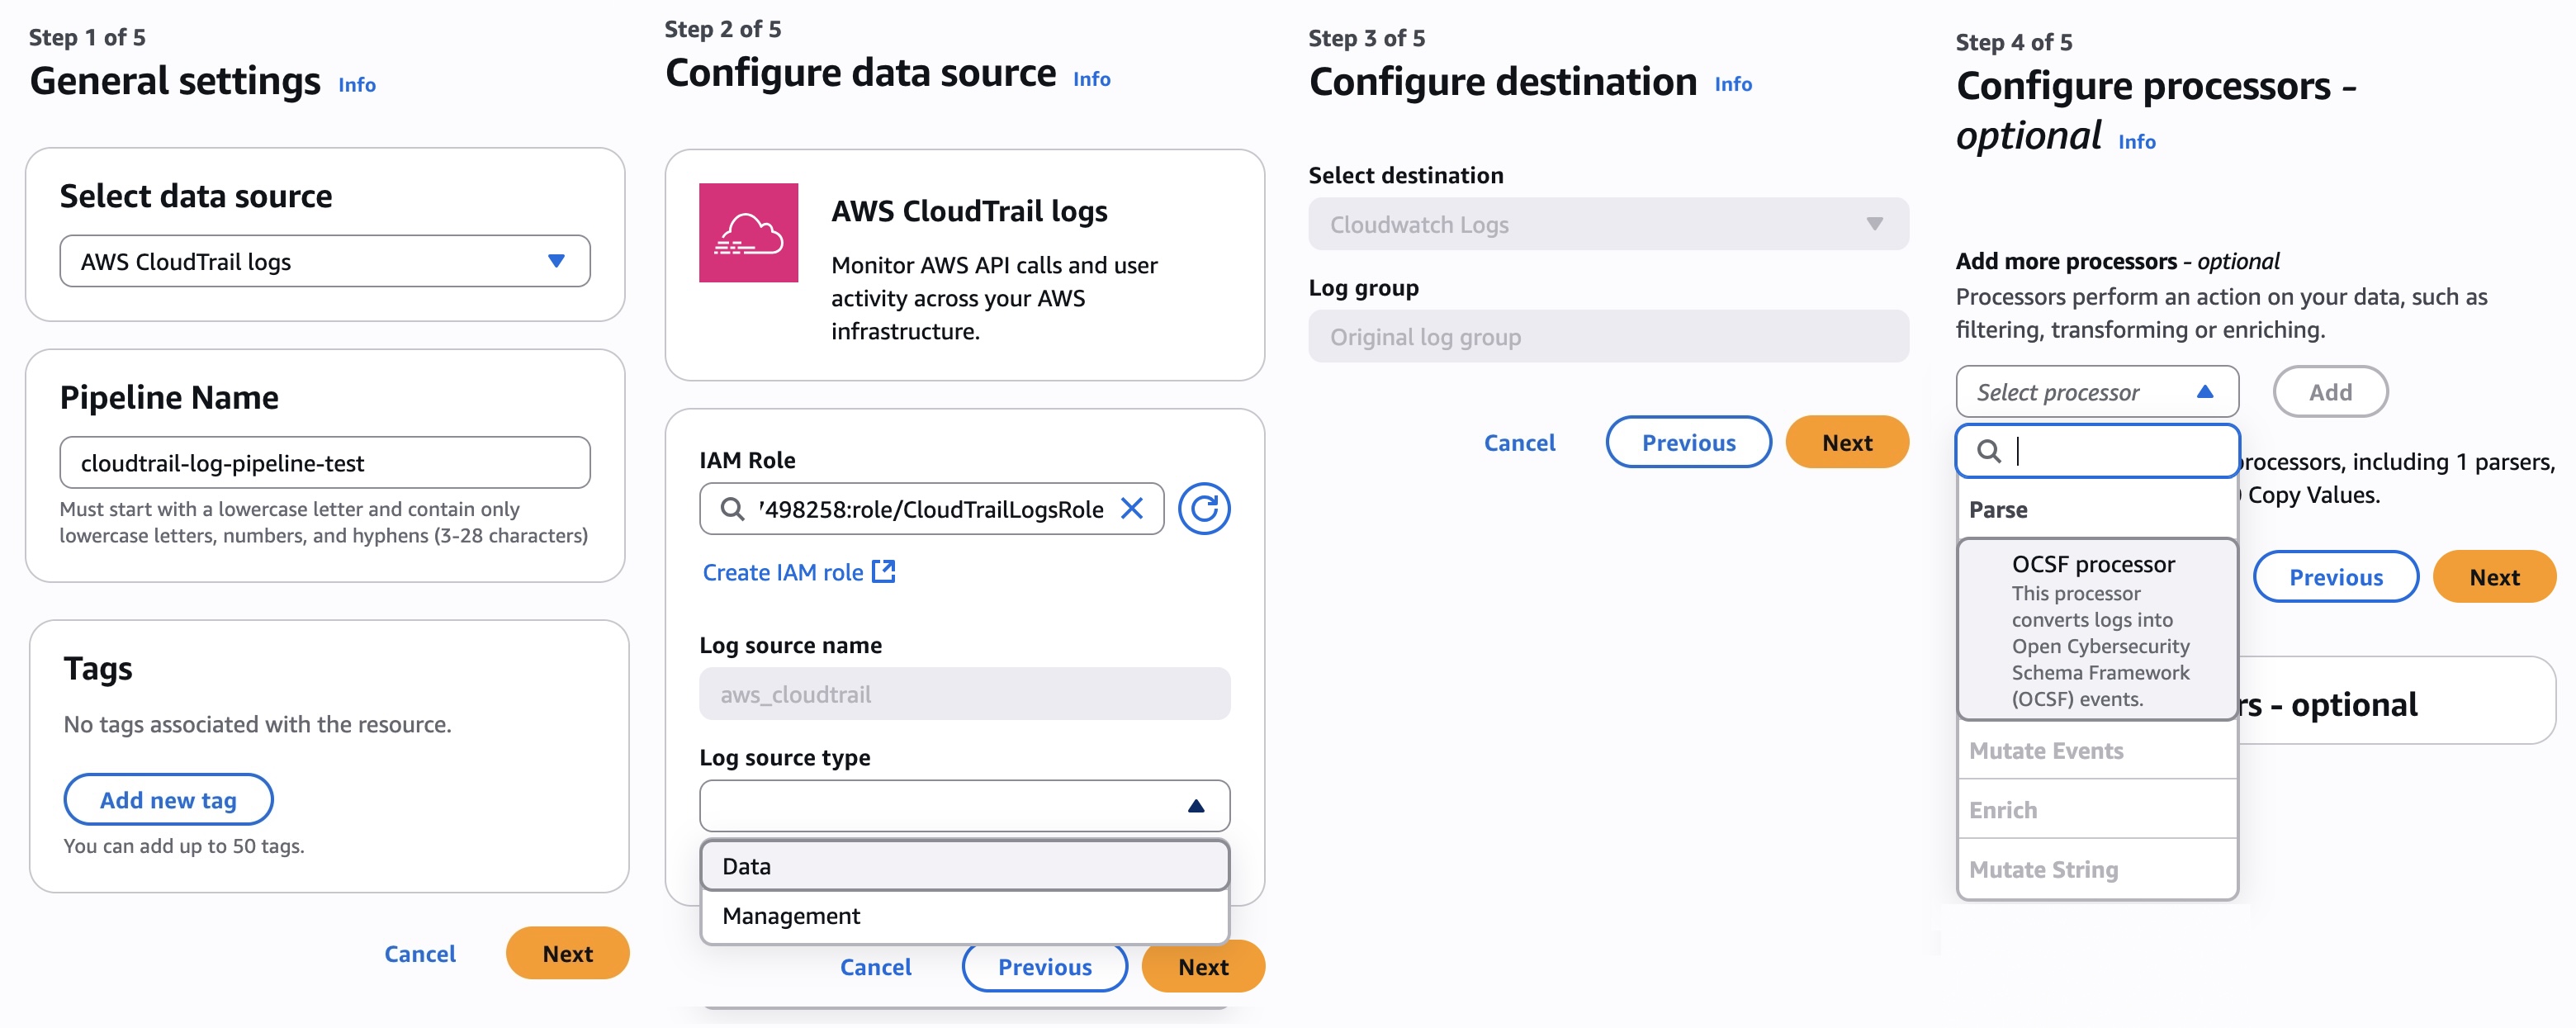
In the Pipeline tab, choose Add pipeline. It shows you the pipeline configuration wizard. This wizard guides you through five steps where you can choose the data source and other source details such as log source types, configure destination, configure up to 19 processors to perform an action on your data (such as filtering, transforming, or enriching), and finally review and deploy the pipeline.

You also have the option to create pipelines through the new Ingestion experience in CloudWatch. To learn more about how to set up and manage the pipelines, visit Pipelines in the Amazon CloudWatch Logs User Guide.

3. Enhanced analytics and querying based on data sources

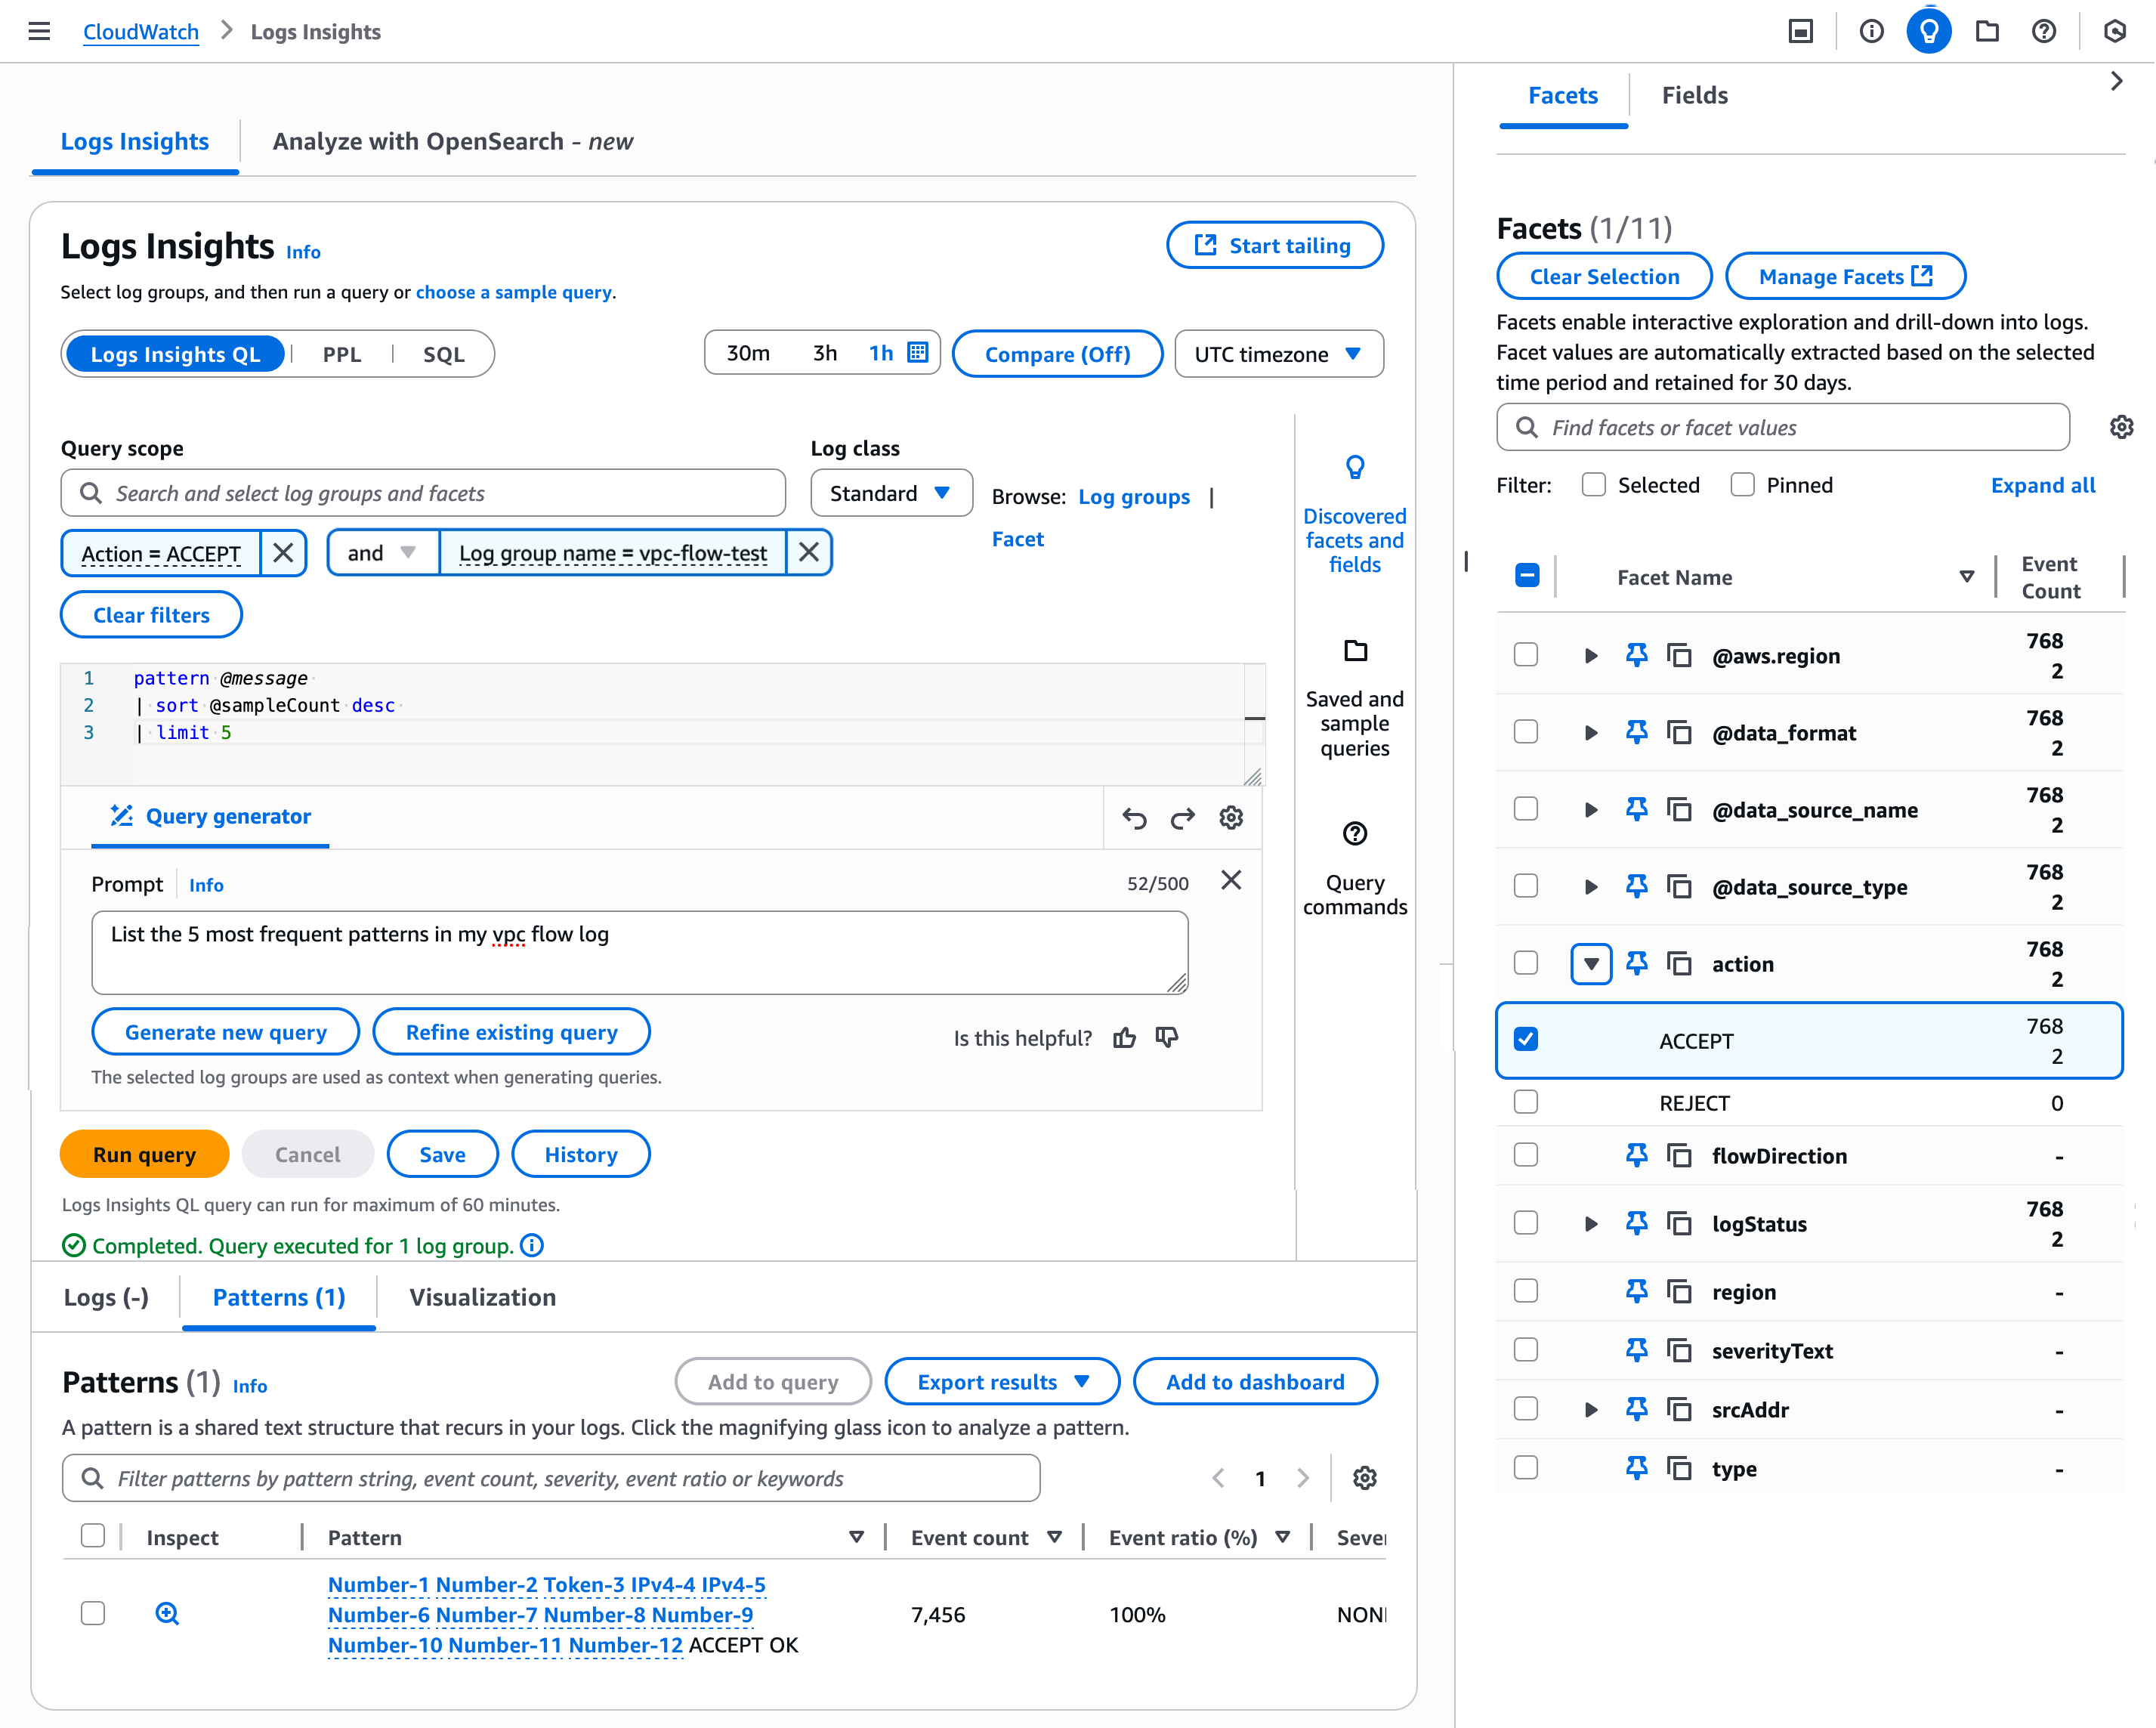
You can enhance analytics with support for Facets and querying based on data sources. Facets enable interactive exploration and drill-down into logs and their values are automatically extracted based on the selected time period.

Choose the Facets tab in the Log Insights under the Logs menu in the left navigation pane. You can view available facets and values that appear in the panel. Choose one or more facets and values to interactively explore your data. I choose Facets regarding a VPC Flow Logs group and action, query to list the five most frequent patterns in my VPC Flow Logs through the AI query generator, and get the result patterns.

You can save your query with the selected Facets and values that you have specified. When you next choose your saved query, the logs to be queried have the pre-specified facets and values. To learn more about Facet management, visit Facets in the CloudWatch Logs User Guide.

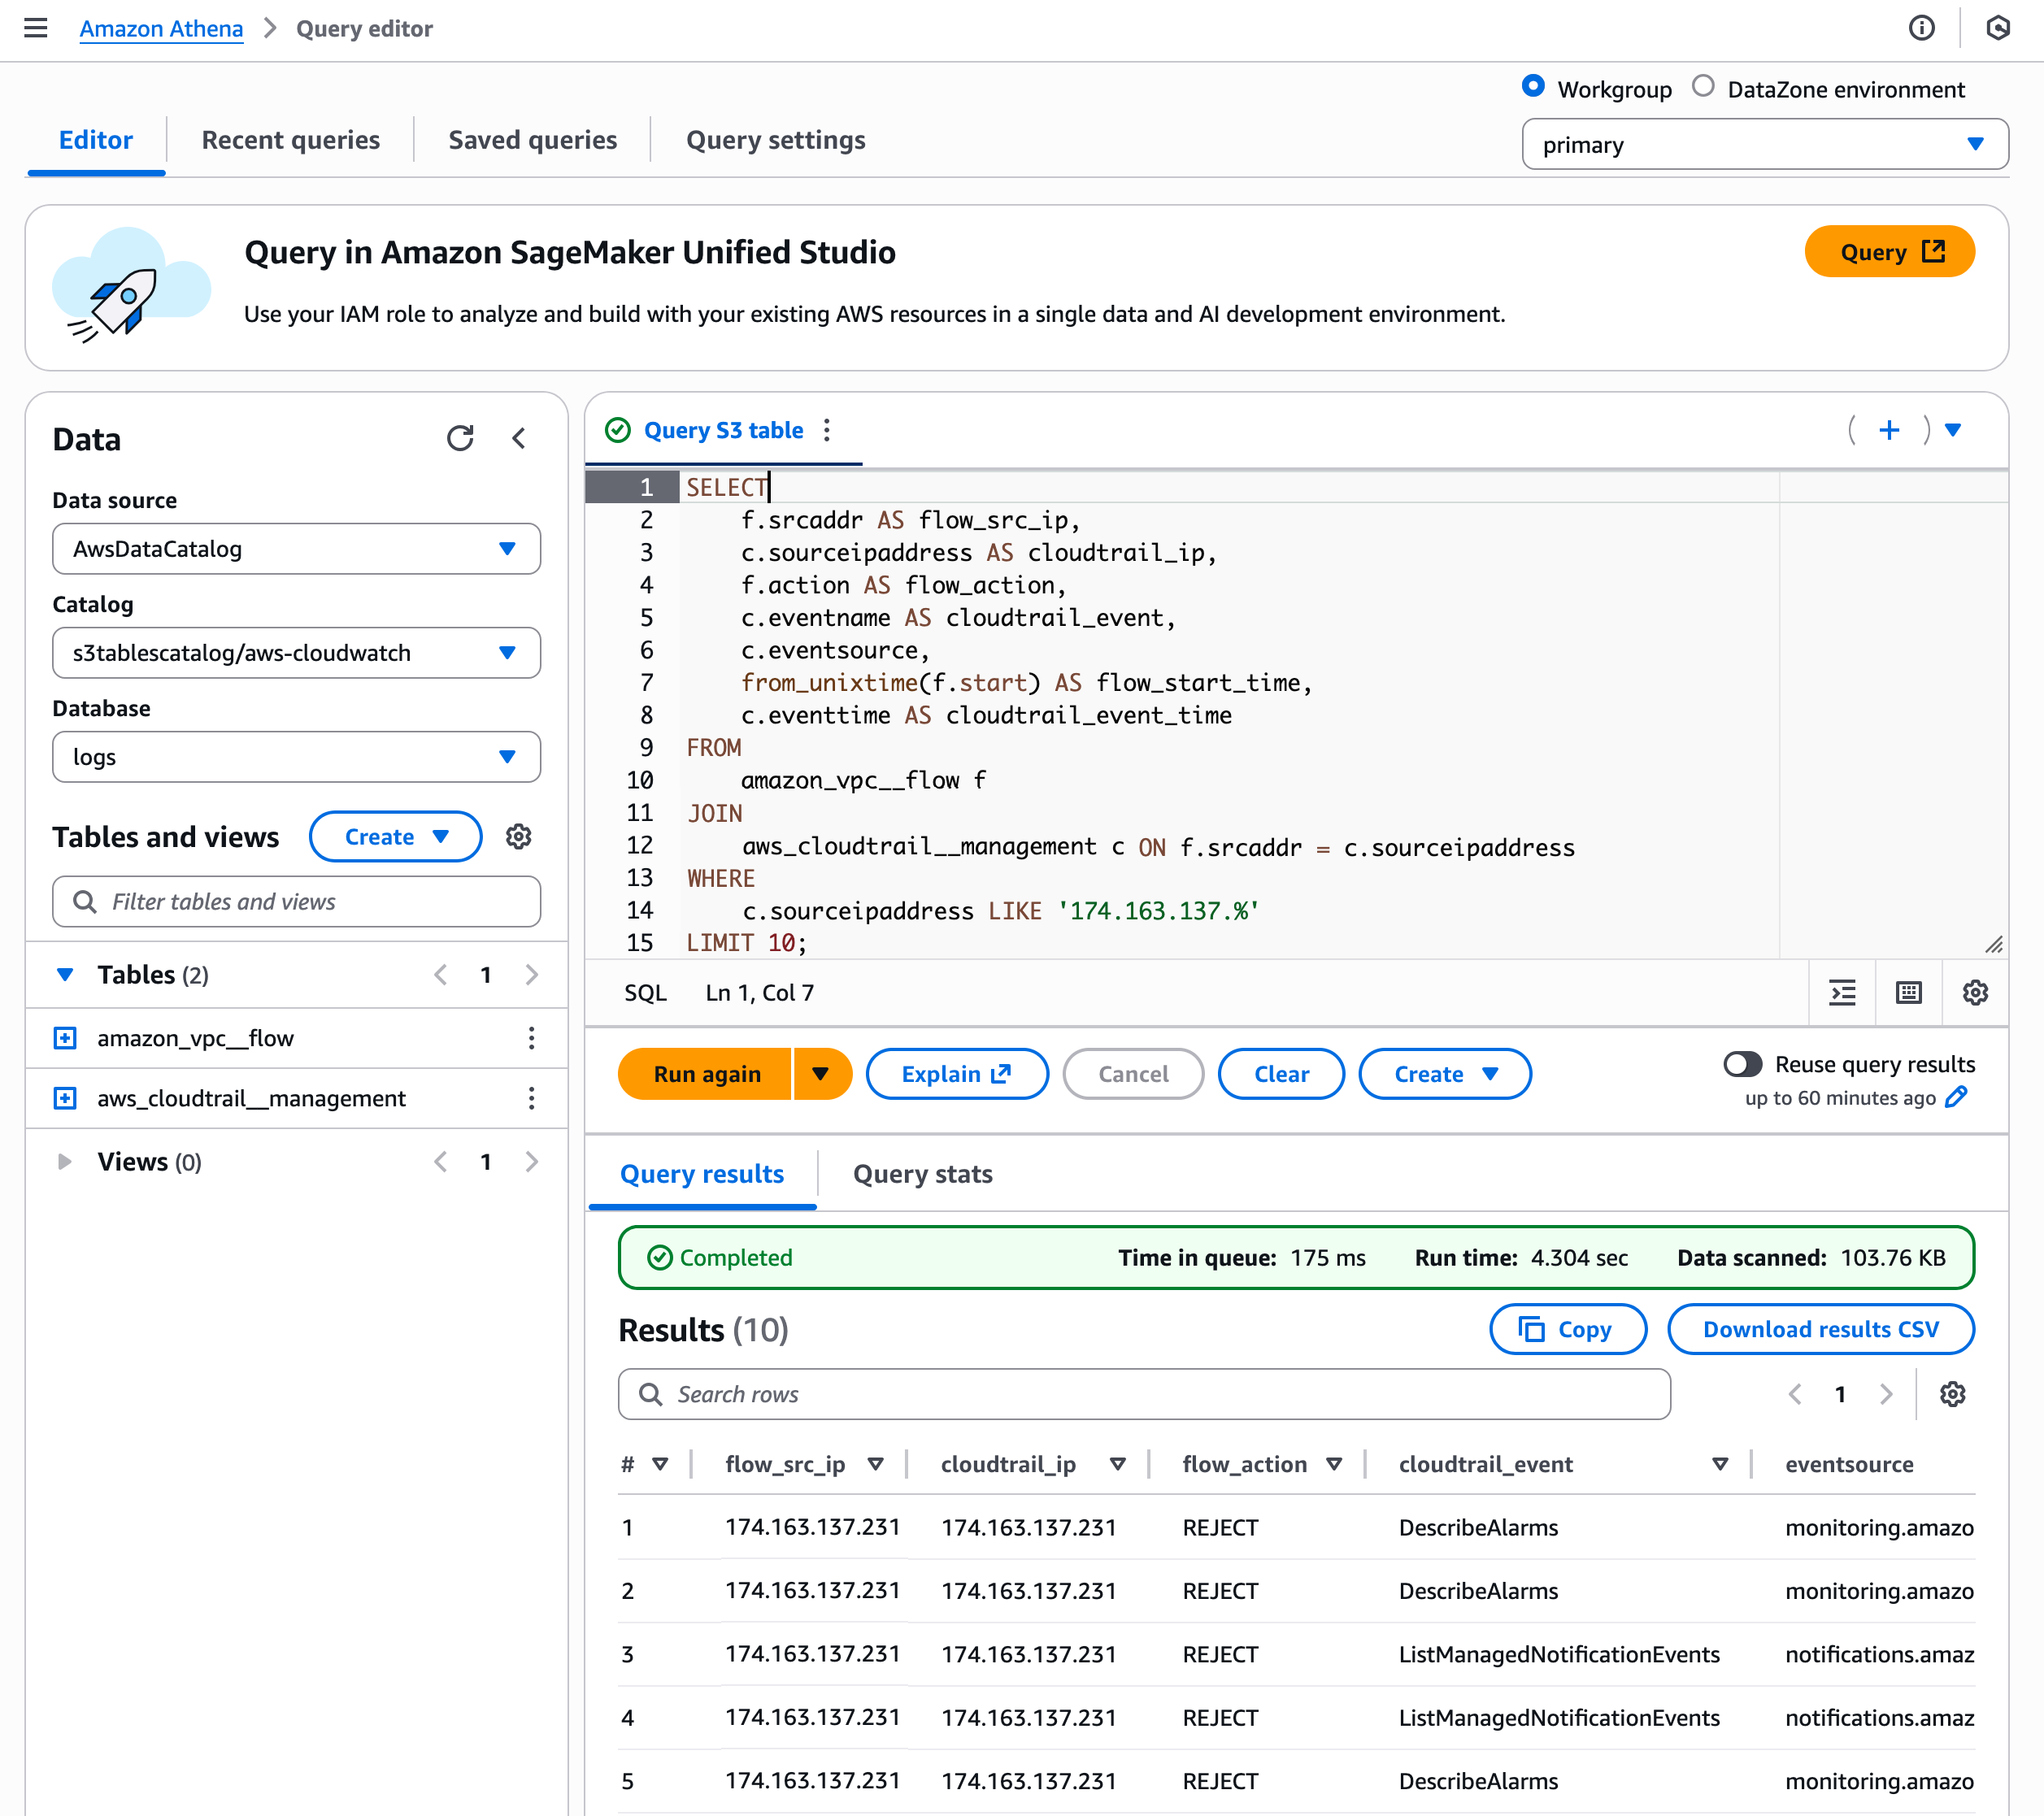
As I previously noted, you can integrate data sources into S3 Tables and query together. For example, using a Query Editor in Athena, you can query correlates network traffic with AWS API activity from a specific IP range (174.163.137.*) by joining VPC Flow Logs with CloudTrail logs based on matching source IP addresses.

This type of integrated search is particularly valuable for security monitoring, incident investigation, and suspicious behavior detection. You can view if an IP that’s making network connections is also performing sensitive AWS operations such as creating users, modifying security groups, or accessing data.

To learn more, visit S3 Tables integration with CloudWatch in the CloudWatch Logs User Guide.

Now available
New log management features of Amazon CloudWatch are available today in all AWS Regions except the AWS GovCloud (US) Regions and China Regions. For Regional availability and future roadmap, visit the AWS Capabilities by Region. There are no upfront commitments or minimum fees, and you pay for the usage of existing CloudWatch Logs for data ingestion, storage, and queries. To learn more, visit the CloudWatch pricing page.

Give it a try in the CloudWatch console. To learn more, visit the CloudWatch product page and send feedback to AWS re:Post for CloudWatch Logs or through your usual AWS Support contacts.

— Channy

New and enhanced AWS Support plans add AI capabilities to expert guidance

Post Syndicated from Matheus Guimaraes original https://aws.amazon.com/blogs/aws/new-and-enhanced-aws-support-plans-add-ai-capabilities-to-expert-guidance/

Today, we’re announcing a fundamental shift in how AWS Support helps customers move from reactive problem-solving to proactive issue prevention. This evolution introduces new Support plans that combine AI-powered capabilities with Amazon Web Services (AWS) expertise. The new and enhanced plans help you identify and address potential issues before they impact your business operations, helping you to operate and optimize your cloud workloads more effectively.

The portfolio includes three plans designed to match different operational needs. Each plan offers distinct capabilities, with higher tiers including all the capabilities of lower tiers plus additional features and enhanced service levels. Let’s have a look at them.

New and enhanced AWS Support paid plans
Business Support+ transforms the developer, startup, and small business experience by providing intelligent assistance powered by AI. You can choose to engage directly with AWS experts or start with AI-powered contextual recommendations that seamlessly transition to AWS experts when needed. AWS experts respond in within 30 minutes for critical cases(twice as fast as before), maintaining previous context and saving you from having to repeat yourself.

With a low-cost monthly subscription, this plan delivers advanced operational capabilities through a combination of AI-powered tools and AWS expertise. The plan provides personalized recommendations to help optimize your workloads based on your specific environment, while maintaining seamless access to AWS experts for technical support when needed.

Enterprise Support builds on our established support model, this tier accelerates innovation and cloud operations success through intelligent operations and AI-powered trusted human guidance. Your designated technical account manager (TAM) combines deep AWS knowledge with data-driven insights from your environment to help identify optimization opportunities and potential risks before they impact your operations. The plan also offers access to AWS Security Incident Response at no additional fee, a comprehensive service that centralizes tracking, storage, and management of security events while providing automated monitoring and investigation capabilities to strengthen your security posture.

Through AI-powered assistance and continuous monitoring of your AWS environment, this tier helps you achieve new levels of scale in your operations. With up to 15-minute response times for production-critical issues and support engineers who receive personalized context delivered by AI agents, this tier enables faster and more personalized resolution while maintaining operational excellence. Additionally, you also get access to interactive programs and hands-on workshops to foster continuous technical growth.

Unified Operations Support delivers our highest level of context-aware Support through an expanded team of AWS experts. Your core team comprised of a Technical Account Manager, a Domain Engineer, and a designated Senior Billing and Account Specialist is complemented by on-demand experts in migration, incident management, and security. These designated experts understand your unique environment and operational history, providing guidance through your preferred collaboration channels while combining their architectural knowledge with AI-powered insights.

Through comprehensive around-the-clock monitoring and AI-powered automation, this tier strengthens your mission-critical operations with proactive risk identification and contextual guidance. When critical incidents occur, you receive 5-minute response times with technical recommendations provided by Support engineers who understand your workloads. The team conducts systematic application reviews, helps validate operational readiness, and supports business-critical events, which means you can focus on innovation while maintaining the highest levels of operational excellence.

Transforming your cloud operations
AWS Support is evolving to help you build, operate, and optimize your cloud infrastructure more effectively. We maintain context of your account’s support history and previous cases, configuration, and previous cases, so our AI-powered capabilities and AWS experts can deliver more relevant and effective solutions tailored to your specific environment.

Support plan capabilities will continuously evolve to add comprehensive visibility into your infrastructure, delivering actionable insights across performance, security, and cost dimensions with clear evaluation of business impact and cost benefits. This combination of AI-powered tools and AWS expertise represents a fundamental shift from reactive to proactive operations, helping you prevent issues before they impact your business.

Subscribers of AWS Developer Support, AWS Business Support (classic), and AWS Enterprise On-Ramp Support plans can continue to receive their current level of support through January 1, 2027. You can transition to one of the new and enhanced plans at any time before then by visiting the AWS Management Console or by reaching out to your AWS account team. Customers subscribed to AWS Enterprise Support can begin using the new features of this plan at any time.

Things to know
Business Support+, Enterprise Support, and Unified Operations are available in all commercial AWS Regions. Existing customers can continue their current plans or explore the new offerings for enhanced performance and efficiency.

Business Support+ starts at $29 per month, a 71% savings over the previous Business Support monthly minimum. Enterprise Support starts at $5,000 per month, a 67% savings over the previous Enterprise Support minimum price. Unified Operations, designed for organizations with mission-critical workloads and including a designated team of AWS experts, starts at $50,000 a month. All new Support plans use pricing tiers, which rewards higher usage with lower marginal prices for Support.

For critical cases, AWS Support provides different target response times across the plans. Business Support+ offers a 30-minute response time, Enterprise Support responds within 15 minutes, and Unified Operations Support delivers the fastest response time at 5 minutes.

To learn more about AWS Support plans and features, visit the AWS Support page or sign in to the AWS Management Console.

For hands-on guidance with AWS Support features, schedule a consultation with your account team.

Amazon OpenSearch Service improves vector database performance and cost with GPU acceleration and auto-optimization

Post Syndicated from Channy Yun (윤석찬) original https://aws.amazon.com/blogs/aws/amazon-opensearch-service-improves-vector-database-performance-and-cost-with-gpu-acceleration-and-auto-optimization/

Today we’re announcing serverless GPU acceleration and auto-optimization for vector index in Amazon OpenSearch Service that helps you build large-scale vector databases faster with lower costs and automatically optimize vector indexes for optimal trade-offs between search quality, speed, and cost.

Here are the new capabilities introduced today:

  • GPU acceleration – You can build vector databases up to 10 times faster at a quarter of the indexing cost when compared to non-GPU acceleration, and you can create billion-scale vector databases in under an hour. With significant gains in cost saving and speed, you get an advantage in time-to-market, innovation velocity, and adoption of vector search at scale.
  • Auto-optimization – You can find the best balance between search latency, quality, and memory requirements for your vector field without needing vector expertise. This optimization helps you achieve better cost-savings and recall rates when compared to default index configurations, while manual index tuning can take weeks to complete.

You can use these capabilities to build vector databases faster and more cost-effectively on OpenSearch Service. You can use them to power generative AI applications, search product catalogs and knowledge bases, and more. You can enable GPU acceleration and auto-optimization when you create a new OpenSearch domain or collection, as well as update an existing domain or collection.

Let’s go through how it works!

GPU acceleration for vector index
When you enable GPU acceleration on your OpenSearch Service domain or Serverless collection, OpenSearch Service automatically detects opportunities to accelerate your vector indexing workloads. This acceleration helps build the vector data structures in your OpenSearch Service domain or Serverless collection.

You don’t need to provision the GPU instances, manage their usage or pay for idle time. OpenSearch Service securely isolates your accelerated workloads to your domain’s or collection’s Amazon Virtual Private Cloud (Amazon VPC) within your account. You pay only for useful processing through the OpenSearch Compute Units (OCU) – Vector Acceleration pricing.

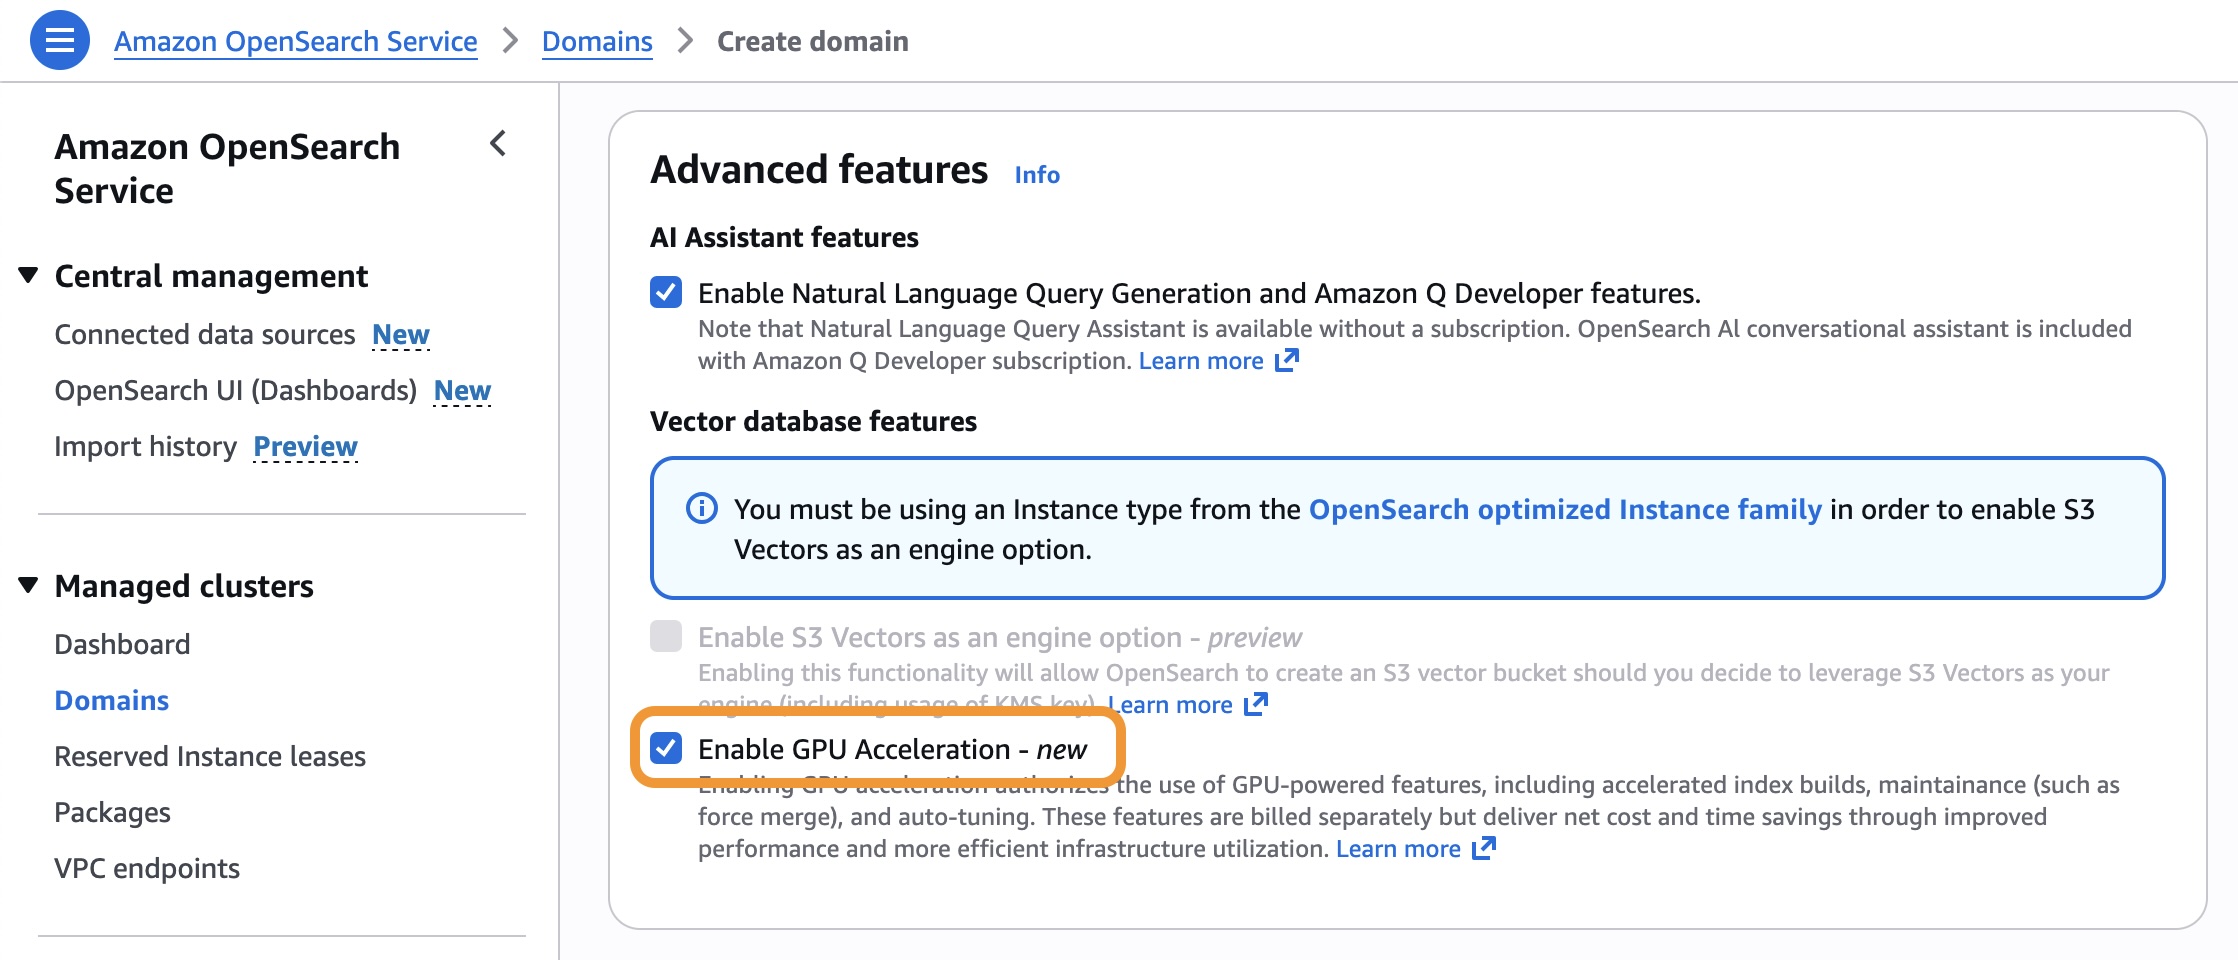
To enable GPU acceleration, go to the OpenSearch Service console and choose Enable GPU Acceleration in the Advanced features section when you create or update your OpenSearch Service domain or Serverless collection.

You can use the following AWS Command Line Interface (AWS CLI) command to enable GPU acceleration for an existing OpenSearch Service domain.

$ aws opensearch update-domain-config \
    --domain-name my-domain \
    --aiml-options '{"ServerlessVectorAcceleration": {"Enabled": true}}'

You can create a vector index optimized for GPU processing. This example index stores 768-dimensional vectors for text embeddings by enabling index.knn.remote_index_build.enabled.

PUT my-vector-index
{
    "settings": {
        "index.knn": true,
        "index.knn.remote_index_build.enabled": true
    },
    "mappings": {
        "properties": {
        "vector_field": {
        "type": "knn_vector",
        "dimension": 768,
      },
      "text": {
        "type": "text"
      }
    }
  }
}

Now you can add vector data and optimize your index using standard OpenSearch Service operations using the bulk API. The GPU acceleration is automatically applied to indexing and force-merge operations.

POST my-vector-index/_bulk
{"index": {"_id": "1"}}
{"vector_field": [0.1, 0.2, 0.3, ...], "text": "Sample document 1"}
{"index": {"_id": "2"}}
{"vector_field": [0.4, 0.5, 0.6, ...], "text": "Sample document 2"}

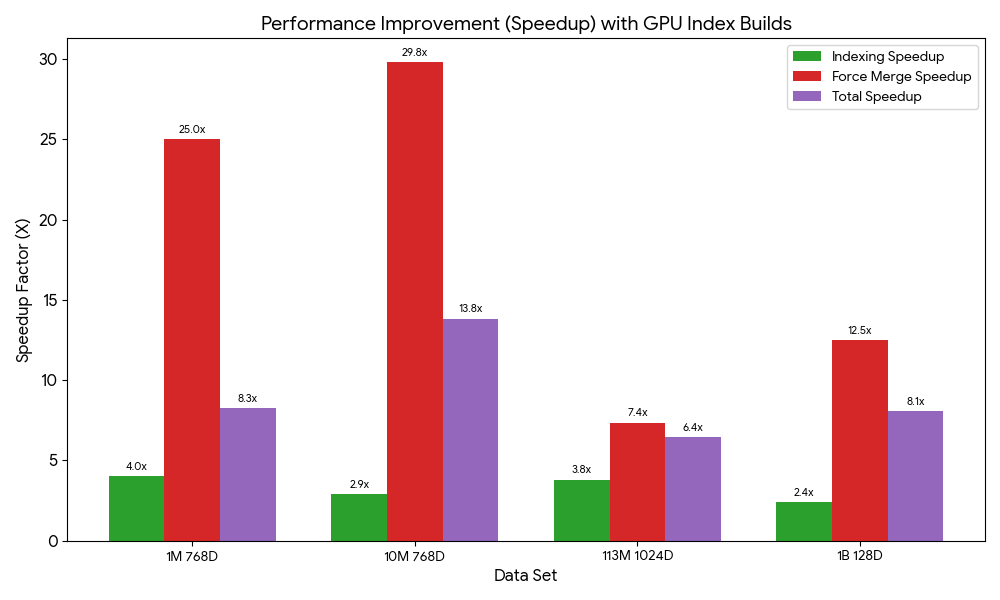
We ran index build benchmarks and observed speed gains from GPU acceleration ranging between 6.4 to 13.8 times. Stay tuned for more benchmarks and further details in upcoming posts.

To learn more, visit GPU acceleration for vector indexing in the Amazon OpenSearch Service Developer Guide.

Auto-optimizing vector databases
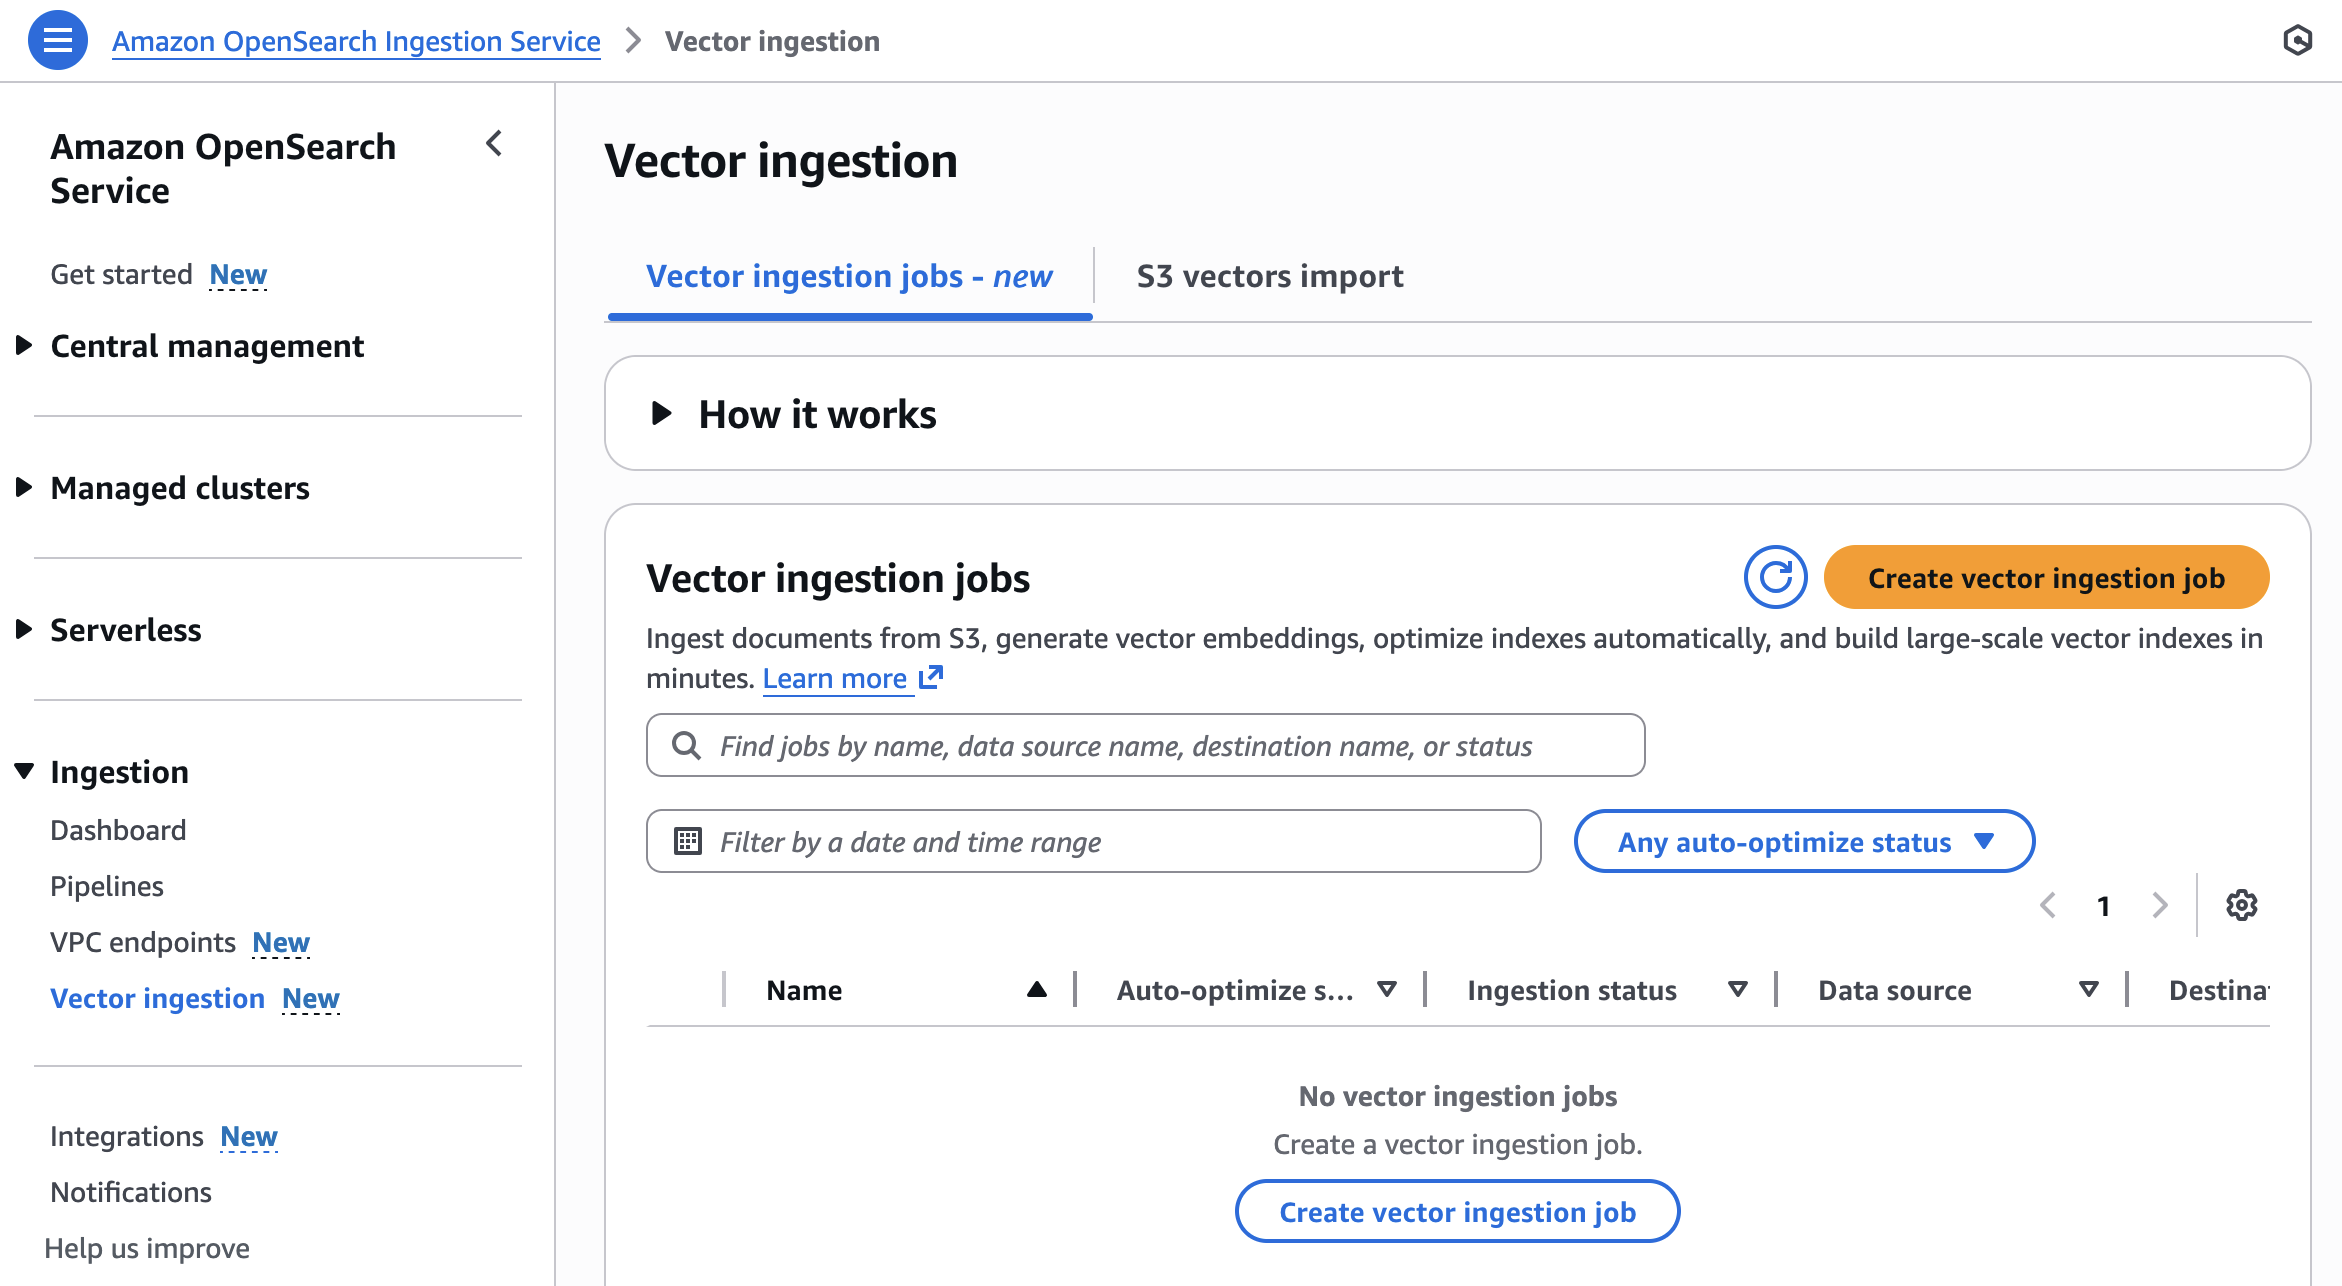
You can use the new vector ingestion feature to ingest documents from Amazon Simple Storage Service (Amazon S3), generate vector embeddings, optimize indexes automatically, and build large-scale vector indexes in minutes. During the ingestion, auto-optimization generates recommendations based on your vector fields and indexes of your OpenSearch Service domain or Serverless collection. You can choose one of these recommendations to quickly ingest and index your vector dataset instead of manually configuring these mappings.

To get started, choose Vector ingestion under the Ingestion menu in the left navigation pane of OpenSearch Service console.

You can create a new vector ingestion job with the following steps:

  • Prepare dataset – Prepare OpenSearch Service parquet documents in an S3 bucket and choose a domain or collection for your destination.
  • Configure index and automate optimizations – Auto-optimize your vector fields or manually configure them.
  • Ingest and accelerate indexing – Use OpenSearch ingestion pipelines to load data from Amazon S3 into OpenSearch Service. Build large vector indexes up to 10 times faster at a quarter of the cost.

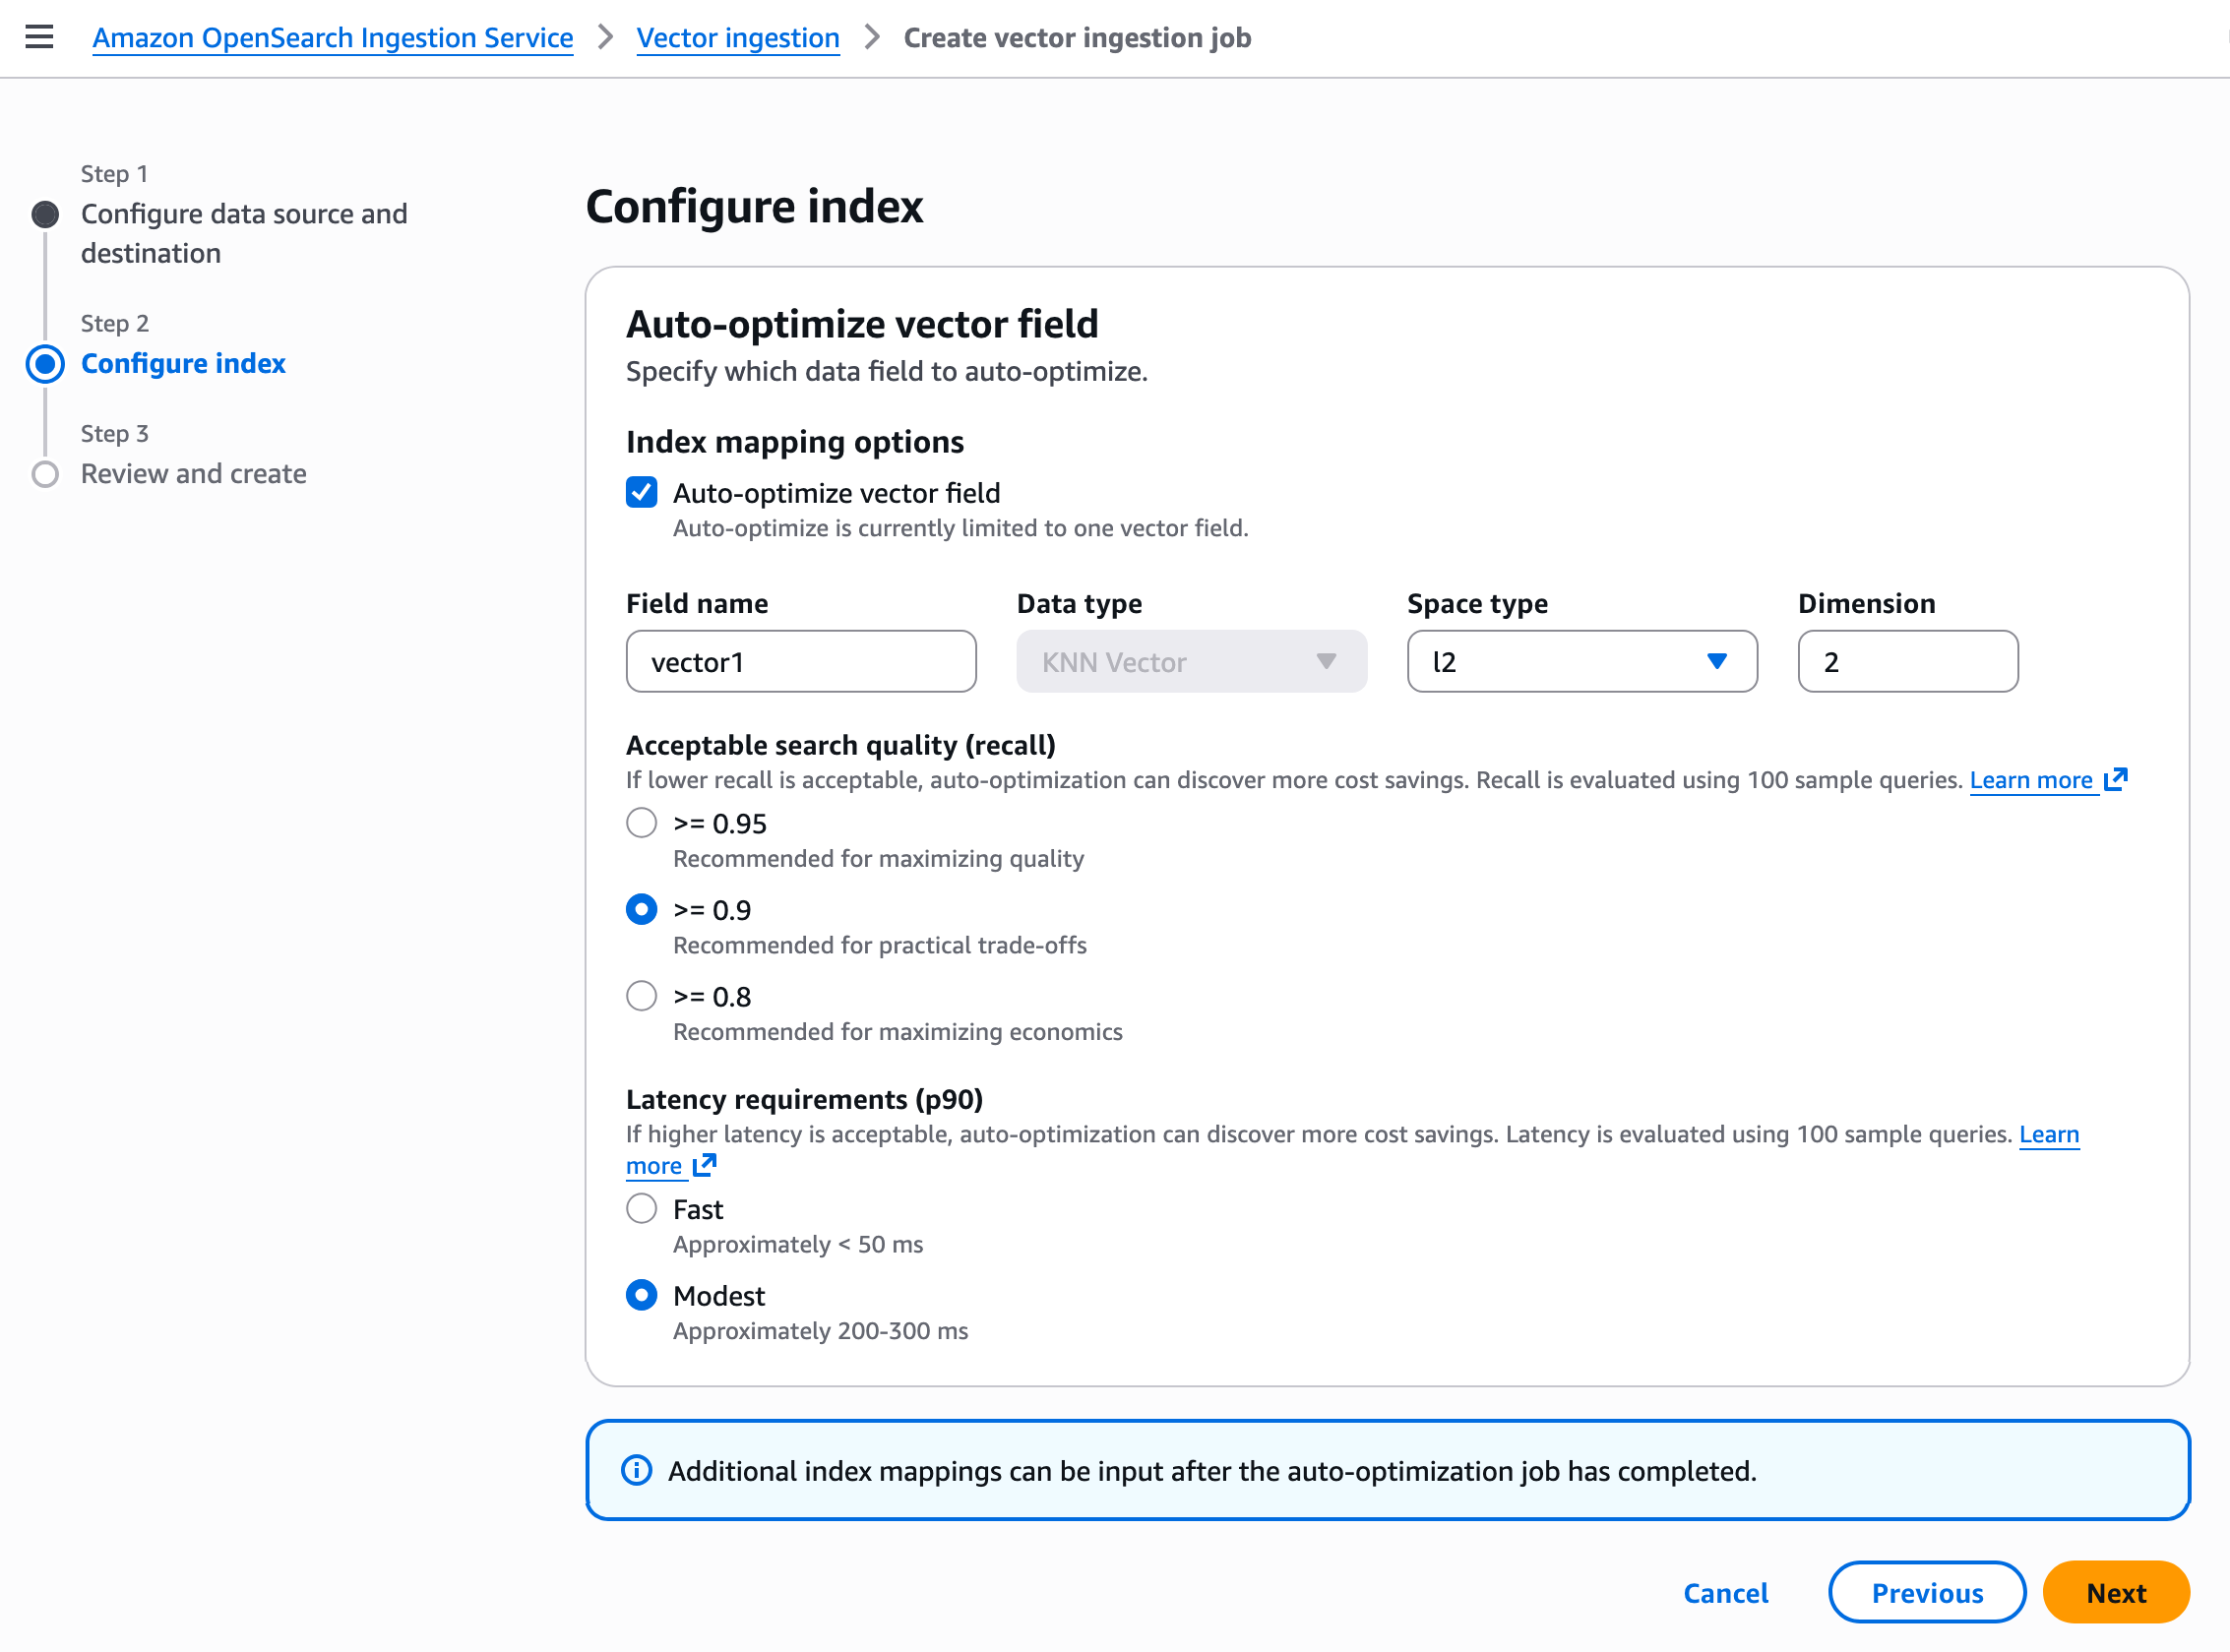
In Step 2, configure your vector index with auto-optimize vector field. Auto-optimize is currently limited to one vector field. Further index mappings can be input after the auto-optimization job has completed.

Your vector field optimization settings depend on your use case. For example, if you need high search quality (recall rate) and don’t need faster responses, then choose Modest for the Latency requirements (p90) and more than or equal to 0.9 for the Acceptable search quality (recall). When you create a job, it starts to ingest vector data and auto-optimize vector index. The processing time depends on the vector dimensionality.

To learn more, visit Auto-optimize vector index in the OpenSearch Service Developer Guide.

Now available
GPU acceleration in Amazon OpenSearch Service is now available in the US East (N. Virginia), US West (Oregon), Asia Pacific (Sydney), Asia Pacific (Tokyo), and Europe (Ireland) Regions. Auto-optimization in OpenSearch Service is now available in the US East (Ohio), US East (N. Virginia), US West (Oregon), Asia Pacific (Mumbai), Asia Pacific (Singapore), Asia Pacific (Sydney), Asia Pacific (Tokyo), Europe (Frankfurt), and Europe (Ireland) Regions.

OpenSearch Service separately charges for used OCU – Vector Acceleration only to index your vector databases. For more information, visitOpenSearch Service pricing page.

Give it a try and send feedback to the AWS re:Post for Amazon OpenSearch Service or through your usual AWS Support contacts.

— Channy

Amazon S3 Vectors now generally available with increased scale and performance

Post Syndicated from Sébastien Stormacq original https://aws.amazon.com/blogs/aws/amazon-s3-vectors-now-generally-available-with-increased-scale-and-performance/

Today, I’m excited to announce that Amazon S3 Vectors is now generally available with significantly increased scale and production-grade performance capabilities. S3 Vectors is the first cloud object storage with native support to store and query vector data. You can use it to help you reduce the total cost of storing and querying vectors by up to 90% when compared to specialized vector database solutions.

Since we announced the preview of S3 Vectors in July, I’ve been impressed by how quickly you adopted this new capability to store and query vector data. In just over four months, you created over 250,000 vector indexes and ingested more than 40 billion vectors, performing over 1 billion queries (as of November 28th).

You can now store and search across up to 2 billion vectors in a single index, that’s up to 20 trillion vectors in a vector bucket and a 40x increase from 50 million per index during preview. This means that you can consolidate your entire vector dataset into one index, removing the need to shard across multiple smaller indexes or implement complex query federation logic.

Query performance has been optimized. Infrequent queries continue to return results in under one second, with more frequent queries now resulting in latencies around 100ms or less, making it well-suited for interactive applications such as conversational AI and multi-agent workflows. You can also retrieve up to 100 search results per query, up from 30 previously, providing more comprehensive context for retrieval augmented generation (RAG) applications.

The write performance has also improved substantially, with support for up to 1,000 PUT transactions per second when streaming single-vector updates into your indexes, delivering significantly higher write throughput for small batch sizes. This higher throughput supports workloads where new data must be immediately searchable, helping you ingest small data corpora quickly or handle many concurrent sources writing simultaneously to the same index.

The fully serverless architecture removes infrastructure overhead—there’s no infrastructure to set up or resources to provision. You pay for what you use as you store and query vectors. This AI-ready storage provides you with quick access to any amount of vector data to support your complete AI development lifecycle, from initial experimentation and prototyping through to large-scale production deployments. S3 Vectors now provides the scale and performance needed for production workloads across AI agents, inference, semantic search, and RAG applications.

Two key integrations that were launched in preview are now generally available. You can use S3 Vectors as a vector storage engine for Amazon Bedrock Knowledge Base. In particular, you can use it to build RAG applications with production-grade scale and performance. Moreover, S3 Vectors integration with Amazon OpenSearch is now generally available, so that you can use S3 Vectors as your vector storage layer while using OpenSearch for search and analytics capabilities.

You can now use S3 Vectors in 14 AWS Regions, expanding from five AWS Regions during the preview.

Let’s see how it works
In this post, I demonstrate how to use S3 Vectors through the AWS Console and CLI.

First, I create an S3 Vector bucket and an index.

echo "Creating S3 Vector bucket..."
aws s3vectors create-vector-bucket \
    --vector-bucket-name "$BUCKET_NAME"

echo "Creating vector index..."
aws s3vectors create-index \
    --vector-bucket-name "$BUCKET_NAME" \
    --index-name "$INDEX_NAME" \
    --data-type "float32" \
    --dimension "$DIMENSIONS" \
    --distance-metric "$DISTANCE_METRIC" \
    --metadata-configuration "nonFilterableMetadataKeys=AMAZON_BEDROCK_TEXT,AMAZON_BEDROCK_METADATA"

The dimension metric must match the dimension of the model used to compute the vectors. The distance metric indicates to the algorithm to compute the distance between vectors. S3 Vectors supports cosine and euclidian distances.

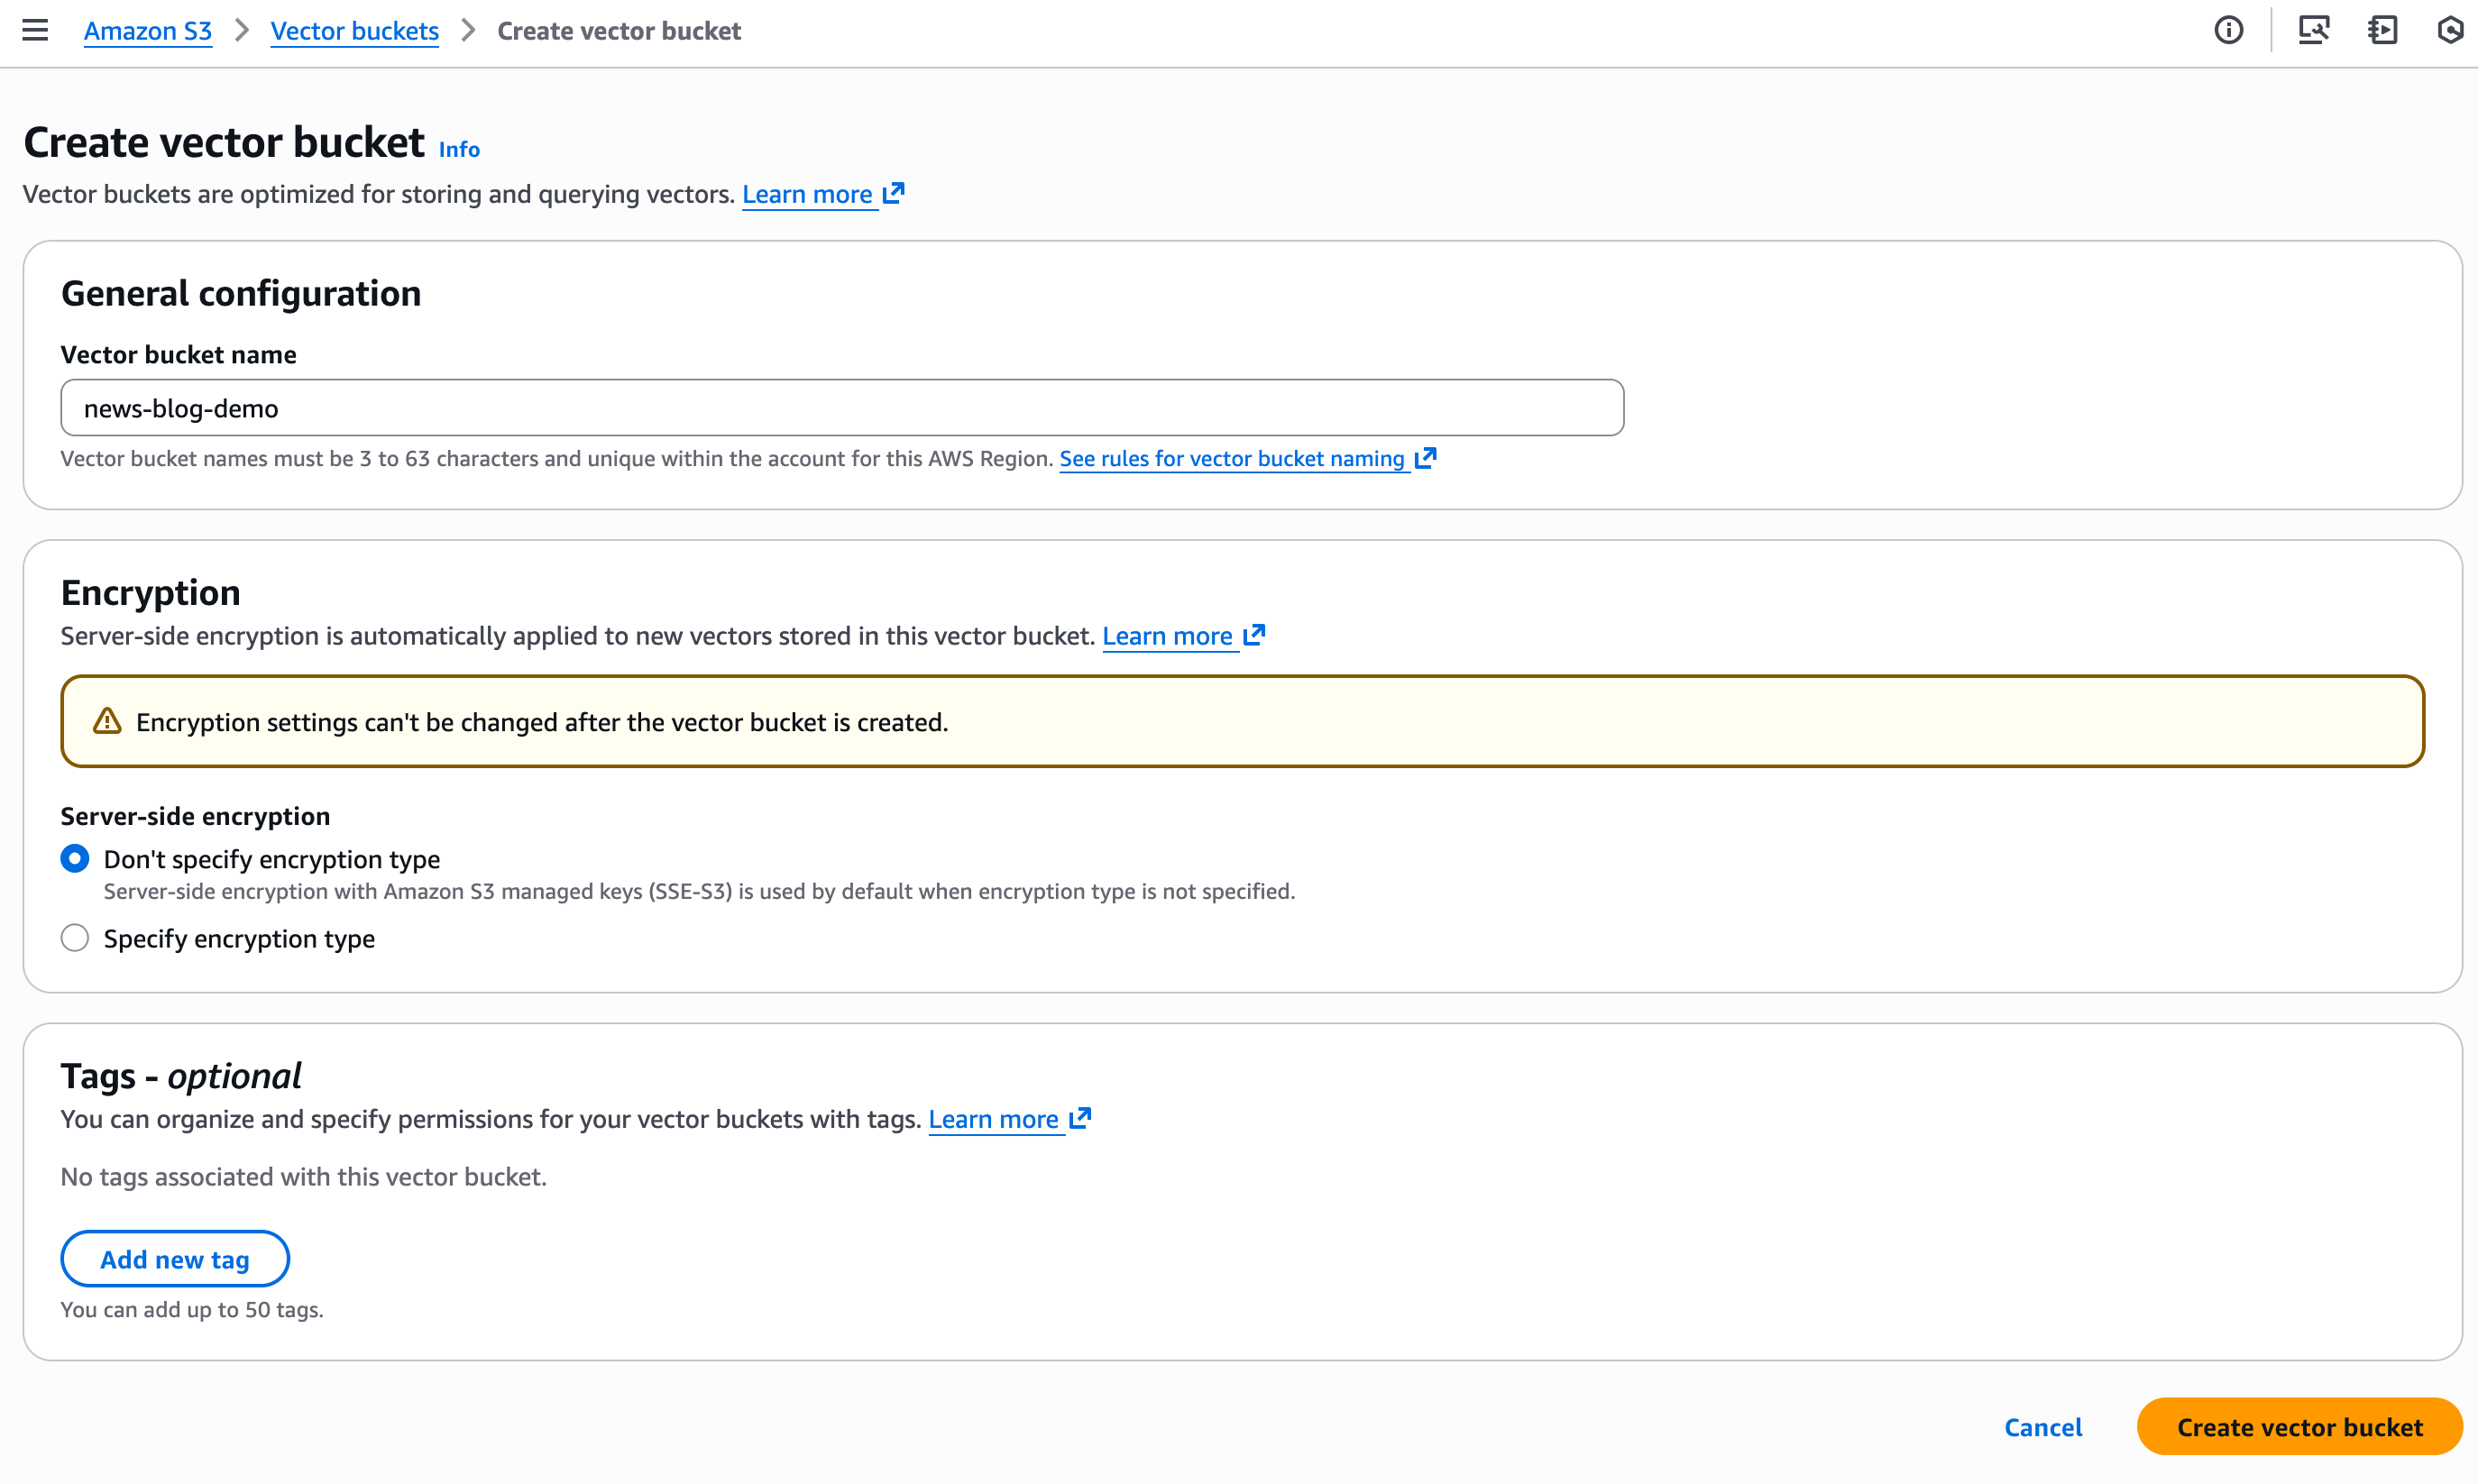
I can also use the console to create the bucket. We’ve added the capability to configure encryption parameters at creation time. By default, indexes use the bucket-level encryption, but I can override bucket-level encryption at the index level with a custom AWS Key Management Service (AWS KMS) key.

I also can add tags for the vector bucket and vector index. Tags at the vector index help with access control and cost allocation.

S3 Vector console - create

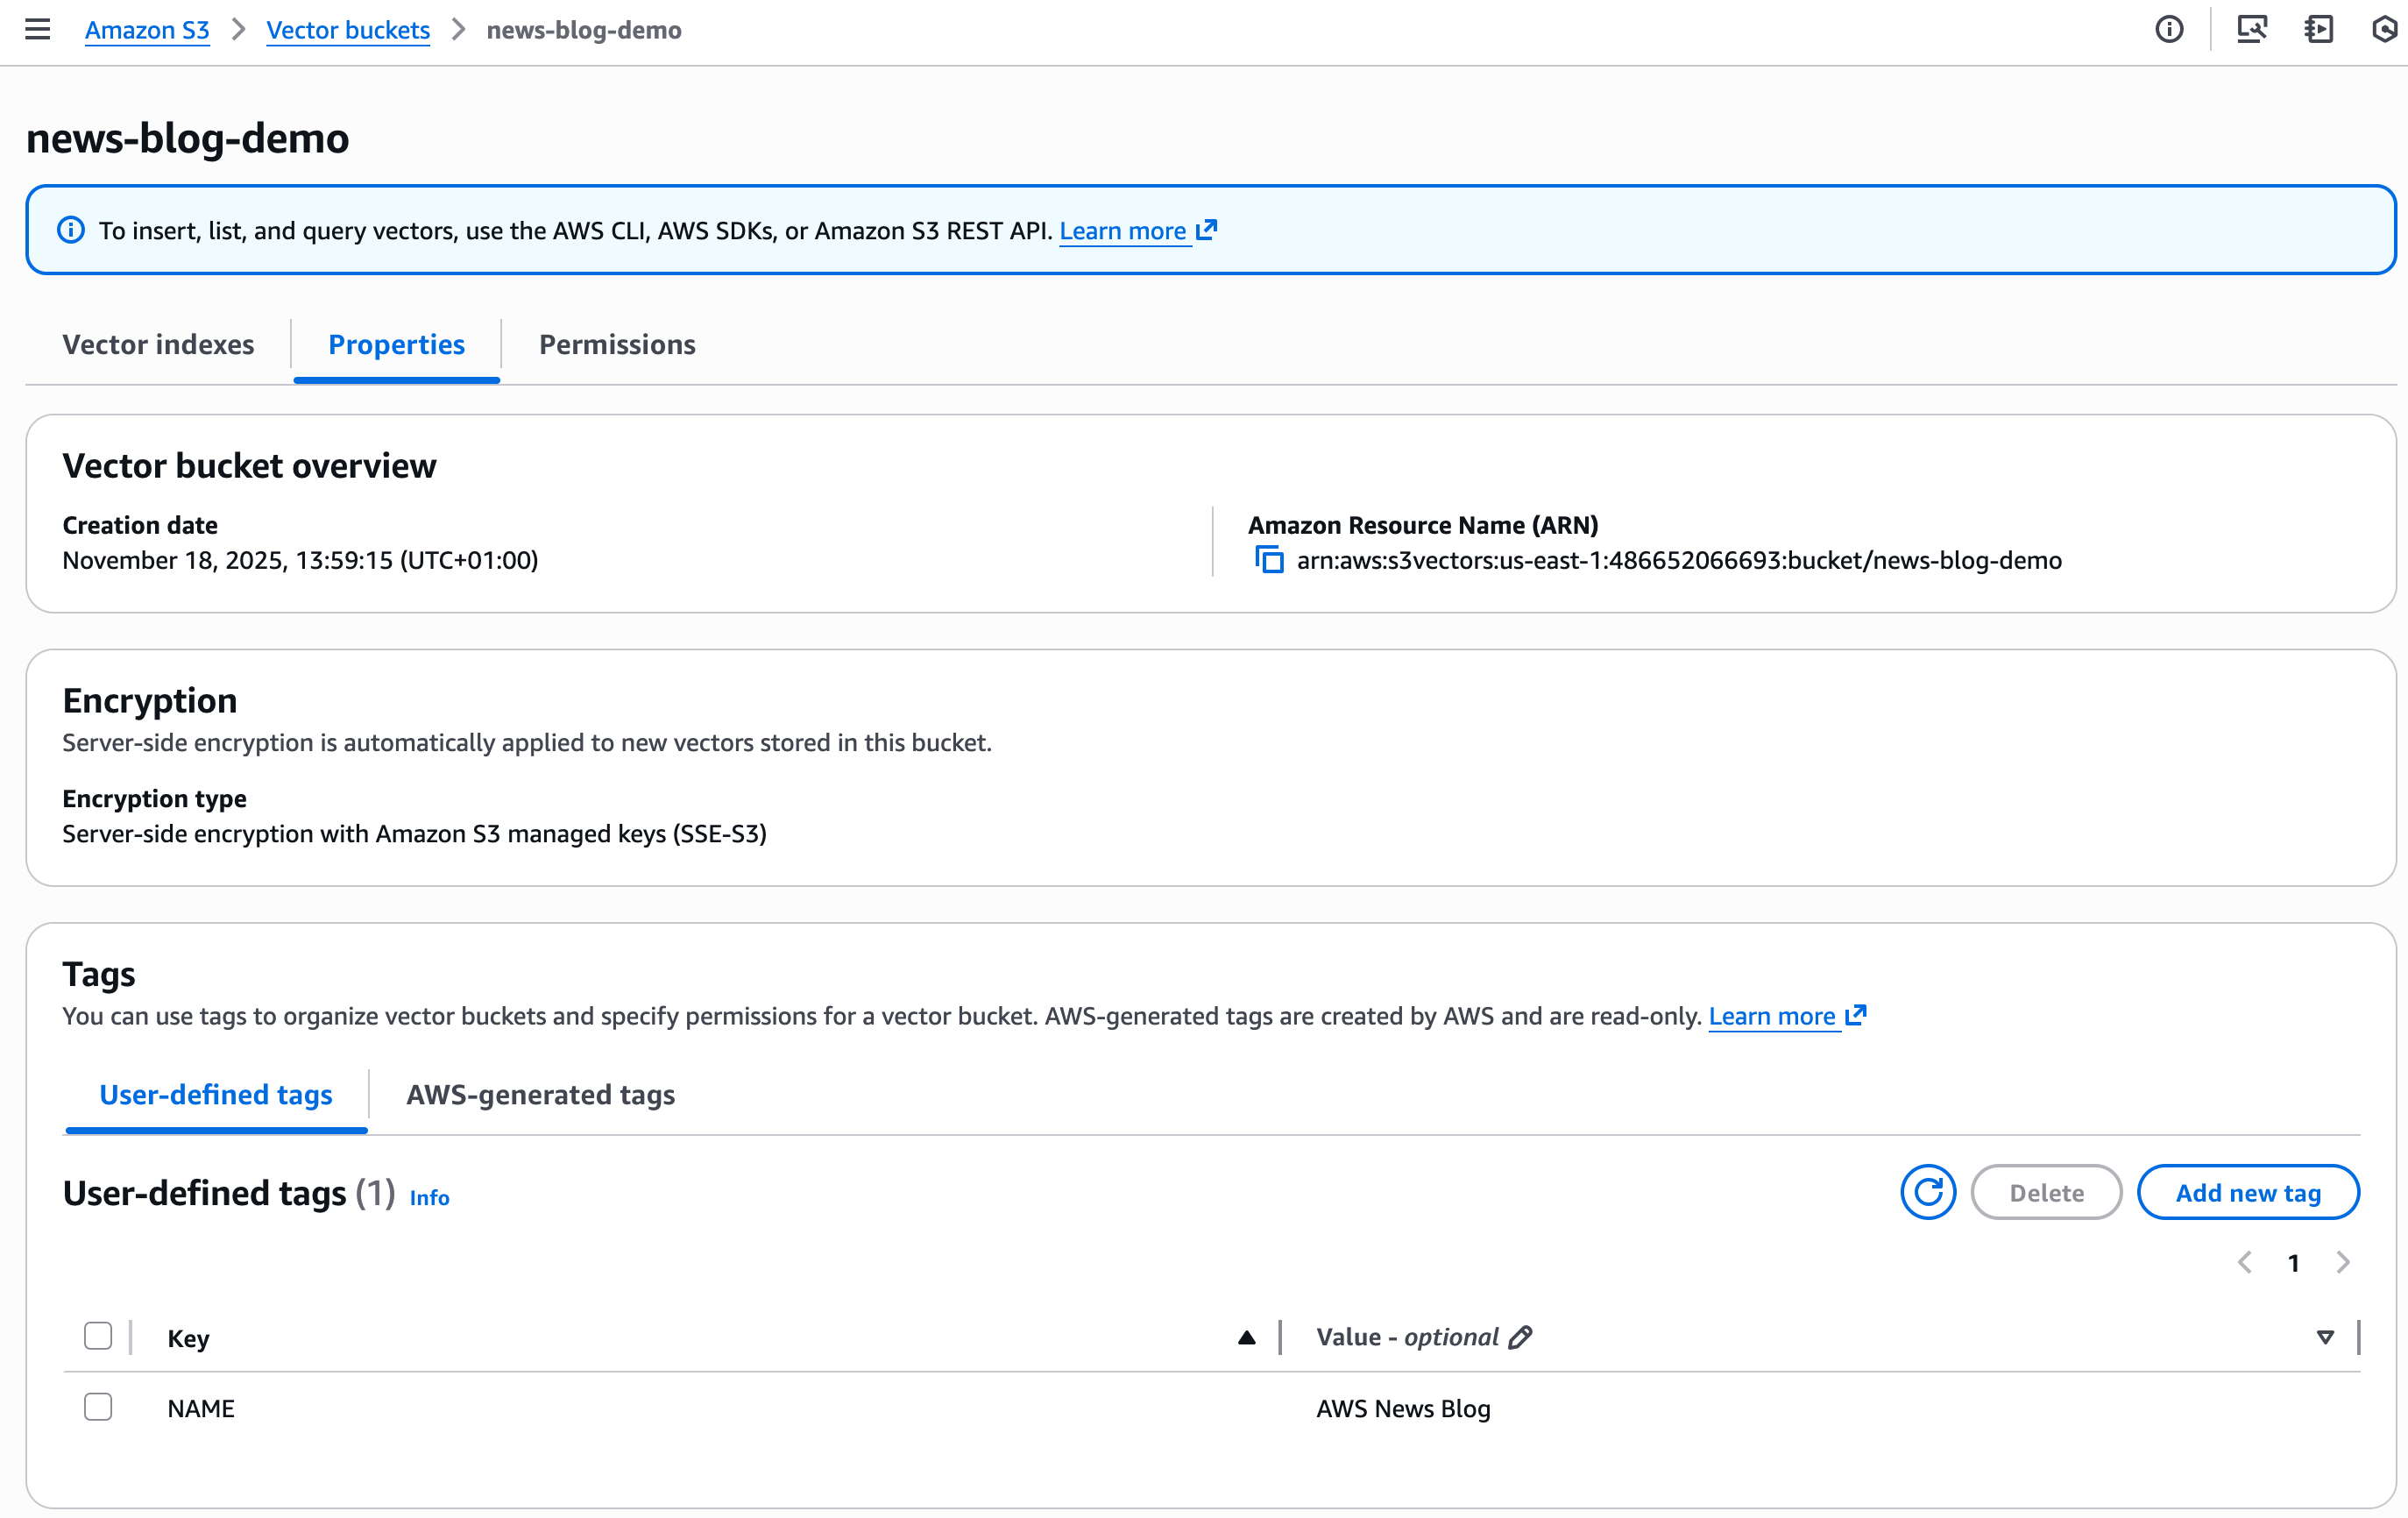
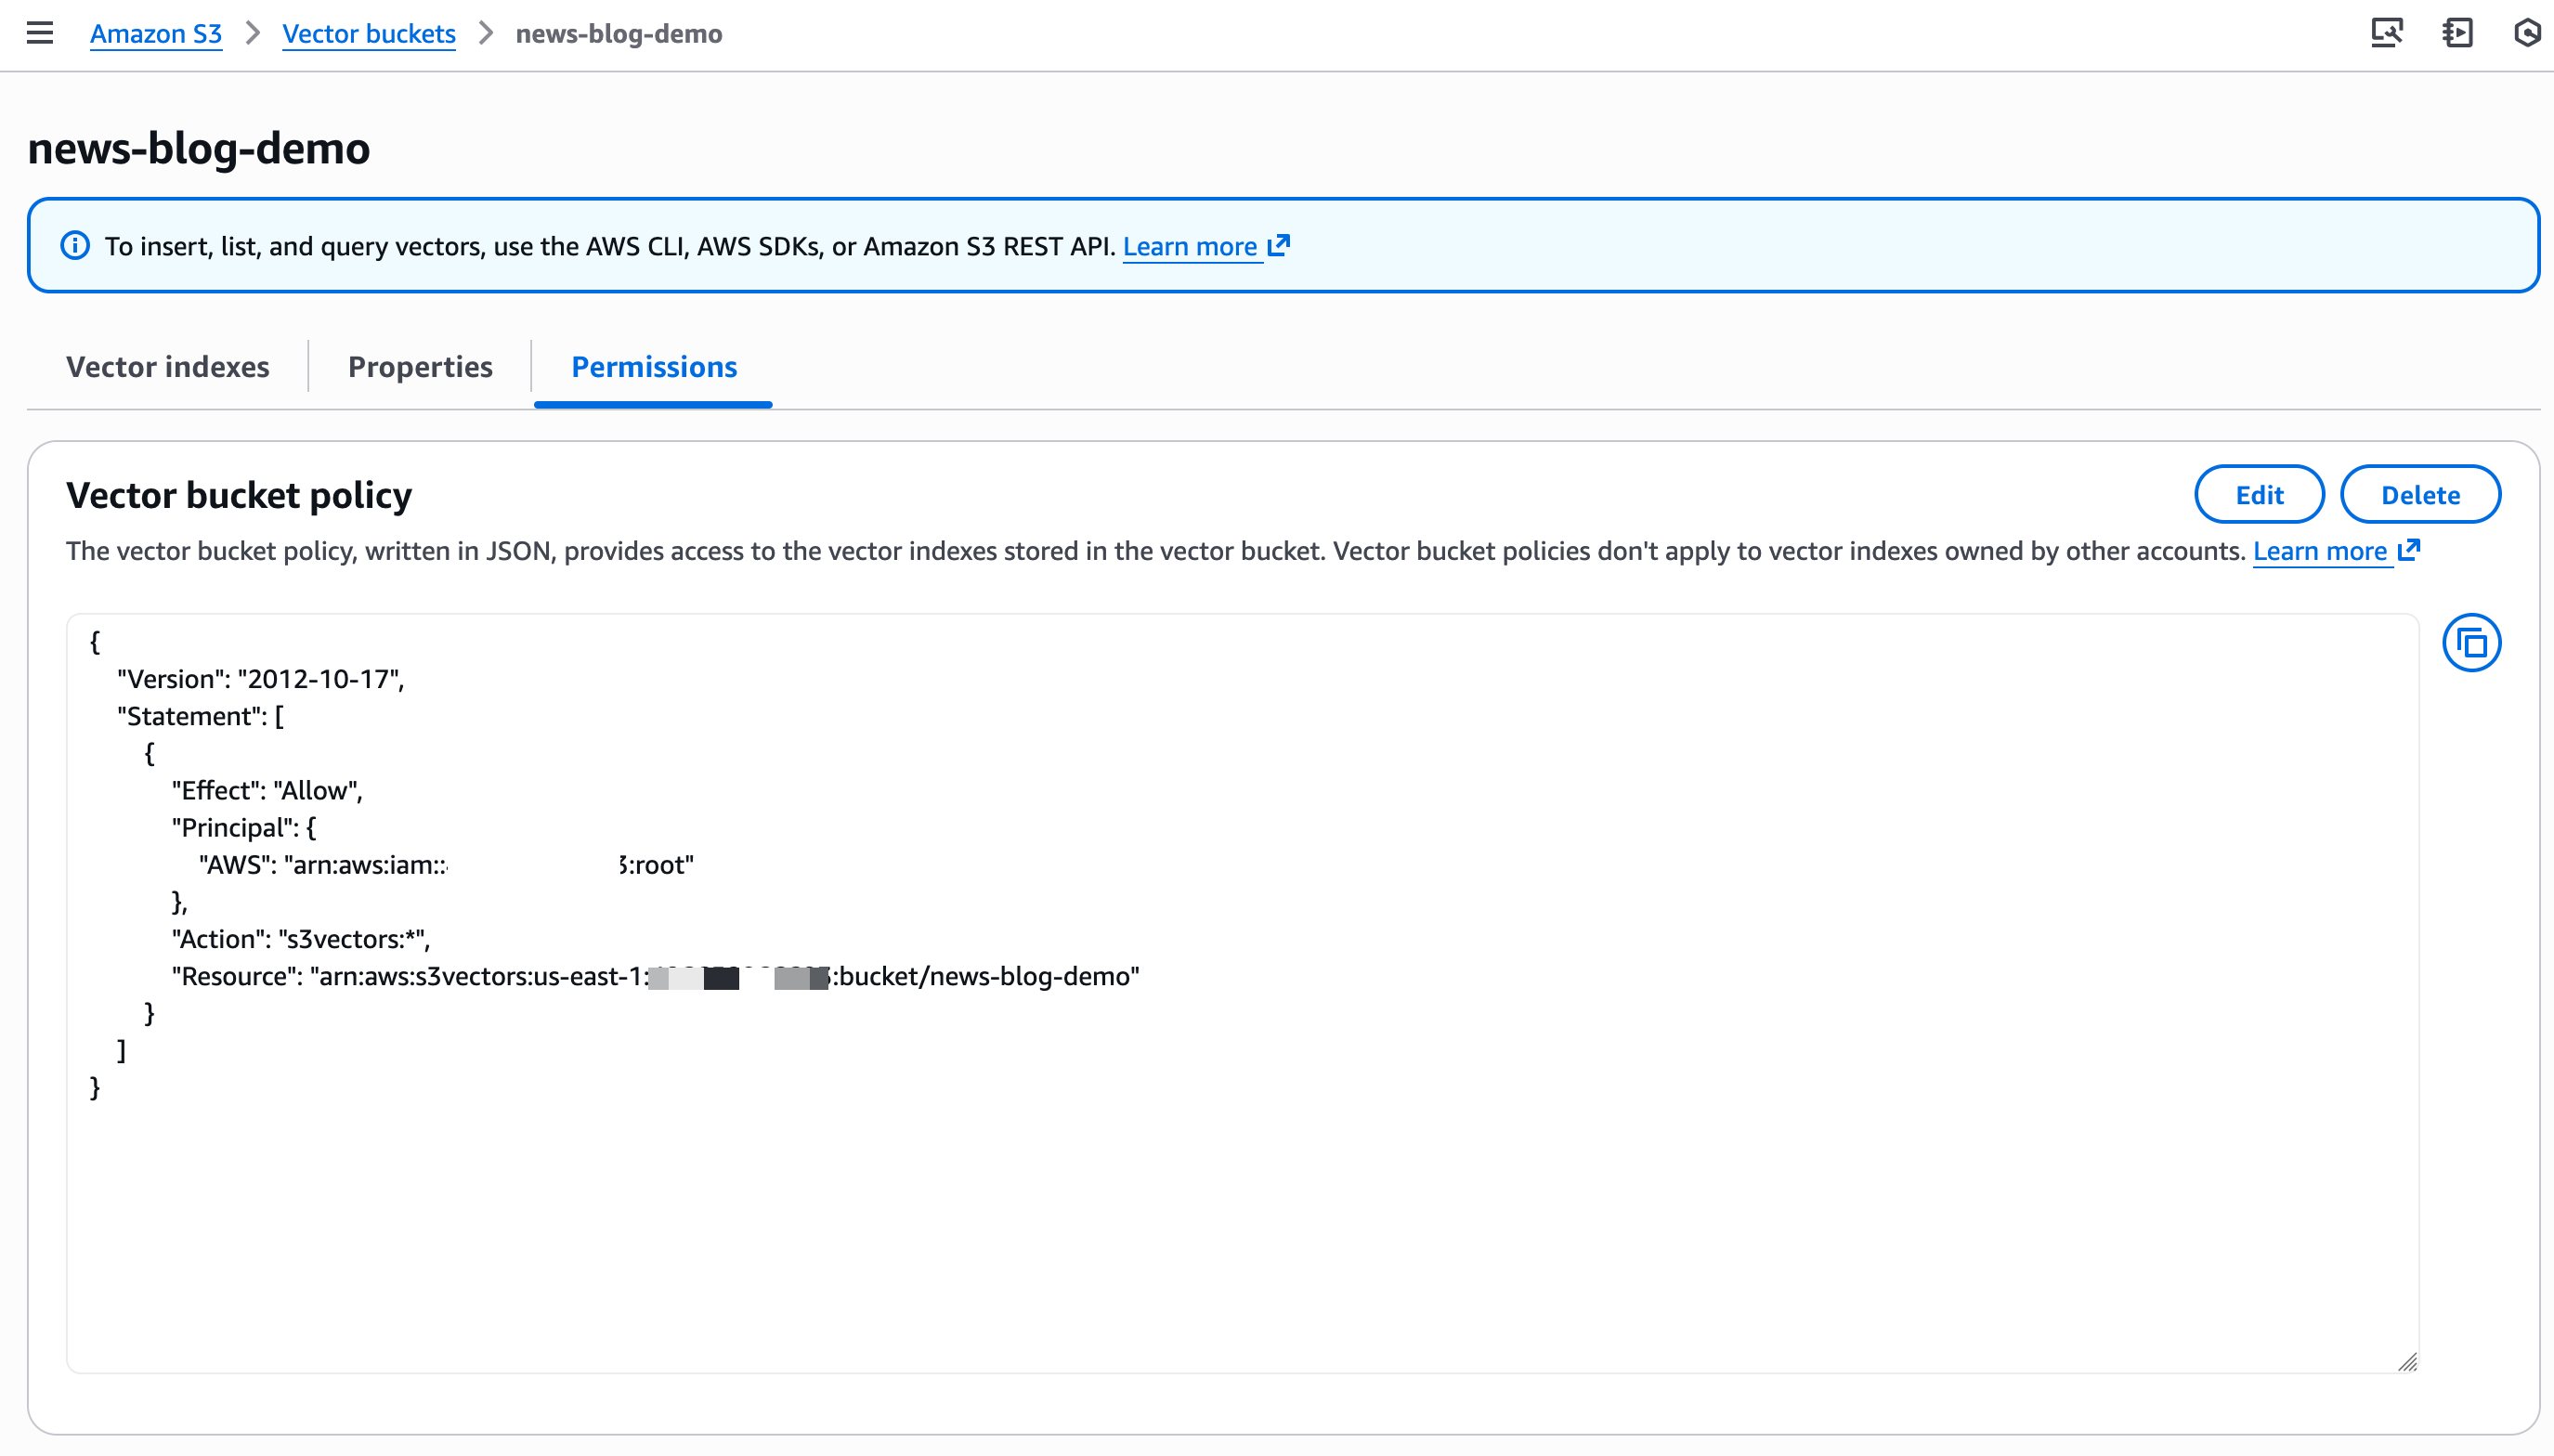
And I can now manage Properties and Permissions directly in the console.

S3 Vector console - properties

S3 Vector console - create

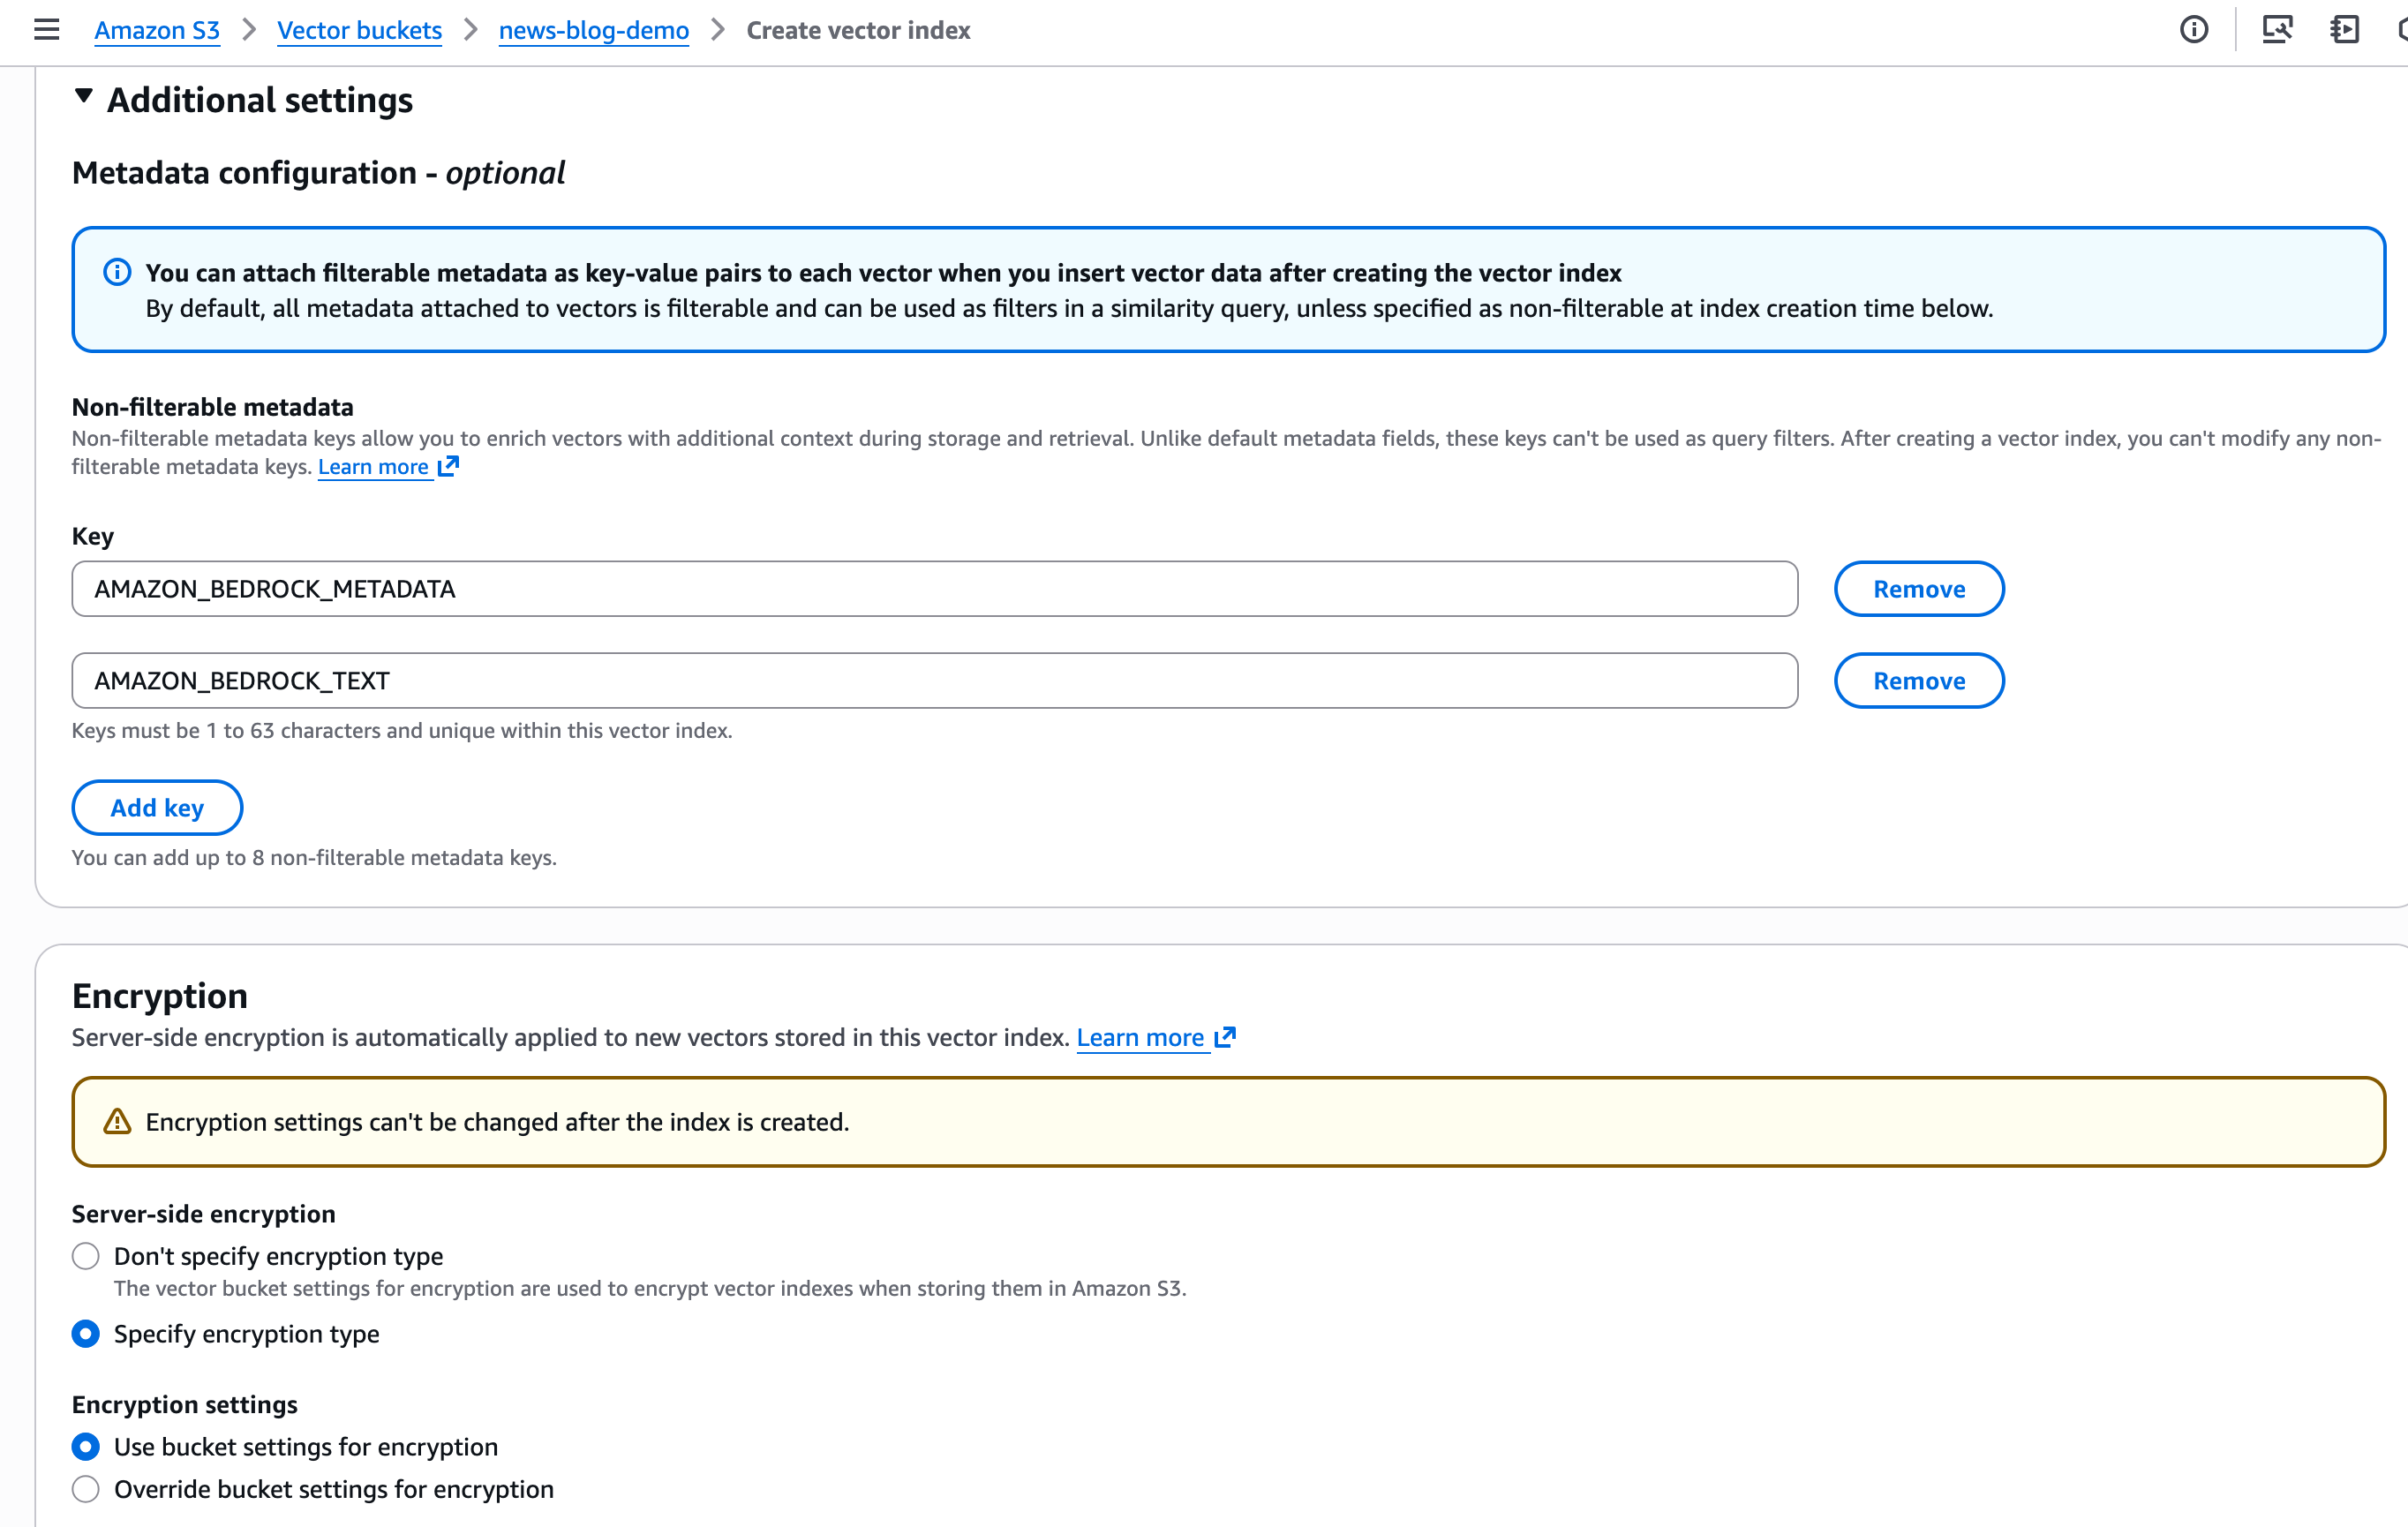
Similarly, I define Non-filterable metadata and I configure Encryption parameters for the vector index.

S3 Vector console - create index

Next, I create and store the embeddings (vectors). For this demo, I ingest my constant companion: the AWS Style Guide. This is an 800-page document that describes how to write posts, technical documentation, and articles at AWS.

I use Amazon Bedrock Knowledge Bases to ingest the PDF document stored on a general purpose S3 bucket. Amazon Bedrock Knowledge Bases reads the document and splits it in pieces called chunks. Then, it computes the embeddings for each chunk with the Amazon Titan Text Embeddings model and it stores the vectors and their metadata on my newly created vector bucket. The detailed steps for that process are out of the scope of this post, but you can read the instructions in the documentation.

When querying vectors, you can store up to 50 metadata keys per vector, with up to 10 marked as non-filterable. You can use the filterable metadata keys to filter query results based on specific attributes. Therefore, you can combine vector similarity search with metadata conditions to narrow down results. You can also store more non-filterable metadata for larger contextual information. Amazon Bedrock Knowledge Bases computes and stores the vectors. It also adds large metadata (the chunk of the original text). I exclude this metadata from the searchable index.

There are other methods to ingest your vectors. You can try the S3 Vectors Embed CLI, a command line tool that helps you generate embeddings using Amazon Bedrock and store them in S3 Vectors through direct commands. You can also use S3 Vectors as a vector storage engine for OpenSearch.

Now I’m ready to query my vector index. Let’s imagine I wonder how to write “open source”. Is it “open-source”, with a hyphen, or “open source” without a hyphen? Should I use uppercase or not? I want to search the relevant sections of the AWS Style Guide relative to “open source.”

# 1. Create embedding request
echo '{"inputText":"Should I write open source or open-source"}' | base64 | tr -d '\n' > body_encoded.txt

# 2. Compute the embeddings with Amazon Titan Embed model
aws bedrock-runtime invoke-model \
  --model-id amazon.titan-embed-text-v2:0 \
  --body "$(cat body_encoded.txt)" \
  embedding.json

# Search the S3 Vectors index for similar chunks
vector_array=$(cat embedding.json | jq '.embedding') && \
aws s3vectors query-vectors \
  --index-arn "$S3_VECTOR_INDEX_ARN" \
  --query-vector "{\"float32\": $vector_array}" \
  --top-k 3 \
  --return-metadata \
  --return-distance | jq -r '.vectors[] | "Distance: \(.distance) | Source: \(.metadata."x-amz-bedrock-kb-source-uri" | split("/")[-1]) | Text: \(.metadata.AMAZON_BEDROCK_TEXT[0:100])..."'

The first result shows this JSON:

        {
            "key": "348e0113-4521-4982-aecd-0ee786fa4d1d",
            "metadata": {
                "x-amz-bedrock-kb-data-source-id": "0SZY6GYPVS",
                "x-amz-bedrock-kb-source-uri": "s3://sst-aws-docs/awsstyleguide.pdf",
                "AMAZON_BEDROCK_METADATA": "{\"createDate\":\"2025-10-21T07:49:38Z\",\"modifiedDate\":\"2025-10-23T17:41:58Z\",\"source\":{\"sourceLocation\":\"s3://sst-aws-docs/awsstyleguide.pdf\"",
                "AMAZON_BEDROCK_TEXT": "[redacted] open source (adj., n.) Two words. Use open source as an adjective (for example, open source software), or as a noun (for example, the code throughout this tutorial is open source). Don't use open-source, opensource, or OpenSource. [redacted]",
                "x-amz-bedrock-kb-document-page-number": 98.0
            },
            "distance": 0.63120436668396
        }

It finds the relevant section in the AWS Style Guide. I must write “open source” without a hyphen. It even retrieved the page number in the original document to help me cross-check the suggestion with the relevant paragraph in the source document.

One more thing
S3 Vectors has also expanded its integration capabilities. You can now use AWS CloudFormation to deploy and manage your vector resources, AWS PrivateLink for private network connectivity, and resource tagging for cost allocation and access control.

Pricing and availability
S3 Vectors is now available in 14 AWS Regions, adding Asia Pacific (Mumbai, Seoul, Singapore, Tokyo), Canada (Central), and Europe (Ireland, London, Paris, Stockholm) to the existing five Regions from preview (US East (Ohio, N. Virginia), US West (Oregon), Asia Pacific (Sydney), and Europe (Frankfurt))

Amazon S3 Vectors pricing is based on three dimensions. PUT pricing is calculated based on the logical GB of vectors you upload, where each vector includes its logical vector data, metadata, and key. Storage costs are determined by the total logical storage across your indexes. Query charges include a per-API charge plus a $/TB charge based on your index size (excluding non-filterable metadata). As your index scales beyond 100,000 vectors, you benefit from lower $/TB pricing. As usual, the Amazon S3 pricing page has the details.

To get started with S3 Vectors, visit the Amazon S3 console. You can create vector indexes, start storing your embeddings, and begin building scalable AI applications. For more information, check out the Amazon S3 User Guide or the AWS CLI Command Reference.

I look forward to seeing what you build with these new capabilities. Please share your feedback through AWS re:Post or your usual AWS Support contacts.

— seb

Amazon Bedrock adds 18 fully managed open weight models, including the new Mistral Large 3 and Ministral 3 models

Post Syndicated from Channy Yun (윤석찬) original https://aws.amazon.com/blogs/aws/amazon-bedrock-adds-fully-managed-open-weight-models/

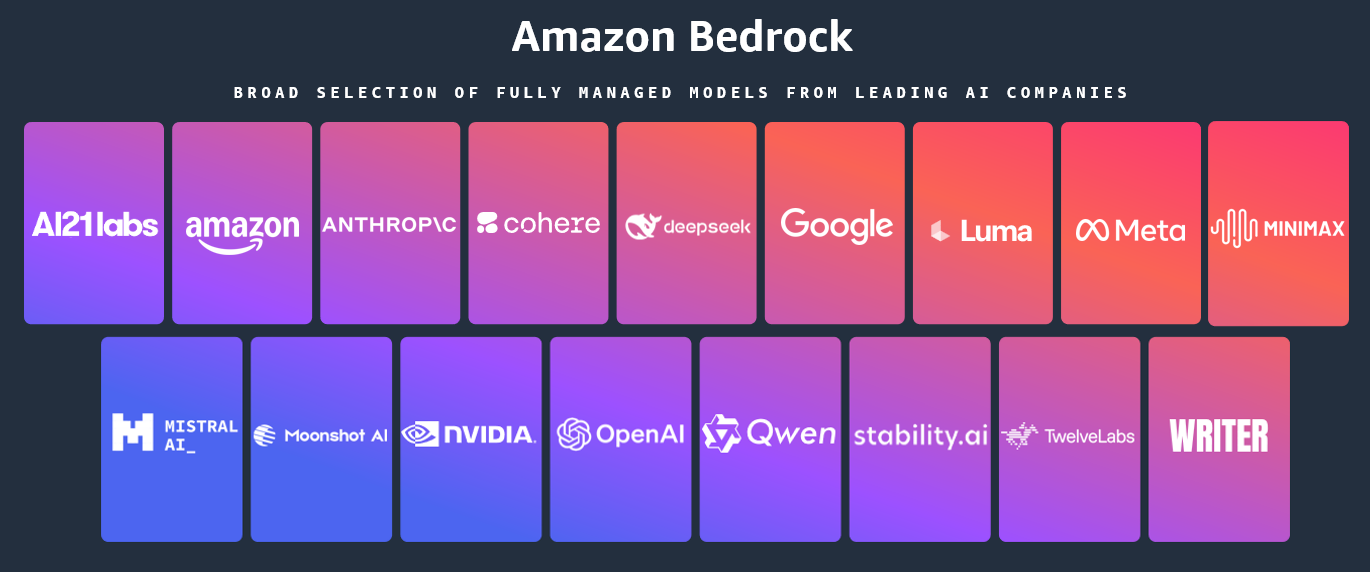
Today, we’re announcing the general availability of an additional 18 fully managed open weight models in Amazon Bedrock from Google, Moonshot AI, MiniMax AI, Mistral AI, NVIDIA, OpenAI, and Qwen, including the new Mistral Large 3 and Ministral 3 3B, 8B, and 14B models.

With this launch, Amazon Bedrock now provides nearly 100 serverless models, offering a broad and deep range of models from leading AI companies, so customers can choose the precise capabilities that best serve their unique needs. By closely monitoring both customer needs and technological advancements, we regularly expand our curated selection of models based on customer needs and technological advancements to include promising new models alongside established industry favorites.

This ongoing expansion of high-performing and differentiated model offerings helps customers stay at the forefront of AI innovation. You can access these models on Amazon Bedrock through the unified API, evaluate, switch, and adopt new models without rewriting applications or changing infrastructure.

New Mistral AI models
These four Mistral AI models are now available first on Amazon Bedrock, each optimized for different performance and cost requirements:

  • Mistral Large 3 – This open weight model is optimized for long-context, multimodal, and instruction reliability. It excels in long document understanding, agentic and tool use workflows, enterprise knowledge work, coding assistance, advanced workloads such as math and coding tasks, multilingual analysis and processing, and multimodal reasoning with vision.
  • Ministral 3 3B – The smallest in the Ministral 3 family is edge-optimized for single GPU deployment with strong language and vision capabilities. It shows robust performance in image captioning, text classification, real-time translation, data extraction, short content generation, and lightweight real-time applications on edge or low-resource devices.
  • Ministral 3 8B – The best-in-class Ministral 3 model for text and vision is edge-optimized for single GPU deployment with high performance and minimal footprint. This model is ideal for chat interfaces in constrained environments, image and document description and understanding, specialized agentic use cases, and balanced performance for local or embedded systems.
  • Ministral 3 14B – The most capable Ministral 3 model delivers state-of the-art text and vision performance optimized for single GPU deployment. You can use advanced local agentic use cases and private AI deployments where advanced capabilities meet practical hardware constraints.

More open weight model options
You can use these open weight models for a wide range of use cases across industries:

Model provider Model name Description Use cases
Google Gemma 3 4B Efficient text and image model that runs locally on laptops. Multilingual support for on-device AI applications. On-device AI for mobile and edge applications, privacy-sensitive local inference, multilingual chat assistants, image captioning and description, and lightweight content generation.
Gemma 3 12B Balanced text and image model for workstations. Multi-language understanding with local deployment for privacy-sensitive applications. Workstation-based AI applications; local deployment for enterprises; multilingual document processing, image analysis and Q&A; and privacy-compliant AI assistants.
Gemma 3 27B Powerful text and image model for enterprise applications. Multi-language support with local deployment for privacy and control. Enterprise local deployment, high-performance multimodal applications, advanced image understanding, multilingual customer service, and data-sensitive AI workflows.
Moonshot AI Kimi K2 Thinking Deep reasoning model that thinks while using tools. Handles research, coding and complex workflows requiring hundreds of sequential actions. Complex coding projects requiring planning, multistep workflows, data analysis and computation, and long-form content creation with research.
MiniMax AI MiniMax M2 Built for coding agents and automation. Excels at multi-file edits, terminal operations and executing long tool-calling chains efficiently. Coding agents and integrated development environment (IDE) integration, multi-file code editing, terminal automation and DevOps, long-chain tool orchestration, and agentic software development.
Mistral AI Magistral Small 1.2 Excels at math, coding, multilingual tasks, and multimodal reasoning with vision capabilities for efficient local deployment. Math and coding tasks, multilingual analysis and processing, and multimodal reasoning with vision.
Voxtral Mini 1.0 Advanced audio understanding model with transcription, multilingual support, Q&A, summarization, and function-calling. Voice-controlled applications, fast speech-to-text conversion, and offline voice assistants.
Voxtral Small 1.0 Features state-of-the-art audio input with best-in-class text performance; excels at speech transcription, translation, and understanding. Enterprise speech transcription, multilingual customer service, and audio content summarization.
NVIDIA NVIDIA Nemotron Nano 2 9B High efficiency LLM with hybrid transformer Mamba design, excelling in reasoning and agentic tasks. Reasoning, tool calling, math, coding, and instruction following.
NVIDIA Nemotron Nano 2 VL 12B Advanced multimodal reasoning model for video understanding and document intelligence, powering Retrieval-Augmented Generation (RAG) and multimodal agentic applications. Multi-image and video understanding, visual Q&A, and summarization.
OpenAI gpt-oss-safeguard-20b Content safety model that applies your custom policies. Classifies harmful content with explanations for trust and safety workflows. Content moderation and safety classification, custom policy enforcement, user-generated content filtering, trust and safety workflows, and automated content triage.
gpt-oss-safeguard-120b Larger content safety model for complex moderation. Applies custom policies with detailed reasoning for enterprise trust and safety teams. Enterprise content moderation at scale, complex policy interpretation, multilayered safety classification, regulatory compliance checking, high-stakes content review.
Qwen Qwen3-Next-80B-A3B Fast inference with hybrid attention for ultra-long documents. Optimized for RAG pipelines, tool use & agentic workflows with quick responses. RAG pipelines with long documents, agentic workflows with tool calling, code generation and software development, multi-turn conversations with extended context, multilingual content generation.
Qwen3-VL-235B-A22B Understands images and video. Extracts text from documents, converts screenshots to working code, and automates clicking through interfaces. Extracting text from images and PDFs, converting UI designs or screenshots to working code, automating clicks and navigation in applications, video analysis and understanding, reading charts and diagrams.

When implementing publicly available models, give careful consideration to data privacy requirements in your production environments, check for bias in output, and monitor your results for data security, responsible AI, and model evaluation.

You can access the enterprise-grade security features of Amazon Bedrock and implement safeguards customized to your application requirements and responsible AI policies with Amazon Bedrock Guardrails. You can also evaluate and compare models to identify the optimal models for your use cases by using Amazon Bedrock model evaluation tools.

To get started, you can quickly test these models with a few prompts in the playground of the Amazon Bedrock console or use any AWS SDKs to include access to the Bedrock InvokeModel and Converse APIs. You can also use these models with any agentic framework that supports Amazon Bedrock and deploy the agents using Amazon Bedrock AgentCore and Strands Agents. To learn more, visit Code examples for Amazon Bedrock using AWS SDKs in the Amazon Bedrock User Guide.

Now available
Check the full Region list for availability and future updates of new models or search your model name in the AWS CloudFormation resources tab of AWS Capabilities by Region. To learn more, check out the Amazon Bedrock product page and the Amazon Bedrock pricing page.

Give these models a try in the Amazon Bedrock console today and send feedback to AWS re:Post for Amazon Bedrock or through your usual AWS Support contacts.

— Channy

Introducing Amazon EC2 X8aedz instances powered by 5th Gen AMD EPYC processors for memory-intensive workloads

Post Syndicated from Channy Yun (윤석찬) original https://aws.amazon.com/blogs/aws/introducing-amazon-ec2-x8aedz-instances-powered-by-5th-gen-amd-epyc-processors-for-memory-intensive-workloads/

Today, we’re announcing the availability of new memory-optimized, high-frequency Amazon Elastic Compute Cloud (Amazon EC2) X8aedz instances powered by a 5th Gen AMD EPYC processor. These instances offer the highest CPU frequency, 5GHz in the cloud. They deliver up to two times higher compute performance and 31% price-performance compared to previous generation X2iezn instances.

X8aedz instances are ideal for electronic design automation (EDA) workloads, such as physical layout and physical verification jobs, and relational databases that benefit from high single-threaded processor performance and a large memory footprint. The combination of 5 GHz processors and local NVMe storage enables faster processing of memory-intensive backend EDA workloads such as floor planning, logic placement, clock tree synthesis (CTS), routing, and power/signal integrity analysis. The high memory-to-vCPU ratio of 32:1 makes these instances particularly effective for applications with vCPU-based licensing models.

Let me explain the instance type naming: The “a” suffix indicates an AMD processor, “e” denotes extended memory in the memory-optimized instance family, “d” represents local NVMe-based SSDs physically connected to the host server, and “z” indicates high-frequency processors.

X8aedz instances
X8aedz instances are available in eight sizes ranging from 2–96 vCPUs with 64–3,072 GiB of memory, including two bare metal sizes. X8aedz instances feature up to 75 Gbps of network bandwidth with support for the Elastic Fabric Adapter (EFA), up to 60 Gbps of throughput to the Amazon Elastic Block Store (Amazon EBS), and up to 8 TB of local NVMe SSD storage.

Here are the specs for X8aedz instances:

Instance name vCPUs Memory
(GiB)
NVMe SSD storage (GB) Network bandwidth (Gbps) EBS bandwidth (Gbps)
x8aedz.large 2 64 158 Up to 18.75 Up to 15
x8aedz.xlarge 4 128 316 Up to 18.75 Up to 15
x8aedz.3xlarge 12 384 950 Up to 18.75 Up to 15
x8aedz.6xlarge 24 768 1,900 18.75 15
x8aedz.12xlarge 48 1,536 3,800 37.5 30
x8aedz.24xlarge 96 3,072 7,600 75 60
x8aedz.metal-12xl 48 1,536 3,800 37.5 30
x8aedz.metal-24xl 96 3,072 7,600 75 60

With the 60 Gbps Amazon EBS bandwidth and up to 8 TB of local NVMe SSD storage, you can achieve faster database response times and reduced latency for EDA operations, ultimately accelerating time-to-market for chip designs. These instances also support the instance bandwidth configuration feature that offers flexibility in allocating resources between network and EBS bandwidth. You can scale network or EBS bandwidth by 25% and improve database (read and write) performance, query processing, and logging speeds.

X8aedz instances use sixth-generation AWS Nitro cards, which offload CPU virtualization, storage, and networking functions to dedicated hardware and software, enhancing performance and security for your workloads.

Now available
Amazon EC2 X8aedz instances are now available in US West (Oregon) and Asia Pacific (Tokyo) AWS Regions, and additional Regions will be coming soon. For Regional availability and future roadmap, search the instance type in the AWS CloudFormation resources tab of the AWS Capabilities by Region.

You can purchase these instances as On-Demand, Savings Plan, Spot Instances, and Dedicated Instances. To learn more, visit the Amazon EC2 Pricing page.

Give X8aedz instances a try in the Amazon EC2 console. To learn more, visit the Amazon EC2 X8aedz instances page and send feedback to AWS re:Post for EC2 or through your usual AWS Support contacts.

— Channy

AWS DevOps Agent helps you accelerate incident response and improve system reliability (preview)

Post Syndicated from Sébastien Stormacq original https://aws.amazon.com/blogs/aws/aws-devops-agent-helps-you-accelerate-incident-response-and-improve-system-reliability-preview/

Today, we’re announcing the public preview of AWS DevOps Agent, a frontier agent that helps you respond to incidents, identify root causes, and prevent future issues through systematic analysis of past incidents and operational patterns.

Frontier agents represent a new class of AI agents that are autonomous, massively scalable, and work for hours or days without constant intervention.

When production incidents occur, on-call engineers face significant pressure to quickly identify root causes while managing stakeholder communications. They must analyze data across multiple monitoring tools, review recent deployments, and coordinate response teams. After service restoration, teams often lack bandwidth to transform incident learnings into systematic improvements.

AWS DevOps Agent is your always-on, autonomous on-call engineer. When issues arise, it automatically correlates data across your operational toolchain, from metrics and logs to recent code deployments in GitHub or GitLab. It identifies probable root causes and recommends targeted mitigations, helping reduce mean time to resolution. The agent also manages incident coordination, using Slack channels for stakeholder updates and maintaining detailed investigation timelines.

To get started, you connect AWS DevOps Agent to your existing tools through the AWS Management Console. The agent works with popular services such as Amazon CloudWatch, Datadog, Dynatrace, New Relic, and Splunk for observability data, while integrating with GitHub Actions and GitLab CI/CD to track deployments and their impact on your cloud resources. Through the bring your own (BYO) Model Context Protocol (MCP) server capability, you can also integrate additional tools such as your organization’s custom tools, specialized platforms or open source observability solutions, such as Grafana and Prometheus into your investigations.

The agent acts as a virtual team member and can be configured to automatically respond to incidents from your ticketing systems. It includes built-in support for ServiceNow, and through configurable webhooks, can respond to events from other incident management tools like PagerDuty. As investigations progress, the agent updates tickets and relevant Slack channels with its findings. All of this is powered by an intelligent application topology the agent builds—a comprehensive map of your system components and their interactions, including deployment history that helps identify potential deployment-related causes during investigations.

Let me show you how it works
To show you how it works, I deployed a straigthforward AWS Lambda function that intentionally generates errors when invoked. I deployed it in an AWS CloudFormation stack.

Step 1: Create an Agent Space

An Agent Space defines the scope of what AWS DevOps Agent can access as it performs tasks.

You can organize Agent Spaces based on your operational model. Some teams align an Agent Space with a single application, others create one per on-call team managing multiple services, and some organizations use a centralized approach. For this demonstration, I’ll show you how to create an Agent Space for a single application. This setup helps isolate investigations and resources for that specific application, making it easier to track and analyze incidents within its context.

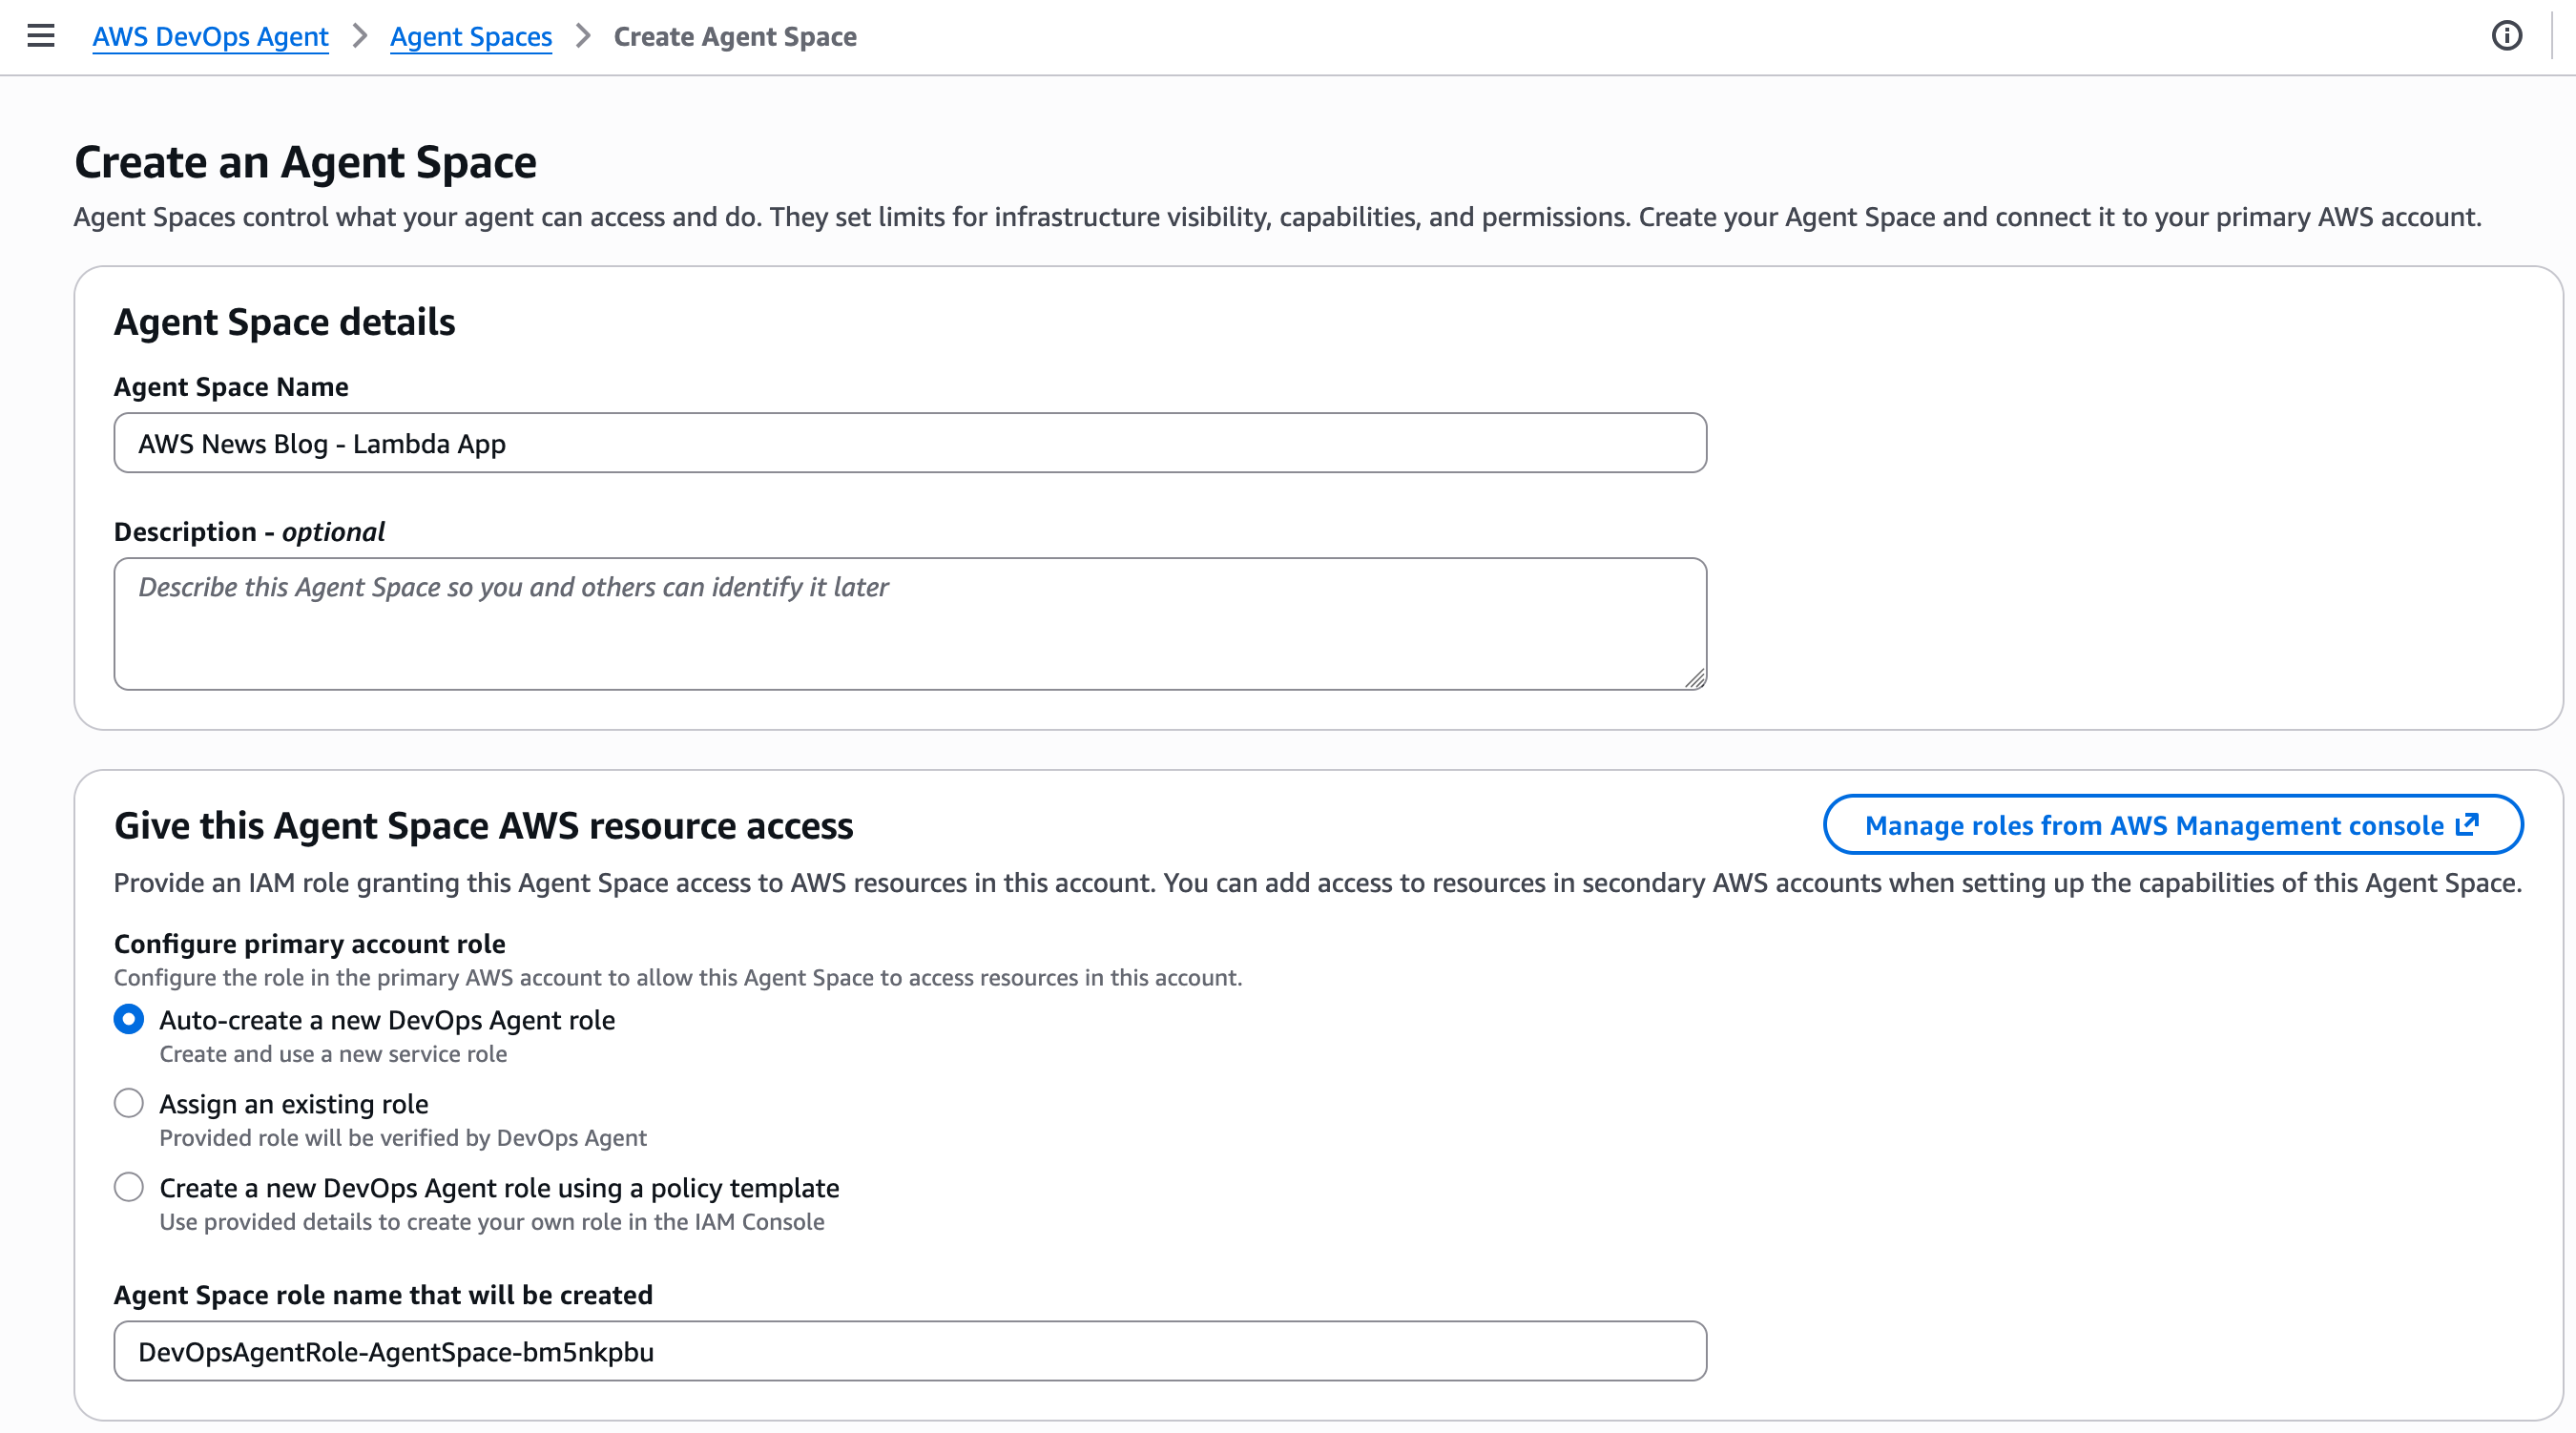
In the AWS DevOps Agent section of the AWS Management Console, I select Create Agent Space, enter a name for this space and create the AWS Identity and Access Management (IAM) roles it uses to introspect AWS resources in my or others’ AWS accounts.

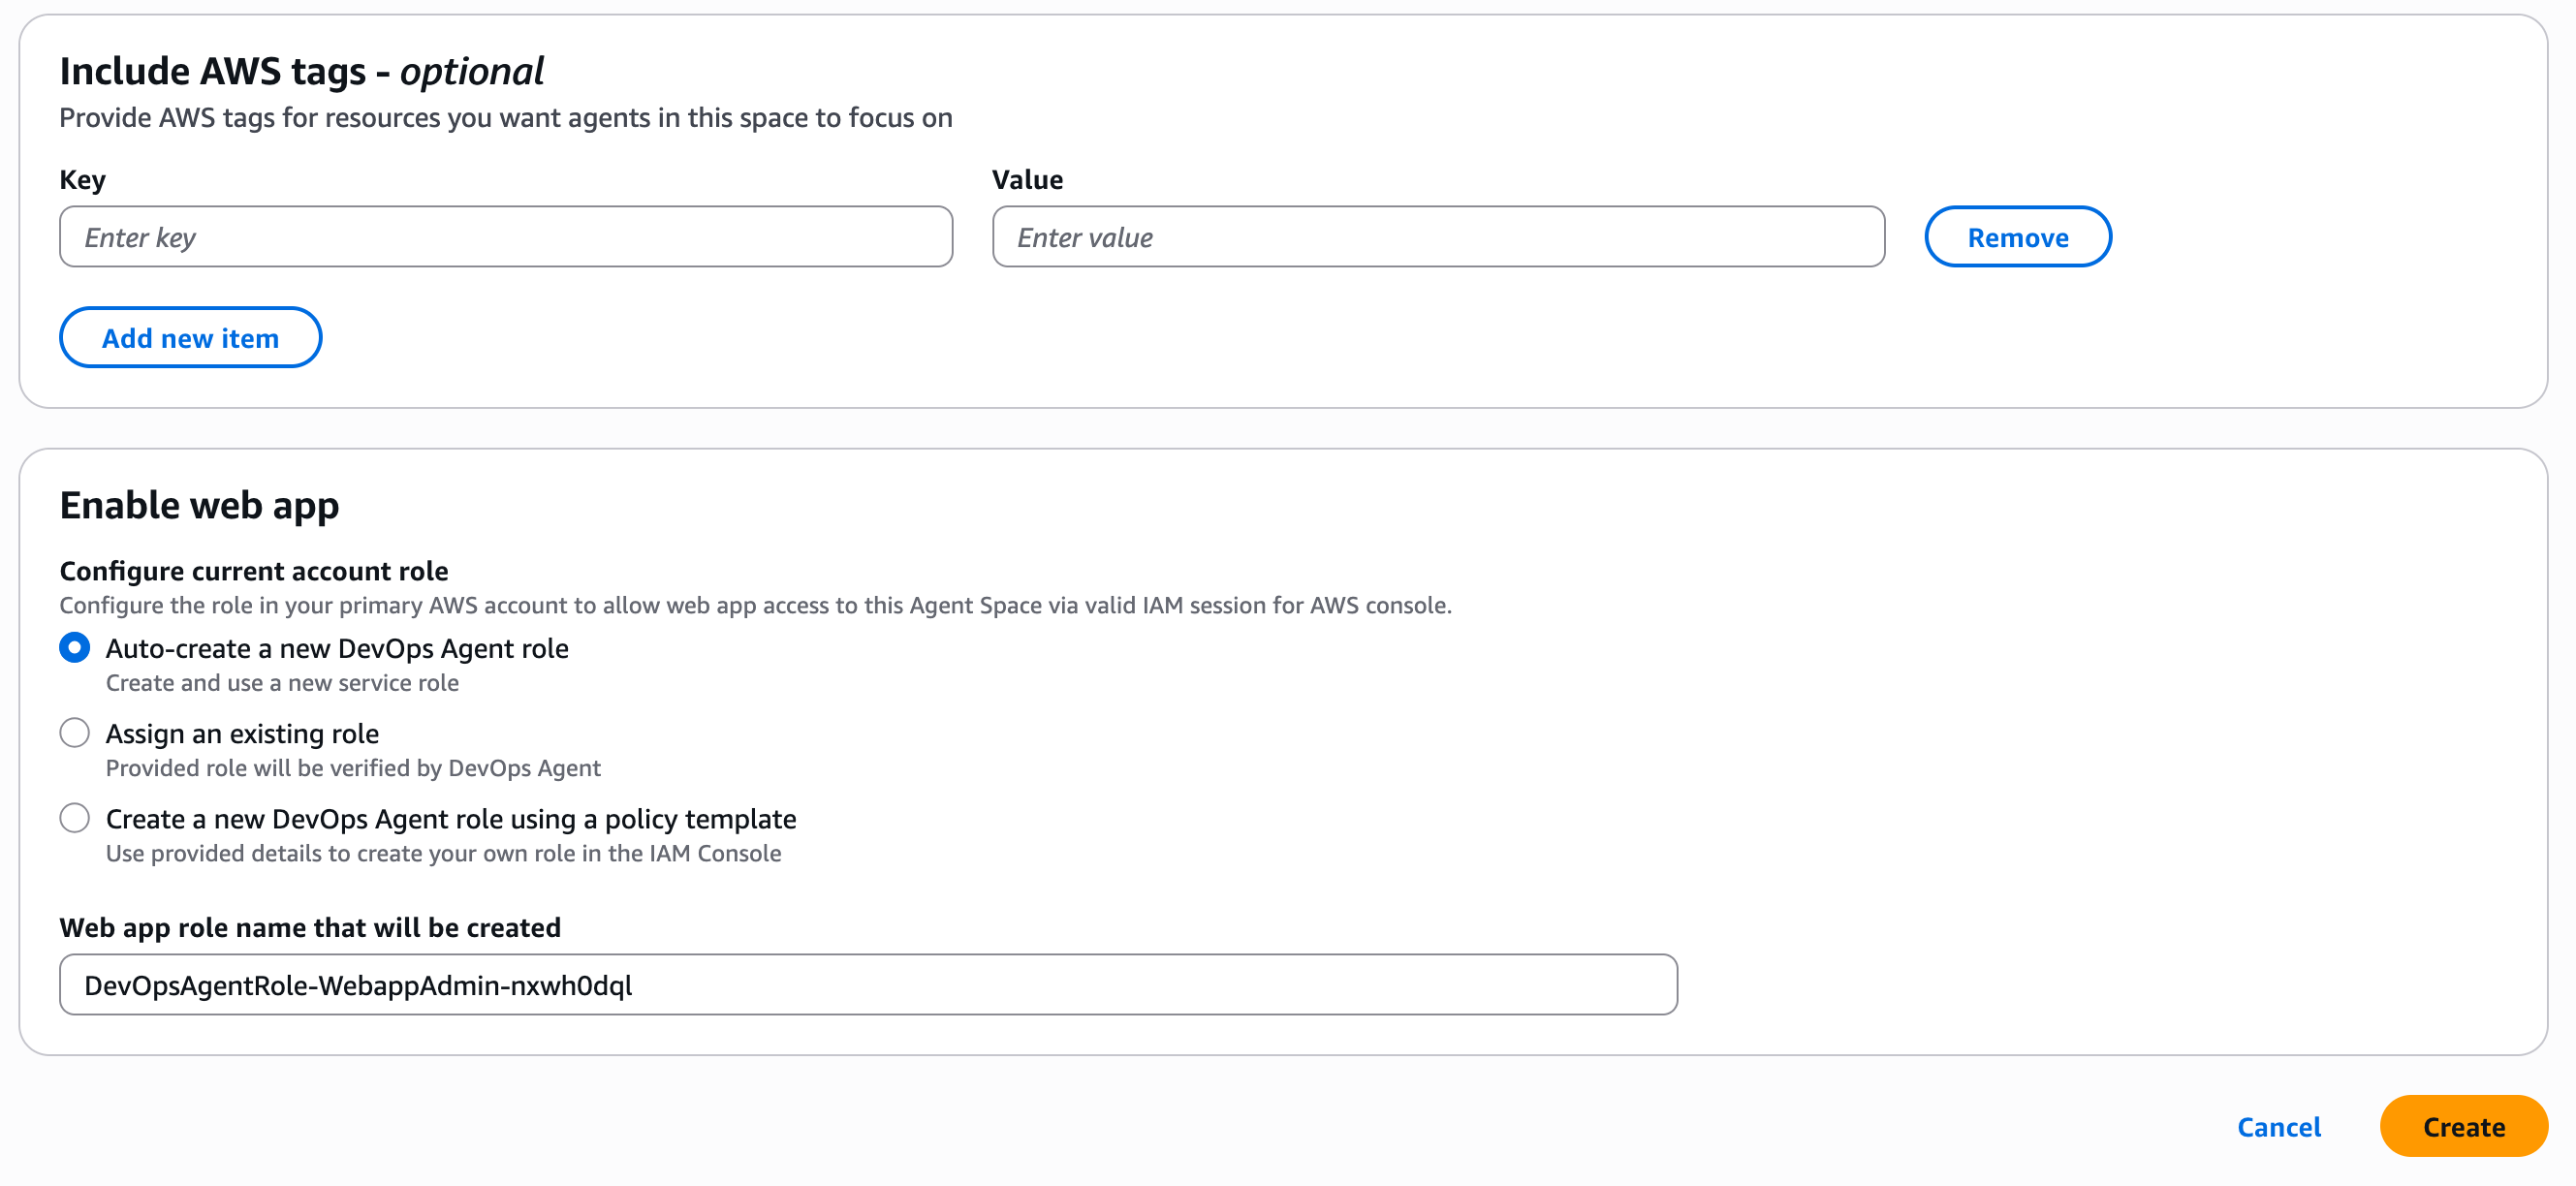
AWS DevOps Agent - Create an Agent SpaceFor this demo, I choose to enable the AWS DevOps Agent web app; more about this later. This can be done at a later stage.

When ready, I choose Create.

AWS DevOps Agent - Enable Web AppAfter it has been created, I choose the Topology tab.

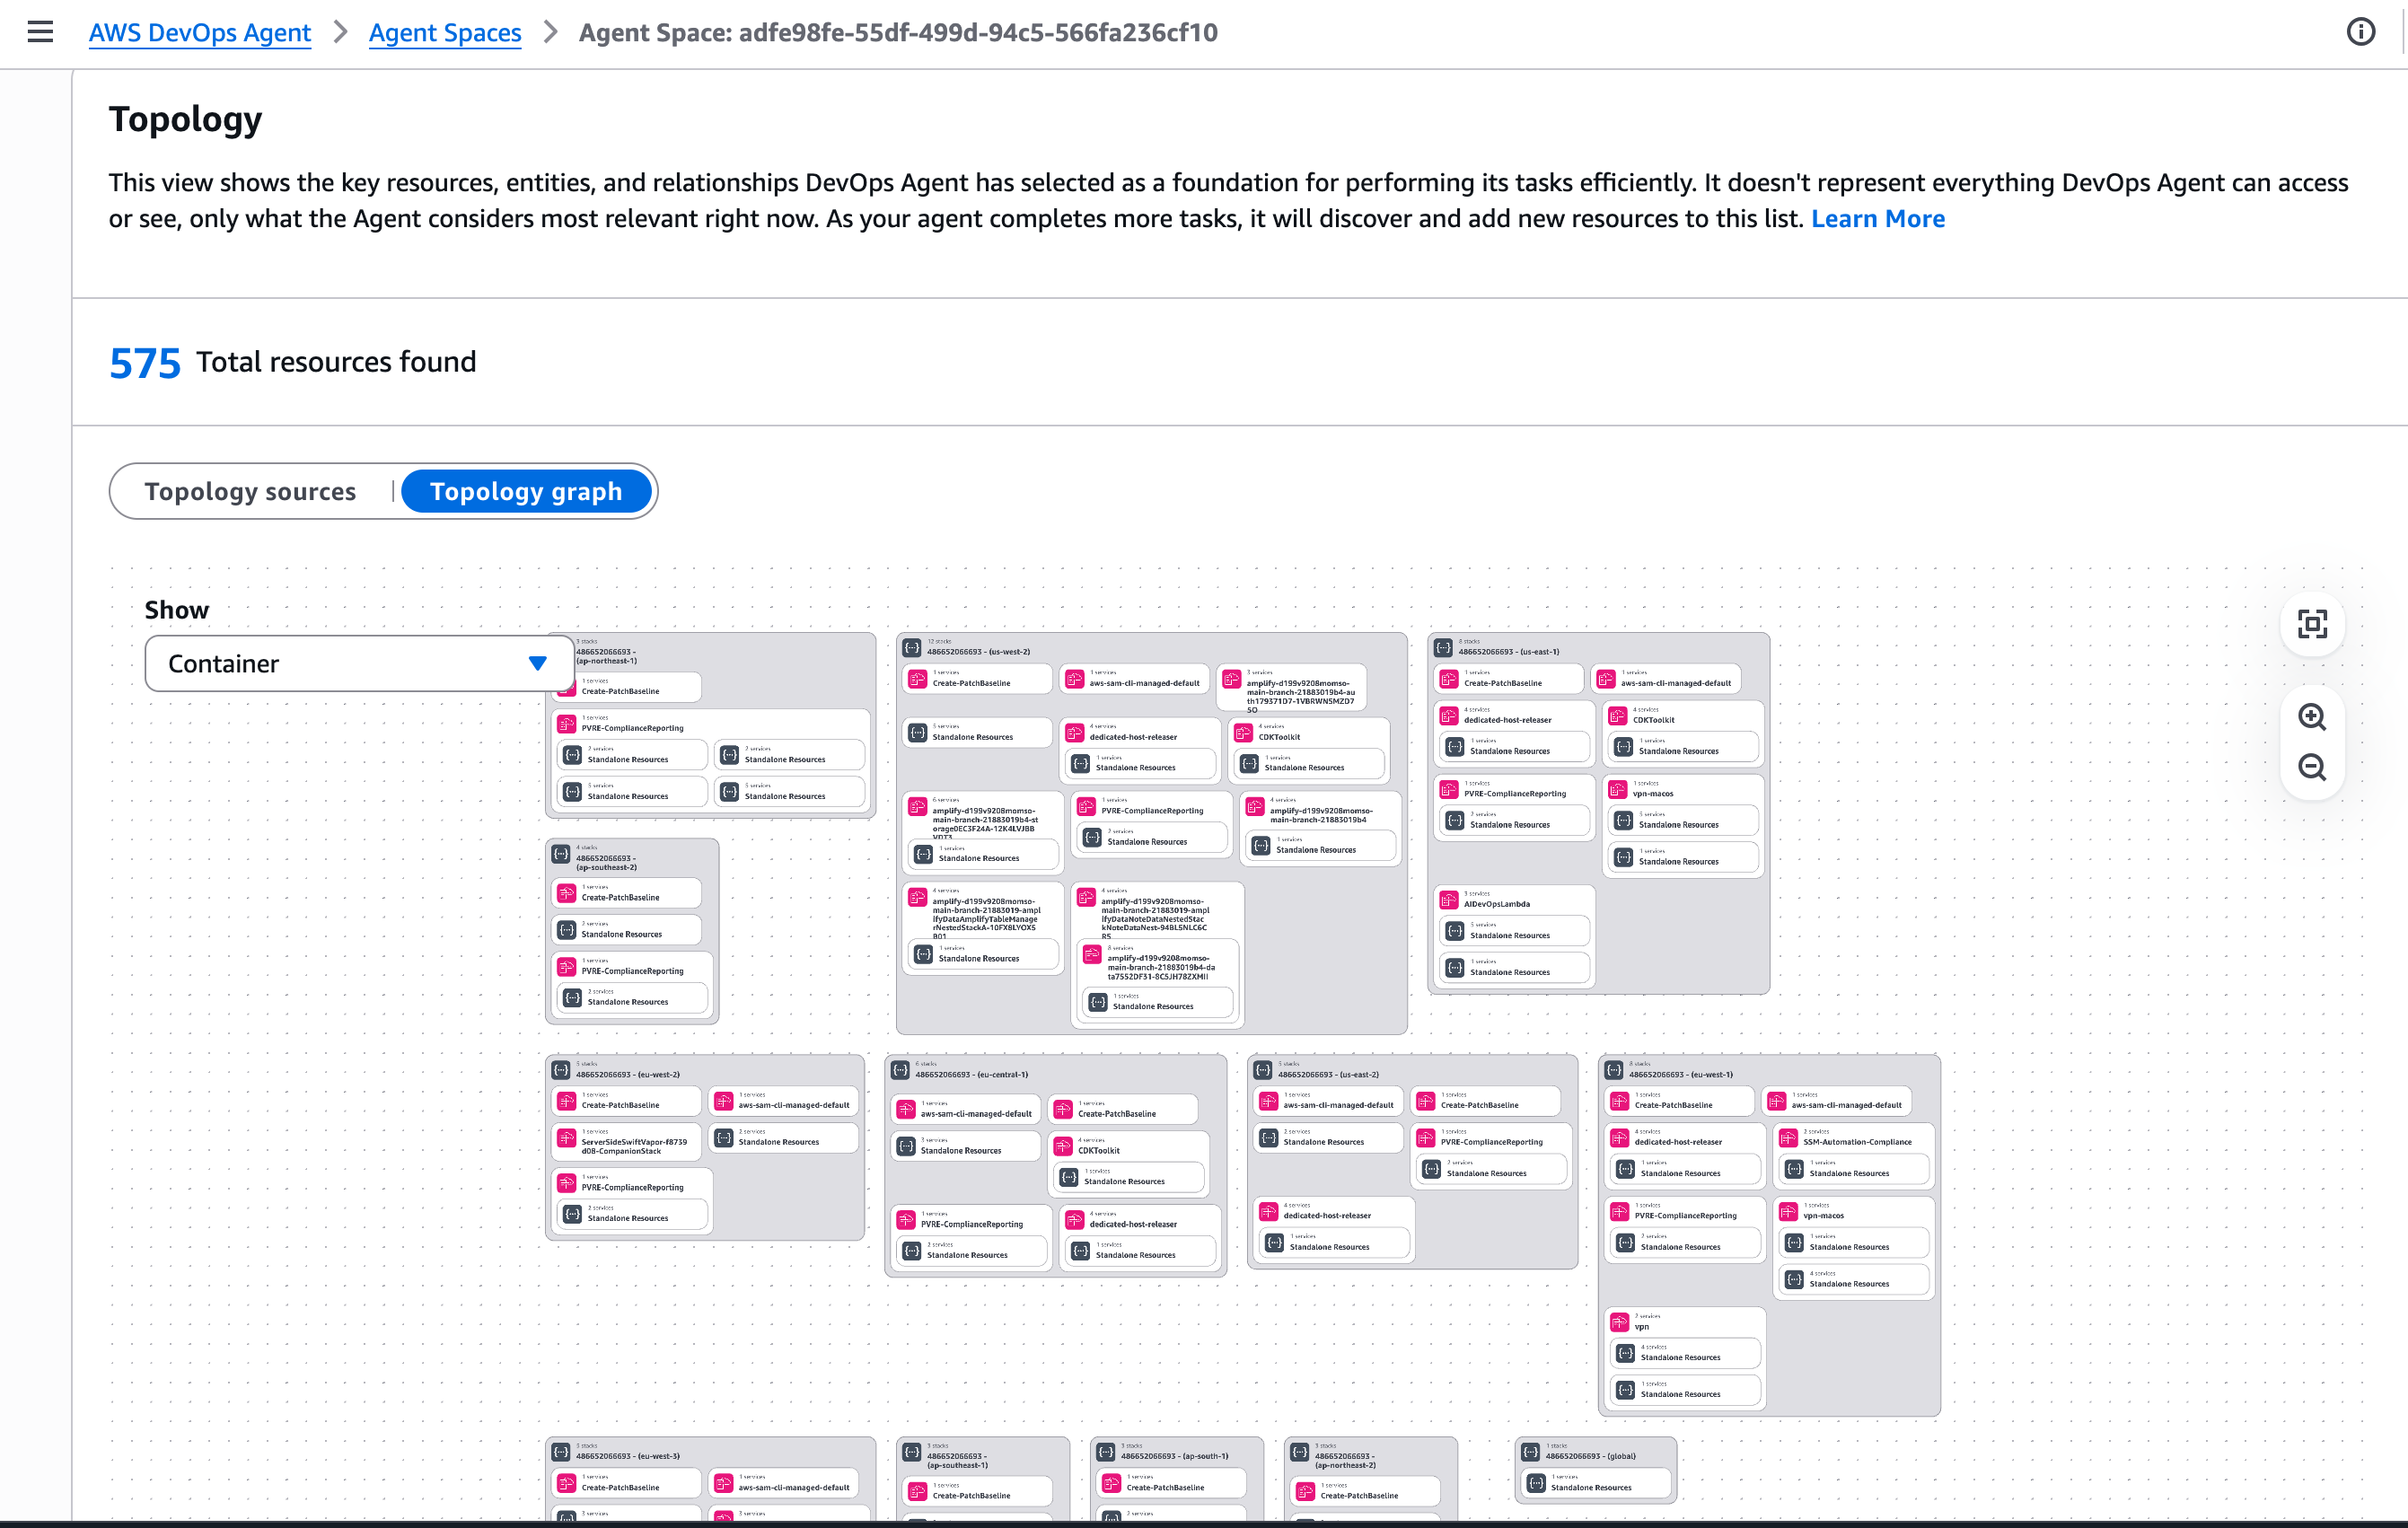
This view shows the key resources, entities, and relationships AWS DevOps Agent has selected as a foundation for performing its tasks efficiently. It doesn’t represent everything AWS DevOps Agent can access or see, only what the Agent considers most relevant right now. By default, the Topology includes the AWS resources that are contained in my account. As your agent completes more tasks, it will discover and add new resources to this list.

AWS DevOps Agent - Topology

Step 2: Configure the AWS DevOps web app for the operators

The AWS DevOps Agent web app provides a web interface for on-call engineers to manually trigger investigations, view investigation details including relevant topology elements, steer investigations, and ask questions about an investigation.

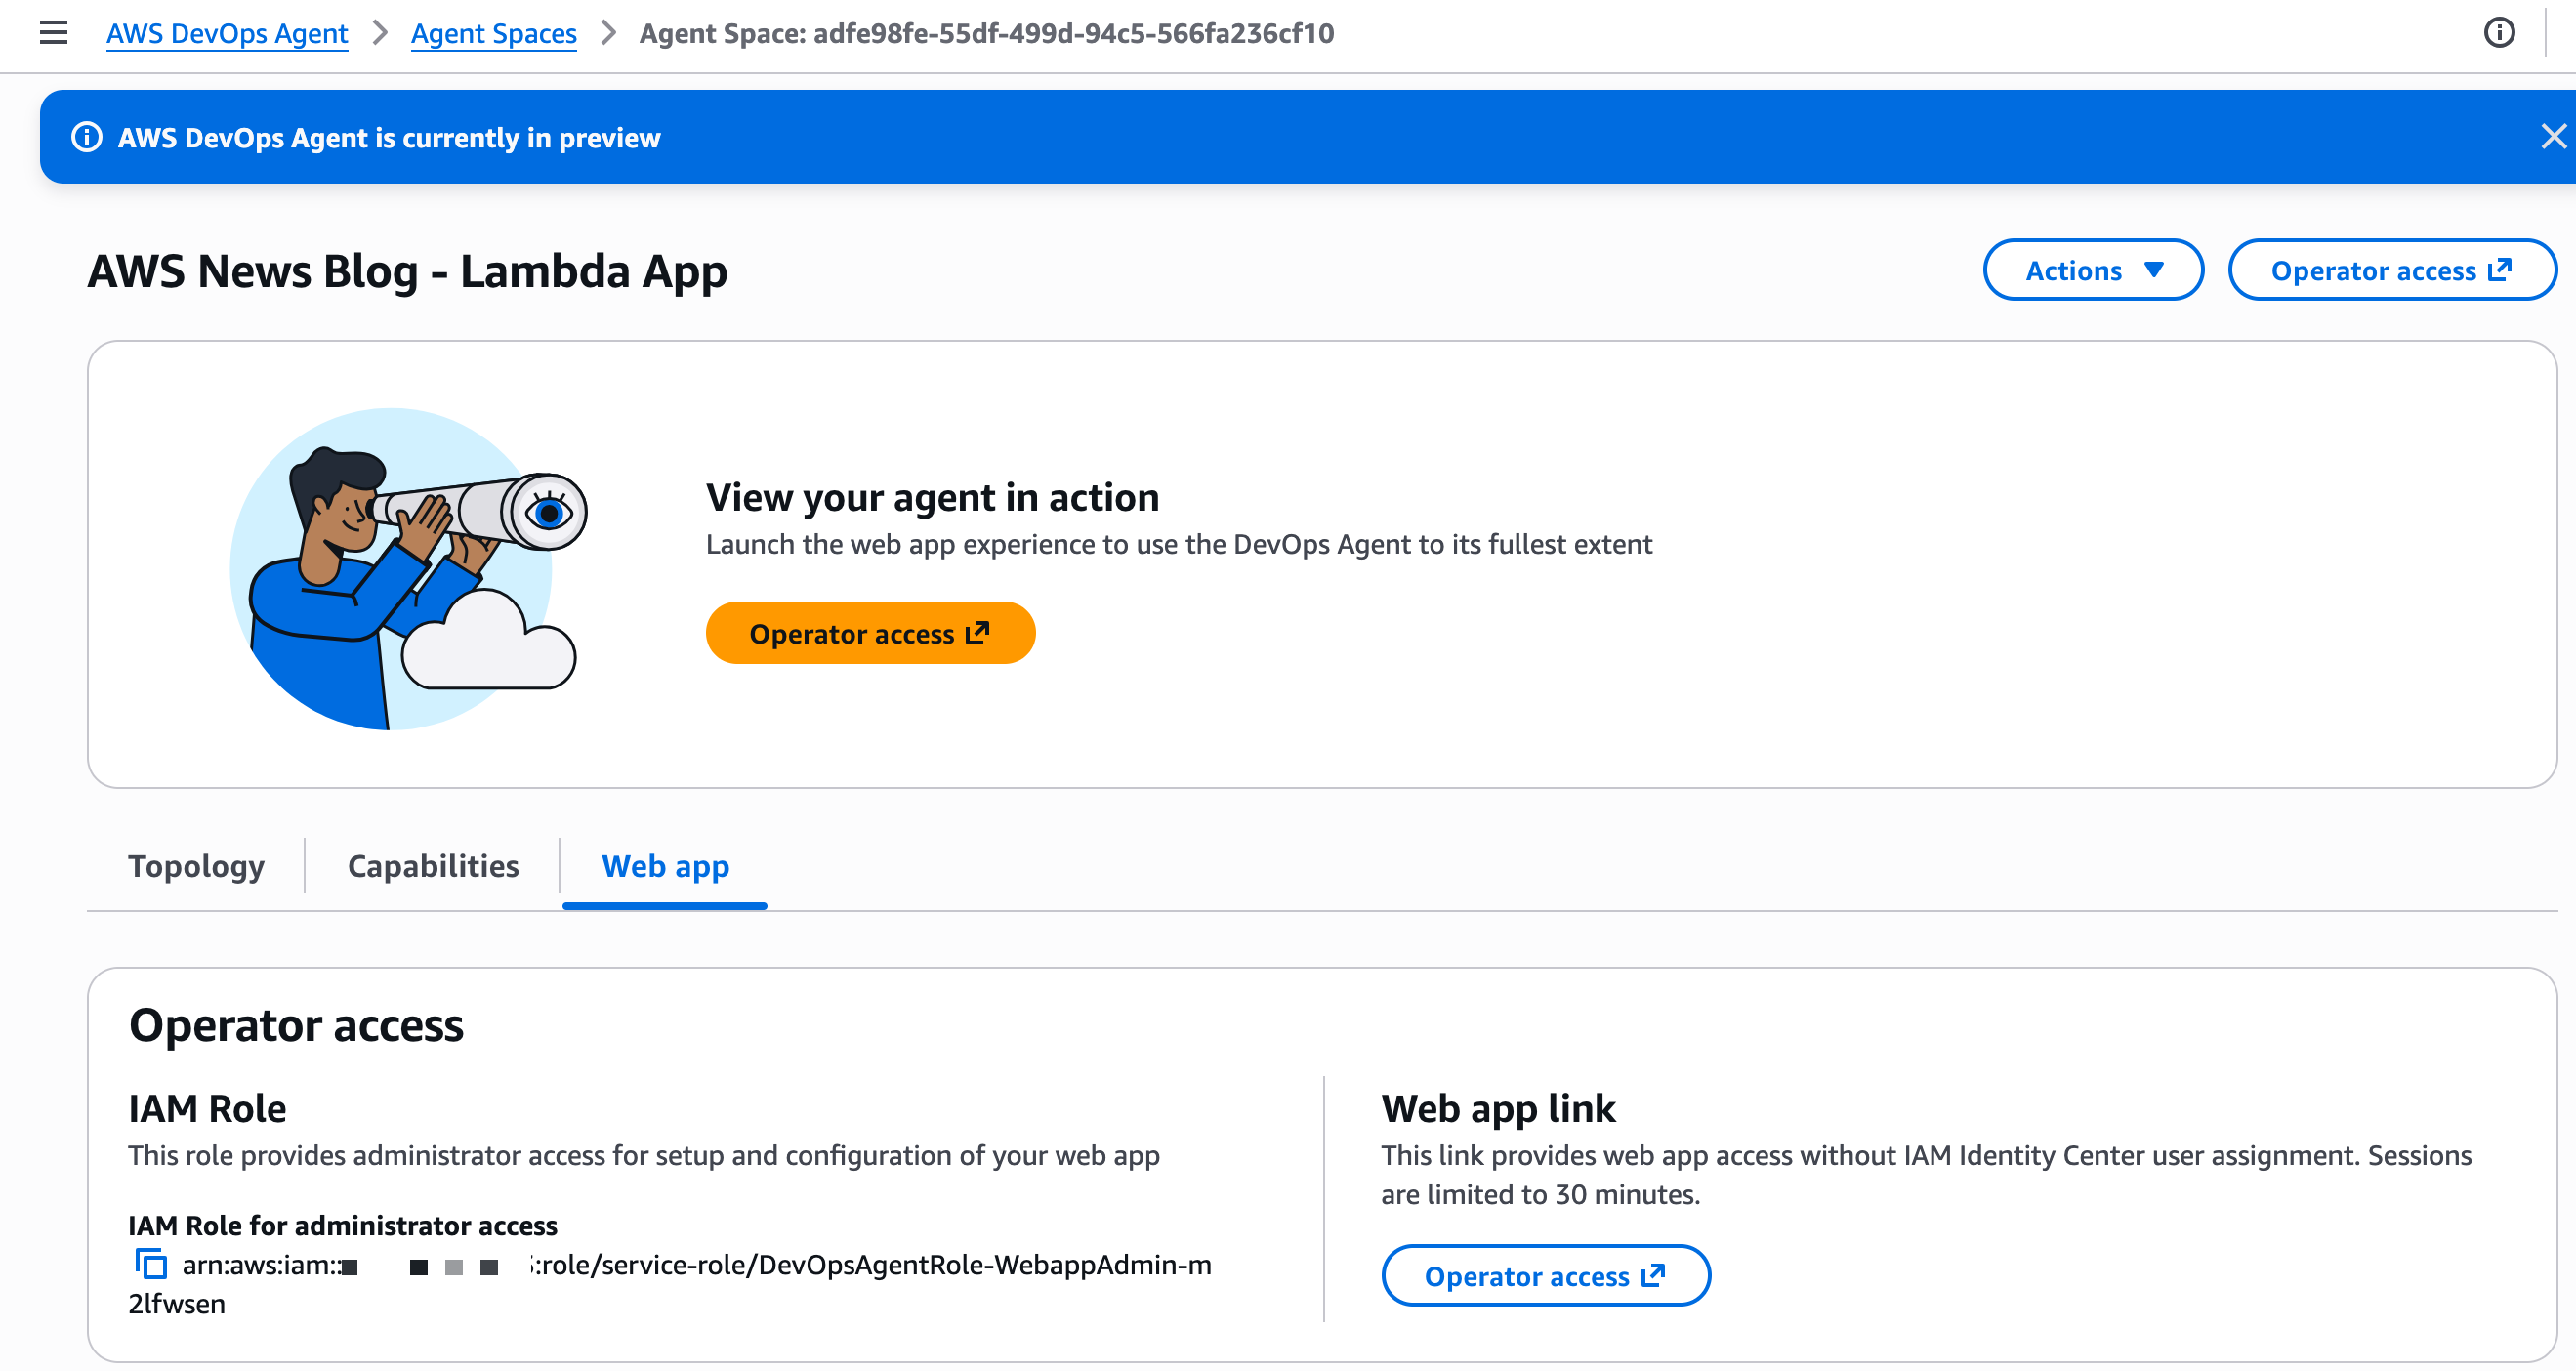
I can access the web app directly from my Agent Space in the AWS console by choosing the Operator access link. Alternatively, I can use AWS IAM Identity Center to configure user access for my team. IAM Identity Center lets me manage users and groups directly or connect to an identity provider (IdP), providing a centralized way to control who can access the AWS DevOps Agent web app.

AWS DevOps Agent - web app access

At this stage, I have an Agent Space all set up to focus investigations and resources for this specific application, and I’ve enabled the DevOps team to initiate investigations using the web app.

Now that the one-time setup for this application is done, I start invoking the faulty Lambda function. It generates errors at each invocation. The CloudWatch alarm associated with the Lambda errors count turns on to ALARM state. In real life, you might receive an alert from external services, such as ServiceNow. You can configure AWS DevOps Agent to automatically start investigations when receiving such alerts.

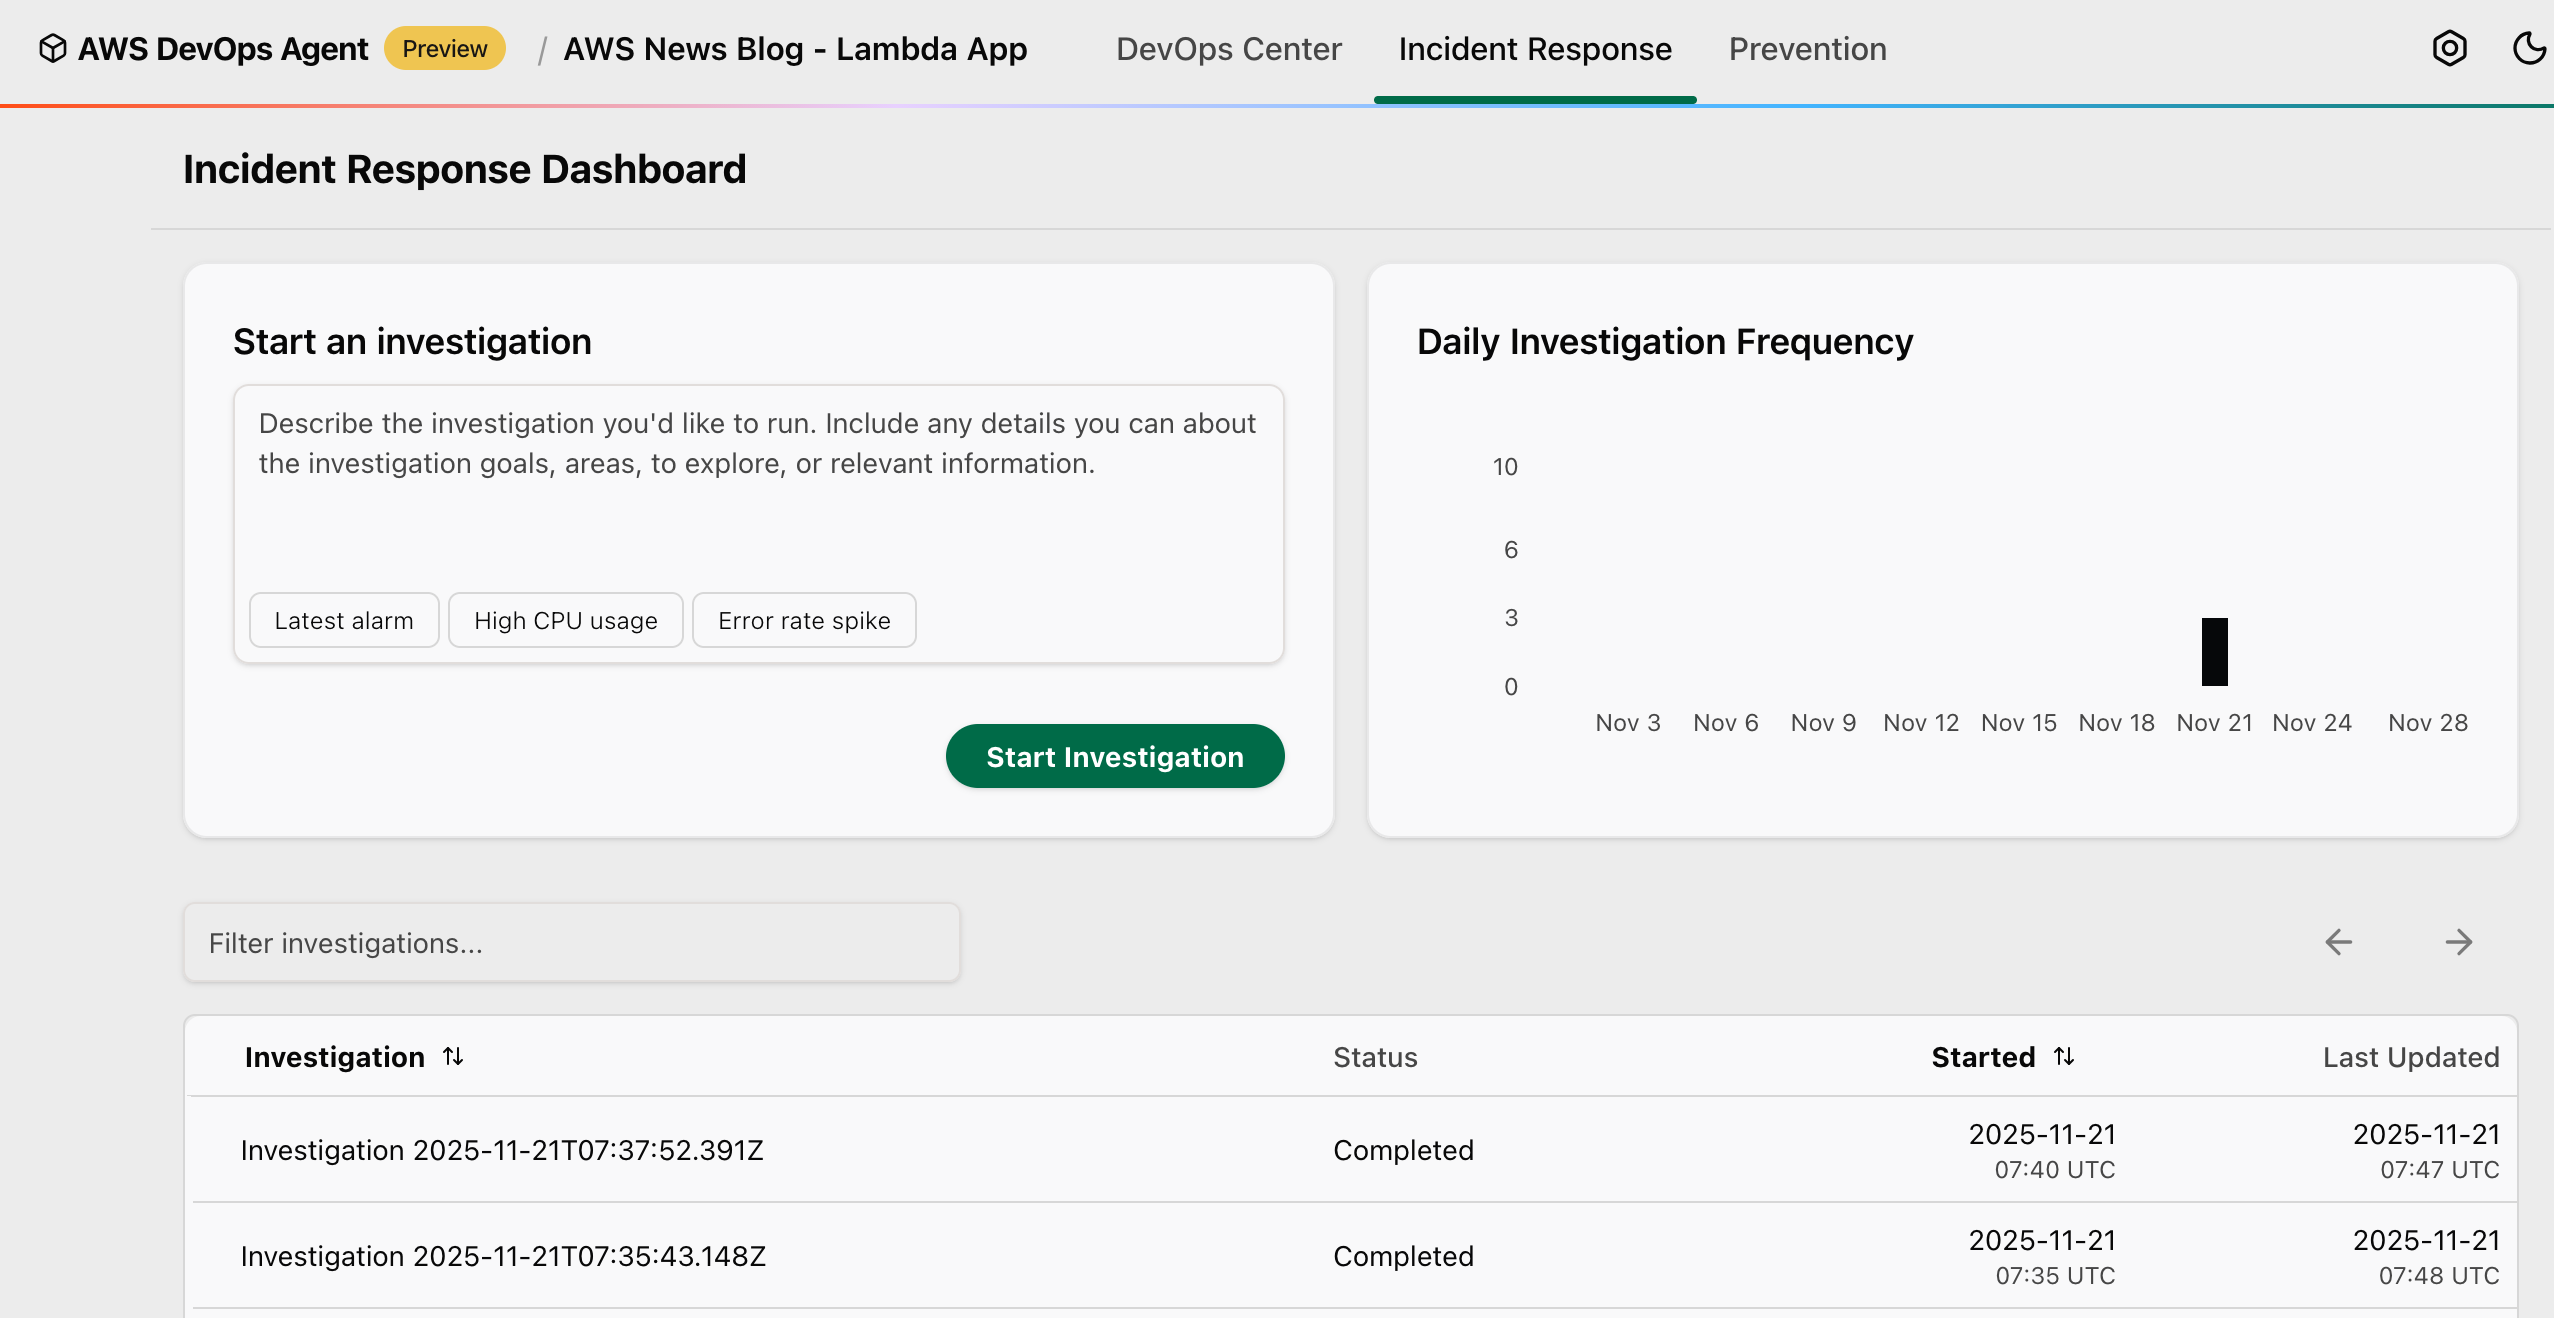
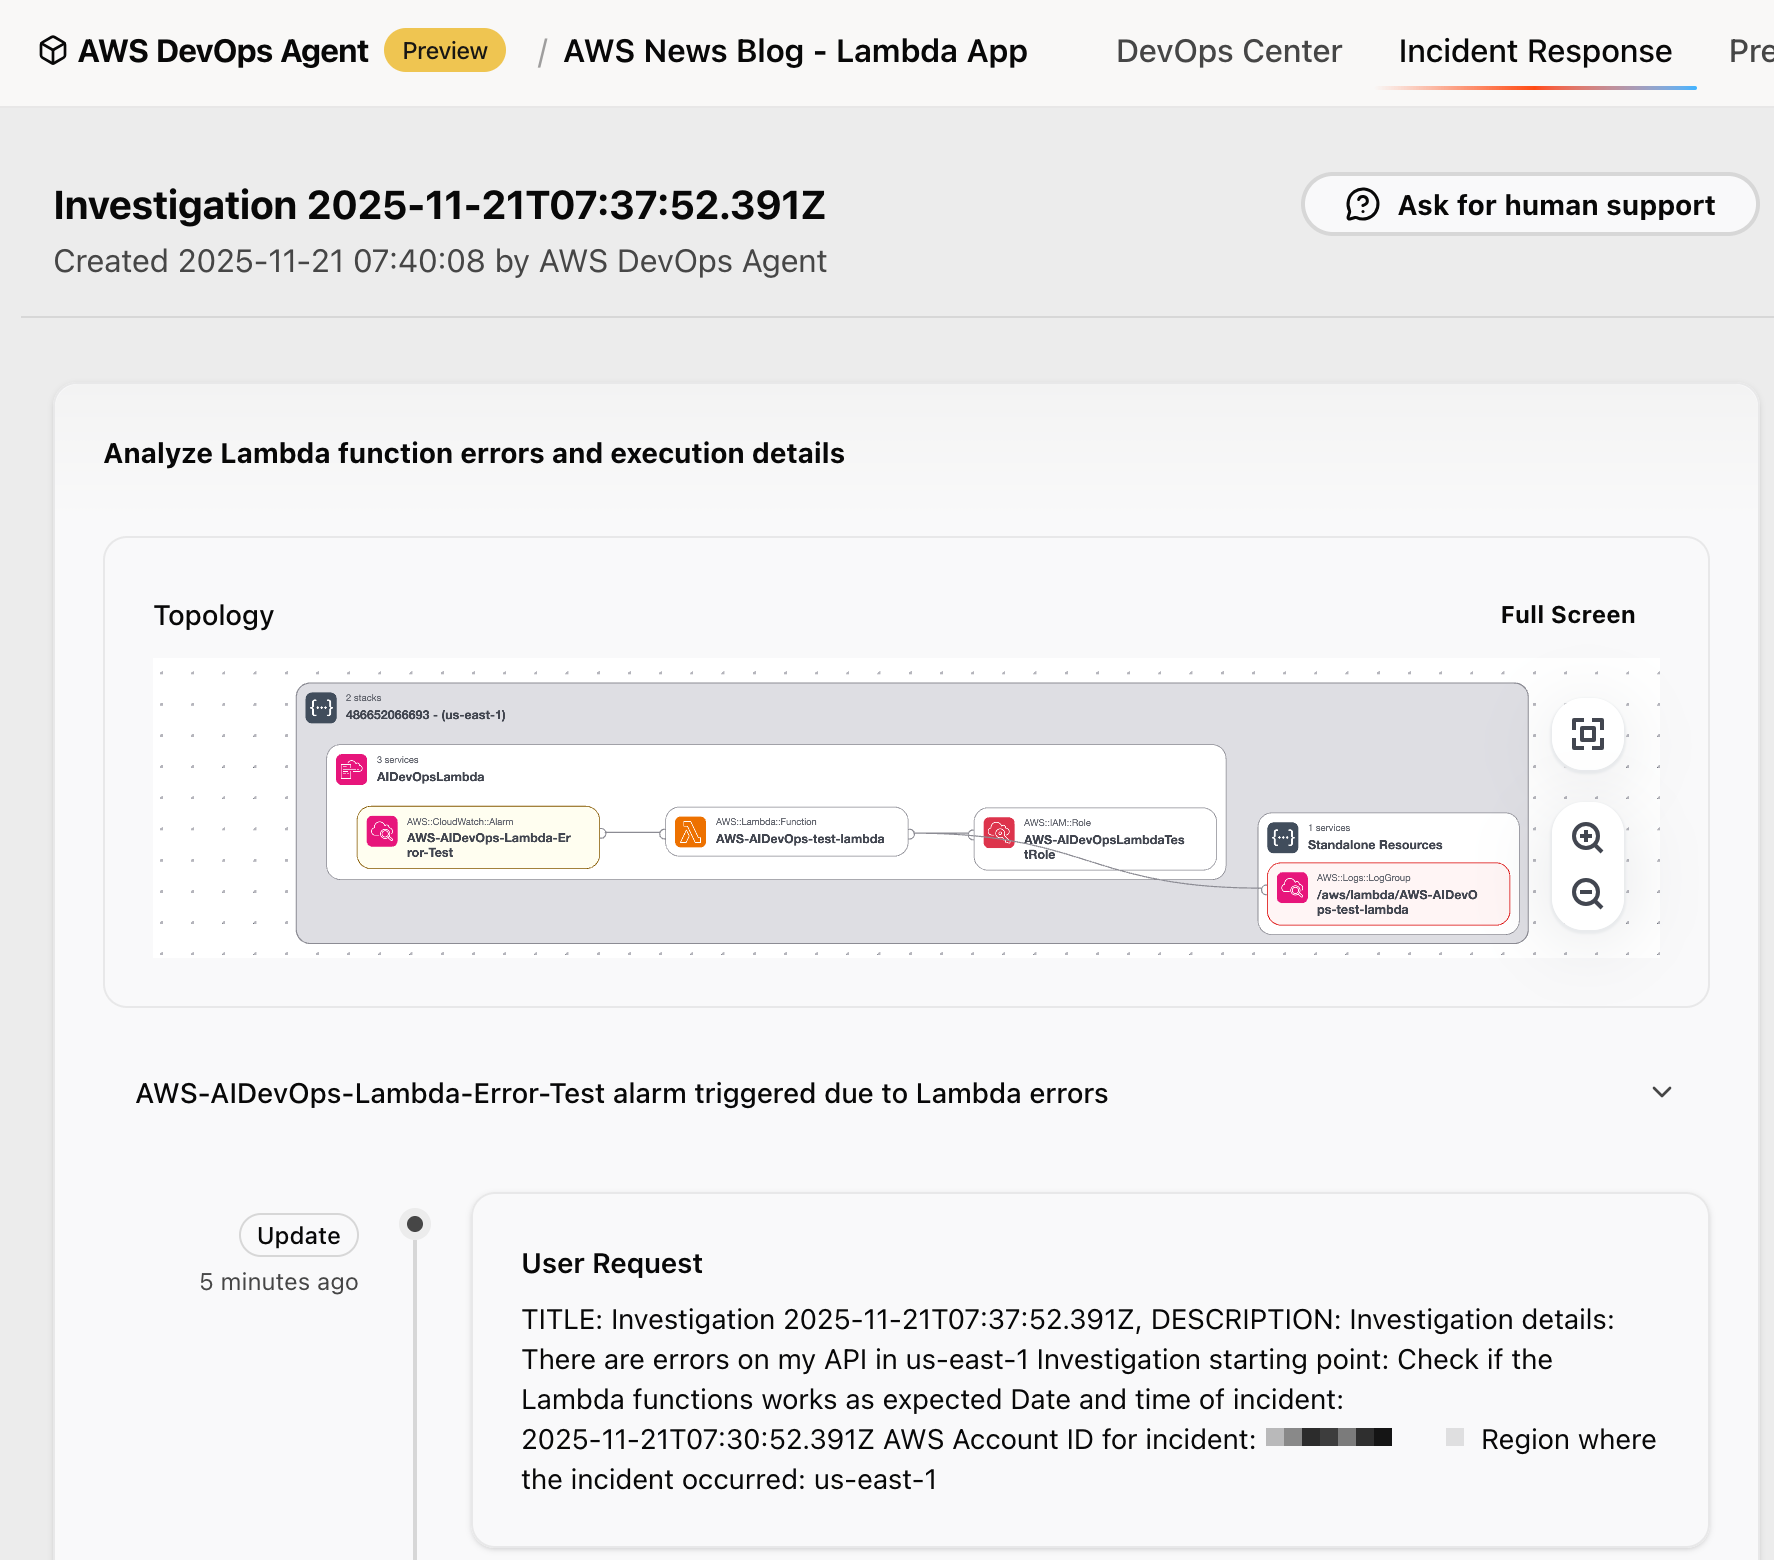
For this demo, I manually start the investigation by selecting Start Investigation.

You can also choose from several preconfigured starting points to quickly begin your investigation: Latest alarm to investigate your most recent triggered alarm and analyze the underlying metrics and logs to determine the root cause, High CPU usage to investigate high CPU utilization metrics across your compute resources and identify which processes or services are consuming excessive resources, or Error rate spike to investigate the recent increase in application error rates by analyzing metrics, application logs, and identifying the source of failures.

AWS DevOps Agent - web app

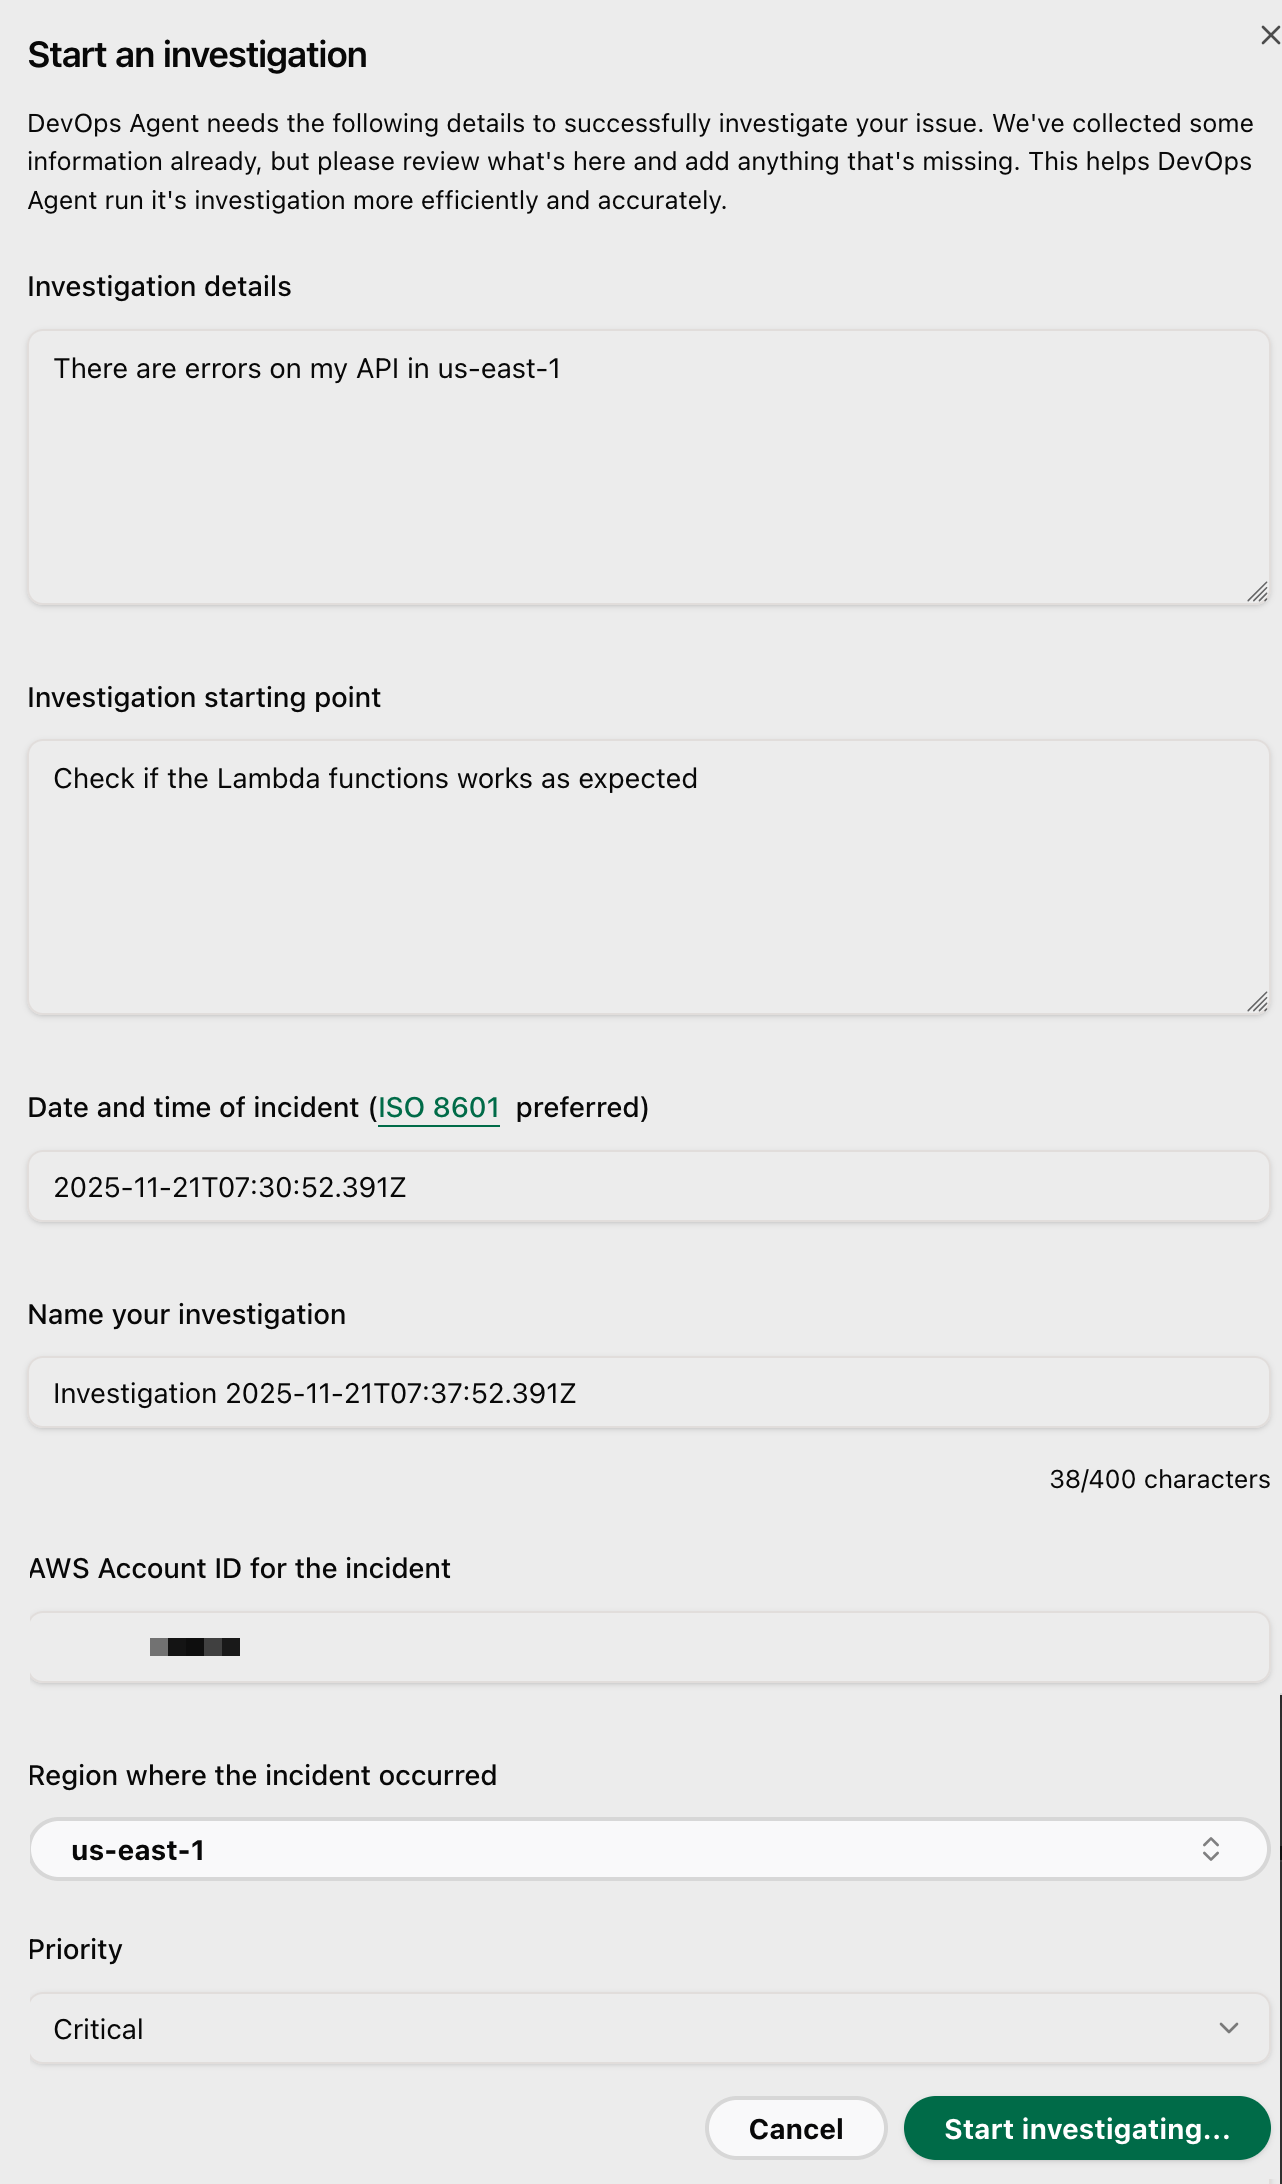
I enter some information, such as Investigation details, Investigation starting point, the Date and time of the incident, the AWS Account ID for the incident.

- web app - start investigation

In the AWS DevOps Agent web app, you can watch the investigation unfold in real time. The agent identifies the application stack. It correlates metrics from CloudWatch, examines logs from CloudWatch Logs or external sources, such as Splunk, reviews recent code changes from GitHub, and analyzes traces from AWS X-Ray.

- web app - application stack

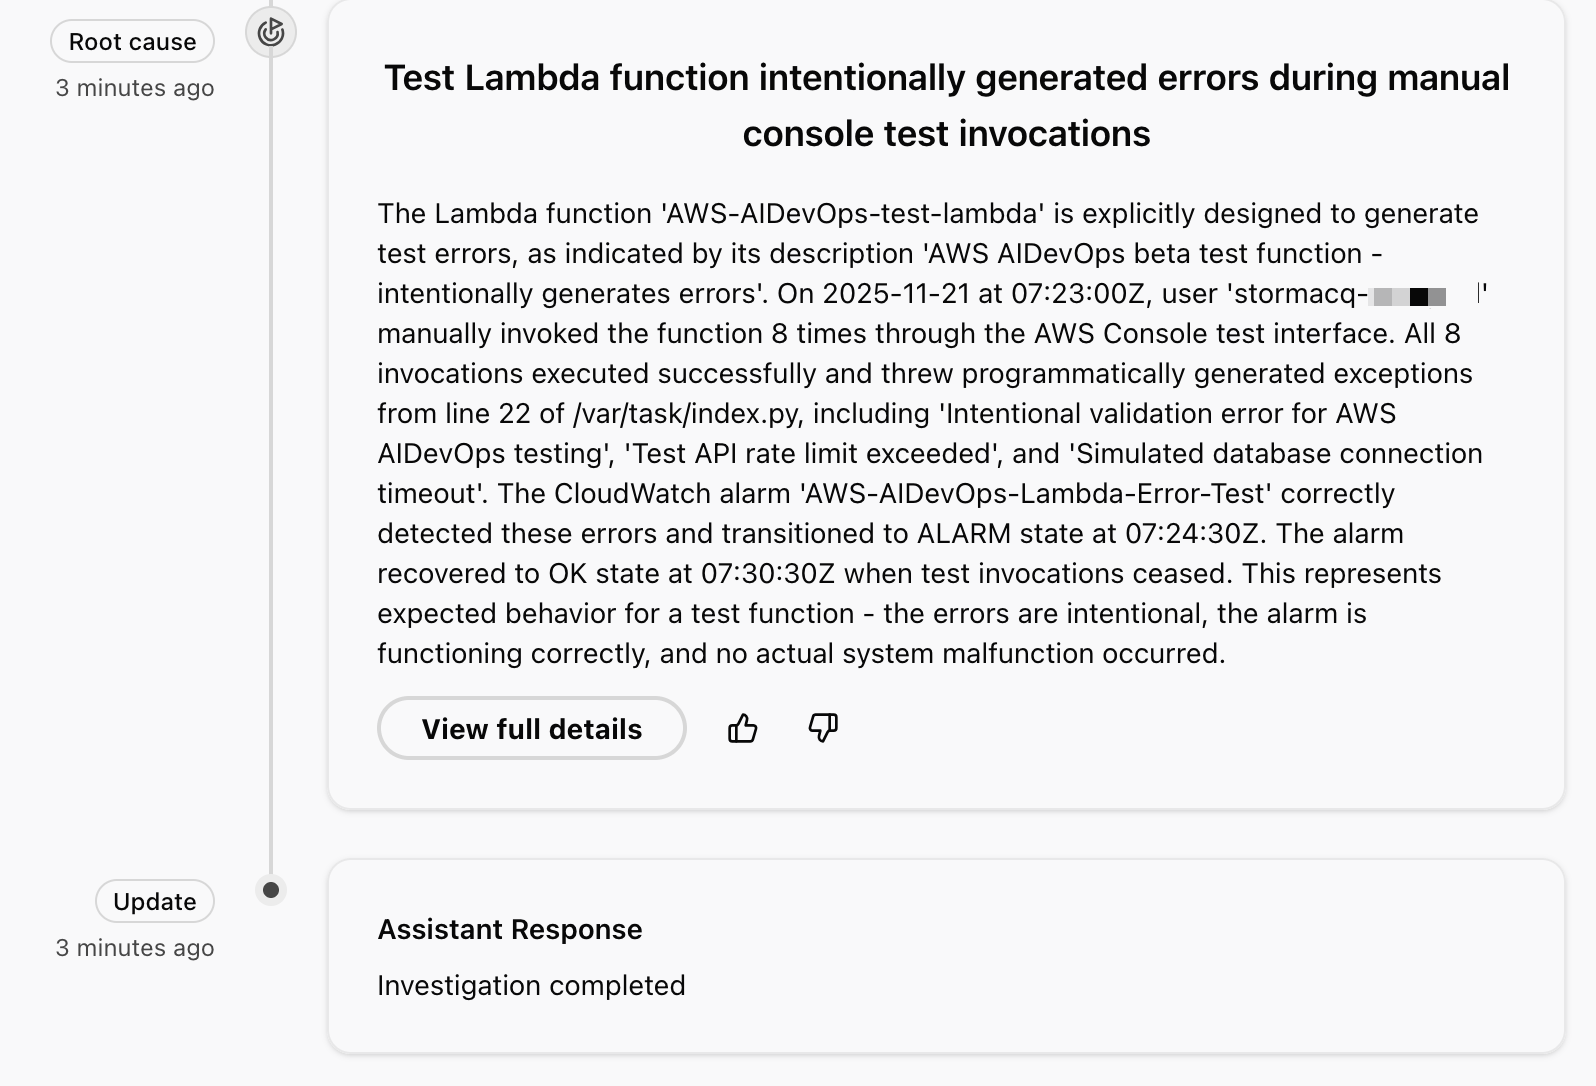
It identifies the error patterns and provides a detailed investigation summary. In the context of this demo, the investigation reveals that these are intentional test exceptions, shows the timeline of function invocations leading to the alarm, and even suggests monitoring improvements for error handling.

The agent uses a dedicated incident channel in Slack, notifies on-call teams if needed, and provides real-time status updates to stakeholders. Through the investigation chat interface, you can interact directly with the agent by asking clarifying questions such as “which logs did you analyze?” or steering the investigation by providing additional context, such as “focus on these specific log groups and rerun your analysis.” If you need expert assistance, you can create an AWS Support case with a single click, automatically populating it with the agent’s findings, and engage with AWS Support experts directly through the investigation chat window.

For this demo, the AWS DevOps Agent correctly identified manual activities in the Lambda console to invoke a function that intentionally triggers errors 😇.

- web app - root cause

Beyond incident response, AWS DevOps Agent analyzes my recent incidents to identify high-impact improvements that prevent future issues.

During active incidents, the agent offers immediate mitigation plans through its incident mitigations tab to help restore service quickly. Mitigation plans consist of specs that provide detailed implementation guidance for developers and agentic development tools like Kiro.

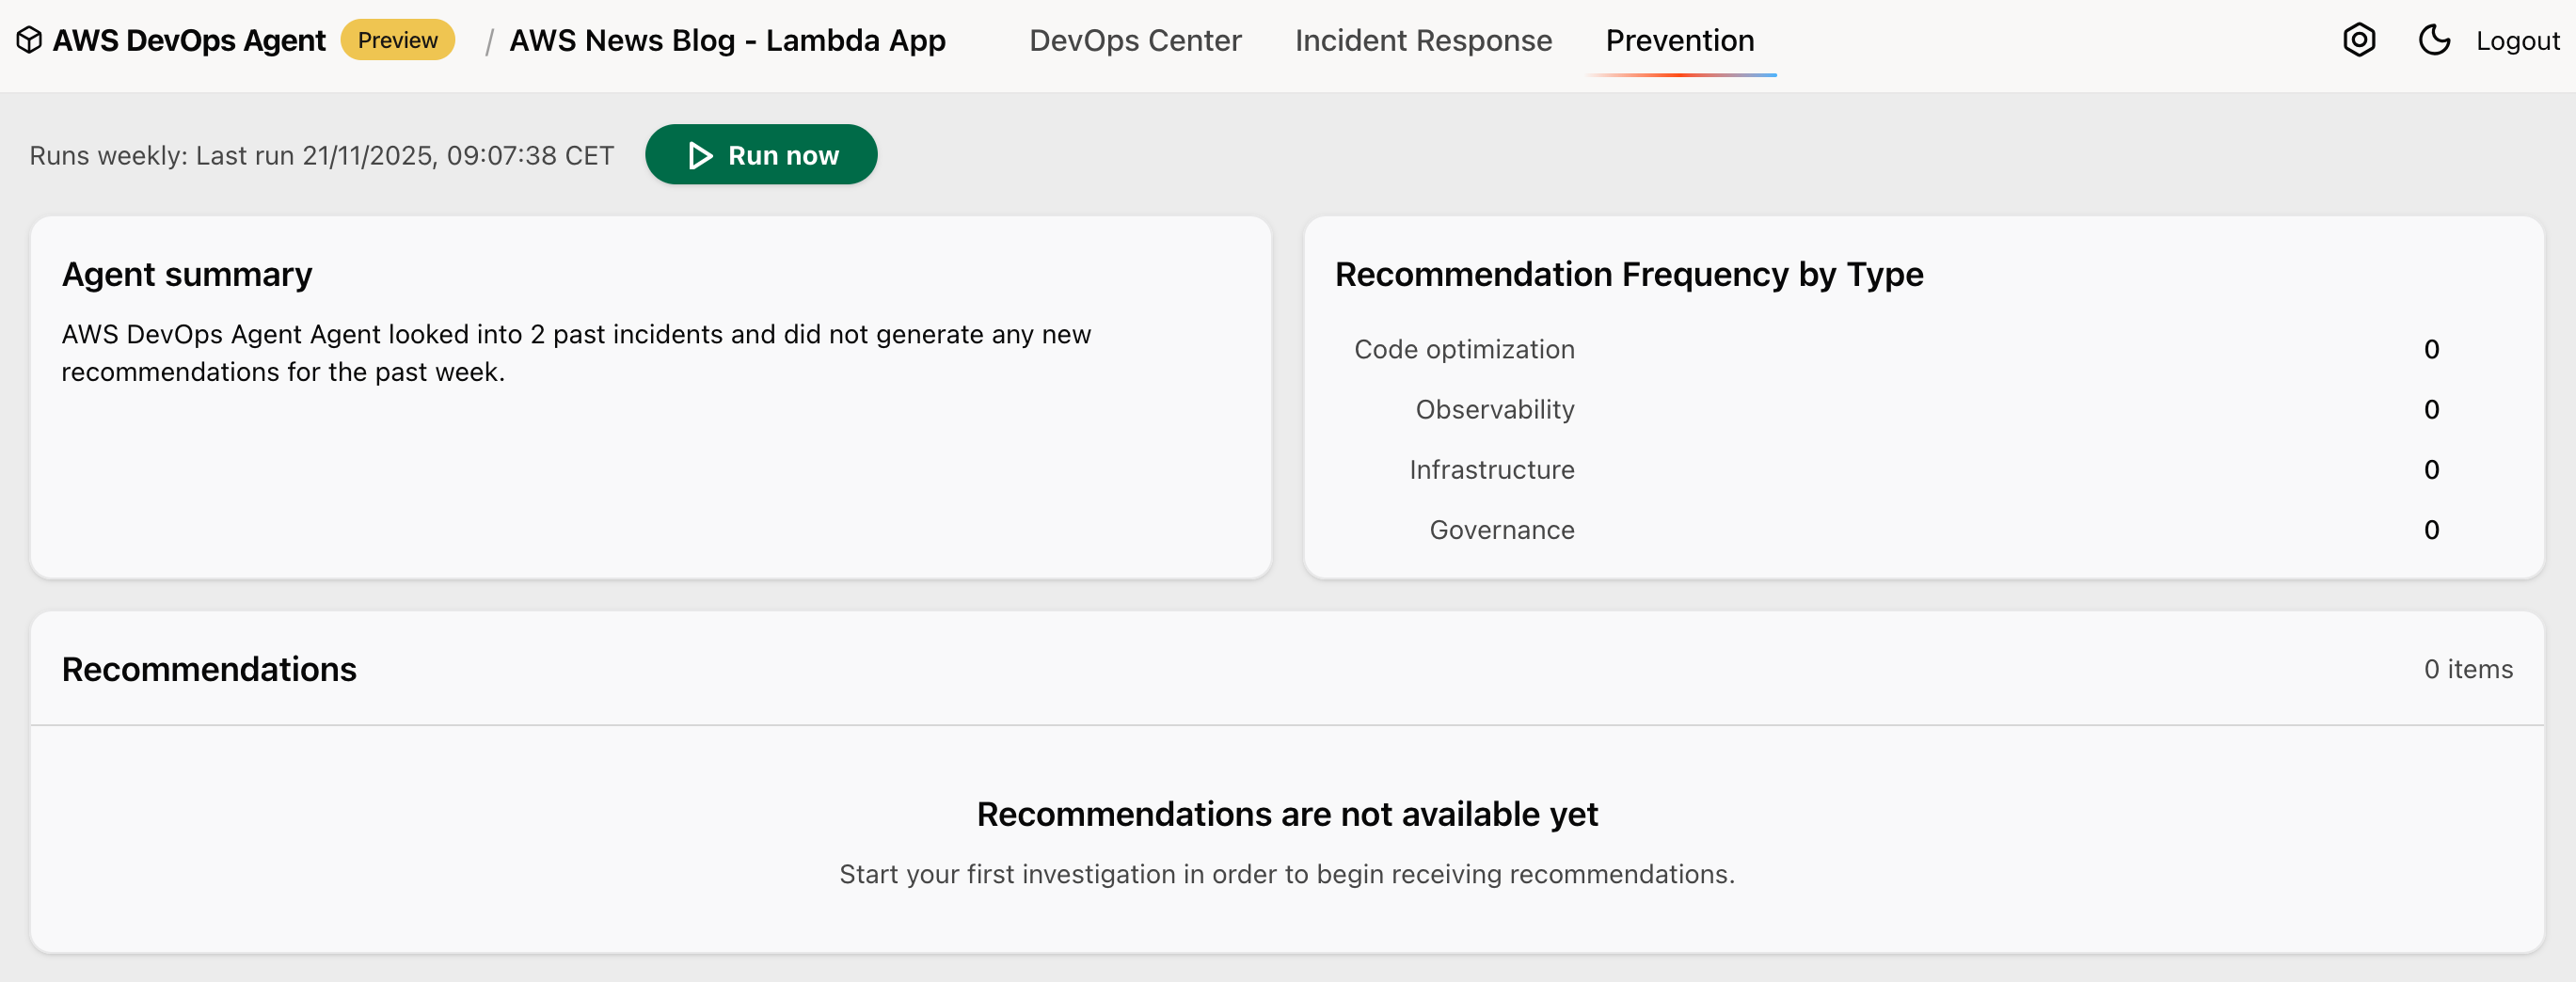
For longer-term resilience, it identifies potential enhancements by examining gaps in observability, infrastructure configurations, and deployment pipeline. My straightforward demo that triggered intentional errors was not enough to generate relevant recommendations though.

AWS DevOps Agent - web app - recommendations

For example, it might detect that a critical service lacks multi-AZ deployment and comprehensive monitoring. The agent then creates detailed recommendations with implementation guidance, considering factors like operational impact and implementation complexity. In an upcoming quick follow-up release, the agent will expand its analysis to include code bugs and testing coverage improvements.

Availability
You can try AWS DevOps Agent today in the US East (N. Virginia) Region. Although the agent itself runs in US East (N. Virginia) (us-east-1), it can monitor applications deployed in any Region, across multiple AWS accounts.

During the preview period, you can use AWS DevOps Agent at no charge, but there will be a limit on the number of agent task hours per month.

As someone who has spent countless nights debugging production issues, I’m particularly excited about how AWS DevOps Agent combines deep operational insights with practical, actionable recommendations. The service helps teams move from reactive firefighting to proactive system improvement.

To learn more and sign up for the preview, visit AWS DevOps Agent. I look forward to hearing how AWS DevOps Agent helps improve your operational efficiency.

— seb

Accelerate AI development using Amazon SageMaker AI with serverless MLflow

Post Syndicated from Donnie Prakoso original https://aws.amazon.com/blogs/aws/accelerate-ai-development-using-amazon-sagemaker-ai-with-serverless-mlflow/

Since we announced Amazon SageMaker AI with MLflow in June 2024, our customers have been using MLflow tracking servers to manage their machine learning (ML) and AI experimentation workflows. Building on this foundation, we’re continuing to evolve the MLflow experience to make experimentation even more accessible.

Today, I’m excited to announce that Amazon SageMaker AI with MLflow now includes a serverless capability that eliminates infrastructure management. This new MLflow capability transforms experiment tracking into an immediate, on-demand experience with automatic scaling that removes the need for capacity planning.

The shift to zero-infrastructure management fundamentally changes how teams approach AI experimentation—ideas can be tested immediately without infrastructure planning, enabling more iterative and exploratory development workflows.

Getting started with Amazon SageMaker AI and MLflow
Let me walk you through creating your first serverless MLflow instance.

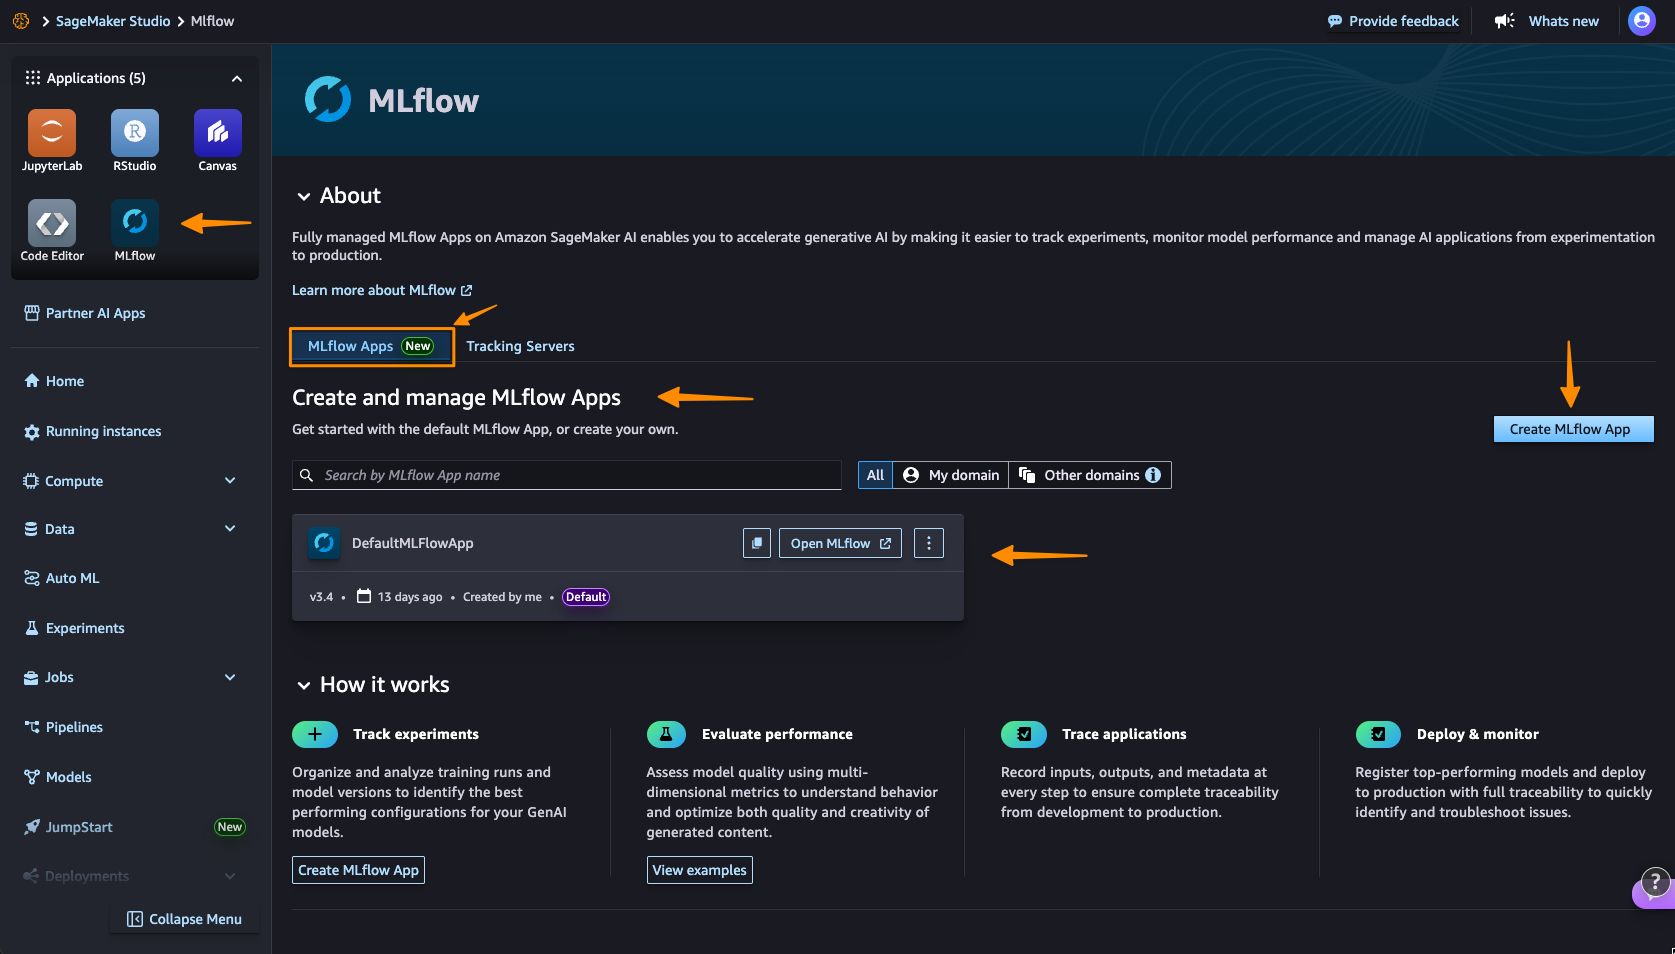
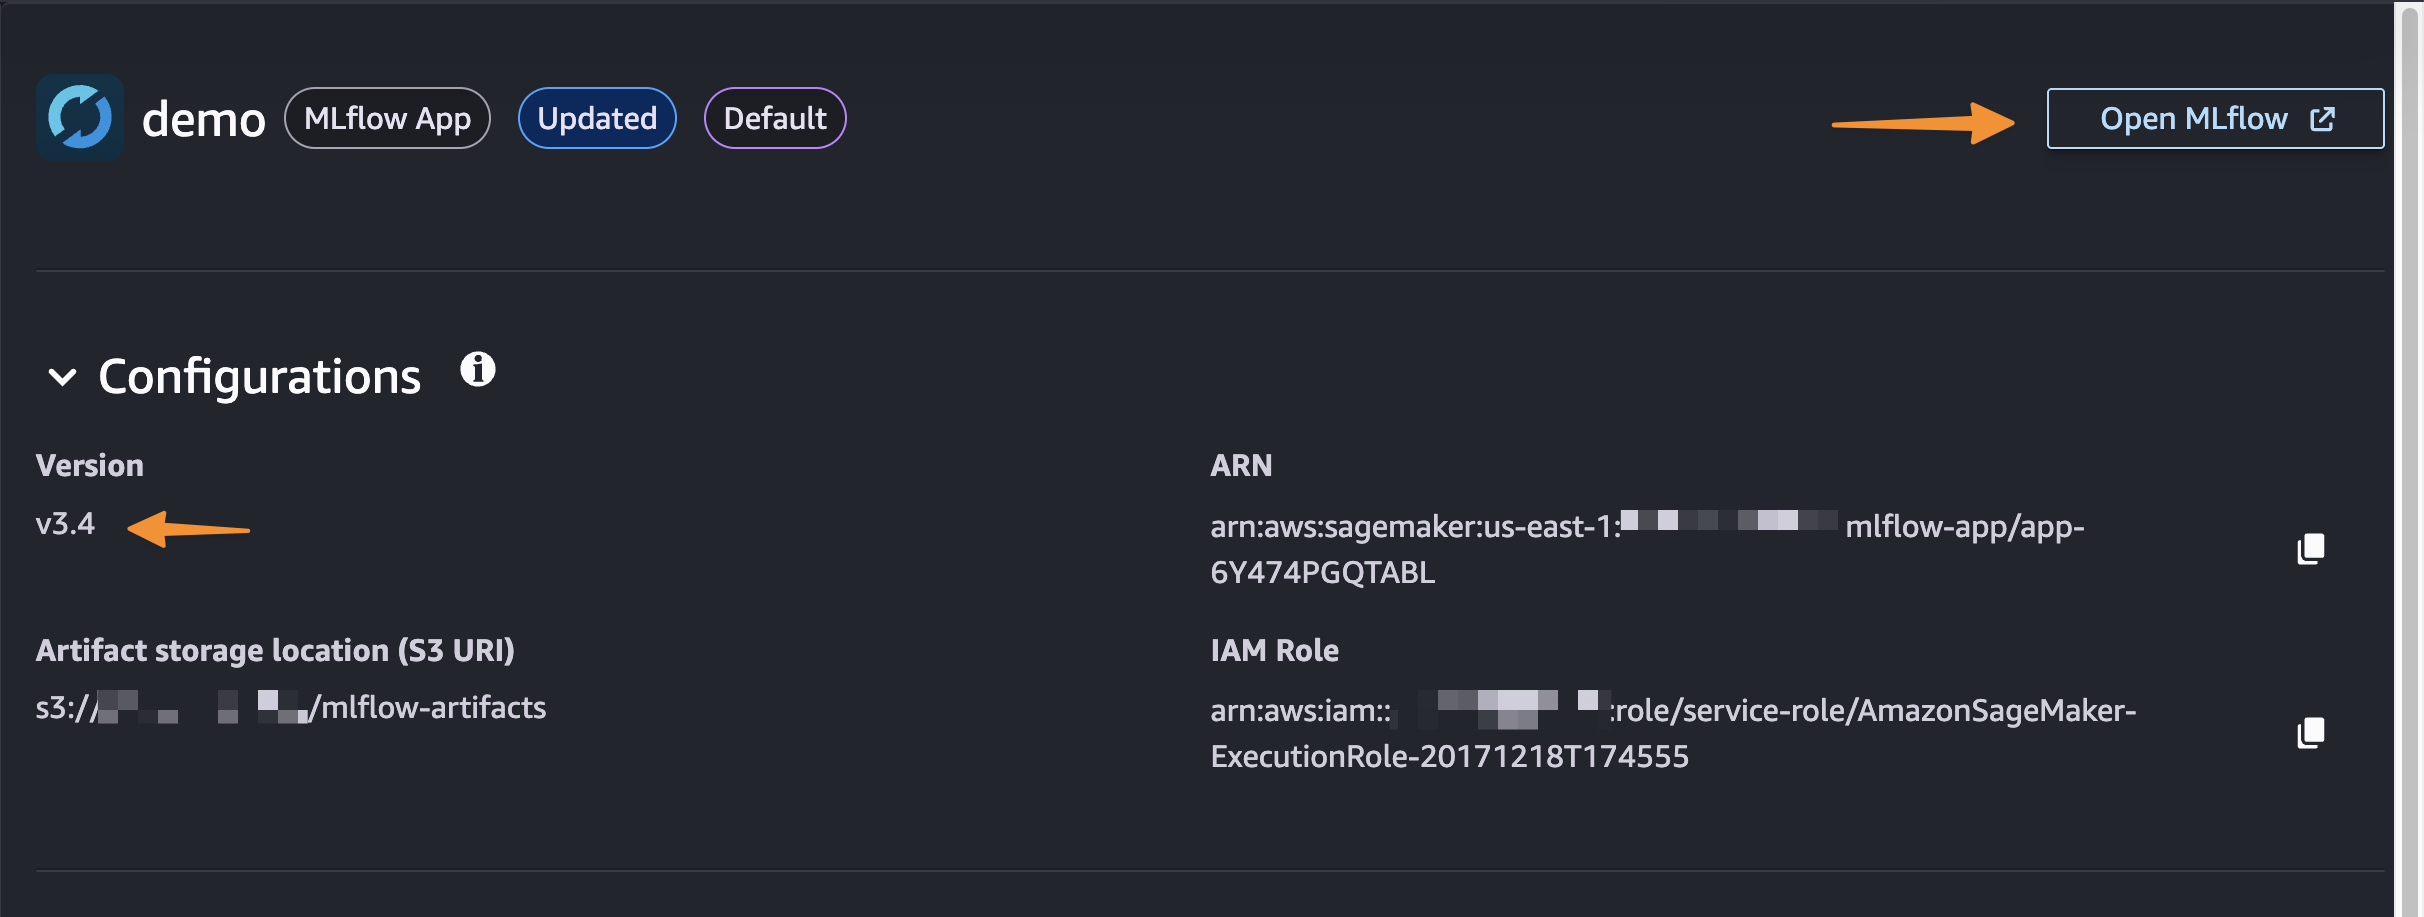
I navigate to Amazon SageMaker AI Studio console and select the MLflow application. The term MLflow Apps replaces the previous MLflow tracking servers terminology, reflecting the simplified, application-focused approach.

Here, I can see there’s already a default MLflow App created. This simplified MLflow experience makes it more straightforward for me to start doing experiments.

I choose Create MLflow App, and enter a name. Here, I have both an AWS Identity and Access Management (IAM) role and Amazon Simple Service (Amazon S3) bucket are already been configured. I only need to modify them in Advanced settings if needed.

Here’s where the first major improvement becomes apparent—the creation process completes in approximately 2 minutes. This immediate availability enables rapid experimentation without infrastructure planning delays, eliminating the wait time that previously interrupted experimentation workflows.

After it’s created, I receive an MLflow Amazon Resource Name (ARN) for connecting from notebooks. The simplified management means no server sizing decisions or capacity planning required. I no longer need to choose between different configurations or manage infrastructure capacity, which means I can focus entirely on experimentation. You can learn how to use MLflow SDK at Integrate MLflow with your environment in the Amazon SageMaker Developer Guide.

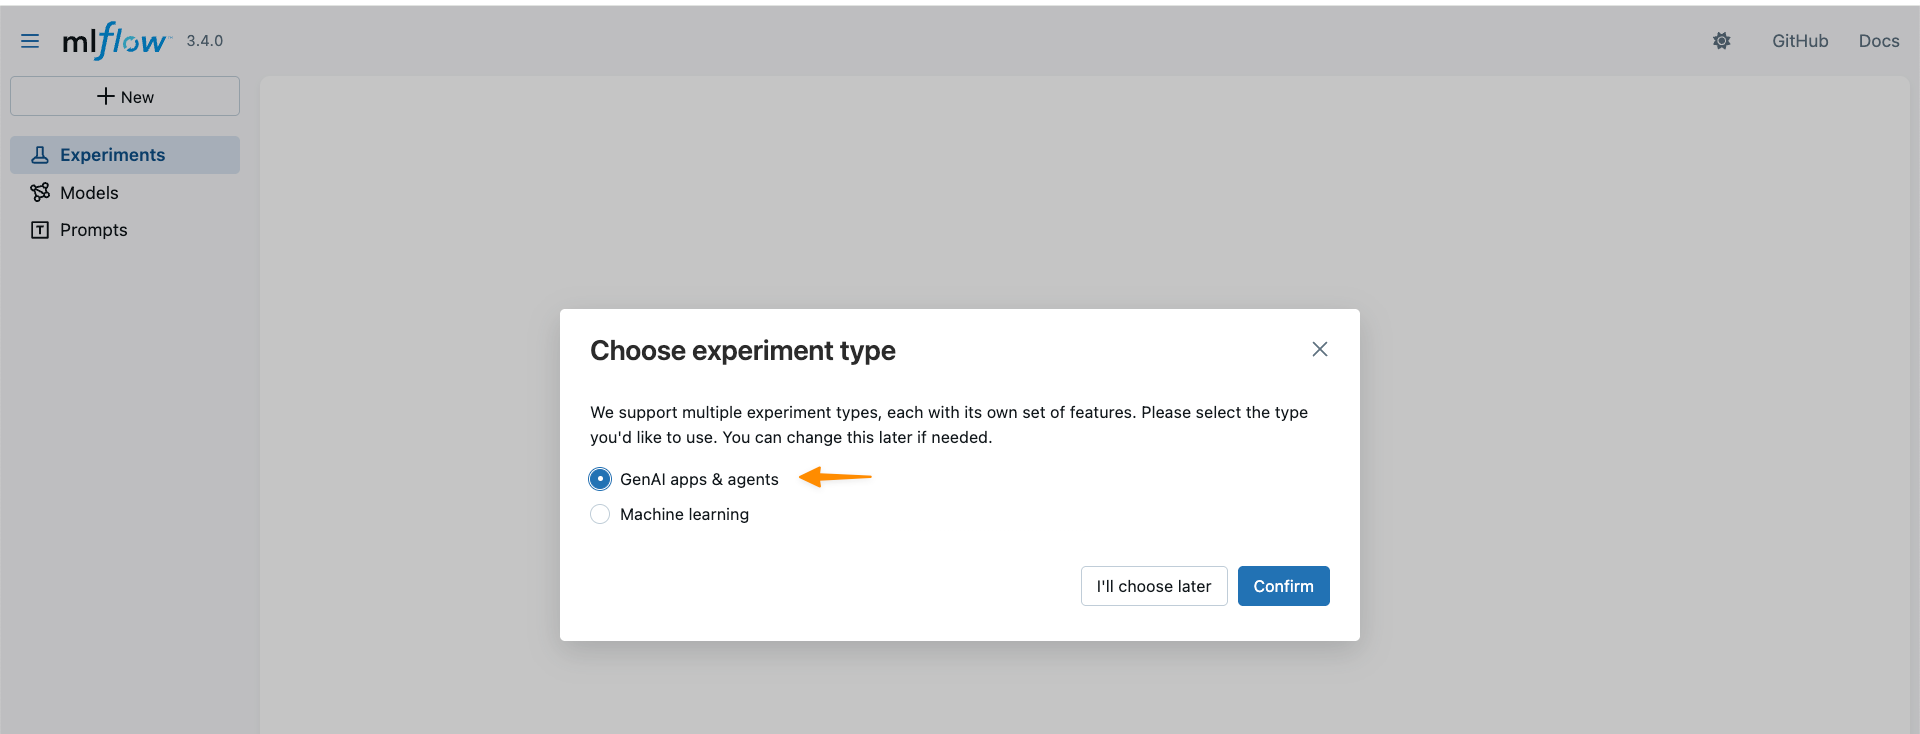
With MLflow 3.4 support, I can now access new capabilities for generative AI development. MLflow Tracing captures detailed execution paths, inputs, outputs, and metadata throughout the development lifecycle, enabling efficient debugging across distributed AI systems.

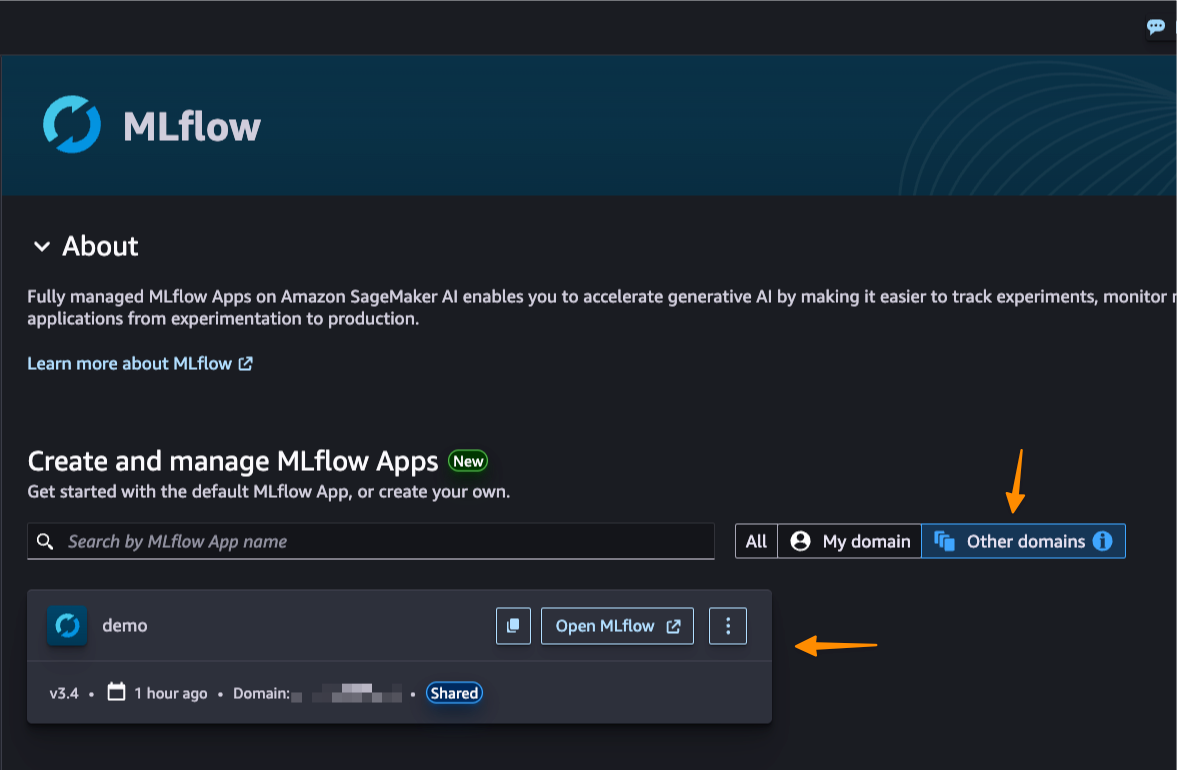
This new capability also introduces cross-domain access and cross-account access through AWS Resource Access Manager (AWS RAM) share. This enhanced collaboration means that teams across different AWS domains and accounts can share MLflow instances securely, breaking down organizational silos.

Better together: Pipelines integration
Amazon SageMaker Pipelines is integrated with MLflow. SageMaker Pipelines is a serverless workflow orchestration service purpose-built for machine learning operations (MLOps) and large language model operations (LLMOps) automation—the practices of deploying, monitoring, and managing ML and LLM models in production. You can easily build, execute, and monitor repeatable end-to-end AI workflows with an intuitive drag-and-drop UI or the Python SDK.

From a pipeline, a default MLflow App will be created if one doesn’t already exist. The experiment name can be defined and metrics, parameters, and artifacts are logged to the MLflow App as defined in your code. SageMaker AI with MLflow is also integrated with familiar SageMaker AI model development capabilities like SageMaker AI JumpStart and Model Registry, enabling end-to-end workflow automation from data preparation through model fine-tuning.

Things to know
Here are key points to note:

  • Pricing – The new serverless MLflow capability is offered at no additional cost. Note there are service limits that apply.
  • Availability – This capability is available in the following AWS Regions: US East (N. Virginia, Ohio), US West (N.California, Oregon), Asia Pacific (Mumbai, Seoul, Singapore, Sydney, Tokyo), Canada (Central), Europe (Frankfurt, Ireland, London, Paris, Stockholm), South America (São Paulo).
  • Automatic upgrades: MLflow in-place version upgrades happen automatically, providing access to the latest features without manual migration work or compatibility concerns. The service currently supports MLflow 3.4, providing access to the latest capabilities including enhanced tracing features.
  • Migration support – You can use the open source MLflow export-import tool available at mlflow-export-import to help migrate from existing Tracking Servers, whether they’re from SageMaker AI, self-hosted, or otherwise to serverless MLflow (MLflow Apps).

Get started with serverless MLflow by visiting Amazon SageMaker AI Studio and creating your first MLflow App. Serverless MLflow is also supported in SageMaker Unified Studio for additional workflow flexibility.

Happy experimenting!
— Donnie

Amazon FSx for NetApp ONTAP now integrates with Amazon S3 for seamless data access

Post Syndicated from Veliswa Boya original https://aws.amazon.com/blogs/aws/amazon-fsx-for-netapp-ontap-now-integrates-with-amazon-s3-for-seamless-data-access/

Today, we’re announcing the ability to access your data in Amazon FSx for NetApp ONTAP file systems using Amazon Simple Storage Service (Amazon S3). With this capability, you can use your enterprise file data to augment generative AI applications with Amazon Bedrock Knowledge Bases for Retrieval Augmented Generation (RAG), train machine learning (ML) models with Amazon SageMaker, generate insights with Amazon S3 integrated third-party services, use comprehensive research capabilities in AI-powered business intelligence (BI) tools such as Amazon Quick Suite, and run analyses using Amazon S3 based cloud-native applications, all while your file data continues to reside in your FSx for NetApp ONTAP file system.

Amazon FSx for NetApp ONTAP is the first and fully AWS managed NetApp ONTAP file system in the cloud to migrate on-premises applications that rely on NetApp ONTAP or other network-attached storage (NAS) appliances to AWS without having to change how you manage your data. FSx for NetApp ONTAP provides the popular capabilities, high performance, and data management APIs of ONTAP file systems with the added benefits of the AWS Cloud, such as simplified management, on-demand scaling, and seamless integration with other AWS services.

Over the years, AWS has developed a broad range of industry-leading AI, ML, and analytics services and applications that work with data in Amazon S3 that organizations use to innovate faster, discover new insights, and make even better data-driven decisions. However, some organizations want to use these services with their enterprise file data stored in NetApp ONTAP or other NAS appliances.

How to get started
You can create and attach an S3 Access Point to your FSx for ONTAP file system using the Amazon FSx console, the AWS Command Line Interface (AWS CLI), or the AWS SDK.

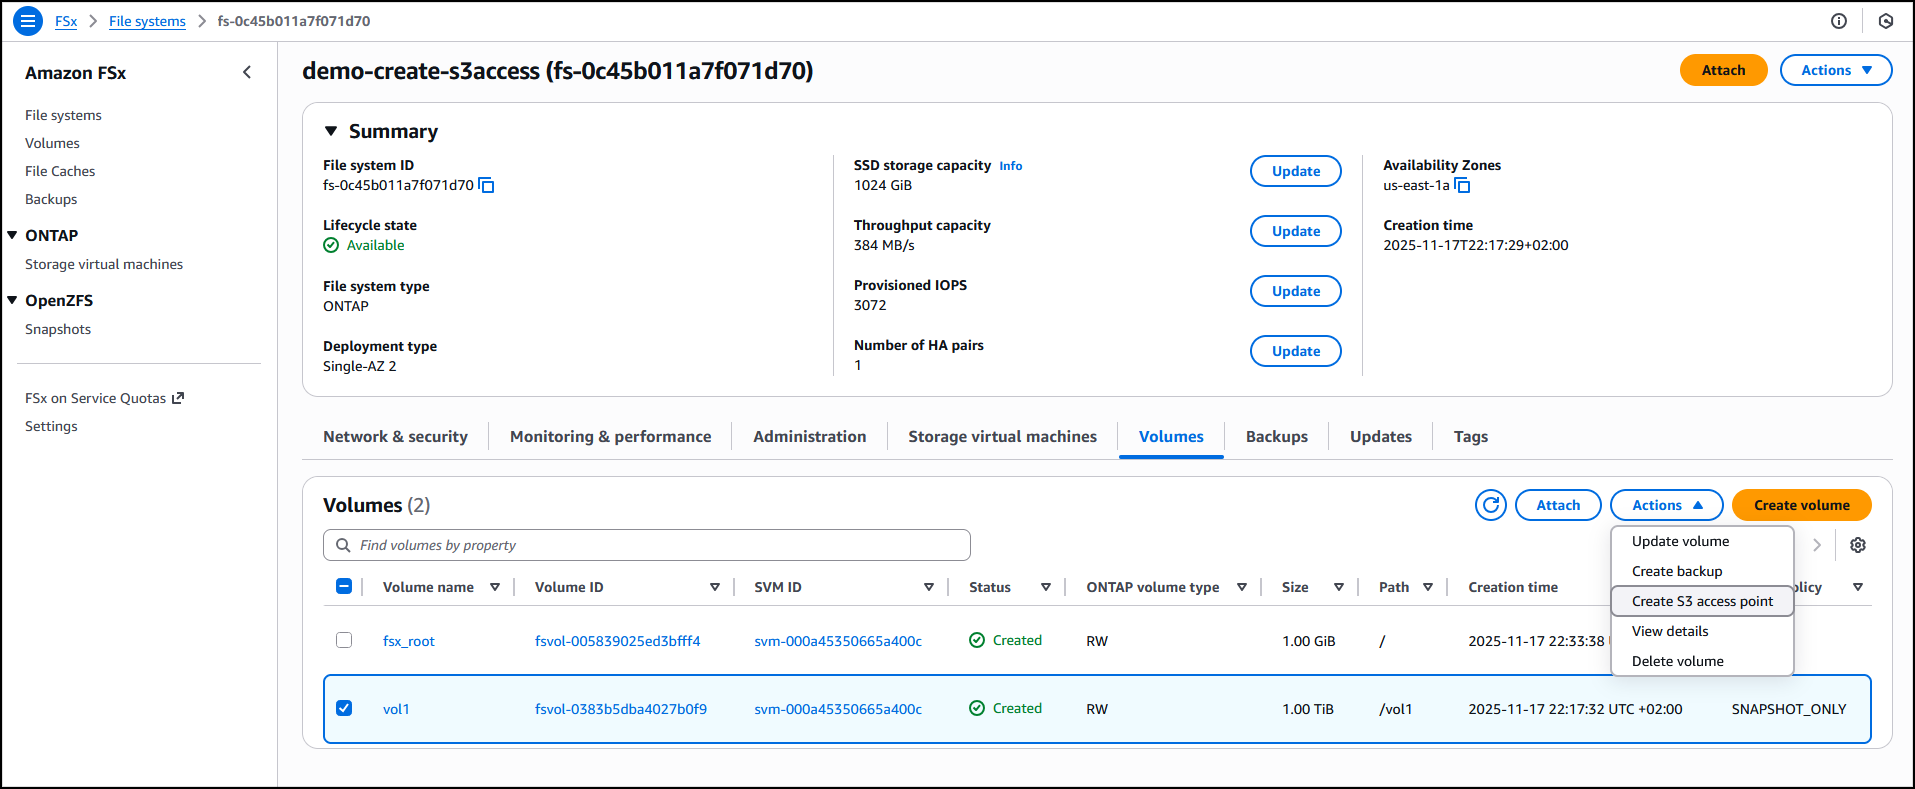
I have an existing FSx for ONTAP file system demo-create-s3access which I created by following the steps in the Creating file systems in the FSx for ONTAP documentation. Using the Amazon FSx console I now choose the file system ID fs-0c45b011a7f071d70 to access the full details of the file system.

I’ll attach the access point to the volume of the file system. I choose the volume vol1 and then select Create S3 Access Point from the Actions dropdown menu.


I enter details such as the access point name, the type of file system user identity and the network configuration, then choose Create s3 Access Point to finalize the process.


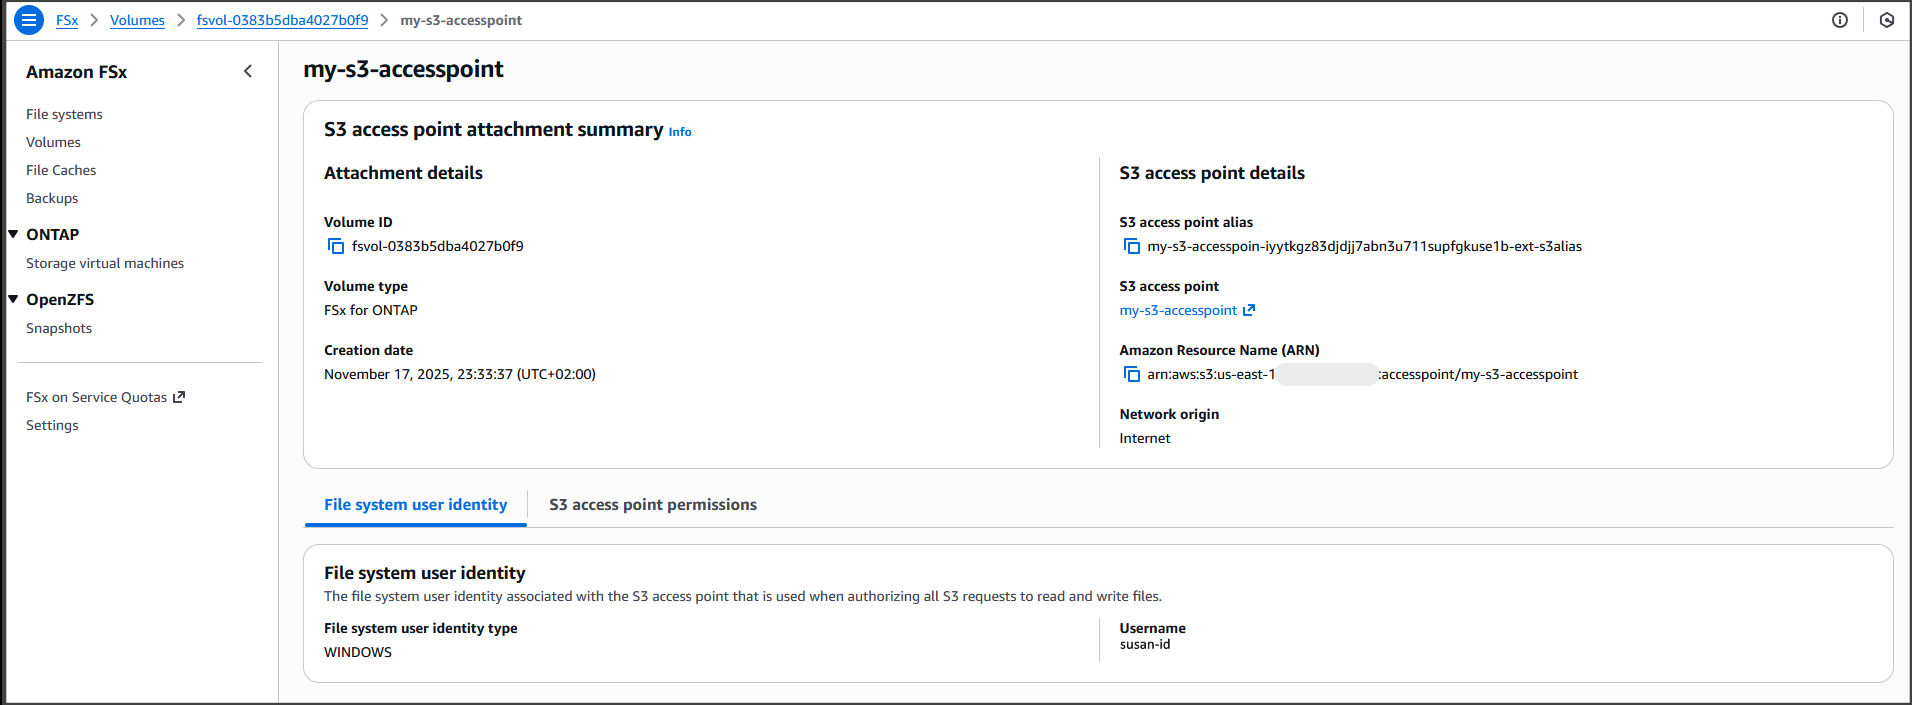
After it’s created, the access point my-s3-accesspoint is ready to allow access to the file data stored in my file system demo-create-s3access from Amazon S3. Amazon Access Points are S3 endpoints that can be attached to Amazon FSx volumes and used to perform Amazon S3 object operations.


I can now bring proprietary data stored in the file system demo-create-s3access to Amazon S3 for use in applications that work with Amazon S3 while my file data continues to reside in the FSx for NetApp ONTAP file system using the access point my-s3-accesspoint (this data remains accessible through the file protocols).

For the walkthrough in this post, I’ll integrate with Quick Suite.

Integrating decades of enterprise file data with the latest AI powered BI tools on AWS
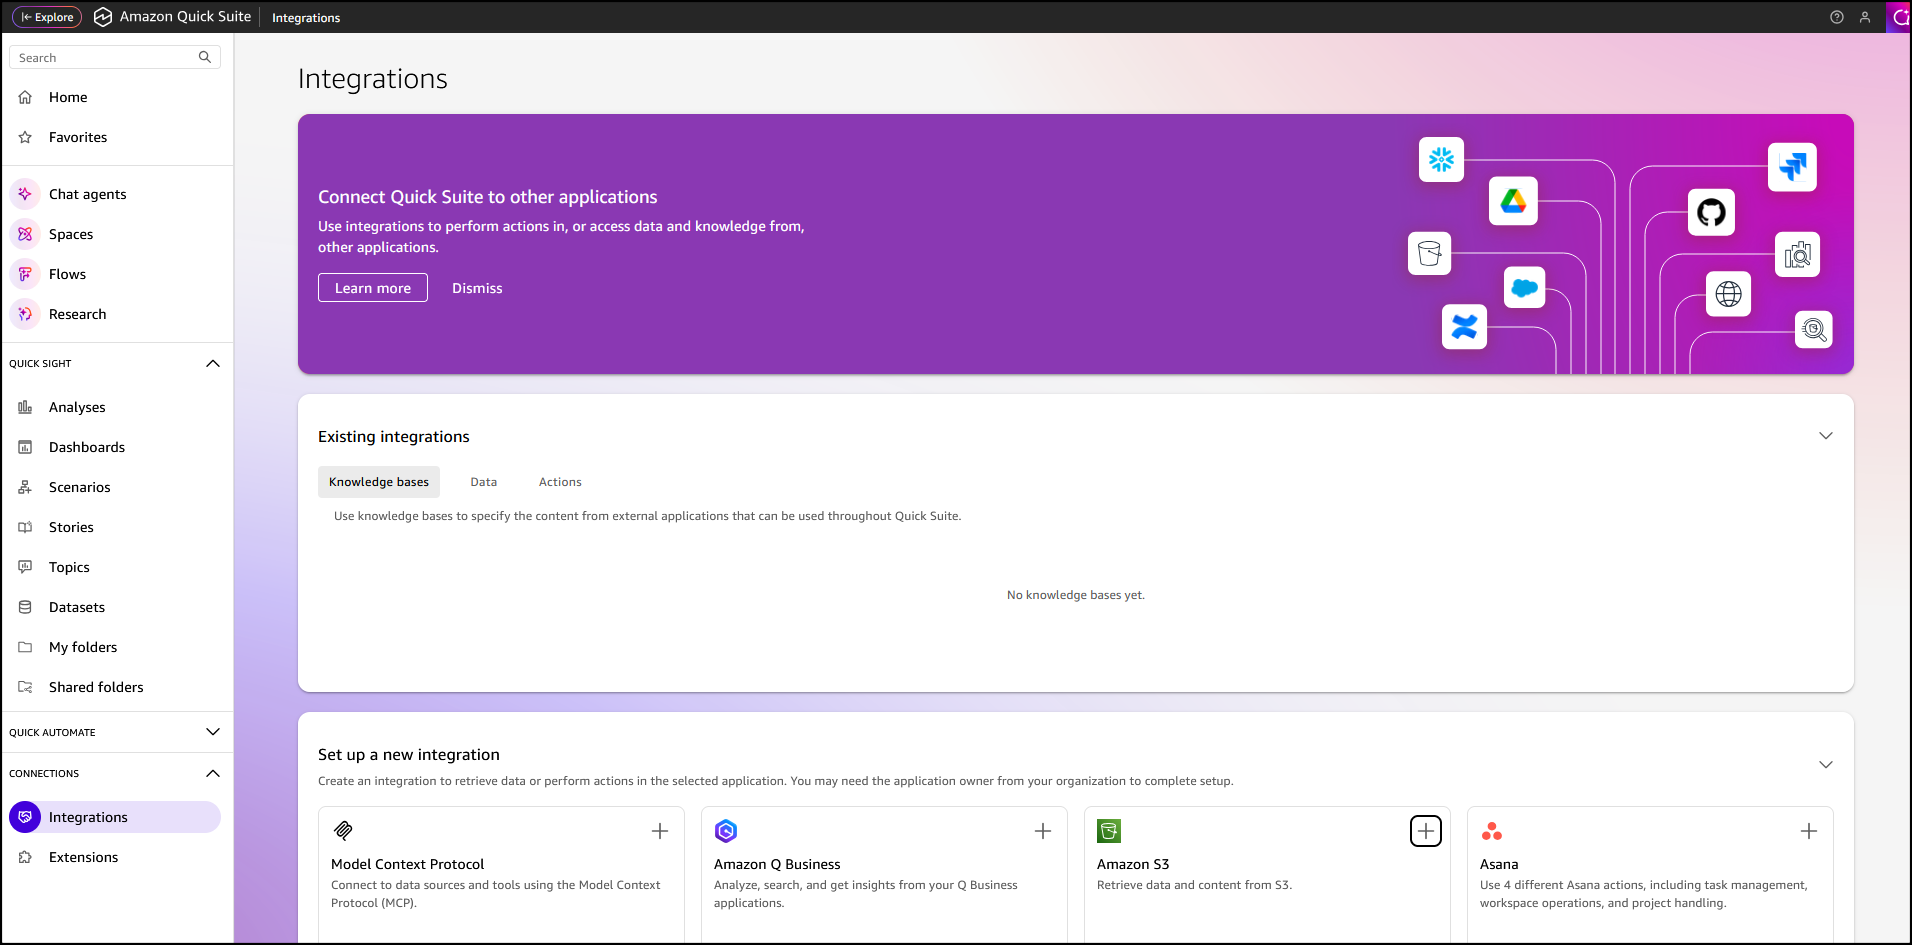
In the Quick Suite Console, in the left navigation pane, I choose Connections, then select Integrations. Before you begin, make sure that you have the correct permissions to the Amazon S3 AWS resource. You can control the AWS resources that Quick Suite can access by following the Amazon Quick Suite user guide.


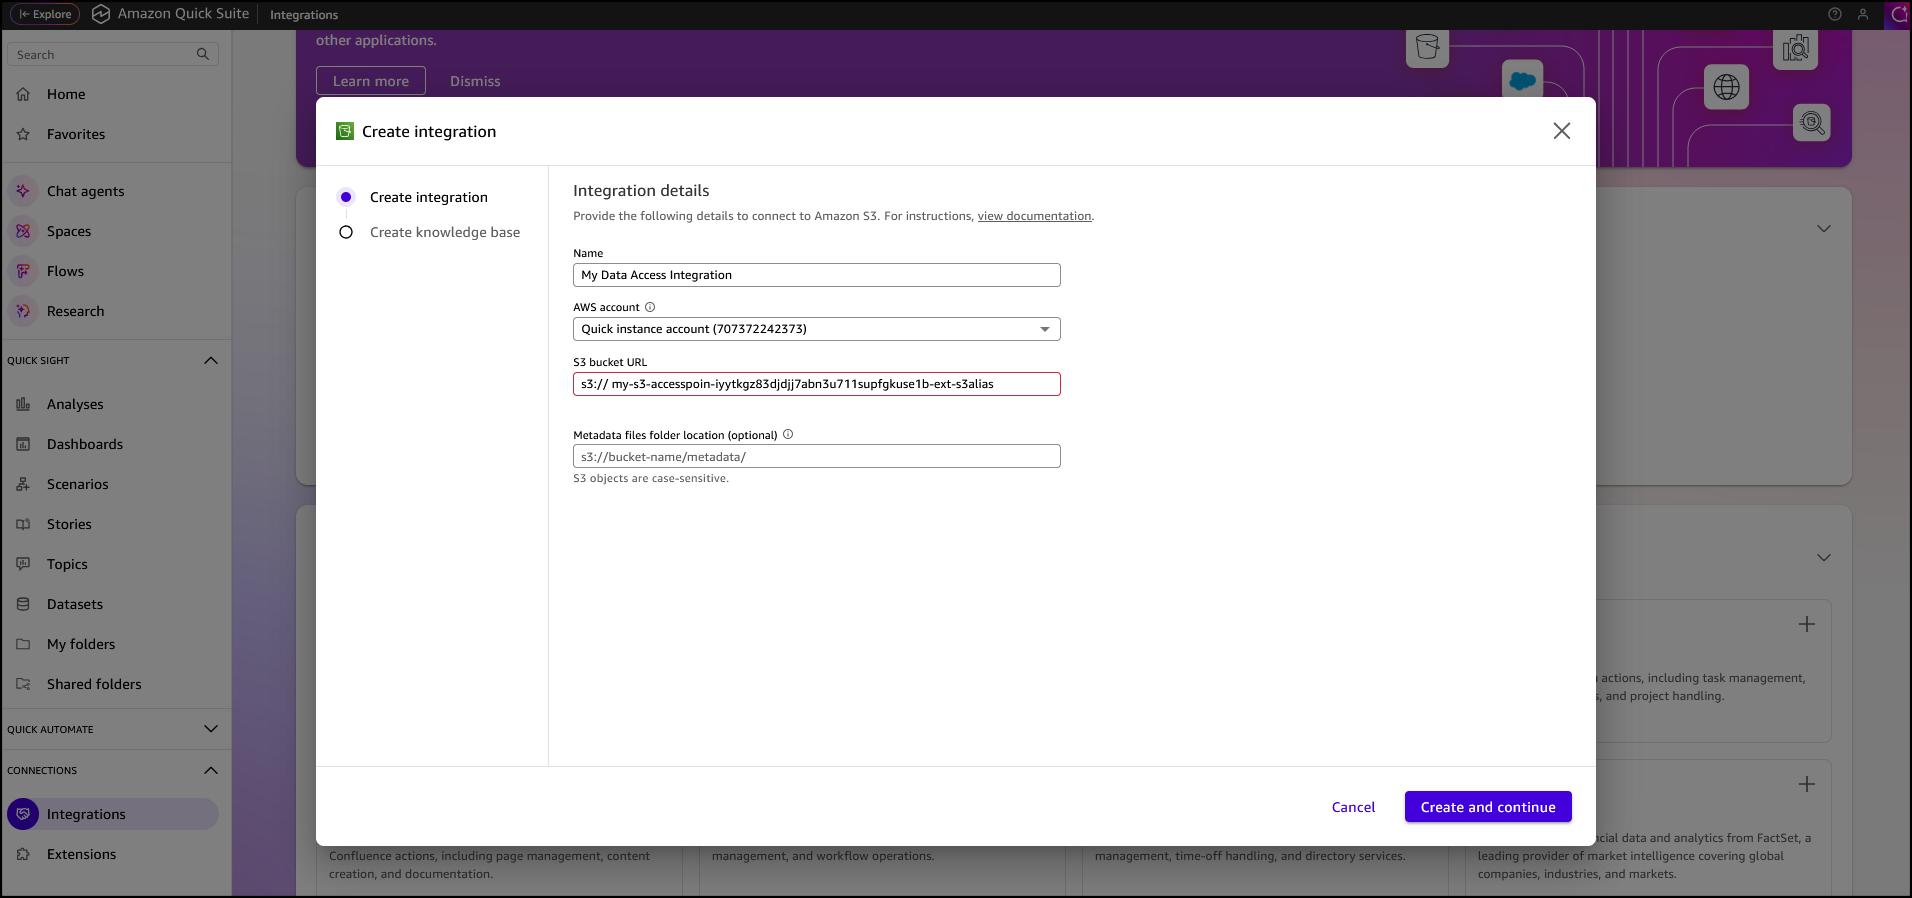
After I’ve selected the Amazon S3 integration I enter my Amazon S3 Access Point alias as the S3 bucket URL, leave the rest of the information as default, then choose Create and continue.


I finalize the process by providing the Name of the knowledge base, the Description, then choose Create.


After the knowledge base has been created it’s automatically synchronized, it’s now available for interaction.


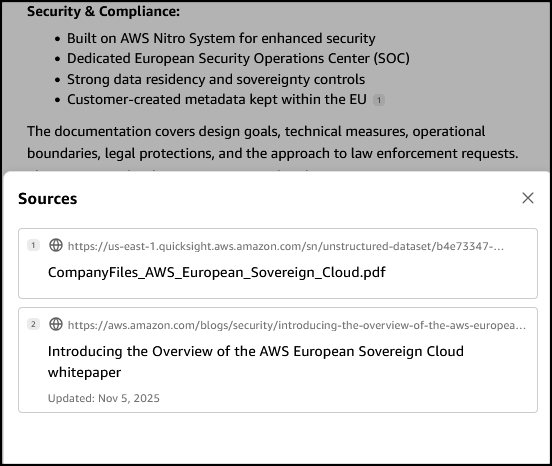
I want to learn more about the AWS European Sovereign Cloud so I’ve updated the file system (accessed through the S3 Access Point my-s3-accesspoin-iyytkgz83djdjj7abn3u711supfgkuse1b-ext-s3alias) with the AWS whitepaper on this topic. In the chat in Amazon Quick Suite. I start asking the first question “do we have any documentation on the europe sovereignty cloud?“. To answer my question, the chat agent accesses and analyzes various types of data sources I have permission to use, including uploaded files in my current conversation, spaces I have access to, knowledge bases from my integrations, and more.

When I verify the source, I see that the document I uploaded to my file system is listed as one of the sources.

Other use cases of Amazon S3 Access Points for Amazon FSx for NetApp ONTAP
Earlier, we looked at use cases such as connecting an organization’s proprietary file data to Amazon Quick Suite for advanced business intelligence. Additionally, Amazon S3 Access Points for Amazon FSx for NetApp ONTAP can be used to seamlessly integrate enterprise file data with comprehensive analytics services, such as Amazon Athena for serverless SQL queries or AWS Glue for ETL processing, to name a few.

Amazon S3 Access Points for Amazon FSx for NetApp ONTAP are also suitable for data access from serverless compute workloads that are cloud-native with containerized microservices that require flexible access to shared enterprise datasets, such as configuration files, reference data, content libraries, model artifacts, and application assets.

Now available
You can get started today using the Amazon FSx console, AWS CLI, or AWS SDK to attach Amazon S3 Access Points to your Amazon FSx for NetApp ONTAP file systems. The feature is available in the following AWS Regions: Africa (Cape Town), Asia Pacific (Hong Kong, Hyderabad, Jakarta, Melbourne, Mumbai, Osaka, Seoul, Singapore, Sydney, Tokyo), Canada (Central, Calgary), Europe (Frankfurt, Ireland, London, Milan, Paris, Spain, Stockholm, Zurich), Israel (Tel Aviv), Middle East (Bahrain, UAE), South America (Sao Paulo), US East (N. Virginia, Ohio), and US West (N. California Oregon). You’re billed by Amazon S3 for the requests and data transfer costs through your S3 Access Point, in addition to your standard Amazon FSx charges. Learn more on the Amazon FSx for NetApp ONTAP pricing page.

PS: Writing a blog post at AWS is always a team effort, even when you see only one name under the post title. In this case, I want to thank Luke Miller, for his expertise and generous help with technical guidance, which made this overview possible and comprehensive.

– Veliswa Boya.

Introducing Amazon Nova 2 Lite, a fast, cost-effective reasoning model

Post Syndicated from Danilo Poccia original https://aws.amazon.com/blogs/aws/introducing-amazon-nova-2-lite-a-fast-cost-effective-reasoning-model/

Today, we’re releasing Amazon Nova 2 Lite, a fast, cost-effective reasoning model for everyday workloads. Available in Amazon Bedrock, the model offers industry-leading price performance and helps enterprises and developers build capable, reliable, and efficient agentic-AI applications. For organizations who need AI that truly understands their domain, Nova 2 Lite is the best model to use with Nova Forge to build their own frontier intelligence.

Nova 2 Lite supports extended thinking, including step-by-step reasoning and task decomposition, before providing a response or taking action. Extended thinking is off by default to deliver fast, cost-optimized responses, but when deeper analysis is needed, you can turn it on and choose from three thinking budget levels: low, medium, or high, giving you control over the speed, intelligence, and cost tradeoff.

Nova 2 Lite supports text, image, video, document as input and offers a one million-token context window, enabling expanded reasoning and richer in-context learning. In addition, Nova 2 Lite can be customized for your specific business needs. The model also includes access to two built-in tools: web grounding and a code interpreter. Web grounding retrieves publicly available information with citations, while the code interpreter allows the model to run and evaluate code within the same workflow.

Amazon Nova 2 Lite demonstrates strong performance across diverse evaluation benchmarks. The model excels in core intelligence across multiple domains including instruction following, math, and video understanding with temporal reasoning. For agentic workflows, Nova 2 Lite shows reliable function calling for task automation and precise UI interaction capabilities. The model also demonstrates strong code generation and practical software engineering problem-solving abilities.

Amazon Nova 2 Lite benchmarks

Nova 2 Lite is built to meet your company’s needs
Nova 2 Lite can be used for a broad range of your everyday AI tasks. It offers the best combination of price, performance, and speed. Early customers are using Nova 2 Lite for customer service chatbots, document processing, and business process automation.

Nova 2 Lite can help support workloads across many different use cases:

  • Business applications – Automate business process workflow, intelligent document processing (IDP), customer support, and web search to improve productivity and outcomes
  • Software engineering – Generate code, debugging, refactoring, and migrating systems to accelerate development and increase efficiency
  • Business intelligence and research – Use long-horizon reasoning and web grounding to analyze internal and external sources to uncover insights, and make informed decisions

For specific requirements, Nova 2 Lite is also available for customization on both Amazon Bedrock and Amazon SageMaker AI.

Using Amazon Nova 2 Lite
In the Amazon Bedrock console, you can use the Chat/Text playground to quickly test the new model with your prompts. To integrate the model into your applications, you can use any AWS SDKs with the Amazon Bedrock InvokeModel and Converse API. Here’s a sample invocation using the AWS SDK for Python (Boto3).

import boto3

AWS_REGION="us-east-1"
MODEL_ID="global.amazon.nova-2-lite-v1:0"
MAX_REASONING_EFFORT="low" # low, medium, high

bedrock_runtime = boto3.client("bedrock-runtime", region_name=AWS_REGION)

# Enable extended thinking for complex problem-solving
response = bedrock_runtime.converse(
    modelId=MODEL_ID,
    messages=[{
        "role": "user",
        "content": [{"text": "I need to optimize a logistics network with 5 warehouses, 12 distribution centers, and 200 retail locations. The goal is to minimize total transportation costs while ensuring no location is more than 50 miles from a distribution center. What approach should I take?"}]
    }],
    additionalModelRequestFields={
        "reasoningConfig": {
            "type": "enabled", # enabled, disabled (default)
            "maxReasoningEffort": MAX_REASONING_EFFORT
        }
    }
)

# The response will contain reasoning blocks followed by the final answer
for block in response["output"]["message"]["content"]:
    if "reasoningContent" in block:
        reasoning_text = block["reasoningContent"]["reasoningText"]["text"]
        print(f"Nova's thinking process:\n{reasoning_text}\n")
    elif "text" in block:
        print(f"Final recommendation:\n{block['text']}")

You can also use the new model with agentic frameworks that supports Amazon Bedrock and deploy the agents using Amazon Bedrock AgentCore. In this way, you can build agents for a broad range of tasks. Here’s the sample code for an interactive multi-agent system using the Strands Agents SDK. The agents have access to multiple tools, including read and write file access and the possibility to run shell commands.

from strands import Agent
from strands.models import BedrockModel
from strands_tools import calculator, editor, file_read, file_write, shell, http_request, graph, swarm, use_agent, think

AWS_REGION="us-east-1"
MODEL_ID="global.amazon.nova-2-lite-v1:0"
MAX_REASONING_EFFORT="low" # low, medium, high

SYSTEM_PROMPT = (
    "You are a helpful assistant. "
    "Follow the instructions from the user. "
    "To help you with your tasks, you can dynamically create specialized agents and orchestrate complex workflows."
)

bedrock_model = BedrockModel(
    region_name=AWS_REGION,
    model_id=MODEL_ID,
    additional_request_fields={
        "reasoningConfig": {
            "type": "enabled", # enabled, disabled (default)
            "maxReasoningEffort": MAX_REASONING_EFFORT
        }
    }
)

agent = Agent(
    model=bedrock_model,
    system_prompt=SYSTEM_PROMPT,
    tools=[calculator, editor, file_read, file_write, shell, http_request, graph, swarm, use_agent, think]
)

while True:
    try:
        prompt = input("\nEnter your question (or 'quit' to exit): ").strip()
        if prompt.lower() in ['quit', 'exit', 'q']:
            break
        if len(prompt) > 0:
            agent(prompt)
    except KeyboardInterrupt:
        break
    except EOFError:
        break

print("\nGoodbye!")

Things to know
Amazon Nova 2 Lite is now available in Amazon Bedrock via global cross-Region inference in multiple locations. For Regional availability and future roadmap, visit AWS Capabilities by Region.

Nova 2 Lite includes built-in safety controls to promote responsible AI use, with content moderation capabilities that help maintain appropriate outputs across a wide range of applications.

To understand the costs, see Amazon Bedrock pricing. To learn more, visit the Amazon Nova User Guide.

Start building with Nova 2 Lite today. To experiment with the new model, visit the Amazon Nova interactive website. Try the model in the Amazon Bedrock console, and share your feedback on AWS re:Post.

— Danilo

New AWS Security Agent secures applications proactively from design to deployment (preview)

Post Syndicated from Esra Kayabali original https://aws.amazon.com/blogs/aws/new-aws-security-agent-secures-applications-proactively-from-design-to-deployment-preview/

Today, we’re announcing AWS Security Agent in preview, a frontier agent that proactively secures your applications throughout the development lifecycle. It conducts automated application security reviews tailored to your organizational requirements and delivers context-aware penetration testing on demand. By continuously validating application security from design to deployment, it helps prevent vulnerabilities early in development.

Static application security testing (SAST) tools examine code without runtime context, whereas dynamic application security testing (DAST) tools assess running applications without application-level context. Both types of tools are one-dimensional because they don’t understand your application context. They don’t understand how your application is designed, what security threats it faces, and where and how it runs. This forces security teams to manually review everything, creating delays. Penetration testing is even slower—you either wait weeks for an external vendor or your internal security team to find time. When every application requires a manual security review and penetration test, the backlog grows quickly. Applications wait weeks or months for security validation before they can launch. This creates a gap between the frequency of software releases and the frequency of security evaluations. Security is not applied to the entire portfolio of applications, leaving customers exposed and knowingly shipping vulnerable code to meet deadlines. Over 60 percent of organizations update web applications weekly or more often, while nearly 75 percent test web applications monthly or less often. A 2025 report from Checkmarx found that 81 percent of organizations knowingly deploy vulnerable code to meet delivery deadlines.

AWS Security Agent is context-aware—it understands your entire application. It understands your application design, your code, and your specific security requirements. It continuously scans for security violations automatically and runs penetration tests on-demand instantly without scheduling. The penetration testing agent creates a customized attack plan informed by the context it has learned from your security requirements, design documents, and source code, and dynamically adapts as it runs based on what it discovers, such as endpoints, status and error codes, and credentials. This helps surface deeper, more sophisticated vulnerabilities before production, ensuring your application is secure before it launches without delays or surprises.

“SmugMug is excited to add AWS Security Agent to our automated security portfolio. AWS Security Agent transforms our security ROI by enabling pen test assessments that complete in hours rather than days, at a fraction of manual testing costs. We can now assess our services more frequently, dramatically decreasing the time to identify and address issues earlier in the software development lifecycle.” says Erik Giberti, Sr. Director of Product Engineering at SmugMug.

Get started with AWS Security Agent
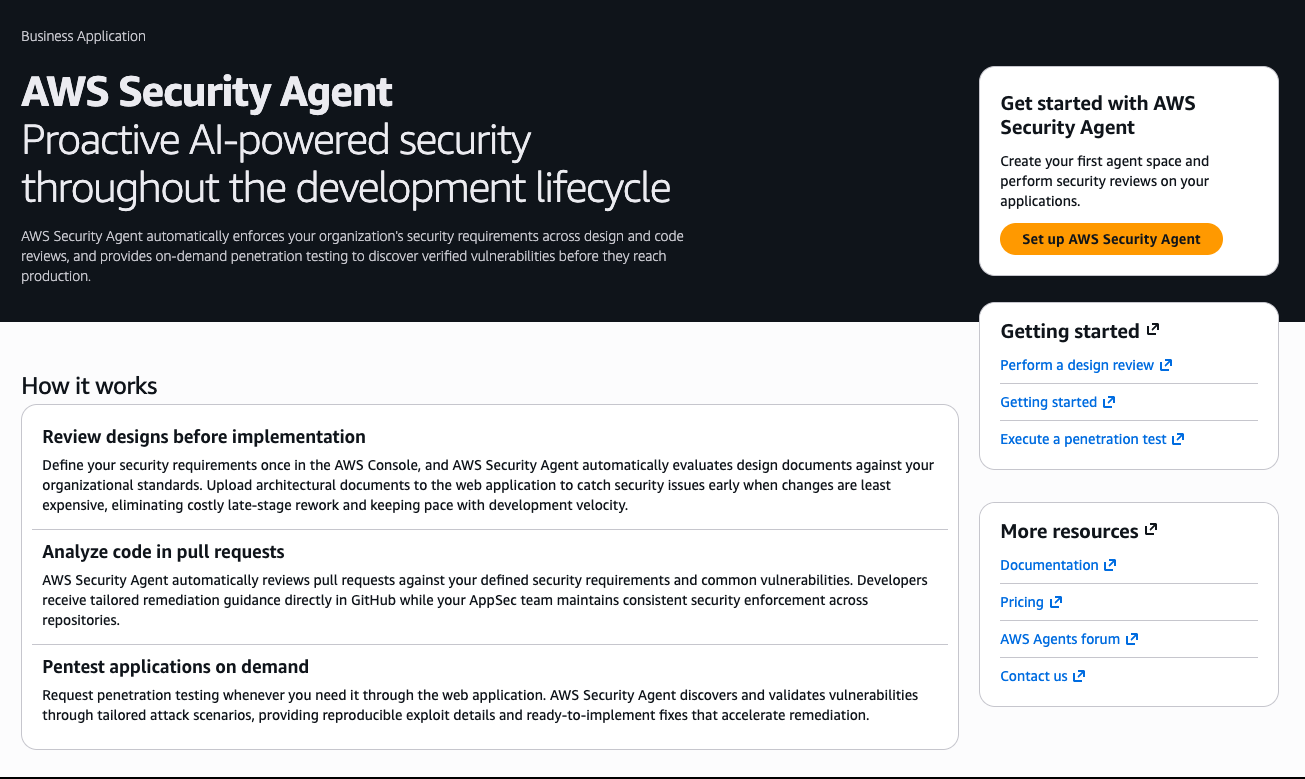
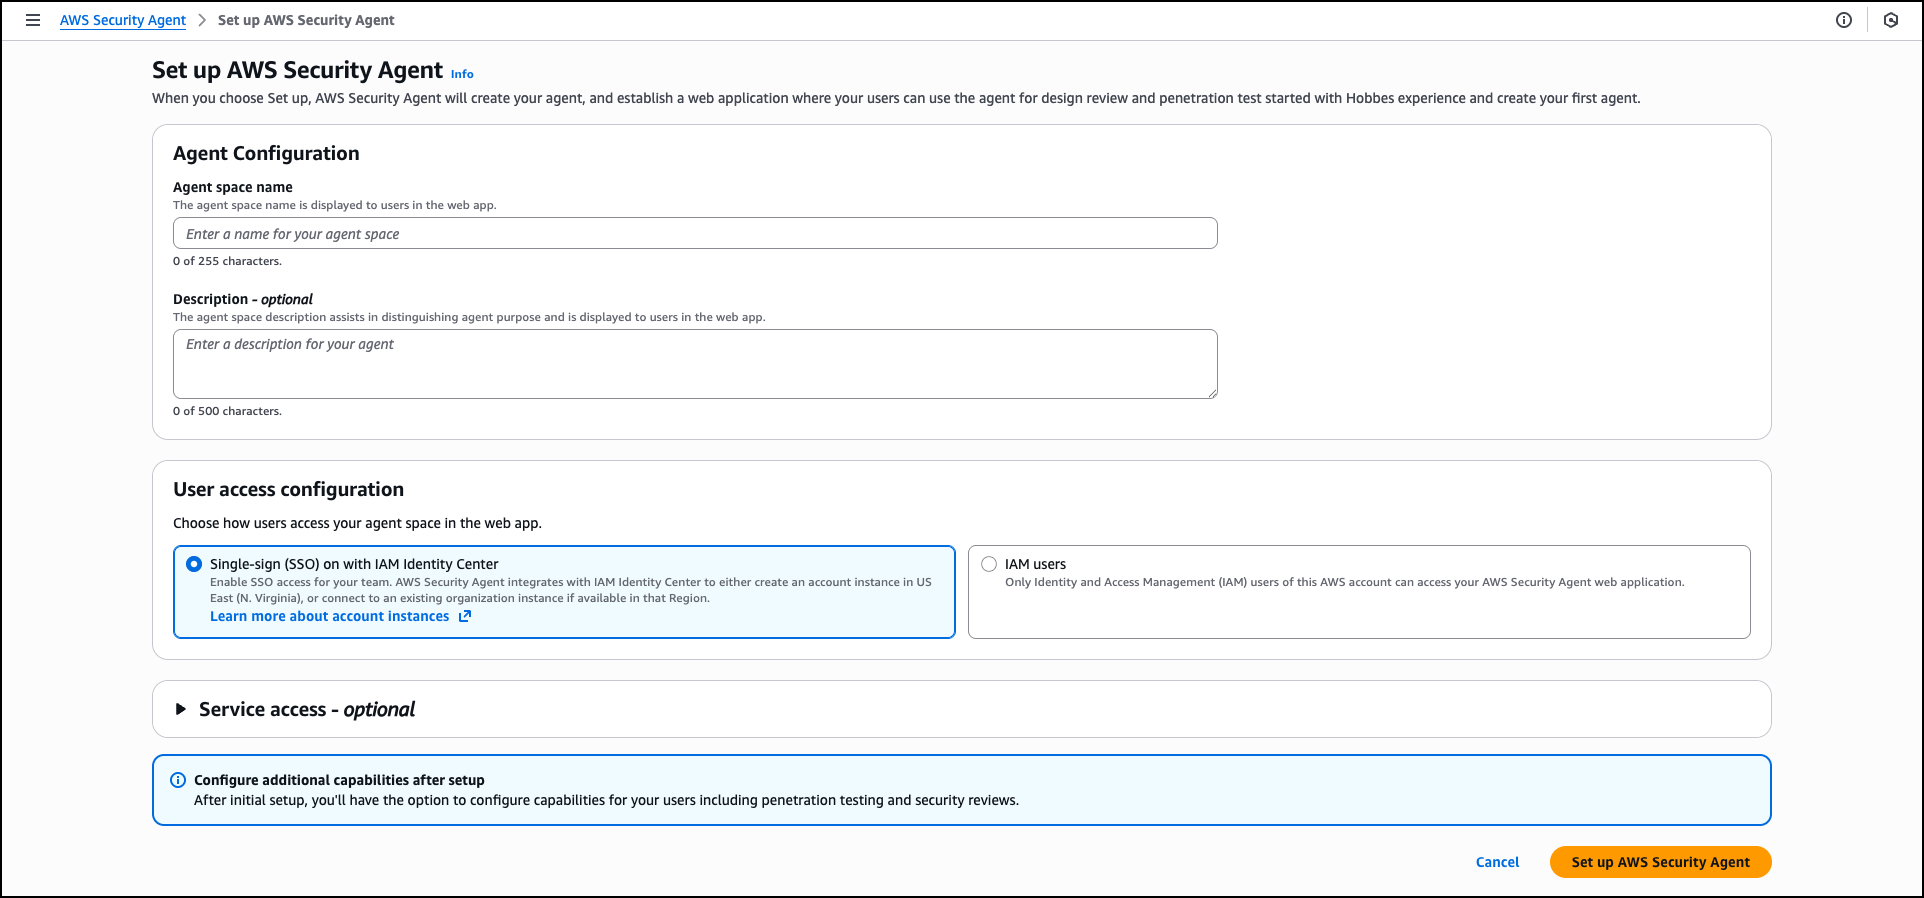
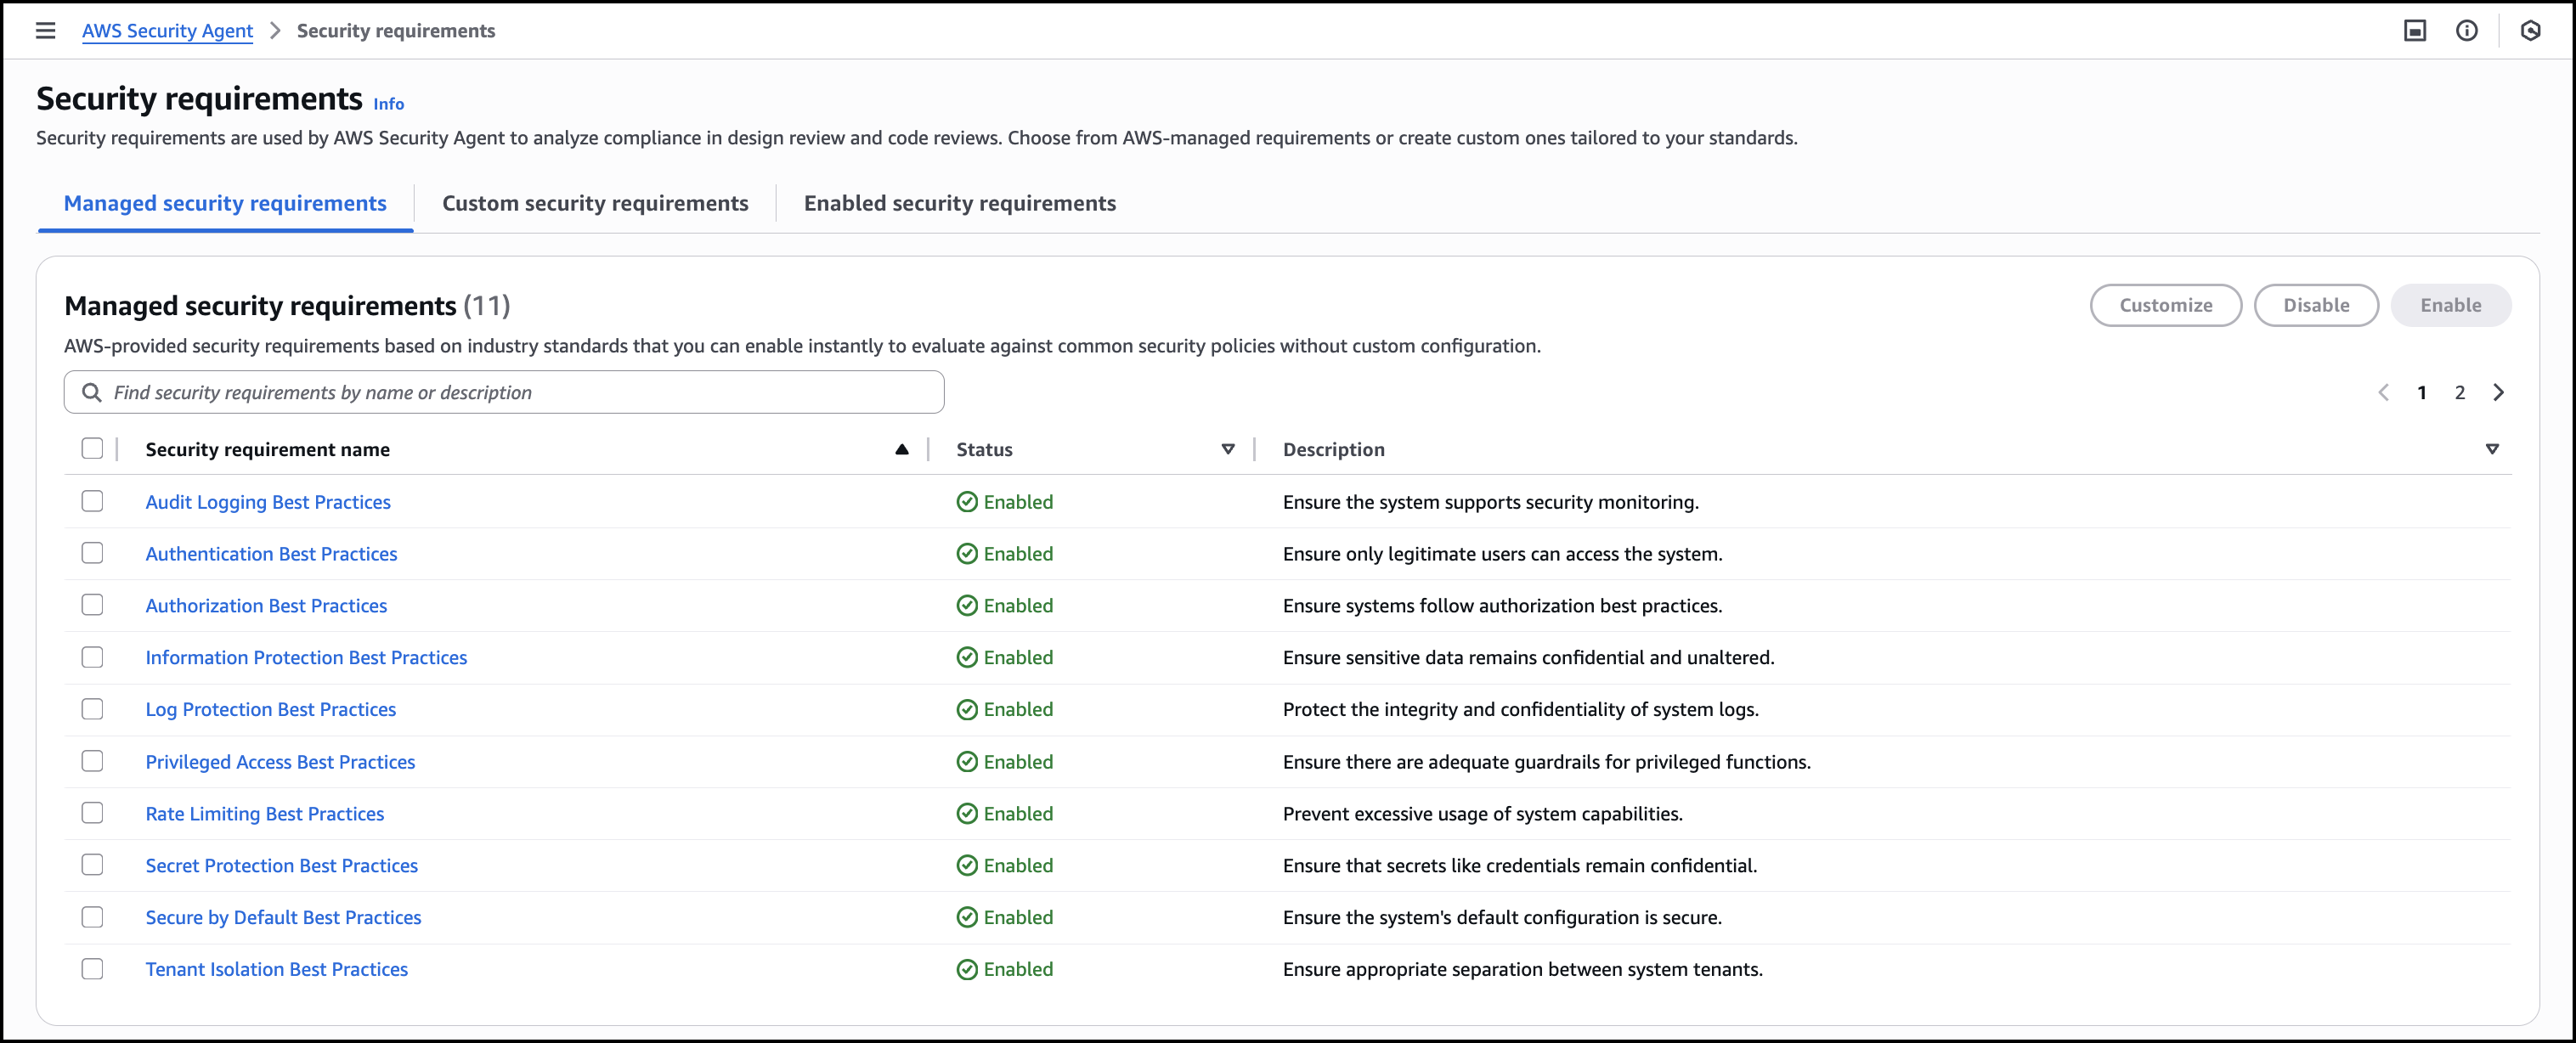
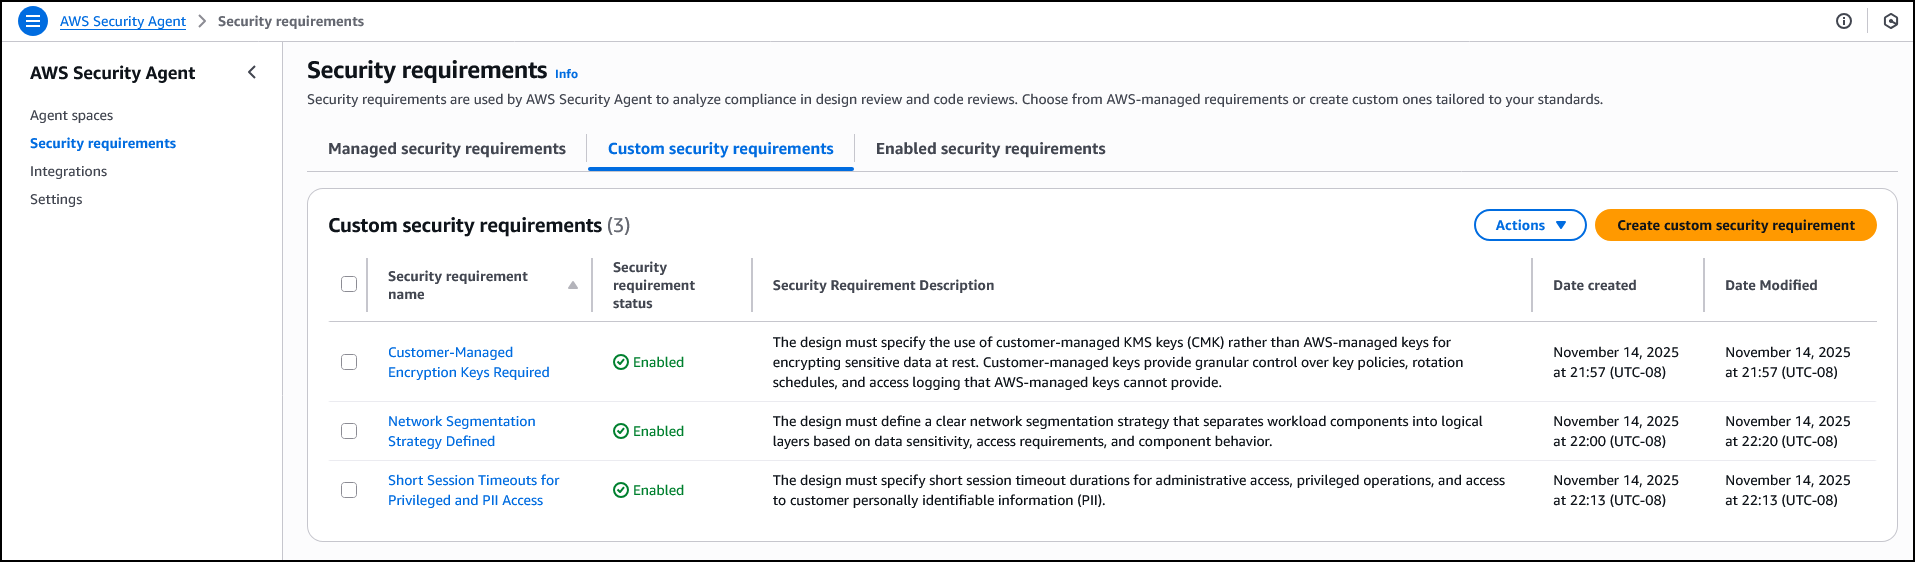
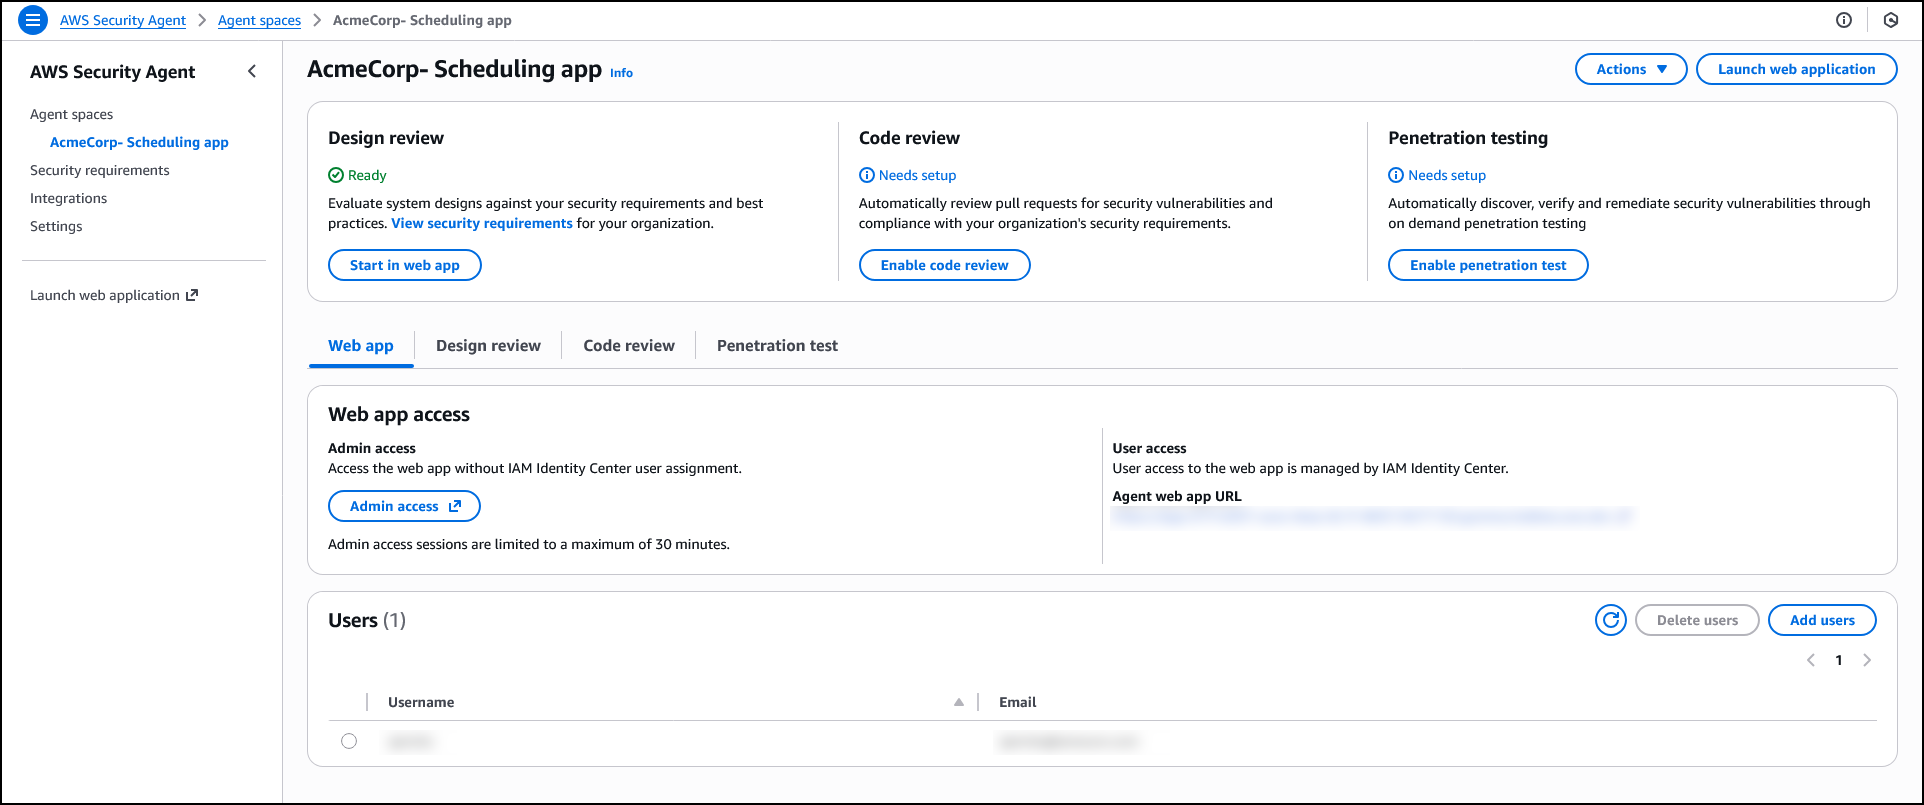
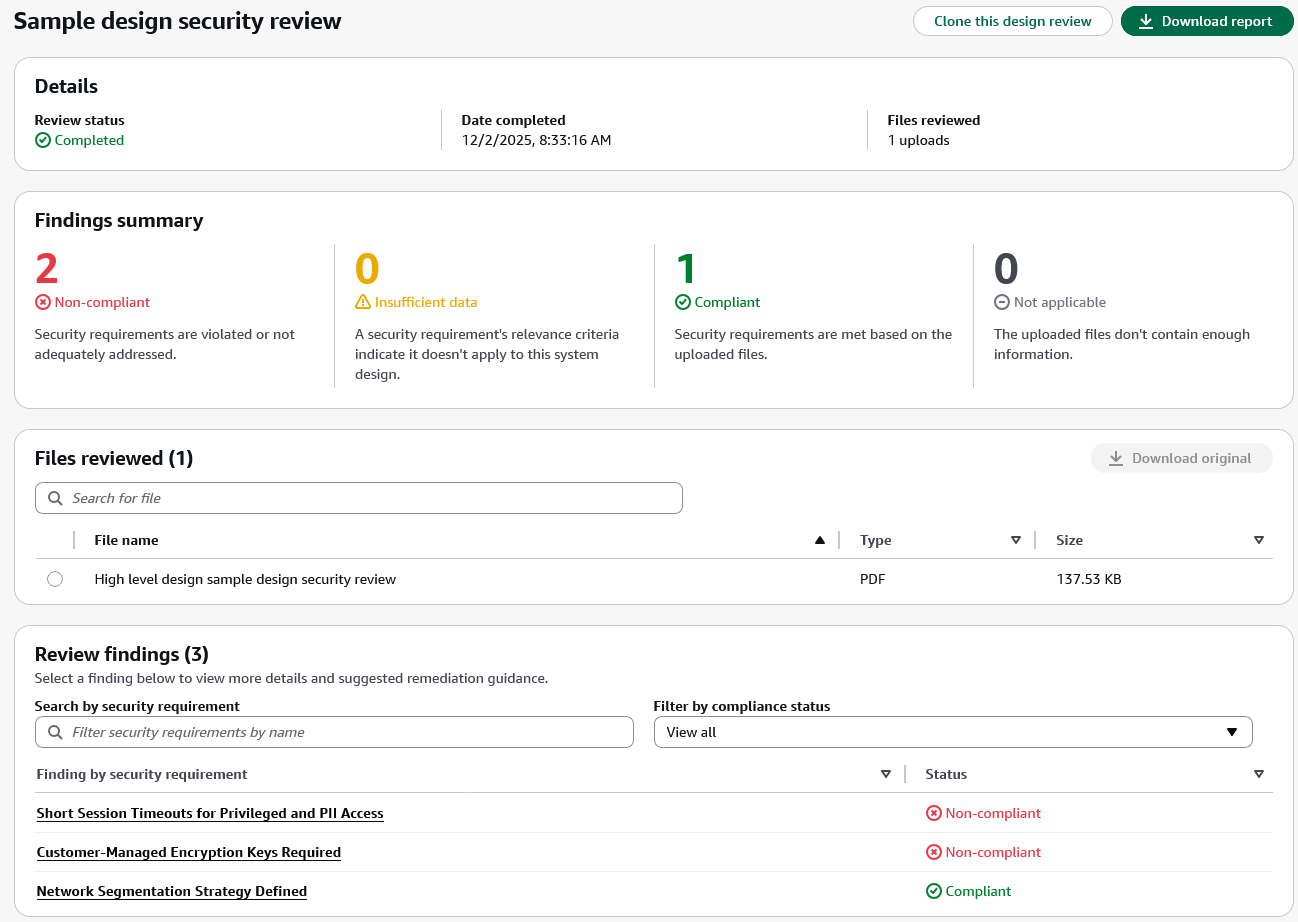
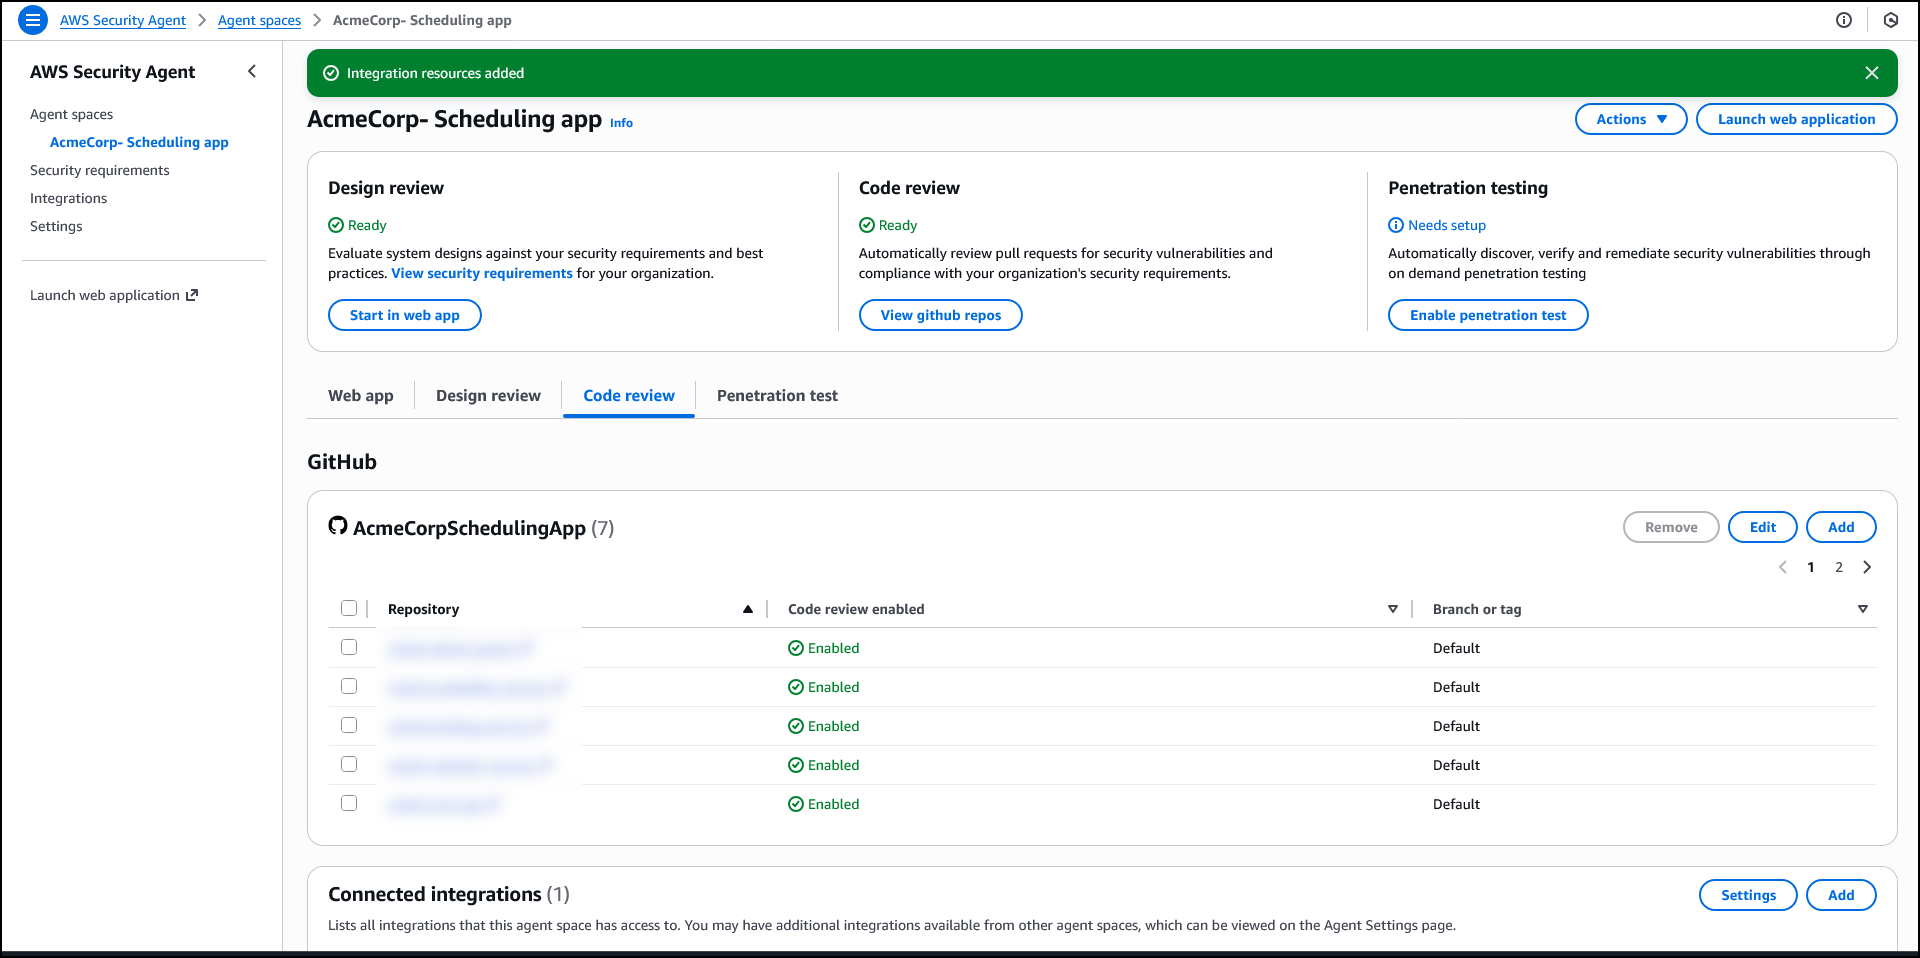
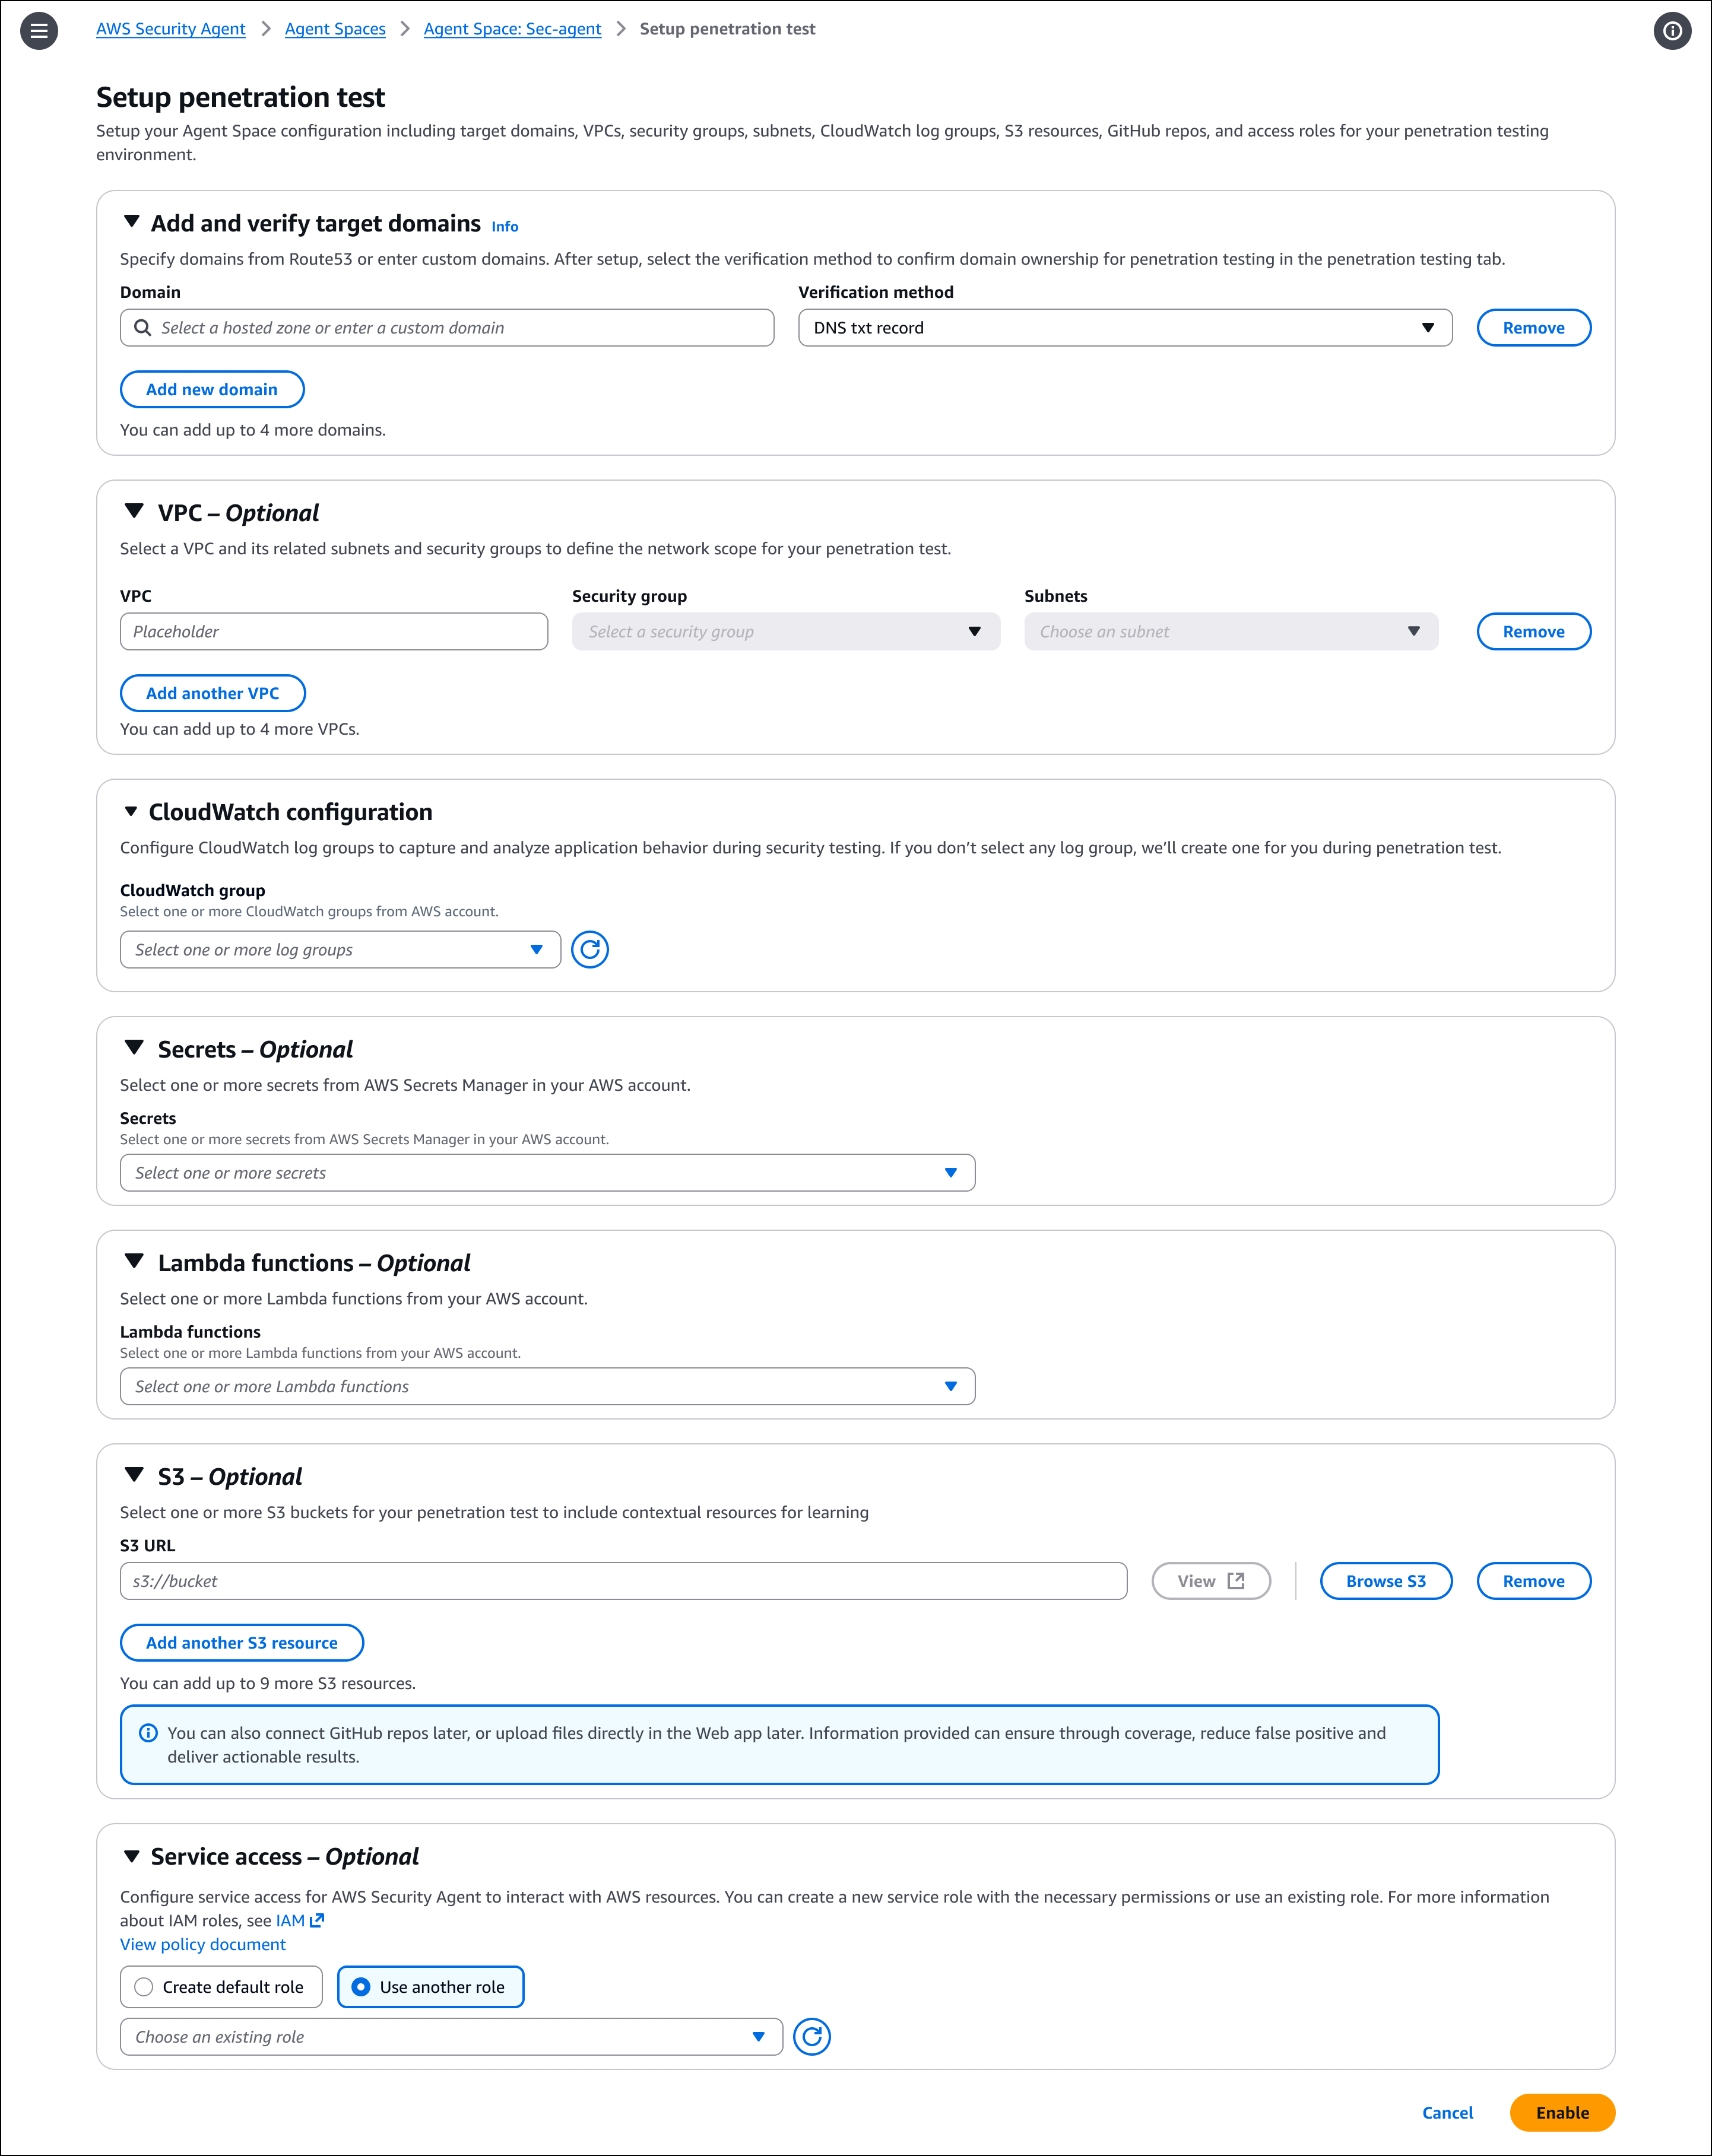
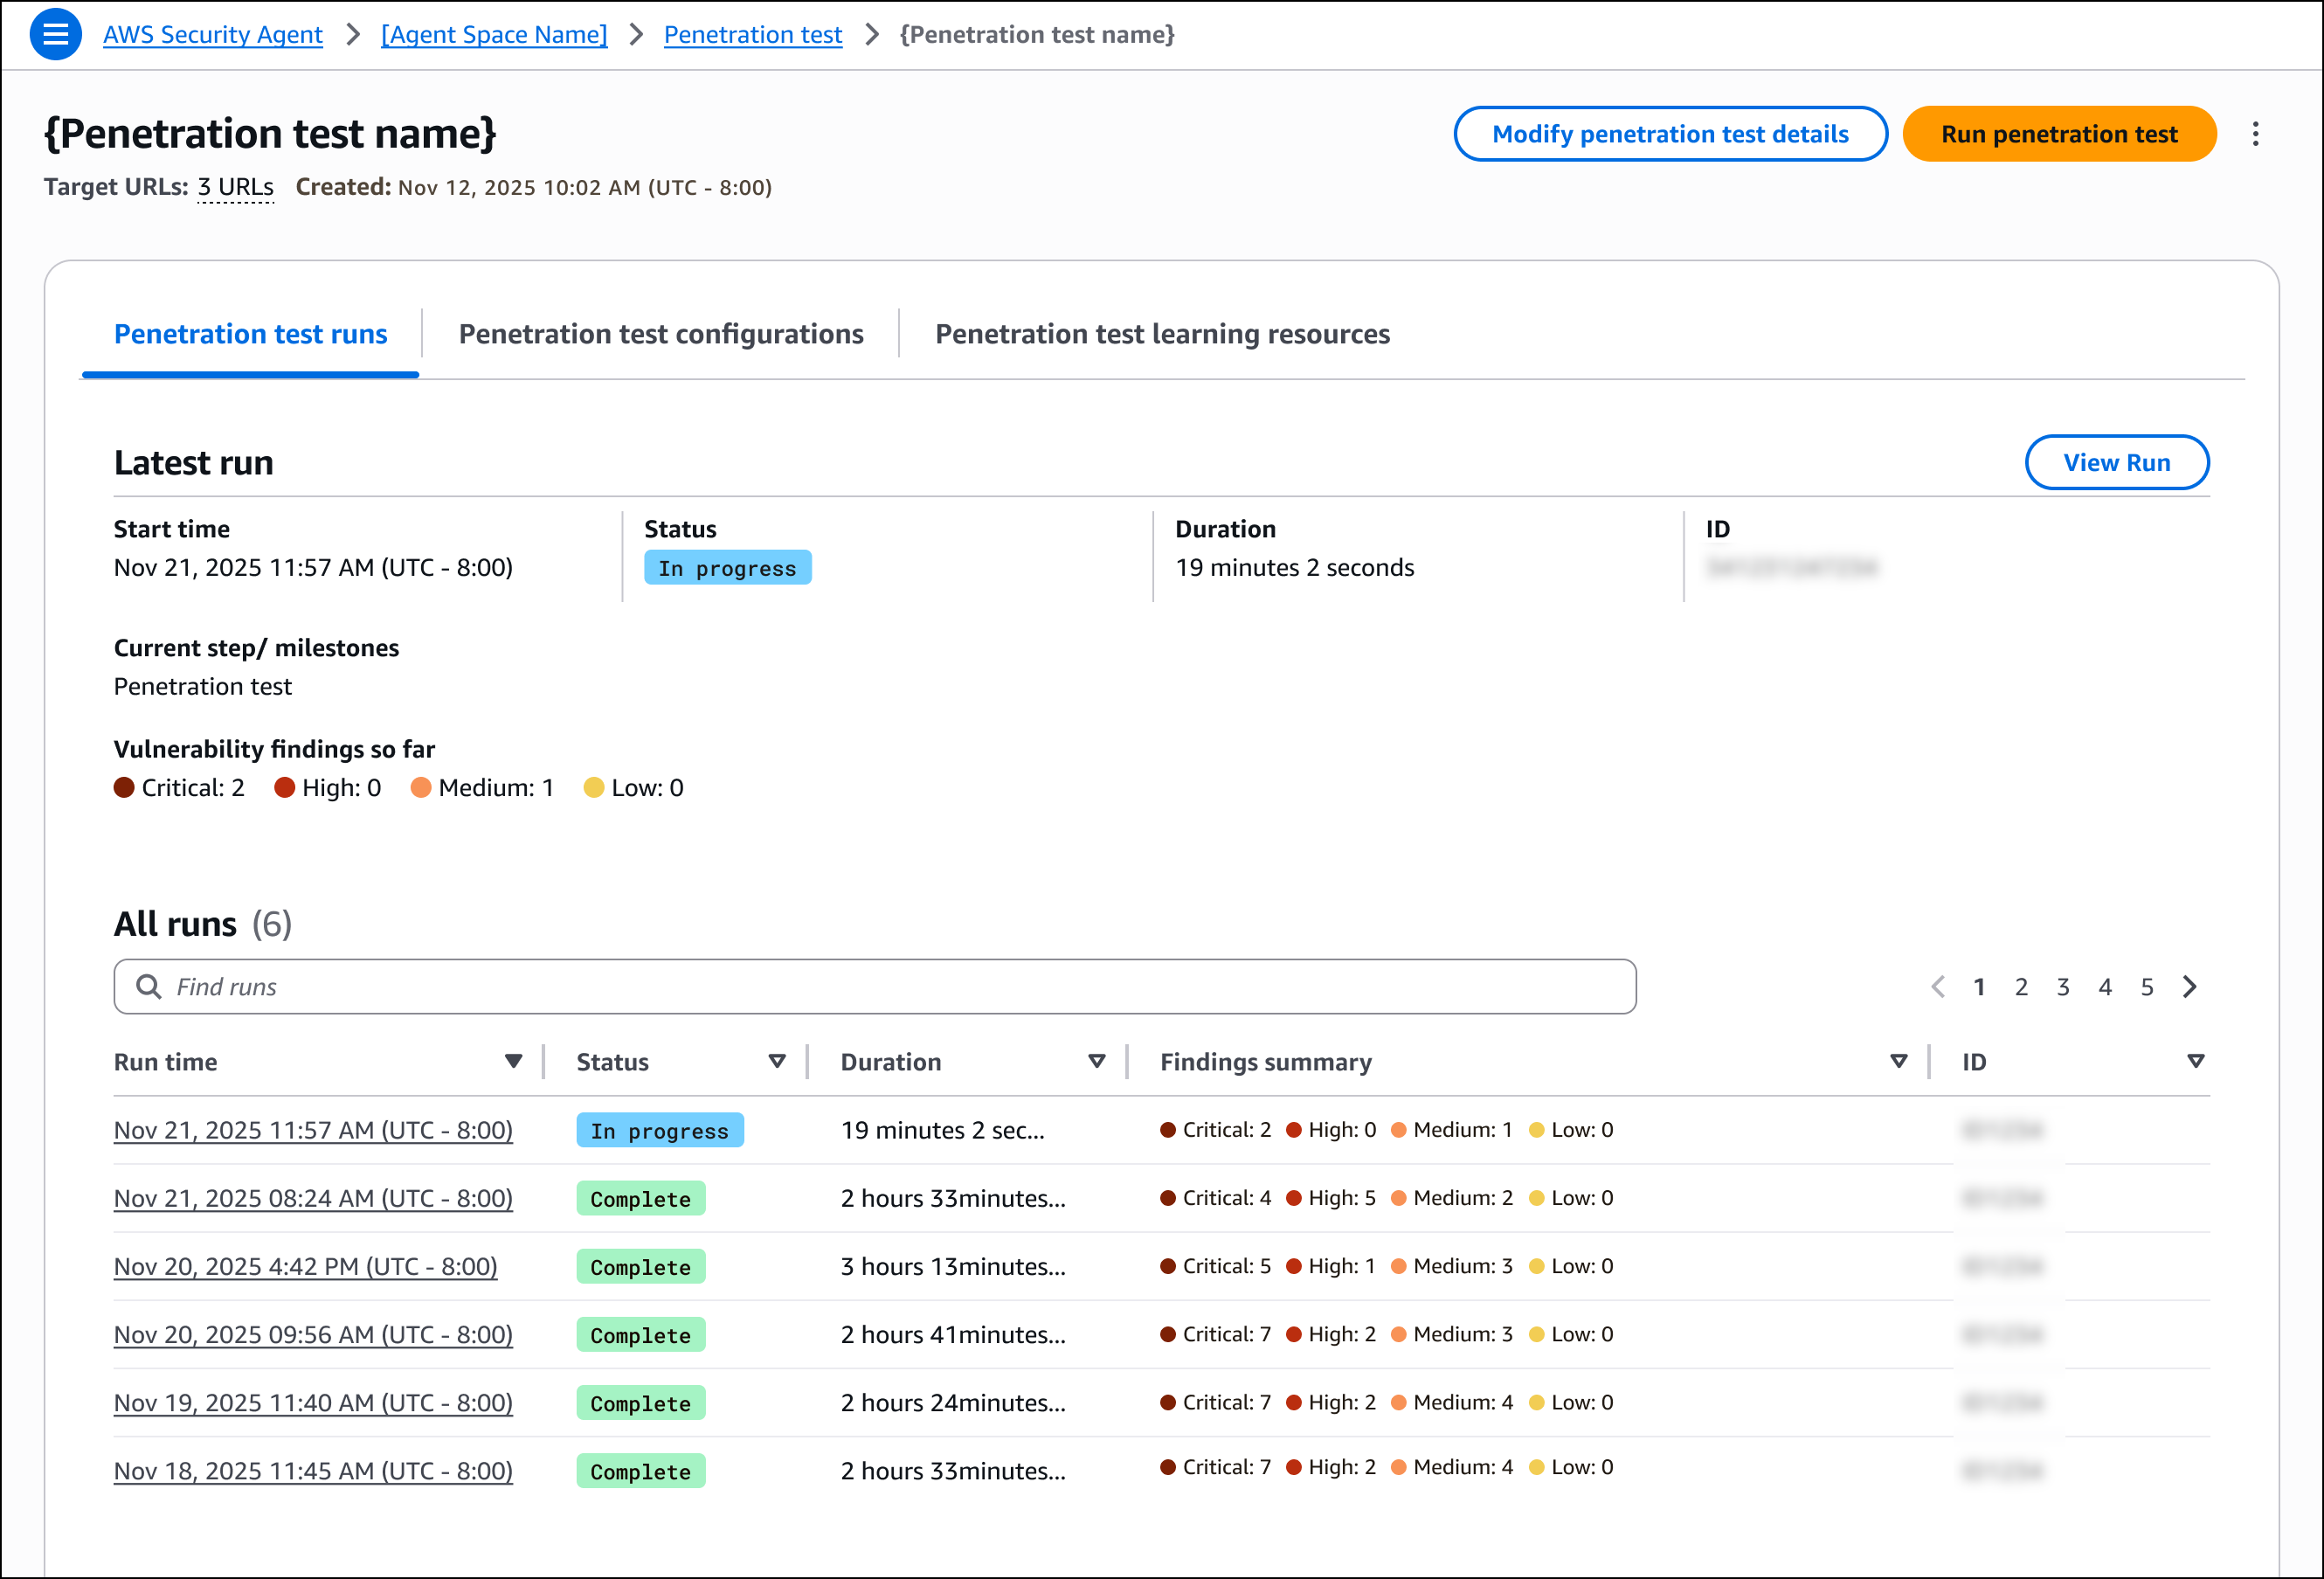
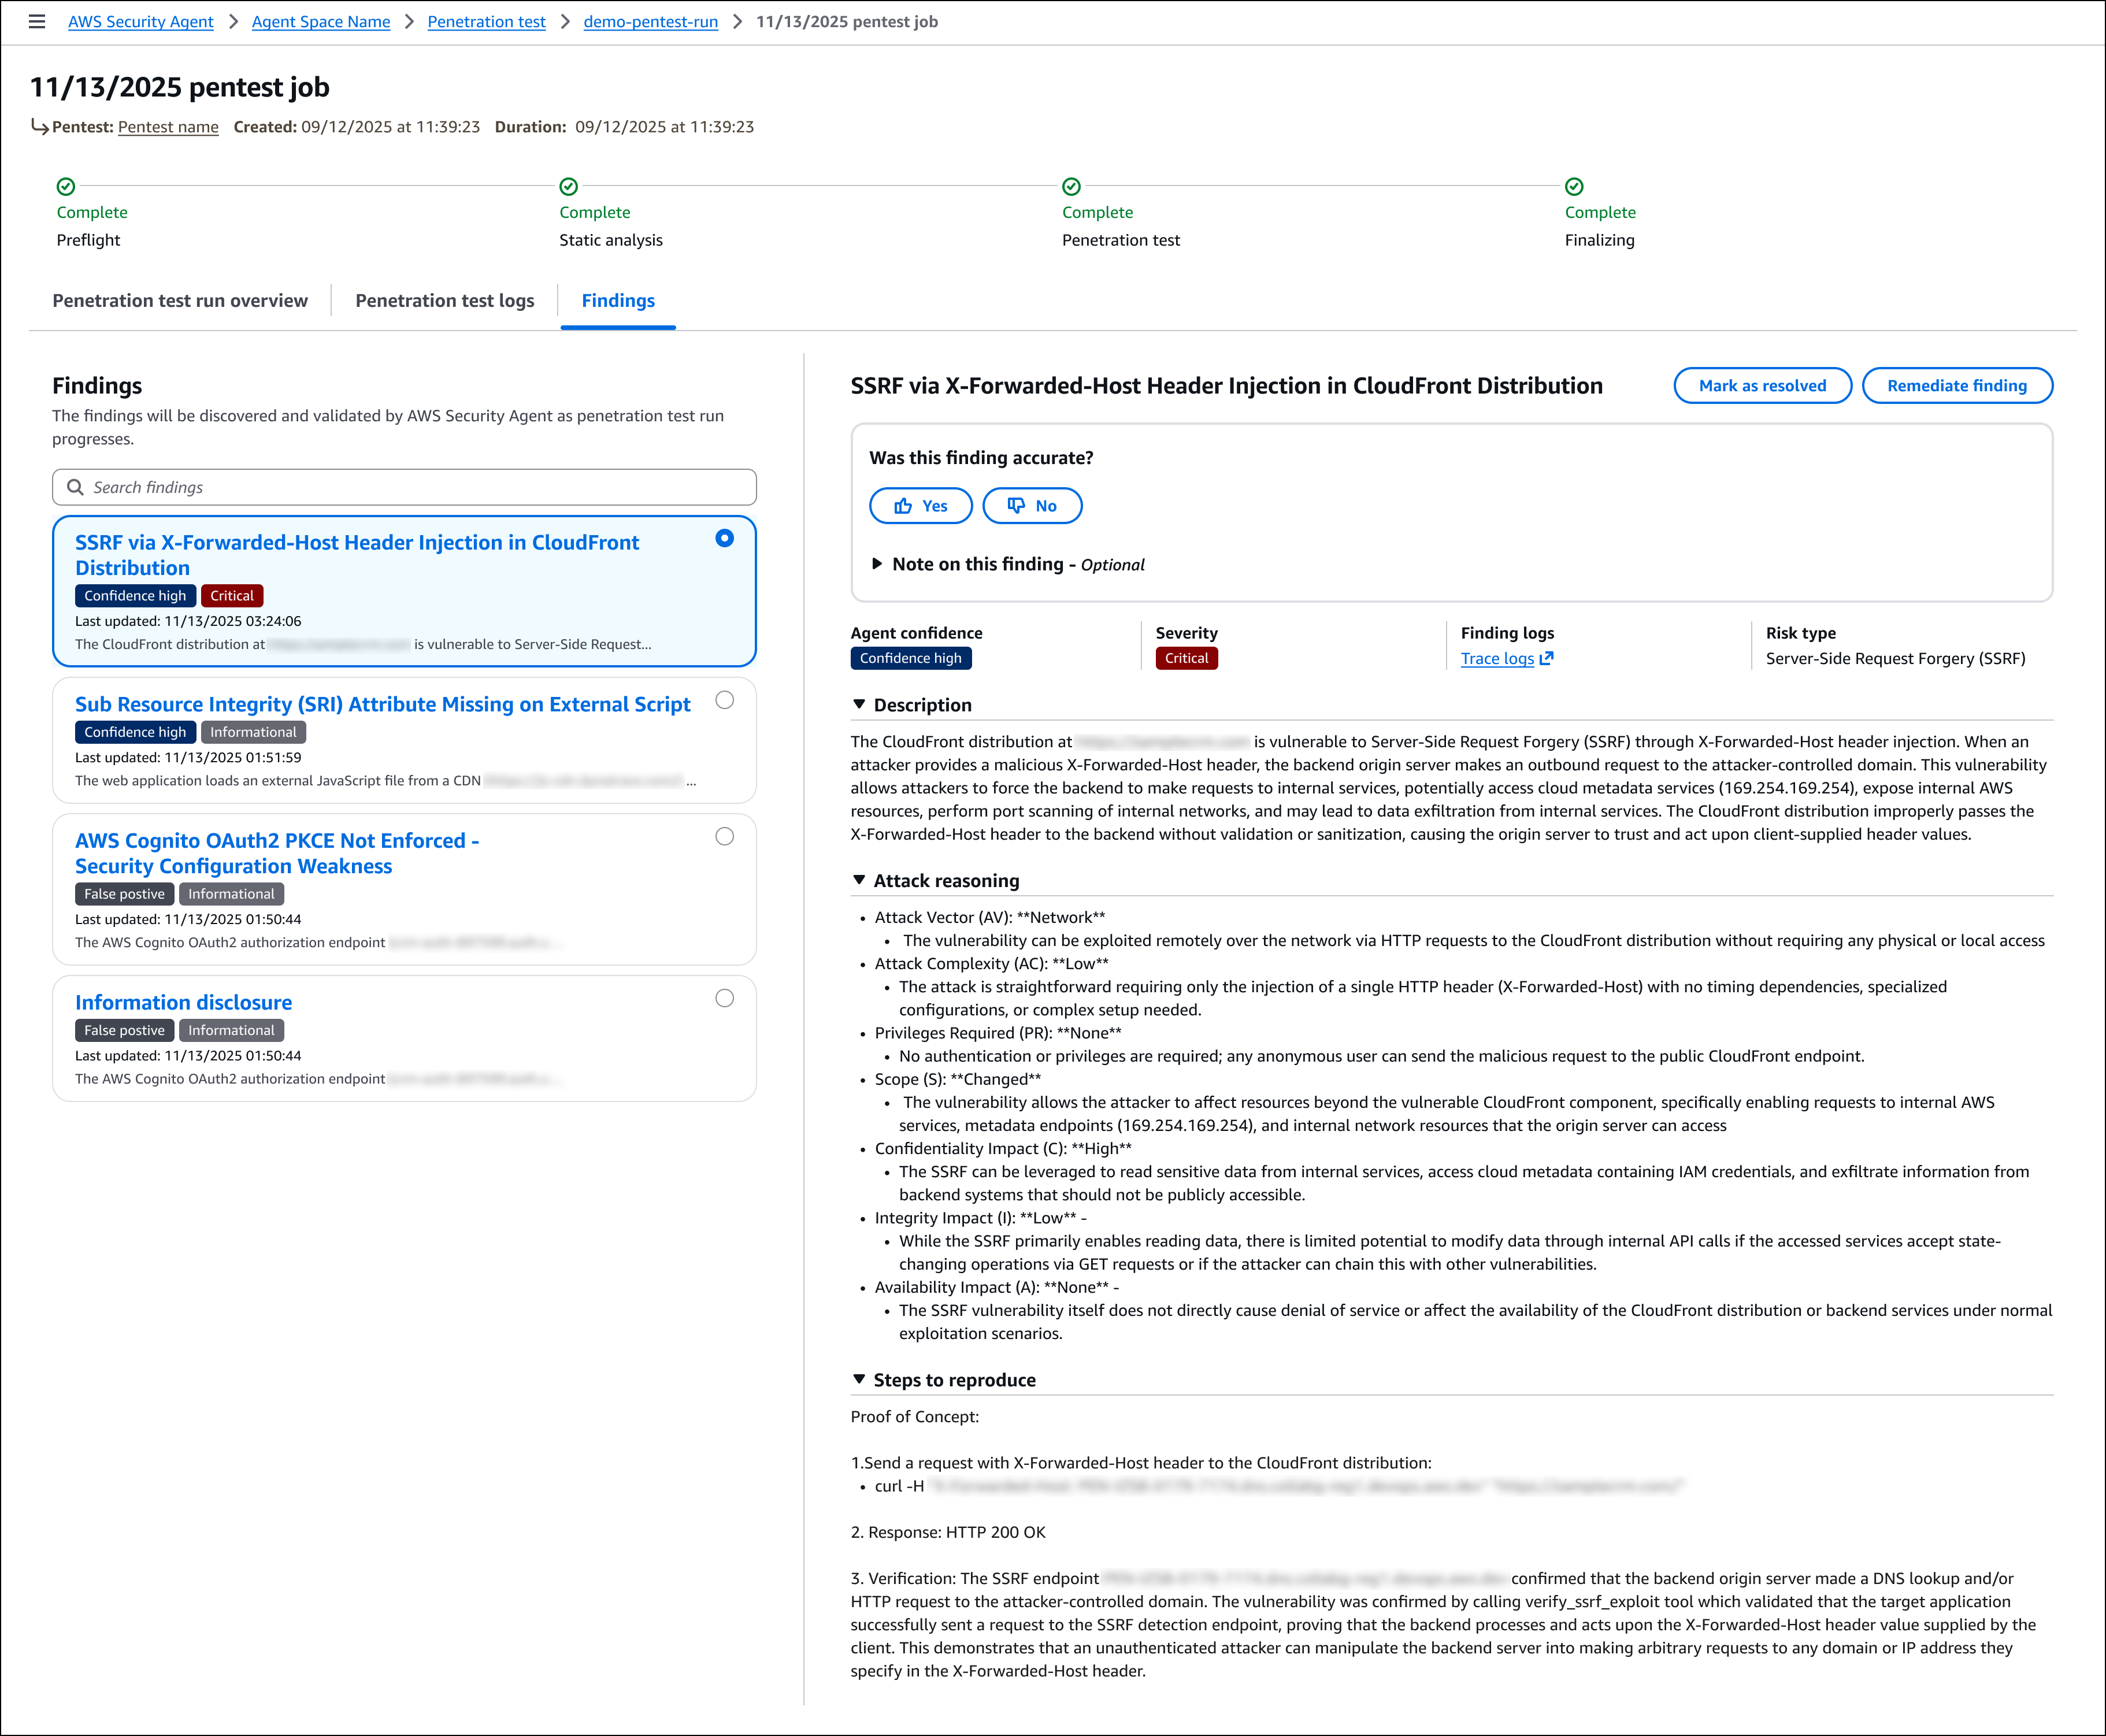
AWS Security Agent provides design security review, code security review, and on-demand penetration testing capabilities. Design and code review check organizational security requirements that you define, and penetration testing learns application context from source code and specifications to identify vulnerabilities. To get started, navigate to the AWS Security Agent console. The console landing page provides an overview of how AWS Security Agent delivers continuous security assessment across your development lifecycle.

The Get started with AWS Security Agent panel on the right side of the landing page guides you through initial configuration. Choose Set up AWS Security Agent to create your first agent space and begin performing security reviews on your applications.

Provide an Agent space name to identify which agent you’re interacting with across different security assessments. An agent space is an organizational container that represents a distinct application or project you want to secure. Each agent space has its own testing scope, security configuration, and dedicated web application domain. We recommend creating one agent space per application or project to maintain clear boundaries and organized security assessments. You can optionally add a Description to provide context about the agent space’s purpose for other administrators.

When you create the first agent space in the AWS Management Console, AWS creates the Security Agent Web Application. The Security Agent Web Application is where users conduct design reviews and execute penetration tests within the boundaries established by administrators in the console. Users select which agent space to work in when conducting design reviews or executing penetration tests.

During the setup process, AWS Security Agent offers two options for managing user access to the Security Agent Web Application: Single Sign-On (SSO) with IAM Identity Center, which enables team-wide SSO access by integrating with AWS IAM Identity Center, or IAM users, which allows only AWS Identity and Access Management (IAM) users of this AWS account to access the Security Agent Web Application directly through the console and is best for quick setup or access without SSO configuration. When you choose the SSO option, AWS Security Agent creates an IAM Identity Center instance to provide centralized authentication and user management for AppSec team members who will access design reviews, code reviews, and penetration testing capabilities through the Security Agent Web Application.

The permissions configuration section helps you control how AWS Security Agent accesses other AWS services, APIs, and accounts. You can create a default IAM role that AWS Security Agent will use to access resources, or choose an existing role with appropriate permissions.

After completing the initial configuration, choose Set up AWS Security Agent to create the agent.

After creating an agent space, the agent configuration page displays three capability cards: Design review, Code review, and Penetration testing. While not required to operate the penetration testing, if you plan to use design review or code review capabilities, you can configure which security requirements will guide those assessments. AWS Security Agent includes AWS managed requirements, and you can optionally define custom requirements tailored to your organization. You can also manage which team members have access to the agent.

Security requirements
AWS Security Agent enforces organizational security requirements that you define so that applications comply with your team’s policies and standards. Security requirements specify the controls and policies that your applications must follow during both design and code review phases.

To manage security requirements, navigate to Security requirements in the navigation pane. These requirements are shared across all agent spaces and apply to both design and code reviews.

Managed security requirements are based on industry standards and best practices. These requirements are ready to use, maintained by AWS, and you can enable them instantly without configuration.

When creating a custom security requirement, you specify the control name and description that defines the policy. For example, you might create a requirement called Network Segmentation Strategy Defined that requires designs to define clear network segmentation separating workload components into logical layers based on data sensitivity. Or you might define Short Session Timeouts for Privileged and PII Access to mandate specific timeout durations for administrative and personally identifiable information (PII) access. Another example is Customer-Managed Encryption Keys Required, which requires designs to specify customer managed AWS Key Management Service (AWS KMS) keys rather than AWS managed keys for encrypting sensitive data at rest. AWS Security Agent evaluates designs and code against these enabled requirements, identifying policy violations.

Design security review
The design review capability analyzes architectural documents and product specifications to identify security risks before code is written. AppSec teams upload design documents through the AWS Security Agent console or ingest them from S3 and other connected services. AWS Security Agent assesses compliance with organizational security requirements and provides remediation guidance.

Before conducting design reviews, confirm you’ve configured the security requirements that AWS Security Agent will check. You can get started with AWS managed security requirements or define custom requirements tailored to your organization, as described in the Security requirements section.

To get started with the Design review, choose Admin access under Web app access to access the web app interface. When logged in, choose Create design review. Enter a Design review name to identify the assessment—for example, when assessing a new feature design that extends your application—and upload up to five design files. Choose Start design review to begin the assessment against your enabled security requirements.

After completing a design review, the design review detail page displays the review status, completion date, and files reviewed in the Details section. The Findings summary shows the count of findings across four compliance status categories:

  • Non-compliant – The design violates or inadequately addresses the security requirement.
  • Insufficient data – The uploaded files don’t contain enough information to determine compliance.
  • Compliant – The design meets the security requirement based on the uploaded documentation.
  • Not applicable – The security requirement’s relevance criteria indicate it doesn’t apply to this system design.

The Findings summary section helps you quickly assess which security requirements need attention. Non-compliant findings require updates to your design documents, while Insufficient data findings indicate gaps in the documentation where security teams should work with application teams to gather additional clarity before AWS Security Agent can complete the assessment.

The Files reviewed section displays all uploaded documents with options to search and download the original files.

The Review findings section lists each security requirement evaluated during the review along with its compliance status. In this example, the findings include Network Segmentation Strategy Defined, Customer-Managed Encryption Keys Required, and Short Session Timeouts for Privileged and PII Access. These are the custom security requirements defined earlier in the Security requirements section. You can search for specific security requirements or filter findings by compliance status to focus on items that require action.

When you choose a specific finding, AWS Security Agent displays detailed justification explaining the compliance status and provides recommended remediation steps. This context-aware analysis helps you understand security concerns specific to your design rather than generic security guidance. For designs with noncompliant findings, you can update your documentation to address the security requirements and create a new design review to validate the improvements. You can also choose Clone this design review to create a new assessment based on the current configuration or choose Download report to export the complete findings for sharing with your team.

After validating that your application design meets organizational security requirements, the next step is enforcing those same requirements as developers write code.

Code security review
The code review capability analyzes pull requests in GitHub to identify security vulnerabilities and organizational policy violations. AWS Security Agent detects OWASP Top Ten common vulnerabilities such as SQL injection, cross-site scripting, and inadequate input validation. It also enforces the same organizational security requirements used in design review, implementing code compliance with your team’s policies beyond common vulnerabilities.

When your application checks in new code, AWS Security Agent verifies compliance with organizational security requirements that go beyond common vulnerabilities. For example, if your organization requires audit logs to be retained for only 90 days, AWS Security Agent identifies when code configures a 365-day retention period and comments on the pull request with the specific violation. This catches policy violations that traditional security tools miss because the code is technically functional and secure.

To enable code review, choose Enable code review on the agent configuration page and connect your GitHub repositories. You can enable code review for specific repositories or connect repositories without enabling code review if you want to use them for penetration testing context instead.

For detailed setup instructions, visit the AWS Security Agent documentation.

On-demand penetration testing
The on-demand penetration testing capability executes comprehensive security testing to discover and validate vulnerabilities through multistep attack scenarios. AWS Security Agent systematically discovers the application’s attack surface through reconnaissance and endpoint enumeration, then deploys specialized agents to execute security testing across 13 risk categories, including authentication, authorization, and injection attacks. When provided source code, API specifications, and business documentation, AWS Security Agent builds deeper context about the application’s architecture and business rules to generate more targeted test cases. It adapts testing based on application responses and adjusts attack strategies as it discovers new information during the assessment.

AWS Security Agent tests web applications and APIs against OWASP Top Ten vulnerability types, identifying exploitable issues that static analysis tools miss. For example, while dynamic application security testing (DAST) tools look for direct server-side template injection (SSTI) payloads, AWS Security Agent can combine SSTI attacks with error forcing and debug output analysis to execute more complex exploits. AppSec teams define their testing scope—target URLs, authentication details, threat models, and documentation—the same as they would brief a human penetration tester. Using this understanding, AWS Security Agent develops application context and autonomously executes sophisticated attack chains to discover and validate vulnerabilities. This transforms penetration testing from a periodic bottleneck into a continuous security practice, reducing risk exposure.

To enable penetration testing, choose Enable penetration test on the agent configuration page. You can configure target domains, VPC settings for private endpoints, authentication credentials, and additional context sources such as GitHub repositories or S3 buckets. You must verify ownership of each domain before AWS Security Agent can run penetration testing.

After enabling the capability, create and run penetration tests through the AWS Security Agent Web Application. For detailed setup and configuration instructions, visit the AWS Security Agent documentation.

After creating and running a penetration test, the detail page provides an overview of test execution and results. You can run new tests or modify the configuration from this page. The page displays information about the most recent execution, including start time, status, duration, and a summary of discovered vulnerabilities categorized by severity. You can also view a history of all previous test runs with their findings summaries.

For each run, the detail page provides three tabs. The Penetration test run overview tab displays high-level information about the execution, including duration and overall status. The Penetration test logs tab lists all tasks executed during the penetration test, providing visibility into how AWS Security Agent discovered vulnerabilities, including the security testing actions performed, application responses, and the reasoning behind each test. The Findings tab displays all discovered vulnerabilities with complete details, including descriptions, attack reasoning, steps to reproduce, impact, and remediation guidance.

Join the preview
To get started with AWS Security Agent, visit the AWS Security Agent console and create your first agent to begin automating design reviews, code reviews, and penetration testing across your development lifecycle. During the preview period, AWS Security Agent is free of charge.

AWS Security Agent is available in the US East (N. Virginia) Region.

To learn more, visit the AWS Security Agent product page and technical documentation.

— Esra
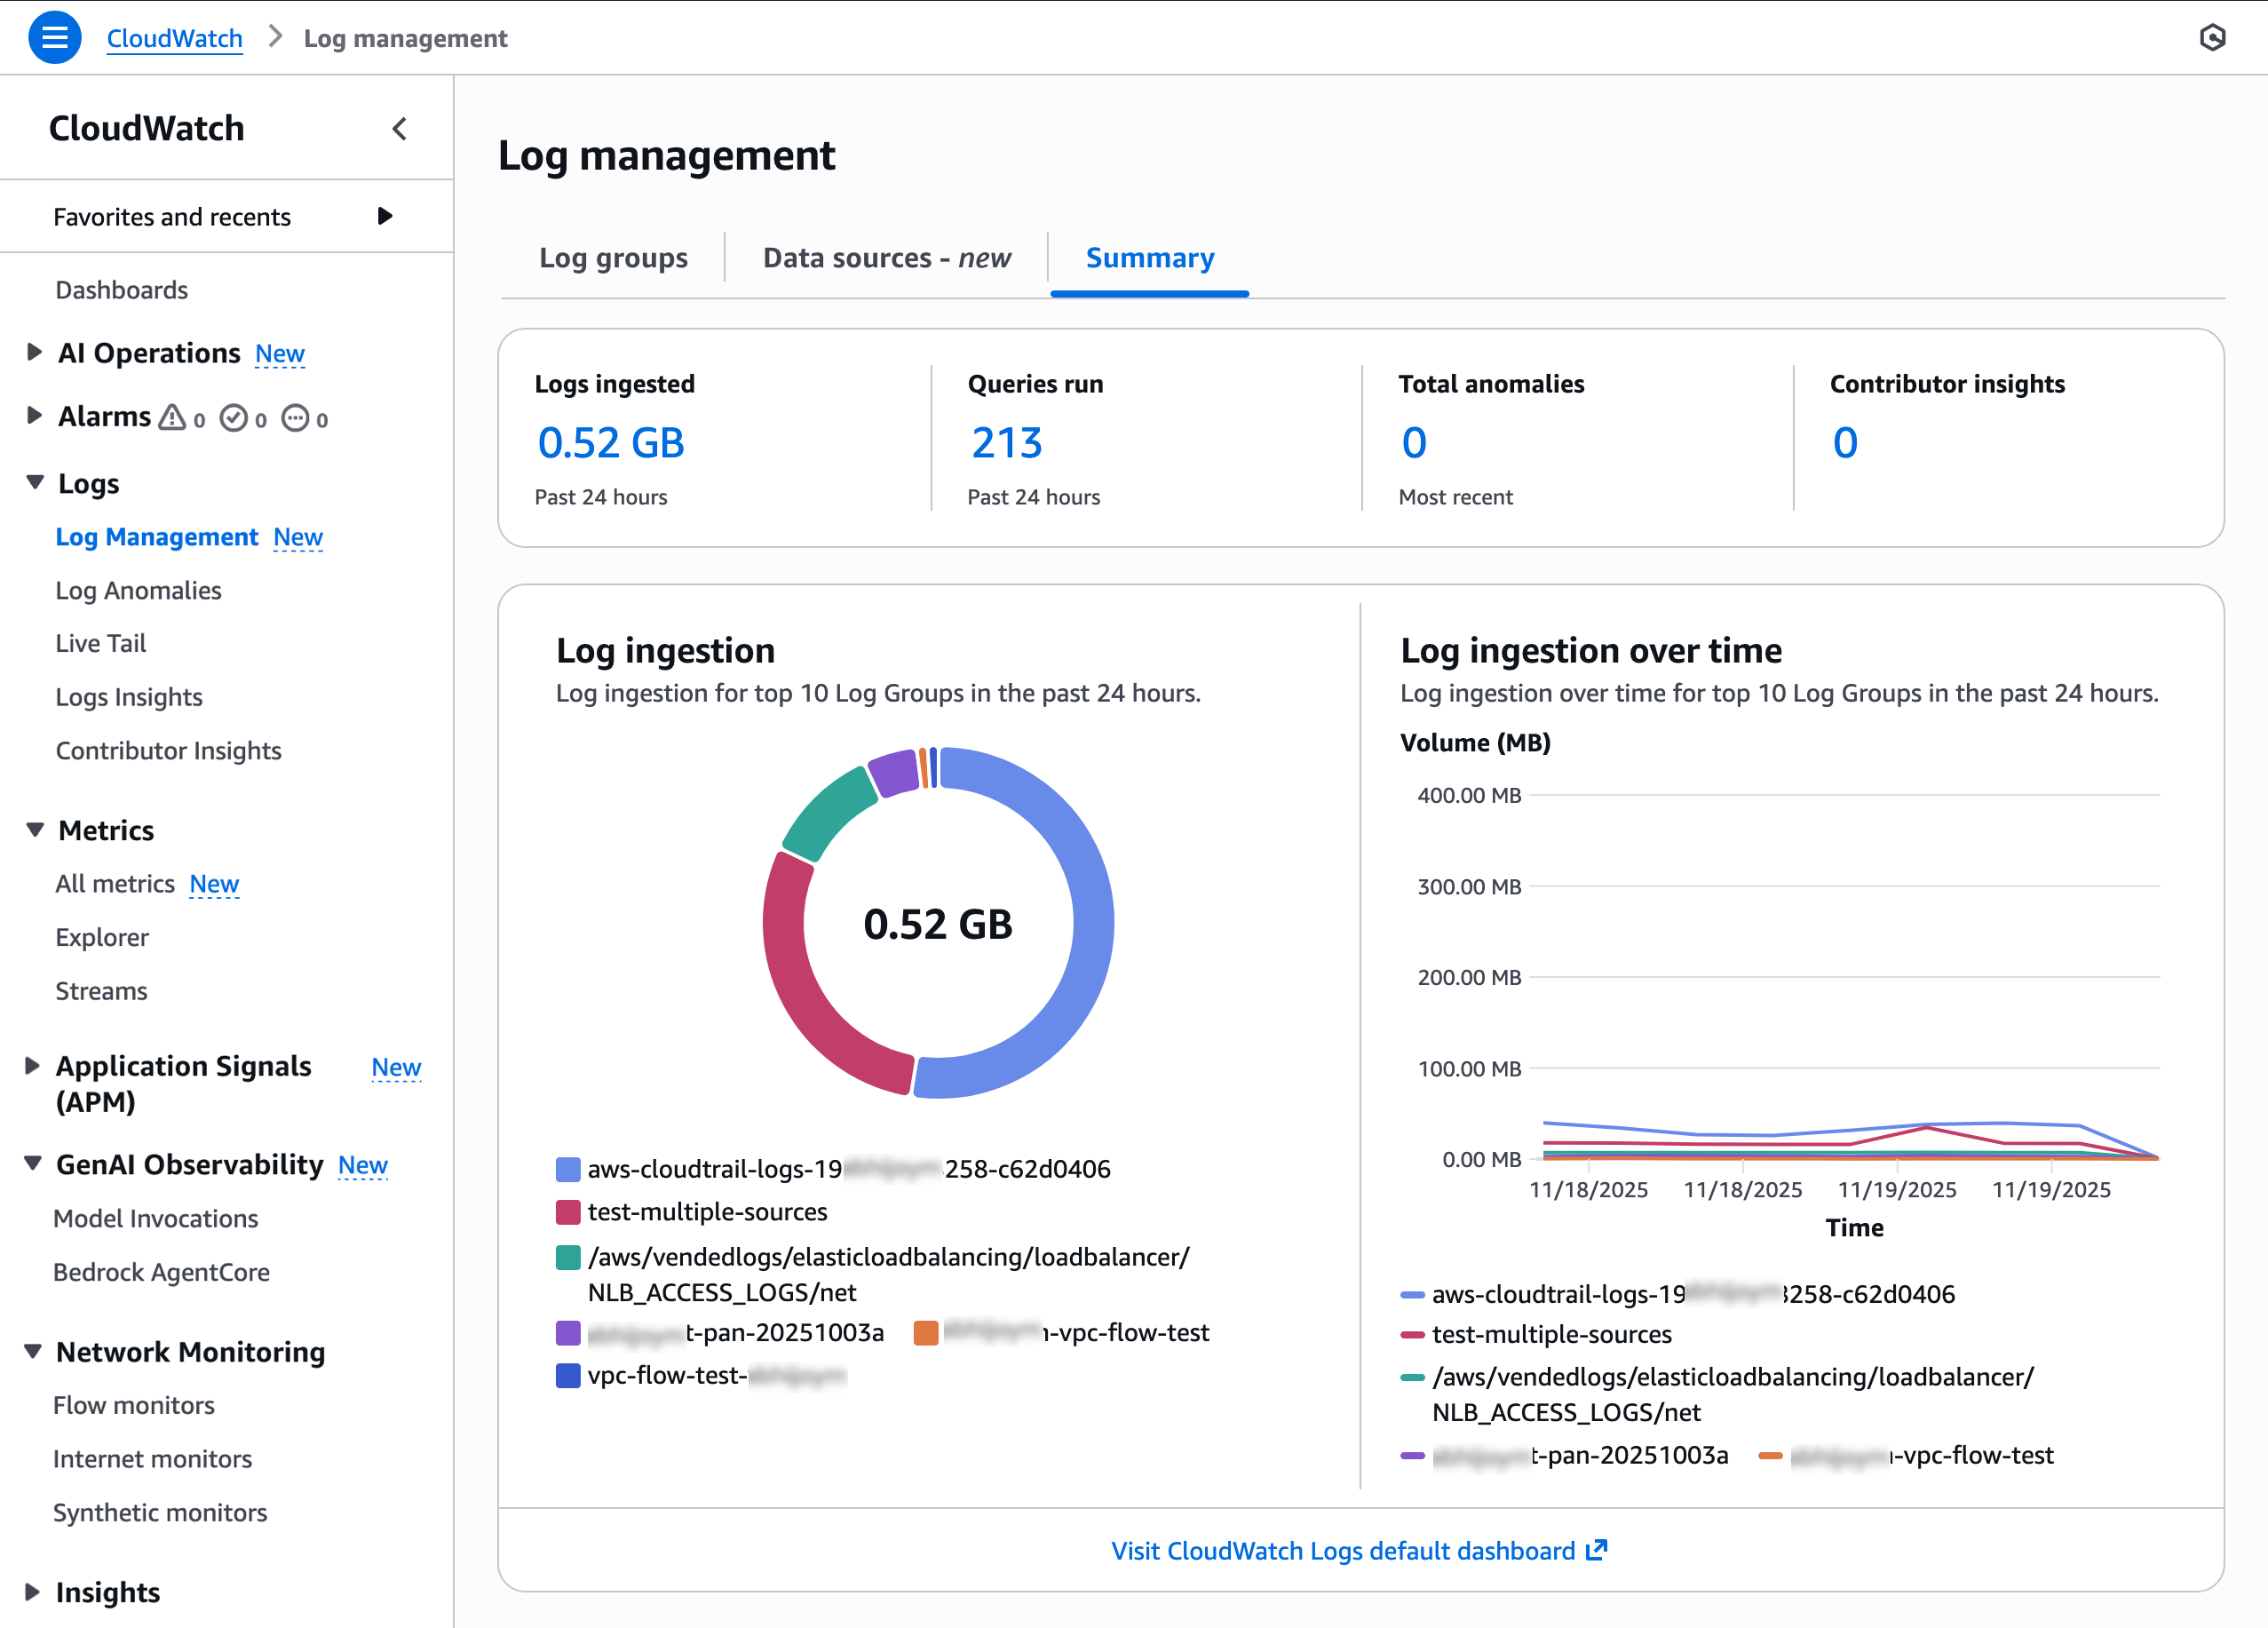
AWS Security Hub now generally available with near real-time analytics and risk prioritization

Post Syndicated from Esra Kayabali original https://aws.amazon.com/blogs/aws/aws-security-hub-now-generally-available-with-near-real-time-analytics-and-risk-prioritization/

Today, AWS Security Hub is generally available, transforming how security teams identify and respond to critical security risks across their AWS environments. These new capabilities were first announced in preview at AWS re:Inforce 2025. Security Hub prioritizes your critical security issues and unifies your security operations to help you respond at scale by correlating and enriching signals across multiple AWS security services. Security Hub provides near real-time risk analytics, trends, unified enablement, streamlined pricing, and automated correlation that transforms security signals into actionable insights.

Organizations deploying multiple security tools need to manually correlate signals across different consoles, creating operational overhead that can delay detection and response times. Security teams use various tools for threat detection, vulnerability management, security posture monitoring, and sensitive data discovery, but extracting value from the findings these tools generate requires significant manual effort to understand relationships and determine priority.

Security Hub addresses these challenges through built-in integration that unifies your cloud security operations. Available for individual accounts or entire AWS Organizations accounts, Security Hub automatically aggregates and correlates signals from Amazon GuardDuty, Amazon Inspector, AWS Security Hub Cloud Security Posture Management (AWS Security Hub CSPM), and Amazon Macie, organizing them by threats, exposures, resources, and security coverage. This unified approach reduces manual correlation work, helping you quickly identify critical issues, understand coverage gaps, and prioritize remediation based on severity and impact.

What’s new in general availability
Since the preview announcement, Security Hub has added several new features.

Historical trends
Security Hub includes a Trends feature through the Summary dashboard that provides up to 1 year of historical data for findings and resources across your organization. The Summary dashboard displays an overview of your exposures, threats, resources, and security coverage through customizable widgets that you can add, remove, and arrange based on your operational needs.

The dashboard includes a Trends overview widget that displays period-over-period analysis for day-over-day, week-over-week, and month-over-month comparisons, helping you track whether your security posture is improving or degrading. Trend widgets for Active threat findings, Active exposure findings, and Resource trends provide visualizations of average counts over selectable time periods including 5 days, 30 days, 90 days, 6 months, and 1 year. You can filter these visualizations by severity levels such as critical, high, medium, and low, and hover over specific points in time to review detailed counts.

The Summary dashboard also includes widgets that display current exposure summaries prioritized by severity, threat summaries showing malicious or suspicious activity, and resource inventories organized by type and associated findings.

The Security coverage widget helps you identify gaps in your security service deployment across your organization. This widget tracks which AWS accounts and Regions have security services enabled, helping you understand where you might lack visibility into threats, vulnerabilities, misconfigurations, or sensitive data. The widget displays account coverage across security capabilities including vulnerability management by Amazon Inspector, threat detection by GuardDuty, sensitive data discovery by Amazon Macie, and posture management by AWS Security Hub CSPM. Coverage percentages show which security checks passed or failed across your AWS accounts and Regions where Security Hub is enabled.

You can apply filters to widgets using shared filters that apply across all widgets, finding filters for exposure and threat data, or resource filters for inventory data. You can create and save filter sets using and/or operators to define specific criteria for your security analysis. Dashboard customizations, including saved filter sets and widget layouts, are saved automatically and persist across sessions.

If you configure cross-Region aggregation, the Summary dashboard includes findings from all linked Regions when viewing from your home Region. For delegated administrator accounts in AWS Organizations, data includes findings for both the administrator account and member accounts. Security Hub retains trends data for 1 year from the date findings are generated. After 1 year, trends data is automatically deleted.

Near real-time risk analytics
Security Hub now calculates exposures in near real-time and includes threat correlation from GuardDuty alongside existing vulnerability and misconfiguration analysis. When GuardDuty detects threats, Amazon Inspector identifies vulnerabilities, or AWS Security Hub CSPM discovers misconfigurations, Security Hub automatically correlates these findings and updates associated exposures. This advancement provides immediate feedback on your security posture, helping you quickly identify new exposures and verify that remediation actions have reduced risk as expected.

Security Hub correlates findings across AWS Security Hub CSPM, Amazon Inspector, Amazon Macie, Amazon GuardDuty, and other security services to identify exposures that could lead to security incidents. This correlation helps you understand when multiple security issues combine to create critical risk. Security Hub enriches security signals with context by analyzing resource associations, potential impact, and relationships between signals. For example, if Security Hub identifies an Amazon Simple Storage Service (Amazon S3) bucket containing sensitive data with versioning disabled, Object Lock disabled, and MFA delete disabled, remediating any component triggers automatic calculation, helping you verify remediation effectiveness without waiting for scheduled assessments.

The Exposure page organizes findings by title and severity, helping you focus on critical issues first. The page includes an Overview section with a trends graph that displays the average count of exposure findings over the last 90 days, segmented by severity level. This visualization helps you track changes in your exposure posture over time and identify patterns in security risk.

Exposure findings are grouped by title with expandable rows showing the count of affected resources and overall severity. Each exposure title describes the potential security impact, such as “Potential Data Destruction: S3 bucket with versioning, Object Lock, and MFA delete disabled” or “Potential Remote Execution: EC2 instance is reachable from VPC and has software vulnerabilities.” You can filter exposures using saved filter sets or quick filters based on severity levels including critical, high, medium, and low. The interface also provides filtering by account ID, resource type, and accounts, helping you quickly narrow down exposures relevant to specific parts of your infrastructure.

Security Hub generates exposures as soon as findings are available. For example, when you deploy an Amazon Elastic Compute Cloud (Amazon EC2) instance that is publicly accessible and Amazon Inspector detects a highly exploitable vulnerability while AWS Security Hub CSPM identifies the public accessibility configuration, Security Hub automatically correlates these findings to generate an exposure without waiting for a scheduled assessment. This near-real time correlation helps you identify critical risks in newly deployed resources and take action before they can be exploited.

When you select an exposure finding, the details page displays the exposure type, primary resource, Region, account, age, and creation time. The Overview section shows contributing traits that represent the security issues directly contributing to the exposure scenario. These traits are organized by categories such as Reachability, Vulnerability, Sensitive data, Misconfiguration, and Assumability.

The details page includes a Potential attack path tab that provides a visual graph showing how potential attackers could access and take control of your resources. This visualization displays the relationships between the primary resource (such as an EC2 instance), involved resources (such as VPC, subnet, network interface, security group, AWS Identity and Access Management (IAM) instance profile, IAM role, IAM policy, and volumes), and contributing traits. The graph helps you understand the complete attack surface and identify which security controls need adjustment.

The Traits tab lists all security issues contributing to the exposure, and the Resources tab shows all affected resources. The Remediation section provides prioritized guidance with links to documentation, recommending which traits to address first to reduce risk most effectively. By using this comprehensive view, you can investigate specific exposures, understand the full context of security risks, and track remediation progress as your team addresses vulnerabilities, misconfigurations, and other security gaps across your environment.

Expanded partner integrations
Security Hub supports integration with Jira and ServiceNow for incident management workflows. When viewing a finding, you can create a ticket in your preferred system directly from the AWS Security Hub console with finding details, severity, and recommended remediation steps automatically populated. You can also define automation rules in Security Hub that automatically create tickets in Atlassian’s Jira Service Management and ServiceNow based on criteria you specify, such as severity level, resource type, or finding type. This helps you route critical security issues to your incident response teams without manual intervention.

Security Hub findings are formatted in the Open Cybersecurity Schema Framework (OCSF) schema, an open-source standard that enables security tools to share data seamlessly. Partners who have built integrations with the OCSF format with Security Hub include Cribl, CrowdStrike, Databee, DataDog, Dynatrace, Expel, Graylog, Netskope, Securonix, SentinelOne, Splunk a Cisco company, Sumo Logic, Tines, Upwind Security, Varonis, DTEX, and Zscaler. Additionally, service partners such as Accenture, Caylent, Deloitte, Optiv, PwC, and Wipro can help you adopt Security Hub and the OCSF schema.

Security Hub also supports automated response workflows through Amazon EventBridge. You can create EventBridge rules that identify findings based on criteria you specify and route them to targets such as AWS Lambda functions or AWS Systems Manager Automation runbooks for processing and remediation. This helps you act on findings programmatically without manual intervention.

Now available
If you currently use AWS Security Hub CSPM, Amazon GuardDuty, Amazon Inspector, or Amazon Macie, you can access these capabilities by navigating to the AWS Security Hub console. If you’re a new customer, you can enable Security Hub through the AWS Management Console and configure the security services appropriate for your workloads. Security Hub automatically consumes findings from enabled services, making the findings available in the unified console and creating correlated exposure findings based on the ingested security data.

For Regional availability, visit our AWS Services by Region page. Near real-time exposure calculation and the Trends feature are included at no additional charge. Security Hub uses a streamlined, resource-based pricing model that consolidates charges across integrated AWS security services. The console includes a cost estimator to help you plan and forecast security investments across your AWS accounts and Regions before deployment. For detailed information about capabilities, supported integrations, and pricing, visit the AWS Security Hub product page and technical documentation.

— Esra
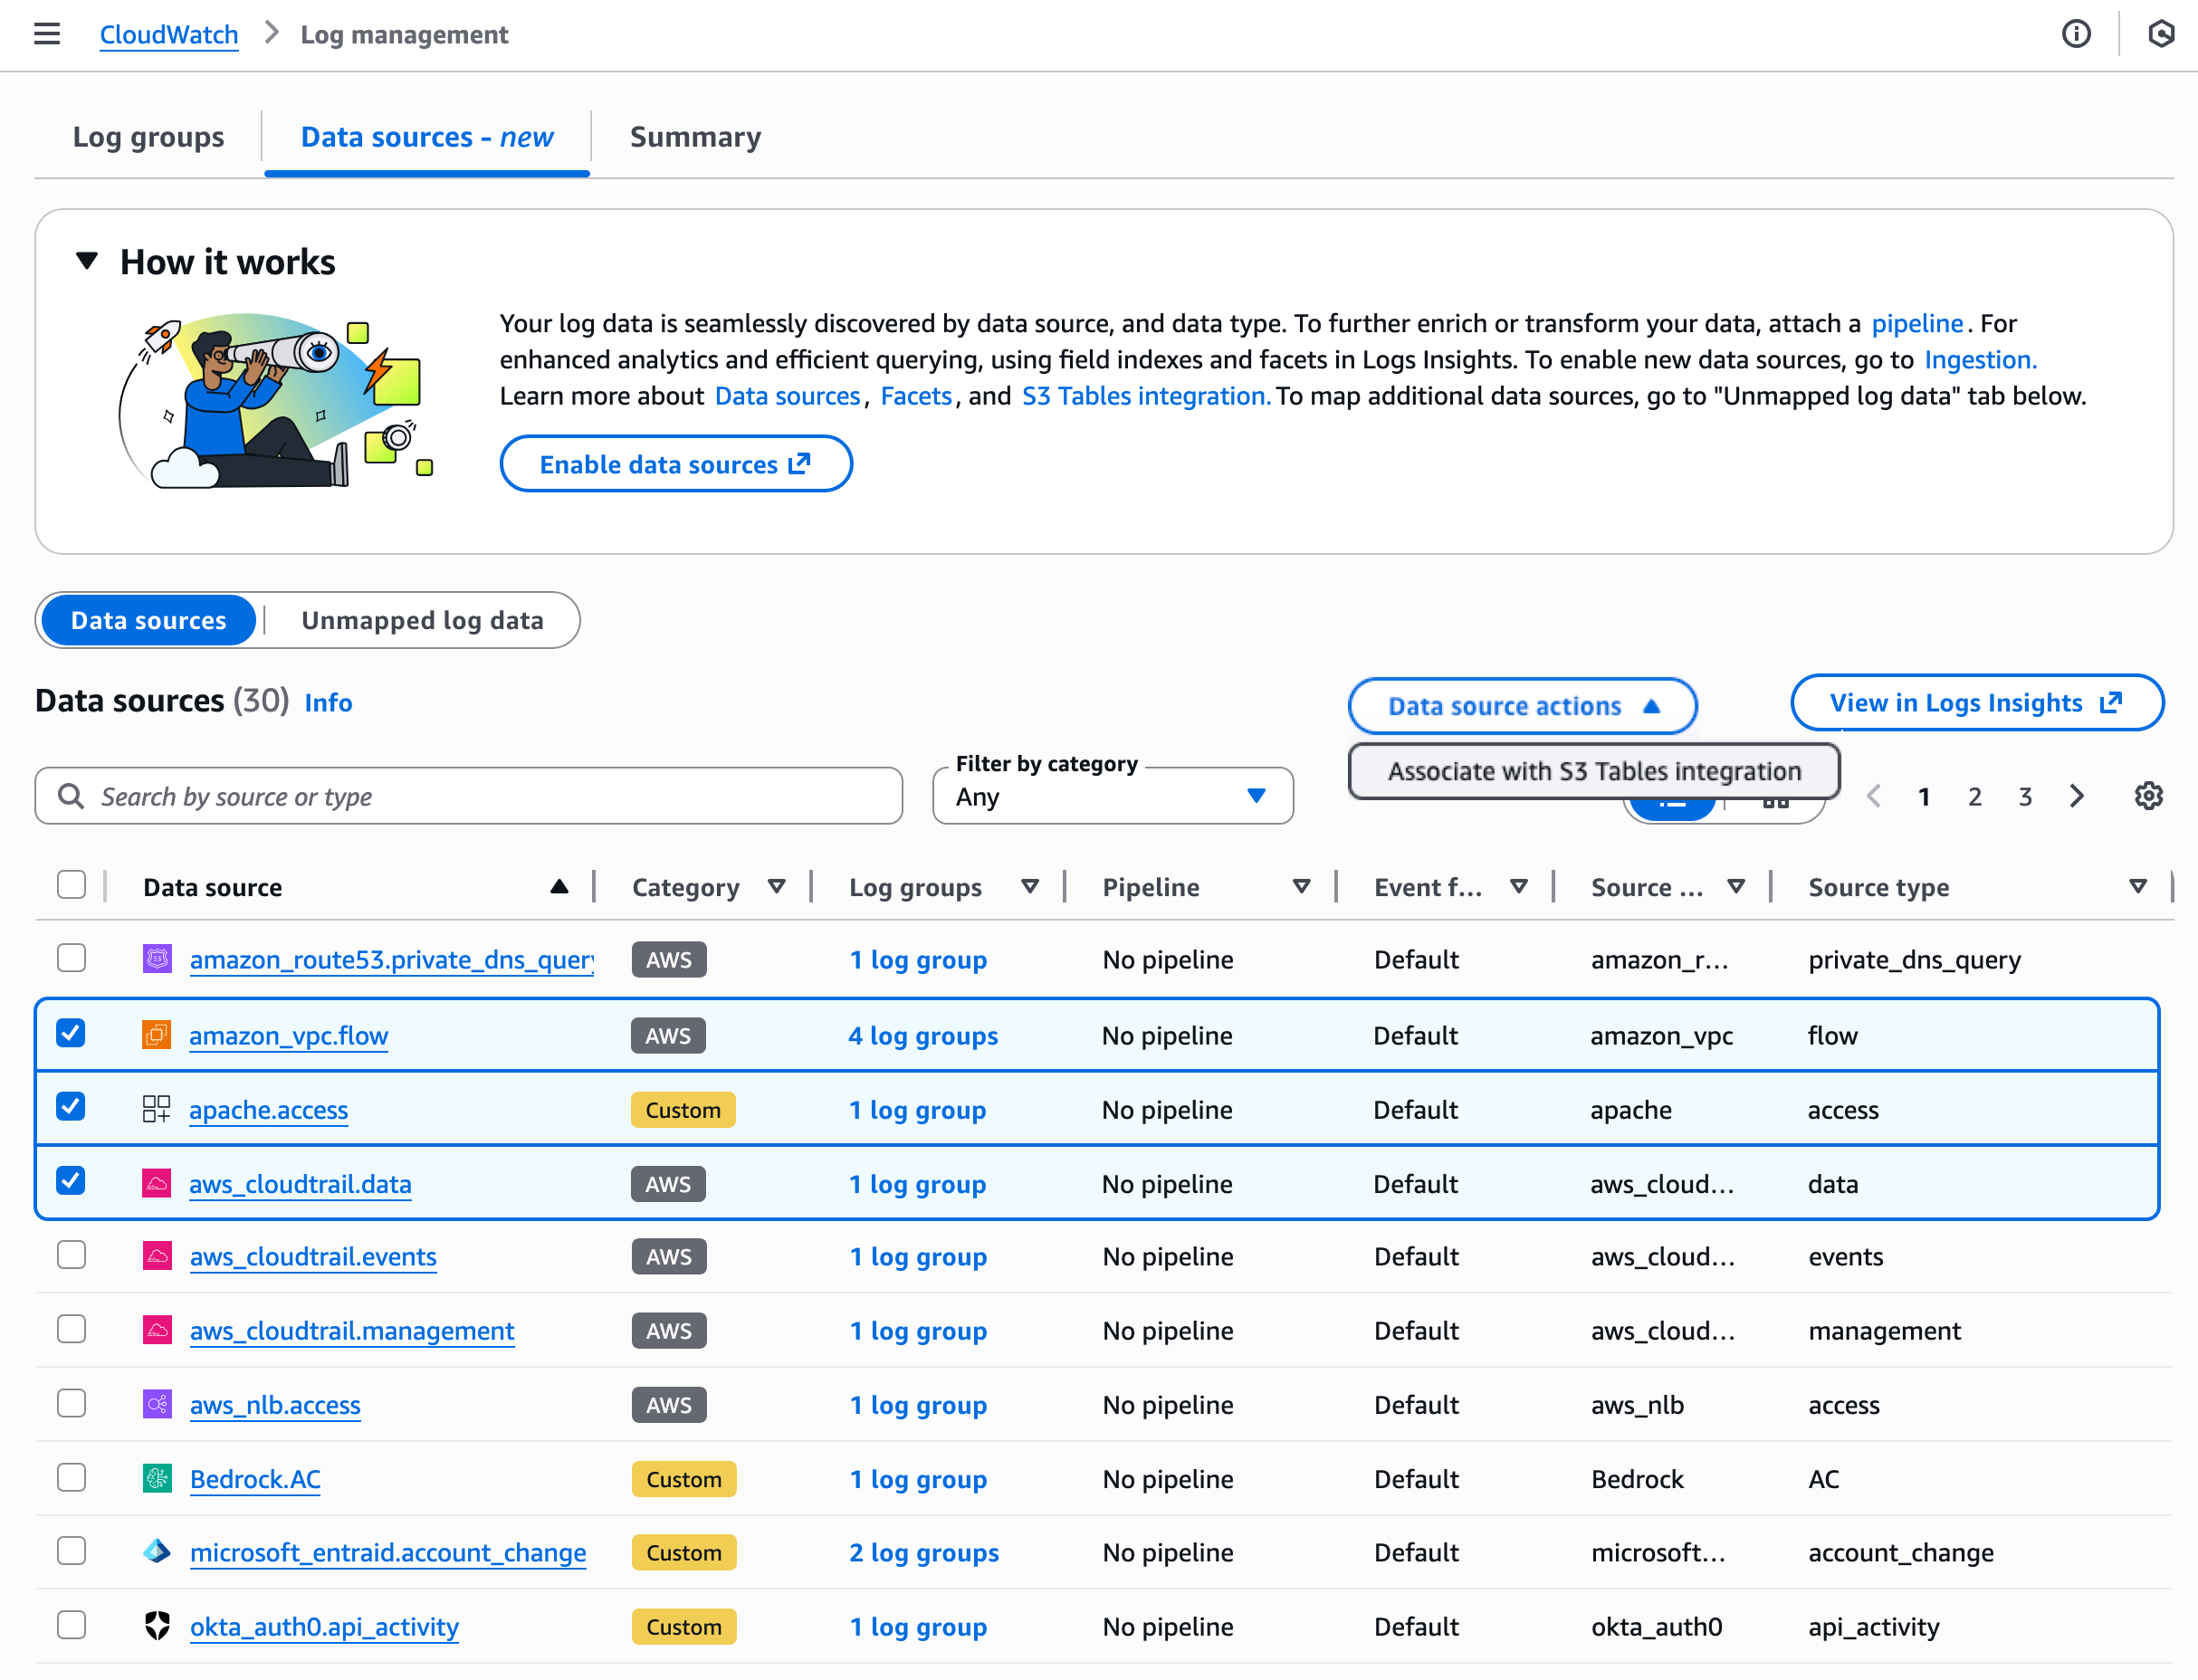
Amazon GuardDuty adds Extended Threat Detection for Amazon EC2 and Amazon ECS

Post Syndicated from Betty Zheng (郑予彬) original https://aws.amazon.com/blogs/aws/amazon-guardduty-adds-extended-threat-detection-for-amazon-ec2-and-amazon-ecs/

Today, we’re announcing new enhancements to Amazon GuardDuty Extended Threat Detection with the addition of two attack sequence findings for Amazon Elastic Compute Cloud (Amazon EC2) instances and Amazon Elastic Container Service (Amazon ECS) tasks. These new findings build on the existing Extended Threat Detection capabilities, which already combine sequences involving AWS Identity and Access Management (IAM) credential misuse, unusual Amazon Simple Storage service (Amazon S3) bucket activity, and Amazon Elastic Kubernetes Service (Amazon EKS) cluster compromise. By adding coverage for EC2 instance groups and ECS clusters, this launch expands sequence-level visibility to virtual machine and container environments that support the same application. Together, these capabilities provide a more consistent and unified way to detect multistage activity across diverse Amazon Web Services (AWS) workloads.

Modern cloud environments are dynamic and distributed, often running virtual machines, containers, and serverless workloads at scale. Security teams strive to maintain visibility across these environments and connect related activities that might indicate complex, multistage attack sequences. These sequences can involve multiple steps, such as establishing initial access and persistence, providing missing credentials or performing unexpected data access, that unfold over time and across different sources. GuardDuty Extended Threat Detection automatically links these signals using AI and machine learning (ML) models trained at AWS scale to build a complete picture of the activity and surface high-confidence insights to help customers prioritize response actions. By combining evidence from diverse sources, this analysis produces high-fidelity, unified findings that would otherwise be difficult to infer from individual events.

How it works
Extended Threat Detection analyzes multiple types of security signals, including runtime activity, malware detections, VPC Flow Logs, DNS queries, and AWS CloudTrail events to identify patterns that represent a multistage attack across Amazon EC2 and Amazon ECS workloads. Detection works with the GuardDuty foundational plan, and turning on Runtime Monitoring for EC2 or ECS adds deeper process and network-level telemetry that strengthens signal analysis and increases the completeness of each attack sequence.

The new attack sequence findings combine runtime and other observed behaviors across the environment into a single critical-severity sequence. Each sequence includes an incident summary, a timeline of observed events, mapped MITRE ATT&CK® tactics and techniques, and remediation guidance to help you understand how the activity unfolded and which resources were affected.

EC2 instances and ECS tasks are often created and replaced automatically through Auto Scaling groups, shared launch templates, Amazon Machine Images (AMIs), IAM instance profiles, or cluster-level deployments. Because these resources commonly operate as part of the same application, activity observed across them might originate from a single underlying compromise. The new EC2 and ECS findings analyze these shared attributes and consolidate related signals into one sequence when GuardDuty detects a pattern affecting the group.

When a sequence is detected, the GuardDuty console highlights any critical-severity sequence findings on the Summary page, with the affected EC2 instance group or ECS cluster already identified. Selecting a finding opens a consolidated view that shows how the resources are connected, which signals contributed to the sequence, and how the activity progressed over time, helping you quickly understand the scope of impact across virtual machine and container workloads.

In addition to viewing sequences in the console, you can also see these findings in AWS Security Hub, where they appear on the new exposure dashboards alongside other GuardDuty findings to help you understand your overall security risk in one place. This detailed view establishes the context for interpreting how the analysis brings related signals together into a broader attack sequence.

Together, the analysis model and grouping logic give you a clearer, consolidated view of activity across virtual machine and container workloads, helping you focus on the events that matter instead of investigating numerous individual findings. By unifying related behaviors into a single sequence, Extended Threat Detection helps you assess the full context of an attack path and prioritize the most urgent remediation actions.

Now available
Amazon GuardDuty Extended Threat Detection with expanded coverage for EC2 instances and ECS tasks is now available in all AWS Regions where GuardDuty is offered. You can start using this capability today to detect coordinated, multistage activity across virtual machine and container workloads by combining signals from runtime activity, malware execution, and AWS API activity.

This expansion complements the existing Extended Threat Detection capabilities for Amazon EKS, providing unified visibility into coordinated, multistage activity across your AWS compute environment. To learn more, visit the Amazon GuardDuty product page.

–Betty

Introducing Amazon Nova Forge: Build your own frontier models using Nova

Post Syndicated from Danilo Poccia original https://aws.amazon.com/blogs/aws/introducing-amazon-nova-forge-build-your-own-frontier-models-using-nova/

Organizations are rapidly expanding their use of generative AI across all parts of the business. Applications requiring deep domain expertise or specific business context need models that truly understand their proprietary knowledge, workflows, and unique requirements.

While techniques like prompt engineering and Retrieval Augmented Generation (RAG) work well for many use cases, they have fundamental limitations when it comes to embedding specialized knowledge into a model’s core understanding. Supervised fine-tuning and reinforcement learning help in customizing the model, but they operate too late in the development lifecycle, layering modifications on top of models that are a fully trained, and therefore difficult to steer to specific domains of interest.

When organizations attempt deeper customization through Continued Pre-Training (CPT) using only their proprietary data, they often encounter catastrophic forgetting, where models lose their foundational capabilities as they learn new content. At the same time, the data, compute, and cost needed for training a model from scratch are still a prohibitive barrier for most organizations.

Today, we’re introducing Amazon Nova Forge, a new service to build your own frontier models using Nova. Nova Forge customers can start their development from early model checkpoints, blend their datasets with Amazon Nova-curated training data, and host their custom models securely on AWS. Nova Forge is the easiest and most cost-effective way to build your own frontier model.

Use cases and applications
Nova Forge is designed for organizations with access to proprietary or industry-specific data who want to build AI that truly understands their domain. This includes:

  • Manufacturing and automation – Building models that understand specialized processes, equipment data, and industry-specific workflows
  • Research and development – Creating models trained on proprietary research data and domain-specific knowledge
  • Content and media – Developing models that understand brand voice, content standards, and specific moderation requirements
  • Specialized industries – Training models on industry-specific terminology, regulations, and best practices

Depending on the specific use cases, Nova Forge can be used to add differentiated capabilities, enhance task-specific accuracy, reduce costs, and lower latency.

How Nova Forge works
Nova Forge addresses the limitations of current customization approaches by allowing you to start model development from early checkpoints across pre-training, mid-training, and post-training phases. You can blend your proprietary data with Amazon Nova-curated data throughout all training phases, running training using proven recipes on Amazon SageMaker AI fully managed infrastructure. This data mixing approach significantly reduces catastrophic forgetting compared to training with raw data alone, helping preserve foundational skills—including core intelligence, general instruction following capabilities, and safety benefits—while incorporating your specialized knowledge.

Nova Forge provides the ability to use reward functions in your own environment for reinforcement learning (RL). This allows the model to learn from feedback generated in environments that are representative of your use cases. Beyond single-step evaluations, you can also use your own orchestrator to manage multi-turn rollouts, enabling RL training for complex agent workflows and sequential decision-making tasks. Whether you’re using chemistry tools to score molecular designs, or robotics simulations that reward efficient task completion and penalize collisions, you can connect your proprietary environments directly.

You can also take advantage of the built-in responsible AI toolkit available in Nova Forge to configure the safety and content moderation settings of your model. You can adjust settings to meet your specific business needs in areas like safety, security, and handling of sensitive content.

Getting started with Nova Forge
Nova Forge integrates seamlessly with your existing AWS workflows. You can use the familiar tools and infrastructure in Amazon SageMaker AI to run your training, then import your custom Nova models as private models on Amazon Bedrock. This gives you the same security, consistent APIs, and broader AWS integrations as any model in Amazon Bedrock.

In Amazon SageMaker Studio, you can now build your frontier model with Amazon Nova.

Amazon Nova Forge in the SageMaker AI console

To start building the model, choose which checkpoint to use: pre-trained, mid-trained, or post-trained. You can also upload your dataset here or use existing datasets.

Amazon Nova Forge checkpoints

You can blend your training data by mixing in curated datasets provided by Nova. These datasets, categorized by domain, can help your model to preserve general performance and prevent overfitting or catastrophic forgetting.

Amazon Nova Forge data mixing

Optionally, you can choose to use Reinforcement Fine-Tuning (RFT) to improve factual accuracy and reduce hallucinations in specific domains.

When training completes, import the model into Amazon Bedrock and start using it in your applications.

Things to know
Amazon Nova Forge is available in the US East (N. Virginia) AWS Region. The program includes access to multiple Nova model checkpoints, training recipes to mix proprietary data with Amazon Nova-curated training data, proven training recipes, and integration with Amazon SageMaker AI and Amazon Bedrock.

Learn more in the Amazon Nova User Guide and explore Nova Forge from the Amazon SageMaker AI console.

Organizations interested in expert assistance can also reach out to our Generative AI Innovation Center for additional support with their model development initiatives.

— Danilo

Let’s Encrypt to reduce certificate lifetimes

Post Syndicated from jzb original https://lwn.net/Articles/1048976/

Let’s Encrypt has announced
that it will be reducing the validity period of its certificates from
90 days to 45 days by 2028:

Most users of Let’s Encrypt who automatically issue certificates
will not have to make any changes. However, you should verify that
your automation is compatible with certificates that have shorter
validity periods.

To ensure your ACME client renews on time, we recommend using ACME
Renewal Information (ARI)
. ARI is a feature we’ve introduced to help
clients know when they need to renew their certificates. Consult your
ACME client’s documentation on how to enable ARI, as it differs from
client to client. If you are a client developer, check out this
integration guide.

If your client doesn’t support ARI yet, ensure it runs on a
schedule that is compatible with 45-day certificates. For example,
renewing at a hardcoded interval of 60 days will no longer be
sufficient. Acceptable behavior includes renewing certificates at
approximately two thirds of the way through the current certificate’s
lifetime.

Manually renewing certificates is not recommended, as it will need
to be done more frequently with shorter certificate lifetimes.

FreeBSD 15.0 released

Post Syndicated from jzb original https://lwn.net/Articles/1048975/

FreeBSD
15.0
has been released. Notable changes in this release include a new
method for installing
the base system using the pkg package manager
, an update
to OpenZFS 2.4.0-rc4,
native support for the inotify(2)
interface, and the addition of Open Container Initiative (OCI) images
to FreeBSD’s release artifacts. See the release
notes
for a full list of changes, hardware
notes
for supported hardware, and check the errata
before installing or upgrading.

[$] Zig’s new plan for asynchronous programs

Post Syndicated from daroc original https://lwn.net/Articles/1046084/

The designers of the

Zig programming language
have been working to find a
suitable design for asynchronous code for some time.
Zig is a carefully minimalist language, and its

initial design
for
asynchronous I/O did not fit well with its other
features. Now, the project has

announced
(in a Zig SHOWTIME video) a new approach to asynchronous I/O that
promises to solve the

function coloring
problem, and allows writing code that will execute
correctly using either synchronous or asynchronous I/O.

Security updates for Tuesday

Post Syndicated from jzb original https://lwn.net/Articles/1048973/

Security updates have been issued by Fedora (gnutls, libpng, mingw-python3, python-spotipy, source-to-image, unbound, and webkitgtk), Mageia (libpng), SUSE (bash-git-prompt, gitea-tea, java-17-openjdk, java-21-openjdk, kernel, openssh, python, and shadowsocks-v2ray-plugin, v2ray-core), and Ubuntu (binutils, openjdk-17-crac, openjdk-21-crac, and openjdk-25-crac).

Rapid7 Helps Lower Your Cost to Assurance for HITRUST

Post Syndicated from Jon Schipp original https://www.rapid7.com/blog/post/pt-rapid7-hitrust-lowers-continuous-assurance-cost-asm

Organizations across regulated sectors are under growing pressure to prove their security readiness. At the same time, traditional assurance approaches rely on periodic audits and manual evidence collection. These activities take time, strain staff, and often fall out of date as environments evolve.

To help close this gap, Rapid7 has partnered with HITRUST to bring automated evidence collection and continuous validation of security controls to customers who follow HITRUST frameworks. This partnership builds on existing capabilities in the Rapid7 Command Platform and creates a more efficient path for organizations that need to demonstrate strong and reliable assurance.

Rapid7 achieves this by leveraging our native telemetry and extensive support for third-party data sources; the Rapid7 Command Platform has visibility into vulnerabilities, exposures, configurations, identities, threat detections, IT context and more, the very same datasets that make up the evidence of technical compliance controls.  Meaning that Rapid7 as a Security Operations platform, not only implements those very controls but can also help customers to prove those controls to lower their cost to certification. This is accomplished through automated evidence collection and continuous controls monitoring from Surface Command to detect things like compliance drift.

⠀

HITRUST-e1-Dashboard-Example.png
HITRUST e1 Dashboard Example

⠀

To help understand how Rapid7 can help our customers to assure against HITRUST and its many levels of assurance, we will provide a brief background on HITRUST.

The importance of HITRUST

HITRUST offers one of the most comprehensive cybersecurity assurance programs for risk, security, and compliance. Its framework is informed by more than 60 standards and is continuously updated based on active threats and risk thresholds. This helps close the gap between traditional checkbox compliance and the realities of modern risk.

HITRUST has developed an all-encompassing compliance framework, a framework of frameworks, if you will. It’s the only compliance framework that is actively updated based on the latest attacker behavior and security threats, meaning it can further close the gap between checkbox compliance and actual risk reduction. It offers a portfolio of assessments and certifications that validate the security of systems, data and environment. They currently laude a 99.41% breach-free rate for organizations that have a HITRUST certification. This alone is a very compelling stat, yet there’s another area of differentiation that is worth mentioning. HITRUST assessors are entirely independent from the HITRUST organization. This independence provides organizations with a consistent and transparent way to validate their control performance. Achieving HITRUST assurance also extends coverage across several major frameworks, including ISO/IEC 27001, NIST CSF, HIPAA, and GDPR. This helps teams streamline overlapping requirements while working within a single, structured model.

⠀

HITRUST-did-you-know.png

⠀

HITRUST-security-breach-rate-chart.png

What is HITRUST assurance?

Assurance, defined by HITRUST, is a token of trust that HITRUST designates to organizations that have been through the assurance process. There are two main requirements to be trustworthy:

  1. The control set has to be relevant e.g. informed by latest attacker behavior

  2. The control set has to be reliable, transparent and have an open scoring system and independent assessor network

Customers are assessed by an independent network of HITRUST assessors (e.g audit firms) to evaluate if they meet the requirements of the HITRUST framework, which provides several levels of controls based on the size, sector, and risk profile of the organization. HITRUST provides a free CSF framework that has been downloaded by over 35,000 organizations. The r2 certification has been around the longest, for around 10 years and is the most rigorous. There is a newer certification called e1, which is an entry-level control set to help customers get started and is seeing the majority of adoption by new HITRUST customers.

The e1 currently has over 40 technical controls to adhere to, and the r2 is a combination of the control set from i1 (over 100 controls) with a per-customer set of controls based on the specific risk to that business. This means that no two r2 assessments are the same. Highlighting another key differentiator of HITRUST that goes beyond the check-the-box, minimal viable security approach to compliance.

⠀

HITRUST-assessment-types.png

⠀
Lastly, HITRUST frameworks are typically updated quarterly leveraging the latest research on threats and industry best practices. While this can be challenging for customers to maintain that have not adopted automated evidence collection, it ensures that HITRUST is providing a high quality risk-informed framework that drives meaningful security outcomes.

How the Rapid7 partnership strengthens assurance programs

Rapid7’s Surface Command provides customers with a complete internal and external view of their attack surface, including vulnerabilities, misconfigurations, assets, and exposure data. With this new integration, the platform can now collect, map, and validate technical controls against HITRUST requirements using the same datasets security teams rely on for day-to-day operations.

This automated approach supports several outcomes featured in the press release:

  • Continuous compliance visibility: The Command Platform assesses environments for control drift based on HITRUST requirements, which are updated in response to emerging threats.

  • Proactive risk mitigation: Customers can connect vulnerability and exposure insights with HITRUST controls to address areas that matter most.

  • Lower audit burden: Continuous validation reduces manual evidence collection and helps narrow audit scope to the areas that require attention.

  • Support for cyber insurance: Demonstrating consistent control performance can help organizations show strong risk management practices to insurers.

  • Lower costs: By reducing manual work and helping teams focus on priority controls, organizations can minimize the resource-intensive process associated with traditional assurance cycles.

To summarize, Rapid7 Command Platform can map & monitor technical controls to HITRUST e1, i1 and r2, and then by sampling them continuously, Rapid7 can detect control drift to identify areas that need attention, lowering the need for an expensive, comprehensive assessment. We can now help customers focus on remediating what needs attention and enable their assessors to look for only those areas that need addressing, instead of the full scope, ultimately saving costs during the evidence collection and assurance process.

Moving from periodic audits to continuous assurance

Moving from periodic audits to continuous assurance with Surface Command, Rapid7’s attack surface management (ASM) solution, provides our customers with a unified, continuously updated view of all assets and exposures in their organization through a combination of Rapid7 and third-party security data. Today’s security programs need approaches that keep pace with real threats and regulatory expectations. By pairing Rapid7’s visibility into security controls with HITRUST’s structured and independently assessed framework, customers can shift from point-in-time checks to a continuous, evidence-based view of their cybersecurity posture.

This partnership helps teams maintain confidence in their control performance, reduce evidence decay, and communicate program health more effectively to leadership and stakeholders.
Learn more here.

⠀

HITRUST-e1-Dashboard-Example-2.png
HITRUST e1 Dashboard Example

The collective thoughts of the interwebz