Post Syndicated from The Atlantic original https://www.youtube.com/watch?v=QKHS6uo1of0
LXQt 2.3.0 released
Post Syndicated from jzb original https://lwn.net/Articles/1045140/
Version
2.3.0 of the Lightweight Qt Desktop Environment (LXQt) has been
released. The highlight of this release is continued improvement in
Wayland support across LXQt components. Rather than offering its own
compositor, the LXQt project takes a modular approach and works with
several Wayland compositors, such as KWin, labwc, and niri.
[$] A security model for systemd
Post Syndicated from jzb original https://lwn.net/Articles/1042888/
Linux has many security features and tools that have evolved over
the years to address threats as they emerge and security gaps as they
are discovered. Linux security is all, as Lennart Poettering observed at the All Systems Go! conference held
in Berlin, somewhat random and not a “clean
”
design. To many observers, that may also appear to be the case for
systemd; however, Poettering said that he does have a vision for how
all of the security-related pieces of systemd are meant to fit
together. He wanted to use his talk to explain “how the individual
“.
security-related parts of systemd actually fit together and why they
exist in the first place
OCI Runtime Specification 1.3 adds FreeBSD
Post Syndicated from jzb original https://lwn.net/Articles/1045125/
Version
1.3 of the Open Container Initiative (OCI) Runtime
Specification has been released. The specification covers the
configuration, execution environment, and lifecycle of containers. The
most notable change in 1.3 is the addition of FreeBSD to the
specification, which the FreeBSD Foundation calls
“a watershed moment for FreeBSD
“:
The addition of cloud-native container support complements FreeBSD’s
already robust virtualization capabilities, particularly the powerful
FreeBSD jails technology that has been a cornerstone of the operating
system for over two decades. In fact, OCI containers on FreeBSD are
implemented using jails as the underlying isolation mechanism,
bringing together the security and resource management benefits of
jails with the portability and ecosystem advantages of OCI-compliant
containers.
Security updates for Wednesday
Post Syndicated from jzb original https://lwn.net/Articles/1045124/
Security updates have been issued by Debian (bind9 and gimp), Fedora (chromium, fastapi-cli, fastapi-cloud-cli, gherkin, libnbd, maturin, openapi-python-client, python-annotated-doc, python-cron-converter, python-fastapi, python-inline-snapshot, python-jiter, python-openapi-core, python-platformio, python-pydantic, python-pydantic-core, python-pydantic-extra-types, python-rignore, python-starlette, python-typer, python-typing-inspection, python-uv-build, ruff, rust-astral-tokio-tar, rust-attribute-derive, rust-attribute-derive-macro, rust-collection_literals, rust-get-size-derive2, rust-get-size2, rust-interpolator, rust-jiter, rust-manyhow, rust-manyhow-macros, rust-proc-macro-utils, rust-quote-use, rust-quote-use-macros, rust-regex, rust-regex-automata, rust-reqsign, rust-reqsign-aws-v4, rust-reqsign-command-execute-tokio, rust-reqsign-core, rust-reqsign-file-read-tokio, rust-reqsign-http-send-reqwest, rust-serde_json, rust-speedate, rust-tikv-jemalloc-sys, rust-tikv-jemallocator, and uv), Mageia (golang and libavif), Red Hat (bind9.16, pcs, and qt6-qtsvg), SUSE (colord, ffmpeg, govulncheck-vulndb, jasper, openjpeg, poppler, qatengine, qatlib, runc, sccache, and tiff), and Ubuntu (keystone, libssh, linux-hwe-6.14, linux-nvidia-tegra, linux-nvidia-tegra-5.15, linux-nvidia-tegra-igx,
linux-raspi, runc-app, runc-stable, squid, squid3, and unbound).
2025 Cybersecurity Predictions: How did we do?
Post Syndicated from Rapid7 original https://www.rapid7.com/blog/post/it-2025-cybersecurity-predictions-how-did-rapid7-do
Every industry has their it’s-that-time-of-year-again rituals, and the cybersecurity industry is no different. The spring ushers in RSA, August is Hacker Summer Camp, October brings with it Cybersecurity Awareness Month — and, before we know it, it’s the end of the year and we’re once again making our “predictions” of what lies ahead.
A wise young man once said, “Life moves pretty fast. If you don’t stop and look around once in a while, you could miss it.” In our space, a whole lot is moving fast. To see clearly, it’s certainly important to take a moment to step away from the noise and look outward.
Many experts offer their predictions for the coming year, but how many stop to look back at how their vision for the current year fared? With that in mind, let’s take a look at the predictions Rapid7 experts made for 2025.
A look back
Prediction: “Greater visibility will act as a life preserver for security teams treading water across an increasingly complex attack surface.”
The importance of unified visibility, attack surface management, and exposure insight has become a leading theme in industry trends reports in 2025. The exposure management market is growing strongly, projected to hit ~$10.9 billion by 2030, which is up from ~$3.3 billion in 2024. Managed Detection and Response (MDR) adoption is also surging; the MDR market reached USD 4.19 billion in 2025 and is forecasted to keep growing fast.
Rapid7 customer New Zealand Automobile Association (NZAA) offers a real-world example of this trend. Before working with Rapid7, NZAA’s cybersecurity tools were fragmented and disjointed. This lack of a unified approach reduced visibility and slowed down threat responses. Now, with Rapid7’s MDR service, NZAA has a partner that can provide 24/7 support, centralized visibility, and predictable data usage — all with transparency and scalability.
This is just one example of the evidence we’ve seen that security teams are acting to consolidate disparate tooling and connect proactive exposure risk management with reactive detection and response capabilities. As a result, these teams and their organizations are shifting holistically into a confident, resilient security posture.
Prediction: “To thrive in a world where regulatory change is an ongoing concern, SecOps should prepare for both the predictable and the unpredictable.”
Regulatory change is indeed accelerating. For example, the EU’s Cyber Resilience Act was passed in 2024, with application phases extending toward 2027.
The UK announced the Cyber Security and Resilience Bill in 2024 to extend cyber obligations on organizations. Security operations teams have had to deal with both “expected” regulatory shifts (like NIS2, SEC rules) and unexpected mandates or cross-jurisdictional tensions.
Many organizations are now incorporating compliance readiness, threat modelling for future rules, and flexible architectures. Moving forward, SecOps should expect even more scrutiny over how operations are designed and architected, as well as how insights are shared and with whom.
Prediction: “Cybercriminals will increasingly exploit zero-day vulnerabilities, expanding potential entry points and bypassing traditional security measures to deliver more ransomware attacks.”
Zero days have continued to rise in prominence. Since 2023, Rapid7 has observed many notable zero-day-enabled ransomware and supply-chain attacks (e.g. MOVEit exploit, Cleo File Transfer, GoAnywhere MFT, Scattered Spider).
Attackers are investing in zero-day toolchains, and zero-day brokers are emerging in dark markets (i.e., “exploit-as-a-service” trends). See our Initial Access Brokers Report for more detail.
Rapid7 Q2 2025 Ransomware Trends Analysis research highlights that threat actors are using zero days more often, especially in critical or targeted operations within sectors like services (21.2%), manufacturing (16.8%), retail (14.1%), healthcare (10.3%), and communications, and media (10%).
In Q3 there were several instances of cybercriminals continuing to leverage zero-day exploits as initial access vectors during their ransomware campaigns. For example, CVE-2025-61882 affecting Oracle E-Business Suite was exploited in the wild by CL0p. The trend of cybercriminals exploiting zero-day vulnerabilities continues, as does the recurrence of not only the same cybercriminal groups, but also the same products being targeted over time (e.g., the file transfer product GoAnywhere MFT).
A look ahead
2025 has certainly pushed security teams to their limits with an increasingly complex attack surface, accelerating regulatory changes, and a persistent rise in zero-day exploits and ransomware attacks. The ongoing talent gap and the struggle to bridge the divide between technical and business leadership have further compounded these challenges, making it crucial for organizations to prioritize visibility, proactive exposure management, and actionable threat intelligence.
What will 2026 bring? Take a look ahead with our experts: Register now for Rapid7’s Top Cybersecurity Predictions webinar.
How Workers VPC Services connects to your regional private networks from anywhere in the world
Post Syndicated from Thomas Gauvin original https://blog.cloudflare.com/workers-vpc-open-beta/
In April, we shared our vision for a global virtual private cloud on Cloudflare, a way to unlock your applications from regionally constrained clouds and on-premise networks, enabling you to build truly cross-cloud applications.
Today, we’re announcing the first milestone of our Workers VPC initiative: VPC Services. VPC Services allow you to connect to your APIs, containers, virtual machines, serverless functions, databases and other services in regional private networks via Cloudflare Tunnels from your Workers running anywhere in the world.
Once you set up a Tunnel in your desired network, you can register each service that you want to expose to Workers by configuring its host or IP address. Then, you can access the VPC Service as you would any other Workers service binding — Cloudflare’s network will automatically route to the VPC Service over Cloudflare’s network, regardless of where your Worker is executing:
export default {
  async fetch(request, env, ctx) {
    // Perform application logic in Workers here

    // Call an external API running in a ECS in AWS when needed using the binding
    const response = await env.AWS_VPC_ECS_API.fetch("http://internal-host.com");

    // Additional application logic in Workers
    return new Response();
  },
};
Workers VPC is now available to everyone using Workers, at no additional cost during the beta, as is Cloudflare Tunnels. Try it out now. And read on to learn more about how it works under the hood.
Your applications span multiple networks, whether they are on-premise or in external clouds. But it’s been difficult to connect from Workers to your APIs and databases locked behind private networks.
We have previously described how traditional virtual private clouds and networks entrench you into traditional clouds. While they provide you with workload isolation and security, traditional virtual private clouds make it difficult to build across clouds, access your own applications, and choose the right technology for your stack.
A significant part of the cloud lock-in is the inherent complexity of building secure, distributed workloads. VPC peering requires you to configure routing tables, security groups and network access-control lists, since it relies on networking across clouds to ensure connectivity. In many organizations, this means weeks of discussions and many teams involved to get approvals. This lock-in is also reflected in the solutions invented to wrangle this complexity: Each cloud provider has their own bespoke version of a “Private Link” to facilitate cross-network connectivity, further restricting you to that cloud and the vendors that have integrated with it.
With Workers VPC, we’re simplifying that dramatically. You set up your Cloudflare Tunnel once, with the necessary permissions to access your private network. Then, you can configure Workers VPC Services, with the tunnel and hostname (or IP address and port) of the service you want to expose to Workers. Any request made to that VPC Service will use this configuration to route to the given service within the network.
{
  "type": "http",
  "name": "vpc-service-name",
  "http_port": 80,
  "https_port": 443,
  "host": {
    "hostname": "internally-resolvable-hostname.com",
    "resolver_network": {
      "tunnel_id": "0191dce4-9ab4-7fce-b660-8e5dec5172da"
    }
  }
}
This ensures that, once represented as a Workers VPC Service, a service in your private network is secured in the same way other Cloudflare bindings are, using the Workers binding model. Let’s take a look at a simple VPC Service binding example:
{
  "name": "WORKER-NAME",
  "main": "./src/index.js",
  "vpc_services": [
    {
      "binding": "AWS_VPC2_ECS_API",
      "service_id": "5634563546"
    }
  ]
}
Like other Workers bindings, when you deploy a Worker project that tries to connect to a VPC Service, the access permissions are verified at deploy time to ensure that the Worker has access to the service in question. And once deployed, the Worker can use the VPC Service binding to make requests to that VPC Service — and only that service within the network.
That’s significant: Instead of exposing the entire network to the Worker, only the specific VPC Service can be accessed by the Worker. This access is verified at deploy time to provide a more explicit and transparent service access control than traditional networks and access-control lists do.
This is a key factor in the design of Workers bindings: de facto security with simpler management and making Workers immune to Server-Side Request Forgery (SSRF) attacks. We’ve gone deep on the binding security model in the past, and it becomes that much more critical when accessing your private networks.
Notably, the binding model is also important when considering what Workers are: scripts running on Cloudflare’s global network. They are not, in contrast to traditional clouds, individual machines with IP addresses, and do not exist within networks. Bindings provide secure access to other resources within your Cloudflare account – and the same applies to Workers VPC Services.
So how do VPC Services and their bindings route network requests from Workers anywhere on Cloudflare’s global network to regional networks using tunnels? Let’s look at the lifecycle of a sample HTTP Request made from a VPC Service’s dedicated fetch() request represented here:

It all starts in the Worker code, where the .fetch() function of the desired VPC Service is called with a standard JavaScript Request (as represented with Step 1). The Workers runtime will use a Cap’n Proto remote-procedure-call to send the original HTTP request alongside additional context, as it does for many other Workers bindings.
The Binding Worker of the VPC Service System receives the HTTP request along with the binding context, in this case, the Service ID of the VPC Service being invoked. The Binding Worker will proxy this information to the Iris Service within an HTTP CONNECT connection, a standard pattern across Cloudflare’s bindings to place connection logic to Cloudflare’s edge services within Worker code rather than the Workers runtime itself (Step 2).
The Iris Service is the main service for Workers VPC. Its responsibility is to accept requests for a VPC Service and route them to the network in which your VPC Service is located. It does this by integrating with Apollo, an internal service of Cloudflare One. Apollo provides a unified interface that abstracts away the complexity of securely connecting to networks and tunnels, across various layers of networking.
To integrate with Apollo, Iris must complete two tasks. First, Iris will parse the VPC Service ID from the metadata and fetch the information of the tunnel associated with it from our configuration store. This includes the tunnel ID and type from the configuration store (Step 3), which is the information that Iris needs to send the original requests to the right tunnel.
Second, Iris will create the UDP datagrams containing DNS questions for the A and AAAA records of the VPC Service’s hostname. These datagrams will be sent first, via Apollo. Once DNS resolution is completed, the original request is sent along, with the resolved IP address and port (Step 4). That means that steps 4 through 7 happen in sequence twice for the first request: once for DNS resolution and a second time for the original HTTP Request. Subsequent requests benefit from Iris’ caching of DNS resolution information, minimizing request latency.
In Step 5, Apollo receives the metadata of the Cloudflare Tunnel that needs to be accessed, along with the DNS resolution UDP datagrams or the HTTP Request TCP packets. Using the tunnel ID, it determines which datacenter is connected to the Cloudflare Tunnel. This datacenter is in a region close to the Cloudflare Tunnel, and as such, Apollo will route the DNS resolution messages and the Original Request to the Tunnel Connector Service running in that datacenter (Step 5).

The Tunnel Connector Service is responsible for providing access to the Cloudflare Tunnel to the rest of Cloudflare’s network. It will relay the DNS resolution questions, and subsequently the original request to the tunnel over the QUIC protocol (Step 6).
Finally, the Cloudflare Tunnel will send the DNS resolution questions to the DNS resolver of the network it belongs to. It will then send the original HTTP Request from its own IP address to the destination IP and port (Step 7). The results of the request are then relayed all the way back to the original Worker, from the datacenter closest to the tunnel all the way to the original Cloudflare datacenter executing the Worker request.
This unlocks a whole new tranche of applications you can build on Cloudflare. For years, Workers have excelled at the edge, but they’ve largely been kept “outside” your core infrastructure. They could only call public endpoints, limiting their ability to interact with the most critical parts of your stack—like a private accounts API or an internal inventory database. Now, with VPC Services, Workers can securely access those private APIs, databases, and services, fundamentally changing what’s possible.

This immediately enables true cross-cloud applications that span Cloudflare Workers and any other cloud like AWS, GCP or Azure. We’ve seen many customers adopt this pattern over the course of our private beta, establishing private connectivity between their external clouds and Cloudflare Workers. We’ve even done so ourselves, connecting our Workers to Kubernetes services in our core datacenters to power the control plane APIs for many of our services. Now, you can build the same powerful, distributed architectures, using Workers for global scale while keeping stateful backends in the network you already trust.
It also means you can connect to your on-premise networks from Workers, allowing you to modernize legacy applications with the performance and infinite scale of Workers. More interesting still are some emerging use cases for developer workflows. We’ve seen developers run cloudflared on their laptops to connect a deployed Worker back to their local machine for real-time debugging. The full flexibility of Cloudflare Tunnels is now a programmable primitive accessible directly from your Worker, opening up a world of possibilities.
VPC Services is the first milestone within the larger Workers VPC initiative, but we’re just getting started. Our goal is to make connecting to any service and any network, anywhere in the world, a seamless part of the Workers experience. Here’s what we’re working on next:
Deeper network integration. Starting with Cloudflare Tunnels was a deliberate choice. It’s a highly available, flexible, and familiar solution, making it the perfect foundation to build upon. To provide more options for enterprise networking, we’re going to be adding support for standard IPsec tunnels, Cloudflare Network Interconnect (CNI), and AWS Transit Gateway, giving you and your teams more choices and potential optimizations. Crucially, these connections will also become truly bidirectional, allowing your private services to initiate connections back to Cloudflare resources such as pushing events to Queues or fetching from R2.
Expanded protocol and service support. The next step beyond HTTP is enabling access to TCP services. This will first be achieved by integrating with Hyperdrive. We’re evolving the previous Hyperdrive support for private databases to be simplified with VPC Services configuration, avoiding the need to add Cloudflare Access and manage security tokens. This creates a more native experience, complete with Hyperdrive’s powerful connection pooling. Following this, we will add broader support for raw TCP connections, unlocking direct connectivity to services like Redis caches and message queues from Workers ‘connect()’.
Ecosystem compatibility. We want to make connecting to a private service feel as natural as connecting to a public one. To do so, we will be providing a unique autogenerated hostname for each Workers VPC Service, similar to Hyperdrive’s connection strings. This will make it easier to use Workers VPC with existing libraries and object–relational mapping libraries that may require a hostname (e.g., in a global ‘fetch()’ call or a MongoDB connection string). Workers VPC Service hostname will automatically resolve and route to the correct VPC Service, just as the ‘fetch()’ command does.
We’re excited to release Workers VPC Services into open beta today. We’ve spent months building out and testing our first milestone for Workers to private network access. And we’ve refined it further based on feedback from both internal teams and customers during the closed beta.
Now, we’re looking forward to enabling everyone to build cross-cloud apps on Workers with Workers VPC, available for free during the open beta. With Workers VPC, you can bring your apps on private networks to region Earth, closer to your users and available to Workers across the globe.
The Wickenburg Massacre: A Wild West Mystery
Post Syndicated from The History Guy: History Deserves to Be Remembered original https://www.youtube.com/watch?v=JVS6sm6-rcQ
Scientists Need a Positive Vision for AI
Post Syndicated from Bruce Schneier original https://www.schneier.com/blog/archives/2025/11/scientists-need-a-positive-vision-for-ai.html
For many in the research community, it’s gotten harder to be optimistic about the impacts of artificial intelligence.
As authoritarianism is rising around the world, AI-generated “slop” is overwhelming legitimate media, while AI-generated deepfakes are spreading misinformation and parroting extremist messages. AI is making warfare more precise and deadly amidst intransigent conflicts. AI companies are exploiting people in the global South who work as data labelers, and profiting from content creators worldwide by using their work without license or compensation. The industry is also affecting an already-roiling climate with its enormous energy demands.
Meanwhile, particularly in the United States, public investment in science seems to be redirected and concentrated on AI at the expense of other disciplines. And Big Tech companies are consolidating their control over the AI ecosystem. In these ways and others, AI seems to be making everything worse.
This is not the whole story. We should not resign ourselves to AI being harmful to humanity. None of us should accept this as inevitable, especially those in a position to influence science, government, and society. Scientists and engineers can push AI towards a beneficial path. Here’s how.
The Academy’s View of AI
A Pew study in April found that 56 percent of AI experts (authors and presenters of AI-related conference papers) predict that AI will have positive effects on society. But that optimism doesn’t extend to the scientific community at large. A 2023 survey of 232 scientists by the Center for Science, Technology and Environmental Policy Studies at Arizona State University found more concern than excitement about the use of generative AI in daily life—by nearly a three to one ratio.
We have encountered this sentiment repeatedly. Our careers of diverse applied work have brought us in contact with many research communities: privacy, cybersecurity, physical sciences, drug discovery, public health, public interest technology, and democratic innovation. In all of these fields, we’ve found strong negative sentiment about the impacts of AI. The feeling is so palpable that we’ve often been asked to represent the voice of the AI optimist, even though we spend most of our time writing about the need to reform the structures of AI development.
We understand why these audiences see AI as a destructive force, but this negativity engenders a different concern: that those with the potential to guide the development of AI and steer its influence on society will view it as a lost cause and sit out that process.
Elements of a Positive Vision for AI
Many have argued that turning the tide of climate action requires clearly articulating a path towards positive outcomes. In the same way, while scientists and technologists should anticipate, warn against, and help mitigate the potential harms of AI, they should also highlight the ways the technology can be harnessed for good, galvanizing public action towards those ends.
There are myriad ways to leverage and reshape AI to improve peoples’ lives, distribute rather than concentrate power, and even strengthen democratic processes. Many examples have arisen from the scientific community and deserve to be celebrated.
Some examples: AI is eliminating communication barriers across languages, including under-resourced contexts like marginalized sign languages and indigenous African languages. It is helping policymakers incorporate the viewpoints of many constituents through AI-assisted deliberations and legislative engagement. Large language models can scale individual dialogs to address climate–change skepticism, spreading accurate information at a critical moment. National labs are building AI foundation models to accelerate scientific research. And throughout the fields of medicine and biology, machine learning is solving scientific problems like the prediction of protein structure in aid of drug discovery, which was recognized with a Nobel Prize in 2024.
While each of these applications is nascent and surely imperfect, they all demonstrate that AI can be wielded to advance the public interest. Scientists should embrace, champion, and expand on such efforts.
A Call to Action for Scientists
In our new book, Rewiring Democracy: How AI Will Transform Our Politics, Government, and Citizenship, we describe four key actions for policymakers committed to steering AI toward the public good.
These apply to scientists as well. Researchers should work to reform the AI industry to be more ethical, equitable, and trustworthy. We must collectively develop ethical norms for research that advance and applies AI, and should use and draw attention to AI developers who adhere to those norms.
Second, we should resist harmful uses of AI by documenting the negative applications of AI and casting a light on inappropriate uses.
Third, we should responsibly use AI to make society and peoples’ lives better, exploiting its capabilities to help the communities they serve.
And finally, we must advocate for the renovation of institutions to prepare them for the impacts of AI; universities, professional societies, and democratic organizations are all vulnerable to disruption.
Scientists have a special privilege and responsibility: We are close to the technology itself and therefore well positioned to influence its trajectory. We must work to create an AI-infused world that we want to live in. Technology, as the historian Melvin Kranzberg observed, “is neither good nor bad; nor is it neutral.” Whether the AI we build is detrimental or beneficial to society depends on the choices we make today. But we cannot create a positive future without a vision of what it looks like.
This essay was written with Nathan E. Sanders, and originally appeared in IEEE Spectrum.
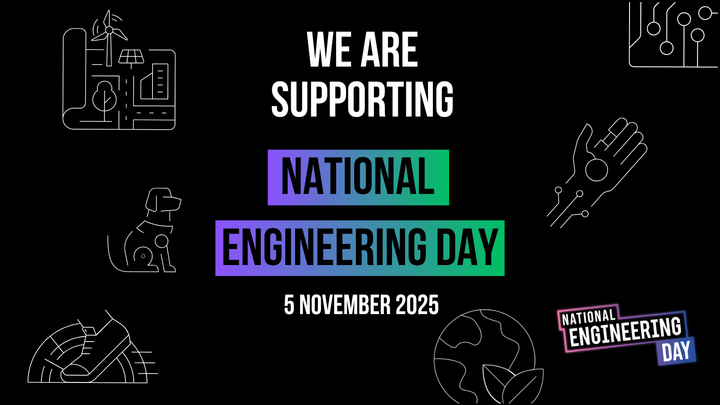
Celebrating the UK’s National Engineering Day 2025
Post Syndicated from Lou Loxley original https://www.raspberrypi.org/blog/celebrating-the-uks-national-engineering-day-2025/
We’re happy to celebrate National Engineering Day in the UK with our friends at the Royal Academy of Engineering. Today they launch the AI-Z of Engineering, an online collection showcasing more than 100 current engineering jobs, and over 100 more engineering jobs envisaged for the future. Their aim is to inspire more young people to pursue engineering careers in areas ranging from artificial intelligence (AI) and robotics to medicine, software engineering, space, and sustainability.
Engineers shape the technologies and industries that define the future — and the systems they build affect jobs and tasks in every sector. As Sir John Lazar, President of the Royal Academy of Engineering and our Chair of Trustees, says about AI technology:
“I’m not a believer that all jobs will just disappear because of AI. If you think of a job as an assemblage of tasks, there’s no question that the tasks in your job will change because AI will work with you on a bunch of things, and this will in turn reshape your job or role. The people who will thrive through this transformation will be those who engage with curiosity, intellectual rigour, scepticism, creativity, problem-solving and teamwork – and these are the skills and attitudes that are taught by engineering and computational thinking.”
Sir John Lazar, President of the Royal Academy of Engineering and Chair of Trustees, Raspberry Pi Foundation.

Why kids still need to learn to code in the age of AI
At the Raspberry Pi Foundation, we believe AI literacy is crucial for all young people. We also believe all young people need to learn to code to be able to shape our future, where AI systems are integrated into all aspects of life. Our position paper “Why kids still need to learn to code in the age of AI” presents five reasons why:
- Even though AI tools can be used to generate code, we still need skilled human programmers to critically review that code.
- Learning to code remains the most effective way to become a skilled human programmer, and allows better understanding of how computers work and what their potential and constraints are.
- Learning to code will open up more economic opportunities, as advances in technology let us solve a wider range of problems using computers.
- Coding is a literacy that gives young people agency and a new way to express themselves, to learn, and to make sense of the world.
- Young people who learn to code now will shape the future, and we need that power to sit with young people from all backgrounds so they can design systems that serve everyone.
Our free resources for young people help them learn to code and get creative with technology to bring their ideas into the world, building their confidence. So whether your kids are just starting their coding journey, or are looking for a new challenge, you can use our resources to support them.

Understanding coding and computers is critical in many engineering roles, so inspiring kids about engineering can also motivate them to try their hand at coding.
How you can get involved with National Engineering Day
There are plenty of ways you can celebrate National Engineering Day. Inspire young people to embark on careers in engineering by sharing the AI-Z of Engineering collection with your school or college, on social media, or on your organisation’s website. The collection is a living resource that will be updated, and contributions are always welcome — both for current jobs and future ones.To find out more ways to get involved with National Engineering Day, you can go download the toolkit.
The post Celebrating the UK’s National Engineering Day 2025 appeared first on Raspberry Pi Foundation.
Любомир Бабуров: Човекът е положен в своя разказ за света
Post Syndicated from Ина Иванова original https://www.toest.bg/lyubomir-baburov-chovekut-e-polozhen-v-svoya-razkaz-za-sveta/

Когато преди 15 години Любомир Бабуров стартира платформата Ratio, вярва, че колкото повече информация дава на потребителите, толкова по-полезна би била тя. Днес вече е сигурен, че
на хората са необходими диалог, любопитство и радостта да размишляват по различни въпроси.
Ratio категорично отказва да фаворизира конкретни гледни точки и предлага да говорим „по научни теми на разбираем език“. Вероятно точно тази рецепта прави подкаста иконичен за различни поколения. Все едно дали ще коментира идеи от областта на астрофизиката, еволюцията на технологиите, човешкия геном, струнната теория, или тъмната страна на пчелите.
Етичен акцент поставят и философските разговори между Любомир Бабуров и проф. Стоян Ставру (обособени в серията Vox nihili). В почти 250 епизода двамата водят дискусии и с други гости за едрите хуманитарни търсения – за свободната воля, смисъла, боговете, дълга, справедливостта, злото, идеята за бъдеще.
Научен разговор на достъпен език е концепция, която не разчита на предизвестен успех в нашите времена на небивал интерес към конспиративни теории, подхранвани от фабрики за тролове и фастфуд послания. Именно защото предизвиква аудиторията (а и екипите на подкаста) да напусне зоната си на комфорт. Най-често срещаният маркетингов подход напоследък е куртоазна игра на сигурно, прицелване в таргет, чиито възможности са предварително преценени и предложеното съдържание не рискува да ги надхвърли. Подобен механизъм вещае постоянно, макар и дискретно снижаване на критериите, особено тези на публиката. Спад. Регрес.
Любомир Бабуров обаче винаги е избирал да прави друго – да говори за това, което му е интересно. И да упражнява паралелно няколко различни професии, които му носят различни видове удовлетворение (освен директор и основател на Ratio той е основател на Българския космически клъстър и CSO в Ozone.bg). Признава, че на нещата, които го ентусиазират, трудно казва „не“.
На ръба между XX и XXI век учи новогръцка филология, като едновременно с това прави сайтове и поддържа форуми. Казва, че това е времето, в което почти не е излизал, живял е доста затворено и приятелите му са били в интернет – американци, италианци, германци. Това е и възрастта, в която се запалва по историята на Стария свят („Класика е момчетата да се интересуват от Римската империя“, усмихва се с доза самоирония). Това вероятно е и възрастта на първоначално натрупване на капитал от идеи. Години по-късно той надгражда с книги по философия и популярна наука.
Книгата, която преобърна приоритетите ми, беше „Себичният ген“ на Докинс. Прочетох я цялата и след това я започнах отново, вече по-внимателно и аналитично. В нея има едно преформулиране на света, което показва как би могъл да изглежда той. Как еволюцията през естествения подбор би работила не само на ниво индивиди, а и на ниво гени. Но отчита и липсата на контрол върху цялото. От една страна, е добре аргументирана, от друга – SciFi. След Докинс започнах да мисля повече.
Следват лекциите по физика на Ричард Файнман, а оттам стига до останалите му книги, става фен на начина, по който Файнман се опитва да осмисли собственото си мислене. Впечатлен е от метода на нобеловия лауреат по физика за 1965 г. да си представя абстрактни квантови системи, сравнявайки ги с конкретни предмети – това подпомага интуитивното разрешаване на проблеми, свързани с поведението на системите.
Покрай Файнман открива и други физици, които му въздействат като философи. Шон Карол го поразява с широтата на концепциите си и с отказа си да говори радикално по големите философски теми, например за Аза и съзнанието. Карол е ученият, който твърди, че за различните нива на разглеждане на света около нас има и различни обяснения. „Не можеш да говориш за ниво „човек“, давайки примери от ниво „квантова система“, което не знам дали е вярно впрочем – усъмнява се Любо Бабуров, – но неговият аргумент е, че ако говорим за свободна воля, да речем, тя работи на ниво „съзнание“, но не и на ниво „кварки“. Шон Карол не е съгласен и да се ползва терминология от физиката за социални динамики и процеси например. Други физици пък пишат за липсата на свободна воля. Твърдят, че ние сме [положени] в детерминистична вселена и в нея няма ниво за свободни действия.“
И до днес тези интереси на Любо от Ratio предопределят отправните точки на епизодите със Стоян Ставру – за него казва, че е човекът, с когото си е говорил най-много в този живот. И е благодарен за тези почти осем години разгорещени дискусии.
Виражите им между идеите на Фуко, Достоевски, Платон, Сократ, Шекспир или Агамбен обаче не изключват търсенето на фундаменталните, научно постижими основи на материята.
За мен по-интересното е да се опитаме да интегрираме нещата, които знаем за света около нас. Затова правя Ratio. Тръгвам от основата, че има физичен свят, ние сме в него и той е познаваем. Колкото повече познания натрупваме, толкова повече се променя и начинът, по който размишляваме за него. Големият разговор е за интерпретацията. Окей съм да чувам серия от мнения, които са различни от моето, това дори ме предизвиква да мисля.
Няма как любопитството и хъсът на Любомир Бабуров да размишлява върху по-широка проблематика да не повлияе и върху самоанализа му. Така че стигаме до страховете. Той споделя, че е привилегирован да няма физически страхове и фобии, макар напоследък да отчита, че в самолет се чувства все по-дискомфортно въпреки стотиците часове полети през годините.
Има различни видове страх. Когато бях много млад, живеех в началото на „Раковска“, около Сточна гара. Кварталът не беше много сигурен, беше си направо опасен, в началото на 2000 г. не беше осветен – тогава се страхувах. Екзистенциални страхове обаче имаме всички. Но мога да дам рецепта за минимизирането им: Албер Камю плюс някакво количество физици, които говорят за физическата смърт на Вселената и липсата на свободна воля. Помагат ти да стигнеш до разбирането, че светът се случва наоколо ти и ти нямаш никакво влияние върху него. Просто по някое време ще умреш. Ако междувременно извлечеш нещо и нещо научиш – това е.
Социалните страхове от войни и противопоставяния, разбира се, не подминават никого от нас. Любомир Бабуров споделя, че според него създават фон на тревожност – именно защото житейски имаме нужда да градим около себе си свят, семейство и сигурност.
И тук започват да се отварят въпроси. Какво например се случва в условия на война? Кое е приоритет? Това, което правиш, или близките ти, за които трябва да създадеш условия да не бъдат в опасност? Ако утре има война в България, оставаш или напускаш страната? Много сериозен въпрос е кое ще избереш – публичното или личното. И в двата случая имаш дълг и отговорност. Според мен никой не знае как би реагирал в подобна ситуация. Притеснявам се, че аз бих реагирал първосигнално, че бих останал заради разбирането и амбицията си, че трябва да свърша работа и да направя някакви неща. И от това биха страдали близките ми.
Ratio като инициатива всъщност изпълнява функциите на необходимо, мечтано, стойностно пространство за създателя и екипа си. Но също така подкастът и форумите (на 8 ноември предстои есенното издание) разчитат на значими, влиятелни лектори, а и сами имат реномето на престижна платформа за научни разговори.
Затова и стигаме до авторитетите.
Сложна тема е, ние сме разсъждавали върху нея със Стоян Ставру неведнъж. От една страна, тук имаме генеалогия – редица хора, които са размишлявали по даден проблем, и отделно имаме тяхното собствено ниво на експертност. Не знам дали в момента е заради технологиите, или идеологиите, но днес всички си вярват, че знаят всичко. За съжаление, „авторитет“ звучи почти като мръсна дума. През това, което ние правим, се опитваме да покажем важността на хората, които знаят за какво говорят. Не вярвам обаче, че ще можем да противодействаме на загубата на доверие в авторитетите.
Информацията в момента е твърде дифузна и може да бъде взета от различни източници, вместо като предишните поколения да отидем при конкретен специалист – лекар, инженер, физик. Да, професионално те са с променливо качество, защото са хора, но имат своето ниво на експертност. Сега питаме ChatGPT.
И понеже интелигентният човек обглежда и процесите, и себе си със спасителното чувство на дистанцираност, Любо от Ratio може да си позволи капка шеговит самоанализ: „Аз съм класическият пример за човек, който не е станал специалист. Имам много интереси, правя добре много неща, но не съм тесен специалист по нищо.“
Усещането на Любомир Бабуров за гранулиран свят, за пъзел от микросветогледите на отделни групи хора, ни води до човека, който винаги е бил положен в собствения си разказ за света. „В момента просто разказите са много – казва той. – Консумираме брутално количество информация, а гладът за информация си е същият.“
Споделя, че той също намира време да слуша подкасти – когато шофира и когато ходи пеша. Напоследък следи българските „Дневен ред“, „Телевизия по радиото“ и „Говори интернет“, подкаста на Сам Харис, както и култовия Very Bad Wizards. И понеже дори хора, жонглиращи с различни ангажименти като него, успяват да си вземат кратък отпуск, през август Любо е изслушал дългите шестчасови епизоди на историка Дан Карлин за Първата световна война.
Буквално дни преди есенното издание на Ratio Forum, свързано с екосистемите, си позволявам да извадя от контекста на програмата една фраза: Какво се крие под повърхността.
Ние няма да казваме неща, които са скрити – те са пред очите ни, но не ги виждаме или ни е страх от тях. Обикновено имаме някаква интерпретация за света наоколо, имаме приоритети. И в този смисъл, надявам се под повърхността при мен да има наченки за разбиране на света, да бъда адекватен, да допринасям за нещо стойностно. Да предизвиквам размисъл и заедност. Позициите ни често са доста по-гъвкави, отколкото си мислим, имаме опцията да се променяме и да се вкарваме в правилните обстоятелства.
Хората, които тихо и кротко променят средата, формират общности и задават посоки, в които има смисъл да тръгнем заедно. Тук ви срещаме с тях. Това са „Тези хора“.
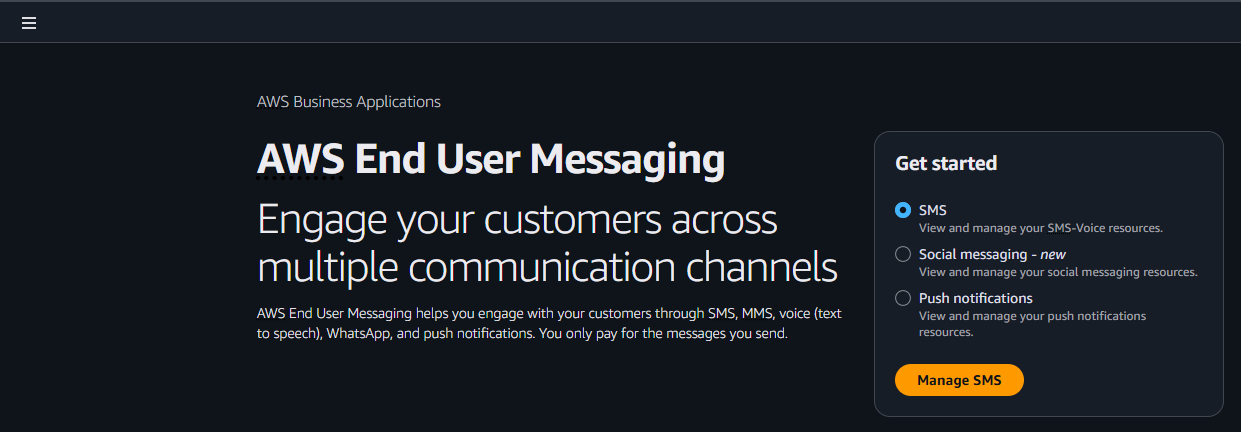
A Guide to Sending International SMS with US Toll-Free Numbers and AWS End User Messaging
Post Syndicated from Brett Ezell original https://aws.amazon.com/blogs/messaging-and-targeting/a-guide-to-sending-international-sms-with-us-toll-free-numbers-and-aws-end-user-messaging/
AWS End User Messaging now supports international SMS capabilities for US Toll-Free Numbers (TFNs). This new feature allows businesses to use a single US TFN to send SMS messages to over 150 countries, simplifying global outreach. It primarily benefits customers who need to send one-way transactional alerts—like one-time passwords (OTPs) or shipping notifications—and businesses that want to rapidly prototype and test their messaging strategy in new international markets without the overhead of procuring country-specific numbers.
This guide will walk you through the pros and cons of this feature and show you how to enable it and when to use it versus traditional, country-specific sending methods.
What Are International US Toll-Free Numbers?
An International US Toll-Free Number is a standard US TFN that has been enabled with the capability to send SMS messages to destinations outside of the United States. This feature is backward compatible, meaning you can enable it on any new or existing US TFNs in your account.
How to Enable International Sending
There are three primary ways to enable this feature for your US Toll-Free Numbers:
- Enable international sending when registering a new number in the console.
- Enable international sending for an existing number in the console.
- Enable international sending for an existing number via the AWS CLI.
1. Enable When Registering a New US Toll-Free Number (Console)
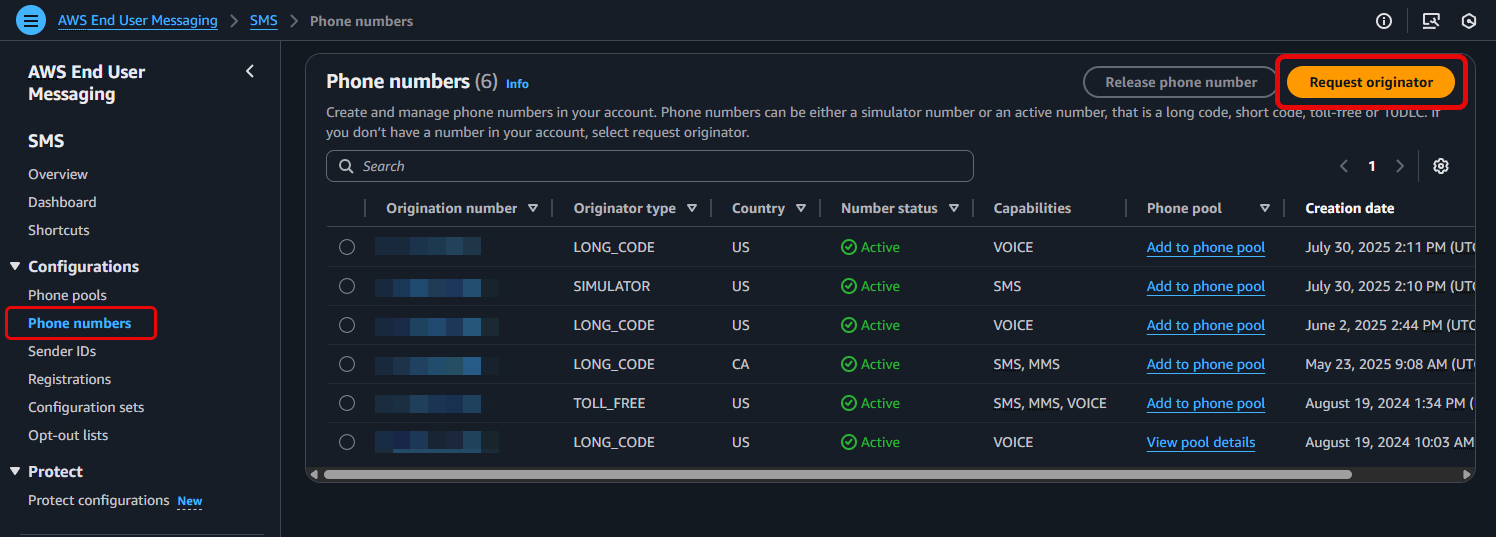
- From the AWS End User Messaging console, navigate to Manage SMS
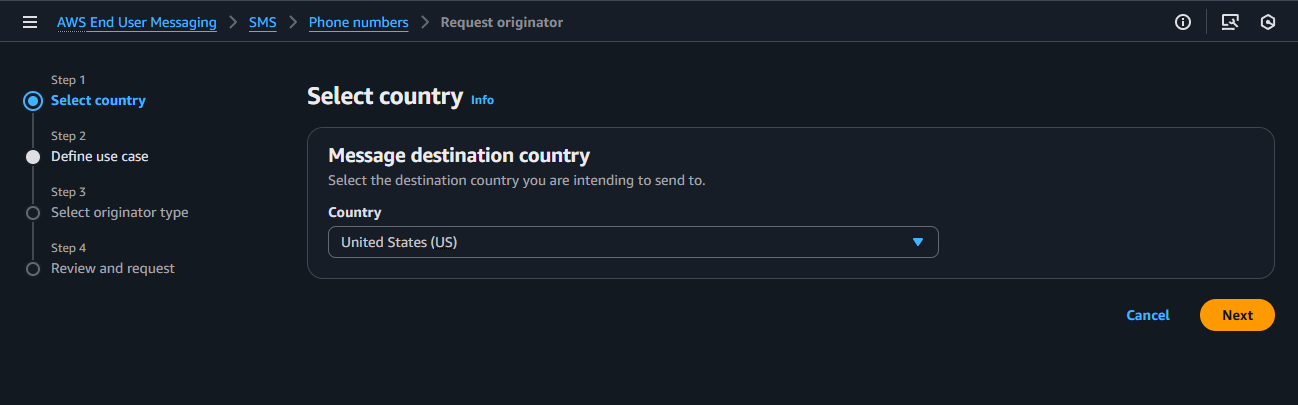
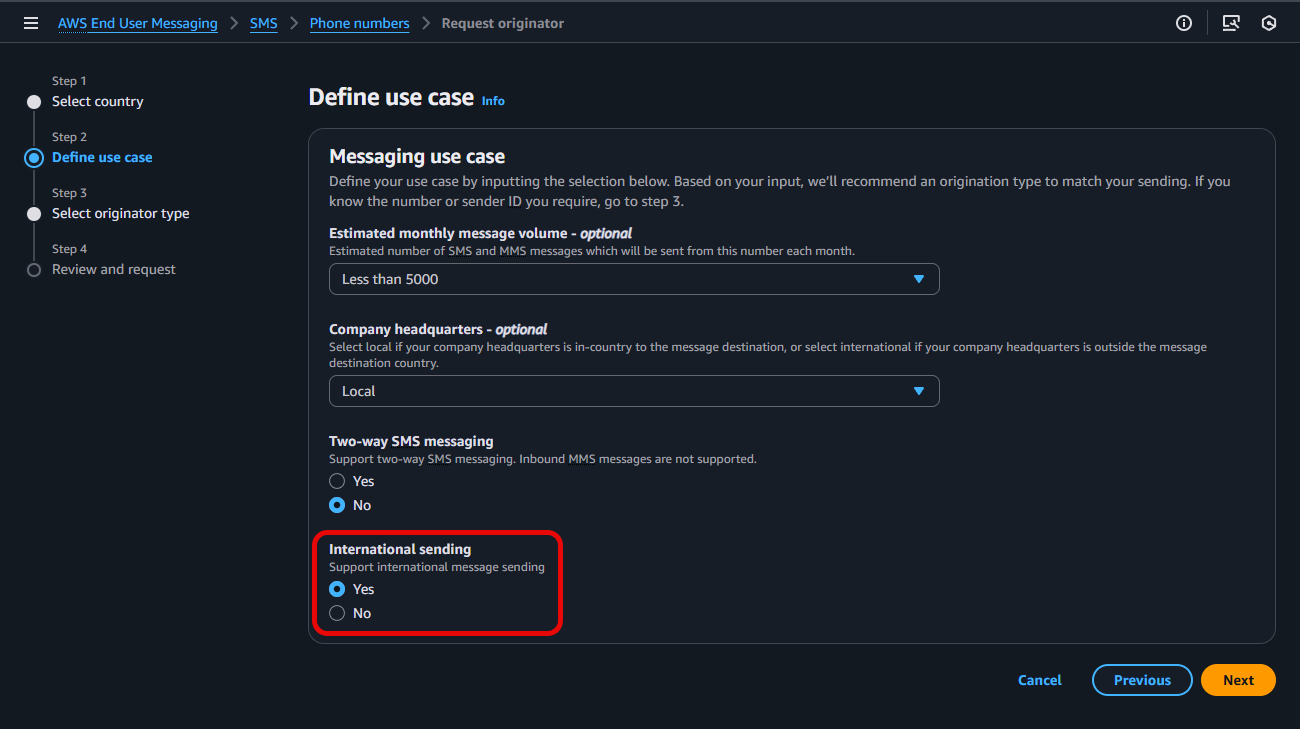
- From the AWS End User Messaging console, navigate to Configurations > Phone numbers > and select Request originator
- Step 1: Select country, select the United States (US) as your destination country
- Under Step 2: Define use case, configure the various options listed for your intended Messaging use case, and select Yes to enable International sending, prior to clicking Next
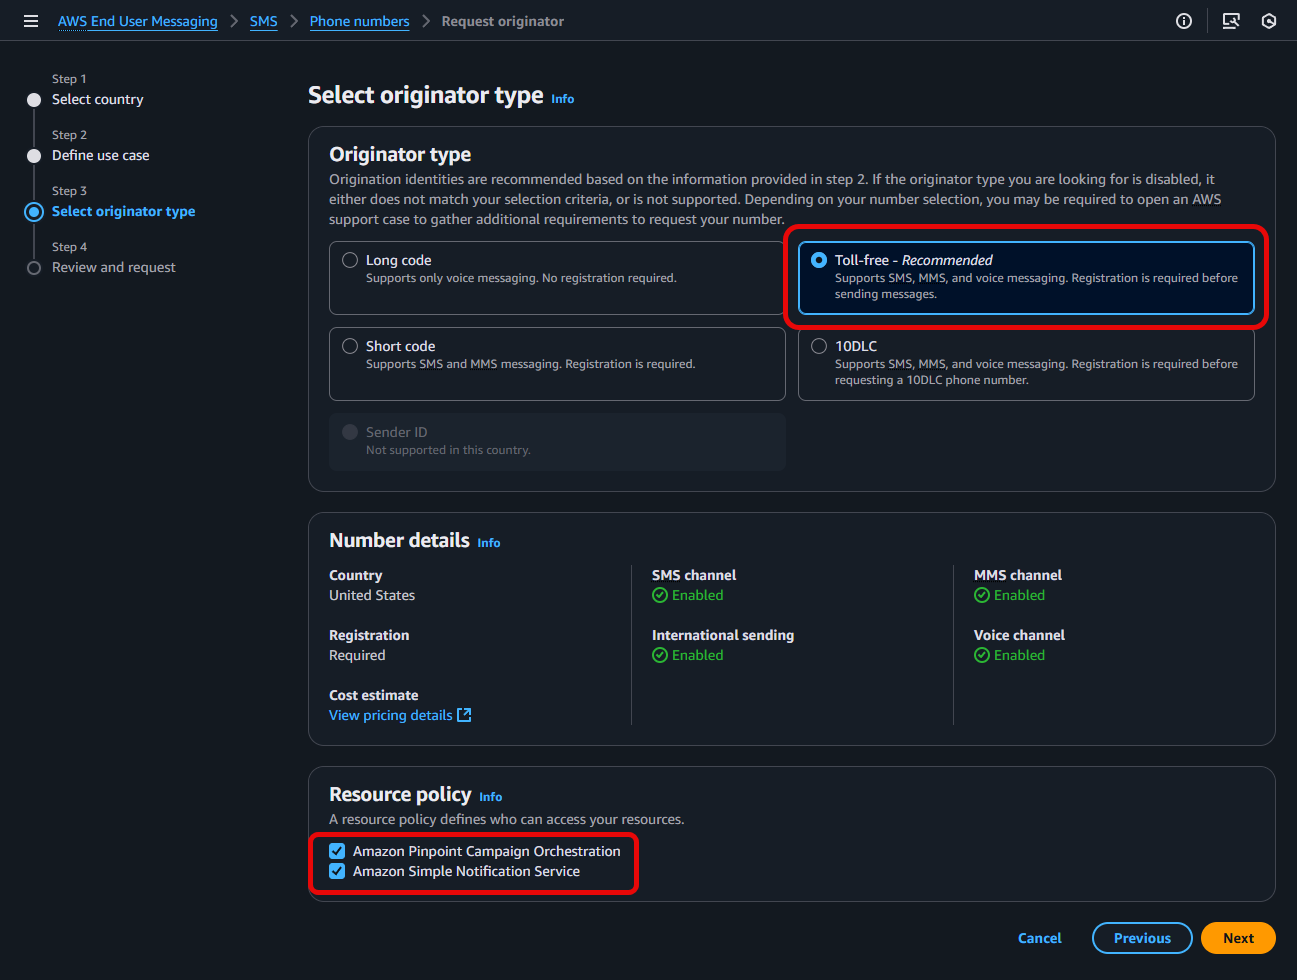
- For Step 3: Select originator type, select Toll-free, validate your Resource policy choices, select Next
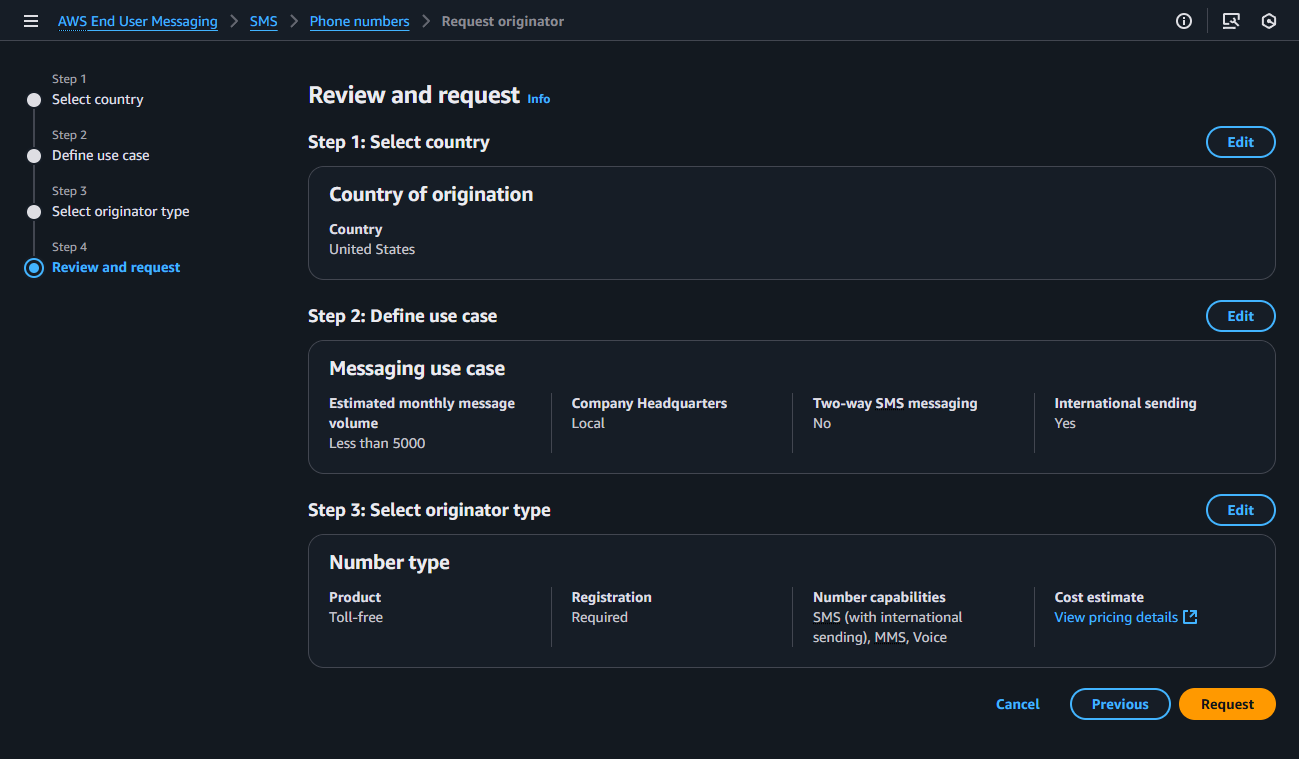
- In Step 4: Review and request: Verify the information you entered is correct and select Request. Please note: US Toll-Free Number registration requests can take approximately 15 business days to be approved.
For more information, see Request a phone number in AWS End User Messaging SMS
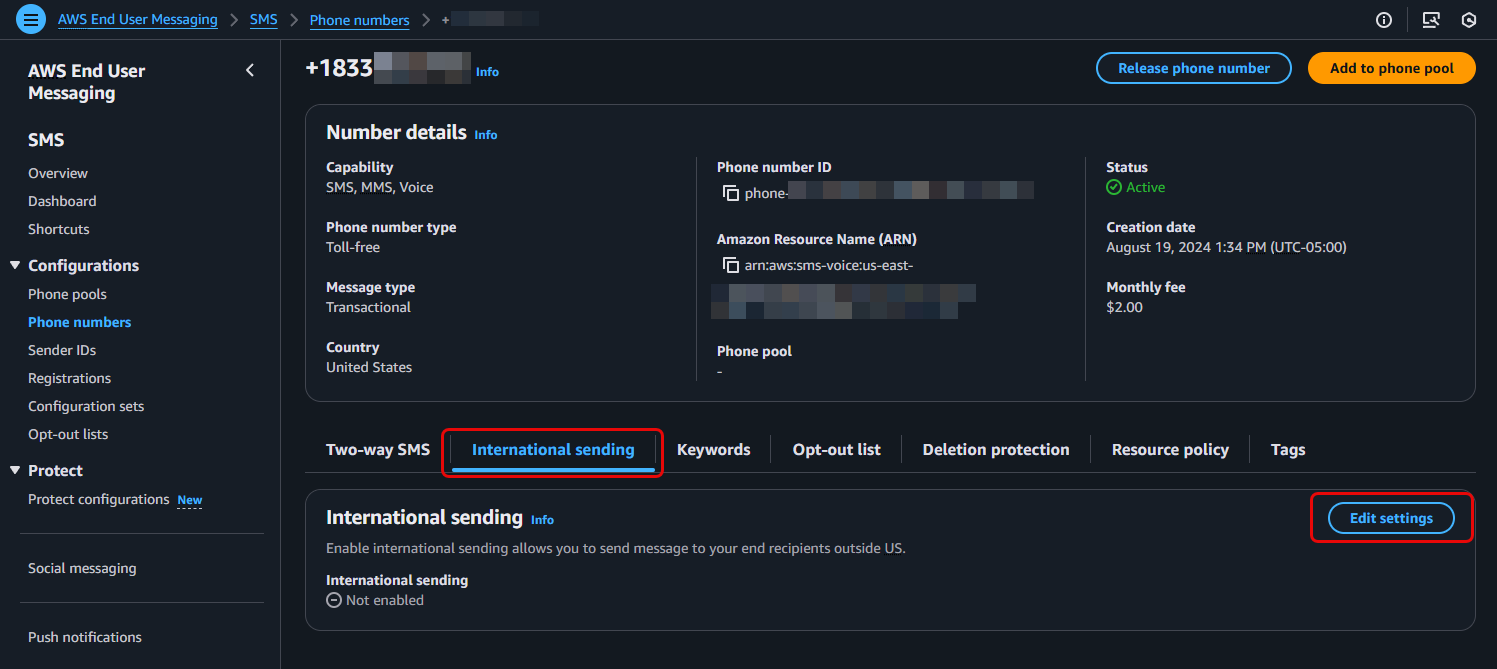
2. Enable for an Existing US Toll-Free Number (Console or CLI)
If you have already acquired a TFN, you can enable the international sending feature at any time.
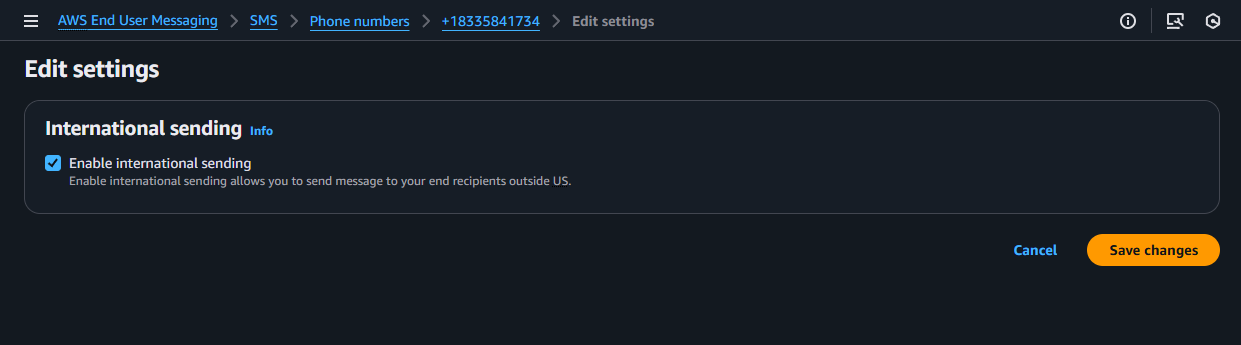
Using the AWS Management Console:
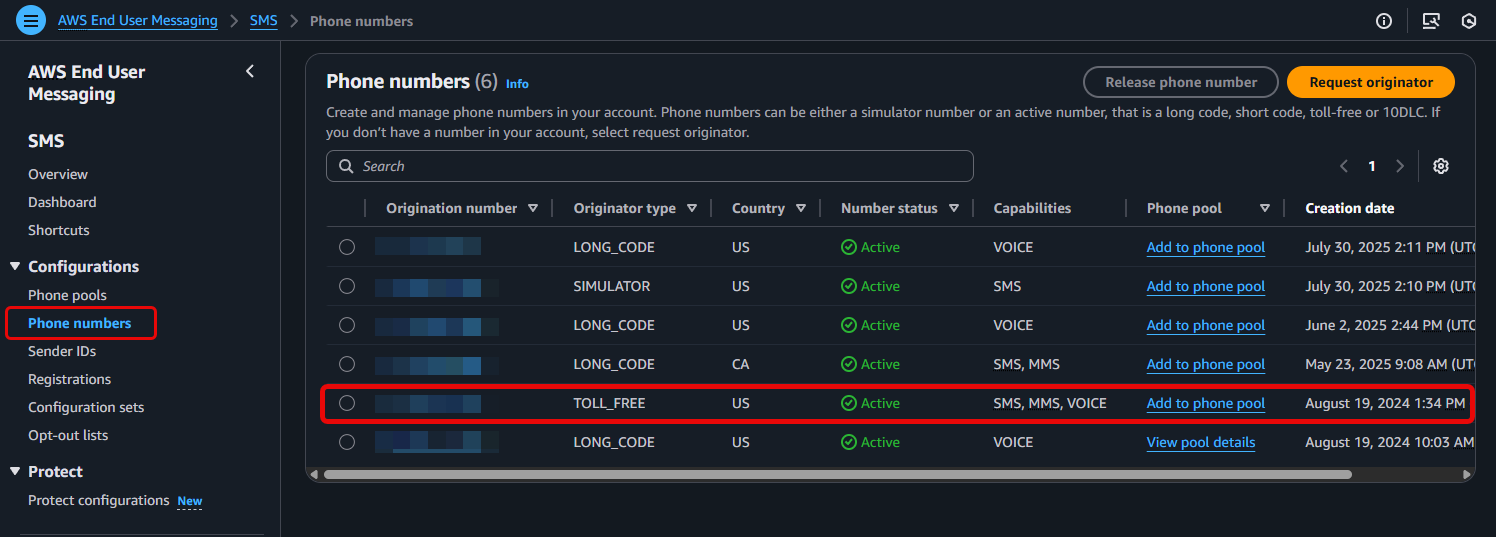
- Navigate to Configurations > Phone numbers > and select an existing Toll-free number
- Locate the International sending tab and choose Edit settings
- Check the Enable international sending capability box in your phone number details

- Save Changes
Using the AWS CLI
The update-phone-number command allows you to modify a phone number’s capabilities, while the describe-phone-numbers command allows you to verify its status.
1. To Enable International Sending:
Use the --international-sending-enabled flag
aws pinpoint-sms-voice-v2 update-phone-number \
    --phone-number-id "phone-a1b2c3d4e5f67890" \
    --international-sending-enabled \
    --region us-east-1
Note: Replace "phone-a1b2c3d4e5f67890" with your actual phone number’s ID
2. To Disable International Sending:
Use the --no-international-sending-enabled flag
aws pinpoint-sms-voice-v2 update-phone-number \
    --phone-number-id "phone-a1b2c3d4e5f67890" \
    --no-international-sending-enabled \
    --region us-east-1
Expected Response (for update-phone-number):
A successful command returns the full JSON object for the phone number. Confirm the change by checking that the InternationalSendingEnabled value is true
{
    "PhoneNumberArn": "arn:aws:sms-voice:us-east-1:111122223333:phone-number/phone-a1b2c3d4e5f67890",
    "PhoneNumberId": "phone-a1b2c3d4e5f67890",
    "PhoneNumber": "+18005550199",
    "Status": "ACTIVE",
    "IsoCountryCode": "US",
    "MessageType": "TRANSACTIONAL",
    "NumberCapabilities": [
        "SMS"
    ],
    "NumberType": "TOLL_FREE",
    "MonthlyLeasingPrice": "2.00",
    "TwoWayEnabled": true,
    "InternationalSendingEnabled": true,
    "CreatedTimestamp": "2025-08-15T10:30:00.123Z"
}
3. To Verify the Current Status:
Use the describe-phone-numbers command with your Phone Number ID to check its current configuration at any time.
aws pinpoint-sms-voice-v2 describe-phone-numbers \
    --phone-number-ids "phone-a1b2c3d4e5f67890" \
    --region us-east-1
Benefits and Limitations
This feature offers a powerful new way to reach a global audience, but it’s important to understand where it shines and what its limitations are.
Benefits (Advantages)
- Global Reach with a Single Number: Send SMS to over 150 countries using a single, existing US TFN.
- Simplified Management: Avoid the operational overhead and cost of purchasing and managing a fleet of country-specific phone numbers.
- Rapid Prototyping and Testing: Quickly test messaging campaigns in new international markets before committing to the best practice approach of acquiring dedicated in-country numbers.
- Cost Optimization for One-Way Alerts: Provides a cost-effective method for sending high-volume, one-way transactional messages like OTPs, appointment reminders, and shipping notifications globally.
Limitations & Technical Considerations
- Two-Way SMS is Limited to the US and Canada: Reliable, two-way SMS conversations are only supported for recipients in the United States and Canada.
- One-Way Only for All Other Countries: For all other destinations, this is a one-way only.
- Best-Effort Deliverability: Sending outside of the US and Canada is on a “best-effort” basis. The phone number that appears on the recipient’s device may be replaced with a local number or Sender ID, which is why two-way messaging will not work for these destinations. For more details on maximizing delivery, please read A Guide to Optimizing SMS Delivery and Best Practices.
- Managed Opt-Out is Not Guaranteed Internationally: The automatic STOP reply functionality does not work for destinations outside of the US and Canada. For international recipients, you must provide an alternative opt-out method.
- Standard Throughput (3 MPS): International TFNs have a default throughput of 3 Message Parts Per Second (MPS). For high-volume, high-throughput campaigns, dedicated country-specific numbers (like short codes) are the recommended best practice.
Understanding the Cost
The pricing for this feature is straightforward:
- No Additional Monthly Fees: There is no extra charge to enable the international sending capability on your US TFN. You only pay the standard monthly lease for the number itself.
- Pay-Per-Use Messaging: You are billed for each outbound SMS message at the standard, per-message rate for the destination country.
For a complete and up-to-date list of prices by country, please visit the AWS End User Messaging Pricing page.
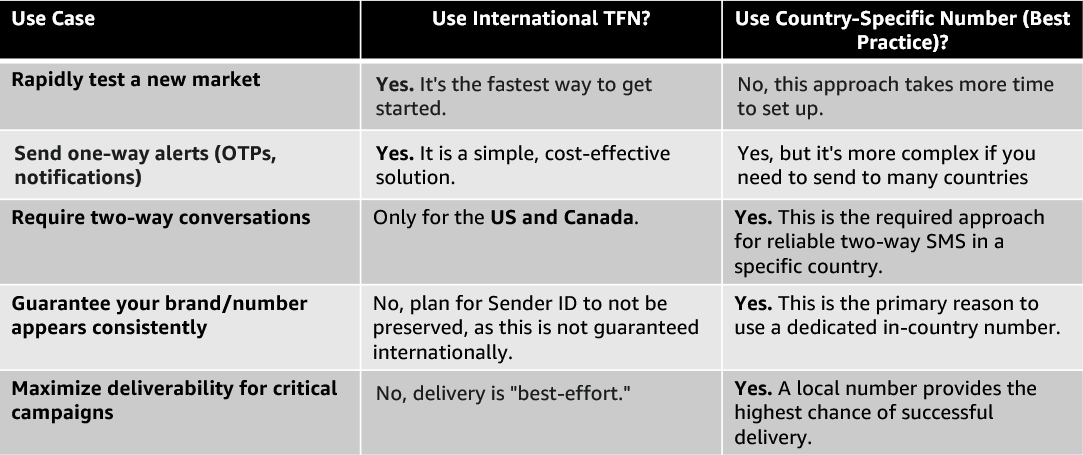
When to Use This vs. Country-Specific Numbers
Choosing the right tool depends on your use case. Here’s a simple comparison:
Considerations and Next Steps
Once you have enabled your international sending over US Toll-Free Numbers, you can enhance your messaging strategy by considering resilience, monitoring, and scalability. The following resources provide best practices for enhancing your sending.
- Monitoring Delivery: To monitor delivery rates and patterns by country, you can use Configuration Sets to create event destinations. This allows you to stream SMS events (like
DELIVEREDorFAILED) to services like Amazon CloudWatch or Amazon Data Firehose for analysis. - Building Resilience: For implementing robust delivery, including automatic retry strategies for failed messages, we recommend reading our guide: How to build resilient SMS delivery with AWS End User Messaging.
- Broader Global Strategy: For a deeper look at the strategic elements of a global SMS program, our post on How to Manage Global Sending of SMS with AWS End User Messaging provides valuable insights and includes a template for organizing use cases and selecting originators.
Conclusion
International SMS for US Toll-Free Numbers is a powerful strategic tool for businesses looking to simplify their global messaging. It excels at enabling rapid testing in new markets and efficiently delivering one-way transactional alerts across the globe from a single number.
However, it is not a replacement for the best practice of using dedicated, in-country phone numbers when reliable two-way conversations and guaranteed branding are critical to your campaign’s success. By understanding its benefits and limitations, you can strategically use this feature to get going quickly while planning a long-term move towards country-specific codes for your most important markets.
Metric Tip
Post Syndicated from xkcd.com original https://xkcd.com/3164/

Orchestrating big data processing with AWS Step Functions Distributed Map
Post Syndicated from Biswanath Mukherjee original https://aws.amazon.com/blogs/compute/orchestrating-big-data-processing-with-aws-step-functions-distributed-map/
Developers seek to process and enrich semi-structured big data datasets with durably orchestrated network-based workflows. For example, during quarterly earnings season, finance organizations run thousands of market simulations simultaneously to provide timely insights for scenario planning or risk management—these workloads require coordination between raw datasets and on-premise servers to provide the latest market information.
AWS Step Functions is a visual workflow service capable of orchestrating over 14,000 API actions from over 220 AWS services to build distributed applications. Now, Step Functions Distributed Map streamlines big data dataset transformation by processing Amazon Athena data manifest and Parquet files directly. Using its Distributed Map feature, you can process large scale datasets by running concurrent iterations across data entries in parallel. In Distributed mode, the Map state processes the items in the dataset in iterations called child workflow executions. You can specify the number of child workflow executions that can run in parallel. Each child workflow execution has its own, separate execution history from that of the parent workflow. By default, Step Functions runs 10,000 parallel child workflow executions in parallel.
Distributed Map can process AWS Athena data manifest and Parquet files directly, eliminating the need for custom pre-processing. You also now have visibility into your Distributed Map usage with new Amazon CloudWatch metrics: Approximate Open Map Runs Count, Open Map Run Limit, and Approximate Map Runs Backlog Size.
In this post, you’ll learn how to use AWS Step Functions Distributed Map to process Athena data manifest and Parquet files through a step-by-step demonstration.
This post is part of a series of post about AWS Step Functions Distributed Map:
|
Use case: IoT sensor data processing
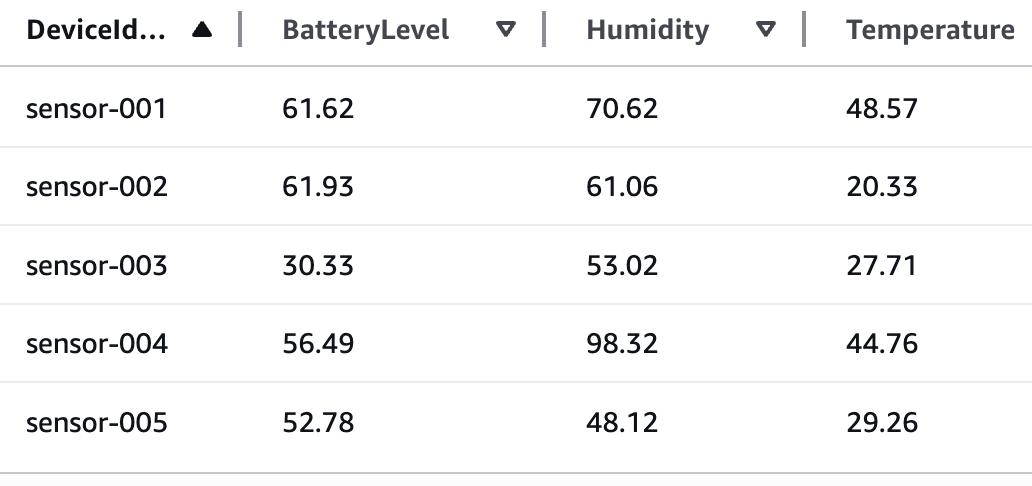
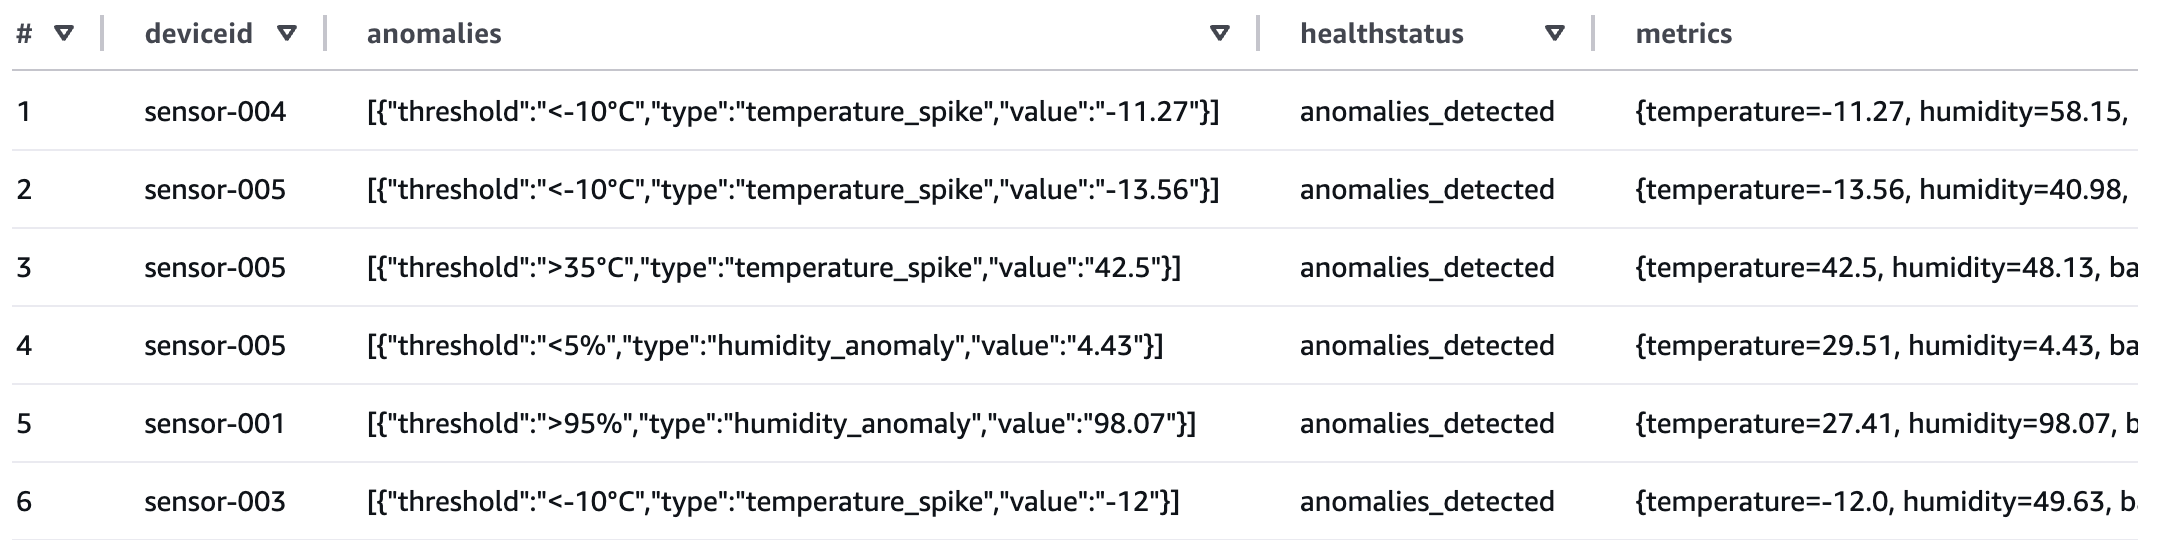
You’ll build a sample application that demonstrates processing IoT sensor data in Parquet format using Step Functions Distributed Map. These Parquet data files and a manifest file containing the list of the data files are exported from Athena. The data temperature, humidity, and lbattery level from different devices. The following table shows sample of sensor data:
Example IoT sensor data
Your objective is to use the Athena data manifest file, get the list of Parquet files, and iterate over the data in the files to detect anomalies and also stream the processed data through Amazon Kinesis Data Firehose to an Amazon S3 bucket for further analytics using Athena queries. Following is the criteria to detect anomaly:
- Low battery conditions: less than 20%
- Humidity anomalies: more than 95% or less than 5%
- Temperature spikes: more than 35°C or less than -10°C
The following diagram represents the AWS Step Functions state machine:
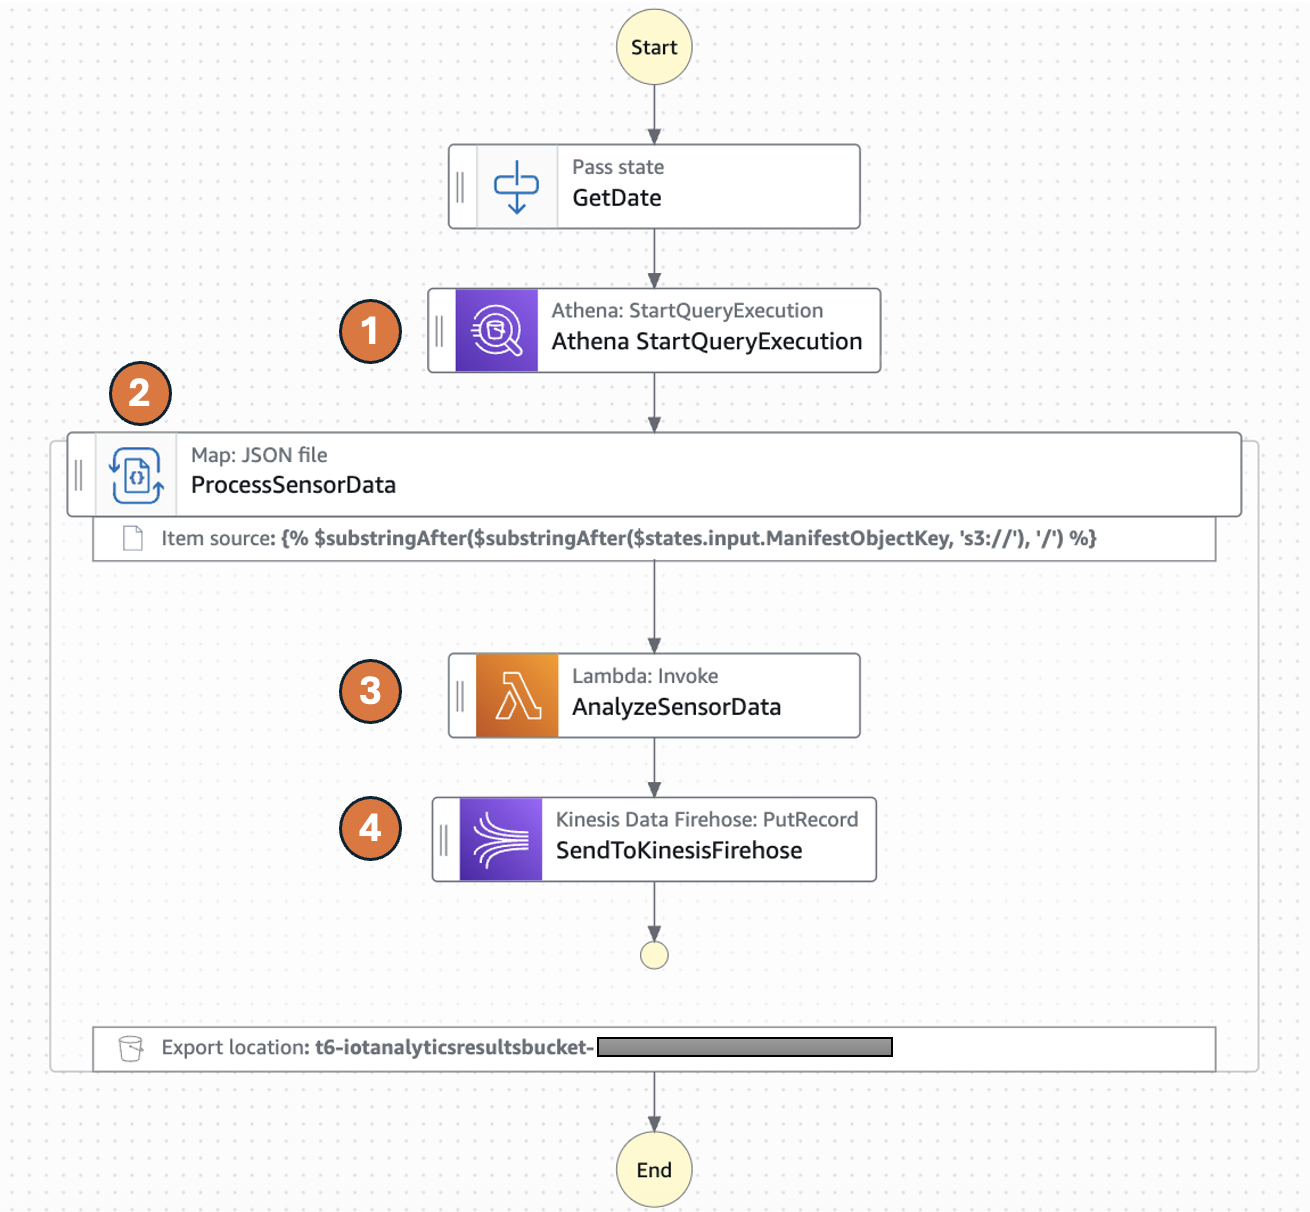
Parquet files processing workflow
- The Distributed Map runs an Athena query which generates Parquet data files and an Athena manifest file (csv). The manifest file contains the list of Parquet data files.
- Distributed Map processes these Parquet data files in parallel using child workflow executions. You can control the number of child workflow executions that can run in parallel using MaxConcurrency parameter. See Step Functions service quotas to learn more about concurrency limits.
- Each child workflow execution invokes an AWS Lambda function to process the respective Parquet file. The Lambda function processes individual sensor readings and detects anomalies according to the preceeding logic and returns a processed sensor data summary response.
- The child workflow sends the summary response record to Amazon Kinesis firehose stream which stores the results in a specified Amazon S3 results bucket.
The following Athena Start QueryExecution state runs an UNLOAD query to generate data files in Parquet format and a manifest file in CSV. The output will be stored in the S3 bucket specified in the UNLOAD query and the manifest file will be stored in the S3 bucket configured for the Athena workgroup.
The following ItemReader is configured to use a manifest type of “ATHENA_DATA” with “PARQUET” data input.
Additional supported InputType options are CSV and JSONL. All objects referenced in a single manifest file must have the same InputType format. You specify the Amazon S3 bucket location of Athena manifest CSV file under Arguments.
The context object contains information in a JSON structure about your state machine and execution. Your workflows can reference the context object in a JSONata expression with $states.context.
Within a Map state, the Context object includes the following data:
For each Map state iteration, Index contains the index number for the array item that is being currently processed, Key is available only when iterating over JSON objects, Value contains the array item being processed, and Source contains one of the following:
- For state input, the value will be : STATE_DATA
- For Amazon S3 LIST_OBJECTS_V2 with Transformation=NONE, the value will show the S3 URI for the bucket. For example: S3://amzn-s3-demo-bucket.
- For all the other input types, the value will be the Amazon S3 URI. For example: S3://amzn-s3-demo-bucket/object-key.
Using this newly introduced Source field in the context object, you can connect the child executions with the source object.
Prerequisites
- Access to an AWS account through the AWS Management Console and the AWS Command Line Interface (AWS CLI). The AWS Identity and Access Management (IAM) user that you use must have permissions to make the necessary AWS service calls and manage AWS resources mentioned in this post. While providing permissions to the IAM user, follow the principle of least-privilege.
- AWS CLI installed and configured. If you are using long-term credentials like access keys, follow manage access keys for IAM users and secure access keys for best practices.
- Git Installed
- AWS Serverless Application Model (AWS SAM) installed
- Python 3.13+ installed
Set up the state machine and sample data
Run the following steps to deploy the Step Functions state machine.
- Clone the GitHub repository in a new folder and navigate to the project root folder.
- Run the following command to install required Python dependencies for the Lambda function.
- Build the application.
- Deploy the application
- Enter the following details:
- Stack name: The CloudFormation stack name (for example, sfn-parquet-file-processor)
- AWS Region: A supported AWS Region (for example, us-east-1)
- Keep rest of the components to default values.
Note the outputs from the AWS SAM deploy. You will use them in the subsequent steps.
- Run the following command to generate sample data in csv format and upload it to an S3 bucket. Replace
<IoTDataBucketName>with the value fromsam deployouptut.
Create the Athena database and tables
Before you can run queries, you must set up an Athena database and table for your data.
- From Amazon Athena console, navigate to workgoups, select the workgroup named “primary”. Select Edit from Actions. In the query result configuration section, select the options as follows:
- Management of query results – select customer managed
- Location of query results – enter s3://<IoTDataBucketName>. Replace
<IoTDataBucketName>with the value fromsam deployoutput. - Choose Save to save the changes to the workgroup
- Select Query editor tab and run the following commands to create database and tables
- Create an Athena table in database iotsensordata that references the S3 bucket containing the raw sensor data. In this case it will be
<IoTDataBucketName>. Replace<IoTDataBucketName>with the value fromsam deployoutput. - Create an Athena table in database iotsensordata that references the S3 bucket having the analytics results streamed from Kinesis Data Firehose. Replace
<IoTAnalyticsResultsBucket>with value fromsam deployoutput. And replace<year>with the current year (e.g 2025).
Start your state machine
Now that you have data ready and Athena set up for queries, start your state machine to retrieve and process the data.
- Run the following command to start execution of the Step Functions. Replace the
<StateMachineArn>and<IoTDataBucketName>with the value from sam deploy output..The Step Functions state machine has the Athena
StartQueryExecutionstate which has anUNLOADquery that generates the sensor data files in a parquet format and a manifest file in CSV format. The manifest will have 5 rows referencing the 5 parquet files. The state machine will process these 5 parquet files in one map run. - Run the following command to get the details of the execution. Replace the
executionArnfrom the previous command. - After you see the status
SUCCEEDED, run the following command from Athena query editor to check the processed output from Kinesis Data Firehose that was streamed to S3 bucket referenced by the Athena table created in step 4 of the preceding section.
If any of the sensor data exceeds the thresholds, the healthstatus attribute will be set to “anomalies_detected”. The workflow produced a summary table of metadata which you can now query for reporting.
Review workflow performance
Using the following observability metrics, you can review key performance behavior of your data processing workflow.
The AWS/States namespace includes the following new metrics for all Step Functions Map Runs.
OpenMapRunLimit: This is the maximum number of open Map Runs allowed in the AWS account. The default value is 1,000 runs and is a hard limit. For more information, see Quotas related to accounts.ApproximateOpenMapRunCount: This metric tracks the approximate number of Map Runs currently in progress within an account. Configuring an alarm on this metric using the Maximum statistic with a threshold of 900 or higher can help you take proactive action before reaching theOpenMapRunLimitof 1,000. This metric enables operational teams to implement preventive measures, such as staggering new executions or optimizing workflow concurrency, to maintain system stability and prevent backlog accumulation.ApproximateMapRunBacklogSize: This metric shows up when theApproximateOpenMapRunCounthas reached 1,000 and there are backlogged Map Runs waiting to be executed. Backlogged Map Runs wait at the MapRunStarted event until the total number of open Map Runs is less than the quota.
The following graph shows an example of these new metrics. Use the maximum statistic to visualize these metrics. ApproximateMapRunBacklogSize metrics appear after accounts start getting throttled on the OpenMapRunLimit limit. The OpenMapRun (orange line) is the account hard limit of 1,000 shown as a static line. The ApproximateOpenMapRunCount (violet line) is the current number of active OpenMap runs. The ApproximateMapRunBacklogSize (green line) indicates the map runs waiting in backlog to be processed. When the ApproximateOpenMapRunCount is lower than 1000 (OpenMapRun limit) there are no map runs in backlog. However, when the count reaches the OpenMapRun limit, the backlog of map runs starts to build up. After the active runs complete, the backlog will start to drain out and new runs will begin execution.
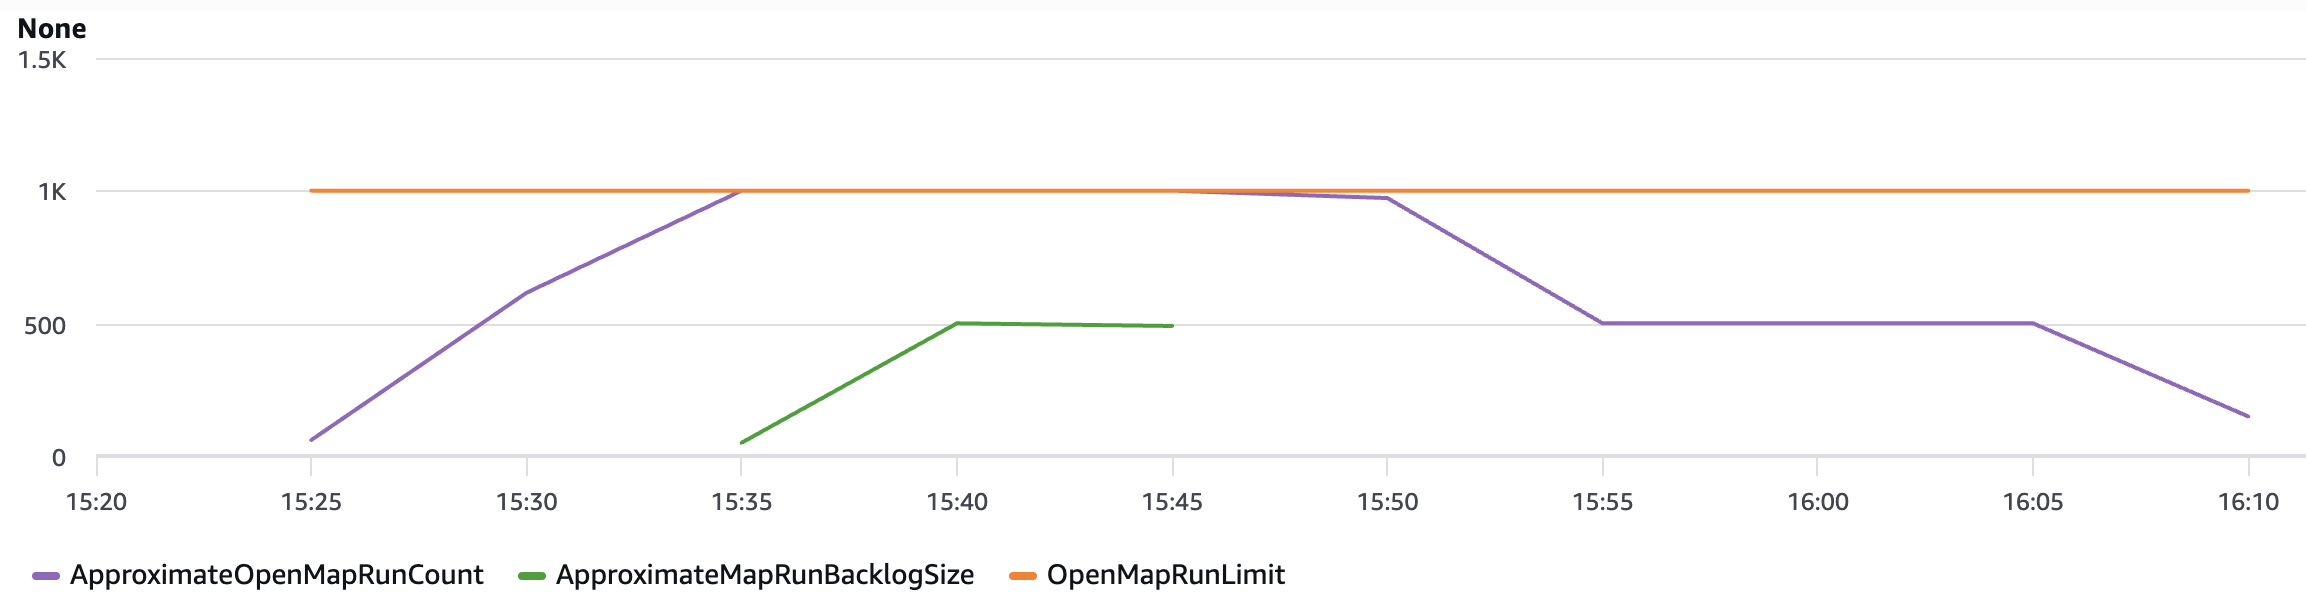
Graphed metrics from Amazon CloudWatch
Clean up
To avoid costs, remove all resources created for this post once you’re done. From the Athena query editor, run the following commands:
Run the following commands from the AWS CLI after replacing the <placeholder> variable to delete the resources you deployed for this post’s solution:
Conclusion
With this update, Distributed Map now supports additional data inputs, so you can orchestrate large-scale analytics and ETL workflows. You can now process Amazon Athena data manifest and Parquet files directly, eliminating the need for custom pre-processing. You also now have visibility into your Distributed Map usage with the following metrics: Approximate Open Map Runs Count, Open Map Run Limit, and Approximate Map Runs Backlog Size.
New input sources for Distributed Map are available in all commercial AWS Regions where AWS Step Functions is available. For a complete list of AWS Regions where Step Functions is available, see the AWS Region Table. The improved observability of your Distributed Map usage with new metrics is available in all AWS Regions. To get started, you can use the Distributed Map mode today in the AWS Step Functions console. To learn more, visit the Step Functions developer guide.
For more serverless learning resources, visit Serverless Land.
Optimizing nested JSON array processing using AWS Step Functions Distributed Map
Post Syndicated from Biswanath Mukherjee original https://aws.amazon.com/blogs/compute/optimizing-nested-json-array-processing-using-aws-step-functions-distributed-map/
When you’re working with large datasets, you’ve likely encountered the challenge of processing complex JSON structures in your automated workflows. You need to preprocess arrays within nested JSON objects before you can run parallel processing on them. Extracting data used to require custom code and extra processing steps, delaying you from building your core application logic.
With AWS Step Functions Distributed Map, you can process large datasets with concurrent iterations of workflow steps across data entries. Using the enhanced ItemsPointer feature of Distributed Maps, you can extract array data directly from JSON objects stored in Amazon S3. Alternatively, for JSON object as state input, you can use Items (JSONata) or ItemsPath (JSONPath). With this enhancement you can point directly to arrays nested within JSON structures, eliminating the need for custom preprocessing of your data. With ItemsPointer, Items, and ItemsPath you can select the nested array data and simplify your workflows.
In this post, we explore how to optimize processing array data embedded within complex JSON structures using AWS Step Functions Distributed Map. You’ll learn how to use ItemsPointer to reduce the complexity of your state machine definitions, create more flexible workflow designs, and streamline your data processing pipelines—all without writing additional transformation code or AWS Lambda functions.
This post is part of a series of post about AWS Step Functions Distributed Map:
|
Use case: e-commerce product data enrichment
In this e-commerce use case example, you’ll build a sample application that demonstrates processing of product inventory data for an e-commerce application using AWS Step Functions Distributed Map. The application receives a JSON file from an upstream application containing an array of product information. The Step Functions workflow reads the JSON file containing product data from an S3 bucket and iterates over the array to enrich each product data in the array.
The following diagram presents the AWS Step Functions state machine.
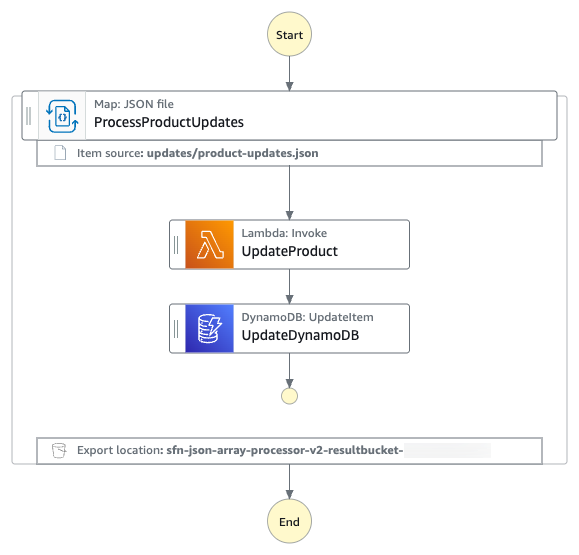
JSON array processing workflow
The JSON array is processed using the following workflow:
- The state machine reads the product-updates.json file from an input S3 bucket. The file contains a JSON array of products.
- The Distributed Map state in the state machine, selects the JSON array node using
ItemsPointerand iterates over the JSON array. - For each of the items within the array, the state machine invokes a Lambda function for data enrichment. The Lambda function adds product stock and price information to the product data.
- The state machine saves the updated product data in an Amazon DynamoDB table.
- Finally, the state machine uploads the execution metadata into an output S3 bucket. See limits related to state machine executions and task executions.
MaxConcurrency can be configured to specify the number of child workflow executions in a Distributed Map that can run in parallel. If not specified, then Step Functions doesn’t limit concurrency and runs 10,000 parallel child workflow executions.
You can read a JSON file from a S3 bucket using ItemReader and its sub-fields. If the JSON file, from the S3 bucket, contains a nested object structure, you can select the specific node with your data set with an ItemsPointer. For example, the following input JSON file:
The following JSONata-based workflow configuration extracts a nested list of products from productUpdates/items:
For JSONPath-based workflow note that Arguments is replaced with Parameters:
The ItemReader field is not needed when your dataset is JSON data from a previous step. ItemsPointer is only applicable when the input JSON objects read from an S3 bucket. If you are using JSON as state input to a Distributed Map, then you can use the ItemsPath (for JSONPath) or Items (for JSONata) field to specify a location in the input that points to JSON array or object used for iterations.
Prerequisite
To use Step Functions Distributed Map, verify you have:
- Access to an AWS account through the AWS Management Console and the AWS Command Line Interface (AWS CLI). The AWS Identity and Access Management (IAM) user that you use must have permissions to make the necessary AWS service calls and manage AWS resources mentioned in this post. While providing permissions to the IAM user, follow the principle of least-privilege.
- AWS CLI installed and configured. If you are using long-term credentials like access keys, follow manage access keys for IAM users and secure access keys for best practices.
- Git Installed
- AWS Serverless Application Model (AWS SAM) installed
- Python 3.13+ installed
Set up and run the workflow
Run the following steps to deploy the Step Functions state machine.
- Clone the GitHub repository in a new folder and navigate to the project folder.
- Run the following commands to deploy the application.
Enter the following details:
- Stack name: Stack name for CloudFormation (for example, stepfunctions-json-array-processor)
- AWS Region: A supported AWS Region (for example, us-east-1)
- Accept all other default values.
The outputs from the sam deploy will be used in the subsequent steps.
- Run the following command to generate
product-updates.jsonfile containing a nested JSON array of sample products and upload theproduct-updates.jsonfile to the input S3 bucket. ReplaceInputBucketNamewith the value from sam deploy output. - Run the following command to start execution of the Step Functions workflow. Replace the
StateMachineArnwith the value fromsam deployoutput.The state machine reads the input
product-updates.jsonfile and invokes a Lambda function to update the database for every product in the array after adding price and stock information. The execution metadata is also uploaded into the results bucket.
Monitor and verify results
Run the following steps to monitor and verify the test results.
- Run the following command to get the details of the execution. Replace
executionArnwith your state machine ARN.Wait until the status shows
SUCCEEDED. - Run the following commands to validate the processed output from
ProductCatalogTableNameDynamoDB table. Replace the valueProductCatalogTableNamewith the value from sam deploy output. - Check that the DynamoDB table contains the enriched product data including price and stock attributes. Example output:
Clean up
To avoid costs, remove all resources you’ve created while following along with this post.
Run the following command after replacing the <placeholder> variable to delete the resources you deployed for this post’s solution:
Conclusion
In this post, you learned how to use Step Functions Distributed Map for extracting array data natively from JSON objects stored in a S3 bucket. By removing custom data extraction code, you can simplify the processing of your large-scale parallel workloads. With ItemsPointer you can extract array data within JSON files stored in a S3 bucket , and with Items(JSONata) or ItemsPath (JSONPath), you can extract arrays from complex JSON state input, adding flexibility to your workflow designs.
New input sources for Distributed Map are available in all commercial AWS Regions where AWS Step Functions is available. For a complete list of AWS Regions where Step Functions is available, see the AWS Region Table. To get started, you can use the Distributed Map mode today in the AWS Step Functions console. To learn more, visit the Step Functions developer guide.
For more serverless learning resources, visit Serverless Land.
Enhanced search with match highlights and explanations in Amazon SageMaker
Post Syndicated from Ramesh H Singh original https://aws.amazon.com/blogs/big-data/enhanced-search-with-match-highlights-and-explanations-in-amazon-sagemaker/
Amazon SageMaker now enhances search results in Amazon SageMaker Unified Studio with additional context that improves transparency and interpretability. Users can see which metadata fields matched their query and understand why each result appears, increasing clarity and trust in data discovery. The capability introduces inline highlighting for matched terms and an explanation panel that details where and how each match occurred across metadata fields such as name, description, glossary, and schema. Enhanced search results reduces time spent evaluating irrelevant assets by presenting match evidence directly in search results. Users can quickly validate relevance without analyzing individual assets.
In this post, we demonstrate how to use enhanced search in Amazon SageMaker.
Search results with context
Text matches include keyword match, begins with, synonyms, and semantically related text. Enhanced search displays search result text matches in these locations:
- Search result: Text matches in each search result’s name, description, and glossary terms are highlighted.
- About this result panel: A new About this result panel is displayed to the right of the highlighted search result. The panel displays the text matches for the result item’s searchable content including name, description, glossary terms, metadata, business names, and table schema. The list of unique text match values is displayed at the top of the panel for quick reference.
Data catalogs contain thousands of datasets, models, and projects. Without transparency, users can’t tell why certain results appear or trust the ordering. Users need evidence for search relevance and understandability.
Enhanced search with match explanations improves catalog search in four key ways:
1) transparency is increased because users can see why a result appeared and gain trust,
2) efficiency improves since highlights and explanations reduce time spent opening irrelevant assets,
3) governance is supported by showing where and how terms matched, aiding audit and compliance processes, and
4) consistency is reinforced by revealing glossary and semantic relationships, which reduces misunderstanding and improves collaboration across teams.
How enhanced search works
When a user enters a query, the system searches across multiple fields like name, description, glossary terms, metadata, business names and table schema. With enhanced search transparency, each search result includes the list of text matches that were the basis for including the result, including the field that contained the text match, and a portion of the field’s text value before and after the text match, to provide context. The UI uses this information to display the returned text with the text match highlighted.
For example, a steward searches for “revenue forecasting,” and an asset is returned with the name “Sales Forecasting Dataset Q2” and a description that contains “projected sales figures.” The word sales is highlighted in the name and description, in both the search result and the text matches panel, because sales is a synonym for revenue. The About this result panel also shows that forecast was matched in the schema field name sales_forecast_q2.
Solution overview
In this section we demonstrate how to use the enhanced search features. In this example, we will be demonstrating the use in a marketing campaign where we need user preference data. While we have multiple datasets on users, we will demonstrate how enhanced search simplifies the discovery experience.
Prerequisites
To test this solution you should have an Amazon SageMaker Unified Studio domain set up with a domain owner or domain unit owner privileges. You should also have an existing project to publish assets and catalog assets. For instructions to create these assets, see the Getting started guide.
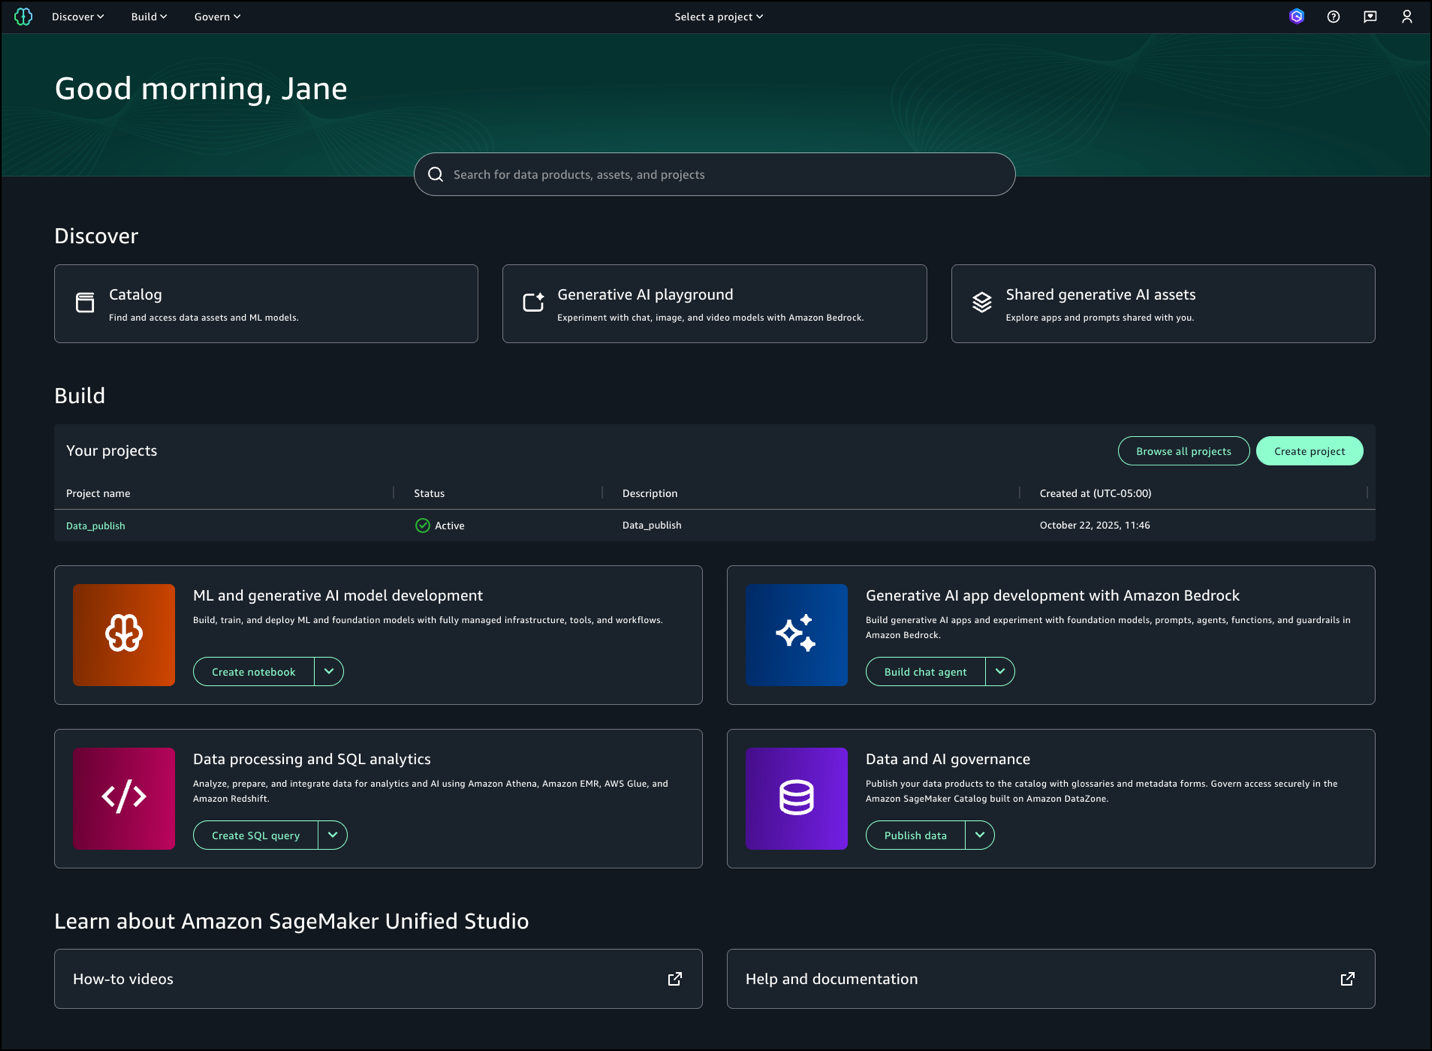
In this example we created a project named Data_publish and loaded data from the Amazon Redshift sample database. To ingest the sample data to SageMaker Catalog and generate business metadata, see Create an Amazon SageMaker Unified Studio data source for Amazon Redshift in the project catalog.
Asset discovery with explainable search
To find assets with explainable search:
- Log in to SageMaker Unified Studio.

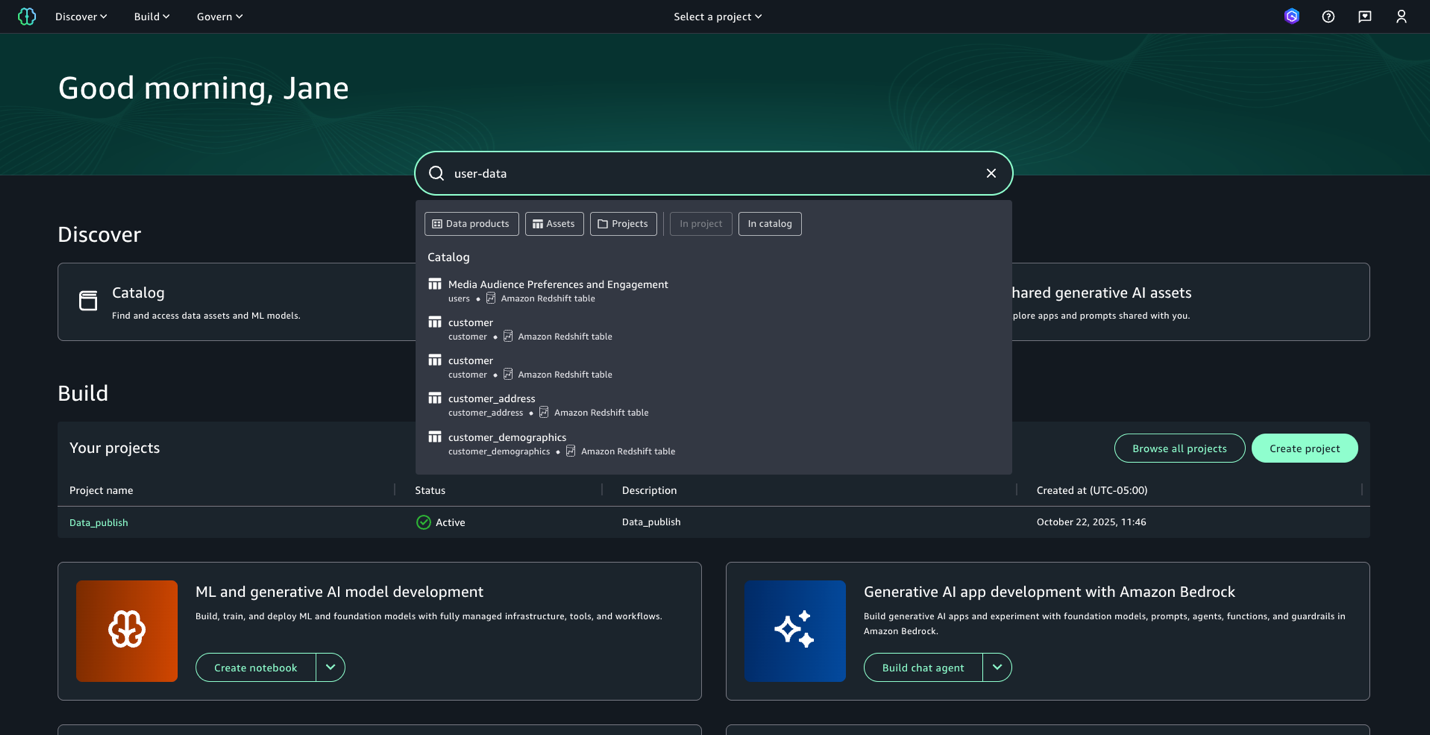
- Enter the search text
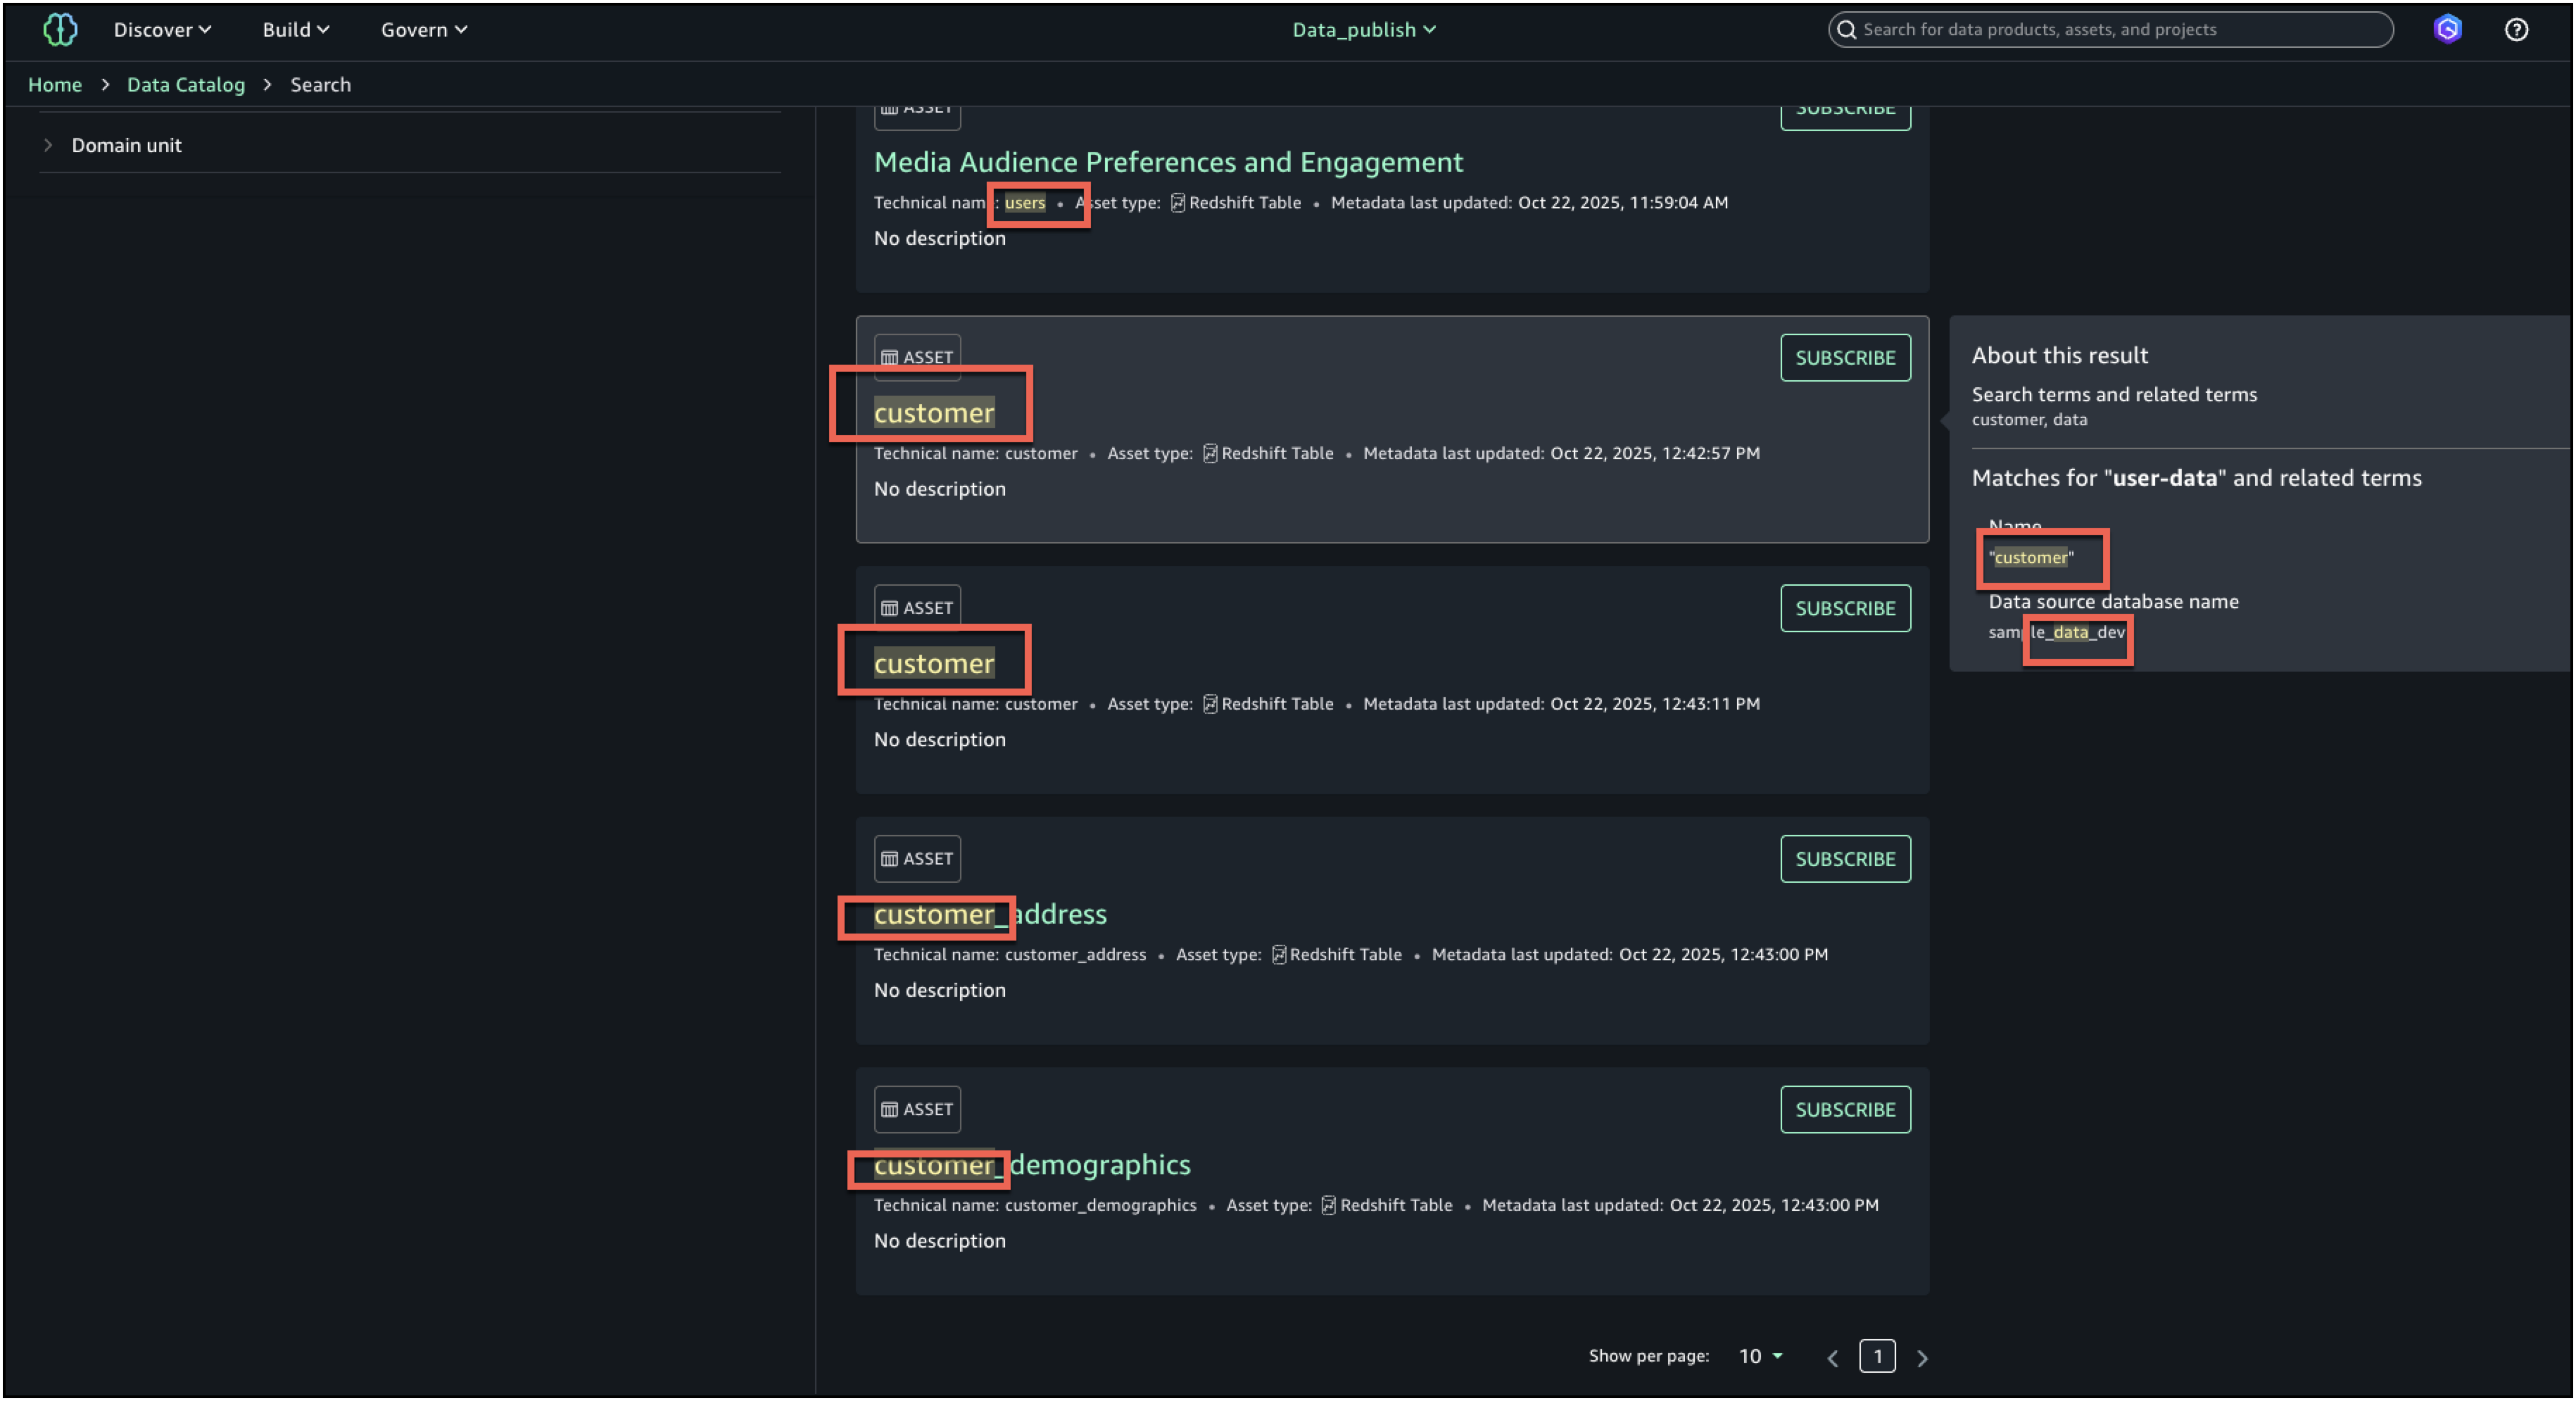
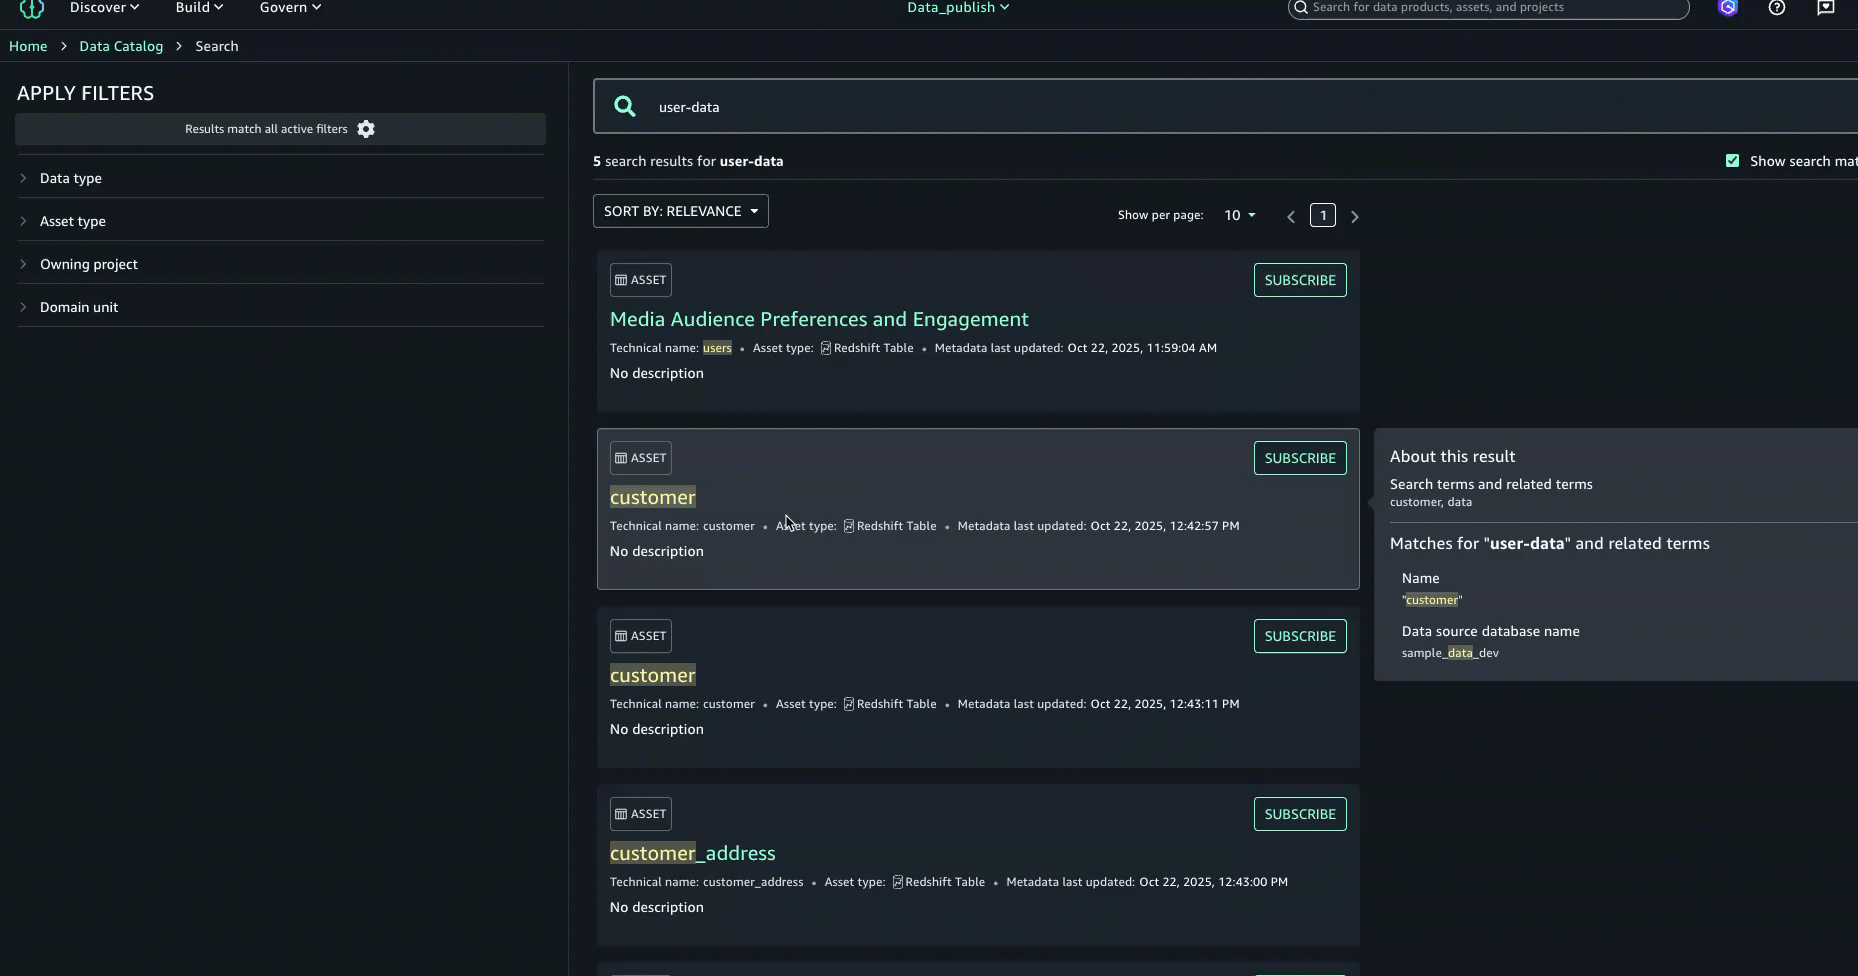
user-data. While we get the search results in this view, we want to get further details on each of these datasets. Press enter to go to full search.
- In full search, search results are returned when there are text matches based on keyword search, starts with, synonym, and semantic search. Text matches are highlighted within the searchable content that is shown for each result: in the name, description, and glossary terms.
- To further enhance the discovery experience and find the right asset, you can look at the About this result panel on the right and see the other text matches, for example, in the summary, table name, data source database name, or column business name, to better understand why the result was included.

- After examining the search results and text match explanations, we identified the asset named
Media Audience Preferences and Engagementas the right asset for the campaign and selected it for analysis.

Conclusion
Enhanced search transparency in Amazon SageMaker Unified Studio transforms data discovery by providing clear visibility into why assets appear in search results. The inline highlighting and detailed match explanations help users quickly identify relevant datasets while building trust in the data catalog. By showing exactly which metadata fields matched their queries, users spend less time evaluating irrelevant assets and more time analyzing the right data for their projects.
Enhanced search is now available in AWS Regions where Amazon SageMaker is supported.
To learn more about Amazon SageMaker, see the Amazon SageMaker documentation.
About the authors
Supercharging the ML and AI Development Experience at Netflix
Post Syndicated from Netflix Technology Blog original https://netflixtechblog.com/supercharging-the-ml-and-ai-development-experience-at-netflix-b2d5b95c63eb
Supercharging the ML and AI Development Experience at Netflix with Metaflow
Shashank Srikanth, Romain Cledat
Metaflow — a framework we started and open-sourced in 2019 — now powers a wide range of ML and AI systems across Netflix and at many other companies. It is well loved by users for helping them take their ML/AI workflows from prototype to production, allowing them to focus on building cutting-edge systems that bring joy and entertainment to audiences worldwide.
Metaflow allows users to:
- Iterate and ship quickly by minimizing friction
- Operate systems reliably in production with minimal overhead, at Netflix scale.
Metaflow works with many battle-hardened tooling to address the second point — among them Maestro, our newly open-sourced workflow orchestrator that powers nearly every ML and AI system at Netflix and serves as a backbone for Metaflow itself.
In this post, we focus on the first point and introduce a new Metaflow functionality, Spin, that helps users accelerate their iterative development process. By the end, you’ll have a solid understanding of Spin’s capabilities and learn how to try it out yourself with Metaflow 2.19.
Iterative development in ML and AI workflows
To understand our approach to improving the ML and AI development experience, it helps to consider how these workflows differ from traditional software engineering.
ML and AI development revolves not just around code but also around data and models, which are large, mutable, and computationally expensive to process. Iteration cycles can involve long-running data transformations, model training, and stochastic processes that yield slightly different results from run to run. These characteristics make fast, stateful iteration a critical part of productive development.
This is where notebooks — such as Jupyter, Observable, or Marimo — shine. Their ability to preserve state in memory allows developers to load a dataset once and iteratively explore, transform, and visualize it without reloading or recomputing from scratch. This persistent, interactive environment turns what would otherwise be a slow, rigid loop into a fluid, exploratory workflow — perfectly suited to the needs of ML and AI practitioners.
Because ML and AI development is computationally intensive, stochastic, and data- and model-centric, tools that optimize iteration speed must treat state management as a first-class design concern. Any system aiming to improve the development experience in this domain must therefore enable quick, incremental experimentation without losing continuity between iterations.
New: rapid, iterative development with spin
At first glance, Metaflow code looks like a workflow — similar to Airflow — but there’s another way to look at it: each Metaflow @step serves as a checkpoint boundary. At the end of every step, Metaflow automatically persists all instance variables as artifacts, allowing the execution to resume seamlessly from that point onward. The below animation shows this behavior in action:

In a sense, we can consider a @step similar to a notebook cell: it is the smallest unit of execution that updates state upon completion. It does have a few differences that address the issues with notebook cells:
- The execution order is explicit and deterministic: no surprises due to out-of-order cell execution;
- The state is not hidden: state is explicitly stored as self. variables as shared state, which can be discovered and inspected;
- The state is versioned and persisted making results more reproducible.
While Metaflow’s resume feature can approximate the incremental and iterative development approach of notebooks, it restarts execution from the selected step onward, introducing more latency between iterations. In contrast, a notebook allows near-instant feedback by letting users tweak and rerun individual cells while seamlessly reusing data from earlier cells held in memory.
The new spin command in Metaflow 2.19 addresses this gap. Similar to executing a single notebook cell, it quickly executes a single Metaflow @step — with all the state carried over from the parent step. As a result, users can develop and debug Metaflow steps as easily as a cell in a notebook.
The effect becomes clear when considering the three complementary execution modes — run, resume, and spin — side by side, mapping them to the corresponding notebook behavior:

Another major difference isn’t just what gets executed, but what gets recorded. Both run and resume create a full, versioned run with complete metadata and artifacts, while spin skips tracking altogether. It’s built for fast, throw-away iterations during development.
The one-minute clip below illustrates a typical iterative development workflow that alternates between run and spin. In this example, we are building a flow that reads a dataset from a Parquet file and trains a separate model for each product category, focusing on computer-related categories.
As shown in the video, we start by creating a flow from scratch and running a minimal version of it to persist test artifacts — in this case, a Parquet dataset. From there, we can use spin to iterate on one step at a time, incrementally building out the flow, for example, by adding the parallel training steps demonstrated in the clip.
Once the flow has been iterated on locally, it can be seamlessly deployed to production orchestrators like Maestro or Argo, and scaled up on compute platforms such as AWS Batch, Titus, Kubernetes and more. Thus, the experience is as smooth as developing in a notebook, but the outcome is a production-ready, scalable workflow, implemented as an idiomatic Python project!
Spin up smooth development in VSCode/Cursor
Instead of typing run and spin manually in the terminal, we can bind them to keyboard shortcuts. For example, the simple metaflow-dev VS Code extension (works with Cursor as well) maps Ctrl+Opt+R to run and Ctrl+Opt+S to spin. Just hack away, hit Ctrl+Opt+S, and the extension will save your file and spin the step you are currently editing.
One area where spin truly shines is in creating mini-dashboards and reports with Metaflow Cards. Visualization is another strong point of notebooks but the combination of spin and cards makes Metaflow a very compelling alternative for developing real-time and post-execution visualizations. Developing cards is inherently iterative and visual (much like building web pages) where you want to tweak code and see the results instantly. This workflow is readily available with the combination of VSCode/Cursor, which includes a built-in web-view, the local card viewer, and spin.
To see the trio of tools — along with the VS Code extension — in action, in this short clip we add observability to the train step that we built in the earlier example:
A major benefit of Metaflow Cards is that we don’t need to deploy any extra services, data streams, and databases for observability. Just develop visual outputs as above, deploy the flow, and wehave a complete system in production with reporting and visualizations included.
Spin to the next level: injecting inputs, inspecting outputs
Spin does more than just run code — it also lets us take full control of a spun @step’s inputs and outputs, enabling a range of advanced patterns.
In contrast to notebooks, we can spin any arbitrary @step in a flow using state from any past run, making it easy to test functions with different inputs. For example, if we have multiple models produced by separate runs, we could spin an inference step, supplying a different model run each time.
We can also override artifact values or inject arbitrary Python objects — similar to a notebook cell — for spin. Simply specify a Python module with an ARTIFACTS dictionary:
ARTIFACTS = {
  "model": "kmeans",
  "k": 15
}
and point spin at the module:
spin train --artifacts-module artifacts.py
By default spin doesn’t persist artifacts, but we can easily change this by adding –persist. Even in this case, artifacts are not persisted in the usual Metaflow datastore but to a directory-specific location which you can easily clean up after testing. We can access the results with the Client API as usual — just specify the directory you want to inspect with inspect_spin:
from metaflow import inspect_spin

inspect_spin(".")
Flow("TrainingFlow").latest_run["train"].task["model"].data
Being able to inspect and modify a step’s inputs and outputs on the fly unlocks a powerful use case: unit testing individual steps. We can use spin programmatically through the Runner API and assert the results:
from metaflow import Runner

with Runner("flow.py").spin("train", persist=True) as spin:
  assert spin.task["model"].data == "kmeans"
Making AI agents spin
In addition to speeding up development for humans, spin turns out to be surprisingly handy for coding agents too. There are two major advantages to teaching AI how to spin:
- It accelerates the development loop. Agents don’t naturally understand what’s slow, or why speed matters, so they need to be nudged to favor faster tools over slower ones.
- It helps surface errors faster and contextualizes them to a specific piece of code, increasing the chance that the agent is able to fix errors by itself.
Metaflow users are already using Claude Code; spin makes this even easier. In the example below, we added the following section in a CLAUDE.md file:
## Developing Metaflow code
Follow this incremental development workflow that ensures quick iterations
and correct results. You must create a flow incrementally, step by step
following this process:
1. Create a flow skeleton with empty `@step`s.
2. Add a data loading step.
3. `run` the flow.
4. Populate the next step and use `spin` to test it with the correct inputs.
5. `run` the flow to record outputs from the new step.
5. Iterate on (4–5) until all steps have been implemented and work correctly.
6. `run` the whole flow to ensure final correctness.

To test a flow, run the flow as follows
```
python flow.py - environment=pypi run
```

Do this once before running `spin`.
As you are building the flow, you `spin` to test steps quickly.
For instance
```
python flow.py - environment=pypi spin train
```
Just based on these quick instructions, the agent is able to use spin effectively. Take a look at the following inspirational example that one-shots Claude to create a flow, along the lines of our earlier examples, which trains a classifier to predict product categories:
In the video, we can see Claude using spin around the 45-second mark to test a preprocess step. The step initially fails due to a classic data science pitfall: during testing, Claude samples only a small subset of data, causing some classes to be underrepresented. The first spin surfaces the issue, which Claude then fixes by switching to stratified sampling — and finally does another spin to confirm the fix, before proceeding to complete the task.
The inner loop of end-to-end ML/AI
To circle back to where we started, our motivation for adding spin — and for creating Metaflow in the first place — is to accelerate development cycles so we can deliver more joy to our subscribers, faster. Ultimately, we believe there’s no single magic feature that makes this possible. It takes all parts of an ML/AI platform working together coherently — spin included.
From this perspective, it’s useful to place spin in the context of other Metaflow features. It’s designed for the innermost loop of model and business-logic development, with the added benefit of supporting unit testing during deployment, as shown in the overall blueprint of the Metaflow toolchain below.

In this diagram, the solid blue boxes represent different Metaflow commands, while the blue text denotes decorators and other features. In particular, note the Shared Functionality box — another key focus area for us over the past year — which includes configuration management and custom decorators. These capabilities let domain-specific teams and platform providers tailor Metaflow to their own use cases. Following our ethos of composability, all of these features integrate seamlessly with spin as well.
Another key design philosophy of Metaflow is to let projects start small and simple, adding complexity only when it becomes necessary. So don’t be overwhelmed by the diagram above. To get started, install Metaflow easily with
pip install metaflow
and take your first baby @steps for a spin! Check out the docs and for questions, support, and feedback, join the friendly Metaflow Community Slack.
Acknowledgments
We would like to thank our partners at Outerbounds, and particularly Ville Tuulos, Savin Goyal, and Madhur Tandon, for their collaboration on this feature, from initial ideation to review, testing and documentation. We would also like to acknowledge the rest of the Model Development and Management team (Maria Alder, David J. Berg, Shaojing Li, Rui Lin, Nissan Pow, Chaoying Wang, Regina Wang, Seth Yang, Darin Yu) for their input and comments.
![]()
Supercharging the ML and AI Development Experience at Netflix was originally published in Netflix TechBlog on Medium, where people are continuing the conversation by highlighting and responding to this story.
The cycles your dishwasher has might be wildly different – you should try ’em out
Post Syndicated from Technology Connextras original https://www.youtube.com/watch?v=WnBb3DLlVPw
Introducing: Galaxy Brain with Charlie Warzel
Post Syndicated from The Atlantic original https://www.youtube.com/watch?v=lnDEiirt_tc
Police Chases #lastweektonight
Post Syndicated from LastWeekTonight original https://www.youtube.com/shorts/zk_P1rSKR4g