Post Syndicated from Ahmed Ewis original https://aws.amazon.com/blogs/architecture/architecting-offline-first-generative-ai-applications-for-edge-deployments-using-aws-services/
According to Siemens’ 2024 report The True Cost of Downtime, Fortune 500 companies lose an estimated $1.4 trillion annually because of unplanned downtime. This downtime is often worsened by a lack of skills to detect and resolve issues quickly. Generative AI offers a promising path to address this, but deploying these capabilities in industrial environments introduces a distinct architectural challenge: how do you bring the power of large-scale AI to locations where cloud connectivity is unreliable or unavailable?
The answer lies in an offline-first architecture, one that moves AI inference to the edge while using cloud services for model customization, deployment orchestration, and continuous improvement. This pattern requires careful coordination across multiple AWS services spanning artificial intelligence and machine learning (AI/ML), Internet of Things (IoT), and storage, and demands deliberate trade-offs between model capability, hardware constraints, and operational complexity.
The following are a few potential use cases that could benefit smart applications at the edge:
- Maintenance crews struggle to correlate real-time log feeds with relevant machine manuals, and analyze situations in-hand.
- Offshore platforms, remote drilling sites, and pipeline maintenance crews operating in areas with limited satellite connectivity requiring instant access to safety procedures, equipment manuals, and regulatory compliance documentation.
- Remote agricultural facilities with precision farming equipment requiring access to machinery manuals, crop management protocols, and safety procedures.
In this post, we walk through a reference architecture for building and deploying a generative AI application at the edge using AWS services. We cover the end-to-end pattern, from model customization in the cloud using Amazon Bedrock and Amazon SageMaker AI, to edge deployment using AWS IoT Greengrass, to local inference orchestrated by Strands Agents. Along the way, we highlight the key architectural decisions and service integration patterns that make this approach work.
This post describes a reference architecture. It is not intended for direct production use. Perform a security review and implement controls appropriate to your workload before deploying to production.
Architectural decisions for offline-first AI
Designing an offline-first AI architecture starts with a critical decision: how to customize a language model for your domain while keeping it small enough to run on edge hardware. The model must fit within the compute and memory constraints of site-level devices (typically GPUs with 16 GB or more of VRAM), which means working with small language models (SLMs). The customization strategy you choose directly affects your architecture’s complexity, cost, and data pipeline requirements.
The following strategies represent increasing levels of architectural complexity, each with different infrastructure requirements and expected outcomes:
- Model fine-tuning (FT): A relatively lightweight process to adapt a pre-trained model for specialized tasks. For example, you could fine-tune a model to answer troubleshooting questions about specific equipment using labeled Q&A pairs from maintenance tickets. Fine-tuning excels at teaching a model the format, style, and structure of the outputs you want. However, it’s less effective at injecting new domain knowledge that wasn’t in the base model’s original training data.
- Continued pre-training (CPT): A more resource-intensive process that extends the base model’s training with domain-specific unlabeled data to embed new knowledge. For example, you could continue training on technical manuals, repair logs, and engineering documentation to teach the model equipment-specific terminology, failure patterns, and diagnostic procedures. This approach effectively injects domain knowledge into model parameters but requires significant computational resources and larger datasets compared to fine-tuning.
- Hybrid approach (FT + RAG): Retrieval Augmented Generation (RAG) enhances model responses by retrieving relevant documents at inference time, which provides accurate, up-to-date answers with source citations and reduces hallucinations. For our edge implementation, we use ChromaDB (SQLite + HNSW defaults) with a sentence-transformer embedding model (384 dimensions) running on CPU. Documents are chunked at 512 tokens with 50-token overlap. With a dataset up to 5 GB, retrieval latency stays under 50 ms. The entire RAG pipeline lives on CPU/SSD with zero GPU VRAM consumption, keeping the full 16 GB dedicated to the large language model (LLM).
- Hybrid approach (CPT + RAG + FT): Combines continued pre-training of the embedding model with fine-tuning of the language model to optimize the entire RAG pipeline. Through continuing training your embedding model on domain-specific queries to better understand domain-specific terminology and jargon, while fine-tuning your language model on Q&A pairs for the format and tone you want. For example, when an operator asks about the state of a cookie machine, they expect to get the application to check current state, throughput per minute, and visual quality of Cookies! This dual optimization ensures both accurate retrieval and high-quality responses, ideal for knowledge-intensive applications.
To decide on the right strategy for your application, you need to work backward from the use case requirements and expected outcomes.
Reference architecture
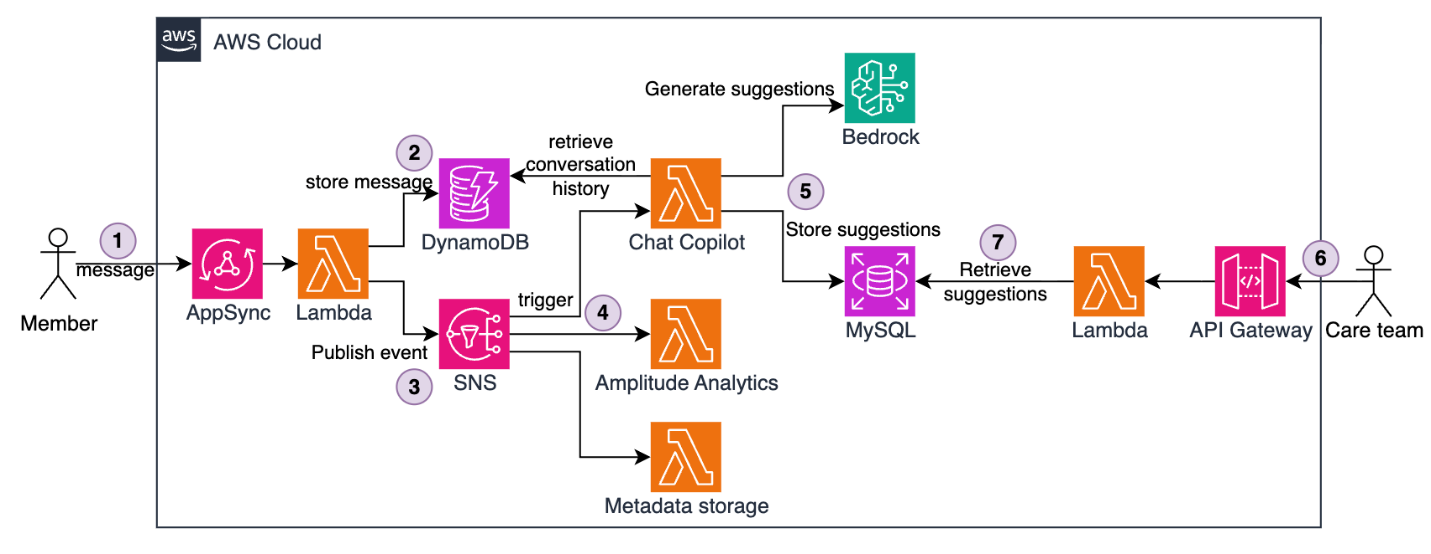
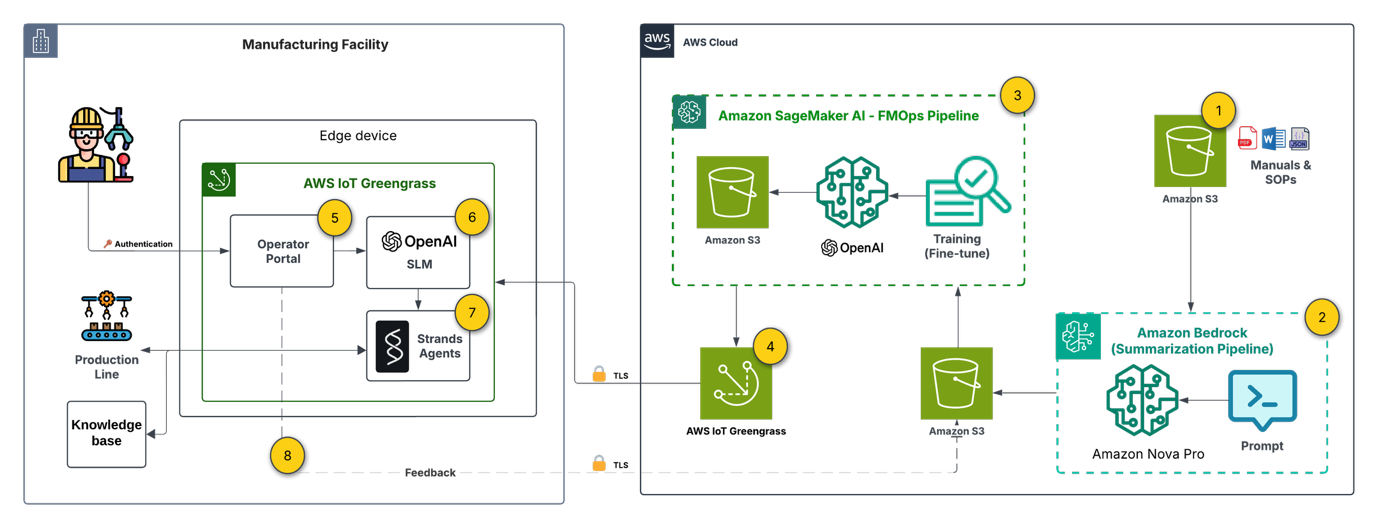
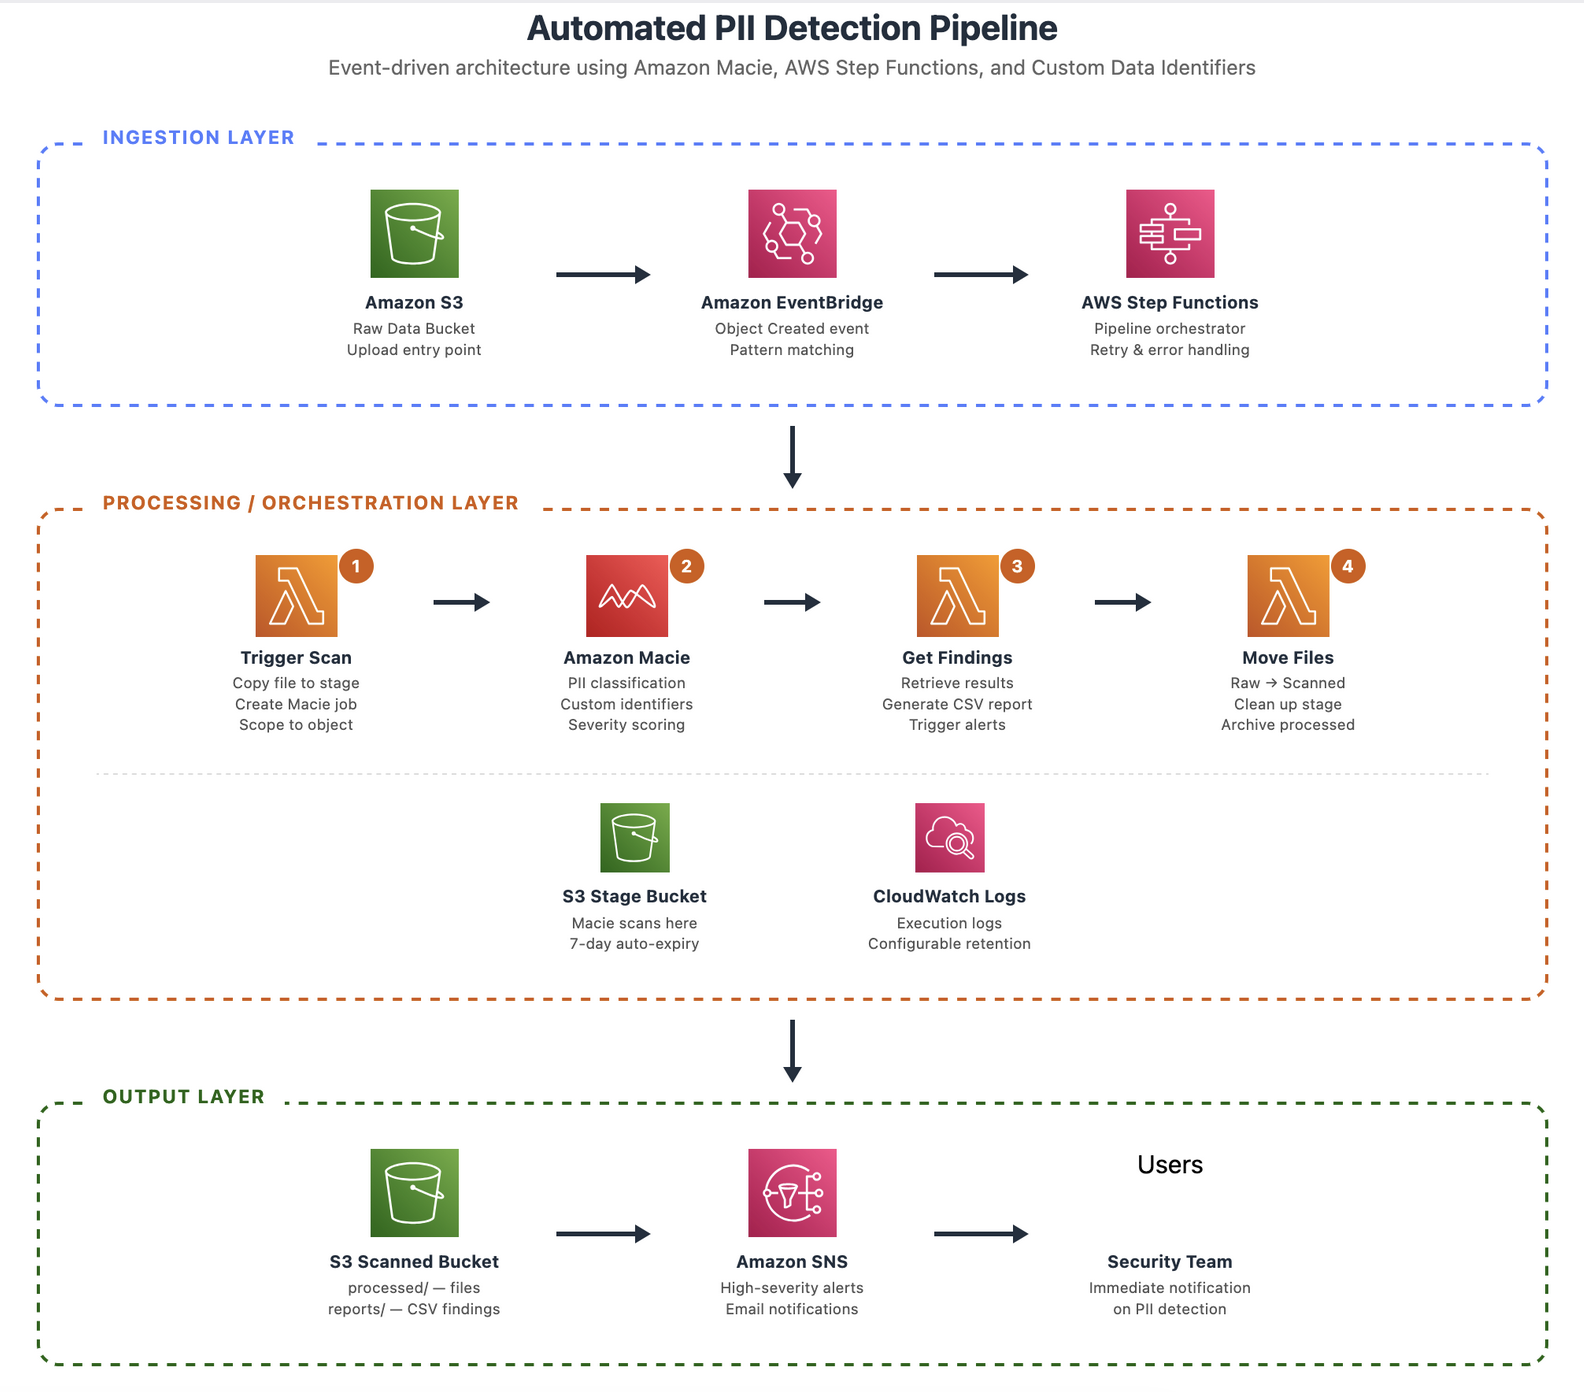
Let’s examine a reference architecture for an edge-deployed generative AI solution built on AWS. This architecture addresses a manufacturing use case where operators need instant access to equipment documentation, log correlation, and troubleshooting guidance, all without depending on cloud connectivity. We chose the hybrid approach (FT + RAG) because it balances two architectural concerns: keeping the on-device model compact through fine-tuning for task-specific behavior, while using RAG to provide up-to-date knowledge retrieval without retraining. The following diagram depicts the end-to-end architecture:

Note: The architecture spans two trust domains. On the cloud side, each service (Amazon Simple Storage Service (Amazon S3), Amazon Bedrock, SageMaker AI, IoT Greengrass) operates under a dedicated least-privilege AWS Identity and Access Management (IAM) role. All cloud-to-edge communication uses mutual TLS using IoT Greengrass device certificates. The operator portal requires authentication. On the edge device, the operator.
The architecture is organized into three layers: cloud-side preparation (steps 1–3), deployment orchestration (step 4), and edge-side inference (steps 5–9). Each layer uses specific AWS services chosen for their integration capabilities.
1. Document base setup
Technical manuals and Standard Operating Procedures (SOPs) are stored in Amazon S3, serving as the single source of truth for both the cloud-side training pipeline and the edge-side RAG knowledge base. The integration of Amazon S3 with both SageMaker AI and IoT Greengrass makes it the natural choice for artifacts that must flow between cloud and edge.
2. Preparing labeled data
Using Amazon Nova Pro on Amazon Bedrock, we process raw documentation into structured question-answer-context pairs for fine-tuning. This is a key architectural decision: rather than manually curating training data, we use a large foundation model (FM) in the cloud to generate high-quality labeled data at scale. The serverless inference of Amazon Bedrock keeps this step cost-effective, and the output feeds directly into the SageMaker AI pipeline.
3. Model customization (FMOps pipeline)
Amazon SageMaker AI Pipelines orchestrates an automated FMOps pipeline that fine-tunes gpt-oss-20b (Mixture of Experts (MoE) architecture: 21B total parameters, 3.6B active per token, 32 experts, 128k context length) on the domain-specific Q&A pairs. The pipeline pattern here is deliberate: it enables repeatable, versioned model customization that can be triggered whenever new documentation is added. The pipeline trains the model to understand equipment-specific terminology and response formats, then stores the customized model artifact in S3 for downstream deployment.
4. Edge deployment
The edge device (in our case, a g4dn.12xlarge with 4× NVIDIA T4 GPUs, 16 GiB each, 64 GiB total accelerator memory, 48 vCPUs, and 129 GiB system RAM) provides the GPU compute necessary for local inference. The hardware selection is an important architectural constraint that directly influences model viability and serving strategy. With gpt-oss-20b occupying 13 GB per T4 GPU, two deployment strategies are available depending on your throughput and latency priorities:
- Model Replication — a full model copy on each of the four GPUs, which supports four concurrent client requests without queuing. This maximizes throughput at the cost of using 81 percent of each GPU’s memory for model weights alone.
- Tensor Parallelism — the model is sharded across all four GPUs at 3.2 GB per GPU, leaving approximately 12.8 GB available on each GPU. This remaining memory serves as KV cache, supporting the full 128K context window for long-form interactions.
The choice between these strategies depends on your workload profile: replication suits high-concurrency, short-query environments, while tensor parallelism suits fewer concurrent users with longer, more complex interactions.
5. Edge device (manufacturing facility)
The edge device (in our case, NVIDIA Jetson Xavier) provides the GPU compute necessary for local inference. The hardware selection is an important architectural constraint: you need sufficient VRAM (16 GB or more) to run the quantized SLM, which directly influences which models are viable for your deployment.
6. User interface (Flask operator portal)
A Flask-based web interface running locally on the device allows maintenance operators and technicians to submit queries about equipment issues, safety procedures, or maintenance tasks. Running the UI on-device eliminates any dependency on external connectivity for the user-facing layer.
7. Off-cloud generative AI
The fine-tuned SLM runs on-premises using Ollama as the inference runtime. Ollama provides a lightweight, container-friendly serving layer that supports quantized model formats (GGUF) for efficient inference within the device’s memory constraints. This decouples the model serving infrastructure from any cloud dependency.
8. Generative AI orchestration
Strands Agents provides the orchestration layer that coordinates the query processing workflow. It routes requests to the appropriate tools: querying the on-site RAG knowledge base, collecting device telemetry data. This agent-based pattern provides extensibility. You can add new tools and data sources without modifying the core inference pipeline.
9. Continuous improvement (feedback loop)
When connectivity is available, user interactions and feedback flow back to the cloud, enabling ongoing model refinement through the FMOps pipeline. This creates a virtuous cycle: edge usage data improves the next model version, which Greengrass deploys back to the device. The architecture is designed to be resilient to connectivity gaps. Feedback is queued locally and synchronized opportunistically.
Prerequisites
To be able to implement a similar solution, you need:
- An AWS account. If you don’t already have an AWS account, you can create one.
- Your access to the AWS account must have IAM permissions to services including Amazon SageMaker AI, Amazon Bedrock, AWS IoT Greengrass, and Amazon S3.
- A hardware device preferably with a GPU that has a sufficient VRAM (>16 GB) to run an SLM.
Implementation overview
This section summarizes the key implementation steps. Each component uses standard AWS service configurations:
- Data preparation – Amazon Nova Pro on Amazon Bedrock generates structured Q&A pairs from raw documentation, producing training data for the SageMaker AI fine-tuning pipeline.
- Model fine-tuning – SageMaker AI Pipelines runs a QLoRA fine-tuning job on gpt-oss-20b using the generated dataset, then stores the customized model artifact in S3.
- Edge deployment – AWS IoT Greengrass (or AWS Systems Manager) transfers the quantized model (GGUF format) to the edge device.
- Local inference – Ollama serves the fine-tuned model with a domain-specific system prompt constraining responses to equipment-relevant answers.
- Orchestration – Strands Agents coordinates the workflow, routing queries to the RAG knowledge base or telemetry tools as needed.
For the fine-tuning notebook, refer to this example notebook for fine-tuning an SLM using Amazon SageMaker AI.
Security considerations
Moving inference to the edge shifts the security perimeter. In a cloud-native deployment, AWS manages much of the infrastructure security. At the edge, you own the full stack, which spans physical device access through application-layer controls. This section outlines the security controls to implement when adapting this architecture for your environment.
Authentication and access control. The Flask operator portal runs on an isolated device, but physical proximity doesn’t replace authentication. Integrate with your organization’s identity provider (SAML/OIDC) or implement certificate-based mutual TLS. Enforce role-based access so that operators, administrators, and maintenance personnel each see only the interfaces relevant to their function.
Encryption at rest. Model artifacts and the ChromaDB vector database contain proprietary knowledge. Encrypt the edge device’s storage volume using full-disk encryption (for example, LUKS on Linux or BitLocker on Windows). Manage encryption keys through AWS IoT Greengrass secret manager or a hardware Trusted Platform Module (TPM) on the device.
Encryption in transit. All communication between the edge device and AWS (including the IoT Greengrass deployment channel and the feedback synchronization loop) must use TLS 1.2 or later. For internal communication between edge components (Flask portal to Ollama, Strands Agents to ChromaDB), enforce TLS even on the loopback interface to prevent local interception.
Input validation and prompt guardrails. The Strands Agents orchestration layer accepts natural language input from operators. Apply input validation to reject malformed or excessively long queries. Implement prompt guardrails to detect and block prompt injection attempts. On the output side, apply content filtering to prevent the model from surfacing sensitive information outside its intended scope.
Network segmentation. Separate edge components into distinct network zones: the operator-facing portal in a perimeter network, the inference runtime in a restricted zone, and the cloud sync channel on an isolated outbound-only interface. Use firewall rules to enforce that only the expected traffic flows between zones.
IAM least privilege. On the cloud side, each AWS service in the pipeline should operate with its own IAM role scoped to minimum required permissions. The IoT Greengrass core device role should only access the specific S3 prefixes and IoT topics it needs. SageMaker pipeline execution roles shouldn’t have access to production S3 buckets.
Logging and monitoring. Enable AWS CloudTrail and Amazon CloudWatch for all cloud-side services. On the edge device, log all operator queries, model responses, and sync events locally. When connectivity is available, forward edge logs to Amazon CloudWatch Logs or Amazon S3 for centralized analysis. Set up alerts for anomalous patterns such as unexpected query volumes, repeated authentication failures, or unauthorized access attempts.
Results
We evaluated the fine-tuned gpt-oss-20b model against the base model using 30 domain-specific question-answer pairs. Both configurations use the full RAG pipeline (ChromaDB + sentence-transformer embedding model) as the retrieval layer. The variable being tested is whether fine-tuning the language model improves generation quality when given the same retrieved context. Three LLM judges (Claude 4.5 Haiku and Claude 4.5 Sonnet using Amazon Bedrock, and Amazon Nova Pro) scored responses on a 12-point scale across accuracy, completeness, and relevance.
| LLM Evaluator |
SLM |
Average score |
| Claude 4.5 Haiku |
Fine-tuned gpt-oss-20b + RAG |
10.20/12 (85%) |
|
Base gpt-oss-20b + RAG |
8.20/12 (68.3%) |
| Claude 4.5 Sonnet |
Fine-tuned gpt-oss-20b + RAG |
9.20/12 (76.7%) |
|
Base gpt-oss-20b + RAG |
7.49/12 (61.7%) |
| Nova Pro |
Fine-tuned gpt-oss-20b + RAG |
9.90/12 (82.5%) |
|
Base gpt-oss-20b +RAG |
8.70/12 (72.5%) |
These results support the hybrid approach (FT + RAG) outlined in our solution architecture, demonstrating that even with a relatively small fine-tuning dataset, significant performance improvements can be achieved for domain-specific applications at the edge.
Cleanup
The AWS services used in this architecture are fully managed services that follow a pay-as-you-go pricing model, meaning you only pay for actual invocations. Exception for this can be the storage costs for the labeled data and the finetuned model in Amazon S3 which you can consider to delete if not in use.
Conclusion
This post presents a reference architecture for deploying generative AI at the edge using AWS services. The key architectural patterns demonstrated include:
Cloud-side model factory – Using Amazon Bedrock for automated training data generation and Amazon SageMaker AI Pipelines for repeatable, versioned model customization, creating a scalable FMOps workflow that decouples model preparation from deployment.
Managed cloud-to-edge bridge – AWS IoT Greengrass provides the deployment orchestration layer, handling model packaging, versioning, and lifecycle management without requiring persistent connectivity to target devices.
Self-contained edge inference stack – A lightweight runtime (Ollama) combined with an agent-based orchestration framework (Strands Agents) supports local AI inference with extensible tool integration, all operating independently of cloud availability.
Feedback-driven continuous improvement – An asynchronous feedback loop synchronizes usage data back to the cloud when connectivity permits, for iterative model refinement without disrupting edge operations.
These patterns are applicable beyond manufacturing. Any environment with intermittent connectivity, strict latency requirements, or data locality constraints (offshore energy, remote agriculture, transportation, defense) can benefit from this architectural approach. The critical design decisions will vary by use case: selecting the right model customization strategy, sizing edge hardware to model requirements, and choosing between RAG and fine-tuning. The overall integration pattern remains consistent.
As with any reference architecture, we recommend that you conduct a security review before production deployment.
To explore this pattern, consider identifying a use case with clear connectivity constraints and working backward from your edge hardware requirements to select a model customization strategy. The hybrid (FT + RAG) approach described in this post offers the right balance of capability and complexity. Expand it as you validate operational improvements.
Ready to explore more? Join us at re:Invent for related sessions: Real-time insights for smart manufacturing with AWS Serverless (CNS375) and Implement Agentic AI at the edge for industrial automation (HMC317).
About the authors