Accelerate SQL development with SageMaker Data Agent in Query Editor

Post Syndicated from Jason Ramos original https://aws.amazon.com/blogs/big-data/accelerate-sql-development-with-sagemaker-data-agent-in-query-editor/

When you develop SQL against Amazon Redshift and Amazon Athena, you spend time finding the right tables across hundreds of databases, writing complex joins and aggregations, debugging failed queries without context from previous attempts, and re-specifying filters for every new question. Amazon SageMaker Data Agent in Query Editor takes a different approach. You describe what you need in natural language, and the Data Agent generates the SQL. It references your actual tables through AWS Glue Data Catalog, proposes step-by-step plans for complex questions, retains context across your session, and offers one-click error recovery with Fix with AI. In this post, you learn how to use Data Agent in Query Editor to explore data, build multi-step analyses, recover from errors, and summarize results using a public education dataset.

Solution overview

You can go from a natural language question to executable SQL in seconds. Data Agent in Query Editor provides a conversational interface with direct access to your AWS data environment, so you spend less time on query mechanics and more time on analysis. Data Agent in Query Editor focuses specifically on SQL development against Amazon Redshift and Amazon Athena. (For Python, SQL, and PySpark across broader analytical and machine learning (ML) workloads, use Data Agent in notebooks.)

Data Agent provides four key capabilities:

  • Catalog-aware SQL generation. You don’t need to browse catalog structures or memorize schema details. Data Agent reads your table metadata directly.
  • Querybook and session context. You build on previous work. Data Agent uses context from your earlier queries and results.
  • Step-by-step planning. You review and approve a structured plan before Data Agent generates SQL.
  • Fix with AI. You recover from failed queries with one click.

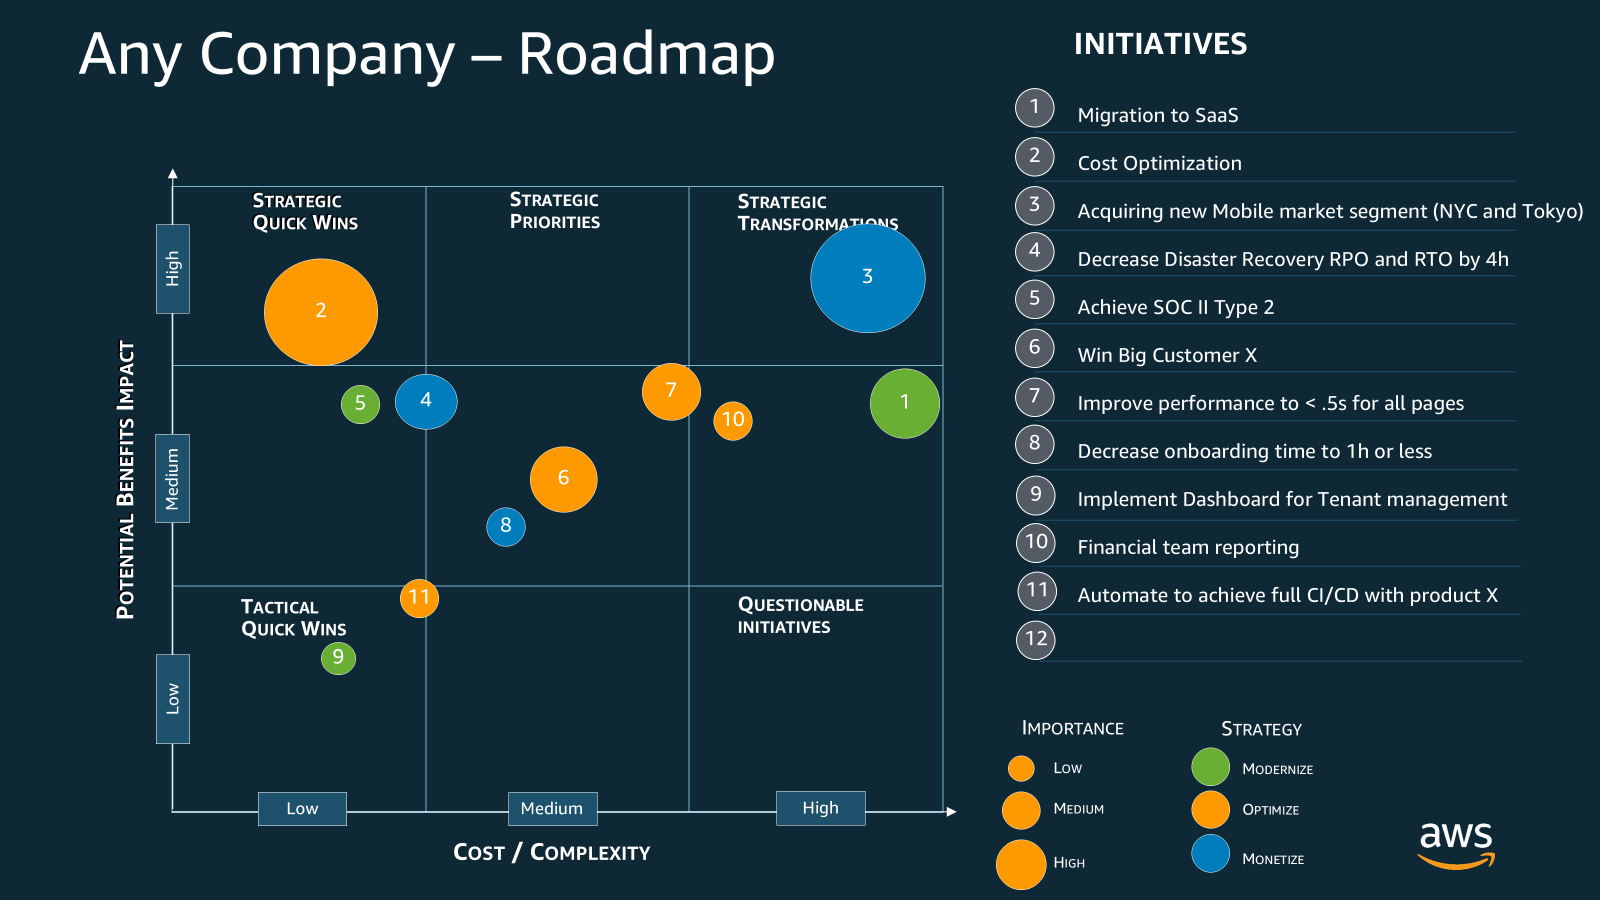
Data Agent integrates with AWS Glue Data Catalog and reads your actual table names, column types, descriptions, and relationships, so generated SQL references your real tables. Each follow-up question builds on your current Query Editor session—the SQL cells in your querybook, the active connection, your selected cell, and execution results from previously run cells. For complex requests, Data Agent produces a structured plan that specifies which data to retrieve, how to aggregate it, and what filters to apply. You review and approve each step before Data Agent proceeds. When a query fails, choose Fix with AI to get a corrected query based on the error and the failed cell’s context.

Query Editor Fix with AI panel showing a corrected SQL query ready for review

[Figure 1: The Query Editor Fix with AI panel, showing a corrected SQL query ready for your review.]

Walkthrough: Education data analysis

In this section, you use Data Agent in Query Editor to analyze California schools data and identify where SAT improvement investment has the most impact. The walkthrough covers four tasks:

  • Explore available data.
  • Build a multi-step analysis plan.
  • Summarize insights from your queries.
  • Recover from a failed query.

The same workflow applies to your own data, whether you are analyzing sales figures, operational metrics, or financial records.

The California schools dataset contains SAT score results, school demographic information, and county-level data for public schools across California. The dataset includes tables that organize SAT scores by subject (reading, writing, math), school details (name, address, county, district), and enrollment figures. After you upload the data into your project database, you directly access the tables from Query Editor through your Amazon Athena or Amazon Redshift Lakehouse connection.

Prerequisites

To complete this walkthrough, you need intermediate SQL knowledge and basic familiarity with the AWS Management Console. You don’t need prior AWS Glue experience, but familiarity with data catalogs (centralized metadata repositories) helps.

You can choose one of two setup paths:

  • Quick start (5 minutes). SageMaker Unified Studio provides a sample database (sagemaker_sample_db) with pre-loaded data. To explore it, choose Data in the navigation pane, expand AwsDataCatalog, and select sagemaker_sample_db.
  • Full setup (30–45 minutes). Upload the California schools dataset into your project’s Lakehouse database. This dataset is publicly available from the California Department of Education. Download the SAT scores, school information, and county-level data files, then upload them through the SageMaker Unified Studio UI. In your project, go to Build, choose Query editor, right-click your project database in the Data explorer, and choose Create table. Drag and drop each CSV file to create the tables. SageMaker Unified Studio stores the data in the project-managed Amazon Simple Storage Service (Amazon S3) location, registers it in AWS Glue Data Catalog, and applies AWS Lake Formation governance automatically.

Running queries against Amazon Athena or Amazon Redshift might incur costs. For pricing details, refer to Amazon Athena pricing and Amazon Redshift pricing. For detailed setup instructions, refer to AWS Identity and Access Management (IAM)-based domains and projects. Before starting the walkthrough, you must have a SageMaker Unified Studio IAM-based domain with a project using the SQL analytics or All Capabilities project profile. The project automatically provisions an AWS Glue database, the required IAM role, and Athena or Redshift Lakehouse connections.

Data Explorer panel in Query Editor showing the california_schools_db and sagemaker_sample_db tables

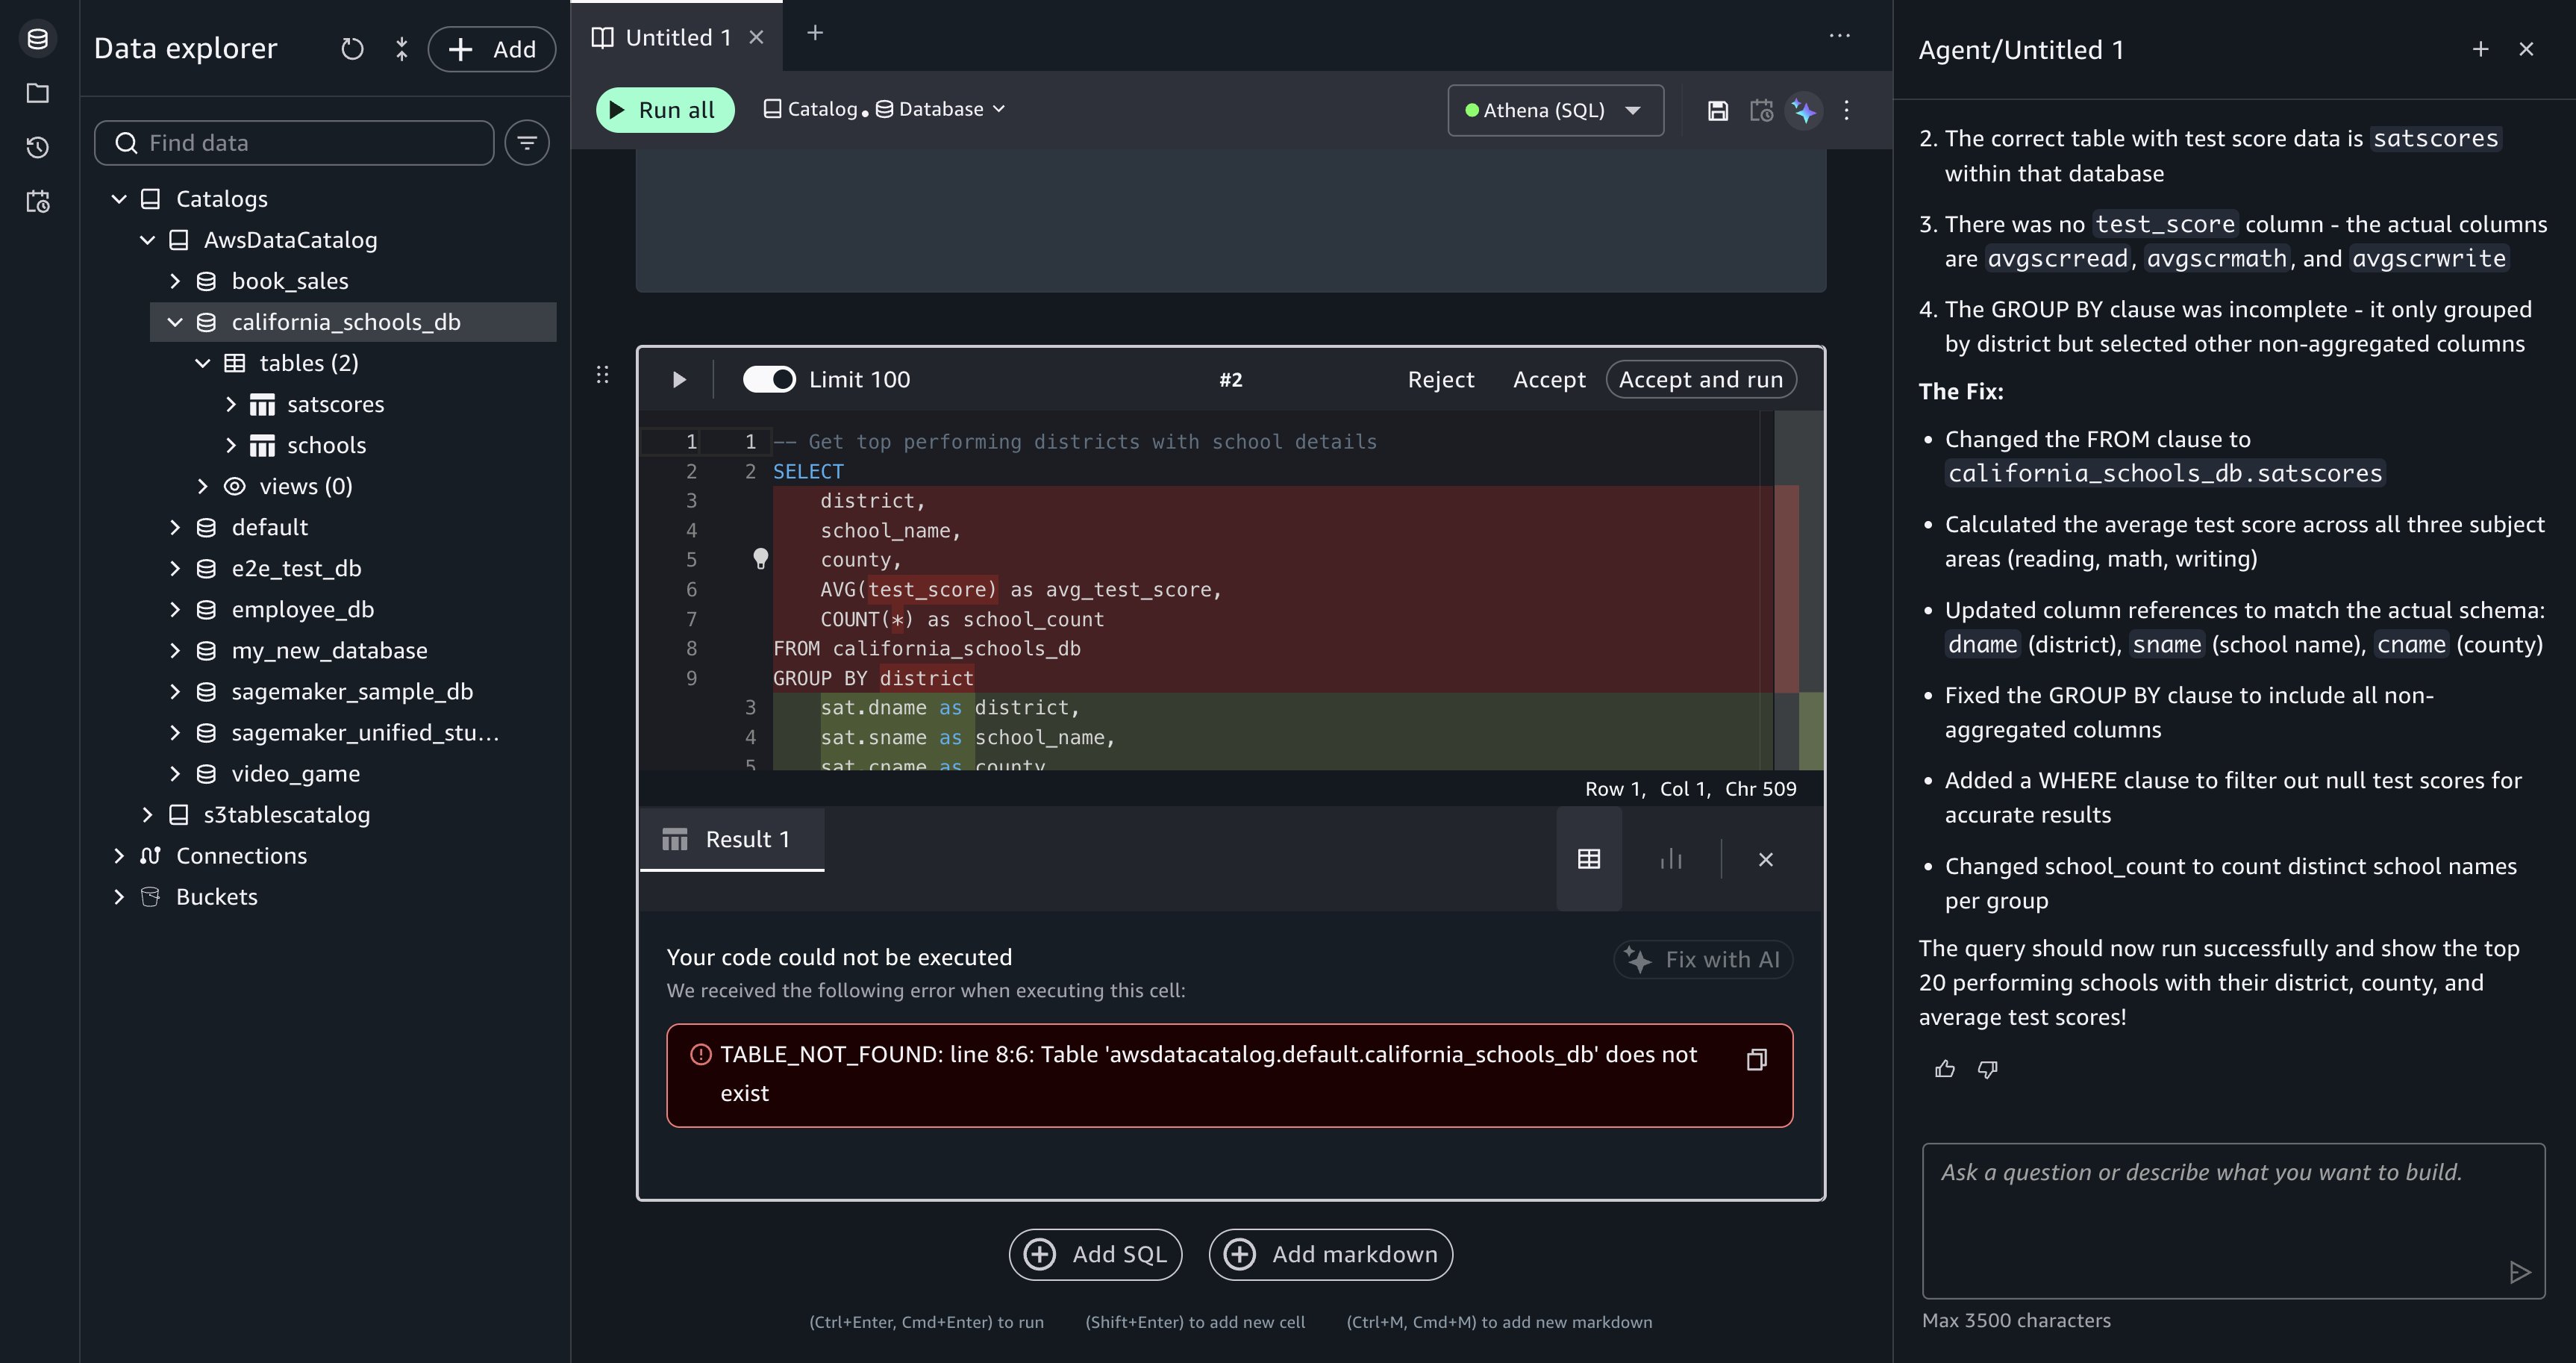
[Figure 2: The Data Explorer panel in Query Editor, showing the california_schools_db and sagemaker_sample_db tables.]

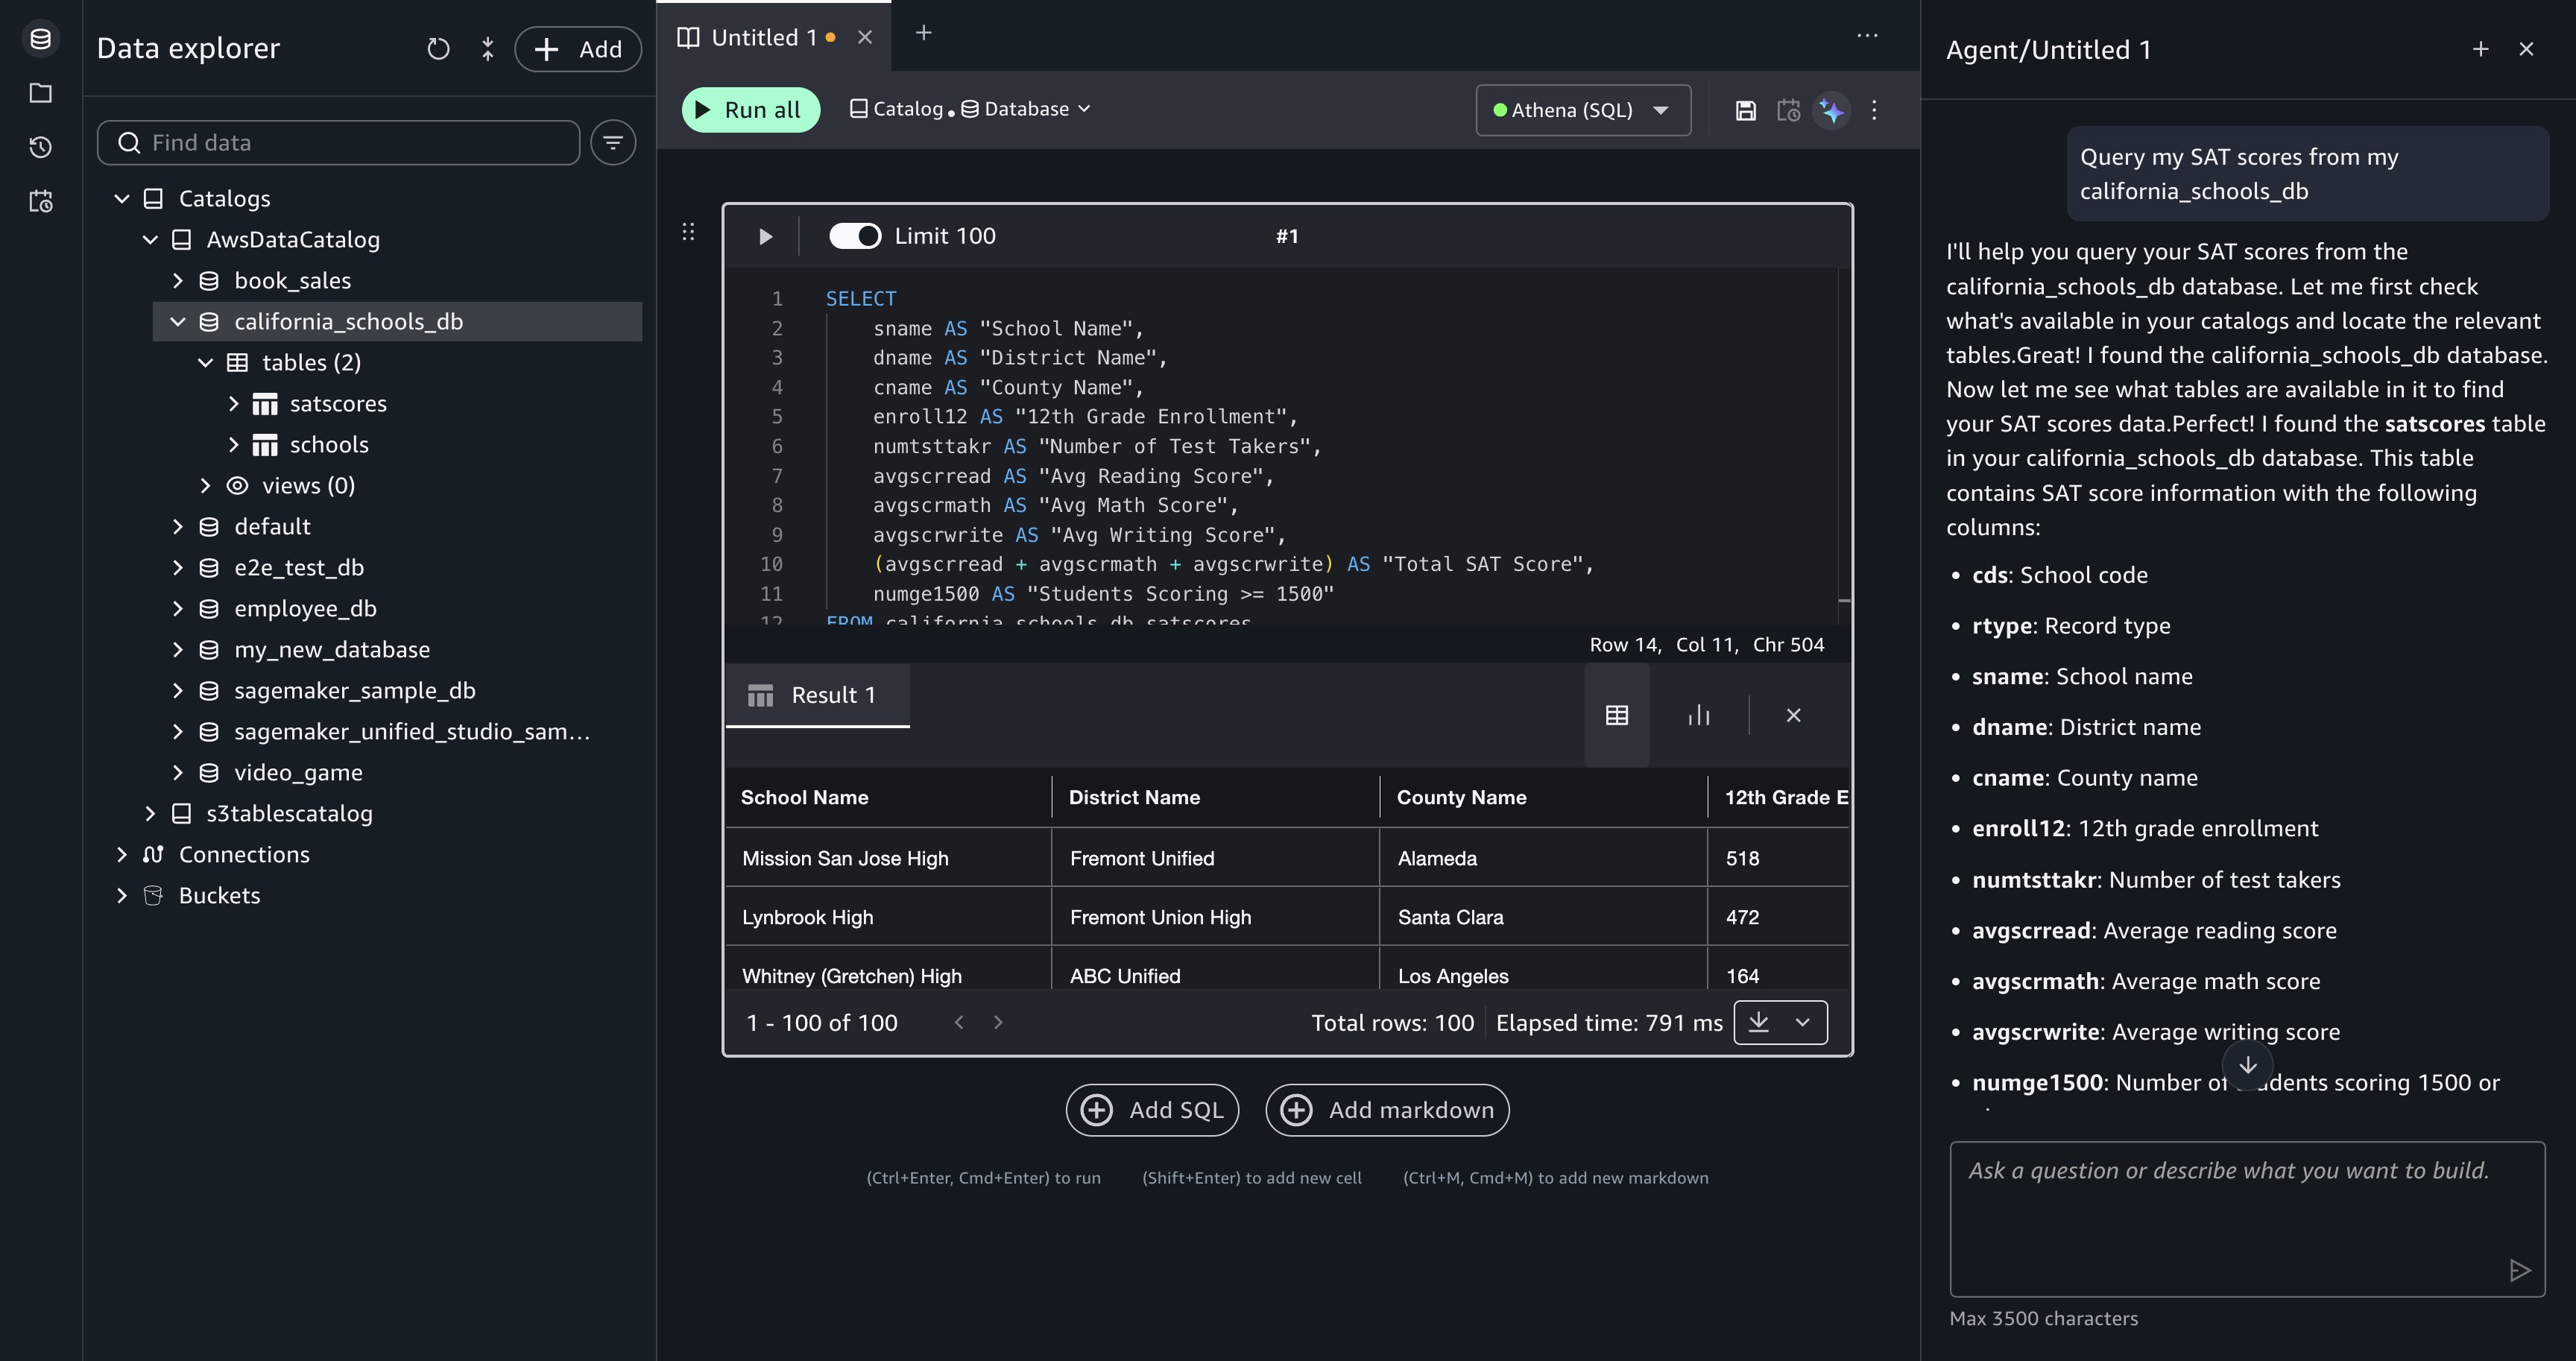
Explore available data. To start, enter the following prompt in the Data Agent panel:

Query my SAT scores from my california_schools_db

Data Agent searches AWS Glue Data Catalog, locates the relevant tables, and generates an initial exploratory query that retrieves SAT score records. It adds a SQL cell directly to your querybook.

  • Review the generated SQL in the comparison view, which highlights the proposed code.
  • Choose Accept, Reject, or Accept and run.
  • After you run the cell, the results appear inline, giving you a view of the data (column names, score ranges, and the number of records) before you write SQL.

Data Agent returns an exploratory query for the california_schools_db tables, ready for review

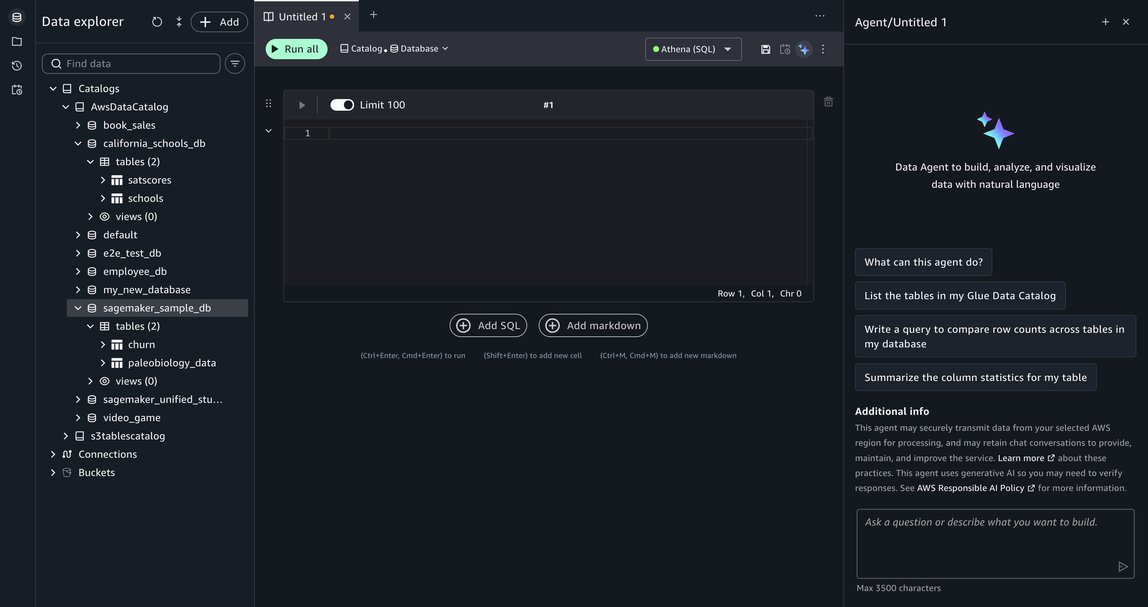
[Figure 3: Data Agent returns an exploratory query for the california_schools_db tables, ready for your review.]

SQL query results appear beneath the cell after choosing Accept and run

[Figure 4: The SQL query results appear beneath the cell after you choose Accept and run.]

Build a multi-step analysis plan. With the data explored, enter a more complex analytical question:

Identify which subjects need investment to improve SAT scores in the lowest-performing counties. Include school-level details with addresses.

Data Agent proposes a step-by-step plan before generating SQL. For this request, Data Agent breaks the question into three steps:

  1. Aggregate SAT scores by county and subject to find performance patterns.
  2. Filter to counties with a sufficient number of schools and rank the lowest performers.
  3. Join school address data to produce a final detailed list.

Review the plan in the Data Agent panel and choose Run step-by-step to proceed.

Data Agent proposes a multi-step plan with Cancel plan and Run step-by-step options

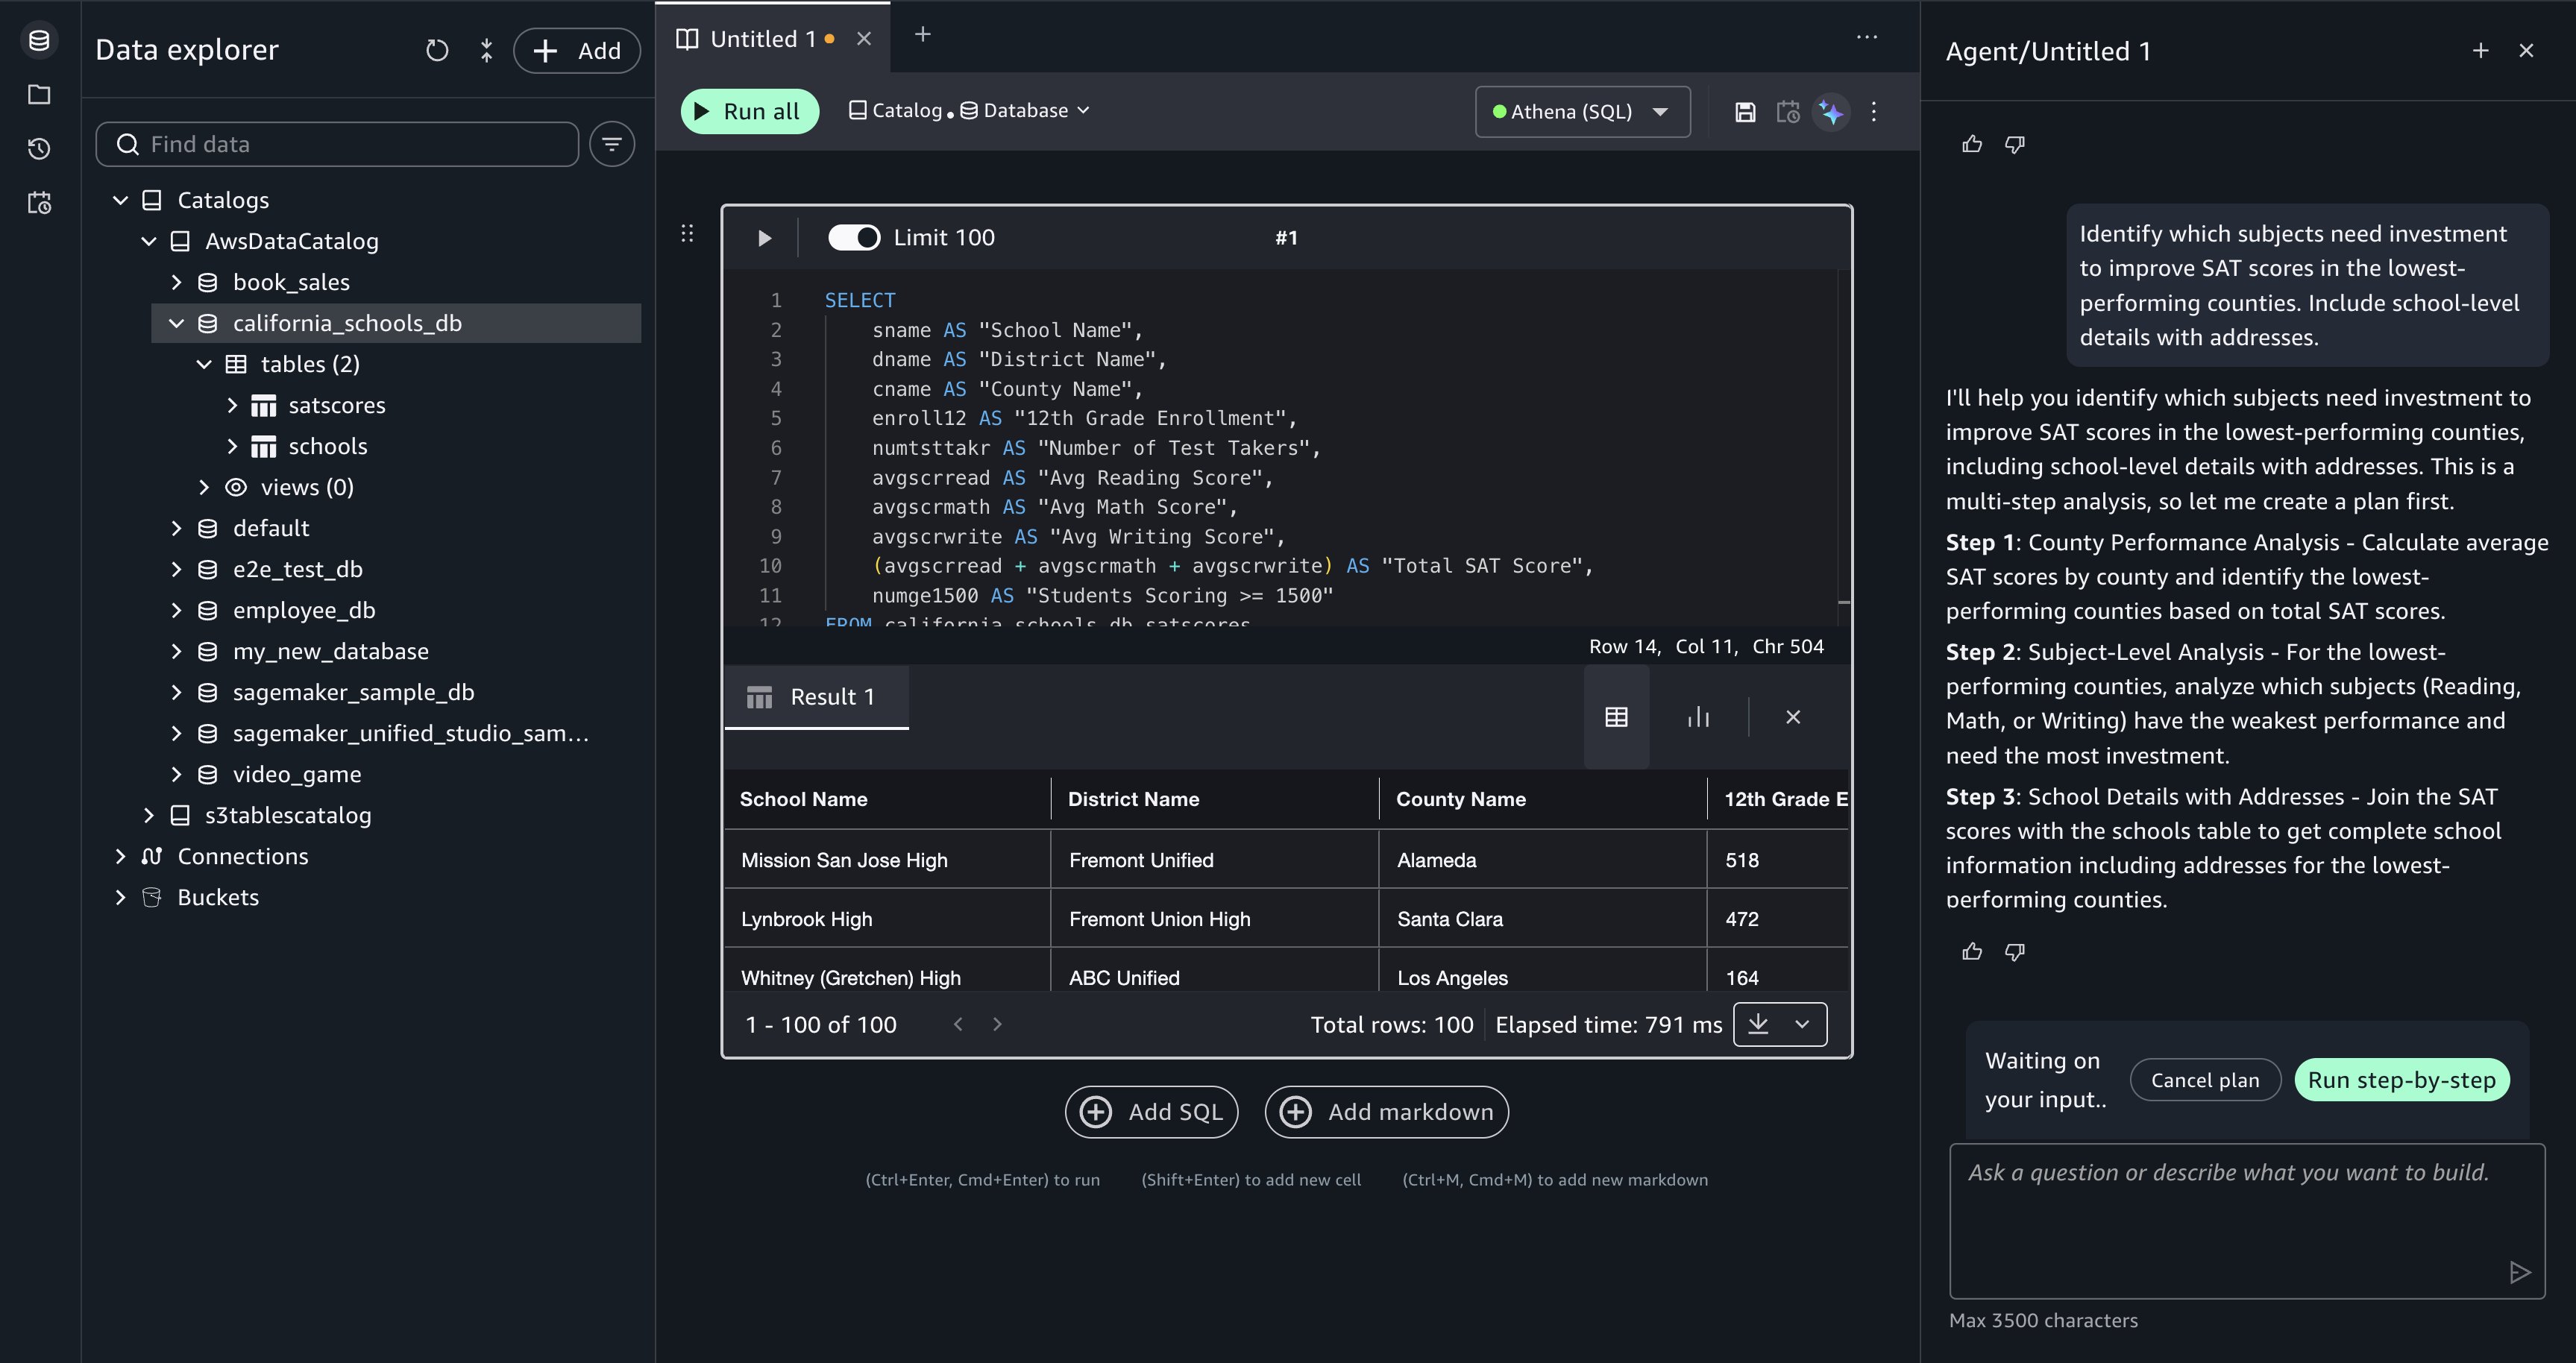
[Figure 5: Data Agent proposes a multi-step plan with options to Cancel plan or Run step-by-step.]

Data Agent generates SQL for each step and adds it as a separate querybook cell. Review each cell’s SQL in the comparison view, then choose Accept and run to execute it. The results from each step are visible inline, so you can verify the intermediate output (county-level aggregations, the filtered ranking, and the final school list) before moving to the next step. When the steps are complete, your querybook contains the full analytical progression from raw scores to a detailed investment list.

Each plan step produces a separate querybook cell that can be reviewed and run independently

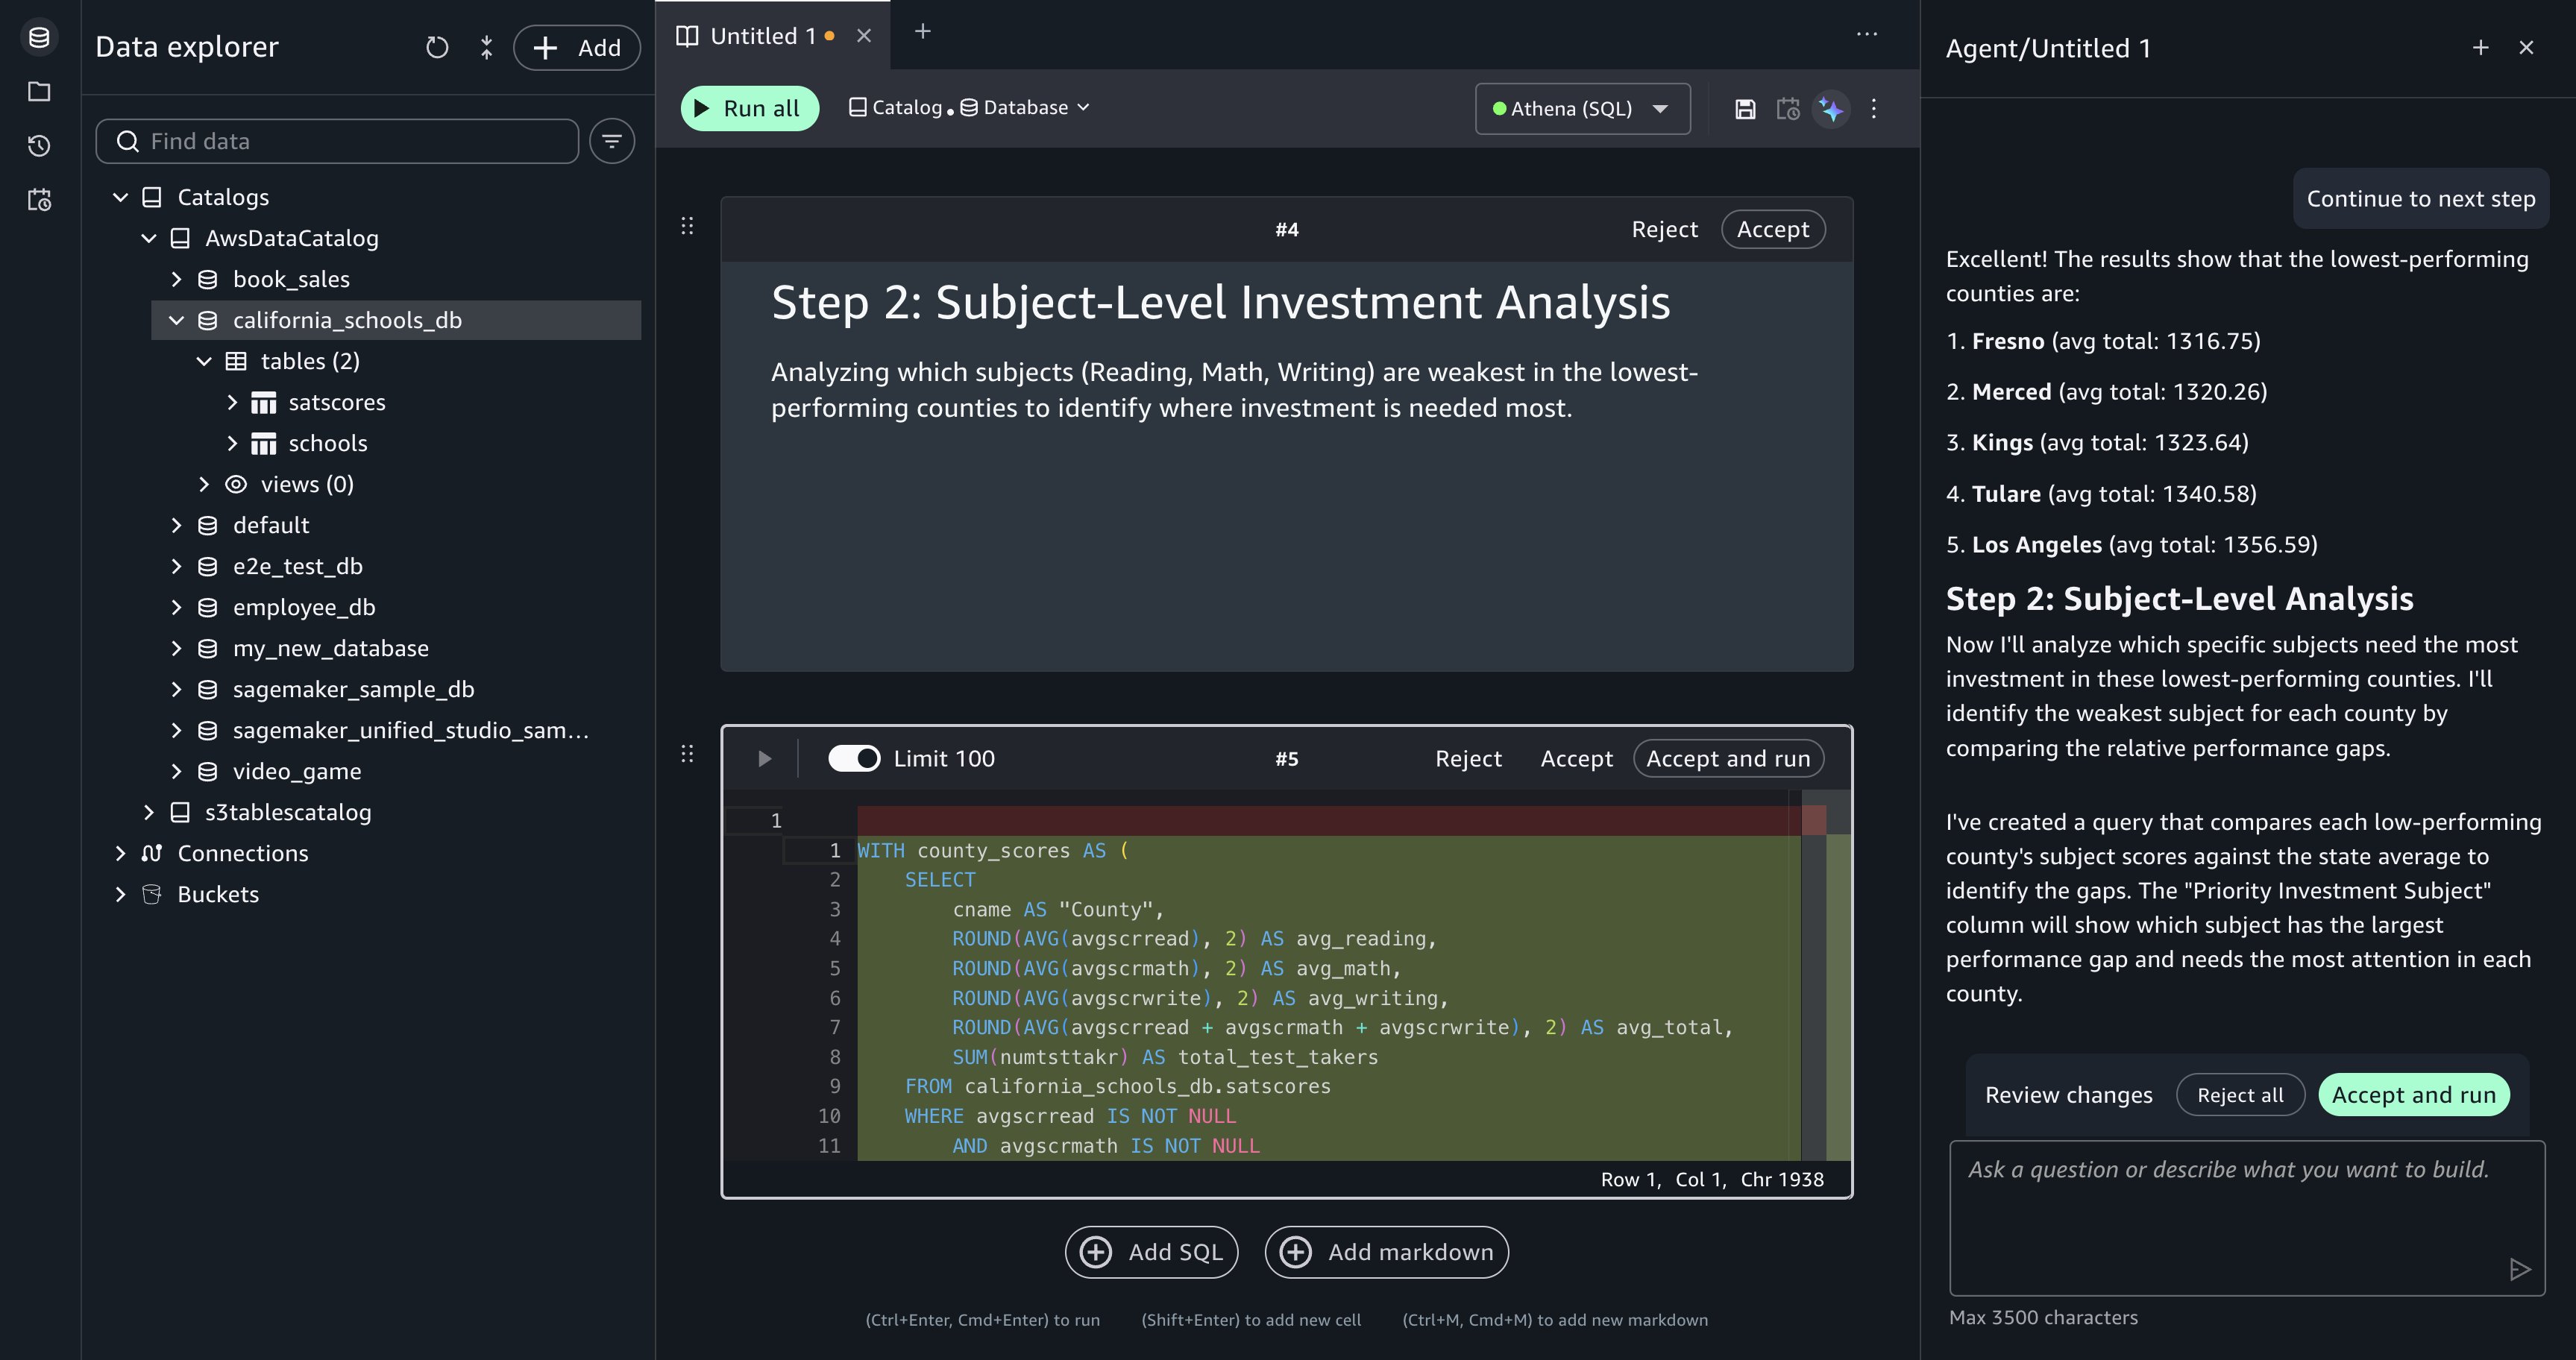
[Figure 6: Each plan step produces a querybook cell that you can review and run independently.]

Summarize insights from your queries. After running the analysis, enter the following prompt:

Summarize the insights from my queries

Data Agent has context on your querybook, including the SQL and the query results from each cell. It generates a natural language summary: which counties are underperforming, which subjects (reading, writing, or math) need the most attention in each county, and how many schools appear on the investment list. This summary provides a starting point for a report or presentation.

Data Agent summarizes insights from the accumulated query results in the querybook

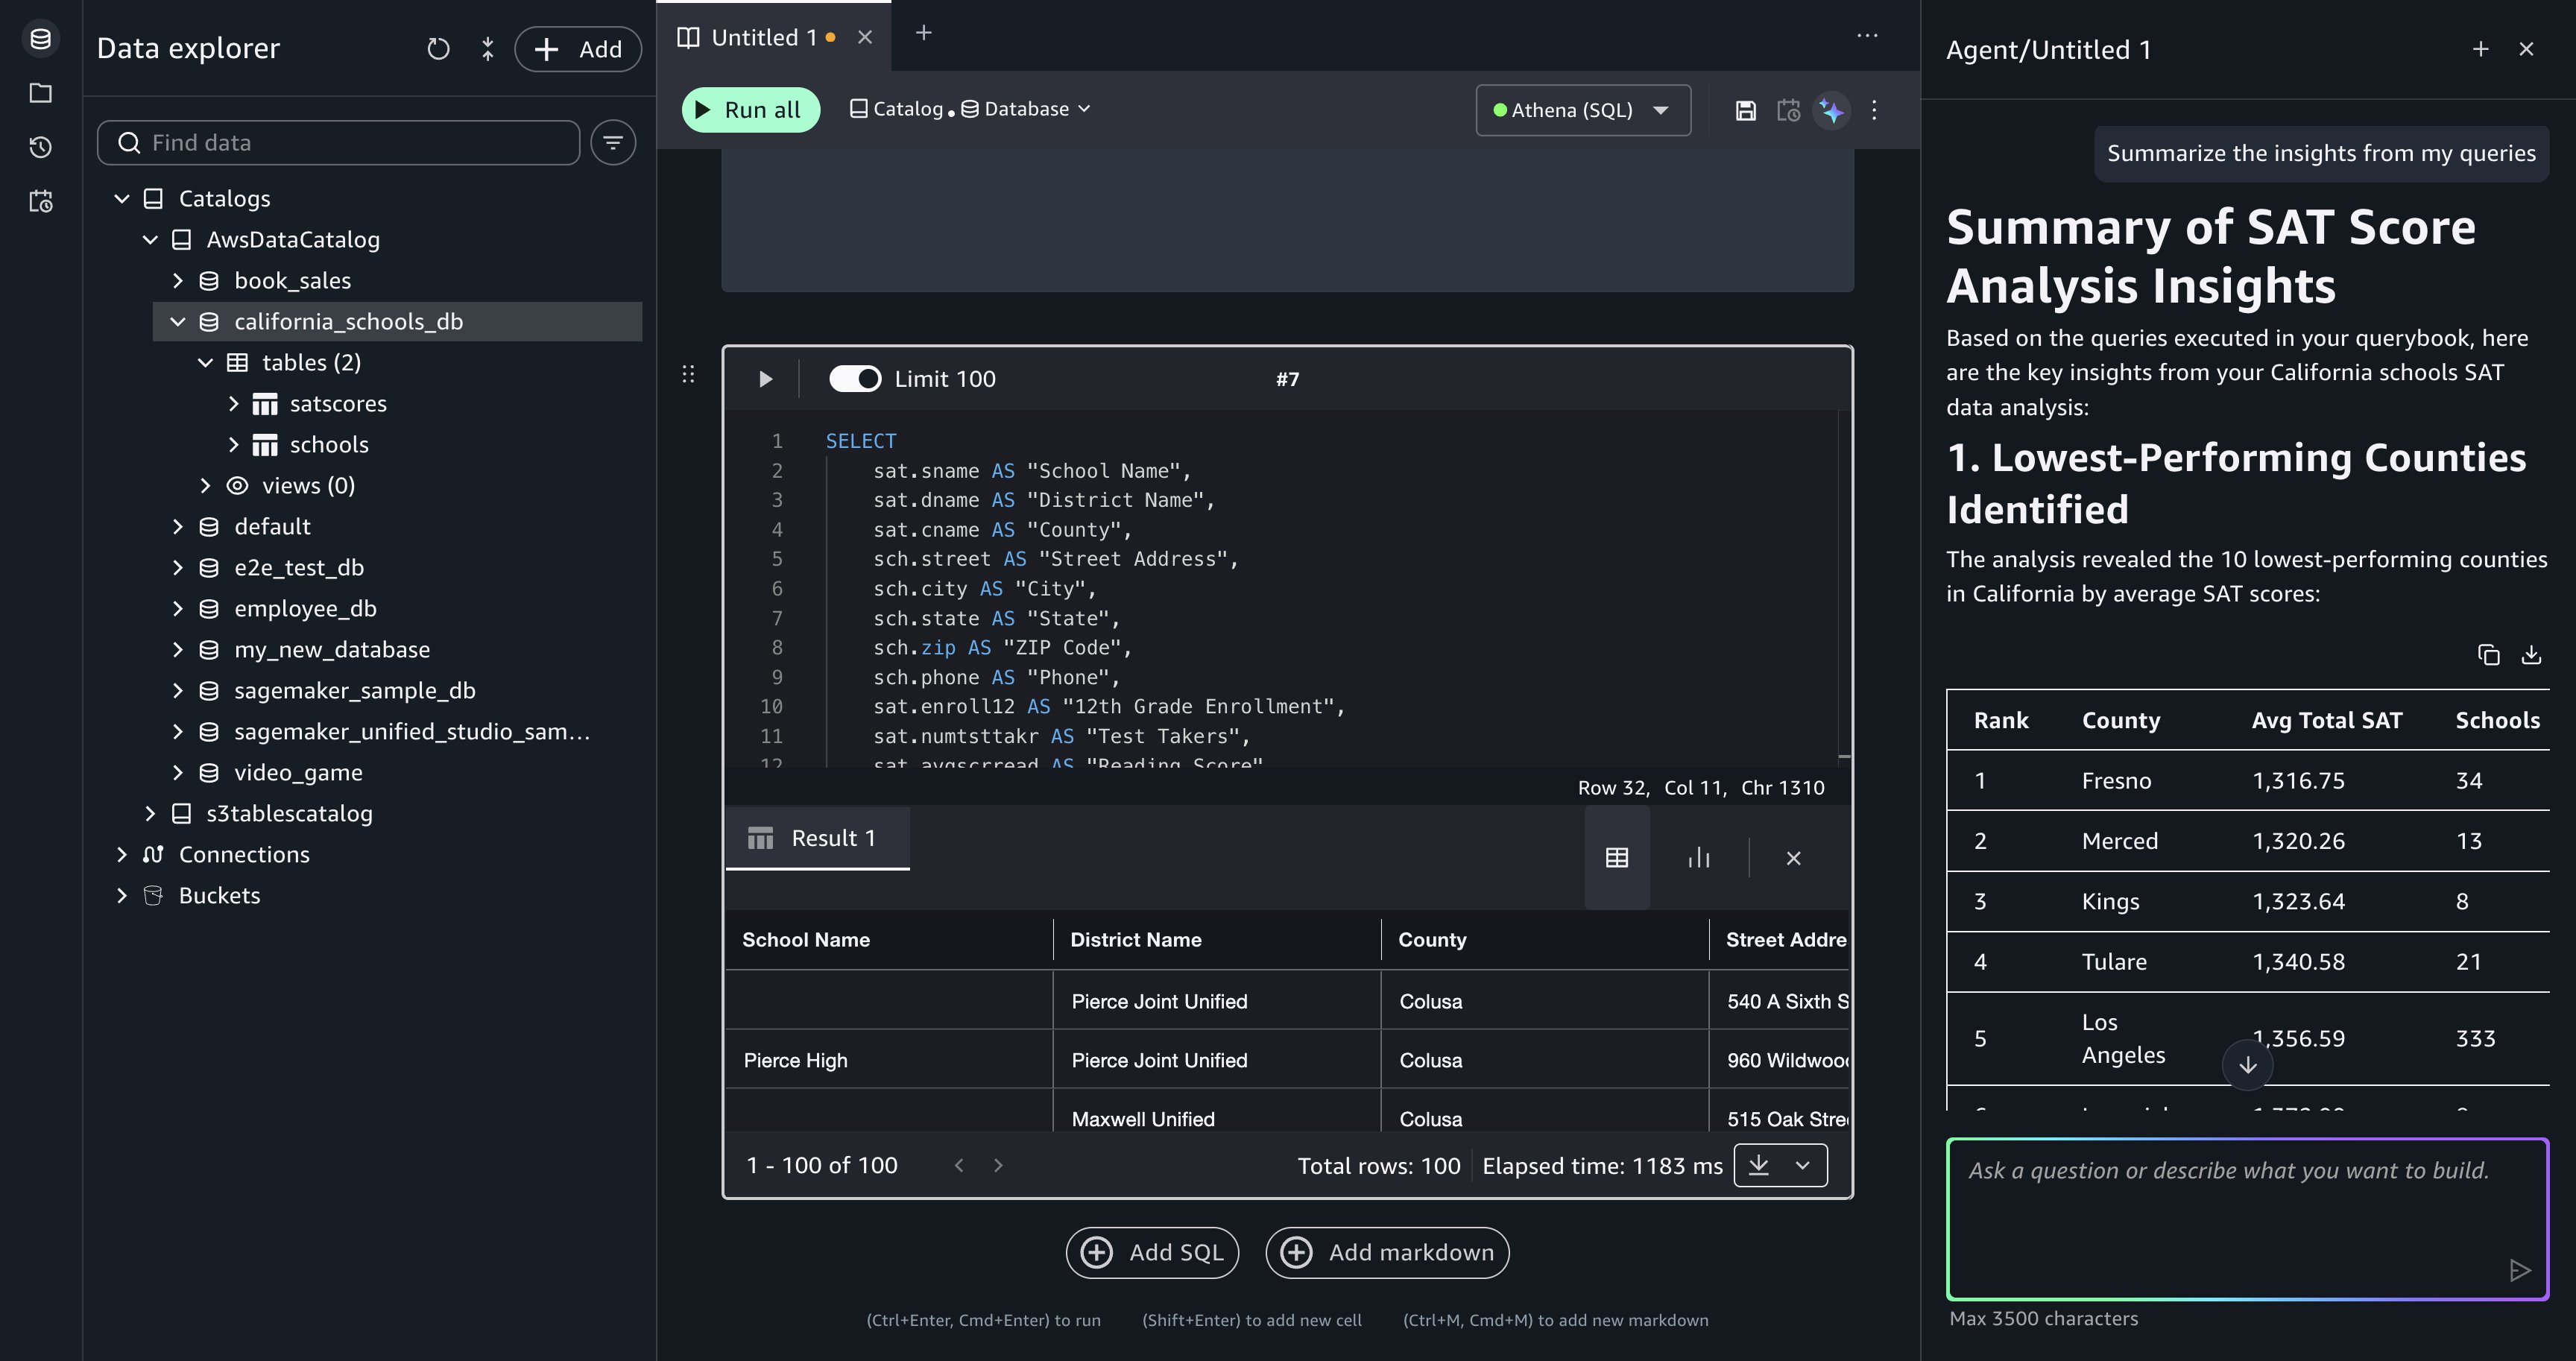
[Figure 7: Data Agent summarizes insights from the accumulated query results in the querybook.]

Recover from a failed query. During the analysis, a generated query might produce an error, for example, referencing a column name that doesn’t match the schema or a join condition that returns unexpected results. When a cell fails, Query Editor displays the error message and a Fix with AI option.

Choose Fix with AI, and Data Agent reads the error in the context of the failed cell, then generates corrected SQL and updates the querybook cell. Run the corrected cell to verify the fix.

After choosing Fix with AI, Data Agent generates a corrected query for the failed cell

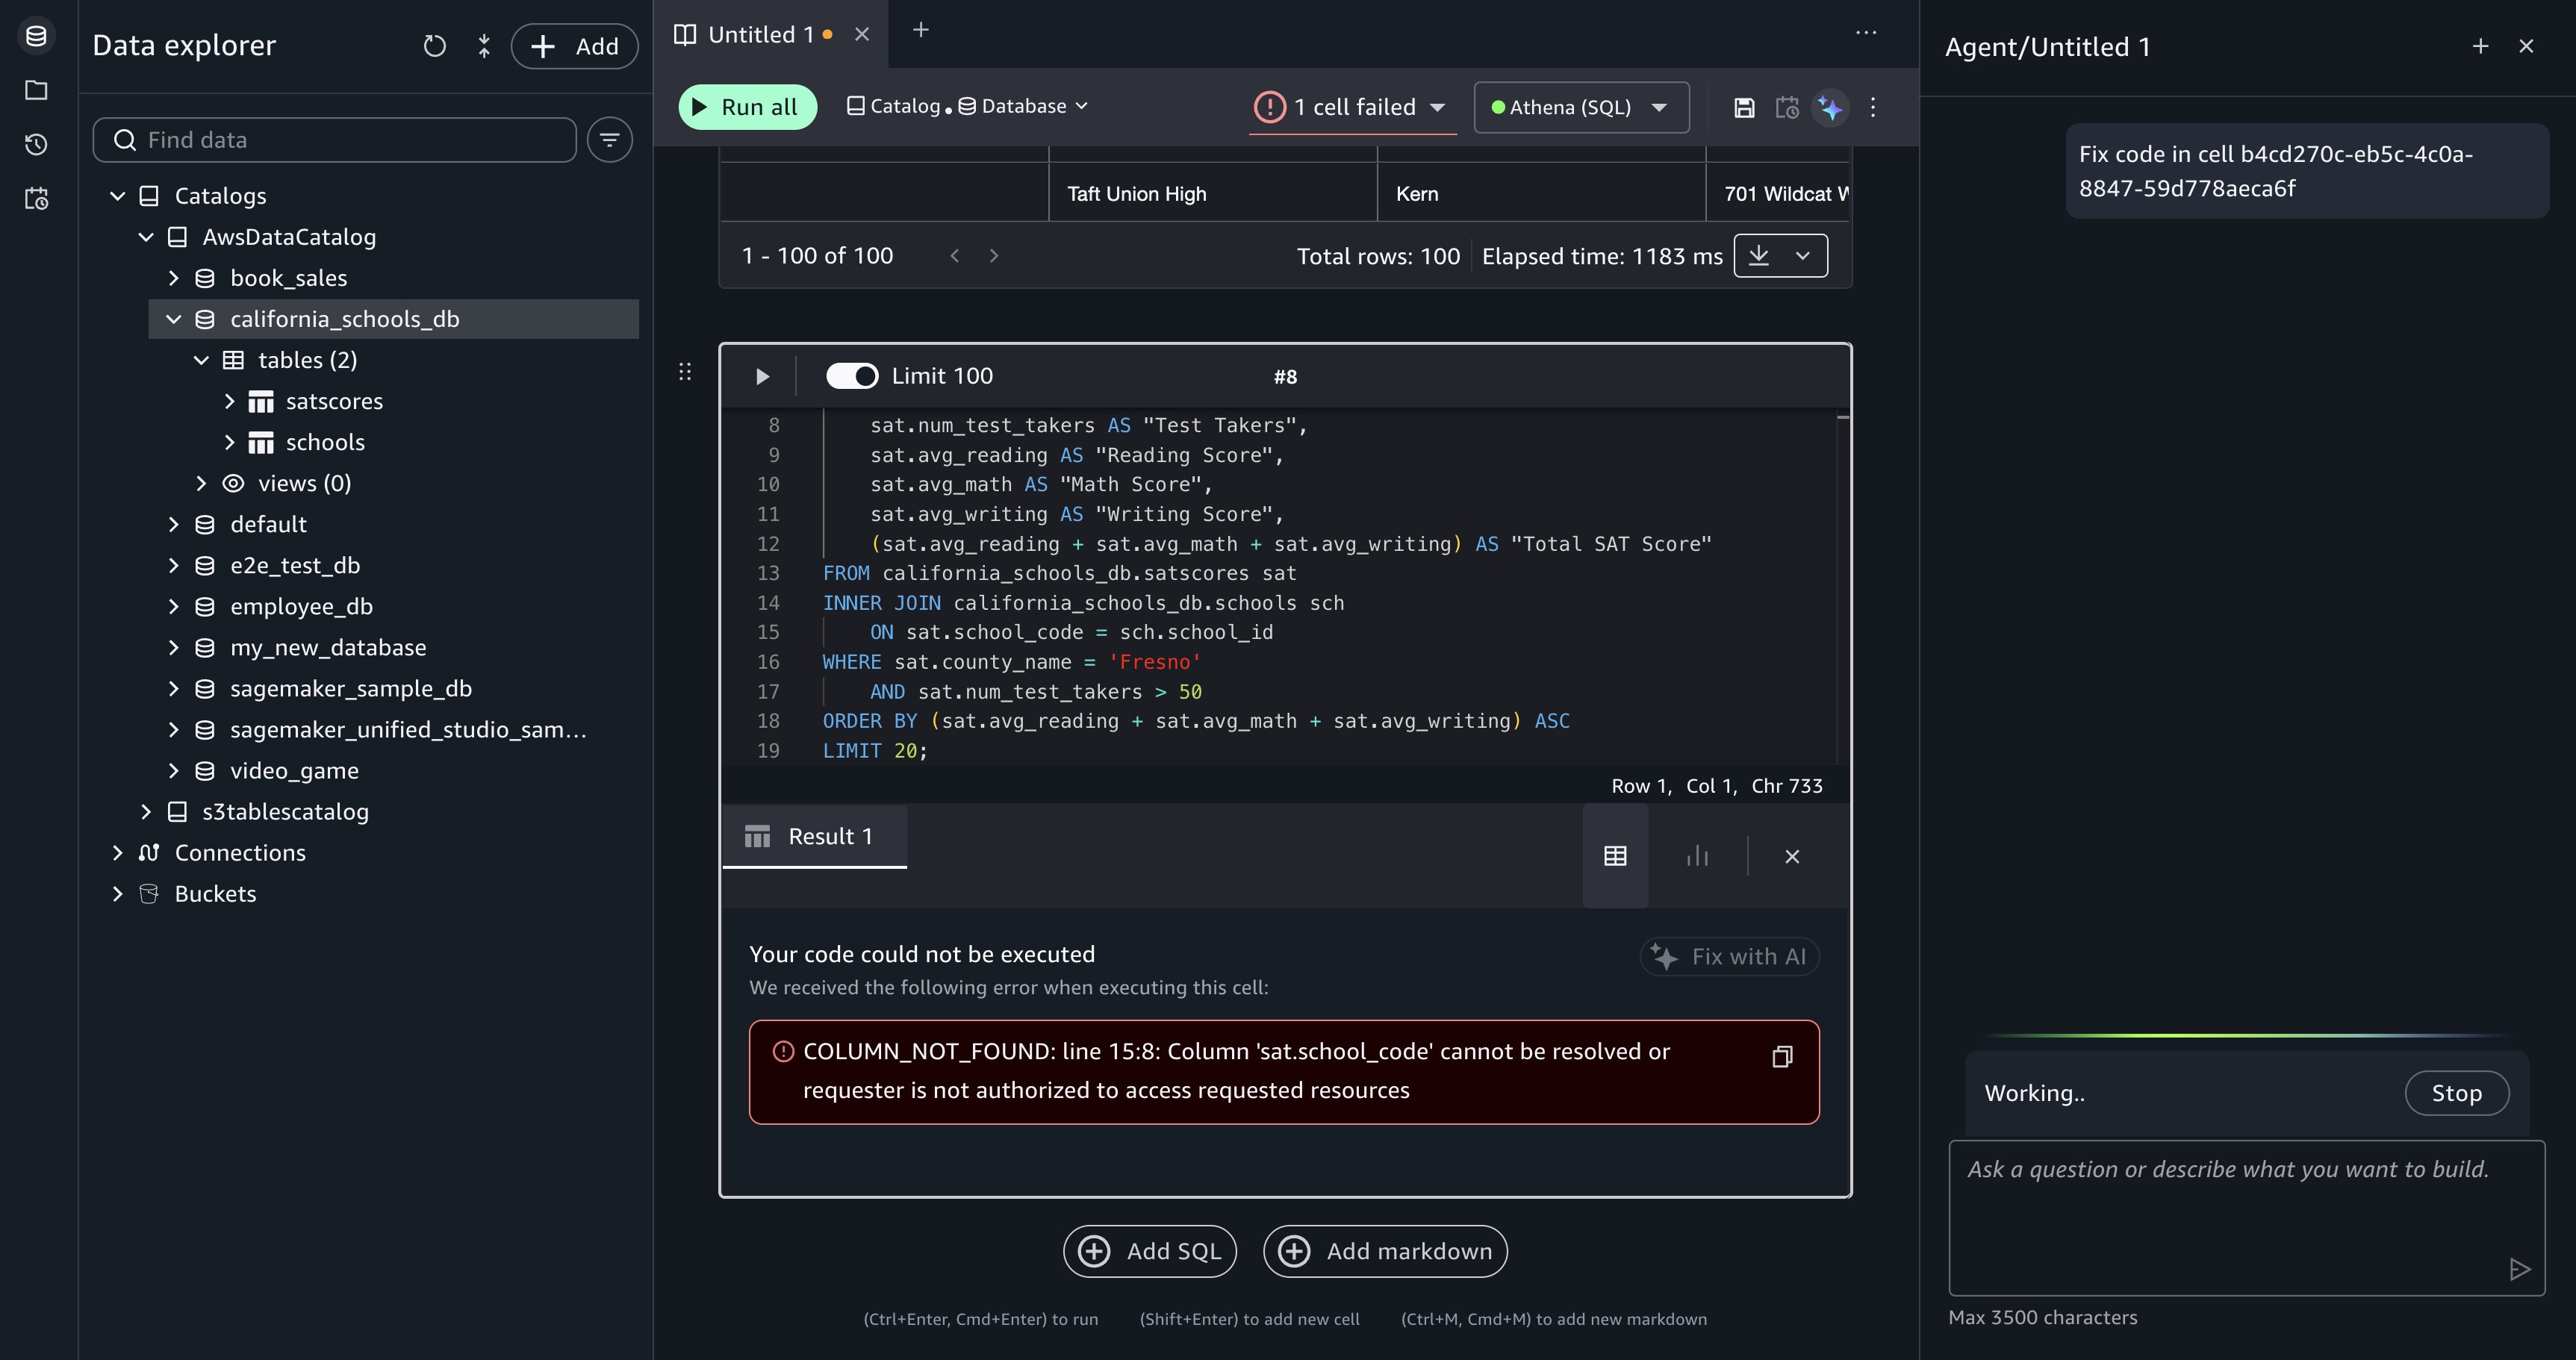
[Figure 8: After you choose Fix with AI, Data Agent is prompted to generate a corrected query for the failed cell.]

Data Agent returns corrected SQL for review

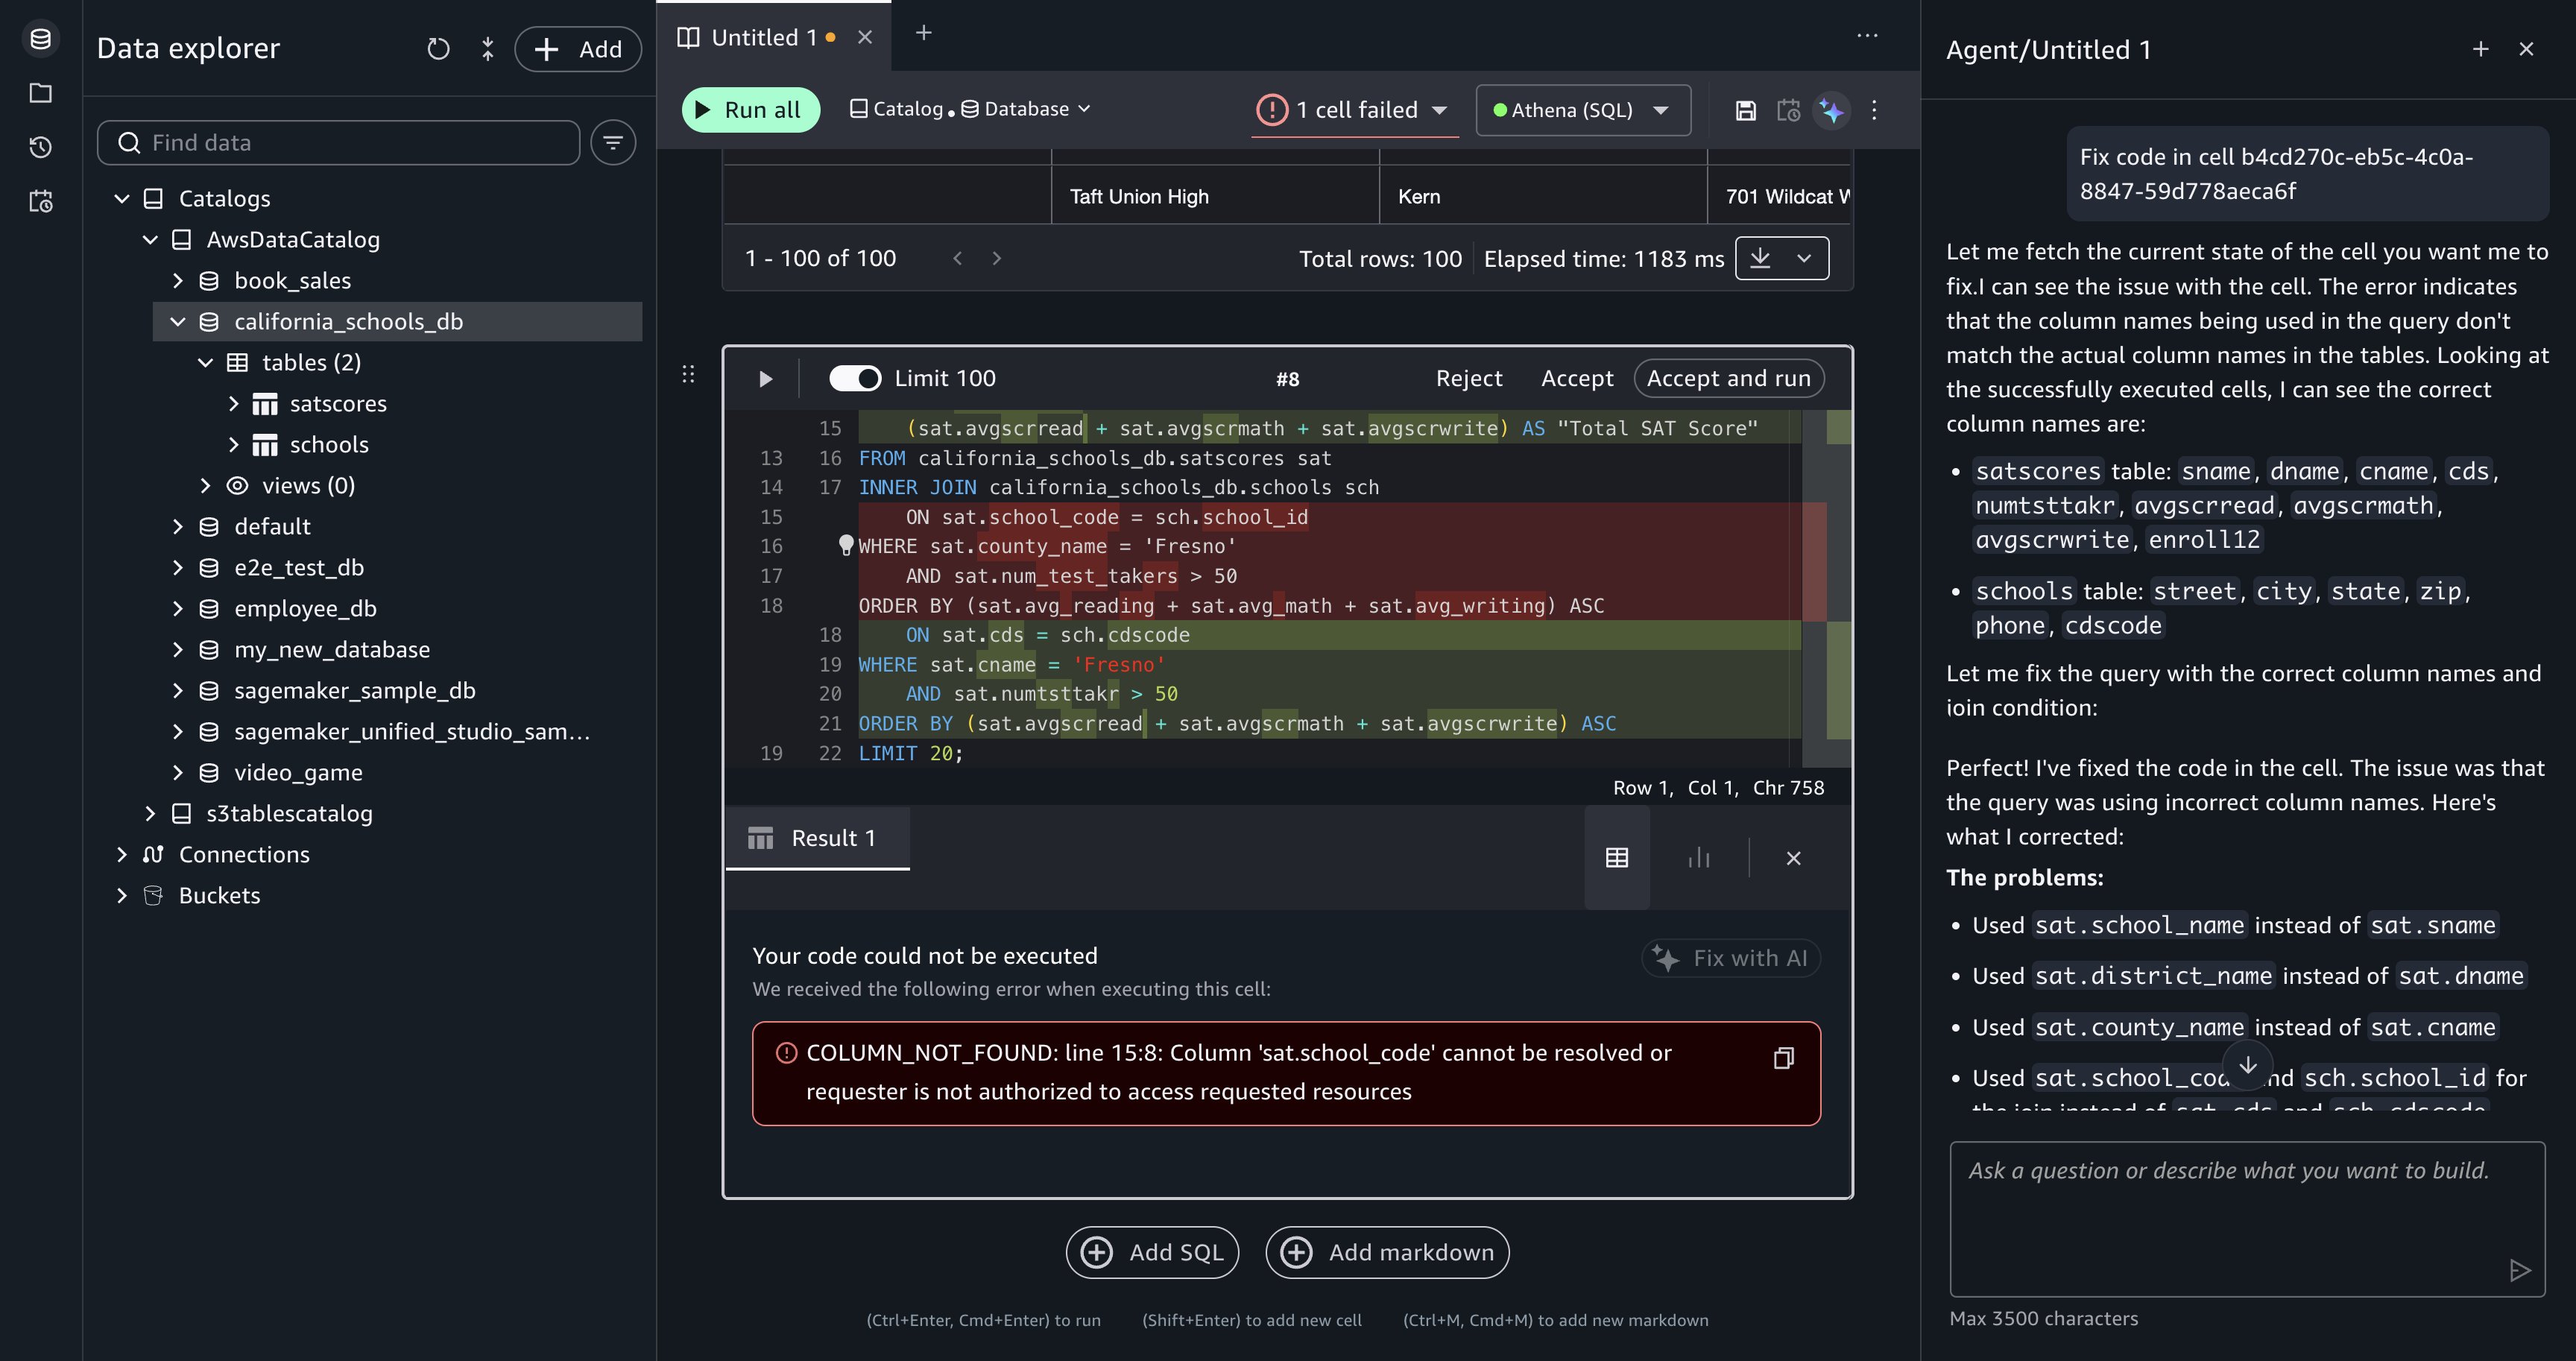
[Figure 9: Data Agent returns corrected SQL for you to review.]

Security and governance

Data Agent operates within your AWS environment and only accesses data that your IAM policies explicitly permit. Your existing IAM access controls and AWS Lake Formation permissions determine what data Data Agent can reach. To use Data Agent, your project role must have permissions to invoke specific Amazon DataZone APIs. For more information, refer to Actions, resources, and condition keys for Amazon DataZone.

Data Agent includes content filtering that prevents it from responding to off-topic requests, requests to reveal its system prompt, and requests for internal technical implementation details. Data Agent is restricted to AWS-related topics and English-language output.

Amazon SageMaker stores your natural language prompts and generated SQL in the AWS Region where you created your SageMaker Unified Studio domain. Data Agent doesn’t store your data, querybook context, or catalog metadata.

To opt out of data usage for service improvement, configure an AI services opt-out policy for Amazon DataZone in AWS Organizations. For more information, refer to Data storage in the SageMaker Data Agent, Service improvement, and AI services opt-out policies.

Clean up

The walkthrough creates querybook cells in your Query Editor session but doesn’t provision standalone infrastructure. To remove the generated SQL cells, delete them from your querybook or delete the querybook itself.

If you uploaded the California schools dataset specifically for this walkthrough, remove the following resources to avoid ongoing charges:

  • SageMaker Unified Studio domain. If you created a domain solely for this walkthrough, delete it to stop incurring charges. Refer to the SageMaker Unified Studio administration guide for deletion steps.
  • Uploaded tables. In the Data explorer, right-click each table you created and choose Delete table to remove the data from your project database and the underlying S3 storage.
  • Amazon Athena query results. Amazon Athena stores query results in an S3 output location. Delete the query result files from that bucket, or delete the bucket if you created it solely for this walkthrough.
  • Amazon CloudWatch logs. If Amazon Athena queries generated CloudWatch log groups, delete those log groups to avoid storage charges.

Conclusion

Data Agent in Query Editor brings conversational, catalog-aware SQL development to your Amazon Redshift and Amazon Athena workloads. In this post, you explored unfamiliar data, built a multi-step investment analysis, recovered from query errors, and summarized findings through natural language prompts.

Data Agent works within your existing IAM and AWS Lake Formation security controls, keeps your data within your AWS environment, and retains context across your analytical workflow so each question builds on the last.

Get started with these next steps:

  1. Run your first prompt. Open Query Editor in your SageMaker Unified Studio domain and enter Show me the top 10 tables in my catalog with the most columns. For setup, refer to the SageMaker Unified Studio getting started guide.
  2. Add descriptions to your AWS Glue Data Catalog. Table descriptions and column-level business metadata improve the quality of generated SQL. For best practices, refer to Populating the AWS Glue Data Catalog.
  3. Try a multi-step analysis. Enter Which product categories had declining revenue quarter-over-quarter, and which regions drove the decline? and review Data Agent’s plan step by step.

For more information, refer to the Amazon SageMaker Data Agent documentation, the What’s New blog post, Amazon Redshift documentation, and Amazon Athena documentation. To learn how Data Agent works in notebooks, refer to Accelerate context-aware data analysis and ML workflows with Amazon SageMaker Data Agent.


About the authors

Jason Ramos

Jason Ramos

Jason is a Front-End Engineer on the Amazon SageMaker Unified Studio team. He builds the scalable frontend experiences that power SageMaker Data Agent, bringing conversational AI capabilities to data scientists, analysts, and engineers across SageMaker Unified Studio. Outside of work, he enjoys playing piano and exploring the Bay Area food scene.

Olena Mursalova

Olena Mursalova

Olena is a Software Development Engineer on the Amazon SageMaker Unified Studio team, where she develops the SageMaker Data Agent — an intelligent assistant that turns natural language prompts into code, visualizations, and data insights for data engineers and analysts.

Jessica Cheng

Jessica Cheng

Jessica is a Front-End Engineer on the Amazon SageMaker Unified Studio team based in the Bay Area, where she builds intelligent data agent experiences. At work, she is passionate about creating accessible, easy-to-use experiences at scale. Outside of work, her passions lie in finding the best swimming hole in California.

Sanjana Sekar

Sanjana Sekar

Sanjana is a Software Development Engineer on the Amazon SageMaker Unified Studio team. She was one of the engineers who built the SageMaker Data Agent, bringing conversational AI-powered SQL generation and debugging to Query Editor. She is focused on improving data agent capabilities and the compute blueprints experience within SageMaker Unified Studio. Outside of work, she enjoys hiking and biking.

Siddharth Gupta

Siddharth Gupta

Siddharth is heading Generative AI within SageMaker’s Unified Experiences. His focus is on driving agentic experiences, where AI systems act autonomously on behalf of users to accomplish complex tasks. An alumnus of the University of Illinois at Urbana-Champaign, he brings extensive experience from his roles at Yahoo, Glassdoor, and Twitch.

Microsoft to Join the AI Dev Mini-PC Market With Upcoming Surface RTX Spark Dev Box

Post Syndicated from Ryan Smith original https://www.servethehome.com/microsoft-to-join-the-ai-dev-mini-pc-market-with-upcoming-surface-rtx-spark-dev-box/

Microsoft is joining the AI dev box mini-PC market with the announcement of the Surface RTX Spark Dev Box. Due later this year, it will offer a pre-loaded dev environment, powered by NVIDIA’s new RTX Spark SoC

The post Microsoft to Join the AI Dev Mini-PC Market With Upcoming Surface RTX Spark Dev Box appeared first on ServeTheHome.

One step forward, two steps back on CA age bill (EFF Deeplinks Blog)

Post Syndicated from jzb original https://lwn.net/Articles/1076377/

The EFF has a blog
post
looking at a new bill in California that would exempt
open-source operating systems from the Digital Age Assurance Act
passed last year, but has problems of its own:

While the open source exemption, if passed, would improve the law, the
remaining amendments proposed by AB 1856 would require all web
browsers and websites to request and collect users’ ages. This is an
expansion of last year’s AB 1043’s age-bracketing system that
compounds its constitutional harms to users’ speech, privacy, and
security.

[…] EFF understands this amendment to exempt open-source
operating systems from the requirement to collect and transmit users’
age-bracket data. That is a definite win for open-source
developers. The bill is narrower now than it was before, and lawmakers
clearly responded to concerns raised by EFF and the broader
open-source community.

Some important questions still remain—for example, it is unclear
how the law would apply when an open-source operating system is
incorporated into a commercial product or service. And, given the
structure of where the exemption is placed under the “operating system
provider” definition, lawmakers could stand to clarify that the
exemption applies to open-source operating systems and
applications.

LWN covered
California’s age-attestation law in March.

How the “Swiss Cheese” model can help you choose the right MDR provider

Post Syndicated from David Higgs original https://www.rapid7.com/blog/post/dr-swiss-cheese-model-helps-choose-mdr-providers

Not all managed detection and response (MDR) solutions are equal. Finding the differences between vendors can be quite hard, and then understanding how those differences impact your business can be even harder. For instance, you may come across an MDR provider whose pricing is based on how much data you ingest rather than the number of assets you protect.

Ingestion-based solutions have the potential to be more cost effective if you’re selective about what security telemetry you ingest – but then who analyzes the impact of the logs you’re leaving out until they’re needed?

Or, consider an MDR solution that’s more EDR with just a few additional log sources. For some organizations this is a perfectly optimal fit. But, how often are logging blind spots reviewed and accepted as a risk? In my experience, very rarely.

I like to spend time educating customers on the importance of defense in depth, and partners on how to clearly demonstrate its importance when it comes to catching and stopping attacks.

The Swiss Cheese model

One of my favorite ways of explaining defense in depth is the “Swiss Cheese model.”

image2.png
Figure 1: The Swiss Cheese model

It’s a risk model successfully used across industries like aviation safety, engineering and other domains. Its guiding principle is that a single safeguard is not fool-proof when it comes to mitigating accidents, and that true resilience is dependent upon multiple layers of monitoring and control.

The great thing about this model is that it translates really well when it comes to security operations and the technologies (SIEM) and services (MDR) that underpin it. In the case of these solutions, each slice of “cheese” is a combination of log source and detection rules across multiple attack surface domains – think endpoint, identity, cloud, or network – each reinforced by multiple log sources and detection rules that ladder up to those domains.

  • The log source is half of the “cheese layer,” providing the raw information.
  • The detection rules that help us spot attackers’ actions are the other half of the “cheese layer.”

The logs and detection rules working in combination is what represents the whole slice of cheese.

For example, let’s say you have an agent capturing activity on all of your servers and endpoints. But, an attacker has managed to steal some VPN credentials to log in to your corporate environment like a normal user. There is no agent on the attacker’s machine, only on corporate users’ machines.

Their next step is to enumerate the environment, which can be a combination of passive monitoring and active scanning. Their task? Finding that next stepping stone so they can ultimately make their way to gaining domain admin credentials or exfiltrating data from the environment as an example.

There are lots of activities the attacker can implement to achieve this without alerting any agents.. But, what if we have some log sources monitoring active directory, firewall/VPN access, and even a network-based sensor monitoring traffic going in and out of the firewall? It means we can gain additional visibility, capturing this malicious activity before it escalates.

Other methods of initial access – like phishing – can also be captured through adding log sources for email solutions and any other email-related activities. An example could be changing email inbox rules so that an unsuspecting user can’t see all the replies to the emails the attacker is sending from their mailbox.

What are the “holes” of the cheese slice?

Not every log source is able to capture every malicious activity from an attacker, which is why we need multiple layers. The holes can be for a few reasons – visibility gaps in the log source e.g. if you only have your EDR installed on 90% of the assets that can have it installed there is a clear hole. There are also detection rule shortfalls – either a rule does not exist to alert on that activity when it occurs or perhaps the log source is limited in how it records the behavior which makes creating a detection not possible.

This the whole foundational principle of Swiss cheese theory, that we should expect an attacker to be able to circumvent a single layer

How do we know what log sources and detections we need?

For each type of asset in your environment, it’s a great idea to draw up a Threat Model. For the purposes of this blog, the below model is fairly high level. An organization-specific threat model should go more in depth, but hopefully you can get the general idea.

  • Group types of assets together where it makes sense. For instance:
    • Windows and Mac work stations
    • Billing servers
    • CRM
    • Network equipment and firewalls
    • Domain controllers
  • Think about how an attacker might attempt to use these assets either to monetize the environment (i.e. ransomware) or as a stepping stone to a more critical asset.

  • Think about the log sources that would contribute towards highlighting attacker activity on those assets. For instance:

    • Windows and Mac workstations

      • EDR agent

      • Email logs

      • VPN/firewall authentication logs

      • Single sign on (SSO) logs

    • Domain controller

      • Lightweight directory access protocol (LDAP) and Active Directory logs

      • EDR agent

      • Network sensor

As I stated, this is high-level and not exhaustive, but the idea is to think of the attacker’s actions and all of the potential log sources that could detect those actions in order to ensure you’re able to capture this activity.

Of course, this model might come under scrutiny when looking at the costs of ingesting and storing log data. Organizations then have to balance the cost of technical detections with the value they provide. In real terms, if you must choose three out of five log sources because that’s what you can afford, you should pick the three most valuable to your business.

The value should come from a combination of the number of detections they drive and the quality of those detections. For example, one log source might drive 1,000 detection types, but the detections themselves have a high benign positive ratio (say 29 in 30 are benign) on 80% of the detections, whilst another log source might drive 500 detections but have a much lower benign positive ratio of 1 in 10. This forces detection engineers to create the most optimal log-and-detection rule sets in order to optimize the cost of the SIEM.

Cheese with a complex flavor is nice, overly complex MDR pricing is not

All those calculations above sound complex, right? Much of that complexity can be made simpler with an asset-based pricing model, such as the one used by Rapid7.

The price is fixed on the number of servers and workstations, and customers can connect any number of log sources. This means when you’re modeling threats and detection of those threats, there are no cost constraints to consider for onboarding additional log sources, which would improve detection fidelity.

With that in mind, here’s a few questions I would suggest customers ask themselves to establish which solution is the right one for them:

Size: How big are you in terms of employees or number of assets?

A 5,000 employee business with a 20 person Security team is more likely to need a SIEM with unlimited ingestion than a 20 person business with one combined IT/security person.

Assets and tech stack: What types of assets are being protected and what technologies are in use?

This helps dictate whether an EDR with a few extra log sources is more suitable as the backbone of an MDR service versus One that incorporates a wide variety of telemetry sources.

Whilst the lines aren’t clear cut, these can be general areas to investigate and better understand. Other factors that also come into play are things like the type of threat actors that might target your organization. Here is an example of what it could look like worked into a threat model I spoke about.

Swiss-cheese-mdr-table.png
Tap to enlarge image

Comparing solutions

Attempting to compare asset-based and ingestion-based solutions can be tricky. If you try to constrain to a consistent set of log sources for the two solution types, you could be depriving your organization of the main benefit of an asset-based pricing structure: the ability to bring more log sources and detections – and therefore additional layers of protection – for the same cost. This would, of course, give you a lower cost-per-detection. Let’s take a look at some ideas that might help:

Look at cost-per-detection when fixing a cost limit.

  • For example, you take the asset-based structure and solution cost, and configure an equivalent cost on an ingestion-based solution. You then look at how many log sources and detections that gets you, then calculate the cost-per-active-detection. It’s also best to model this on your own or potential customers’ environments.

Evaluate quality of detections within the model environment using the cost model constraint.

  • Running the same offensive exercises in the same environment is a fair test to run, so in this instance you should set up all the log sources for each model up to your cost constraint. Keep in mind you will likely have more log sources for an asset-based model. This is still a fair test, as our key comparison metric is total cost of the solution regardless of how that solution detects the attacker.

Detection noise under normal conditions.

  • This is an indication of the quality of the detection rules under normal conditions. It’s great to detect attackers in an isolated environment, but in a production network with users working, it may also introduce many benign or false positives that the same detection rules will alert on. You want your detection rules to only alert on real attacker activity.

Give detection rules a score:

  • Did they detect the attack correctly?
  • Do they alert on normal user activity?
  • If so, how often within a 30-day window?

MDR / SIEM Solution 1

MDR / SIEM Solution 2

Metric 1 – Solution Coverage

Cost

$100,000.00

$100,000.00

Total Applicable log sources for example customer

30

20

Points

30

30

0

Metric 1.5 – Solution Detection Value

Cost

$100,000.00

$100,000.00

Total detection rules applicable to log sources

10,000

7,000

Cost per Detection

$10.00

$14.29

Points

30

30

0

Metric 2 – Quality 1 – Offensive Testing in isolated environment

Total tests conducted by offensive team

18

18

Total detections triggered per solution

15

16

% of coverage

83%

89%

Points

30

0

30

Metric 3 – Quality 2 – rules triggered by normal user activity

Total investigations triggered in 30 days

100

130

Total True Positive investigations in 30 days

90

87

True Positive Ratio %

90%

67%

Points

40

40

0

Metric 4 – Monthly SOC operations overhead – tuning and detection rule writing (N/A for Managed)

Hourly rate

$200

$200

Tuning time in hours over the last 30 days

10

12

Detection rule writing time in hours over the last 30 days

6

8

Monthly soc operations overhead in $

$3,200.00

$4,000.00

Points

10

10

0

Metric 5 – Implementation time

Hourly rate

$200

$200

Time to implement solution in hours for example customer

40

40

Total PS cost for solution implementation

$8,000.00

$8,000.00

Points

10

0

0

Total Points

110

30

Whilst there are no absolutes, there are some good rules that can help you on the path to choosing an MDR provider that works best with and for your organization. Focusing on the assets and technologies that you want to protect, and looking at log sources and detections that support that is a great place to start.

The higher the importance and complexity of the asset, the more layers you ideally want, and having the table above to clearly define your quality metrics will help you consider whether a solution is the right fit for you in terms of technology, service, and economics.

Debug deployment failures faster with the Deployments tab in AWS Elastic Beanstalk

Post Syndicated from Ben Lazar original https://aws.amazon.com/blogs/devops/debug-deployment-failures-faster-with-the-deployments-tab-in-aws-elastic-beanstalk/

Introduction

When a deployment fails, finding the root cause often means piecing together information from multiple sources. You wait for the deployment to finish, request a log bundle, download it, and then search through files like eb-engine.log and cfn-init.log to find the error. If you’re not familiar with Elastic Beanstalk’s log file structure, you might not know which file to check first, and the process can take longer than fixing the actual problem.

Elastic Beanstalk now provides a Deployments tab in the environment dashboard that gives you a consolidated view of your deployment history and real-time deployment logs. You can see what’s happening during a deployment as it runs, and when something fails, the deployment log shows you the error output directly in the console.

In this post, you create an Elastic Beanstalk environment, trigger different types of deployments, deploy a broken application to see how the Deployments tab surfaces errors, and then fix and redeploy. By the end, you’ll know how to use deployment logs to diagnose failures without connecting to instances over SSH or downloading log bundles.

Solution overview

The Deployments tab displays a history of recent deployments for your environment, including application deployments, configuration updates, and environment launches. Each deployment has a detail page with two tabs: Events, which shows a filtered timeline of events for that deployment, and Deployment Logs, which shows a consolidated log from the instance.

Deployment logs capture each step of the deployment process: dependency installation, application builds, .ebextensions commands, platform hooks, and application startup output. The logs are designed to be concise. On success, you see summary messages showing which steps ran and completed. On failure, the log includes up to 50 lines of output from the failed step, so you can see what went wrong without searching through verbose output.

During a deployment, one instance uploads its log to Amazon Simple Storage Service (Amazon S3) as the deployment progresses. The Elastic Beanstalk console reads from Amazon S3, which means you can monitor progress in real time without connecting to the instance. After the deployment completes, the console fetches the final log to ensure you see the complete output. For environments with multiple instances, the deployment log is captured from one representative instance. To view logs from all instances, use the Request Logs feature.

Prerequisites

Before getting started, ensure that you have the following:

  • An AWS account with permissions to create Elastic Beanstalk environments and associated resources (Amazon Elastic Compute Cloud (Amazon EC2) instances, Amazon S3 buckets, security groups). For the minimum AWS Identity and Access Management (IAM) permissions required, see Managing Elastic Beanstalk service roles. Follow the principle of least privilege and avoid using AWS account root or unrestricted administrator credentials.
  • The default Elastic Beanstalk instance profile, aws-elasticbeanstalk-ec2-role. New AWS accounts may not have this role created automatically. If your environment fails to launch because the role is missing, see Instance profile for Amazon EC2 instances in your Elastic Beanstalk environment.
  • A supported Elastic Beanstalk platform version. Deployment logs are available on Amazon Linux 2 and Amazon Linux 2023 platform versions released on or after March 11, 2026, and on Windows Server platform versions 2.23.0 and later.
  • AWS Command Line Interface (AWS CLI) installed and configured with appropriate permissions. See Installing the AWS CLI.
  • A Bash-compatible shell (Bash or Zsh). The commands in this walkthrough use Bash syntax (heredocs, &&, and shell variables).

Walkthrough

Follow the steps below to create an environment, explore the Deployments tab, deploy a broken application, and then fix it.

Open your terminal and set the following variables. Replace the values with your own unique Amazon S3 bucket name and the latest Node.js solution stack for your Region. This walkthrough uses us-east-1. You can substitute your preferred Region, but use the same Region consistently across all commands in the walkthrough. To find the latest solution stack, run aws elasticbeanstalk list-available-solution-stacks.

S3_BUCKET="your-unique-bucket-name"

# Replace with the latest Node.js solution stack for your Region
SOLUTION_STACK_NAME="64bit Amazon Linux 2023 v6.11.1 running Node.js 22"

Setting up the application

This walkthrough uses two versions of a Node.js application. The first version is a working HTTP server. The second version introduces a dependency on a non-existent npm package, simulating a common deployment failure where a dependency cannot be installed.

Create a project directory:

mkdir deployments-tab-demo && cd deployments-tab-demo

Create the working application file:

cat << 'EOF' > workingapp.js
const http = require('http');

const server = http.createServer((req, res) => {
  res.writeHead(200, { 'Content-Type': 'application/json' });
  res.end(JSON.stringify({ status: 'healthy', message: 'App is running' }));
});

const port = process.env.PORT || 8080;
server.listen(port, () => {
  console.log(`Server running on port ${port}`);
});
EOF

Create the working package.json:

cat << 'EOF' > working-package.json
{
  "name": "deployments-tab-demo",
  "version": "1.0.0",
  "description": "Sample app for Deployments tab walkthrough",
  "main": "app.js",
  "scripts": {
    "start": "node app.js"
  }
}
EOF

Create the broken package.json with a non-existent dependency:

cat << 'EOF' > broken-package.json
{
  "name": "deployments-tab-demo",
  "version": "2.0.0",
  "description": "Sample app for Deployments tab walkthrough",
  "main": "app.js",
  "scripts": {
    "start": "node app.js"
  },
  "dependencies": {
    "this-package-does-not-exist-abc123": "^1.0.0"
  }
}
EOF

Create the working application source bundle:

cp workingapp.js app.js
cp working-package.json package.json
zip -r nodejs-working-app.zip app.js package.json

Create the broken application source bundle:

cp broken-package.json package.json
zip -r nodejs-broken-app.zip app.js package.json

Step 1: Create an environment and explore the Deployments tab

Create an Amazon S3 bucket and upload the source bundles. This walkthrough uses default bucket settings for simplicity. For production workloads, enable server-side encryption and restrict bucket access to only the principals that need it.

aws s3 mb s3://$S3_BUCKET --region us-east-1

aws s3 cp nodejs-working-app.zip s3://$S3_BUCKET/nodejs-working-app.zip
aws s3 cp nodejs-broken-app.zip s3://$S3_BUCKET/nodejs-broken-app.zip

Create the Elastic Beanstalk application and the working version:

aws elasticbeanstalk create-application \
--application-name deployments-tab-demo \
--description "Deployments tab walkthrough" \
--region us-east-1

aws elasticbeanstalk create-application-version \
--application-name deployments-tab-demo \
--version-label v1-working \
--source-bundle S3Bucket="$S3_BUCKET",S3Key="nodejs-working-app.zip" \
--region us-east-1

Create the environment:

aws elasticbeanstalk create-environment \
--application-name deployments-tab-demo \
--environment-name deployments-tab-demo-env \
--solution-stack-name "$SOLUTION_STACK_NAME" \
--version-label v1-working \
--option-settings \
Namespace=aws:elasticbeanstalk:environment,OptionName=EnvironmentType,Value=SingleInstance \
Namespace=aws:autoscaling:launchconfiguration,OptionName=IamInstanceProfile,Value=aws-elasticbeanstalk-ec2-role \
--region us-east-1

Don’t wait for the environment to finish creating. Instead, open the Elastic Beanstalk console right away, navigate to your environment, and choose the Deployments tab.

You should see one deployment in the history table with a status of In Progress and a type of Environment Creation. The table also shows the request ID, start time, and duration (which updates as the deployment runs). Choose the Request ID link to open the deployment detail page.

Elastic Beanstalk environment overview page showing the new Deployments tab selected, with a Deployment history table listing one in-progress Environment Creation deployment.

Figure 1 – Deployments tab history table showing the in-progress Environment Creation deployment

The detail page has a summary section with the deployment metadata and two tabs below it:

  • Events shows a filtered timeline of events for this deployment. As the environment creation progresses, new events appear automatically.
  • Deployment Logs shows the consolidated deployment log from the instance.

Select the Deployment Logs tab. At first, the tab may show a message indicating that the log is not yet available. This is expected. The deployment log is written on the EC2 instance and uploaded to Amazon S3, so it won’t appear until the instance launches and begins the deployment process. Once the instance is running, log entries start appearing and the tab refreshes automatically to show new entries as they are written. You can watch dependency installation, platform hooks, and application startup happen in real time.

Deployment details page showing a Deployment summary card (Request ID, Status: In progress, Type: Environment Creation) with the Deployment Logs tab selected and a "Waiting for logs..." placeholder.

Figure 2 – Deployment Logs tab showing “log not yet available” message during early environment creation

After the environment creation completes, the deployment status changes to Succeeded and the log shows the final state. Because this deployment succeeded, the log contains only summary messages for each step. Take notice of how the log captures each phase of the deployment in order: .ebextensions commands, dependency installation (npm), container commands, and then the application startup. Pay attention to the Application Output section near the end of the log. It shows the initial stdout from your application process, confirming that it started and is listening on the expected port. This section is useful for verifying that your application launched correctly after a deployment.

You can also check the environment status from the CLI:

aws elasticbeanstalk describe-environments \
--environment-names deployments-tab-demo-env \
--query 'Environments[0].{Status:Status,Health:Health}' \
--region us-east-1
Successful deployment details page with green "Environment successfully launched" banner, Deployment summary showing Status: Succeeded, and the Deployment Logs tab displaying streamed eb-engine and eb-hooks log entries.

Figure 3 – Deployment detail page showing the completed Deployment Logs tab with successful log output

Step 2: Trigger a configuration update

To see how different deployment types appear in the Deployments tab, add an environment variable to your environment:

aws elasticbeanstalk update-environment \
--environment-name deployments-tab-demo-env \
--option-settings \
Namespace=aws:elasticbeanstalk:application:environment,OptionName=APP_ENV,Value=production \
--region us-east-1

While the update is in progress, go back to the Deployments tab in the console. You should see a second deployment appear in the history with a status of In Progress and a type of Environment Update. Choose the request ID to open the detail page, and select the Deployment Logs tab. The log updates automatically as new entries are written, so you can watch the deployment progress in real time.

After the update completes, the deployment status changes to Succeeded. You now have two deployments in your history, each with its own type and duration.

Elastic Beanstalk environment page after a successful configuration update, showing Health: Ok and a Deployment history table with two Succeeded entries: a Configuration Update and an Environment Creation.

Figure 4 – Deployments tab showing two deployments: Environment Creation and Environment Update

Step 3: Deploy a broken application

This is where the Deployments tab shows its value. Create and deploy a broken application version that references a non-existent npm package:

aws elasticbeanstalk create-application-version \
--application-name deployments-tab-demo \
--version-label v2-broken \
--source-bundle S3Bucket="$S3_BUCKET",S3Key="nodejs-broken-app.zip" \
--region us-east-1

aws elasticbeanstalk update-environment \
--environment-name deployments-tab-demo-env \
--version-label v2-broken \
--region us-east-1

As soon as the deployment starts, go back to the Deployments tab in the console. You should see a new Application Deployment with a status of In Progress. Choose the request ID to open the deployment detail page and select the Deployment Logs tab.

Watch as the log streams in real time. You will see the deployment start, .ebextensions commands run, and then npm install begin. Shortly after, the error appears with the relevant output from the failed step, showing the exact npm error indicating that the package could not be found. The deployment status changes to Failed.

Elastic Beanstalk automatically rolls back to the previous working version, so your environment returns to a healthy state. Without the Deployments tab, diagnosing what went wrong would still require requesting a log bundle, downloading it, extracting it, and searching through the log files. With the Deployments tab, the diagnosis is immediate. There is no need to connect to the instance via SSH or download log bundles. The error is right there in the console.

Deployment details page for a failed Application Deployment, showing Status: Failed in the summary and Deployment Logs containing yum package errors ("No package eb-noti-abc123-1.0.0 available").

Figure 5 – Deployment detail page showing the failed deployment error and npm install output

Compare this to the successful deployment logs from Step 1. The successful log showed only summary messages. The failed log automatically includes the detailed error output. This smart verbosity means you don’t have to search through verbose logs on success, but you get the detail you need on failure.

Step 4: Deploy a fixed version

Although Elastic Beanstalk rolled back to the working version automatically, let’s deploy it explicitly to see what a successful application deployment log looks like after a failure:

aws elasticbeanstalk update-environment \
--environment-name deployments-tab-demo-env \
--version-label v1-working \
--region us-east-1

After the deployment completes, open the deployment detail page from the Deployments tab. The deployment log shows only summary messages for each step. The npm step completes without errors, the application starts, and the deployment finishes. Compare this to the failed deployment log from Step 3, where the error and detailed npm output appeared automatically.

Elastic Beanstalk environment Deployments tab showing a Deployment history of four entries — two Application Deployments (one Succeeded, one Failed), one Configuration Update, and one Environment Creation.

Figure 6 – Deployments tab showing all four deployments with their statuses

Cleaning up

To avoid ongoing charges, terminate the environment and delete the associated resources.

Terminate the environment:

aws elasticbeanstalk terminate-environment \
--environment-name deployments-tab-demo-env \
--region us-east-1

Delete the application (after the environment is terminated):

aws elasticbeanstalk delete-application \
--application-name deployments-tab-demo \
--terminate-env-by-force \
--region us-east-1

Delete the S3 bucket used for source bundles:

aws s3 rb s3://$S3_BUCKET --force --region us-east-1

Remove the local project directory. Before running the following command, make sure your current working directory is not inside deployments-tab-demo:

rm -rf deployments-tab-demo

Conclusion

The Deployments tab in AWS Elastic Beanstalk gives you a single place to view your deployment history and read deployment logs, including while a deployment is still running. When a deployment fails, the log shows you the error output from the failed step directly in the console, so you can identify the root cause without connecting to instances over SSH or downloading log bundles.

Deployment logs are available on Amazon Linux 2 and Amazon Linux 2023 platform versions released on or after March 11, 2026, and on Windows Server platform versions 2.23.0 and later, in all AWS Commercial Regions and AWS GovCloud (US) Regions. To get started, update your environment to a supported platform version and navigate to the Deployments tab in the Elastic Beanstalk console.

To learn more about deployment logs, see Viewing deployment logs in the AWS Elastic Beanstalk Developer Guide. For more information about AWS Elastic Beanstalk, visit the product page.

Ben Lazar

Ben Lazar is a Software Development Engineer II at Amazon Web Services (AWS) on the Elastic Beanstalk team. He maintains the Elastic Beanstalk platforms that customers use to run their web applications.

Security updates for Thursday

Post Syndicated from jzb original https://lwn.net/Articles/1076364/

Security updates have been issued by AlmaLinux (.NET 10.0, compat-openssl10, compat-openssl11, delve, expat, httpd:2.4, libexif, mod_http2, openssl, ruby4.0, samba, thunderbird, unbound, and vim), Debian (ceph and sudo), Fedora (libsoup3, pie, roundcubemail, and xorg-x11-server-Xwayland), Mageia (lxc), Oracle (expat, gnutls, kernel, php:8.2, thunderbird, and uek-kernel), Slackware (httpd, net, proftpd, tigervnc, and xorg), SUSE (apache-sshd, apptainer, atril, bind, busybox, cloudflared, evolution-data-server, golang-github-prometheus-prometheus, golang-github-v2fly-v2ray-core, grafana, helm, kernel, libgphoto2-6, libjxl-devel, libsoup, libsoup-2_4-1, libsoup-3_0-0, memcached, ovmf, python-cairosvg, python-flask, python-pip, python-pymupdf, python-pyOpenSSL, python-urllib3, python-urllib3_1, python3-pyOpenSSL, restic, rsync, salt, sdbootutil, tor, tree-sitter, vorbis-tools, and yq), and Ubuntu (exim4, frr, gst-plugins-base1.0, libtemplate-perl, libwww-perl, mysql-8.0, nginx, python-pip, python-urllib3, and twisted).

VoidZero is joining Cloudflare

Post Syndicated from Evan You original https://blog.cloudflare.com/voidzero-joins-cloudflare/

VoidZero, the company behind Vite, Vitest, Rolldown, Oxc, and Vite+, is joining Cloudflare. As part of this change, all team members of VoidZero are joining Cloudflare, too.

Before saying anything else, we want to make the most important thing clear: Vite, Vitest, Rolldown, Oxc, and Vite+ will stay open source, vendor-agnostic, and community-driven. Nothing about that changes.

Cloudflare’s mission is to help build a better Internet. And a better Internet is an open Internet. Developers need choice, frameworks need a neutral foundation, and applications need to be portable. It is not reasonable to expect the entire web ecosystem to build around a single vendor. The most important tools and frameworks are portable by design.

Vite is one of the few foundational tools that the whole JavaScript ecosystem agrees on. It earned that position by being fast, excellent, portable, and vendor-neutral. One of the best ways Cloudflare can help build a better Internet is by investing in that foundational open source toolchain. A toolchain that makes the Internet better for everyone, not just people who use Cloudflare or choose to host with us.

Over the last few years we’ve invested heavily in making Cloudflare the best place to build and run websites, applications, and agents on our developer platform. But ultimately that choice will always be yours. Run your Vite application anywhere you want.

What this means for Vite

Today’s news gives Vite more resources to keep growing, while the things that make Vite what it is remain the same:

  • Vite remains MIT-licensed and open source.

  • Vite remains vendor-agnostic. Applications built with Vite run anywhere and will continue to do so.

  • Vite’s roadmap continues to be driven by the broader Vite team and community, and continues to be developed in the open.

  • Evan and the rest of the VoidZero team continue to lead Vite, Vitest, Rolldown, Oxc, and Vite+.

  • Cloudflare is committing engineering and resources to those projects, not redirecting them.

We made the same kind of commitment when Astro joined Cloudflare earlier this year. Astro is still open source, and still deploys anywhere. The team is still shipping the roadmap they were already shipping.

This commitment matters even more with Vite, because Vite is not one framework. Vite is the foundation underlying so many: Vue, SvelteKit, Nuxt, Astro, Solid, Qwik, Angular, React Router, TanStack Start. Even Next.js now has a Vite-based implementation in vinext. Vite has become a shared substrate for the JavaScript ecosystem. 

Our number one goal is to maintain the trust that has earned Vite so much adoption. Not with our words here, but by proving it every day in how we support and develop these projects.

We also want to put our money where our mouth is when it comes to our support for open source and shared ecosystem foundations. As part of this announcement, Cloudflare is committing $1 million to a Vite ecosystem fund to support maintainers and contributors, administered by the Vite core team. Vite is bigger than VoidZero or Cloudflare, and the people who have helped build it should be part of what comes next.

Vite as the foundation

The Vite and Cloudflare teams have been collaborating well before this announcement, starting in 2024 with the Vite Environment API. The Environment API lets Vite run server code in something other than Node.js during development. We worked closely with the Vite team on its design, and then built the Cloudflare Vite plugin on top of it.

When you run vite dev with the Cloudflare plugin, your server code runs inside workerd, the same open-source runtime that powers Workers in production. Durable Objects, D1, KV, R2, Workflows, Workers AI, Agents, Service Bindings, Workers RPC – all of it runs locally inside the same runtime model as production.

For a long time, the cost of developing on a non-Node runtime was that local dev felt like a worse version of production. The Environment API removed that cost without forcing anyone to adopt a Cloudflare-specific dev server. Any runtime that wants to plug into Vite can do the same thing. That kind of design – a generic mechanism in Vite with provider-specific implementations – has proven to work well and is one we want to keep building on.

We knew we were on to something when we saw adoption of the Cloudflare Vite plugin take off:


Vite’s adoption curve is one of the more remarkable things to watch in the ecosystem right now. As of this writing, Vite is at roughly 129M weekly downloads. The Cloudflare Vite plugin (@cloudflare/vite-plugin) is at almost 14M weekly downloads.

If you had told us a year ago that a Cloudflare Vite plugin would reach downloads equivalent to more than 10% of Vite itself, we wouldn’t have believed you. What happened? AI happened. More software is being created than ever before, and a lot of it starts with AI-generated code. Those applications need a default stack and a place to run. Agent-coded applications are choosing Vite, and increasingly they are choosing Vite running on Cloudflare.

AI is changing how we write software

Developers used to be the only users of dev servers, bundlers, linters, formatters, and CLIs. That is no longer true: agents are using them too, constantly. They scaffold projects, run dev servers, read errors, write tests, lint and format code, deploy previews, and iterate.

A lot of AI-generated applications already start as Vite apps, because Vite is fast, well understood, and broadly compatible with what agents have seen in their training data. Fast feedback loops have always been important. They become even more critical when writing software with agents:

  • Fast builds, because they iterate more than humans do.

  • Fast tests, because they re-run the suite constantly to verify their own work.

  • Fast linting and formatting, because those tools become guardrails.

  • Clear, structured errors, because the agent has to read and act on them.

  • Consistent CLIs, because small inconsistencies cause big detours.

The entire VoidZero toolchain is built for this kind of loop. Vitest, Rolldown, Oxc, Oxlint, and Oxfmt are each among the fastest tools in their respective categories, and they work well when they are run over and over by an agent. Vite+ brings those pieces together into one toolchain, with one CLI, one configuration model, and fewer moving parts. That makes the development loop easier for people to understand, and easier for agents to drive reliably.

We are dogfooding this ourselves. The Cloudflare dashboard is built on Vite. Oxlint is already saving days of engineering time in Cloudflare codebases. Flue, the agent harness framework from the Astro team, is also moving onto Vite as its foundation. Flue can run agents on Node.js, Cloudflare Workers, GitHub Actions, GitLab CI/CD, and more, and the Cloudflare target now uses the official Cloudflare Vite plugin and workerd integration. Vite is becoming the default application foundation inside Cloudflare too.

Vite is becoming full-stack

A few years ago, the job of a build tool was straightforward: take source files, produce a bundle, hand it off. That is not enough for modern applications, especially in a world where some of those applications are agents themselves.

A modern application is server-rendered routes, APIs, background jobs, queues, databases, object storage, real-time, auth, plus a growing list of agents and AI capabilities. The “build” is no longer the end of the story. It is the start of a deployment that has to understand all of those pieces.

That means Vite has to become more than a build tool. It needs to understand more of the application, while staying true to what made Vite work in the first place: speed, simplicity, and portability.

Void, a deployment platform designed for Vite, has been another testbed for these ideas. It helped explore what a modern application framework should own, what deployment should feel like, and how much of the full application lifecycle can be unified around one toolchain. We have learned a lot from that work.

Now the work is putting those lessons in the right place. Some belong in Vite itself as provider-agnostic primitives: first-class abstractions and hooks for backends, APIs, agents, and deployment that any provider can implement. Other lessons belong inside Cloudflare. Cloudflare will provide a first-class implementation of those hooks on Workers and the rest of our Developer Platform.

Even though some Vite maintainers are joining Cloudflare, changes to Vite itself will continue to go through the same open contribution process as any other Vite contribution. Features added to Vite itself should not be Cloudflare-specific. They will work anywhere Vite works.

Moving Cloudflare toward Vite

The same principle shaped how we think about the future of Cloudflare’s own tooling. We are not moving Vite in the direction of Cloudflare. We are doing the opposite: moving Cloudflare’s application tooling onto Vite, so it is built on top of the same workflows developers already know.

We recently shipped a technical preview of cf, a new unified CLI for the whole Cloudflare platform. Vite is going to be the foundation of our CLI experience for applications. The end goal is one consistent CLI for all of Cloudflare, with the same ergonomics whether you are working on Workers, R2, D1, Agents, or anything else.

If we do this right, the Cloudflare CLI should feel like Vite, not like a separate thing bolted on next to Vite.

  • cf dev should be a superset of vite dev. Same speed, same hot module replacement, same plugin model, plus the Cloudflare runtime and bindings when you want them.

  • cf build should understand Vite projects natively, without an adapter dance.

  • cf deploy should make deploying a Vite app to Cloudflare simple.

If you are running Vite today, the path to Cloudflare will feel like swapping in a superset of the commands you already know. Same project shape. Same Vite workflows. The entire Cloudflare developer platform available when you want it.

What happens next

In the short term, nothing changes for Vite users or the frameworks building on top of Vite:

  • Vite, Vitest, Rolldown, Oxc, and Vite+ keep shipping. The VoidZero team keeps contributing and leading them.

  • The Cloudflare Vite plugin keeps improving.

  • The Environment API and the broader story of “run your server code in the right runtime locally” keeps getting better, including for non-Cloudflare runtimes.

Longer term:

  • We start the work on moving the Cloudflare CLI toward an experience built directly on top of Vite.

  • Vite will get new, clean, provider-agnostic primitives for full-stack apps and agents that work for everyone on any platform.

  • Over time, we intend to open-source the Void platform, so others can learn from it and build their own platforms on top of Vite and Cloudflare.

We will do all of this in public and with the community. The same way Vite has always been built.

Welcome VoidZero

Vite, Vitest, Rolldown, Oxc, and Vite+ exist because a deep ecosystem of open source contributors put years of work into them. These projects are already foundational to how the web is built, and we are grateful to everyone who helped get them here. Thank you to everyone who has contributed code, reviews, issues, docs, plugins, integrations, and support along the way.

We are excited to welcome the VoidZero team to Cloudflare, and excited to put more resources behind these projects. Our job now is to help them grow, stay open, and power the JavaScript ecosystem for everyone.

Vite keeps being Vite. Cloudflare gets to help.

If you want to try Vite on Cloudflare today, run:

  • npm create vite@latest

  • npx wrangler deploy

Hacking Meta’s AI Chatbot

Post Syndicated from Bruce Schneier original https://www.schneier.com/blog/archives/2026/06/hacking-metas-ai-chatbot.html

Hackers are convincing Meta’s AI support chatbot to let them take over other peoples’ accounts:

A video posted on X showed the step-by-step process to hack someone’s Instagram account. The hacker allegedly used a VPN to spoof the targets’ presumed location to avoid triggering Instagram’s automated account protections. Then, the hacker opened a chat with Meta AI Support Assistant and asked the bot to add a new email address to the target’s account. The chatbot can be seen sending a verification code to the email address provided by the hacker; the hacker then shares the verification code with the chatbot, which prompts the chatbot to show a button to “Reset Password.” The hacker enters a new password and takes over the victim’s account.

[…]

On Monday, Instagram spokesperson Andy Stone said in a reply to Wong’s post and others that the issue was now fixed. It’s unclear how many Instagram users had their accounts improperly accessed.

It’s not that easy. Probably this particular tactic is now blocked. But there are others, many others, and they cannot be blocked as a class. The real problem is that LLM chatbots are not trustworthy enough for this application.

Another news article.

Gen Z и промените в климата. Защо младите хора са все по-ангажирани със зелените политики

Post Syndicated from original https://www.toest.bg/gen-z-i-promenite-v-klimata-zashcho-mladite-hora-sa-vse-po-angazhirani-sus-zelenite-politiki/

Gen Z и промените в климата. Защо младите хора са все по-ангажирани със зелените политики

Преди няколко години в час по география учителката ни спомена, че до 2050 г. питейната вода на планетата ще свърши. За мен обаче 2050 г. не е далечното бъдеще, а година, в която няма да съм навършила 50. И за съжаление, информацията си е съвсем вярна – според доклад на ООН от 2026 г. планетата вече е навлязла в „ерата на воден недостиг“, а засегнатите са милиарди. 

Оказва се обаче, че не съм единствената представителка на Gen Z, а и не само на това поколение, която изпитва тревожност за бъдещето заради климатичните промени. Проучване на климатичната тревожност сред младежите и доверието в институциите от 2021 г., проведено в 10 държави с 10 000 респонденти на възраст 16–25 г., установява, че почти 60% от тях са „много“ или „изключително притеснени“ за климата. Дотолкова, че се появява нов термин за този вид проблем –

екотревожност.

Климатичната тревожност е нов психичен проблем, който описва „хроничния страх от екологична катастрофа“, казва пред „Тоест“ д-р Зорница Спасова, главен асистент в Националния център по обществено здраве и анализи и авторка в „Климатека“. Ефектите от климатичните проблеми върху психичното здраве могат да бъдат директни и косвени. Директните са свързани с екстремни метеорологични явления, причиняващи щети и загуби, и това може да доведе до посттравматично стресово разстройство, депресия и тревожност. Високите температури пък водят до промени в настроението, увеличаване на агресивното поведение и престъпността. Д-р Спасова посочва също, че е открита връзка между повишаващите се температури, от една страна, и риска от самоубийства и приема в психиатрични болници, от друга.

Косвените въздействия са свързани с общността и нарушаването на чувството за принадлежност, загубата на природни местообитания и културно наследство. Тревожността от сегашните и очакваните климатични промени, която най-често засяга младите, се проявява под формата на екоемоции – соласталгия (тъга по разрушено/изгубено природно място), екотревожност и екопарализа (чувство за безпомощност пред климатичните промени). 

Климатичните промени засягат правото на живот, здраве, чиста храна и вода, безопасен дом, включително на бъдещите поколения, подчертава д-р Спасова. Появява се чувство за несправедливост, тъй като младите почти не са допринесли за състоянието на планетата, но именно те ще платят цената, казва тя и допълва: 

Това превръща екологията в кауза за социална справедливост, което винаги в историята е било мощен двигател за младежките движения.

В София обаче климатичните активисти имат пространство, където могат да се събират. 

„Магнит“

е създаден през 2019 г. от „Грийнпийс“ – България. Пространството е вдъхновено от нуждите на глобалното климатично движение Fridays for Future и привлича екоактивисти и организации от цялата страна, които получават възможност да организират безплатни събития и да изградят общност. През 2024 г. „Магнит“ започва да разширява дейността си и да функционира все повече като младежки хъб, отворен за разнообразни събития с цел да насърчи по-голяма активност сред младите граждани, да вдъхновява за екологични действия и да събира хора с различни интереси. През 2025 г. пространството се присъединява към Planet One – мрежа от екологични младежки пространства. Към момента има три такива пространства в Африка и пет в Европа, сред които са Bolygo в Унгария и Momentum в Швеция, с които „Магнит“ организира международен и европейски фестивал – Make Something Week. Той ще се проведе в седмицата на Черния петък и ще предложи различни общностни събития за преизползване и „по-бавен“ живот като алтернатива на консуматорството. 

Най-редовно провеждането събитие в „Магнит“ е „Въртидрешка“, разказа за „Тоест“ 21-годишната Божана Славкова, която е настоящата управителка на пространството. На проявата винаги идват около 60 души, за да разменят свои дрехи, които няма да носят повече, но са достатъчно запазени, за да бъдат използвани от някой друг. През май в програмата на „Магнит“ са включени събития за линопечат и създаване на багрилна градина – засяване на растения, които могат да бъдат естествени оцветители. Организират се и работилници за направа на изделия от глина, преизползване на дрехи, бродиране и провеждане на вечери за настолни игри и прожекции на филми. Не цялата програма е свързана изрично с климата – рисуват се например плакати в подкрепа на Палестина. 

В „Магнит“ може да се организират безплатни събития след изпращане на заявка по имейл. Правилата за провеждане, както и свободните дати са публикувани на официалните страници в Instagram и Facebook. Важно е събитието да съвпада с ценностите на „Магнит“. 

За Божана Славкова 

промените в климата не са далечна тема.

Първият ѝ досег с доброволчеството е, когато е 11–12-годишна и майка ѝ я завежда на борда на кораба на „Грийнпийс“. Там се среща с хора от цял свят, обединени от каузата за опазване на околната среда. Оттогава постепенно започва да се интересува повече от темите за човешки права и екология, а това прераства в участие в протести и реализирана арт инсталация с името „Прегърната природа“.

Вече виждаме как сезоните се смесват един с друг и изчезват, как [през] лятото едва може да живеем в жегата, как зимата става също по-засилена. […] Виждаме как водата свършва, […] едновременно с това има наводнения, от които хора си губят жилищата и живота. И това не са далечни неща, те са буквално тук, 

казва Славкова и допълва, че хората покрай нея също са тревожни, дори тези, които не би очаквала да се чувстват така. Наблюденията ѝ са, че поколението алфа е дори по-тревожно по отношение на климата.

Славкова иска да вижда повече политики, насочени към намаляване на зависимостите от тецовете и насърчаване на използването на възобновяеми източници, улесняване на процедурата по поставяне на соларни панели в жилищата и използване на пространствата в града за генериране на енергия – например поставяне на соларни панели върху покривите на сгради, както и 

малко повече да си сътрудничим за природата и с нашите съседки […], защото реално въздухът и водата не ги спират тези граници, които хората сме си измислили. 

Цената на природните бедствия

не е задължително финансова. Д-р Спасова посочва, че горещите вълни ни карат да изместим някои задачи за сутрешните часове, когато е все още хладно. Ставаме зависими от климатиците си, които вече надуват сметките ни за ток през лятото почти колкото през зимата. Излизаме по-малко от къщи, което ограничава социалните ни контакти, и спим по-лошо заради жегата. Някои хранителни култури все по-трудно се отглеждат в летните жеги, съответно ще станат по-редки и по-скъпи в бъдеще и ние ще трябва да променяме и хранителните си навици.

Вече говорихме за психичното здраве, но промените в климата могат да изострят и съществуващи физически медицински състояния или да ускорят разпространението на болести. Според Световната здравна организация (СЗО) между 2030 и 2050 г. около 250 000 души годишно ще загиват от малария, недохранване, диария и топлинни вълни. Най-засегнати са жителите на островни и развиващи се държави, особено децата, които са най-уязвими на замърсяването на водите и въздуха, топлинните вълни, миграцията, болестите и глада, предизвикан от затрудненията в производството на храна. Данни на СЗО от 2017 г. сочат, че заради замърсена околна среда всяка година умират 1,7 млн. деца в световен мащаб.

Колко е платило едно министерство за една година

На въпросите на „Тоест“ какъв е броят на пострадалите от природни бедствия през 2025 г. и какъв е размерът на изплатените помощи, от Министерството на труда и социалната политика отговориха, че за 2025 г. Агенцията за социално подпомагане (АСП) е отпуснала 148 еднократни помощи в размер на 252 444 лв. (около 129 000 евро) на пострадали от бедствия лица и семейства. Тази помощ може да бъде отпусната веднъж в годината, а максималната сума е трикратният размер на линията на бедност през 2025 г., което се равнява на 1914 лв.

С решение на Министерския съвет са изплатени 45 помощи на обща стойност 135 000 лв. като еднократна подкрепа за хора и семейства, чието „единствено и законно“ жилище е пострадало. Това определение изключва живеещите в неузаконени къщи, каквито има преобладаващо в ромските квартали. Домакинствата могат да бъдат подкрепени и с до 2500 лв. от Фонд „Социална закрила“, ако имат нужда да купят ново оборудване и обзавеждане за дома си. От помощта са се възползвали 31 домакинства, които са получили общо 78 545 лв. Наследниците на всеки от тримата загинали при наводненията в област Бургас са получили по 15 000 лв. еднократна помощ.

След като настъпи природно бедствие, служители от АСП отиват на място в засегнатите селища и предоставят на пострадалите информация за възможностите за подкрепа. През 2025 г. в Агенцията са събрали данни за 948 семейства, пострадали от природни бедствия, а за цялата година са изплатени 432 444 лв.

Като част от Националната програма за обучение и заетост на продължително безработни лица са наети 3053 души за работа в аварийни групи, които да помогнат за преодоляването на последствията от пожарите, както и за предотвратяване на бъдещи щети. По тази програма са изразходвани 13 154 911 лв.

Въпреки финансовите и психическите последици от климатичните промени все още съществува 

екоскептицизъм. 

Според д-р Спасова видимите изменения са само „върхът на айсберга“, а съмненията в тях предоставят „интелектуално“ оправдание за човешката немарливост. „Когато не вярваш, че екосистемата е крехка, спираш да я пазиш, което неизбежно води до криза при първото по-сериозно природно явление“, добави тя.

За Божана Славкова обаче причината се корени в политически и икономически интереси: 

Аз си мисля обаче, че ни лъжат, че са екоскептици, защото до голяма степен наистина е трудно вече да не вярваш. […] Всичко ти го показва – не е само науката, но и така го усещаме в живота си. […] Така че този екоскептицизъм за мен е една много грозна игра, която просто обслужва корпоративния интерес и тецовете най-често.

Съвместими ли са промените в климата, младежта и политиката?

През 2021 г. група активни граждани започват да се интересуват от дискусиите около общия устройствен план на община Царево и застрояването на местността Поляните в с. Синеморец. Сред тях има и млади хора, които често прекарват летата в селото. Активистите слагат началото на гражданската инициатива „Спаси Синеморец“. Те създават кратък късометражен филм – „Гласовете на Синеморец“, в който призовават министъра на околната среда и водите (тогава Асен Личев от първото служебно правителство на Стефан Янев) да спре застрояването в защитената местност, внасят и подписка. 

Според Ремина Алексиева, която е активна участничка в дебатите, проблемът е по-сложен. Със съмишлениците ѝ наивно са очаквали той да бъде решен само с помощта на подписката и филмчето, сподели тя за „Тоест“. 

Въпреки това няколко души решават да разберат дали могат да се предприемат правни мерки за спиране на строежите. Именно от тяхната упоритост се ражда 

сдружение „Спаси Странджа“

За последните няколко години организацията се стреми да провокира диалог по темата за устойчивото развитие, да организира обучения за активни граждани, да развива застъпническа дейност. Тя реализира и втория си късометражен филм – „С бетон на море“. Подготвя и наръчник на младия застъпник, в който ще бъде включена информацията от досега проведените обучения, а също така и съвети къде и как можем да подадем сигнал за нередност. 

Днес Ремина Алексиева е част от Управителния съвет на сдружението. Макар да не е родом от Синеморец, мястото за нея е специално и затова тя решава да бъде активна по отношение на опазването на Природен парк „Странджа“: 

И си казах: абе, дай да взема някакво решение – или ще съм от тия хора, които само хейтят и нищо не правят, или поне, като имаш такова мнение, направи нещо по въпроса. И имах такова вътрешно решение да правя нещо по въпроса. […] За мен това си остава някаква пътеводна мисъл. 

Според нея на регионално ниво е важно да се мотивира местната общност да бъде активна, тъй като тя е много по-уязвима и затворена, което създава възможност за злоупотреби. Особеностите при работата на местно равнище се оказват свързани с управлението и на национално.

Климатична справедливост

Южното Черноморие е популярна туристическа дестинация. Свръхзастрояването му обаче може да доведе до замърсяване на водите или до наводнения. Според Ремина Алексиева „това не са някакви изолирани случаи“ и е нужно да се намери баланс между застрояването и природата. Но и да научим институциите да имат отношение към климатичната справедливост и да включат младите в процесите на вземане на решения. Ала това още не е факт:

Решенията, които се вземат в момента, са мимолетни, през призмата на едно определено мислене, което, за съжаление, за мен не отразява правата на следващите поколения. 

Д-р Спасова обаче е оптимистична за адаптацията към новия климат: 

Смятам, че нашата страна предлага ресурси, с които населението би могло да оцелее и при най-неблагоприятния сценарий на климатичната криза.

Измененията на климата вече се виждат и влияят на ежедневието ни. 

Опазването на околната среда не се появява с моето поколение, но все още не е приоритет. За връстниците ми е важно планетата да не се разпадне, докато сме в активна възраст. И да можем да оставим и ние нещо на следващите поколения. Политическият и отчасти общественият дебат по темата обаче са силно популистки и не се взема предвид дългосрочното влияние от климатичната политика. Като представителка на Gen Z съм силно обезпокоена за бъдещето по отношение на климатичните промени. Иска ми се да мога да видя инициатива от политиците ни за смислена промяна, но по-скоро наблюдавам, че за пореден път политиките за младите се изработват без наше участие. 

По буквите: Шурбанов, Тодоров

Post Syndicated from Зорница Христова original https://www.toest.bg/po-bukvite-shurbanov-todorov/

„Записано“ от Александър Шурбанов

По буквите: Шурбанов, Тодоров

София: изд. „Лист“, 2026

„Тиха логика“ от Светослав Тодоров

София: изд. „Кота 0“, 2026

Ето, затварям книгата, протягам ръка да изключа нощната лампа – и обилната светлина, която до този момент обливаше леглото ми, внезапно се заменя с непроницаем мрак. В природата никога не става така.

Показалецът премина през новините, докато тялото ѝ още беше в леглото. Ракета. Движеше се все по-бързо по екрана. Земя. После застиваше като кука, която едва издържа захвърлените към нея мръсни дрехи. Шум. Кокалестият пръст се огъваше така, че не само да продължи четенето, но и да посочи виновник. Жертви.

Можете ли да познаете кой текст от какъв човек е писан? Млад, стар, мъж, жена?

Има ли значение? Трябва ли да има значение?

Една от най-красивите литературоведски утопии е идеята за „близкото четене“ на Айвър Ричардс и американските „нови критици“. Беше въведена у нас от проф. Никола Георгиев и звучеше изключително изкусително за всички, на които ни беше писнало да слушаме за биографиите на поетите, техните революционни заслуги, работническо-селски произход или любовни драми. В класическия учебник биографията изместваше литературата – колко хубаво беше да я заскобим и да гледаме само текста! И тогава да видим кой колко може да пише. И кой колко може да чете.

Да, ама не. Съвсем скоро литературният пазар ни натри носовете. Текст без автор може да получиш за анализ на изпит, но няма да го видиш отпечатан в книжарница. Името на автора продава (че и снимката на корицата). Името на автора строява книгата на определена лавица в книжарницата (това по-късно, защото книжарниците поизчезнаха по едно време). Би било любопитно някой историк да разгледа извънлитературните стратегии за участие в литературния живот – например как четворката от „Литературен вестник“ се снима в позите на друга известна четворка (кръга „Мисъл“), за да бъде на свой ред повторена в трета конфигурация от четирима автори мъже (този път издателство „Кота 0“). Или пък как, кога и защо публиките на различните литературни поколения остават разделени?

Наскоро участвах в дискусия за литературната общност… без да се усетя, че общността, за която ставаше дума, беше с десет години по-млада от мен. Още по-любопитно беше, че в същата дискусия се спомена трета, още по-млада литературна общност, непозната за присъстващите и самодостатъчна. Интересният за мен въпрос е дали това разслояване на публиките се разпознава и в писането?

Нека опитам в сравнението между два текста в сходен жанр: „Записано“ на проф. Александър Шурбанов и „Тиха логика“ на Светослав Тодоров си приличат донякъде по жанра – и двете се състоят от фрагменти.

Фрагментите са може би най-свободният жанр – най-близо до ума на автора, еклектична поредица от мисли и идеи.

В едната от тези книги думи като „гений“ се използват свободно и уверено. В другата – не. В едната от тези книги авторът неведнъж заема женската позиция, гледната точка на застаряваща жена – и звучи убедително, поне докато не усложни играта с жена, която си представя мъжкия поглед. В другата книга такова колебание не съществува. Едната книга излъчва сигурност дори когато задава въпроси. Излъчва увереността на човека, който може да стои наспроти времето и да пита: за природата и цивилизацията, за духа. Другата книга е най-жива в несигурността. В непознаването дори на себе си, на образа в огледалото (един път отместен във възрастта, втори път – в пола). Едната книга, както казаха на премиерата ѝ двама бележити връстници на автора, принадлежи на всички времена, на Ренесанса например. Другата е съвсем днешна и тукашна; тя следи с пръст новините, както героинята на един фрагмент ги следи с пръст, копнеещ да посочи виновник. Но не го прави. Първата книга би го назовала със спокойна дързост.

Поколенчески ли са тези разлики? И ако да, на възрастта ли се дължат – или на конкретния опит на различните поколения? Ако е второто, какво в опита на едно поколение може да го възпре да разсъждава с размах и категоричност? А може би двете книги са съвсем различни и опитът ми да сравнявам като „фрагменти“ е неправилен.

Преводачът на „Изповеди“ на Джон Дън, на Чосър и Шекспир се занимава с микро- и макрокосмоса, с мирозданието и нашето място в него и във времената.

По буквите: Шурбанов, Тодоров

Тази книга е „фрагментарна“ именно заради мащаба на своето начинание – може да го направи само като мрежа от идеи, които читателят свързва мислено, като съзвездия.

„Тиха логика“ пък е повече свързана с фикционалния инстинкт, с доизмислянето на мига и на неговите отражения в огледалото.

По буквите: Шурбанов, Тодоров

Но и фрагментарността е само формалният повод да ги събера в този текст – неформалният е въпросът за срещата между фрагментираните ни литературни общности, за възможната среща не само на публики, а и на смисли, за познанство не биографично (с каквото нашата среда изобилства), а именно книжно, между книгите. За „близко четене“, но не на отделния текст, а на разнородната ни и жива в своята разнородност книжнина.
Как иначе от нея да стане литература?


В емблематичната си колонка „Ходене по буквите“, започната още през 2008 г. във в-к „Култура“, Марин Бодаков ни представяше нови литературни заглавия и питаше с какво точно тези книги ни променят. В началото на 2020 г. той я пренесе в „Тоест“. Вярваме, че е важно тази рубрика да продължи. От човек до човек, с нова книга в ръка. От края на 2021 г. по буквите тръгна Зорница Христова.

Активните дарители на „Тоест“ получават 20% отстъпка от коричната цена на всички книги на над 15 български издателства. Кои са те – вижте в условията на Читателски клуб „Тоест“.

[$] LWN.net Weekly Edition for June 4, 2026

Post Syndicated from jzb original https://lwn.net/Articles/1074950/

Inside this week’s LWN.net Weekly Edition:

  • Front: MeshCore; x32 ABI; Open-source security; Package-manager metadata; More LSFMM+BPF coverage; Loadable crypto module.
  • Briefs: Lightwell; jqwik protestware; RedHat package compromise; DistroWatch; Fedora election; Rust 1.96.0; rsync; Vim Classic 8.3; Quotes; …
  • Announcements: Newsletters, conferences, security updates, patches, and more.

Qualcomm Announces Dragonfly Brand for Data Center Products, More Info to Come June 24th

Post Syndicated from Ryan Smith original https://www.servethehome.com/qualcomm-announces-dragonfly-brand-for-data-center-products/

Qualcomm this week has introduced its Dragonfly brand for its upcoming data center products. The brief teaser promised more details to come on June 24th, during Qualcomm’s 2026 Investor’s Day

The post Qualcomm Announces Dragonfly Brand for Data Center Products, More Info to Come June 24th appeared first on ServeTheHome.

Using Amazon Mail Manager SMTP to send email via Amazon Simple Email Service

Post Syndicated from Josephine Elea Schlage original https://aws.amazon.com/blogs/messaging-and-targeting/using-amazon-mail-manager-smtp-to-send-email-using-amazon-simple-email-service/

If you’re running applications or mail servers that need to send email over Simple Mail Transfer Protocol (SMTP), you may find that the classic Amazon Simple Email Service (Amazon SES) SMTP endpoint (email-smtp.<region>.amazonaws.com) is not available in every AWS Region.

This applies to some newer AWS Regions and partitions, including eusc-de-east-1 in the AWS European Sovereign Cloud (ESC). In these AWS Regions, services configured with a traditional SMTP hostname and credentials, such as Postfix relays, cannot use the classic SES SMTP integration pattern. Amazon SES Mail Manager provides an alternative: an authenticated SMTP ingress endpoint that accepts connections using a hostname, port, and credentials, just like any standard SMTP server.

In addition to SMTP connectivity, Mail Manager introduces a configurable email pipeline between acceptance and delivery. This pipeline gives you traffic filtering, message archiving, and rule-based routing that are not available with the classic SES SMTP endpoint.

In this post, you configure Amazon SES Mail Manager to send outbound email in a Region that does not offer the classic SES SMTP endpoint. This post uses eusc-de-east-1 (AWS European Sovereign Cloud) as an example, but the same steps apply to AWS Regions where Mail Manager is available and the classic SMTP endpoint is not. By the end, you have a working Mail Manager pipeline that can:

  • Control outbound email flow with traffic policies.
  • Archive outgoing messages for compliance.
  • Deliver messages to recipients through a managed SMTP pipeline.

This post walks through a practical setup in eusc-de-east-1 with step-by-step instructions for configuring each component.

Solution overview

In this walkthrough, you configure Amazon SES Mail Manager in eusc-de-east-1 with the following components:

  • Traffic policy: You create a traffic policy with a default action set to Deny. The policy includes two policy statements connected by an OR condition. Policy Statement 1 allows messages that use TLS protocol version 1.2 or higher. Policy Statement 2 allows messages where the recipient address ends with a specific domain, filtering outgoing mail to approved recipients only.
  • Rule set: You create a rule set containing a single rule with two actions that archive outgoing email and then deliver it to recipients.
  • Ingress endpoint: You create an authenticated Mail Manager ingress endpoint that receives, routes, and manages messages based on your configured traffic policy and rule set.

After setting up these components, you use sample Python code to send an email through the ingress endpoint. Optionally, you can integrate with Postfix for relay-based delivery. You also configure Amazon CloudWatch logging to monitor how each message flows through the pipeline. To verify functionality, you check the email archive to confirm that outgoing messages are stored and that the email is received in the intended inbox.

The following diagram shows the message flow: Application or Amazon Elastic Compute Cloud (Amazon EC2) instance → ingress endpoint → traffic policy (allow or deny) → rule set (archive, then send to internet) → recipient inbox.

Walkthrough

This walkthrough covers the prerequisites and the step-by-step setup. Before you create traffic policies and a rule set, you first set up email archiving and AWS Identity and Access Management (IAM) roles, which are needed when you create the traffic policies and rules.

Prerequisites

Before beginning, verify that you have completed domain verification in the eusc-de-east-1 (ESC) Region and moved out of the Amazon SES sandbox. Domain verification is a required first step that confirms your authority to send email through SES from your domain. In this tutorial, you use a sample Python program to send email programmatically through an ingress SMTP endpoint (ARecord). You can run this program on your local machine through the AWS Command Line Interface (AWS CLI).

  • An active AWS account in the AWS European Sovereign Cloud with access to the eusc-de-east-1 Region.
  • A domain to verify as a sending identity in Amazon SES.
  • The AWS CLI, installed and configured for eusc-de-east-1 (required for Amazon CloudWatch logging).
  • An AWS Secrets Manager secret to store ingress endpoint credentials.
  • (Optional) An Amazon Virtual Private Cloud (Amazon VPC) with at least two subnets and an Amazon EC2 instance, if you plan to configure VPC endpoint connectivity.
  • IAM permissions for Amazon SES, AWS Key Management Service (AWS KMS), AWS Secrets Manager, and CloudWatch for the user who is signed in to the AWS Management Console.

Step 1: Create and verify an identity

To create and verify a sending identity in Amazon SES:

  1. In the Amazon SES console, choose Configuration, and then select Identities.
  2. Create the identity (domain or email address). If you verify a domain identity, configure email authentication with Sender Policy Framework (SPF), DomainKeys Identified Mail (DKIM), and Domain-based Message Authentication and Reporting and Conformance (DMARC) to prevent email from being marked as spam or failing delivery. See the following guides:
    1. Authenticating Email with DKIM in Amazon SES.
    2. Authenticating Email with SPF in Amazon SES.
    3. Complying with DMARC authentication protocol in Amazon SES.

    If you verify an email address identity without also verifying the parent domain, your messages may be quarantined or rejected depending on the domain’s DMARC policy.

  3. Complete the verification process.

Note: For eusc-de-east-1, the Custom MAIL FROM Domain Name System (DNS) records use amazonses.eu instead of amazonses.com.

Step 2: Configure an email archive for compliance and retention

Create an email archive to store outgoing messages. You configure this archive as the first action in your rule. The archive serves as a repository for outgoing messages.

  1. In the Amazon SES console, choose Mail Manager, then Email Archiving.
  2. Under Manage archives, select Create archive.
    1. Enter a unique name in the Archive name field.
    2. (Optional) Select a retention period to override the default of 180 days (6 months).
    3. (Optional) Set up encryption by either entering your own AWS Key Management Service (AWS KMS) key in the AWS KMS key ARN field, or selecting Create new key.
  3. Choose Create archive.
  4. After it is created, this archive stores your email according to the rules you define in the next step.

Step 3: Create an IAM role permission policy for the send to internet rule action

Configure an IAM role that permits Mail Manager to send email to external domains. This role is referenced in the rule for the second action, “send to internet,” which delivers email to recipients.

  1. Go to the IAM console.
  2. Choose Roles, and then choose Create role.
  3. For trusted entity, select Custom trust policy and paste the following (replace XXXXXXXXXXX with your AWS EUSC account ID):
    {
      "Version": "2012-10-17",
      "Statement": [
        {
          "Sid": "Statement1",
          "Effect": "Allow",
          "Principal": {
            "Service": "ses.amazonaws.com"
          },
          "Action": "sts:AssumeRole",
          "Condition": {
            "StringEquals": {
              "aws:SourceAccount": "XXXXXXXXXXX"
            },
            "ArnLike": {
              "aws:SourceArn": "arn:aws-eusc:ses:eusc-de-east-1:XXXXXXXX:mailmanager-rule-set/*"
            }
          }
        }
      ]
    }

  4. Skip add permissions, name review, and create your role.
  5. Open your newly created role and select Add permissions.
  6. From the menu, choose Create inline policy.
  7. Select JSON in the policy editor and paste the following (replace example.com with your verified domain, XXXXXXXXXXX with your AWS account ID, and my-configuration-set with your configuration set name if applicable). This policy grants the necessary permissions to send email to recipients on the internet, which is used in rule 2 of your rule set.
    {
      "Version": "2012-10-17",
      "Statement": [
        {
          "Sid": "VisualEditor0",
          "Effect": "Allow",
          "Action": [
            "ses:SendEmail",
            "ses:SendRawEmail"
          ],
          "Resource": [
            "arn:aws-eusc:ses:eusc-de-east-1:XXXXXXXXXXX:identity/example.com",
            "arn:aws-eusc:ses:eusc-de-east-1:XXXXXXXXXXX:configuration-set/my-configuration-set"
          ],
          "Condition": {
            "StringEquals": {
              "ses:FromAddress": "example.com"
            }
          }
        }
      ]
    }

  8. Review and save the policy.

Your newly created role now has the custom trust policy in Trusted entities, and a customer-managed inline permission policy under Permissions.

Step 4: Create a traffic policy

Traffic policies act as security checkpoints for your email infrastructure. They control which messages can enter your system based on rules you define. To create a traffic policy that enforces security requirements for your email:

  1. Open the Amazon SES console.
  2. Go to Mail Manager and select Traffic policies.
  3. Choose Create traffic policy.
  4. Enter a unique name for your policy.
  5. Set Default action to Deny.
  6. In your traffic policy, select “add new policy statement.”
    1. For Allow or deny properties, select Allow.
    2. For Properties, select TLS protocol version.
    3. For Operator, select Minimum version or Is version.
    4. For Value, select TLS 1.2 (minimum) or TLS 1.3 (Is version).
  7. Now, add a second condition to the same policy statement to filter outgoing mail to *example.com domains:
    1. For Properties, select Recipient address.
    2. For Operator, select “Ends with” and for Value enter example.com.

    Configure your policy statements as you like.

  8. Choose Create traffic policy.

Traffic policies are evaluated in a specific sequence:

  1. Deny policy statements are evaluated in order. If any match, the email is immediately blocked and no further evaluation occurs.
  2. If no Deny statements match, all Allow policy statements are evaluated in order. Multiple statements within a policy are connected by OR logic. If any statement matches, the email is allowed.
  3. Within each individual policy statement, multiple conditions are connected by AND logic. Each condition must be true for the statement to match.
  4. If no policy statements match (neither Deny nor Allow), the default action of the traffic policy (either Allow or Deny) is applied.

This policy denies traffic by default and allows only messages that meet the TLS 1.2 minimum requirement and are addressed to approved recipient domains.

Default action: Deny by default. Email traffic is initially blocked unless explicitly allowed by the following policy statements.

Policy statement 1: Allows messages to be sent if the recipient’s address ends with *example.com AND meets the minimum TLS protocol version of TLS 1.2.

Step 5: Create a rule set

Rule sets define how your messages are processed after they pass through your traffic policy. In this example, the rule set establishes a sequential email processing workflow. First, you add the action for archiving outgoing messages, and then you add a second action to deliver messages to recipients.

To create a rule set:

  1. Open the Amazon SES console.
  2. Go to Mail Manager and select Rule sets.
  3. Choose Create rule set.
  4. Enter a unique name for your rule set.
  5. On the rule set’s overview page, select Edit, then select Create new rule.

Step 6: Create rules

In this step, you create rules within your rule set that define the actions performed on each email: archiving for compliance and delivering to recipients.

Email add-ons are optional: In your rule set, you can configure the Vade Advanced Email Security Add On for scanning or dropping messages, archiving for compliance, writing to Amazon Simple Storage Service (Amazon S3) for future analysis, and sending email out. Configure these rules accordingly. This guide covers email sending and archiving in the rule below.

  • Add conditions or exceptions as needed:
    • Select Add new condition to specify what messages the rule applies to.
    • Select EXCEPT in the case of and select Add new exception for exclusions.
  • Configure actions by choosing Add new action.
  • For multiple actions, use the up and down arrows to set the execution order.

Action 1: Archive outgoing email. Stores a copy of each outgoing email in a Mail Manager archive. Archived email can be searched and retrieved directly from the Amazon SES console under Email archiving, supporting compliance and audit requirements.

Action 2: Send to internet. Delivers the email to the intended recipient using Amazon SES.

After you create your rule set, add rules that define how email is processed. You create a rule set containing a single rule with two actions that execute in sequential order.

Follow these steps to create and configure your rules.

  1. In the created rule set’s overview page, select Edit, then choose Create new rule.
  2. In the Rule details sidebar, enter a unique name for your rule.
    1. In the rule details on the right side, select “add new action.”
    2. From the menu, choose “archive,” and choose the archive you created at Step 2.
    3. Then add another action: select “add new action” and from the menu, choose “Send to internet.”
    4. Choose the IAM role that you created in Step 3. This role grants SES Mail Manager access to your resource.
  3. When finished creating your rules, choose Save rule set to apply your changes.

Rule 1: Archive and send email to recipients

The rule processes messages that have successfully passed through the traffic policy. The archive action confirms that messages are archived and searchable. The send to internet action then forwards messages to their intended recipients, completing the email delivery workflow.

Step 7: Store password in AWS Secrets Manager for the ingress endpoint

Before you create an ingress endpoint, set up a password in AWS Secrets Manager and an AWS KMS customer managed key:

1. Create a customer managed key policy for your ingress endpoint.

  1. Open the AWS KMS console.
  2. Select Customer managed key (not AWS managed keys).
  3. Create the key.
  4. Define key administrative permissions.
  5. Define key usage permissions.
  6. In your key policy editor, when you review the key statements, paste the following (replace XXXXXXXXXXX with your AWS account ID):
    {
      "Sid": "Allow use of the key",
      "Effect": "Allow",
      "Principal": {
        "Service": "ses.amazonaws.com"
      },
      "Action": "kms:Decrypt",
      "Resource": "*",
      "Condition": {
        "StringEquals": {
          "aws:SourceAccount": "XXXXXXX",
          "kms:ViaService": "secretsmanager.eusc-de-east-1.amazonaws.com"
        },
        "ArnLike": {
          "aws:SourceArn": "arn:aws-eusc:ses:eusc-de-east-1:XXXXXXXX:mailmanager-ingress-point/*"
        }
      }
    }

2. Set up a password in AWS Secrets Manager.

  1. Go to the AWS Secrets Manager console and select Store a new secret.
  2. Choose Other type of secret.
  3. Enter password as the key and your chosen password as the value.
  4. For encryption key, choose the customer managed key you created above.
  5. Choose Next to proceed to Configure secret.
  6. Enter a secret name and choose Edit permissions, then update the resource policy (replace XXXXXXXXXXX with your AWS account ID).
    {
      "Version": "2012-10-17",
      "Id": "Id",
      "Statement": [
        {
          "Effect": "Allow",
          "Principal": {
            "Service": "ses.amazonaws.com"
          },
          "Action": "secretsmanager:GetSecretValue",
          "Resource": "*",
          "Condition": {
            "StringEquals": {
              "aws:SourceAccount": "XXXXXXXXXXX"
            },
            "ArnLike": {
              "aws:SourceArn": "arn:aws-eusc:ses:eusc-de-east-1:XXXXXXXXXXX:mailmanager-ingress-point/*"
            }
          }
        }
      ]
    }

  7. Choose Next, then create and store your secret.

Step 8: Create an authenticated ingress endpoint (ARecord)

Now that you have created your traffic policy and rule set and stored your credentials, you can create the ingress endpoint:

  1. In the Amazon SES console, choose Mail Manager and then select Ingress endpoints.
  2. Choose Create ingress endpoint.
  3. Configure your endpoint:
    1. For type, select authenticated, then select the Secret ARN you created in Secrets Manager.
    2. Choose the traffic policy you created earlier.
    3. Choose the rule set you created earlier.
    4. Configure Network Type: Public Network (Standard Setup). If you select Private Network, follow Step 9 first in a new tab.
    5. Enter a unique name for your endpoint.
  4. Choose Create ingress endpoint.

After your ingress endpoint is created, note the following details from the General details section:

  • Amazon Resource Name (ARN): arn:aws-eusc:ses:eusc-de-east-1:XXXXXXXXXXX:mailmanager-ingress-point/inp-XXXXX
  • Username: inp-XXXXXXXXXXX
  • Host: XXXXXXXXXXX.mail-manager-smtp.eusc-de-east-1.amazonaws.eu (ARecord)

You need these details when configuring your email client or application to send email through this endpoint.

Step 9: Configure VPC endpoint for SES Mail Manager (optional enhanced security)

A VPC endpoint allows your Postfix EC2 instance to reach Mail Manager privately, without sending traffic over the public internet. To use this option, create the VPC endpoint in the same VPC as your Postfix instance. Configure security group rules to allow traffic on port 587.

  • VPC: The VPC endpoint must be created in the same VPC where your Postfix EC2 instance resides.
  • Security groups:
    • Postfix EC2 SG: Outbound rule to VPC endpoint SG on port 587.
    • VPC endpoint SG: Inbound rule from Postfix EC2 SG on port 587.
  • Subnets: The VPC endpoint should be in subnets that are routable from your EC2 instance’s subnet.

Create a security group for the VPC endpoint:

  1. Open the Amazon VPC console.
  2. Select Security groups.
  3. Choose Create security group.
    1. Name: mail-manager-vpce-sg (example).
    2. VPC: Choose the VPC where your Postfix EC2 instance resides.
  4. Add an inbound rule:
    1. Type: Custom TCP.
    2. Port: 587 (or 25 if using port 25).
    3. Source: Security Group ID of your Postfix EC2 instance (or create a placeholder, update later).
  5. Choose Create security group. Note the Security Group ID for the next step.
  6. Choose Endpoints in the VPC console.
  7. Choose Create endpoint.
    1. Name: mailmanager-ingress-endpoint (example).
    2. For Service category, select AWS services.
    3. For Service Name, select com.amazonaws.eusc-de-east-1.mail-manager-smtp.auth.
    4. For VPC, choose the VPC where your Postfix server resides.
    5. Subnets: Select at least 2 (private) subnets (for high availability).
    6. Security Groups: Choose the security group you created.
  8. Choose Create Endpoint.

Wait for the endpoint status to become Available. After the endpoint status becomes Available, note the DNS name from the endpoint details. Use the regional (non-AZ-specific) DNS name for your Postfix relay configuration:

auth.mail-manager-smtp.eusc-de-east-1.on.amazonwebservices.eu

Step 10: Mail Manager logging (AWS CLI)

Now that you have created your Mail Manager resources, you can configure log delivery through the AWS CLI to track message flow from ingress endpoints through rule set processing. After it is configured, you can view these logs in CloudWatch Log Groups.

  1. Open your terminal (CLI).
  2. Log in to your AWS account using the following command:
    aws configure

  3. Create a CloudWatch Log Group:
    aws logs create-log-group \
        --log-group-name /aws/mailmanager/ruleset-logs \
        --region eusc-de-east-1

    Before you proceed, copy the log group ARN for the step Create the Delivery Destination.

  4. Create the Log Delivery Source:Add your rule set ID to the resource-arn parameter below. You can find the resource ARN for the rule set when you click on the rule set name under rule sets in the SES console.
    aws logs put-delivery-source \
        --name rs-default \
        --resource-arn arn:aws-eusc:ses:eusc-de-east-1:XXXXXX:mailmanager-ruleset/YOUR-RULESET-ID \
        --log-type APPLICATION_LOGS

  5. Create the Log Delivery Destination:Add your log group ARN to the destinationResourceArn parameter below:
    aws logs put-delivery-destination \
        --name mailmanager-destination \
        --output-format json \
        --delivery-destination-configuration '{"destinationResourceArn":"arn:aws-eusc:logs:eusc-de-east-1:XXXXXX:log-group:/aws/mailmanager/ruleset-logs:*"}'

    Copy the delivery destination ARN for the step below.

  6. Link Log Delivery Source to Log Delivery Destination (Create Delivery):
    aws logs create-delivery \
        --delivery-source-name rs-default \
        --delivery-destination-arn arn:aws-eusc:logs:eusc-de-east-1:XXXXXX:delivery-destination:mailmanager-destination

    Verification commands:

    aws logs describe-log-groups --region eusc-de-east-1
    aws logs describe-delivery-sources --region eusc-de-east-1
    aws logs describe-delivery-destinations --region eusc-de-east-1
    aws logs describe-deliveries --region eusc-de-east-1

  7. Send an email and view your logs for your rule set:
    1. Open the Amazon CloudWatch console.
    2. Select Log Groups in the sidebar navigation.
    3. Select the log group you would like to view logs for.
    4. Select the log you would like to view under Log Streams.

Example output of an email that was sent successfully:

{
  "resource_arn": "arn:aws-eusc:ses:eusc-de-east-1:account-id:mailmanager-rule-set/ruleset-id",
  "event_timestamp": 3456789876,
  "message_id": "message-id",
  "rule_set_name": "send",
  "rule_name": "sendtointernet",
  "rule_index": 1,
  "recipients_matched": "[\"[email protected]\"]",
  "action_metadata": {
    "action_name": "SEND",
    "action_index": 1,
    "action_status": "SUCCESS"
  }
}

Step 11: Send email using an ingress endpoint

Code example with Python:

import smtplib
import ssl

# Your ingress endpoint and port
smtp_server = "*****.eusc-de-east-1.amazonaws.eu"
# Or for VPC: "vpce-xxxxx.mail-manager-smtp.auth.eusc-de-east-1.vpce.amazonaws.eu"
smtp_port = 587

# Your SMTP credentials retrieved from Secrets Manager
username = "****"
password = "[REDACTED_PASSWORD]"

sender_email = "[email protected]"  # Your verified identity
receiver_email = "[email protected]"

# Properly formatted email message with headers
message = f"""From: Firstname Lastname <{sender_email}>
To: Firstname Lastname <{receiver_email}>
Subject: Test Email from Python

This email was sent via the Mail Manager ingress endpoint and delivered
to the recipient through the "Send to Internet" rule action.
"""

server = None
try:
    print(f"Connecting to {smtp_server}:{smtp_port}...")
    server = smtplib.SMTP(smtp_server, smtp_port)
    server.set_debuglevel(1)

    print("\nStarting TLS...")
    context = ssl.create_default_context()
    server.starttls(context=context)

    print("\nLogging in...")
    server.login(username, password)

    print("\nSending email...")
    server.sendmail(sender_email, receiver_email, message)
    print("\nEmail sent successfully.")
except Exception as e:
    print(f"\nError: {e}")
    import traceback
    traceback.print_exc()
finally:
    if server:
        server.quit()

Step 12: Integrate with your existing email server

Use Postfix or SMTP clients on Amazon EC2 to relay outbound email through Mail Manager, which then forwards it through the “Send to internet” action configured in Step 3.

If you choose to integrate with Postfix in this guide, your relay host is the ingress endpoint or the VPC endpoint you created. Your port is typically 587.

relayhost = [<ARecord>]:<port>

Example with Postfix

/etc/postfix/main.cf:

relayhost = [xxxx.eusc-de-east-1.amazonaws.eu]:587 or 25
relayhost = [vpce-xxxxx.mail-manager-smtp.auth.eusc-de-east-1.vpce.amazonaws.eu]:587

Clean up

Clean up your AWS environment by removing all resources created during this walkthrough, including Mail Manager configurations, ingress endpoints, rule sets, traffic policies, archives, IAM roles, Secrets Manager secrets, AWS KMS keys, and CloudWatch log groups.

Conclusion

In this post, you configured Amazon SES Mail Manager in the eusc-de-east-1 Region of the AWS European Sovereign Cloud to send outbound email over SMTP. You created a traffic policy to enforce TLS and recipient filtering, a rule set to archive and deliver messages, and an authenticated ingress endpoint that serves as a compatible SMTP relay for your applications.

To learn more, see the Amazon SES Mail Manager documentation, open the Amazon SES console to start configuring your own pipeline, or visit the Amazon SES service page for additional features.

Additional references

For more information, see the following references:


About the authors

Improve your application resilience with Amazon Cognito multi-Region replication

Post Syndicated from Sébastien Stormacq original https://aws.amazon.com/blogs/aws/improve-your-application-resilience-with-amazon-cognito-multi-region-replication/

As a developer advocate working with web and mobile application developers, I’ve often heard about the need to maintain consistent user authentication in the unlikely event of a regional service interruption. The increasing use of agentic AI, microservices, automation, and service accounts has sparked a similar need for machine-to-machine authentication. Today, I’m excited to share two important updates to Amazon Cognito: multi-Region replication for improved resilience, and support for customer managed keys for more control encryption control.

Many applications rely on Amazon Cognito to handle user and machine-to-machine authentication, and to manage user profiles. When building for high availability, having consistent data across different AWS Regions is a key approach, and until now, achieving that consistency came with significant challenges. Engineering teams spent significant time building and maintaining custom replication solutions to synchronize configurations across Regions. Manual export and import of user data between Regions created security risks from potential data exposure and introduced opportunities for data inconsistencies. During regional transitions, end users experienced disruptions like forced password resets and re-authentication. For machine-to-machine communications, teams had to create new app clients in the secondary region, which meant reconfiguring their applications and updating OAuth-protected resources to accept access tokens issued by the new regional issuer. These challenges made it difficult to maintain uninterrupted operations across Regions.

With multi-Region replication, Amazon Cognito automatically maintains a synchronized copy of your user data and machine secrets in a secondary AWS Region of your choice. The replication flows in one direction, from your primary Region to the secondary Region. This includes user profiles, credentials, and pool configurations. The secondary Region operates in read-only mode, focusing on maintaining authentication capabilities. Existing sessions continue uninterrupted.

When you need to direct traffic to the secondary Region, your existing users can continue signing in with their existing credentials without disruption, and currently signed-in users remain authenticated because both regions recognize access tokens issued by either region. Multi-Region replication supports all authentication methods, including federated sign-in through social providers (Amazon, Google, Apple, Facebook), Security Assertion Markup Language (SAML) and OpenID Connect (OIDC) integrations, and API authorization flows. This approach maintains availability for both customer-facing applications and machine-to-machine communications in your backend services. While authentication continues without interruption, operations like new user registration or profile updates are not available during failover.

Before configuring multi-Region replication, you must configure a multi-Region customer managed key stored in AWS Key Management Service (AWS KMS) to encrypt your user data at rest. These keys provide consistent encryption across Regions while giving you control over your encryption strategy.

How this works in practice
I start this demo with an existing Cognito user pool in the us-west-2 (Oregon) Region. I want to configure replication to us-east-1 (Northern Virginia). I also have a customer managed key replicated in these two Regions.

Configuring multi-Region replication is just three steps. The AWS Management Console guides me through the steps: set up a custom key for encryption, configure multi-region OIDC endpoints, and configure the replication itself.

First, I set up a custom AWS KMS key to encrypt the data at rest.

Cognito Multi-Region replication - initial state

I select the custom key I created. I also update the key policy to allow Amazon Cognito to access and use the key. The console shows the correct IAM policy statements to add to my key policy.

Cognito Multi-Region replication - select CMK

The console confirms when the custom key is selected and correctly configured.

Cognito Multi-Region replication - confirm CMK

Second, I follow the console instructions to configure the OIDC issuer type. On Step 2 – optional, I choose Configure.

Cognito Multi-Region replication - configure multi region OIDC 1

I make sure to update my client applications with these new endpoints. This is a required change that will need a redeployment of server-side applications and an update submission for mobile apps on the App Store and Google Play. If I don’t update the endpoints, my users will experience disruptions because requests to the old endpoints will no longer be routed correctly.

On the next screen, I select Updated. I take note of the new URLs. I confirm the changes and choose Change issuer type.

Cognito Multi-Region replication - configure multi region OIDC 2Finally, I select the target Region for replication. Only Regions where the custom encryption key is replicated are available for selection. After having chosen the target Region, I choose Create.Cognito Multi-Region replication - start the replication process.

The service prepares the replication. The time needed depends on the amount of data in the user pool.

When the replicated user pool is ready, I manually Activate it.

Cognito Multi-Region replication - replication process is complete

The replication status becomes Active. It is ready to direct traffic to the replica.

Cognito Multi-Region replication - active

Additional configurations
The console helps me to keep track of additional configurations I have to plan. When I’m using Lambda functions for custom authentication flows or SMS or email notifications, I must also deploy and configure these resources in the new Region.

Similarly, log streaming or AWS WAF configuration must be manually configured in the target Region before I start directing authentication traffic to it.

Cognito Multi-Region replication - task list

Health checks and failover
Both primary and secondary regional endpoints remain active and ready to serve your traffic at all times. To monitor system health and manage failovers, you design a strategy that aligns with your application’s specific requirements and security posture. You can implement health checks to monitor the status of authentication services in your primary Region and define criteria for when to initiate failover. These checks might look for error rates, latency patterns, or specific service alerts.

When your monitoring system detects issues meeting your failover criteria, you can redirect traffic to the secondary Region through DNS updates. This approach gives you control over the failover process while maintaining security. Consider testing your failover strategy during off-peak hours by redirecting a small portion of traffic to verify that authentication continues working as expected in the secondary Region.

When using managed login and federation with custom domains, you can also use the built-in traffic routing feature by providing an Amazon Route 53 health check ID.

Pricing and availability
Multi-Region replication is available today as an add-on feature for Amazon Cognito customers using Essentials and Plus tier. For user authentication, the add-on costs $0.0045 per monthly active user per replica Region for Essentials tier customers and $0.006 per monthly active user per replica region for Plus tier customers. For machine-to-machine (M2M) authentication, the add-on is a 30% charge on top of the standard volume-based pricing for successful tokens issued. For detailed pricing information, see Amazon Cognito pricing.

Multi-Region replication is available in the following Regions: US East (Ohio, N. Virginia), US West (N. California, Oregon), Asia Pacific (Mumbai, Seoul, Singapore, Sydney, Tokyo), Canada (Central), Europe (Frankfurt, Ireland, London, Paris, Stockholm), and South America (São Paulo).

Any of these Regions can be used as the source or the destination for the replication.

Support for customer managed keys is available for the Essentials and Plus tiers. It is available in the following Regions: US East (Ohio, N. Virginia), US West (N. California, Oregon), Africa (Cape Town), Asia Pacific (Hong Kong, Hyderabad, Jakarta, Malaysia, Melbourne, Mumbai, New Zealand, Osaka, Seoul, Singapore, Sydney, Thailand, Tokyo), Canada (Central), Canada West (Calgary), Europe (Frankfurt, Ireland, London, Milan, Paris, Spain, Stockholm, Zurich), Israel (Tel Aviv), Mexico (Central), South America (São Paulo), and AWS GovCloud (US-East, US-West)

From my conversations with customers, maintaining business continuity during regional incidents while meeting security requirements is a high priority. Multi-Region replication provides the capability to build more resilient applications without managing complex replication logic yourself. The automatic synchronization of user data and configurations reduces operational overhead while maintaining security.

For customers in regulated industries, the new support for customer managed keys provides additional control over data encryption. You can now use your own encryption keys to protect user data at rest, helping you meet regulatory requirements in industries like healthcare and financial services.

To get started with multi-Region replication and customer managed key encryption, visit the Amazon Cognito console or see the documentation for detailed setup instructions. I look forward to hearing how you use this feature to strengthen your application architecture.

— seb

Schedule notebook runs in Amazon SageMaker Unified Studio

Post Syndicated from Shivani Mehendarge original https://aws.amazon.com/blogs/big-data/schedule-notebook-runs-in-amazon-sagemaker-unified-studio/

If you build notebooks for recurring tasks such as daily customer analysis, weekly report generation, or data quality checks in Amazon SageMaker Unified Studio, you’ve likely wanted to run them automatically on a schedule. Until now, there wasn’t a native way to do this. Teams had to manage orchestration separately, even though the interactive notebook experience was already in place. Now, notebook scheduling is available, so you can configure your production workloads to run automatically with minimal manual intervention.

In this post, we walk you through the new scheduling and orchestrating capabilities for notebooks in Amazon SageMaker Unified Studio. You will learn how to:

  • Trigger on-demand background runs, such as a model re-training job, without waiting at your desk.
  • Create recurring schedules for tasks such as nightly data freshness checks or weekly business reviews.
  • Parameterize notebooks so a single template can generate reports across different AWS Regions or customer segments.
  • Orchestrate multi-notebook workflows where one notebook’s output feeds into the next. For example, an extract, transform, and load (ETL) pipeline followed by a summary dashboard refresh.
  • Debug failed runs with AI-assisted troubleshooting.

Sample use case overview

In this walkthrough, you will take on the role of a logistics analyst who monitors shipping performance across carriers. The notebook loads shipping data from the ShippingLogs.csv dataset, identifies late deliveries, and generates a performance summary. You want to run this notebook every morning without manual intervention, reuse it across different carriers, and know when something goes wrong.

You will start by running a notebook in the background and viewing the results. Next, you will create a recurring schedule for daily runs, then parameterize the notebook to generate reports for different carriers. You will also orchestrate the notebook in a multi-step workflow and debug a failed run using AI-assisted troubleshooting.

Prerequisites

Before you begin, you need:

  • An Amazon SageMaker Unified Studio project with Notebooks enabled. See Set up IAM-based domains for permission requirements.
  • A sample dataset. We use the ShippingLogs.csv dataset, which contains shipping data including estimated and actual delivery times, carriers, and origins. You can download it from the Workshop Studio (the file is named ShippingLogs.csv on the linked page).

Setting up the notebook

Start by creating a new notebook in your SageMaker Unified Studio project. If you haven’t already, upload the ShippingLogs.csv file under the Shared tab in the Files panel.

SageMaker Unified Studio Notebook Files panel showing the Shared tab with the ShippingLogs.csv dataset uploaded

In the first cell, we load and explore the dataset. To reference the file in code, select the file in the Shared tab and copy the Amazon Simple Storage Service (Amazon S3) URI shown in the file details. Alternatively, you can reference it with this code:

import pandas as pd
from sagemaker_studio import Project

# Initialize the project
proj = Project()

# Get the S3 root path
s3_root = proj.s3.root

df = pd.read_csv(s3_root + '/ShippingLogs.csv')
df.head()

The dataset contains columns including Carrier, ActualShippingDays, ExpectedShippingDays, ShippingOrigin, ShippingPriority, and OnTimeDelivery. Add a second cell to analyze shipping performance for a single carrier:

import matplotlib.pyplot as plt

carrier_data = df[df['Carrier'] == 'GlobalFreight']
# Flag late deliveries
carrier_data['is_late'] = carrier_data['ActualShippingDays'] > carrier_data['ExpectedShippingDays']
late_pct = carrier_data['is_late'].mean() * 100
# Visualize actual vs expected shipping days
plt.figure(figsize=(12, 4))
plt.hist(carrier_data['ActualShippingDays'] - carrier_data['ExpectedShippingDays'], bins=20, edgecolor='black')
plt.axvline(x=0, color='red', linestyle='--', label='On time')
plt.title(f'Shipping Delay Distribution - GlobalFreight ({late_pct:.1f}% late)')
plt.xlabel('Days Over Expected')
plt.ylabel('Number of Shipments')
plt.legend()
plt.show()

With the notebook working interactively, you’re ready to automate it.

Running a notebook asynchronously

To trigger an asynchronous run, open your notebook. In the notebook header, choose the menu on the Run all button, and then choose Run in background.

Notebook header with the Run all menu expanded, showing the Run in background option

This captures a snapshot of the notebook in its current state and starts a run on a separate dedicated compute. You can continue working on other tasks or close the browser entirely. Your interactive session isn’t affected.

You will see a notification at the bottom of your screen confirming that the run started. To check the status of your run, choose View Run in the notification. This opens a view showing every background and scheduled run with its status, duration, and a link to view the full output.

Run history view showing background and scheduled runs with status, duration, and output links

You can choose to view the run details at any point to view results as cells run. The run details include three tabs:

  • Output: The notebook in read-only mode with cell results rendered, including dataframe outputs, visualizations, and print statements.
  • Parameters: The parameter values used for this run.
  • Logs: Run logs for debugging.

Run details view showing the Output, Parameters, and Logs tabs with rendered cell output

You can also access past runs by selecting the View Runs option in the notebook header.

Notebook header with the View Runs option highlighted

Stopping an in-progress run

If you need to cancel a run, open the run, and choose Stop. The run terminates, and its status updates to reflect the cancellation.

Run detail view with the Stop button selected to terminate an in-progress run

What to know about background runs

Compute: Each background run uses its own dedicated compute, separate from your interactive session. Your interactive work isn’t interrupted.

Packages: The packages that you install through the notebook’s package manager will be available in your background runs. When you use !pip install in code cells, the asynchronous run installs those packages as well.

Local files: Background runs can’t access files stored locally in your notebook environment. Reference data from your project’s shared storage (Amazon S3) or connected data sources instead.

Startup time: Expect a few minutes of startup time while compute is provisioned and your environment is prepared.

Creating a recurring schedule

Now that you’ve confirmed asynchronous runs work correctly, you can automate the notebook on a schedule. Choose the schedule icon in the notebook header to open the schedule creation form.

Schedule creation form opened from the notebook header schedule icon

Configure the following settings:

  • Schedule name: Enter a descriptive name, such as Daily Shipping Report.
  • Schedule type: Choose Recurring for repeated runs or One-time for a single future run.
  • Frequency: Define how often the notebook runs using a rate (for example, every one day) or a cron expression. Set the time zone and the start and end dates for the schedule. For example, set the schedule to run every day at 7:00 AM UTC starting tomorrow.
  • Flexible time window (optional): The number of minutes after the scheduled start time within which the run can be invoked. For example, with a 5-minute window, the notebook runs within 5 minutes of the start time.
  • Advanced settings:
    • Compute Instance: Keep the current settings or override with a different instance type for the asynchronous run to use.
    • Timeout: Set a maximum run duration to help prevent notebooks from running indefinitely. If left blank, it defaults to 60 minutes.

Choose Create.

Configured schedule form with name, recurring type, daily frequency, and advanced settings populated

The schedule appears in the Schedules tab of the activity panel. SageMaker Unified Studio creates an Amazon EventBridge Scheduler schedule for each schedule you configure.

Schedules tab in the activity panel listing the newly created Daily Shipping Report schedule

Viewing schedule run history

To view past runs for a schedule, choose the schedule name in the Schedules activity panel. This opens the schedule details view, where you can see the list of runs triggered by that schedule, the duration of each run, and a link to open the notebook output for an individual run.

Schedule details view showing the list of past runs with status, duration, and output links

Editing and deleting schedules

To modify a schedule, choose Edit next to it in the Schedules panel. You can change the frequency, instance type, timeout, and other configuration fields. To pause or resume a schedule, choose Pause or Resume from the same menu. To remove a schedule, choose Delete from that menu. Deleting a schedule stops future runs but preserves historical run outputs in Amazon S3 for auditing purposes.

Schedules panel with the Edit, Pause, Resume, and Delete options for a schedule

Parameterizing notebooks

With parameters, you can reuse a single notebook across different inputs without duplicating code. For example, you can run the same shipping performance report for each carrier by passing a different carrier name to each run.

Defining parameters

Open the Parameters activity panel and choose Add. Set the parameter name to carrier and the default value to GlobalFreight.

Parameters activity panel with the carrier parameter and GlobalFreight default value configured

Using parameters in code

In your notebook, replace the second cell with the following code. This retrieves the carrier parameter value using the SageMaker Unified Studio Python SDK instead of the hardcoded value:

import sagemaker_studio
import matplotlib.pyplot as plt

carrier = sagemaker_studio.nbutils.parameters.get("carrier")

carrier_data = df[df['Carrier'] == carrier].copy()
carrier_data['is_late'] = carrier_data['ActualShippingDays'] > carrier_data['ExpectedShippingDays']
late_pct = carrier_data['is_late'].mean() * 100

plt.figure(figsize=(12, 4))
plt.hist(carrier_data['ActualShippingDays'] - carrier_data['ExpectedShippingDays'], bins=20, edgecolor='black')
plt.axvline(x=0, color='red', linestyle='--', label='On time')
plt.title(f'Shipping Delay Distribution - {carrier} ({late_pct:.1f}% late)')
plt.xlabel('Days Over Expected')
plt.ylabel('Number of Shipments')
plt.legend()
plt.show()

Creating schedules with different parameter values

Now create three schedules for the same notebook, each targeting a different carrier:

  • “daily-shipping-gf” with carrier = GlobalFreight.
  • “daily-shipping-mc” with carrier = MicroCarrier.
  • “daily-shipping-shipper” with carrier = Shipper.

When you view a historical run, a separate Parameters tab in the run output displays the parameter values that were active for that run.

You can also override parameter values when triggering an on-demand background run. Choose the menu on the Run all button, then choose Run with settings. You can keep the defaults or provide custom values for that run.

Orchestrating with Workflows

To combine notebooks into a multi-step pipeline, such as running a data calculation notebook before the shipping log notebook, you can use the Notebook Operator in the Workflows tool to orchestrate them.

To do this, choose the Add to workflows button under the options menu of the notebook header.

Notebook header options menu with the Add to workflows button highlighted

This takes you to the Workflows tool, adding a new Notebook Operator task with prefilled properties from your notebook. When configuring the Operator task:

  • Select the target notebook from the notebook menu.
  • Use the Parameters widget to pass notebook parameters into the run of the notebook.
  • Specify optional arguments such as the compute instance and timeout configuration for the run.

Workflows canvas with a Notebook Operator task configured with notebook, parameters, and compute settings

Workflows also supports polling for the status of a notebook run for a particular notebook using Notebook Sensor. In Workflows, you can add a new Sensor task by hovering on the edge of the existing Operator task, where a plus (+) button is displayed.

Workflows canvas showing the plus button on the edge of an Operator task for adding a Sensor

You can then search for and add the Notebook Sensor to the canvas.

Task picker dialog with Notebook Sensor selected for adding to the workflow canvas

When configuring the Sensor task, specify the notebook run ID within the text field. The Operator’s form field contains Jinja templating to retrieve the notebook run. If the Sensor is used within the same workflow as the Operator, this template can be copied to use within a Sensor to poll the notebook run. Select the target notebook from the notebook menu.

Notebook Sensor configuration panel with the notebook run ID field populated using Jinja templating

Within Workflows, you can configure notebook runs to emit outputs and use those outputs as inputs for subsequent notebook runs.

Building off of the previous shipping log notebook example, we will pass the carrier parameter from an upstream notebook’s output. Your shipping-logs-analysis notebook should be already set up.

Because the notebook depends on the carrier parameter, you can specify it in the Parameters panel.

Parameters panel for the shipping-logs-analysis Operator with the carrier parameter dependency configured

Now, define a second notebook, calculate-best-carrier, which performs a calculation to determine our best carrier to use for shipping:

import pandas as pd
from sagemaker_studio import Project

# Initialize the project
proj = Project()

# Get the S3 root path
s3_root = proj.s3.root

df = pd.read_csv(s3_root + '/ShippingLogs.csv')
df.head()

carrier_stats = df.groupby('Carrier').agg(
    total=('OrderID', 'count'),
    late=('OnTimeDelivery', lambda x: (x == 'Late').sum())
).reset_index()
carrier_stats['late_pct'] = carrier_stats['late'] / carrier_stats['total'] * 100

best = carrier_stats.sort_values('late_pct', ascending=True).iloc[0]
best_carrier = best['Carrier']

print("Late % by carrier:")
print(carrier_stats.to_string(index=False))
print(f"\nBest carrier: {best_carrier} ({best['late_pct']:.1f}% late)")

To configure the calculate-best-carrier notebook’s outputs, you can choose the Variables panel. A new selector is available at the bottom of this panel which allows you to select variables to mark as outputs.

Variables panel with the selector at the bottom for marking notebook variables as outputs

We want this notebook to emit the best_carrier variable.

Variables panel showing best_carrier marked as an output variable for the calculate-best-carrier notebook

Now, use the Add to workflows button as previously demonstrated to quickly add this notebook within a workflow. Chain a second Notebook Operator that points to our shipping-logs-analysis notebook. Because we specified a parameter dependency on carrier for this notebook, it’s available as an option in the Parameters widget menu.

Parameters widget menu of a Notebook Operator showing carrier as a configurable parameter dependency

When they’re chained, the notebook tasks detect the outputs set in upstream notebook runs. These outputs can be selected as keys within the Parameters widget of the Operator to pass into the run. This can be done recursively for an arbitrary number of Operator tasks. We can select the emitted best_carrier output from the calculate-best-carrier notebook.

Parameters widget displaying best_carrier as a selectable upstream output to pass into the next Operator

You can now choose the Save button on the top left of the visual canvas and the Run button to start the workflow. When the workflow is completed, the specified notebook outputs are available in the Task Output panel and the notebook run result can be viewed in the Notebooks tool.

Task Output panel showing the emitted notebook outputs after a successful workflow run

Notebook run result rendered in the Notebooks tool after the chained workflow completes

In a similar manner, the Notebook Sensor will also emit the notebook outputs from a particular notebook’s run which can be used within other tasks. This is useful when you want to retrieve outputs from a notebook run in another workflow.

Debugging a failed run with AI assistance

When viewing your past runs, you notice that a run from earlier today has a Failed status. Choose the failed run to open the notebook output in read-only mode.

In this example, suppose you incorrectly referred to column name ActualShippingDays as DeliveryDays. The run would fail with a KeyError: 'DeliveryDays' in the cell that computes late deliveries.

At the top of the failed run output, choose Troubleshoot with AI. Choosing the Troubleshoot with AI button lands you in the notebook with the Agent chat panel open.

Failed run output with the Troubleshoot with AI button highlighted at the top of the page

The data agent analyzes the cell outputs, identifies the cell that errored, explains the root cause, and suggests a fix. In this case, it identifies that the column DeliveryDays doesn’t exist in the dataframe and suggests updating the code reference. You can review the change, then verify the fix by choosing Run in background from the Run all menu to trigger a test run before the next scheduled run.

Note: You can also use the Data Agent to create schedules and start notebook runs using natural language, without having to navigate.

Cleaning up

To avoid incurring future charges, delete the resources that you created in this walkthrough:

  • Delete any schedules that you created from the Schedules panel in your notebook.
  • Delete test notebooks if you don’t need them.
  • Navigate to the Workflows page and delete any workflows that you created during this walkthrough.
  • Your project’s Amazon S3 storage retains historical run outputs until you manually remove them.

Conclusion

In this post, we showed how to run notebooks in the background in Amazon SageMaker Unified Studio using background runs, schedules, parameterization, workflow orchestration, and AI-assisted debugging. Using a shipping logistics dataset, we demonstrated how a single notebook can be parameterized to generate performance reports for different carriers on independent schedules, all without duplicating code or managing extensive infrastructure.

To get started, open a notebook in your SageMaker Unified Studio project, choose the menu on the Run all button in the notebook header, and choose Run in background. For more advanced use cases, explore workflows in Amazon SageMaker Unified Studio to build multi-step data pipelines, or review the Amazon SageMaker Unified Studio User Guide for additional configuration options.

Learn more:

If you have feedback or questions, reach out on AWS re:Post for Amazon SageMaker Unified Studio.


About the authors

Shivani Mehendarge

Shivani Mehendarge

Shivani is a Software Development Engineer at Amazon Web Services, where she builds scalable infrastructure that helps data teams run and automate their workloads in Amazon SageMaker Unified Studio. She is passionate about solving complex distributed systems challenges and building reliable cloud services.

Regan Perk

Regan Perk

Regan is a Senior Software Development Engineer on the Amazon SageMaker Unified Studio team. She designs, implements, and maintains features that enable customers to manage schedules and workflows in SageMaker Unified Studio.

Qazi Ashikin

Qazi Ashikin

Qazi is a Software Development Engineer at Amazon Web Services, where he works on developing features that allow customers to orchestrate workflows and schedules in SageMaker Unified Studio. He also works on AWS Glue Studio, where he builds agentic systems and maintains services that enable data analytics.

Align your architecture backlog with Tech Roadmap Prioritization (TRP)

Post Syndicated from John Walker original https://aws.amazon.com/blogs/architecture/align-your-architecture-backlog-with-tech-roadmap-prioritization-trp/

What do the organizations that succeed at digital transformation have in common? They align business and technical stakeholders around a shared plan before writing a single line of code. Yet research from McKinsey shows that 70 percent of transformations fail. Stakeholder misalignment and the inability to scale initiatives beyond initial pilots are patterns we see repeatedly across these failures. Before you architect your workloads, your team must agree on which ones deserve focus first.

In this post, we show you how to run a one-hour prioritization session with your stakeholders, plot competing initiatives on a shared matrix by cost and impact and turn the result into an actionable architecture backlog – using a framework called Tech Roadmap Prioritization (TRP).

The architect’s challenge

You’re facilitating alignment between five competing initiatives, but your organization only has capacity to execute two. Who decides? Without structure, decisions default to political influence or recency bias. High-value work stalls while low-impact projects consume resources.

Consider this scenario: your organization has competing initiatives such as a new product launch, application modernization, sales expansion, and security upgrades. Business and technical leaders each hold different priorities, share no view of tradeoffs, and have no shared way to decide what gets done first.

Developers work story backlogs. Support teams work ticket queues. As an architect, your backlog is the set of prioritized initiatives your organization needs to execute, and TRP is how you build it with your stakeholders.

The TRP framework

In approximately one hour, you bring business and technical owners into the same room and build a shared roadmap together. At every stage of your cloud journey, you face competing workloads that require your team’s attention. TRP gives you a repeatable way to decide which ones come first. You produce a single visual artifact: a modified prioritization matrix adapted for architecture roadmapping that plots your initiatives by cost and complexity against business impact.

The initiatives that you surface in TRP feed directly into the AWS Cloud Adoption Framework (AWS CAF) Envision phase, where you can connect business goals to enabling technologies and evaluate initiatives across the CAF’s six perspectives. TRP gives you the starting artifact and AWS CAF gives you the structured analysis that follows.

Why a visual roadmap?

You track your technology initiatives across spreadsheets, slide decks, and hallway conversations. Your business leaders frame urgency in revenue terms. Your technical leaders frame it in risk terms. No single artifact exists where both can view every initiative, its relative priority, and the reasoning behind it. TRP produces that artifact. One hour, one room, one artifact. You plot each initiative on a matrix where position alone communicates priority, and the conversation shifts from “my initiative matters more” to “where does this land relative to everything else?”

The TRP matrix

Tech Roadmap Prioritization matrix plotting initiatives by cost on the x-axis and business impact on the y-axis, with bubble size showing strategic importance and color showing Modernize, Optimize, or Monetize strategy

You represent each initiative as a numbered bubble. The numbers are identifiers, not a priority ranking. Priority is determined by position on the matrix, which you read using five visual cues:

  • X-axis position: Cost and complexity of the initiative (low to high).
  • Y-axis position: Potential benefits and business impact (low to high).
  • Bubble size: Strategic importance to the organization (small = low, large = high).
  • Bubble color: Strategy type based on the Modernize, Optimize, Monetize (MOM) framework. Healthy cloud architectures balance all three: yellow = Modernize (improve what exists), blue = Optimize (reduce cost or increase efficiency), green = Monetize (generate new revenue).
  • Position on the matrix: Where a bubble lands reveals its priority. Upper-left = strategic quick wins (high impact, low cost). Upper-right = strategic transformations (high impact, high cost). Lower-left = tactical quick wins. Lower-right = questionable initiatives that should wait.

What each position tells you to do

After you plot your initiatives, position on the matrix tells you more than priority. It tells you what kind of work comes next.

Upper-left: Strategic quick wins. High impact, low cost. You execute these now. Assign an owner, set a delivery date, and get moving. These build momentum and demonstrate early value to your stakeholders.

Upper-right: Strategic transformations. High impact, high cost. Look at a large blue bubble here, like initiative 1 (Migration to SaaS) in the sample. This delivers high value but carries significant risk. You don’t commit resources to this on day one. You de-risk it first. Run a proof of concept. Schedule workshops to close skill gaps. Identify the complexity drivers and investment requirements, then remove them before you scale. Your job as the facilitator is to define the path from “we want this” to “we’re ready to build this.” For initiatives requiring skills your organization lacks, engage AWS Partners to de-risk and accelerate the work.

Lower-left: Tactical quick wins. Low impact, low cost. Delegate or batch these small wins together. They won’t move the needle on their own, but they clear the backlog and free up attention for the strategic work above.

Lower-right: Questionable initiatives. Low impact, high cost. You park these. They stay visible on the matrix so stakeholders know they haven’t been forgotten, but you don’t invest in them until the business case changes. If someone pushes for one of these, you point to the matrix and ask what moves off the board to make room.

Your architecture decisions start here. Each quadrant demands a different response, and the matrix gives you the shared language to explain why.

Look at initiative 2 in the sample, Cost Optimization. It sits in the upper-left as a large yellow bubble: high impact, low cost, high strategic importance, optimization strategy. That is your first move. Initiative 1 (Migration to SaaS) ranks second: high impact but high cost, meaning you de-risk it before committing. You read every initiative the same way, and the full priority order emerges from the diagram itself.

Now that you know how to read the matrix, here’s how to run the session that creates it.

How to run a one-hour roadmap session

You are the facilitator, not a participant, not a decision-maker. The decisions belong to the business and technical owners in the room. Your role is to keep the group moving, protect the scope, and ensure every voice is heard. TRP isn’t a substitute for capacity planning, project sequencing, or backlog management – those follow TRP and are handled by project management, product owners, and technical owners. What TRP produces is the shared prioritization artifact that informs all of those downstream functions.

You’re answering four questions per initiative, relative to one another. That is the entire scope. Keep the group focused on relative positioning, not detailed analysis. Target 60 minutes. For larger groups, budget 90. The hour works when you protect the scope.

1. Get the right people in the room

Invite people who can make decisions and commit resources. Bring your CTO, VP of Engineering, product leaders, and line-of-business owners. If you don’t have access to those people, find the person who does. That’s your sponsor up your chain of command. Seat business owners and technical owners at the same table. Whether your organization has dedicated roles for each or one person wears multiple hats, the key is getting the people who understand the business priorities and the people who understand the technical complexity into the same conversation.

2. Bring the set of initiatives

Gather your list of competing initiatives before the session. Aim for 5–15. Too few and the exercise feels trivial, too many and you won’t finish in an hour. Pull from your existing project proposals, strategic plans, customer requests, and technical debt backlog. Write a name and a one-sentence description for each one that everyone in the room can understand.

3. Ask the four questions

Walk through each initiative and ask four questions:

  1. How big is it? Skip detailed estimates. Size it relative to the others. Is this a quarter-long effort or a multi-year program? Is it cost, complexity, or something your team has never attempted? Plot it on the x-axis accordingly.
  2. How important is it? Determine where it sits in your organization’s strategic priorities. Does it directly impact initiatives from the board or company owners? Does it enable new technical capabilities? Identify who sponsors it and why. Set the bubble size based on the answer.
  3. How much impact will it have? Name the business outcome it drives: revenue growth, cost reduction, risk mitigation, or customer retention. Place it on the y-axis based on the group’s assessment.
  4. Does it modernize, optimize, or monetize? Assign the bubble color and check your portfolio balance. If every initiative targets optimization, you may be missing growth opportunities. If everything targets monetization, technical debt may be piling up.

Keep these questions high-level on purpose. TRP is qualitative by design. You’re calibrating relative priority, not producing detailed estimates. Focus on alignment, not solutioning. Save the how for after the group agrees on the what and the why.

4. Dos and don’ts

The following patterns are drawn from facilitation observations across TRP sessions run with AWS customers since its creation. They’re specific to what goes wrong (and right) in this particular conversation.

Do:

  • Establish your role at the start. Open with: “I’m here as a facilitator. My job is to help you reach a shared view – the decisions are yours.” This prevents the group from deferring to you and keeps accountability where it belongs.
  • Surface the “someone else’s problem” initiatives. Each team knows what matters to them but assumes another team owns the overlap. TRP puts both sides in the same room and forces them to name where their work ends and the other’s begins.
  • Break the “everything is number one” cluster. Teams that struggle to prioritize will plot every initiative in the same spot. When you see clustering, force relative comparison: no two initiatives can occupy the same position on the matrix.
  • Watch for portfolio imbalance. If every initiative maps to a single color, name it. An all-blue portfolio means no one is investing in growth. A healthy roadmap balances modernization, optimization, and monetization.
  • Redirect from “what it is” to “what it does.” Teams describe initiatives as technologies: “migrate our database,” “upgrade our instances.” Redirect to the business outcome. You can’t plot an initiative on the matrix until the group agrees on what it accomplishes.

Don’t:

  • Let the group solution. The most common failure mode in TRP is the group diving into architecture details mid-session. The moment someone says “well, for initiative 3 we’d need to refactor the data layer,” pull them back: “We’re deciding what matters, not how to build it. Let’s place it on the matrix first.”
  • Skip preparation. The second most common failure: walking in without a pre-populated list of initiatives. You will spend the hour defining them instead of prioritizing them. Even a rough list of five initiatives with one-sentence descriptions is enough to start.
  • Ignore missing data. If nobody can estimate cost or impact for an initiative, flag it. That gap tells you something: you can’t prioritize what you can’t size. These are the initiatives that need a discovery conversation before they can be placed.

5. Close with next steps

Assign the number one priority a point person and set specific dates for next steps. Repeat for each initiative in priority order. Every initiative on the matrix should leave the session with an owner and a next action, even if that action is “revisit in Q3.”

After the session

Treat the matrix as a living document, not an annual artifact. A formal review cadence of at least once per year is a floor, not a target. The real question is: what triggers an out-of-cycle review? Based on patterns across TRP engagements, the answer is any of the following:

  • A major strategic shift – new leadership, a market pivot, an acquisition.
  • A failed or stalled initiative that changes the cost or complexity picture.
  • A significant budget change that reorders what’s feasible.
  • A new initiative that clearly belongs in the upper-left quadrant and displaces existing priorities.
  • A completed initiative that frees capacity and opens room to pull forward work from the upper-right.

When any of these occur, call a TRP session. The matrix is the mechanism for keeping your architecture decisions aligned with a business that doesn’t stand still.

As your prioritized initiatives break down into epics and themes, use the matrix to drive your architecture decision-making throughout the year. Share it with executives, delivery teams, and partners. Before TRP, you justified priorities in meetings and emails that nobody could find later. After TRP, you have a single artifact that documents what was decided, why, and in what order.

Conclusion

Since its creation, TRP has been run with AWS customers of all sizes across industries. That volume is the source of the practitioner patterns in this post, not just a credibility number. Customers consistently surface 4–7 initiatives they hadn’t previously articulated or prioritized as a group. That finding alone is worth one hour of your time.

For example, Zinnia, a leading insurance technology company that processes over 55 percent of digital annuity sales in the U.S., used TRP to prioritize the most critical workloads in their migration to AWS. By identifying their core order entry platform, AnnuityNet, as the highest-impact initiative, they focused resources there first before tackling their data warehouse and commission systems. Within 16 months, Zinnia completed the migration and now processes over 55 percent of digital annuity sales in the U.S. on AWS infrastructure.

The biggest risk in architecture isn’t the technology. It’s that your team isn’t on the same page. TRP gives you a repeatable way to fix that in one hour. Gather your stakeholders, bring your initiatives, ask the four questions, and walk out with a shared roadmap. If you want facilitation support, reach out to your AWS account team. For deeper guidance on the workloads you prioritize, explore the AWS Architecture Center.


About the authors

Enforcing the First AS in BGP AS_PATHs

Post Syndicated from Bryton Herdes original https://blog.cloudflare.com/enforce-first-as-bgp/

Some recent route hijacks reported by Spamhaus captured our attention. In many of these hijack attempts, an apparent bad actor took advantage of unused autonomous system numbers, or ASNs. Notably in these hijacks, the actor appears to be creating fake AS_PATHs toward destinations, misdirecting traffic down an unexpected path. 

By creating forged AS_PATHs, the hijacker is attempting to lead traffic somewhere it isn’t normally meant to go while also trying to conceal their identity. A hijacker could strip enough information away from a network path that they could pretend to be the origin of a Border Gateway Protocol (BGP) prefix themselves. Attackers can use this hijacked route to intercept traffic and for other nefarious purposes.

There is a simple solution for these cases: basic verification that a BGP peer autonomous system (AS) always includes their network as the “First AS” in an advertised route. To get a sense of how well these safeguards are implemented, we stress-tested several major networks and researched their BGP implementations. Read on to see what we learned.

Examining route hijacks involving forged paths

The idea that an actor is creating fake AS_PATHs is supported when we take a closer look at implausible AS relationships in the path. For example, let’s examine one of the hijacks reported by Spamhaus, involving a prefix belonging to Orange S.A., the French telecom company. Using the monocle tool, we can easily find a BGP UPDATE message related to the hijack:

➜  ~ monocle search --start-ts 2026-04-13T00:20:00Z --end-ts 2026-04-13T00:23:59Z --prefix 90.98.0.0/15 --collector rrc26 --json
{
  "aggr_asn": null,
  "aggr_ip": null,
  "as_path": "48237 1299 199524 270118 17072 41128",
  "atomic": false,
  "collector": "rrc26",
  "communities": null,
  "local_pref": 0,
  "med": 0,
  "next_hop": "185.1.8.3",
  "origin": "IGP",
  "peer_asn": 48237,
  "peer_ip": "185.1.8.3",
  "prefix": "90.98.0.0/15",
  "timestamp": 1776039612.0,
  "type": "ANNOUNCE"
}

We know AS1299 (Arelion) is a Tier 1 network, meaning every AS on the right-hand side in the path is describing an upstream (customer-to-provider) relationship. This implies that AS17072 is a transit provider for AS41128, AS270118 for AS17072, and AS199524 for AS270118. If we take a closer look at these networks:

  • AS41128 is an unused ASN belonging to Orange France

  • AS17072 is an ISP primarily based in Mexico

  • AS270118 is a hosting provider based in Mexico

  • AS199524 is Gcore, a provider with a global peering presence

The order of the ASes in the message above would suggest that an unused Orange France AS is buying transit from Mexican ISPs, which is then upstreamed to Gcore and Tier 1 providers – which would be quite odd.

In another instance, a reported hijack for prefixes 47.1.0.0/16 and 47.2.0.0/16 from origin AS36429 even included Cloudflare’s main ASN, 13335, in the AS_PATH, “199524 270118 17072 13335 36429”. We can view examples of these BGP UPDATEs in the MRT Explorer from Cloudflare Radar:


We can authoritatively confirm that we (Cloudflare, AS13335) have no adjacency with the now-unused AS36429 owned by Charter. This means this was a forged path by the hijacker that included Cloudflare’s ASN as one of the fake upstream networks in advertisements propagated toward Gcore (AS199524). Further, Spamhaus correctly pointed out that all the hijack routes led to a network behind Gcore peering in Chicago, never actually traversing the Mexican ISPs or Cloudflare’s network in the forwarding path.

Because of this, we can reasonably conclude these paths are forged up until the leftmost common AS, which in this case is AS199524, as the rest of the path seems implausible. We believe what is happening here is the result of a specific strategy by the hijacker, involving the following steps:

  1. Originate BGP announcements for “parked” prefixes

  2. Forge the AS_PATH completely, without including the hijacker’s own local ASN

  3. Advertise these routes to Gcore, AS199524

In these hijacks it appears Gcore (AS199524) skips the verification and enforcement of the First AS matching the expected customer’s ASN. (We’ll look at why it might skip those steps later in this post.) As a result, the forged path is accepted and the hijacked prefixes are propagated to upstream providers and peers.

While Autonomous System Provider Authorization (ASPA) will help invalidate these forged paths, attackers may bypass it by only including an RPKI-ROV-valid origin AS, or a legitimate ASPA upstream AS. To stop these specific hijacks, we must rely on a different protection mechanism already built into BGP: First AS checking and enforcement.

The importance of First AS checking

Routing traffic across the Internet is a bit like shipping a package. When the package is shipped, a log is kept of every courier that handles it. In BGP, this is called the AS_PATH (Autonomous System Path) and it tracks each network in the path of that route.

The AS_PATH attribute in BGP is used for path selection. This selection algorithm determines which route to a destination traverses the best list of hops, where “best” is defined by multiple variables. It is also used for loop prevention, where networks can decide not to accept paths that have already traversed their own network. Aside from keeping a record of the networks a BGP UPDATE, and therefore route, will traverse, the AS_PATH can also be examined by operator-configured routing policies to route around or purposely through a given AS – for example to avoid BGP anomalies having unexpected impact.

BGP was built on trust, and the AS_PATH can be easily manipulated – whether for seemingly legitimate reasons such as AS prepending to move traffic around, or nefarious reasons such as shortening it to artificially attract traffic or perform origin attacks.

Let’s look at how these two types of malicious BGP manipulations are carried out. 

Example 1: Forged origin attacks

  • AS64506 cryptographically signs their routes with an RPKI ROA (Route Origin Authorization) record, to prevent route origin hijacks.

  • AS64506 also creates an ASPA object, specifying only AS64503 as a valid provider

  • AS64505 manipulates their AS_PATH to strip AS64505 and originate with AS64506

  • AS64502 does not enforce the First AS


The route appears RPKI-ROV valid and is the shortest path, effectively hijacking traffic with the route. AS64506 has done everything correctly by specifying a valid ROA for a prefix advertisement, and has even configured an ASPA object consisting of their sole provider AS64503.

Unfortunately, the hijacker running AS64505 is still able to attract traffic meant for AS64506. Even if AS64501, the customer, and AS64502, their provider, run ASPA validation, they will not find an invalid path, because there is no valley in the path “64502 64506”. In other words, AS64505 by way of not even including their own ASN in the AS_PATH is able to pretend they are AS64506 with no intermediate AS hop.

The correct way of preventing this hijack with existing tools is to enforce the First AS in the AS_PATH. Once enforcing this rule, AS64502 would properly drop the route from AS64505.

Example 2: Shortening the AS_PATH to attract traffic

  • AS64506 has two transit providers: AS64503 and AS64505.

  • AS64505 bills their customer AS64506 based on traffic usage ratios.

  • AS64505 strips itself from the path, and their peer AS64504 does not enforce the First AS.


The BGP path selection algorithm now chooses the route via AS64504 as the best path from AS64501. AS64506 pays both of their providers, AS64503 and AS64505, to deliver traffic from the Internet. However, now AS64505 provides a shorter BGP path from far-end sources, meaning AS64505 will process all the traffic toward AS64506 and be paid for doing so, and AS64503 will not be paid at all.

These BGP vulnerabilities can be solved very simply by enforcing the First AS to match the peer AS in a received AS_PATH.

When an operator configures a BGP neighbor, they must set the remote AS of the network they are interconnecting with. If the First AS in the AS_PATH does not match this value, then the path has been manipulated. The First AS enforcement procedure is outlined in Section 6.3 of RFC 4271 very clearly as:

“If the UPDATE message is received from an external peer, the local

system MAY check whether the leftmost (with respect to the position

of octets in the protocol message) AS in the AS_PATH attribute is

equal to the autonomous system number of the peer that sent the

message. If the check determines this is not the case, the Error

Subcode MUST be set to Malformed AS_PATH.”

RFC 7606 later revises how error-handling should be implemented by vendors, suggesting that routes containing malformed AS_PATHs should be dropped via treat-as-withdraw method. This allows routers to drop specific prefixes with malformed attributes without disrupting the entire BGP session.

The current ASPA draft clearly calls out the importance of First AS enforcement, stating that ASPA cannot handle paths where sufficient AS_PATH information is lacking due to malformed announcements. Enforcing First AS in AS_PATHs is a must for Internet routing security.

Measurement by breaking the First AS rule on purpose

Instead of sticking to theoretical failure cases and past public incidents about violations of the First AS rule, we wanted to measure for ourselves how widely these AS_PATH violations could be accepted on the Internet. To do so, we set up BGP announcements to neighbors where we purposely violated the rule ourselves. Here is what we did:

  1. Allocated two IP prefixes, one for IPv4 and one for IPv6, to advertise to Tier 1 External BGP (EBGP) neighbors 

  2. Purposely prepended the test prefix advertisements to Tier 1 neighbors with a Cloudflare-owned, non-13335 ASN (AS402542) in front of 13335

For example, we advertised the prefixes to AS1299 from our normal BGP session in Geneva. Our local AS is AS13335, but we include AS402542 clearly as the First AS in the AS_PATH.

[email protected]> show configuration policy-options policy-statement 4-TELIA-ACCEPT-EXPORT term ADV-FIRST-AS-PROBE-CR-1695522
from {
    community ANYCAST-ROUTE;
    prefix-list fl_first_as_prober;
    route-type internal;
}
then {
    origin igp;
    as-path-prepend 402542;
    next-hop self;
    accept;
}

[email protected]> show route advertising-protocol bgp <redacted_1299_ip> 162.159.82.0/24 detail | grep "AS path: "
     AS path: 402542 [13335] I

With this configuration, our expectation is that: 

  1. Networks that do enforce-first-as will quietly drop the route via RFC 7606 withdrawal method 

  2. Networks that do not enforce-first-as will accept the route and install it for forwarding toward our test prefixes

Either result will be visible in BGP public route views. It was initially our goal to implement a continuous announcement of prefixes toward all peers that would purposely violate the First AS rule in announcements, and give everyone a tool to check which ISPs validate First AS and those which do not. However, we found there are still networks that have not implemented the guidance published in RFC 7606 when receiving malformed BGP AS_PATHs, and would reset BGP sessions instead of a treat-as-withdraw behavior. This meant we could not safely implement a continuous set of announcements that violate the First AS rule without impacting real traffic to Cloudflare, which we obviously can’t do.

But we can take a closer look at the networks whose policies make the biggest impact: Tier 1 networks. These networks make up the backbone of the Internet and have the largest AS customer cones of anyone, meaning hijacks or malformed paths by these peers have the broadest significance. Let’s start by examining the normal propagation of an anycast prefix, 1.1.1.0/24, across the Tier 1 networks.


The propagation of 1.1.1.0/24 looks how you would expect – it is directly reachable by every Tier 1 network that Cloudflare has a direct adjacency with currently.

Now, let’s compare that with our purposely malformed announcement of the prefix 162.159.82.0/24: 


Note: AS5511 (Orange S.A.) is not pictured above due to its limited presence in public route views, but it was a part of our testing and measurements.

The prefix is propagated very differently from 1.1.1.0/24 – far fewer Tier 1 networks are accepting the announcement directly from Cloudflare (in this case from AS13335 with AS402542 prepended). Based on the criteria of our test mentioned earlier, these are the results we found.

Tier 1 networks that are enforcing First AS rule (by dropping the invalid announcements): 

  • AS174 (Cogent)

  • AS1299 (Arelion)

  • AS3257 (GTT)

  • AS3491 (PCCW)

  • AS5511 (Orange S.A.)

  • AS6453 (Tata)

  • AS7018 (AT&T)

Tier 1 networks that are not enforcing the First AS rule (by accepting and installing the prefixes): 

  • AS701 (Verizon)

  • AS2914 (NTT)

  • AS3356 (Lumen/Colt/Cirion)

  • AS6461 (Zayo)

  • AS6762 (Sparkle)

  • AS6830 (Liberty Global)

  • AS12956 (Telefonica)

With our testing, we uncovered a troubling reality: Half of the Tier 1 networks are vulnerable to hijacks that violate the First AS rule.

While we only tested Tier 1 networks in this measurement study, there’s no doubt there are many non-Tier 1 networks that also break the First AS rule.

We noted that the majority of the Tier 1 networks failing the First AS violation test are running Juniper Networks routers, identified by the peers’ MAC addresses.

This highlights that the default behavior of vendors defines how secure a network is “out of the box” against First AS violation-based attacks. Let’s go over some of the BGP implementations and their defaults to have a better understanding of who is protected by default, and who isn’t.

BGP implementations and default behaviors

The chart below lists major routing/networking vendors and their BGP policies. Here, “Yes” means the BGP implementation by default enforces First AS, which is good. “No” means the BGP implementation is vulnerable by default. 

BGP implementation

First AS enforced by default

Documentation

Cisco IOS/XE/XR

Yes 

bgp enforce-first-as

Junos OS / Junos OS Evolved

No

enforce-first-as

Arista EOS

Yes

bgp enforce-first-as

Nokia SR OS

No

enforce-first-as

Huawei

Yes

check-first-as

Extreme SLX-OS

No

enforce-first-as

RouterOS

No

Configuration not available

BIRD

No

enforce first as

OpenBGPD

Yes

enforce neighbor-as

FRR

Yes (since October 2023 patch)

bgp enforce-first-as

The lack of default enforcement from some vendors may stem from the only valid use case where the First AS should not be enforced on External BGP (EBGP) sessions: Internet Exchange (IX) route servers.

A route server is responsible for transparently (without appending its AS to the AS_PATH) distributing routes between peers on the fabric. This ensures peers do not have to configure new BGP sessions every time a network joins the fabric – instead they can peer with just the route server.

In reality, most production networks have far more sessions with neighbors who are not transparent IX route servers than neighbors who are. It makes much more sense to configure “no enforce-first-as” on a handful of route-server sessions than to manually enable “enforce-first-as” on every single peer in your network.

While a “safe by default” approach is best for protecting against First AS violations, it is generally a steep hill to climb trying to convince vendors to change longstanding defaults. Vendors would also need to introduce a method of doing this gracefully, so as to not impact the IX route server BGP sessions that require “no enforce-first-as” settings to successfully receive routes.

Safer Internet routing with your help: enforce the First AS

Attackers will purposely malform AS_PATHs to slide around BGP security mechanisms. Even RPKI-based ASPA path validation will not be able to protect us from forged-origin hijacks where the path has been totally stripped of everything but the origin AS, leaving nothing for ASPA to invalidate. 

The good news is we already have a mitigation for these cases: we can verify the First AS matches BGP peer AS and always enforce it. Refer to the corresponding “Documentation” column in the above table we have provided. It should be safe to enforce First AS on any External BGP (EBGP) session besides those facing an IX route server neighbor.

If you are a network operator, please enforce First AS on your routers today to protect your network and the wider Internet.

If your router vendor or choice of BGP implementation has a default of enforcing First AS, you’re already safe and should be rejecting any First AS violations.

By working together, we can make the Internet safer from these kinds of hijacks.

The collective thoughts of the interwebz