Powering generative AI/ML solutions with AWS Outposts Servers at Edge locations

Post Syndicated from Art Baudo original https://aws.amazon.com/blogs/compute/powering-generative-ai-ml-solutions-with-aws-outposts-servers-at-edge-locations/

This post is written by Brian Daugherty, Principal Solutions Architect, Leonardo Queirolo, Senior Cloud Support Engineer, and Reet Kundu, Senior Cloud Support Engineer

Powering generative AI/ML solutions with AWS Outposts Servers at Edge locations

Many organizations are vigorously pursuing generative AI initiatives in the Amazon Web Services (AWS) cloud today because generative AI drive advances in productivity, efficiency, and innovation.

However, for some organizations, industries, and use-cases, there is a compelling need to deploy generative AI not only in the cloud, but also at the edge due to factors such as application latency and proximity to critical data.

AWS Outposts can help these organizations address this need by extending AWS services to the edge, such as generative AI services, while maintaining the same tooling and orchestration capabilities found in AWS Regions.

Industrial and manufacturing use-cases are a primary focus of AWS Outposts Servers, which can be deployed on-premises to minimize latency and make sure of stable connectivity between orchestration and control applications such as Manufacturing Execution Systems (MES) or Supervisory, Control, and Data Acquisition (SCADA) systems and the industrial processes they control.

This post explores how to use Outposts Servers to power generative AI solutions at the edge. The example use-case demonstrates real-time anomaly detection for industrial processes and an edge-based human machine interface including a small language model (SLM) with Retrieval-Augmented Generation (RAG) to guide operators on best practices for problem resolution. Although the use case is specific, the tools and methods can be applied to many other edge generative AI use cases.

For a hands-on experience to implement this solution using Outposts Servers, fill out this form with your contact information and we will get back to you with lab access. A detailed step-by-step guide to develop the hands-on example is available in this link.

Architecture overview

As depicted in the following diagram, the solution is distributed in three modules. The first module (1) guides you to establish low-latency, local connectivity to an MQTT broker within the same on-premises network as your lab Amazon Elastic Compute Cloud (Amazon EC2) instance. You configure essential AWS infrastructure (Amazon S3, AWS Secrets Manager, AWS Identity and Access Management (IAM)) to manage the deployment, authentication, and permissions of AWS IoT Greengrass components. You deploy a component to the existing Greengrass core device on your lab EC2 instance to retrieve synthetic Arduino sensor data from the broker using its Local Network Interface (LNI).
Figure 1 – Architectural diagram of the solution to perform low-latency, local inference through generative AI and ML models running on Outposts Servers

Figure 1 – Architectural diagram of the solution to perform low-latency, local inference through generative AI and ML models running on Outposts Servers

In the second module (2), you deploy a component that detects anomalies in sensor data in real-time. This component runs on the Outposts Server EC2 instance hosting the AWS IoT Greengrass core device, performing inference directly at the edge. You use synthetic Arduino sensor data to generate anomalies and observe them being detected by the model. You configure an IoT rule to send the anomaly count to the Amazon CloudWatch Dashboard in the Region. This provides centralized monitoring, while making sure that the raw data and any sensitive data remains processed locally at the edge where latency and connectivity are assured.

In the third module (3), you deploy a comprehensive edge computing solution to enhance operational visibility and decision-making capabilities at the local level. The solution includes a local dashboard that provides a real-time telemetry to display raw sensor data and detect anomalies. A Virtual Assistant is integrated with SLM to provide context-aware response from the factory data and forecasting capability to predict future anomaly trends.

Outposts Server

Outposts Servers provide fully managed AWS infrastructure, services, APIs, and tools for edge use-cases . Two form factors are available: 1U servers are AWS Graviton based, and 2U servers are third-generation Intel Xeon Scalable processor based.

Enabling anomaly detection at the edge

Outposts Servers allow local sensor data processing for low-latency anomaly detection and resilience against external connectivity issues, as shown in the following figure. The example uses synthetic Arduino devices with gyroscope sensors data, simulating industrial sensors sending data to an MQTT Broker on an EC2 instance in the Outposts Server. Gyroscope data is used in various monitoring systems, such as motion control systems, orientation detection, stability, and balance mechanism. The Lab EC2 instance fetches sensor data through the MQTT client and processes it using a machine learning (ML) model for anomaly detection.

Figure 2 – Architectural diagram showing data flow from Arduino sensors through MQTT broker and EC2 on Outposts Server to perform local inference

Figure 2 – Architectural diagram showing data flow from Arduino sensors through MQTT broker and EC2 on Outposts Server to perform local inference

Outposts server LNI

Local communication between synthetic Arduino sensor data, MQTT broker, and the Lab EC2 instance uses LNI, providing Layer 2 presence on the local network. The setup necessitates creating an Elastic Network Interface (ENI) on an Outposts subnet with the LNI enabled, attaching it to the Lab EC2 Instance, and verifying connectivity through the MQTT Broker’s LNI IP using the command ping -c 5 <MQTT_BROKER_LNI_IP> . This enables direct, low-latency communication between components crucial for this edge computing scenario.

AWS IoT Greengrass

AWS IoT Greengrass is an open source edge runtime and cloud service for device software management and deployment supported on Outposts Server. This hybrid approach combines the benefits of edge computing with centralized management, such as:

  • Centralized artifact management: store and version component artifacts in Amazon S3, enabling consistent deployment across multiple edge locations.
  • Secure configuration: use Secrets Manager to handle sensitive information and credentials unique to each edge location.
  • Fleet monitoring: use CloudWatch for centralized monitoring and logging across your distributed edge deployment.
  • Automated updates: deploy software updates and model improvements across your edge fleet through AWS IoT Greengrass component management.

AWS IoT Greengrass components, such as the one used for the anomaly detection, can be deployed to EC2 instances running on Outposts Servers. After configuring the Lab EC2 instance with Greengrass, you can download components from an S3 bucket. The first component deploys a subscriber for receiving synthetic Arduino sensor data through MQTT broker configuration, as shown in the following configuration line.

{
    "broker": "<MQTT_BROKER_LNI_IP>",
    "port": 1883,
    "client_id": "OutpostsServerMLEdge_<workshop-id>",
    "sensor_name": "ArduinoSensor_<arduino-id>",
    "topic": "arduino/ArduinoSensor_<arduino-id>/3-axis-rotation",
    "thing_name": "OutpostsServerMLEdge_Sub",
    "mqttauth_creds": "<ARN_SECRET_MQTT_CREDENTIALS>"
}

The second component is the Anomaly Detector artifact that processes sensor data in real-time, detects anomalies using a pre-trained model, and sends anomaly counts to AWS IoT Core. Key components include:

  • edge_application.py: script for processing sensor data, performing local inference using pre-trained model in ONNX format, and publishing anomaly counts to AWS IoT Core. It is used for local inference, so that the raw data is not exposed outside the Edge location.
  • model: directory storing “arduino.onnx”, a pre-trained Autoencoder model for anomaly detection.
  • statistics: directory storing the values of different statistical functions (for example, mean and standard deviation) from the training phase and used by edge_application.py for inference.
  • functions: directory storing the code of the functions, such as the code to publish to the AWS IoT Core.

After deployment of subscriber and detector components, the Lab EC2 instance processes synthetic gyroscope data from Arduino sensors, detecting anomalies during X, Y, or Z axis movement:

Real-time Dashboard showing sensor data and anomaly count

Real-time anomaly detection results from gyroscope sensor data across X, Y, and Z axes.

Building upon the foundation of Outposts Server, Local Network Interface (LNI), and AWS IoT Greengrass, this solution extends beyond anomaly detection to deliver comprehensive edge AI capabilities. These core components work together to enable advanced generative AI applications at the edge, as demonstrated in the following sections.

Edge generative AI applications with Outposts Server

The solution demonstrates the implementation of key edge generative AI capabilities:

  • Contextual virtual assistance: providing on-site personnel with AI-powered guidance and troubleshooting using local operational data, SOPs, and technical documentation.
  • Predictive insights: using foundational models (FMs) to forecast future trends based on historical data, enabling proactive planning and optimization.
  • Real-time operational dashboard: integrating sensor data visualization with AI-powered insights and forecasts in a unified local interface that maintains operations during connectivity interruptions.

1. Contextual virtual assistance at the edge

The solution implements the virtual assistant through an AWS IoT Greengrass component. The following is a snippet from the component recipe showing the key configuration parameters:

{
    "ComponentConfiguration": {
        "DefaultConfiguration": {
            // Workshop defaults, SLM runs locally on same EC2 instance
            "SLM_endpoint": "http://localhost:8080",  
            "embedding_model": "all-MiniLM-L6-v2",    
            "knowledge_base_directory": "Factory_Data" 
        }
    }
    // Additional component recipe configurations...
}

Although the solution demonstrates a streamlined setup with the SLM running on the same EC2 instance as the AWS IoT Greengrass component, the architecture enables flexible deployment options through the SLM_endpoint configuration. Organizations can:

  • Deploy the SLM on a dedicated resource in their on-premises network (for example "http://<LNI-IP-DEDICATED-RESOURCE>:8080")
  • Use existing hardware infrastructure accessible through LNI
  • Scale SLM compute resources independently from the AWS IoT Greengrass component
  • Maintain low-latency communication through local network interfaces

The implementation showcases a streamlined approach to RAG at the edge through three main components:

Knowledge base management: the solution uses Amazon S3 for document storage (PDFs, Markdown, text) with automatic edge deployment through AWS IoT Greengrass. Alternatively, you can also choose to store the documents in a local storage. A vector database, such as ChromaDB, handles local vector storage and similarity search, enabling efficient knowledge base updates with centralized control.

Flexible query processing: the implementation provides a streamlined interface for RAG management, allowing users to load site-specific knowledge bases and switch between basic SLM and RAG-enhanced responses with local context:

if prompt := st.chat_input("Question"):
if "db" in st.session_state:
        prompt = augmentPrompt(prompt, st.session_state["db"])
response = getStreamingAnswer(prompt, SLM_MODEL_ENDPOINT)

Modular SLM integration: The solution uses a standardized chat completion API, which allows for integration with different SLM deployments while maintaining a consistent interface across the edge fleet:

def getStreamingAnswer(question: str, endpoint: str):    
    chat_template = '<|user|>\n{input} <|end|>\n<|assistant|>'
    payload = {
        'messages': [{'content': f'{chat_template.format(input=question)}'}],
        'stream': True
    }
    SLM_URL = endpoint + '/v1/chat/completions'

This flexible architecture can be adapted for many industrial use-cases where latency and proximity to local data-sources and processes are critical.

2. Predictive insights using local models

The solution demonstrates forecasting capabilities using Chronos, a small and efficient time series forecasting model that can run entirely at the edge. The following solution implementation shows how to process historical data and generate predictions using Chronos on the AWS IoT Greengrass component deployed on Outposts Server:

# Load Chronos model locally on the Outposts Server
pipeline = ChronosPipeline.from_pretrained(
    "amazon/chronos-t5-small",
    device_map="cpu",
    torch_dtype=torch.bfloat16,
)
# Generate forecasts with confidence intervals
def predict_anomaly_count_data():
    forecast = pipeline.predict(
        context = torch.tensor(df["total_anomalies"]),
        prediction_length = pred_length,
        num_samples = n_samples,
        top_k = 50,
        top_p = 1.0,
    )
    
    # Calculate confidence bounds
    low, median, high = np.quantile(forecast[0].numpy(), [0.1, 0.5, 0.9], axis=0)

Although the solution uses sample data for the demonstration, this architecture allows organizations to process complex, real-time data at each edge location. Companies can choose to upload only aggregated metrics to CloudWatch or Amazon QuickSight for fleet monitoring and BI analysis, making sure that sensitive raw data remains secure at the edge.

3. Real-time operational dashboard

The solution showcases a resilient monitoring solution where all inter-component communication occurs within the local network and processing happens on the Outposts server, making sure of full functionality during external network interruptions. The dashboard is accessible through the LNI of the Outposts server, allowing local clients to maintain access through the LNI IP address even when connectivity to the Region is lost.

Through a unified interface, the dashboard provides:

  • Real-time visualization of sensor readings
  • Anomaly detection results from the local ML component
  • AI-powered insights from the local SLM
  • Trend forecasting from the Chronos model

Real-time Dashboard showing sensor data and anomaly count

Real-time Dashboard showing sensor data and anomaly count

Virtual Assistant leveraging Factory Data to provide contextualized answers

Virtual Assistant leveraging Factory Data to provide contextualized answers

Chronos forecasting anomaly count based on historical data

Chronos forecasting anomaly count based on historical data

Conclusion

The implementation demonstrates how AWS Outposts Server enables organizations to use both traditional ML and advanced generative AI capabilities at the edge for a variety of industrial and manufacturing use-cases where low-latency and proximity to sensitive or real-time data are business- and process-critical.

To get started with AWS Outposts and explore use cases like this edge AI solution, fill out this form and our team will contact you with lab access and additional guidance. For a detailed walkthrough of this specific edge AI example, refer to this step-by-step guide. For more information about AWS Outposts Server, see the AWS Outposts Server User Guide.

Automating AWS Private CA audit reports and certificate expiration alerts

Post Syndicated from Santosh Vallurupalli original https://aws.amazon.com/blogs/security/automating-aws-private-ca-audit-reports-and-certificate-expiration-alerts/

Today’s organizations rely heavily on secure and reliable communication channels and digital certificates play a crucial role in securing internal and external-facing infrastructure by establishing trust and enabling encrypted communication. While public certificates are commonly used to secure internet applications, many organizations prefer private certificates for internal resources to maintain confidentiality and enable custom configurations that public certificates don’t support. AWS Private Certificate Authority (AWS Private CA) offers a comprehensive solution to create and manage private certificate hierarchies within an organization’s public key infrastructure (PKI). AWS handles the heavy lifting of certificate authority (CA) management, allowing organizations to issue certificates for various use cases, including creating encrypted communication channels, authenticating clients, and cryptographically signing code. These certificates remain trusted within the organization, helping to ensure internal security without exposing them to the public internet.

AWS Certificate Manager (ACM) and AWS Private CA provide robust tools to issue and manage certificates seamlessly within AWS. However, as workloads evolve—spanning cloud native microservices, containerized environments, and hybrid edge deployments—the default certificate configurations might not meet every need. For instance, private TLS certificates requested using ACM come with a fixed 13-month validity period, which ACM tracks and renews automatically. But what if your organization requires certificates with custom validity periods such as short-lived certificates for ephemeral containers or certificates with extended durations for your on-premises systems? This is a common scenario for enterprises using modern architectures. You can gain significant advantages by creating and updating your certificates through AWS Command Line Interface (AWS CLI) or AWS SDKs. These powerful tools offer enhanced flexibility and integrate seamlessly with existing workflows.

Taking this efficiency even further, you can optimize your certificate management by bypassing the AWS Management Console, using the AWS CLI or SDK to generate certificates programmatically through their custom PKI pipelines.

You can use this automation-friendly approach to maintain full control over your certificate lifecycle, though it’s worth noting that ACM doesn’t inherently track the expiration of certificates that are issued using the acm-pca:IssueCertificate API, and aren’t requested using ACM. Lack of oversight on certificate expiration can lead to operational disruptions and compromise the accessibility of your applications. The AWS Private CA offers a powerful option to address this gap: the Generate audit report option. This option produces a detailed report of the certificates issued by your certificate hierarchy—including their expiration dates—regardless of how they were generated. However, with organizations managing vast numbers of certificates across multiple certificate hierarchies, manual report generation and review becomes impractical and unsustainable.

In this blog post, we guide you through a custom automation workflow that harnesses AWS Private CA audit reports to monitor certificate expirations proactively. The solution uses Amazon EventBridge, AWS Lambda, Amazon Simple Storage Service (Amazon S3), Amazon Simple Notification Service (Amazon SNS), and AWS Security Hub to generate daily reports, review them for expiring certificates, notify stakeholders, and generate log findings for centralized visibility. We’ve also included an AWS CloudFormation template to deploy this solution in your AWS environments, complete with step-by-step instructions. This approach can help ensure that you stay ahead of certificate expirations.

The challenge: Certificate management beyond the defaults

To understand why this solution matters, let’s explore the evolving needs of certificate management.

Certificates requested using ACM that are issued by your private CA through the console default to a 13-month validity period; a reasonable middle ground for many workloads. ACM tracks these certificates, monitors their expiration, and even automates renewals. This hands-off approach works well for standard cloud applications, but modern IT environments are rarely standard because of the diverse requirements of real-world use cases.

Consider these real-world examples:

  • Short-lived certificates: in containerized environments running on EKS or Amazon Elastic Container Service (Amazon ECS) certificates with validity periods of a few hours or days are increasingly common. Service meshes like Istio or Linkerd rely on short-lived certificates to secure pod-to-pod communication, reducing the threat surface if a key is compromised. A 13-month certificate might not be optimal for this use case.
  • Long-lived certificates: On the other hand, some workloads—often found in traditional or resource-constrained environments—benefit from certificates with extended validity periods. For instance, systems deployed in locations with unreliable or restricted network access might require longer-lived certificates to minimize the challenges of frequent renewals, which could disrupt operations or require manual intervention. Likewise, infrastructures running critical applications with minimal automation might lean towards multi-year certificates to reduce the administrative burden and maintain consistent security over time. In such cases, long-lived certificates offer a dependable solution, balancing security needs with operational simplicity and minimizing the frequency of maintenance tasks.

To address these needs, many organizations turn to their own continuous integration and delivery (CI/CD) pipelines and custom automation using AWS Private CA and ACM. Using AWS CLI or SDKs, you can use AWS Private CA to issue certificates that have custom validity periods tailored to their workload requirements.

Extending certificate monitoring beyond ACM integrated services

Even if certificates aren’t requested using ACM, you can optionally re-import the certificates into ACM. After the certificates have been imported, ACM begins tracking and monitoring them. However, you have the flexibility to decide which certificates to import. Certificates that aren’t imported into ACM will not be tracked by the service. These certificates won’t appear in the ACM console, their expiration events won’t trigger Amazon CloudWatch Logs and managed renewals of these certificates aren’t supported by ACM.

Without a centralized view, you must manually monitor expiration dates, a task that quickly becomes unmanageable as certificate volume grows. An expired certificate can lead to downtime (for example, a load balancer rejecting traffic). This is where the ability to generate an audit report from AWS Private CA can help you. It provides a comprehensive list of all the certificates issued by your CA, including serial numbers, issuance dates, and expiration dates. However, generating this report manually using the console and reviewing it daily isn’t scalable.

In the following section, we show you how to set up a more scalable, automated solution that will notify you when certificates need to be renewed.

Prerequisites

For this walkthrough, you need to have the following:

  • An AWS account
  • A private CA from AWS Private CA
  • An externally created certificate imported into ACM

Solution overview

This audit generation solution provides an automated, scalable, and integrated approach to generating and analyzing audit reports for certificates issued by AWS Private CA. It uses AWS services to monitor certificate statuses, detect impending expirations, and notify administrators while integrating findings into Security Hub for centralized security monitoring. The solution helps ensure timely awareness of expiring certificates; enhancing compliance and operational security.

The following figure shows the solution architecture. The process begins with an EventBridge rule (PCAReportRule) that triggers the audit report generation on a user-defined schedule (for example: daily). This rule invokes the first of the two Lambda functions: PCAauditReportLambdaGenerator. This function interacts with the AWS boto3 SDK to generate an audit report, capturing details of issued certificates. The report is formatted as a CSV file (with optional JSON support configurable in the Lambda function) and stored in a designated S3 bucket. To simulate expiration alerts for demonstration purposes, certificates can be issued with a validity period of less than 30 days, as opposed to the default 13-month validity of AWS Private CA certificates.

Figure 1: Solution architecture

Figure 1: Solution architecture

After the audit report is uploaded to the S3 bucket, an S3:PutObject event notification triggers the second Lambda function, PCAAuditReportLambdaProcessor. This function downloads the most recent report, parses the data in the CSV file, and analyzes the details to identify certificates that are expiring within the 30-day threshold. Upon identifying expiring certificates, the function sends a consolidated notification using an Amazon SNS topic PCASNSTopic, which supports subscriptions such as an email or an optional Amazon Simple Queue Service (Amazon SQS) queue for further processing. Simultaneously, the function integrates findings into Security Hub, providing a centralized view of expiring certificates for compliance tracking and security monitoring.

The architecture is deployed using a CloudFormation template, automating the setup of the core components—EventBridge, Lambda functions, an S3 bucket, an SNS topic, and Security Hub integration—into a cohesive system. Security Hub serves as a cloud security posture management service that provides organizations with a consolidated view of their security alerts and compliance status across your AWS accounts. It functions as a central dashboard where security data from various sources and AWS services is aggregated, enabling automatic assessment of resources against established security standards while helping teams prioritize security concerns throughout their environment. This design helps ensure scalability, flexibility, and minimal manual intervention, enabling users to modify the Lambda functions to support additional report formats (such as JSON) or adjust notification thresholds as required. It’s also worth noting that you can generate a report every 30 minutes.

Deploy the solution

With the prerequisites in place and an understanding of the architecture, you’re ready to deploy and test the automation workflow and run an audit report on-demand.

Deploy the CloudFormation template

  1. To get started, clone the following GitHub repo.
    ~ $ curl -O https://aws-security-blog-content.s3.us-east-1.amazonaws.com/public/sample/2526-monitor-private-ca-issued-certificates-aws-private-certificate-authority-eventbridge/ACM-PCA-Monitoring-cfn.yml  
    
    ~ $ ls 
    ACM-PCA-Monitoring-cfn.yml
    

    The ACM-PCA-Monitoring-cfn.yml CloudFormation template includes the following parameters, which allow you to customize the deployment:

    • CertificateAuthorityArn: The Amazon Resource Name (ARN) (<ARN_of_your_PrivateCA>) of your pre-existing private CA for which the audit report is generated.
    • S3BucketName: A new S3 bucket (<Name_of_s3_bucket>) where the audit report will be stored.
    • EventBridgeRuleName: The name of the EventBridge rule (<Name_of_EventBridgeRule>) to trigger the Lambda function (default value: PCAReportRule).
    • CronJobExpression: A cron expression (<Frequency_of_running_evaluation>) to define the schedule for report generation (default value: cron(0 21 * * ? *)).
    • SNSName: The name of a new Amazon SNS topic (<Name_of_SNS_Topic>) for expiration alerts (default value: PCASNSTopic).
    • SQSName: The name of a new Amazon SQS queue (<Name_of_SQS>) for expiration alerts (default value PCASQS).
    • EmailAddress: The email address for receiving notifications (<Email_to_Receive_alerts>).
    • CertificateExpirationThreshold: The threshold value in days (<Expiration_threshold_in_days>) to monitor for your certificate’s expiration (default value: 30).
  2. Run the following command to create the CloudFormation stack. Stack creation will take 2–3 minutes to complete.
    aws cloudformation create-stack \
    --stack-name PCAMonitoringWorkflow \
    --template-body file://ACM-PCA-Monitoring-cfn.yml \
    --capabilities CAPABILITY_NAMED_IAM \
    --parameters '[
        {"ParameterKey": "CertificateAuthorityArn", "ParameterValue": "<ARN_of_your_PrivateCA>"},
        {"ParameterKey": "S3BucketName", "ParameterValue": "<Name_of_s3_bucket>"},
        {"ParameterKey": "EventBridgeRuleName", "ParameterValue": "<Name_of_EventBridgeRule>"},
        {"ParameterKey": "CronJobExpression", "ParameterValue": "<Frequency_of_running_evaluation>"},
        {"ParameterKey": "SNSName", "ParameterValue": "<Name_of_SNS_Topic>"},
        {"ParameterKey": "SQSName", "ParameterValue": "<Name_of_SQS>"},
        {"ParameterKey": "EmailAddress", "ParameterValue": "<Email_to_Receive_alerts>"},
        {"ParameterKey": "CertificateExpirationThreshold", "ParameterValue": "<Expiration_threshold_in_days>"}
    ]'


  3. When stack creation is complete, you’ll get an email asking you to confirm your subscription to the specified SNS topic from the previous step.
    Figure 2: Sample notification email sent by Amazon SNS

    Figure 2: Sample notification email sent by Amazon SNS

Test the automation workflow

  1. Test the automation workflow by creating a private certificate that will trigger your expiration alert system. To do this, you’ll generate a private certificate using your private CA with an intentionally short expiration period. The certificate should expire before the threshold you set in the CloudFormation template (the default is 30 days). For example, if you kept the default 30-day threshold, the following code will generate a certificate that expires in 20 days, which should trigger the notification system:
    #Generate a Private Key
    ~ $ % openssl genrsa -out private-key.pem 2048
    
    #List the private key
    ~ $ % ls 
    private-key.pem
    
    #Generate a Certificate Signing Request (CSR)
    ~ $ % openssl req -new -key private-key.pem -out csr.pem -subj "/C=US/ST=Ohio/L=Columbus/O=MyOrg/OU=IT/CN=mydomain.com"
    
    
    #Issue a Certificate
    ~ $ % aws acm-pca issue-certificate --certificate-authority-arn <specify_arn_of_PrivateCA> --csr "$(cat csr.pem | base64 | tr -d '\n')" --signing-algorithm "SHA256WITHRSA" --validity Value=20,Type="DAYS"
    
    {
     "CertificateArn": "arn:aws:acm-pca:us-east-2:XXXXXX:certificate-authority/7574de75-e5fd-47d0-a4e2-3afc3c0ba4b3/certificate/87980cc7a1cca819dd9082e6cd360c65"
    }
    
    
    #Retrieve the Issued Certificate
    ~ $ % aws acm-pca get-certificate --certificate-authority-arn <specify_arn_of_PrivateCA> --certificate-arn <specify_arn_of_Certificate_generated_above> --output text > certificate.pem
    

Note: You’ll receive alerts for all certificates that are approaching expiration, even for certificates that are requested using ACM, which support managed renewal. You can compare the ARN of the expiring certificate to your list of requested certificates in the ACM console, or to the results of the acm:ListCertificates API.

With the audit report infrastructure deployed and a test certificate created within your expiration threshold, the next step is to trigger the automation workflow to generate and process the audit report.

Run an audit report on-demand

To test the EventBridge rule PCAReportRule, you’ll temporarily modify it to run every 30 minutes. When you’re done testing, you can revert it back to the original scheduled that you specified in the CloudFormation template parameters.

  1. In the Amazon EventBridge console, choose Rules in the navigation pane. Select PCAReportRule and then choose Edit rule.
  2. Select Define schedule.
    1. Under Schedule pattern, select A schedule that runs at a regular rate…
    2. Under Rate expression, for Value enter 30, and for Unit, select Minutes.
    3. Choose Next.
    Figure 3: Edit the schedule of PCAReportRule for the test

    Figure 3: Edit the schedule of PCAReportRule for the test

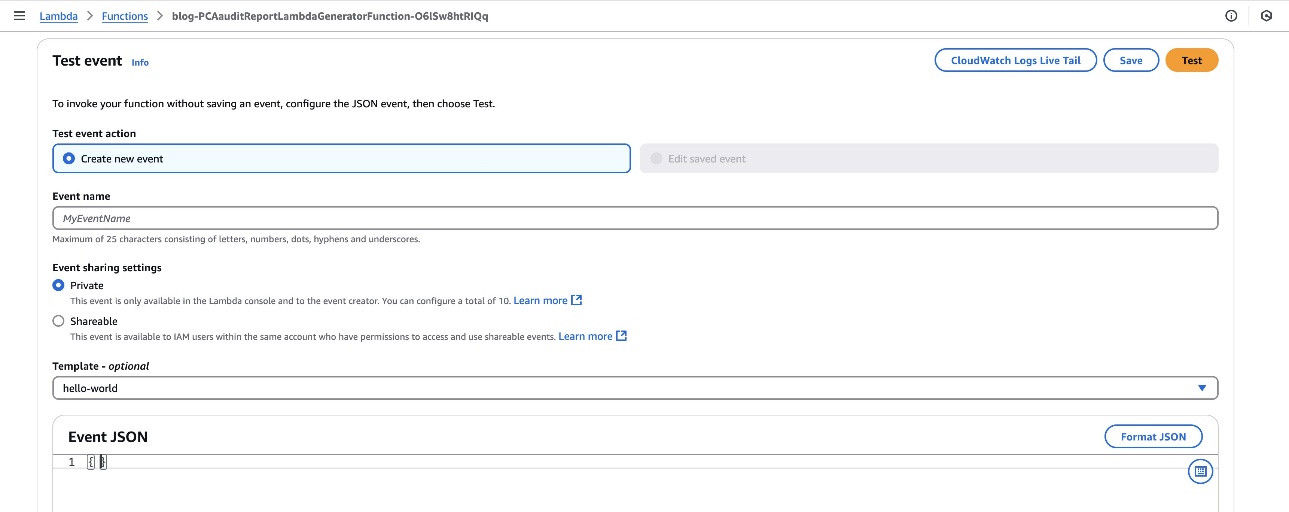
  3. For an immediate test, you can also trigger this workflow from the Lambda console.
    1. In the Lambda console, choose Functions in the navigation pane, and then select the PCAauditReportLambdaGenerator Lambda function.
    2. Choose the Test tab, leave the default values for the Event JSON.
    3. Choose Test at the top of the window.
    Figure 4: Use the console to trigger a test

    Figure 4: Use the console to trigger a test

  4. This Lambda function generates an AWS Private CA audit report and saves it to the specified S3 bucket at the audit-report prefix. To verify this, navigate to the Amazon S3 console and choose Buckets from the navigation pane.
  5. Select the bucket that you created when you ran the CloudFormation template and verify the reports in the audit-report folder.
    Figure 5: The audit report is saved to the specified S3 bucket

    Figure 5: The audit report is saved to the specified S3 bucket

  6. When an audit report is uploaded to the S3 bucket, it automatically triggers the PCAAuditReportLambdaProcessor Lambda function through S3 event notifications. The function analyzes the audit report to identify any certificates approaching expiration. If certificates are found that will expire within the specified threshold (30 days by default), the function automatically creates detailed findings in Security Hub for tracking and monitoring purposes. These findings include important details such as the certificate ARN, expiration date, and severity level.
  7. Because you created a test certificate that expires in 20 days (which is within the test threshold), the automation workflow will detect this and generate corresponding findings in Security Hub. To see the results go to the Security Hub console and choose Findings in the navigation pane.
    Figure 6: View the audit report findings in Security Hub

    Figure 6: View the audit report findings in Security Hub

  8. After creating Security Hub findings, the Lambda function sends detailed certificate expiration alerts through Amazon SNS. You’ll receive an email notification at the address you provided in the CloudFormation parameters. The email will contain important information about the certificates approaching expiration, including their ARNs and exact expiration dates. Here’s an example of the email notification format
    Figure 7: Sample notification email sent by Amazon SNS

    Figure 7: Sample notification email sent by Amazon SNS

Conclusion

Certificate management is crucial for maintaining security across modern workloads, and AWS Private CA plays a vital role in issuing certificates with custom validity periods. The solution in this post delivers a robust, automated approach to certificate lifecycle management by seamlessly integrating several AWS services.

The solution combines Amazon EventBridge for scheduled execution of audit reports, AWS Lambda for automated processing and analysis, Amazon S3 for secure storage of audit reports, Amazon SNS for immediate notification delivery, and AWS Security Hub for centralized monitoring and tracking. This powerful integration creates a comprehensive automation workflow that actively monitors certificate expirations and provides timely alerts across your cloud, hybrid, and edge deployments.

By implementing this CloudFormation template, you can:

  • Automate the generation and processing of AWS Private CA audit reports at scheduled intervals
  • Receive immediate notifications when certificates approach their expiration threshold
  • Maintain centralized visibility through detailed Security Hub findings
  • Track certificate lifecycles across your entire infrastructure
  • Help ensure compliance with organizational security policies
  • Minimize the risk of service disruptions due to expired certificates

The solution transforms traditional certificate management from a manual, error-prone process into a streamlined, automated workflow. It provides security teams with the tools they need to proactively manage certificate lifecycles, maintain compliance requirements, and respond quickly to potential certificate-related issues. The automated notifications and centralized monitoring through Security Hub help ensure that no certificate expiration goes unnoticed, allowing teams to take timely action before service disruptions occur.

The result is a scalable, reliable system that simplifies certificate management and strengthens your organization’s overall security posture through consistent monitoring and proactive management of certificate lifecycles.

If you have feedback about this post, submit comments in the Comments section below.

Santosh Vallurupalli

Santosh Vallurupalli

Santosh is a Sr. Solutions Architect at AWS. Santosh specializes in networking, containers, and migrations and enjoys helping customers in their journey of cloud adoption and building Cloud Native solutions for challenging issues. When not working, he likes traveling, watching Formula1 and watching “The Office” in repeat mode.

Manthan Raval

Manthan Raval

Manthan is a Principal Solutions Architect at AWS specializing in the gaming industry, where he helps customers architect secure, high-performance, scalable cloud solutions. Manthan works closely with gaming companies to transform their operations through cloud innovation. He has guided numerous organizations in their cloud transformation journeys, developing robust architectures that drive business value. He shares his knowledge through public speaking, technical workshops, and customer education sessions across the globe.

[$] An update on torn-write protection

Post Syndicated from jake original https://lwn.net/Articles/1016406/

In a combined storage and filesystem track session at the
2025 Linux Storage, Filesystem, Memory Management, and BPF Summit, John
Garry continued the theme of “untorn” (or atomic) writes that started in the previous session. It was also
an update on where things have gone for untorn writes since his session at last year’s summit. Beyond that,
he looked at some of the plans and challenges for the feature in the future.

[$] Debian Project Leader election 2025 edition

Post Syndicated from jzb original https://lwn.net/Articles/1016107/

Four candidates have stepped up to run in the 2025 Debian Project
Leader
(DPL) election. Andreas
Tille
, who is in his first term as DPL, is running again. Sruthi
Chandran
, Gianfranco
Costamagna
, and Julian Andres
Klode
are the other candidates running for a chance to serve a
term as DPL. The campaigning phase ended on April 5, and Debian
members began voting on April 6. Voting ends on
April 19. This year, the campaign period has been lively and
sometimes contentious, touching on problems with Debian team
delegations and finances.

[$] A new type of spinlock for the BPF subsystem

Post Syndicated from daroc original https://lwn.net/Articles/1016674/

The 6.15 merge window saw the inclusion of a new type of lock for BPF programs:
a resilient queued spinlock that Kumar Kartikeya Dwivedi has been working on
for some time. Eventually, he hopes to convert all of the spinlocks currently
used in the BPF subsystem to his new lock.
He gave a remote presentation about the design of the lock at the
2025 Linux Storage, Filesystem,
Memory-Management, and BPF summit.

Make your apps truly interactive with Cloudflare Realtime and RealtimeKit

Post Syndicated from Zaid Farooqui original https://blog.cloudflare.com/introducing-cloudflare-realtime-and-realtimekit/

Over the past few years, we’ve seen developers push the boundaries of what’s possible with real-time communication — tools for collaborative work, massive online watch parties, and interactive live classrooms are all exploding in popularity.

We use AI more and more in our daily lives. Text-based interactions are evolving into something more natural: voice and video. When users interact with the applications and tools that AI developers create, we have high expectations for response time and connection quality. Complex applications of AI are built on not just one tool, but a combination of tools, often from different providers which requires a well connected cloud to sit in the middle for the coordination of different AI tools.

Developers already use Workers, Workers AI, and our WebRTC SFU and TURN services to build powerful apps without needing to think about coordinating compute or media services to be closest to their user. It’s only natural for there to be a singular “Region: Earth” for real-time applications.

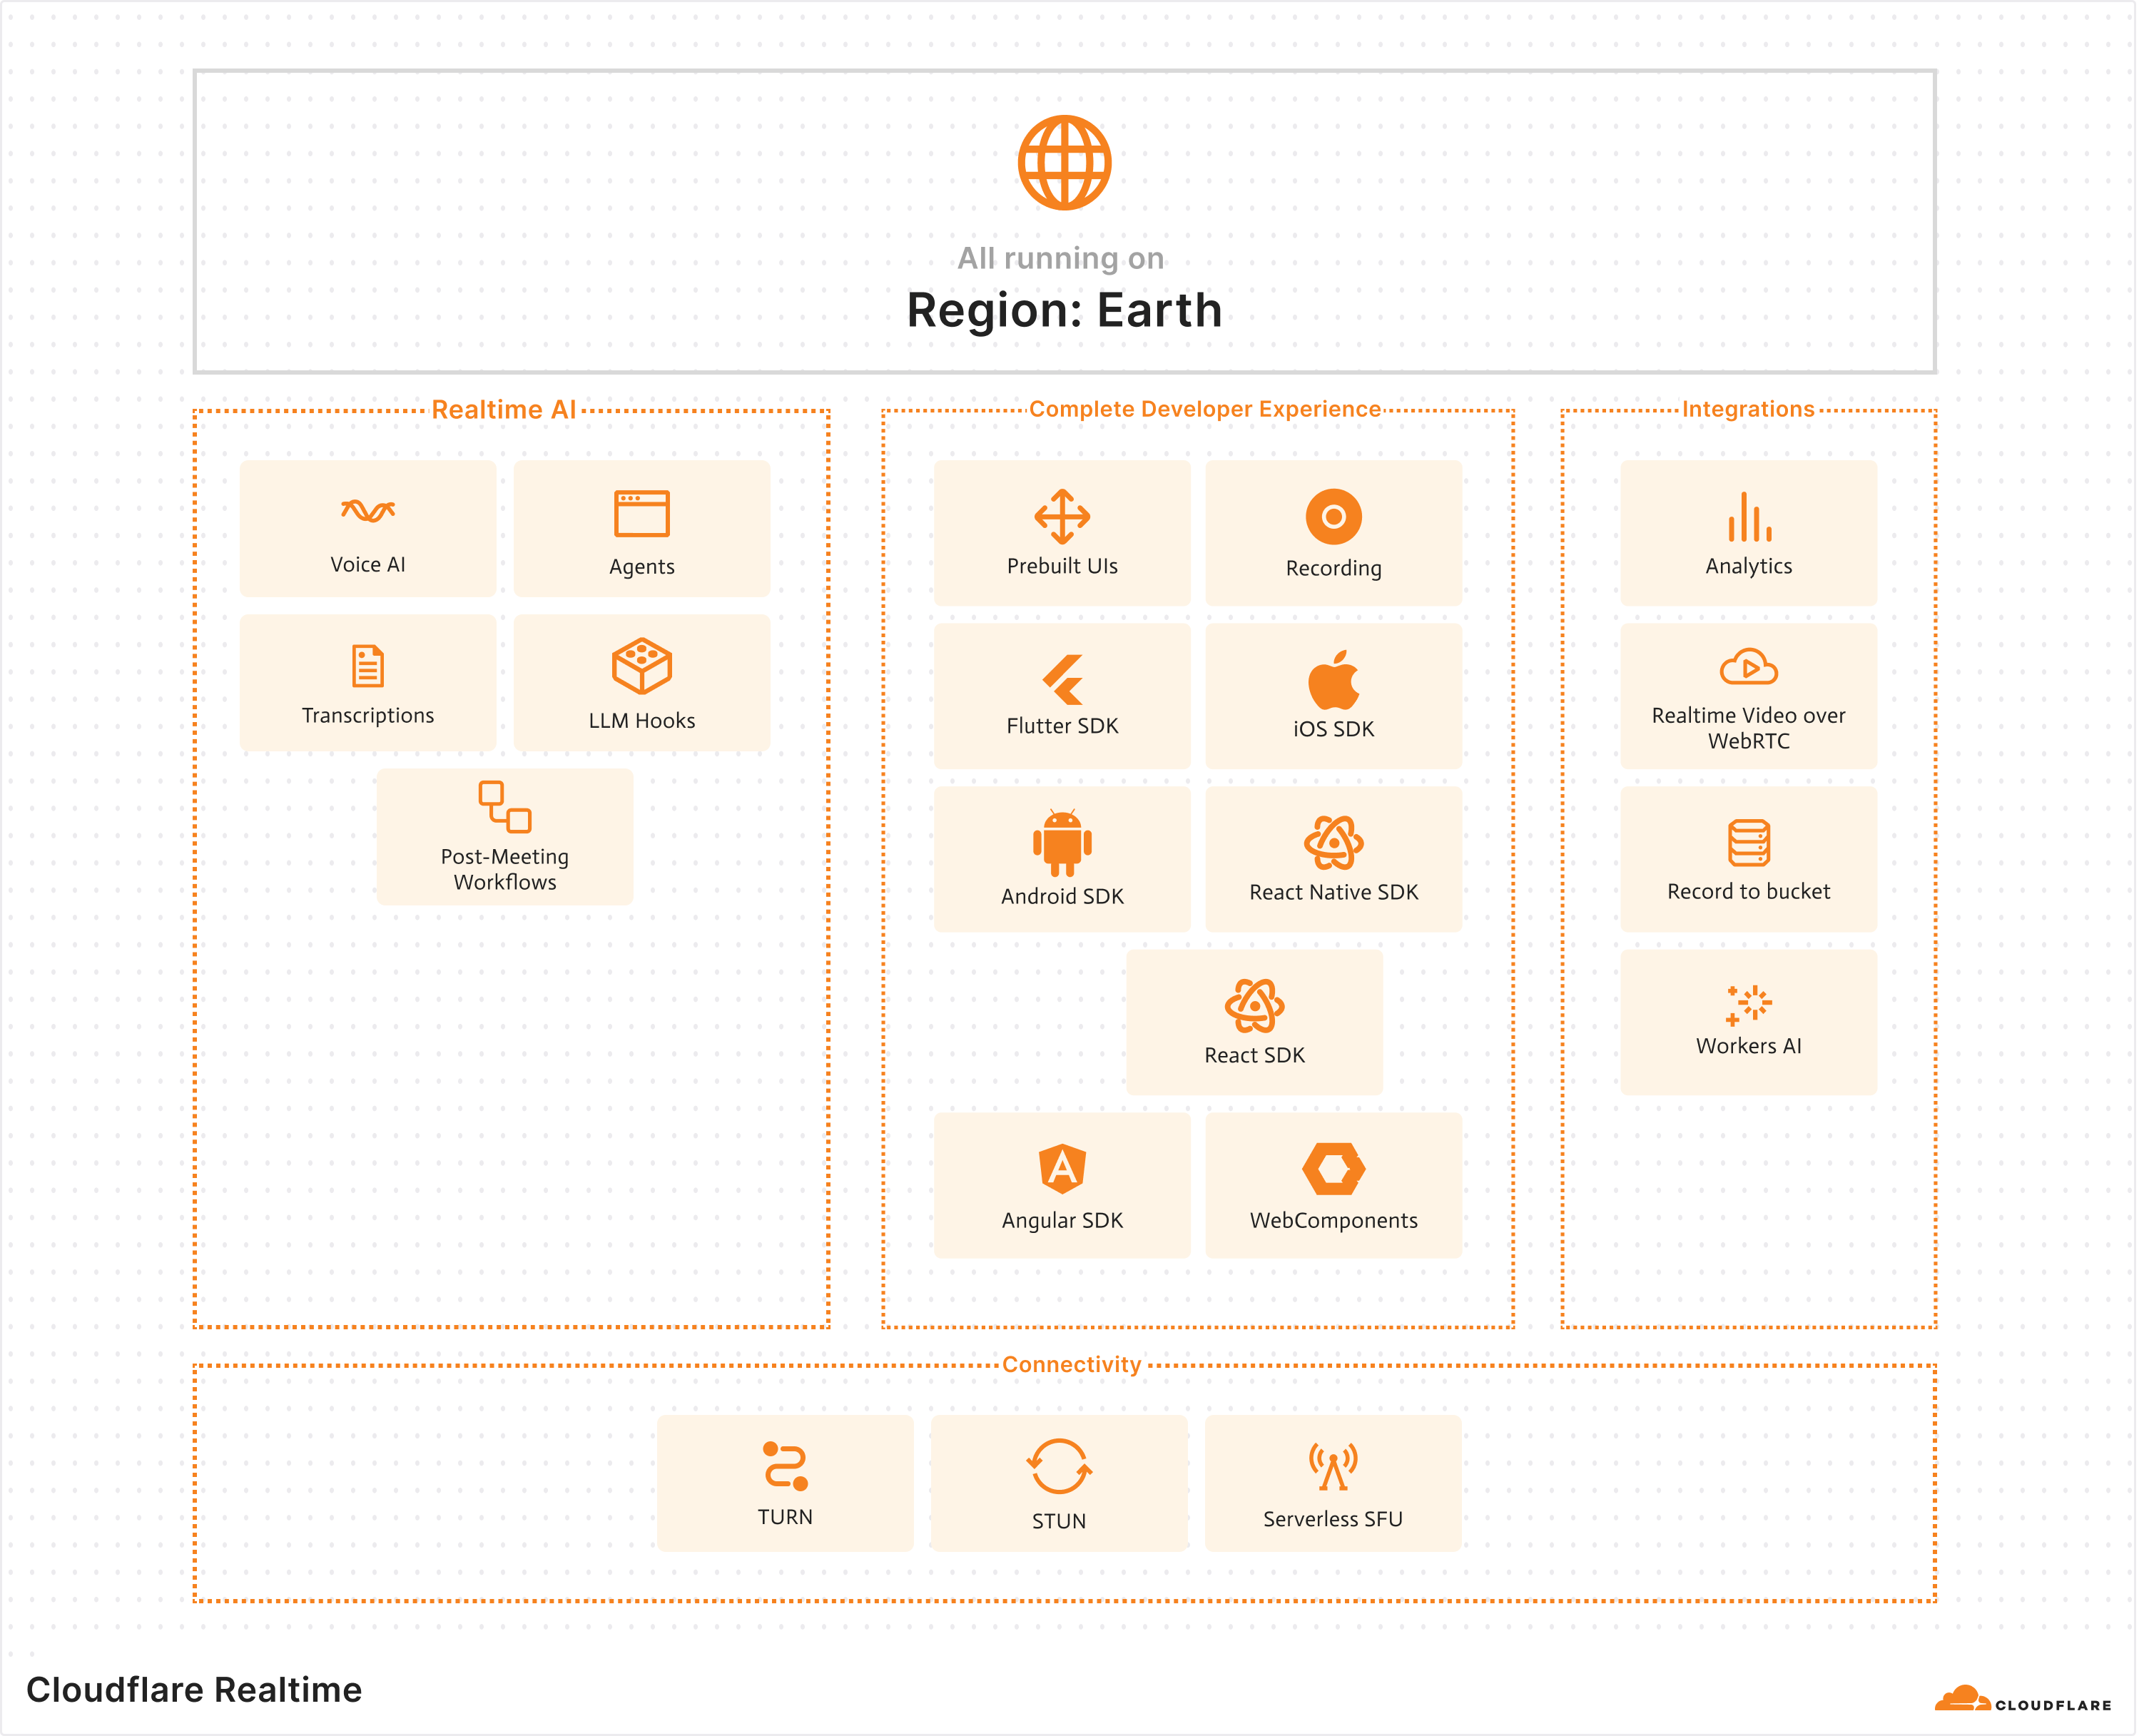
We’re excited to introduce Cloudflare Realtime — a suite of products to help you make your apps truly interactive with real-time audio and video experiences. Cloudflare Realtime now brings together our SFU, STUN, and TURN services, along with the new RealtimeKit.

Say hello to RealtimeKit

RealtimeKit is a collection of mobile SDKs (iOS, Android, React Native, Flutter), SDKs for the Web (React, Angular, vanilla JS, WebComponents), and server side services (recording, coordination, transcription) that make it easier than ever to build real-time voice, video, and AI applications. RealtimeKit also includes user interface components to build interfaces quickly. 

The amazing team behind Dyte, a leading company in the real-time ecosystem, joined Cloudflare to accelerate the development of RealtimeKit. The Dyte team spent years focused on making real-time experiences accessible to developers of all skill levels, and had a deep understanding of the developer journey — they built abstractions that hid WebRTC’s complexity without removing its power.

Already a user of Cloudflare’s products, Dyte was a perfect complement to Cloudflare’s existing real-time infrastructure spanning 300+ cities worldwide. They built a developer experience layer that made complex media capabilities accessible. We’re incredibly excited for their team to join Cloudflare as we help developers define the future of user interaction for real-time applications as one team.

Interactive applications shouldn’t require WebRTC expertise 

For many developers, what starts as “let’s add video chat” can quickly escalate into weeks of technical deep dives into WebSockets and WebRTC. While we are big believers in the potential of WebRTC, we also know that it comes with real challenges when building for the first time. Debugging WebRTC sessions can require developers to learn about esoteric new concepts such as navigating ICE candidate failures, TURN server configurations, and SDP negotiation issues.

The challenges of building a WebRTC app for the first time don’t stop there. Device management adds another layer of complexity. Inconsistent camera and microphone APIs across browsers and mobile platforms introduce unexpected behaviors in production. Chrome handles resolution switching one way, Safari another, and Android WebViews break in uniquely frustrating ways. We regularly see applications that function perfectly in testing environments fail mysteriously when deployed to certain devices or browsers.

Systems that work flawlessly with 5 test users collapse under the load of 50 real-world participants. Bandwidth adaptation falters, connection management becomes unwieldy, and maintaining consistent quality across diverse network conditions proves nearly impossible without specialized expertise. 

What starts as a straightforward feature becomes a multi-month project requiring low-level engineering to solve problems that aren’t core to your business.

We realized that we needed to extend our products to client devices to help solve these problems.

RealtimeKit SDKs for Kotlin, React Native, Swift, JavaScript, Flutter


RealtimeKit is our toolkit for building real-time applications without common WebRTC headaches. The core of RealtimeKit is a set of cross-platform SDKs that handle all the low-level complexities, from session establishment and media permissions to NAT traversal and connection management. Instead of spending weeks implementing and debugging these foundations, you can focus entirely on creating unique experiences for your users.

Recording capabilities come built-in, eliminating one of the most commonly requested yet difficult-to-implement features in real-time applications. Whether you need to capture meetings for compliance, save virtual classroom sessions for students who couldn’t attend live, or enable content creators to archive their streams, RealtimeKit handles the entire media pipeline. No more wrestling with MediaRecorder APIs or building custom recording infrastructure — it just works, scaling alongside your user base.

We’ve also integrated voice AI capabilities from providers like ElevenLabs directly into the platform. Adding AI participants to conversations becomes as simple as a function call, opening up entirely new interaction models. These AI voices operate with the same low latency as human participants — tens of milliseconds across our global network — creating truly synchronous experiences where AI and humans converse naturally. Combined with RealtimeKit’s ability to scale to millions of concurrent participants, this enables entirely new categories of applications that weren’t feasible before.

The Developer Experience


RealtimeKit focuses on what developers want to accomplish, rather than how the underlying protocols work. Adding participants or turning on recording are just an API call away. SDKs handle device enumeration, permission requests, and UI rendering across platforms. Behind the scenes, we’re solving the thorny problems of media orchestration and state management that can be challenging to debug.

We’ve been quietly working towards launching the Cloudflare RealtimeKit for years. From the very beginning, our global network has been optimized for minimizing latency between our network and end users, which is where the majority of network disruptions are introduced.

We developed a Selective Forwarding Unit (SFU) that intelligently routes media streams between participants, dynamically adjusting quality based on network conditions. Our TURN infrastructure solves the complex problem of NAT traversal, allowing connections to be established reliably behind firewalls. With Workers AI, we brought inference capabilities to the edge, minimizing latency for AI-powered interactions. Workers and Durable Objects provided the WebSockets coordination layer necessary for maintaining consistent state across participants.

SFU and TURN services are now Generally Available

We’re also announcing the General Availability of our SFU and TURN services for WebRTC developers that need more control and a low-level integration with the Cloudflare network.

SFU now supports simulcast, a very common feature request. Simulcast allows developers to select media streams from multiple options, similar to selecting the quality level of an online video, but for WebRTC. Users with different network qualities are now able to receive different levels of quality, either automatically defined by the SFU or manually selected.

Our TURN service now offers advanced analytics with insight into regional, country, and city level usage metrics. Together with Custom Identifiers, and revocable tokens, Cloudflare’s TURN service offers an in-depth view into usage and helps avoid abuse.

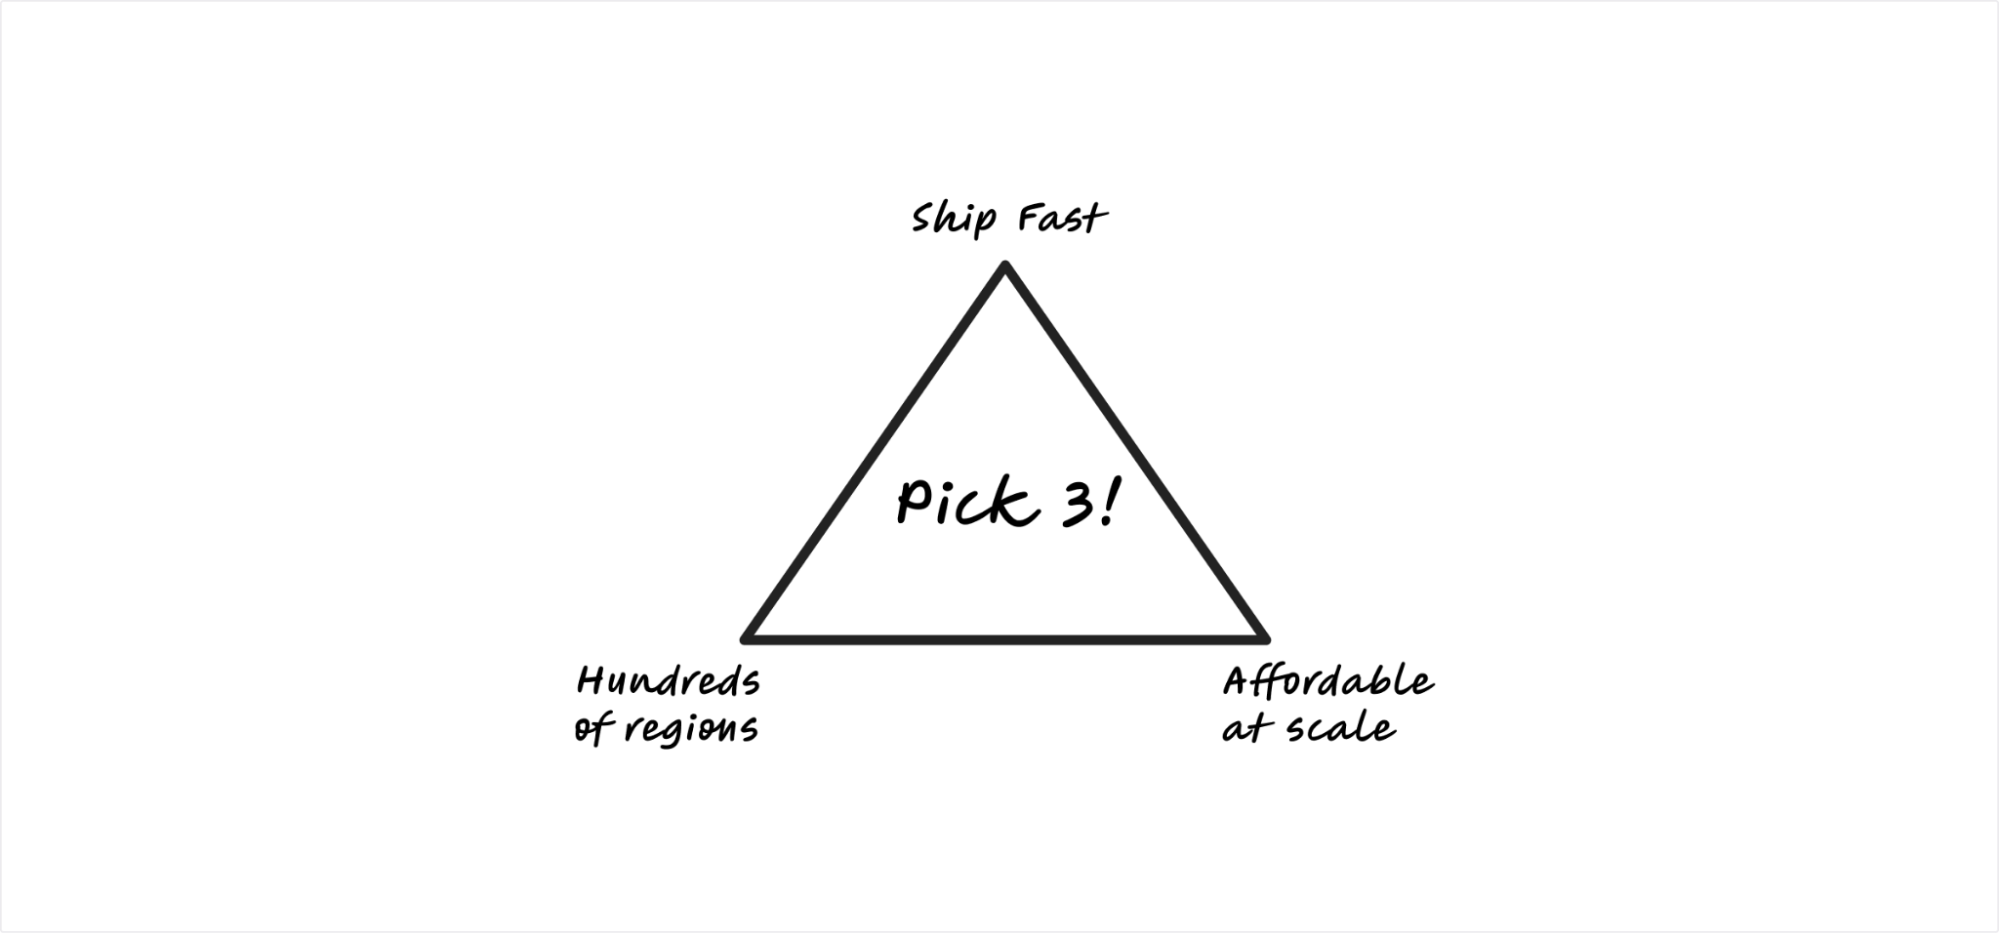
Our SFU and TURN products continue to be one of the most affordable ways to build WebRTC apps at scale, at 5 cents per GB after 1,000 GB of free usage each month.

Partnering with Hugging Face to make realtime AI communication seamless

FastRTC is a lightweight Python library from Hugging Face that makes it easy to stream real-time audio and video into and out of AI models using WebRTC. TURN servers are a critical part of WebRTC infrastructure and ensure that media streams can reliably connect across firewalls and NATs. For users of FastRTC, setting up a globally distributed TURN server can be complex and expensive.  

Through our new partnership with Hugging Face, FastRTC users now have free access to Cloudflare’s TURN Server product, giving them reliable connectivity out of the box. Developers get 10 GB of TURN bandwidth each month using just a Hugging Face access token — no setup, no credit card, no servers to manage. As projects grow, they can easily switch to a Cloudflare account for more capacity and a larger free tier.

This integration allows AI developers to focus on building voice interfaces, video pipelines, and multimodal apps without worrying about NAT traversal or network reliability. FastRTC simplifies the code, and Cloudflare ensures it works everywhere. See these demos to get started.

Ship AI-powered realtime apps in days, not weeks


With RealtimeKit, developers can now implement complex real-time experiences in hours. The SDKs abstract away the most time-consuming aspects of WebRTC development while providing APIs tailored to common implementation patterns. Here are a few of the possibilities: 

  • Video conferencing: Add multi-participant video calls to your application with just a few lines of code. RealtimeKit handles the connection management, bandwidth adaptation, and device permissions that typically consume weeks of development time.

  • Live streaming: Build interactive broadcasts where hosts can stream to thousands of viewers while selectively bringing participants on-screen. The SFU automatically optimizes media routing based on participant roles and network conditions.

  • Real-time synchronization: Implement watch parties or collaborative viewing experiences where content playback stays synchronized across all participants. The timing API handles the complex delay calculations and adjustments traditionally required.

  • Voice AI integrations: Add transcription and AI voice participants without building custom media pipelines. RealtimeKit’s media processing APIs integrate with your existing authentication and storage systems rather than requiring separate infrastructure.

When we’ve seen our early testers use the RealtimeKit, it doesn’t just accelerate their existing projects, it fundamentally changes which projects become viable. 

Get started with RealtimeKit

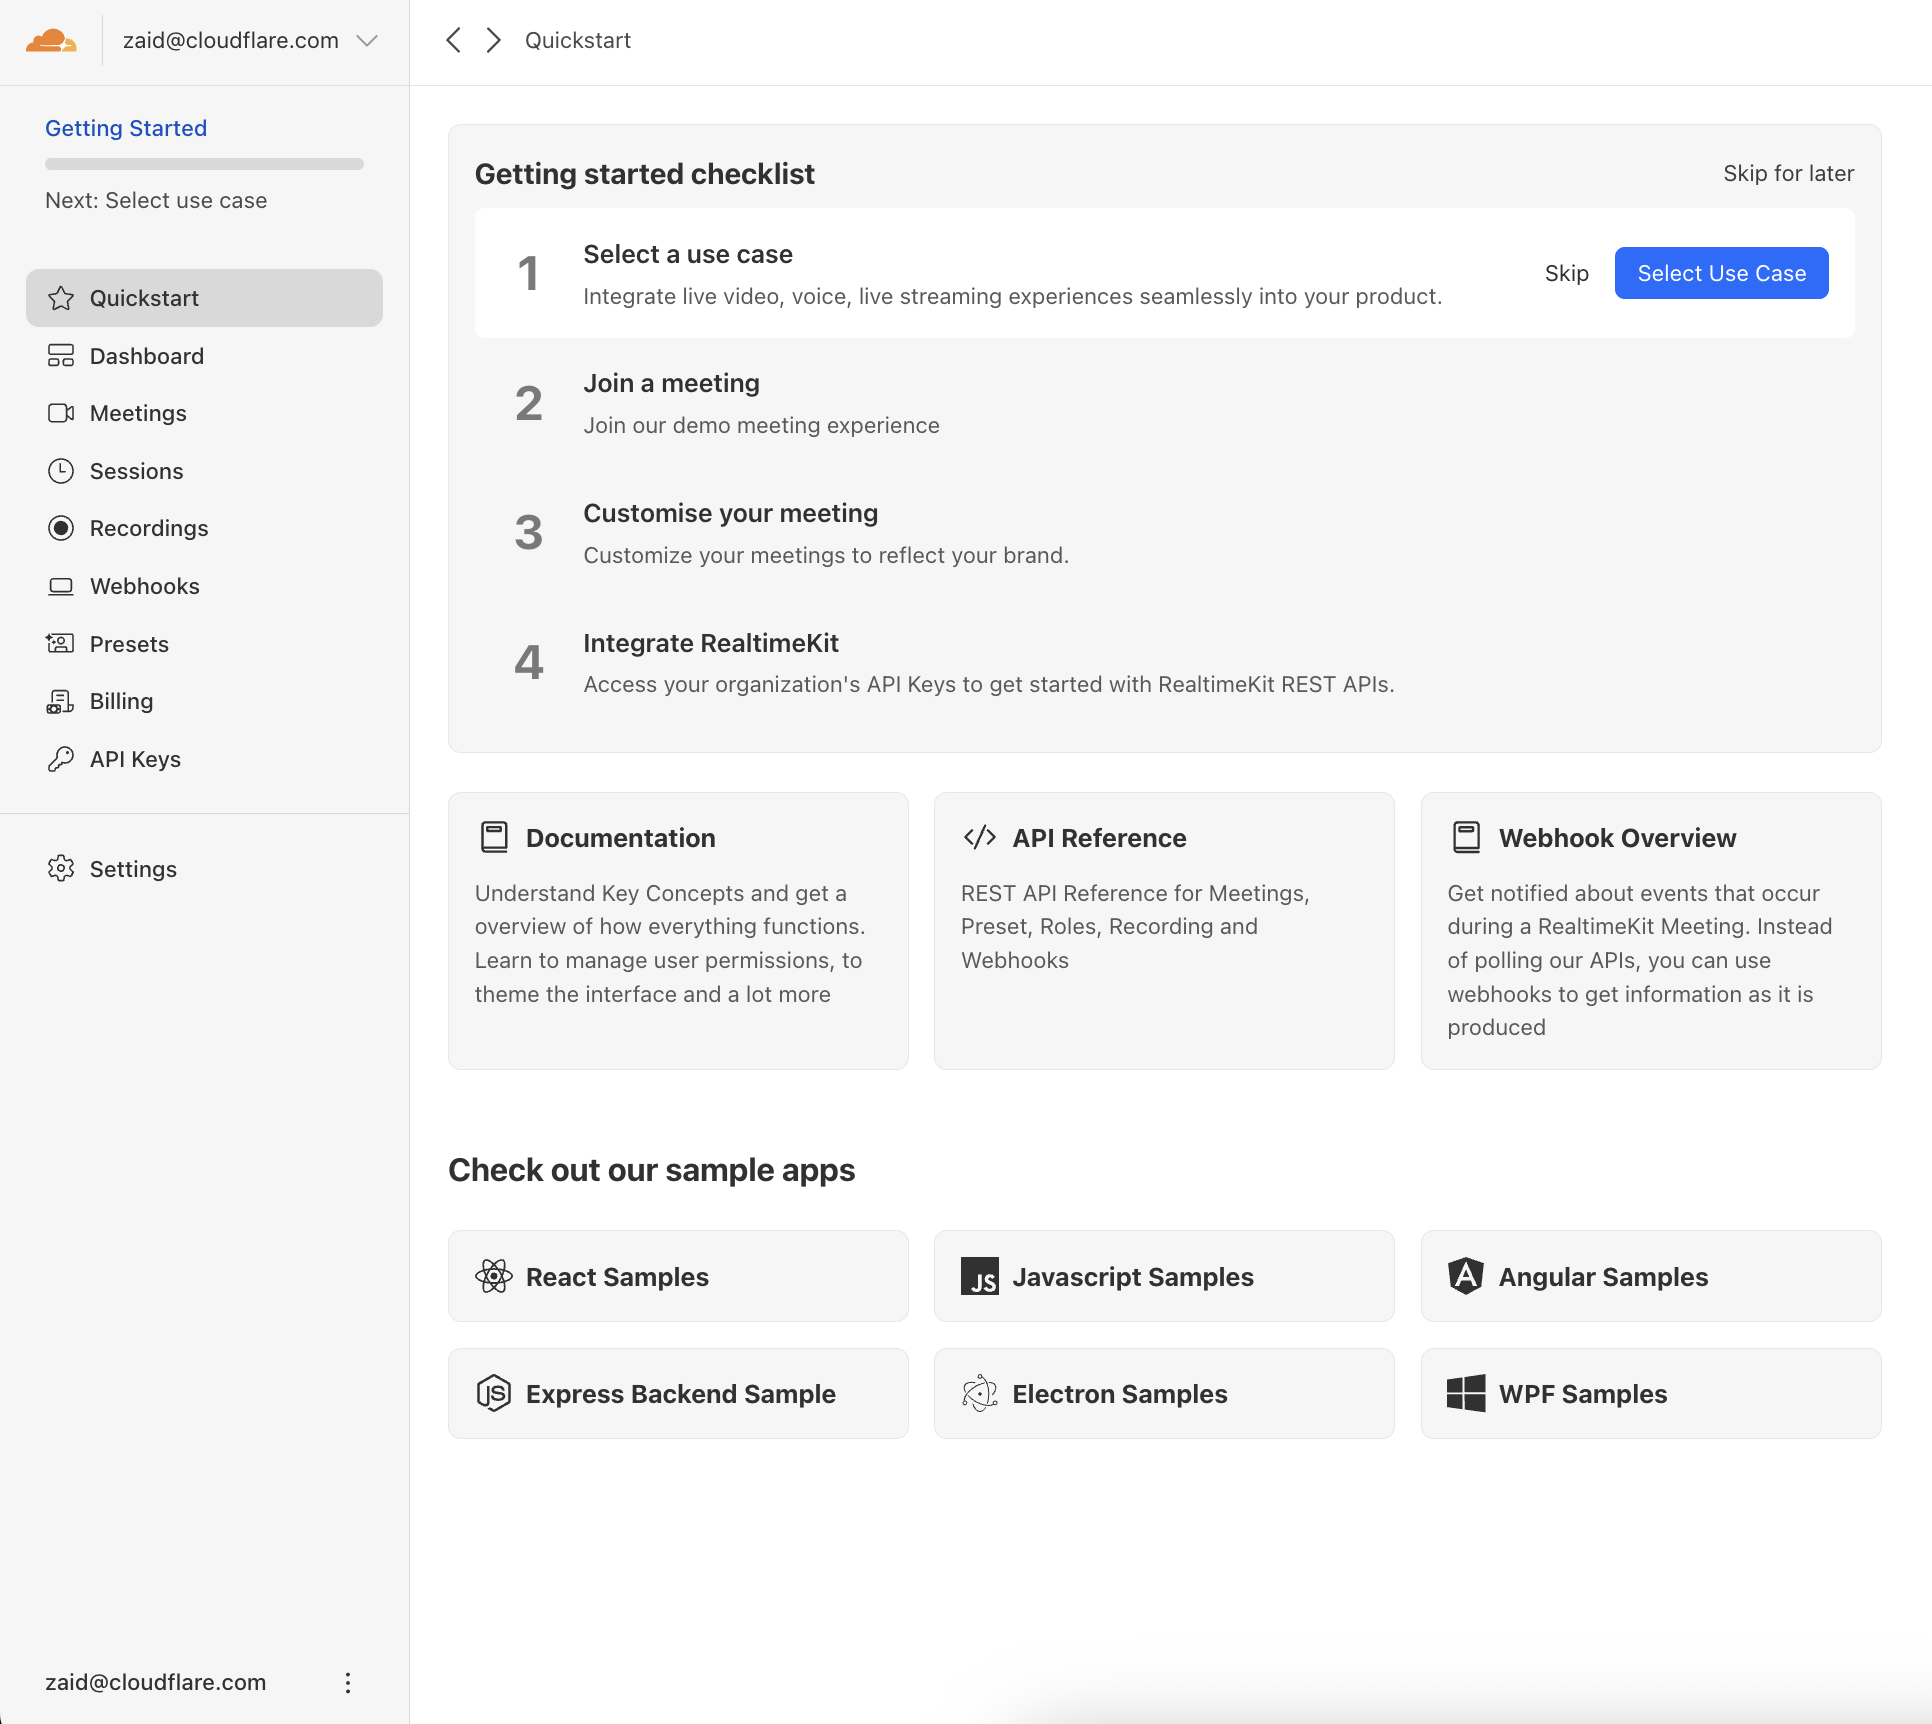
Starting today, you’ll notice a new Realtime section in your Cloudflare Dashboard. This section includes our TURN and SFU products alongside our latest product, RealtimeKit. 

RealtimeKit is currently in a closed beta ready for select customers to start kicking the tires. There is currently no cost to test it out during the beta. Request early access here or via the link in your Cloudflare dashboard. We can’t wait to see what you build.


Introducing Cloudflare Secrets Store (Beta): secure your secrets, simplify your workflow

Post Syndicated from Mia Malden original https://blog.cloudflare.com/secrets-store-beta/

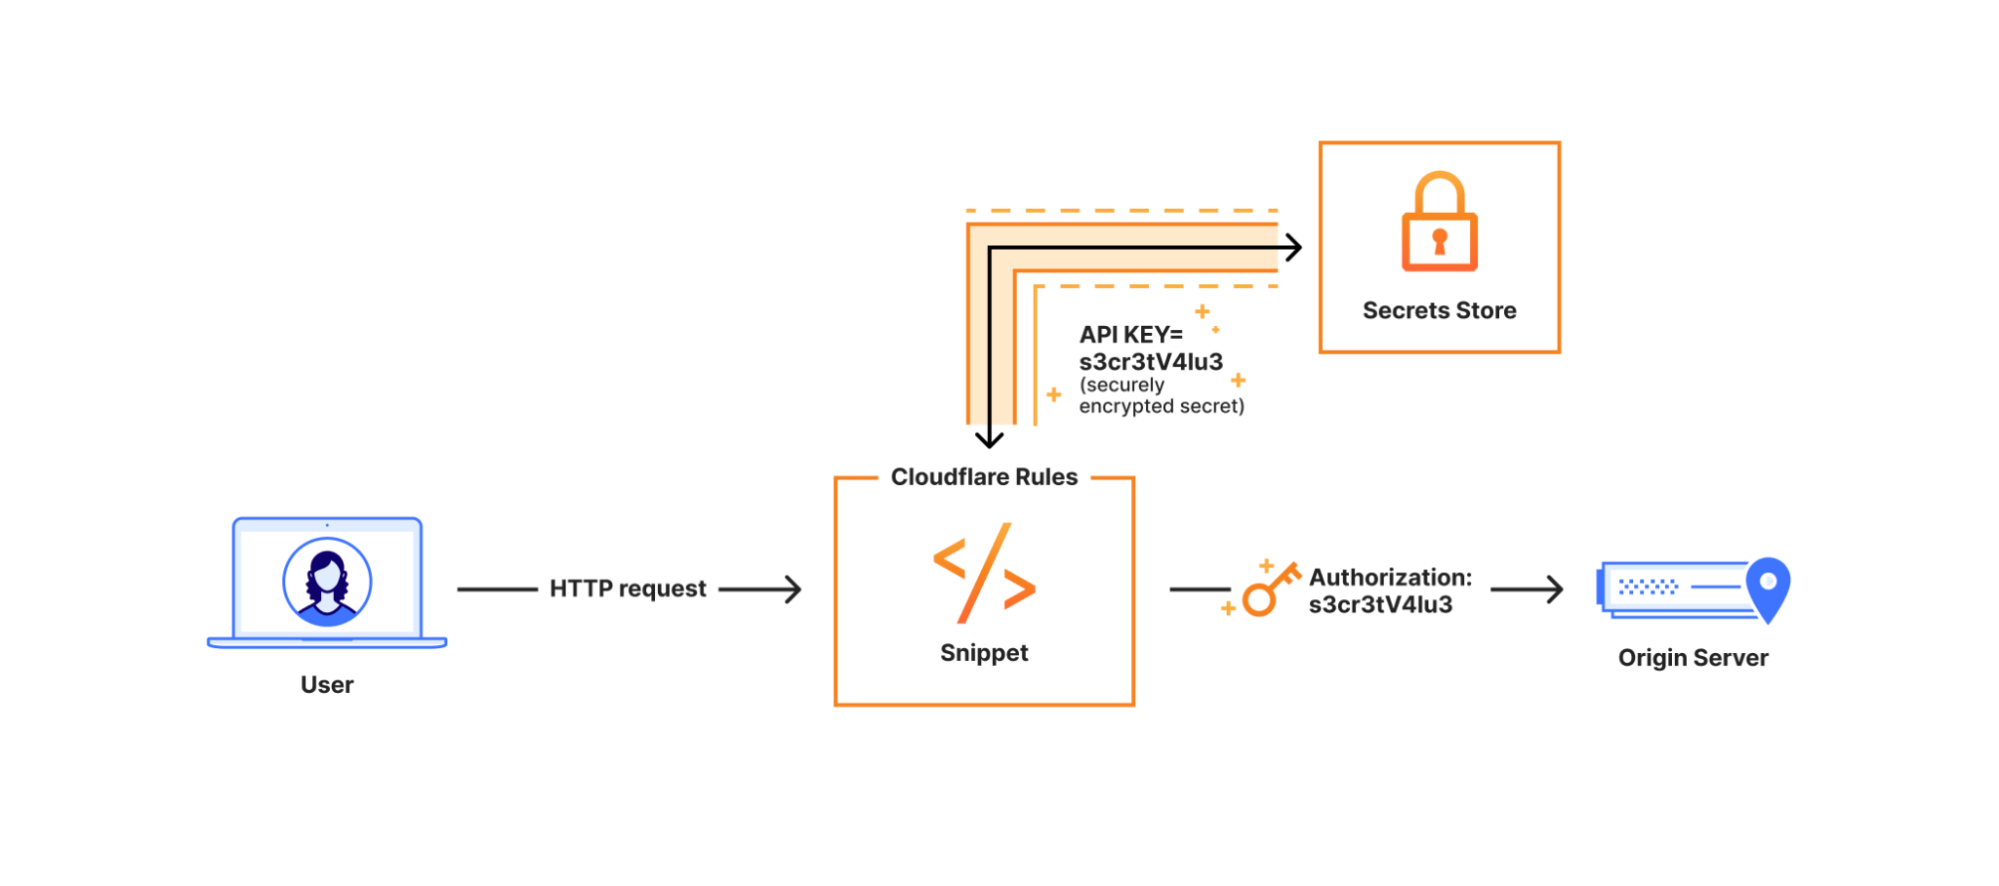
Every cloud platform needs a secure way to store API tokens, keys, and credentials — welcome, Cloudflare Secrets Store! Today, we are very excited to announce and launch Secrets Store in beta. We built Cloudflare Secrets Store to help our customers centralize management, improve security, and restrict access to sensitive values on the Cloudflare platform. 

Wherever secrets exist at Cloudflare – from our developer platform, to AI products, to Cloudflare One –  we’ve built a centralized platform that allows you to manage them in one place. 

We are excited to integrate Cloudflare Secrets Store with the whole portfolio of Cloudflare products, starting today with Cloudflare Workers. 

Securing your secrets across Workers

If you have a secret you want to use across multiple Workers, you can now use the Cloudflare Secrets Store to do so. You can spin up your store from the dashboard or by using Wrangler CLI:

wrangler secrets-store store create <name>

Then, create a secret:

wrangler secrets-store secret create <store-id>

Once the secret is created, you can specify the binding to deploy in a Worker immediately. 

secrets_store_secrets = [
{ binding = "'open_AI_KEY'", store_id= "abc123", secret_name = "open_AI_key"},
]

Last step – you can now reference the secret in code!

const openAIkey = await env.open_AI_key.get();

Environment variables and secrets were first launched in Cloudflare Workers back in 2020. Now, there are millions of local secrets deployed on Workers scripts. However, these are not all unique. Many of these secrets have duplicate values within a customer’s account. For example, a customer may reuse the same API token in ten different scripts, but since each secret is accessible only on the per-Worker level, that value would be stored in ten different local secrets. Plus, if you need to roll that secret, there is no seamless way to do so that preserves a single source of truth.

With thousands of secrets duplicated across scripts — each requiring manual creation and updates  — scoping secrets to individual Workers has created significant friction for developers. Additionally, because Workers secrets are created and deployed locally, any secret is accessible – in terms of creation, editing, and deletion – to anyone who has access to that script. 

Now, you can create account-level secrets and variables that can be shared across all Workers scripts, centrally managed and protected within the Secrets Store. 

Building a secure secrets manager

The most important feature of a Secret Store, of course, is to make sure that your secrets are stored securely. 

Once the secret is created, its value will not be readable by anyone, be it developers, admins, or Cloudflare employees. Only the permitted service will be able to use the value at runtime. 

This is why the first thing that happens when you deploy a new secret to Cloudflare is encrypting the secret prior to storing it in our database. We make sure your tokens are safe and protected using a two-level key hierarchy, where the root key never leaves a secure system. This is done by making use of DEKs (Data Encryption Keys) to encrypt your secrets and a separate KEK (Key Encryption Key) to encrypt the DEKs themselves. The data encryption keys are refreshed frequently, making the possibility and impact scope of a single DEK exposure very small. In the future, we will introduce periodic key rotations for our KEK and also provide a way for customers to have their own account-specific DEKs.

After the secrets are encrypted, there are two permissions checks when deploying a secret from the Secrets Store to a Worker. First, the user must have sufficient permissions to create the binding. Second, when the Worker makes a fetch call to retrieve the secret value, we verify that the Worker has an appropriate binding to access that secret. 

The secrets are automatically propagated across our network using Quicksilver – so that every secret is on every server– to ensure they’re immediately accessible and ready for the Worker to use. Wherever your Worker is deployed, your secrets will be, too. 

If you’d like to use a secret to secure your AI model keys before passing on to AI Gateway:

export default {
 async fetch(request, env, ctx) {
   const prompt = "Write me a pun about Cloudflare";
   const openAIkey = await env.open_AI_key.get();

   const response = await fetch("https://gateway.ai.cloudflare.com/v1/YOUR_ACCOUNT_TAG/openai/chat/completions", {
     method: "POST",
     headers: {
       "Content-Type": "application/json",
       "Authorization": `Bearer ${openAIkey}`,
     },
     body: JSON.stringify({
       model: "gpt-3.5-turbo",
       messages: [
         { role: "user", content: prompt }
       ],
       temperature: 0.8,
       max_tokens: 100,
     }),
   });

   const data = await response.json();
   const answer = data.choices?.[0]?.message?.content || "No pun found 😢";

   return new Response(answer, {
     headers: { "Content-Type": "text/plain" },
   });
 }
};

Cloudflare Secrets Store, with built-in RBAC

Now, a secret’s value can be updated once and applied everywhere — but not by everyone. Cloudflare Secrets Store uses role-based access control (RBAC) to ensure that only those with permission can view, create, edit, or delete secrets. Additionally, any changes to the Secrets Store are recorded in the audit logs, allowing you to track changes. 

Whereas per-Worker secrets are tied to the Workers account role, meaning that anyone who can modify the Worker can modify the secret, access to account-level secrets is restricted with more granular controls. This allows for differentiation between security admins who manage secrets and developers who use them in the code.


Secrets Store Admin

Secrets Store Reporter

Secrets Store Deployer

Create secrets

✓


Update secrets

✓


Delete secrets

✓


View secrets metadata

✓

✓

✓

Deploy secrets (i.e. bind to a Worker)


✓

Each secret can also be scoped to a particular Cloudflare product to ensure the value is only used where it is meant to be. Today, the secrets are restricted to Workers by default, but once the Secrets Store supports multiple products, you’ll be able to specify where the secret can be used (e.g. “I only want this secret to be accessible through Firewall Rules”). 

What’s next for Secrets Store

Secrets Store will support all secrets across Cloudflare, including:

  • Cloudflare Access has service tokens to authenticate against your Zero Trust policies.

  • Transform Rules require sensitive values in the request headers to grant access or pass onto to something else.

  • AI Gateway relies upon secret keys from each provider to position Cloudflare between the end user and the AI model. 

…and more! 

Right now, to use a secret within a Worker, you have to create a binding for that specific secret. In the future, we’ll allow you to create a binding to the store itself so that the Worker can access any secret within that store. We’ll also allow customers to create multiple secret stores within their account so that they can manage secrets by group when creating access policies. 

Every Cloudflare account can create up to twenty secrets for free. We’re currently finalizing our pricing and will publish more details for each tier soon.

We’re thrilled to get Secrets Store into our customers’ hands and are excited to continue building it out to support more products and features as we work towards making Secrets Store GA.

Try it out today! 

Cloudflare Secrets Store with the Workers integration is available for all customers via UI and API today. For instructions to get started in the Cloudflare dashboard, take a look at our developer documentation. 

If you have any feedback or feature requests, we’d love for you to share those with us on this Google form.

Cloudflare Snippets are now Generally Available

Post Syndicated from Nikita Cano original https://blog.cloudflare.com/snippets/

Program your traffic at the edge — fast, flexible, and free

Cloudflare Snippets are now generally available (GA) for all paid plans, giving you a fast, flexible way to control HTTP traffic using lightweight JavaScript “code rules” — at no extra cost.

Need to transform headers dynamically, fine-tune caching, rewrite URLs, retry failed requests, replace expired links, throttle suspicious traffic, or validate authentication tokens? Snippets provide a production-ready solution built for performance, security, and control.

With GA, we’re introducing a new code editor to streamline writing and testing logic. This summer, we’re also rolling out an integration with Secrets Store — enabling you to bind and manage sensitive values like API keys directly in Snippets, securely and at scale.

What are Snippets?

Snippets bring the power of JavaScript to Cloudflare Rules, letting you write logic that runs before a request reaches your origin or after a response returns from upstream. They’re ideal when built-in rule actions aren’t quite enough. While Cloudflare Rules let you define traffic logic without code, Snippets extend that model with greater flexibility for advanced scenarios.

Think of Snippets as the ultra-fast “code layer” of Cloudflare Rules: the Ruleset Engine evaluates your rules and invokes your code, which then runs on the Workers runtime.

Key capabilities of Snippets:

Best of all? Snippets are included at no extra cost for Pro, Business, and Enterprise plans — with no usage-based fees.

The journey to GA: How Snippets became production-grade

Cloudflare Snippets started as a bold idea: bring the power of JavaScript-based logic to Cloudflare Rules, without the complexity of a full-stack developer platform.

Over the past two years, Snippets have evolved into a production-ready “code rules” solution, shaping the future of HTTP traffic control.

2022: Cloudflare Snippets were announced during Developer Week as a solution for users needing flexible HTTP traffic modifications without a full Worker.

2023: Alpha launch — hundreds of users tested Snippets for high-performance traffic logic.

2024: 7x traffic growth, processing 17,000 requests per second. Terraform support and production-grade backend were released.

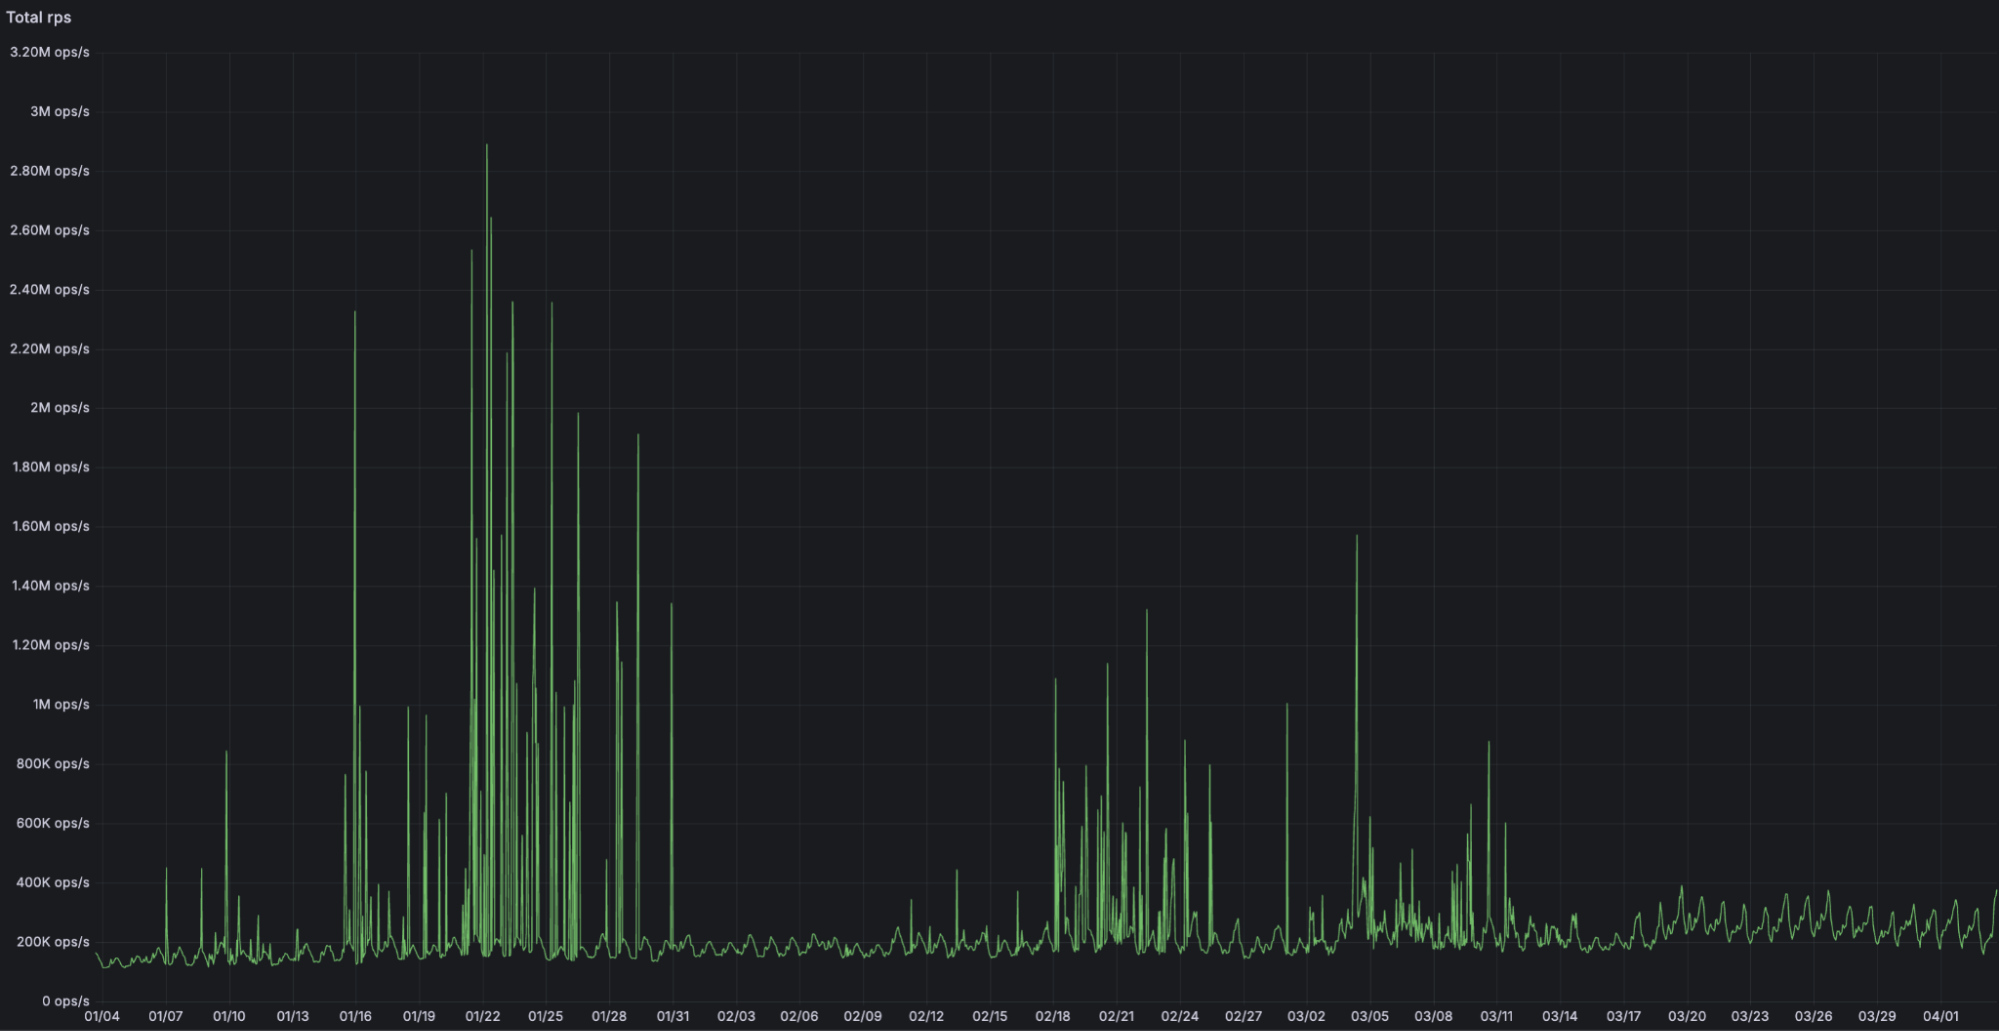
2025: General Availability — Snippets introduces a new code editor, increased limits alongside other Cloudflare Rules products, integration with Trace, and a production-grade experience built for scale, handling over 2 million requests per second at peak. Integration with the Secrets Store is rolling out this summer.


New: Snippets + Trace

Cloudflare Trace now shows exactly which Snippets were triggered on a request. This makes it easier to debug traffic behavior, verify logic execution, and understand how your Snippets interact with other products in the request pipeline.

Whether you’re fine-tuning header logic or troubleshooting a routing issue, Trace gives you real-time insight into how your edge logic behaves in production.

Coming soon: Snippets + Secrets Store

In the third quarter, you’ll be able to securely access API keys, authentication tokens, and other sensitive values from Secrets Store directly in your Snippets. No more plaintext secrets in your code, no more workarounds.


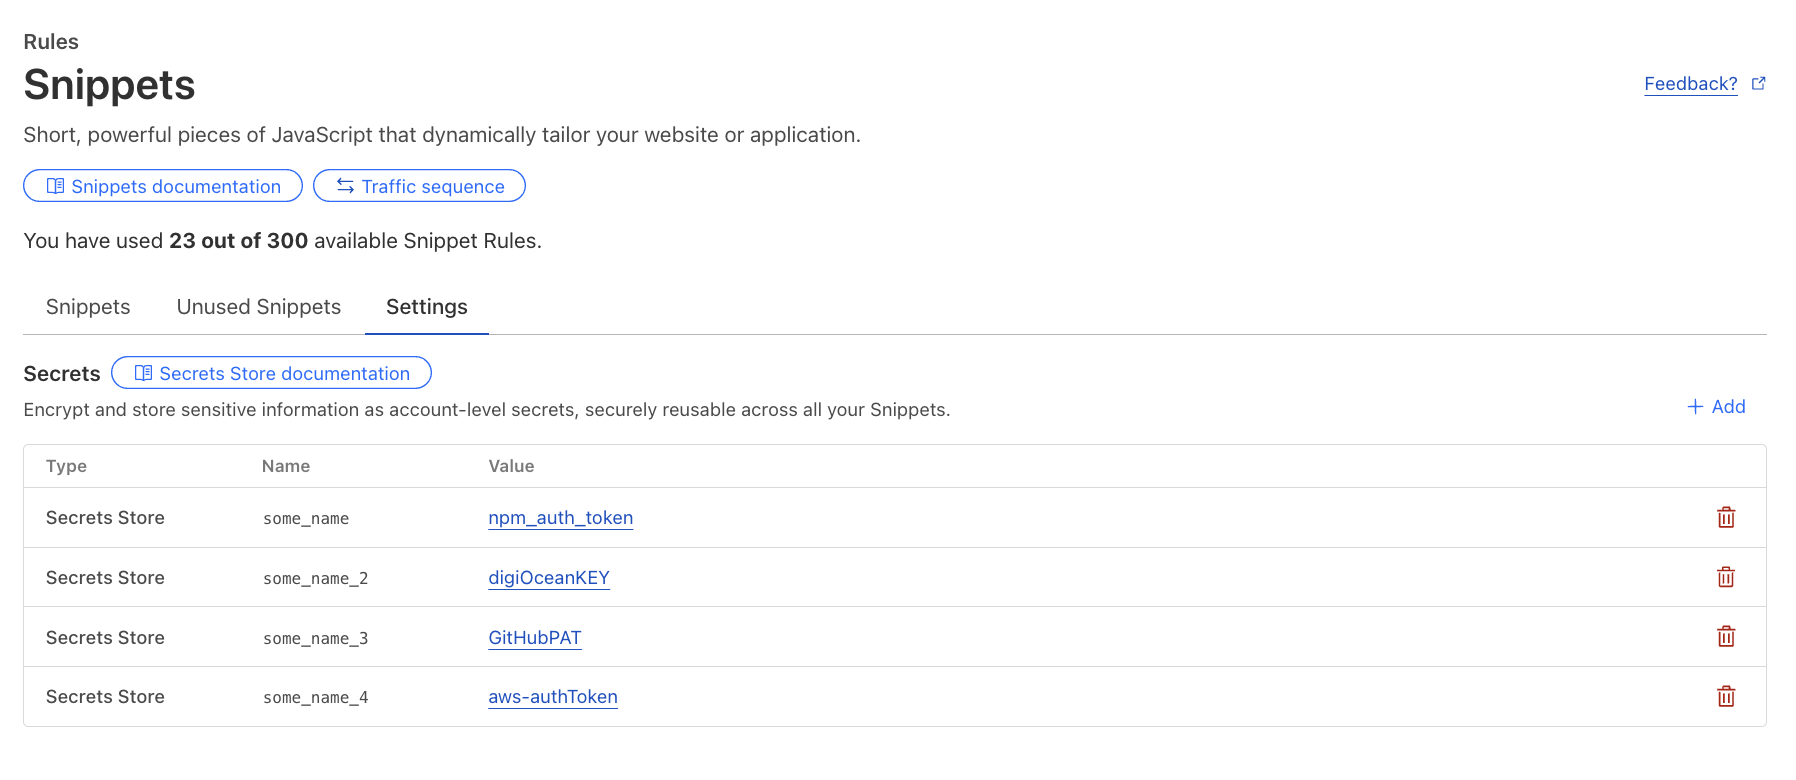
Once rolled out, secrets can be configured for Snippets via the dashboard or API under the new “Settings” button.


When to use Snippets vs. Cloudflare Workers

Snippets are fast, flexible, and free, but how do they compare to Cloudflare Workers? Both allow you to programmatically control traffic. However, they solve different problems:

Feature

Snippets

Workers

Execute scripts based on request attributes (headers, geolocation, cookies, etc.)

✅

❌

Modify HTTP requests/responses or serve a different response

✅

✅

Add, remove, or rewrite headers dynamically

✅

✅

Cache assets at the edge

✅

✅

Route traffic dynamically between origins

✅

✅

Authenticate requests, pre-sign URLs, run A/B testing

✅

✅

Perform compute-intensive tasks (e.g., AI inference, image processing)

❌

✅

Store persistent data (e.g., KV, Durable Objects, D1)

❌

✅

Deploy via CLI (Wrangler)

❌

✅

Use TypeScript, Python, Rust or other programming languages

❌

✅

Use Snippets when:

  • You need ultra-fast conditional traffic modifications directly on Cloudflare’s network.

  • You want to extend Cloudflare Rules beyond built-in actions.

  • You need free, unlimited invocations within the execution limits.

  • You are migrating from VCL, Akamai’s EdgeWorkers, or on-premise logic.

Use Workers when:

  • Your application requires state management, Developer Platform product integrations, or high compute limits.

  • You are building APIs, full-stack applications, or complex workflows.

  • You need logging, debugging tools, CLI support, and gradual rollouts.

Still unsure? Check out our detailed guide for best practices.

Snippets in action: real-world use cases

Below are practical use cases demonstrating Snippets. Each script can be dynamically triggered using our powerful Rules language, so you can granularly control which requests your Snippets will be applied to.

1. Dynamically modify headers

Inject custom headers, remove unnecessary ones, and tweak values on the fly:

export default {
  async fetch(request) {
    const timestamp = Date.now().toString(16); // convert timestamp to HEX
    const modifiedRequest = new Request(request, { headers: new Headers(request.headers) });
    modifiedRequest.headers.set("X-Hex-Timestamp", timestamp); // send HEX timestamp to upstream

    const response = await fetch(modifiedRequest);
    const newResponse = new Response(response.body, response); // make response from upstream immutable

    newResponse.headers.append("x-snippets-hello", "Hello from Cloudflare Snippets"); // add new response header
    newResponse.headers.delete("x-header-to-delete"); // delete response header
    newResponse.headers.set("x-header-to-change", "NewValue"); // replace the value of existing response header

    return newResponse;
  },
};

2. Serve a custom maintenance page

Route traffic to a maintenance page when your origin is undergoing planned maintenance:

export default {
    async fetch(request) { // for all matching requests, return predefined HTML response with 503 status code
        return new Response(`
            <!DOCTYPE html>
            <html lang="en">
            <head>
                <meta charset="UTF-8">
                <title>We'll Be Right Back!</title>
                <style> body { font-family: Arial, sans-serif; text-align: center; padding: 20px; } </style>
            </head>
            <body>
                <h1>We'll Be Right Back!</h1>
                <p>Our site is undergoing maintenance. Check back soon!</p>
            </body>
            </html>
        `, { status: 503, headers: { "Content-Type": "text/html" } });
    }
};

3. Retry failed requests to a backup origin

Ensure reliability by automatically rerouting requests when your primary origin returns an unexpected response:

export default {
  async fetch(request) {
    const response = await fetch(request); // send original request to the origin

    if (!response.ok && !response.redirected) { // if response is not 200 OK or a redirect, send to another origin
      const newRequest = new Request(request); // clone the original request to construct a new request
      newRequest.headers.set("X-Rerouted", "1"); // add a header to identify a re-routed request at the new origin
      const url = new URL(request.url); // clone the original URL
      url.hostname = "backup.example.com"; // send request to a different origin / hostname
      return await fetch(url, newRequest); // serve response from the backup origin
    }

    return response; // otherwise, serve response from the primary origin
  },
};

4. Redirect users based on their location

Send visitors to region-specific sites for better localization:

export default {
    async fetch(request) {
        const country = request.cf.country; // identify visitor's country using request.cf property
        const redirectMap = { US: "https://example.com/us", EU: "https://example.com/eu" }; // define redirects for each country
        if (redirectMap[country]) return Response.redirect(redirectMap[country], 301); // redirect on match
        return fetch(request); // otherwise, proceed to upstream normally
    }
};

Getting started with Snippets

Snippets are available right now in the Cloudflare dashboard under Rules > Snippets:

  1. Go to Rules → Snippets.

  2. Use prebuilt templates or write your own JavaScript code.

  3. Configure a flexible rule to trigger your Snippet.

  4. Test and deploy instantly.

  5. Automate via API or Terraform.

Try Snippets today

Cloudflare Snippets are now generally available, bringing fast, cost-free, and intelligent HTTP traffic control to all paid plans.

With native integration into Cloudflare Rules and Terraform — and Secrets Store integration coming this summer — Snippets provide the most efficient way to manage advanced traffic logic at scale.

Explore Snippets in the Cloudflare Dashboard and start optimizing your traffic with lightweight, flexible rules that enhance performance and reduce complexity.

Network performance update: Developer Week 2025

Post Syndicated from Emily Music original https://blog.cloudflare.com/network-performance-update-developer-week-2025/

As the Internet has become enmeshed in our everyday lives, so has our need for speed. No one wants to wait when adding shoes to our shopping carts, or accessing corporate assets from across the globe. And as the Internet supports more and more of our critical infrastructure, speed becomes more than just a measure of how quickly we can place a takeout order. It becomes the connective tissue between the systems that keep us safe, healthy, and organized. Governments, financial institutions, healthcare ecosystems, transit — they increasingly rely on the Internet. This is why at Cloudflare, building the fastest network is our north star. 

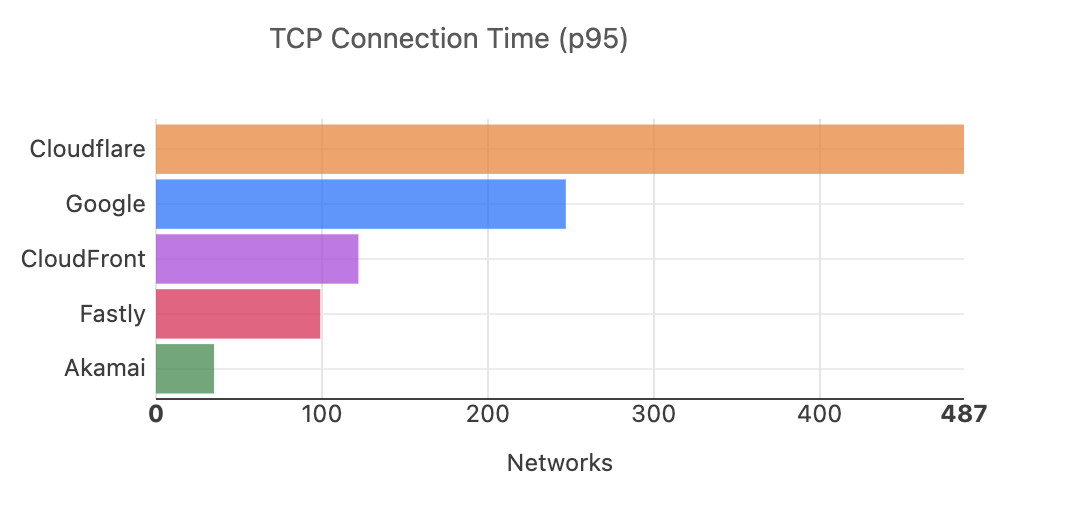
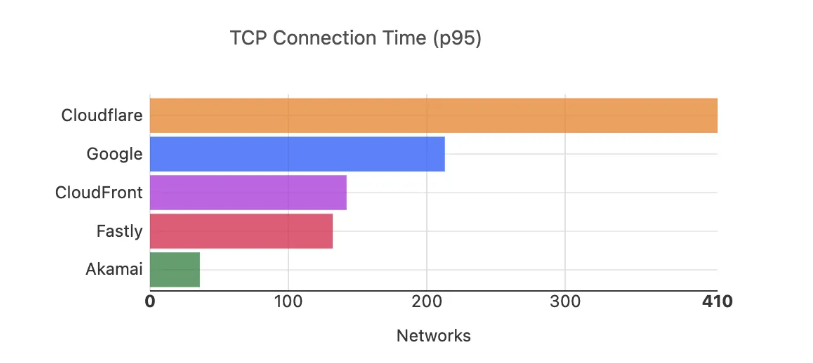
We’re happy to announce that we are the fastest network in 48% of the top 1000 networks by 95th percentile TCP connection time between November 2024, and March 2025, up from 44% in September 2024.

In this post, we’re going to share with you how our network performance has changed since our last post in September 2024, and talk about what makes us faster than other networks.  But first, let’s talk a little bit about how we get this data.

How does Cloudflare get this data?

It’s happened to all of us — you casually click on a site, and suddenly you’ve reached a Cloudflare-branded error page. While you are shaking your fist at the sky, something interesting is happening on the back end. Cloudflare is using Real User Monitoring (RUM) to collect the data used to compare our performance against other networks. The monitoring we do is slightly different than the RUM Cloudflare offers to customers. When the error page loads, a 100 KB file is fetched and loaded. This file is hosted on networks like Cloudflare, Akamai, Amazon CloudFront, Fastly, and Google Cloud CDN. Your browser processes the performance data, and sends it to Cloudflare, where we use it to get a clear view of how these different networks stack up in terms of speed. 

We’ve been collecting and refining this data since June 2021.  You can read more about how we collect that data here, and we regularly track our performance during Innovation Weeks to hold ourselves accountable to you that we are always in pursuit of being the fastest network in the world.

How are we doing?

In order to evaluate Cloudflare’s speed relative to others, we measure performance across the top 1000 “eyeball” networks using the list provided by the Asia Pacific Network Information Centre (APNIC). So-called “eyeball” networks are those with a large concentration of subscribers/end users.  This information is important, because it gives us signals for where we can expand our presence or peering, or optimize our traffic engineering. When benchmarking, we assess the 95th percentile TCP connection time. This is the time it takes a user to establish a TCP connection to the server they are trying to reach. This metric helps us illustrate how Cloudflare’s network makes your traffic faster by serving your customers as locally as possible. 

When we look at Cloudflare’s performance across the top 1000 networks, we can see that we’re fastest in 487, or over 48%, of these networks, between November 2024 and March 2025:


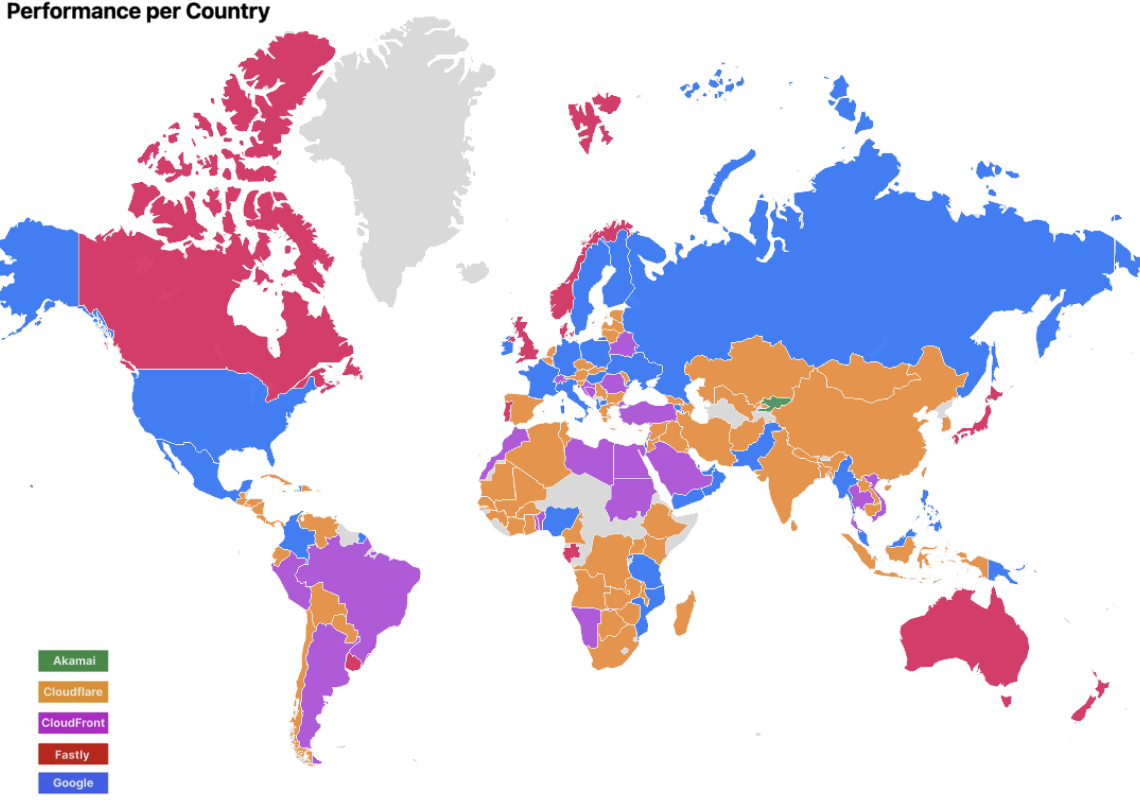
In September 2024, we ranked #1 in 44% of these networks:


So why did we jump?  To get a better understanding of why, let’s take a look at the countries where we improved, which will give us a better sense of where to dive in.  This is what our network map looked like in September 2024 (grey countries mean we do not have enough data or users to derive insights):


(September 2024)

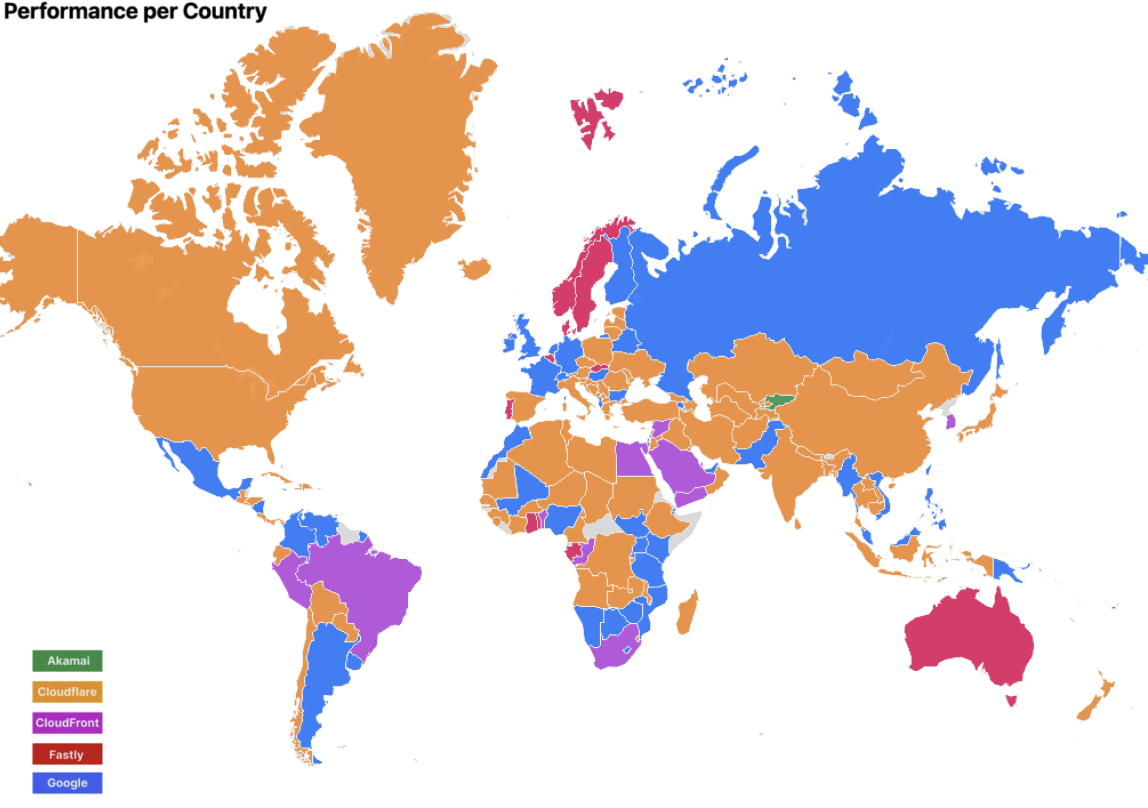
Today, using those same 95th percentile TCP connect times, we rank #1 in 48% of networks and the network map looks like this:


(March 2025)

We made most of our gains in Africa, where countries that previously didn’t have enough samples saw an increase in samples, and Cloudflare pulled ahead. This could mean that there was either an increase in Cloudflare users, or an increase in error pages shown. These countries got faster almost exclusively due to the presence of our Edge Partner deployments, which are Cloudflare locations embedded in last mile networks.  In next-generation markets like many African countries, these locations are crucial towards being faster as connectivity to end users tends to fall back to places like South Africa or London if in-country peering does not exist.

But let’s take a look at a couple of other places and see why we got faster.

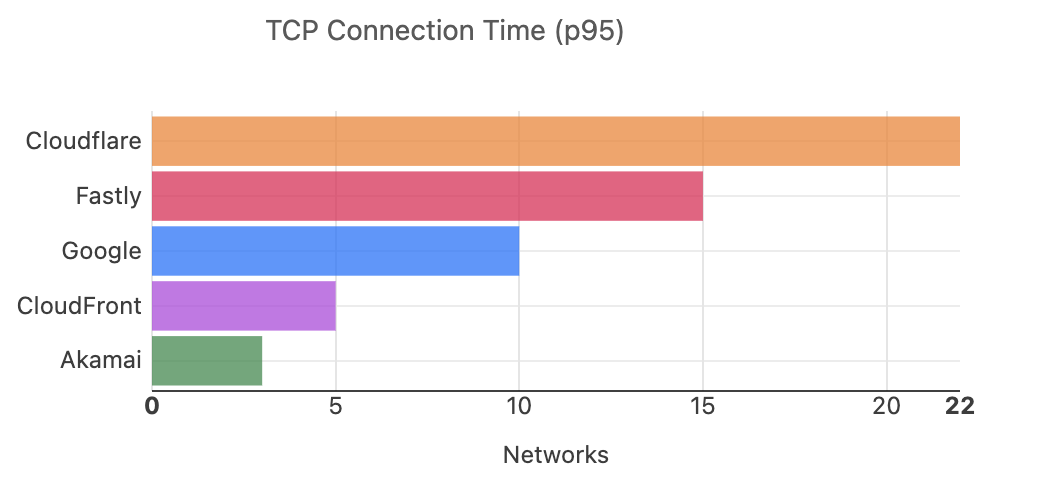
In Canada, we were not the fastest in September 2024, but we are the fastest today. Today, we are the fastest in 40% of networks, which is the most out of all of our competitors:


But when you look at the overall country numbers, we see that the race for the fastest network is quite close:

Canada 95th Percentile TCP Connect Time by Provider

Rank

Entity

Connect Time (P95)

#1 Diff

1

Cloudflare

179 ms

–

2

Fastly

180 ms

+0.48% (+0.87 ms)

3

Google

180 ms

+0.74% (+1.32 ms)

4

CloudFront

182 ms

+1.74% (+3.11 ms)

5

Akamai

215 ms 

+20% (+36 ms)

The difference between Cloudflare and the third-fastest network is a little over a millisecond!  As we’ve pointed out previously, such fluctuations are quite common, especially at higher percentiles.  But there is still a significant difference between us and the slowest network; we’re around 20% faster.

However, looking at a place like Japan where were not the fastest in September 2024 but are now the fastest, there is a significant difference between Cloudflare and the number two network:

Japan 95th Percentile TCP Connect Time by Provider

Rank

Entity

Connect Time (P95)

#1 Diff

1

Cloudflare

116 ms

–

2

Fastly

122 ms

+5.23% (+6.08 ms)

3

Google

124 ms

+6.21% (+7.22 ms)

4

CloudFront

127 ms

+8.91% (+10 ms)

5

Akamai

153 ms 

+32% (+37 ms)

Why is this? We are in more locations in Japan than our competitors and added more Edge Partner deployments in these locations, bringing us even closer to end-users. Edge Partner deployments are collaborations with ISPs, where we take space in their data centers, and peer with them directly. 

Why?

Why do we track our network performance like this? The answer is simple: to improve user experience. This data allows us to track a key performance metric for Cloudflare and the other networks. When we see that we’re lagging in a region, it serves as a signal to dig deeper into our network. 

This data is a gold mine for the teams tasked with improving Cloudflare’s network. When there are countries where Cloudflare is behind, it gives us signals for where we should expand or investigate. If we’re slow, we may need to invest in additional peering. If a region we have invested in heavily is slower, we may need to investigate our hardware.  The example from Japan shows exactly how this can benefit: we took a location where we were previously on par with our competitors, added peering in new locations, and we pulled ahead. 

On top of this map, we have autonomous system (ASN) level granularity on how we are performing on each one of the top 1000 eyeball networks, and we continuously optimize our traffic flow with each of them.  This allows us to track individual networks that may lag and improve the customer experience in those networks through turning up peering, or even adding new deployments in those regions. 

What’s next?

We’re sharing our updates on our journey to become #1 everywhere so that you can see what goes into running the fastest network in the world. From here, our plan is the same as always: identify where we’re slower, fix it, and then tell you how we’ve gotten faster.

Introducing Workers Observability: logs, metrics, and queries – all in one place

Post Syndicated from Rohin Lohe original https://blog.cloudflare.com/introducing-workers-observability-logs-metrics-and-queries-all-in-one-place/

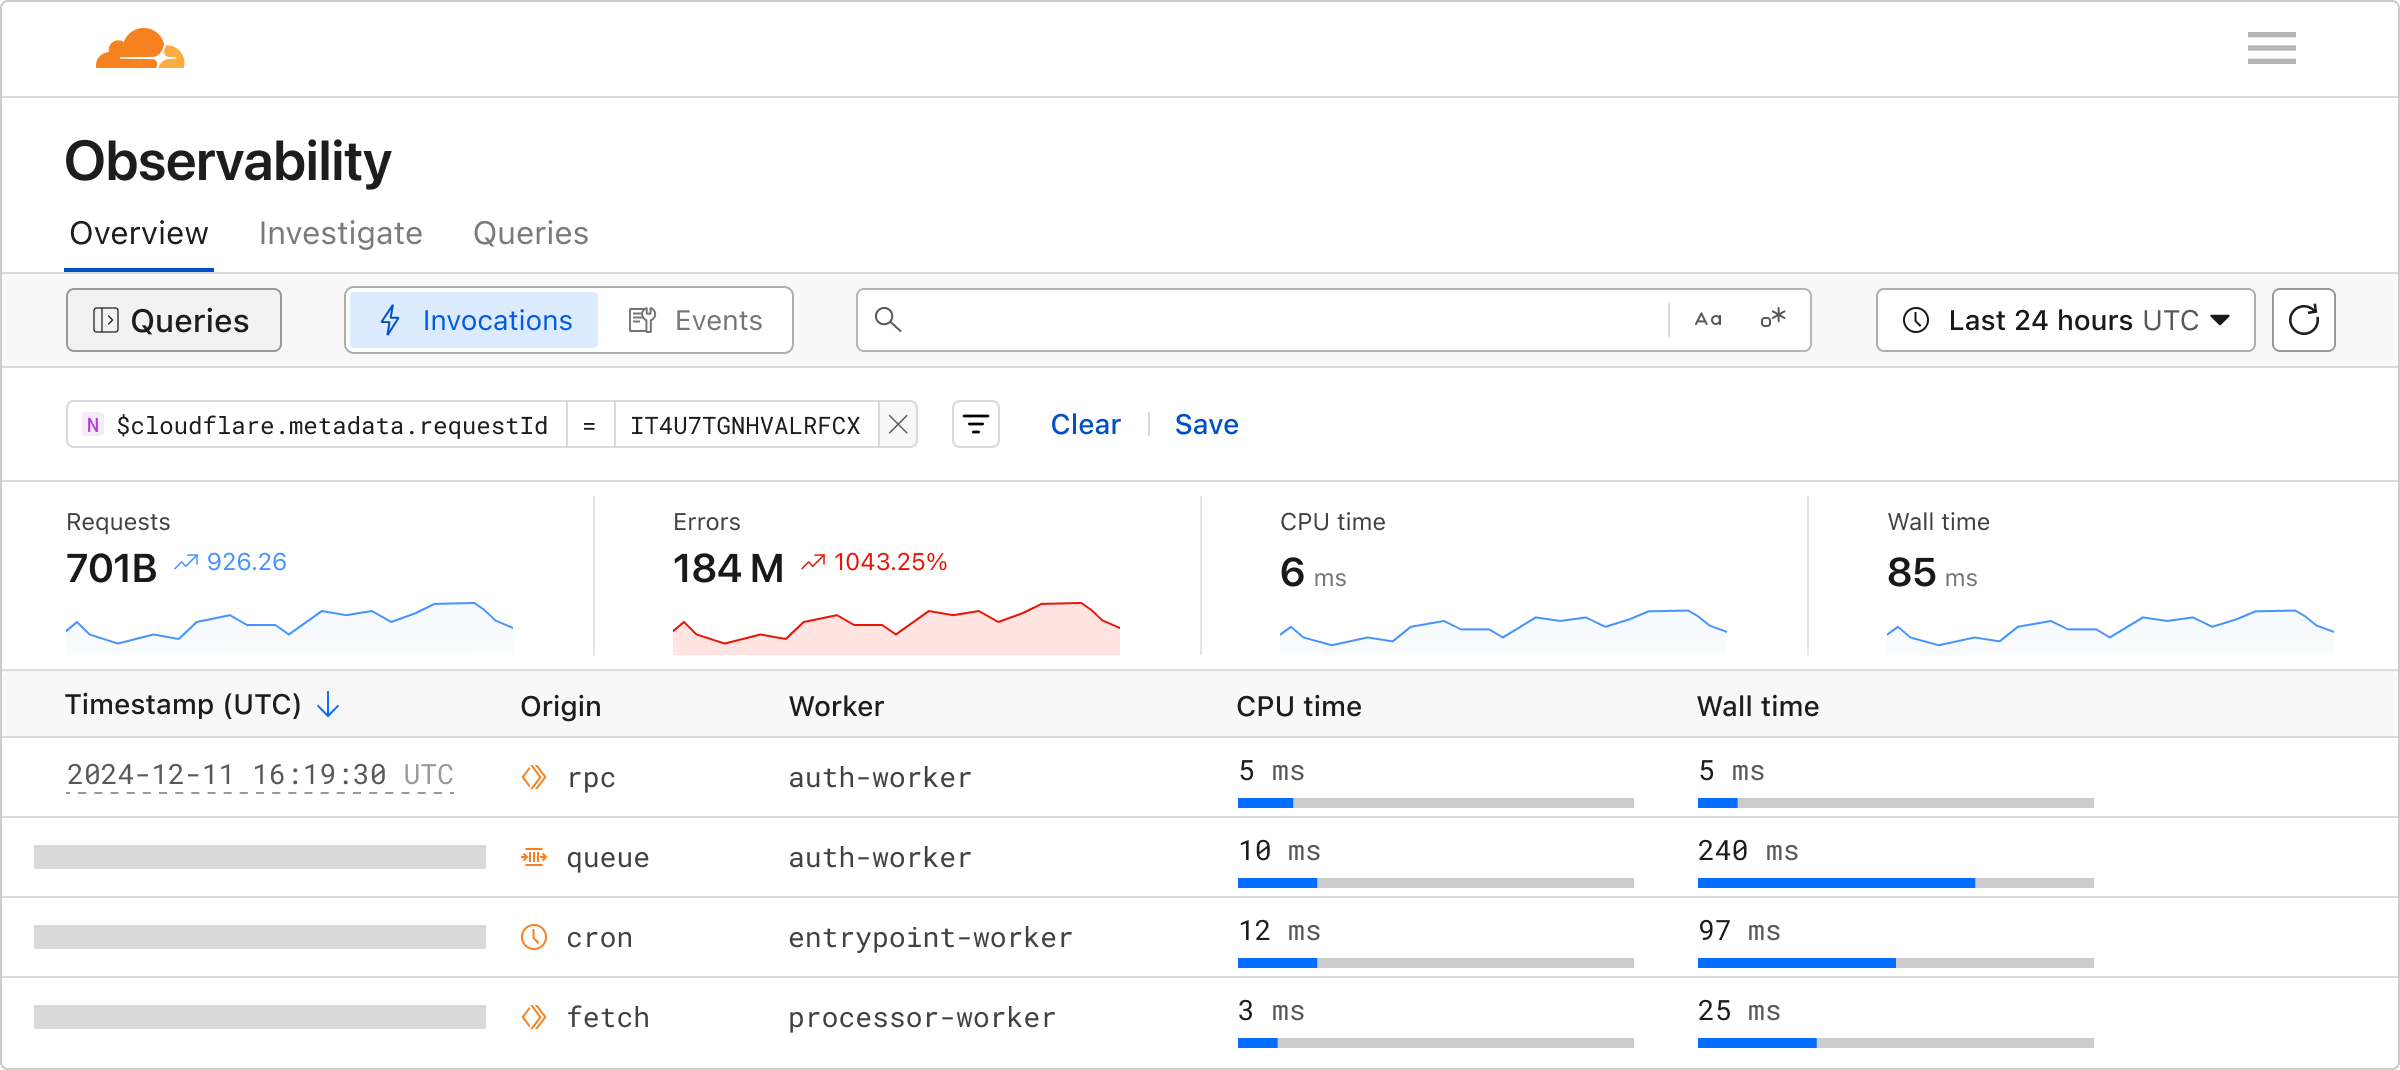
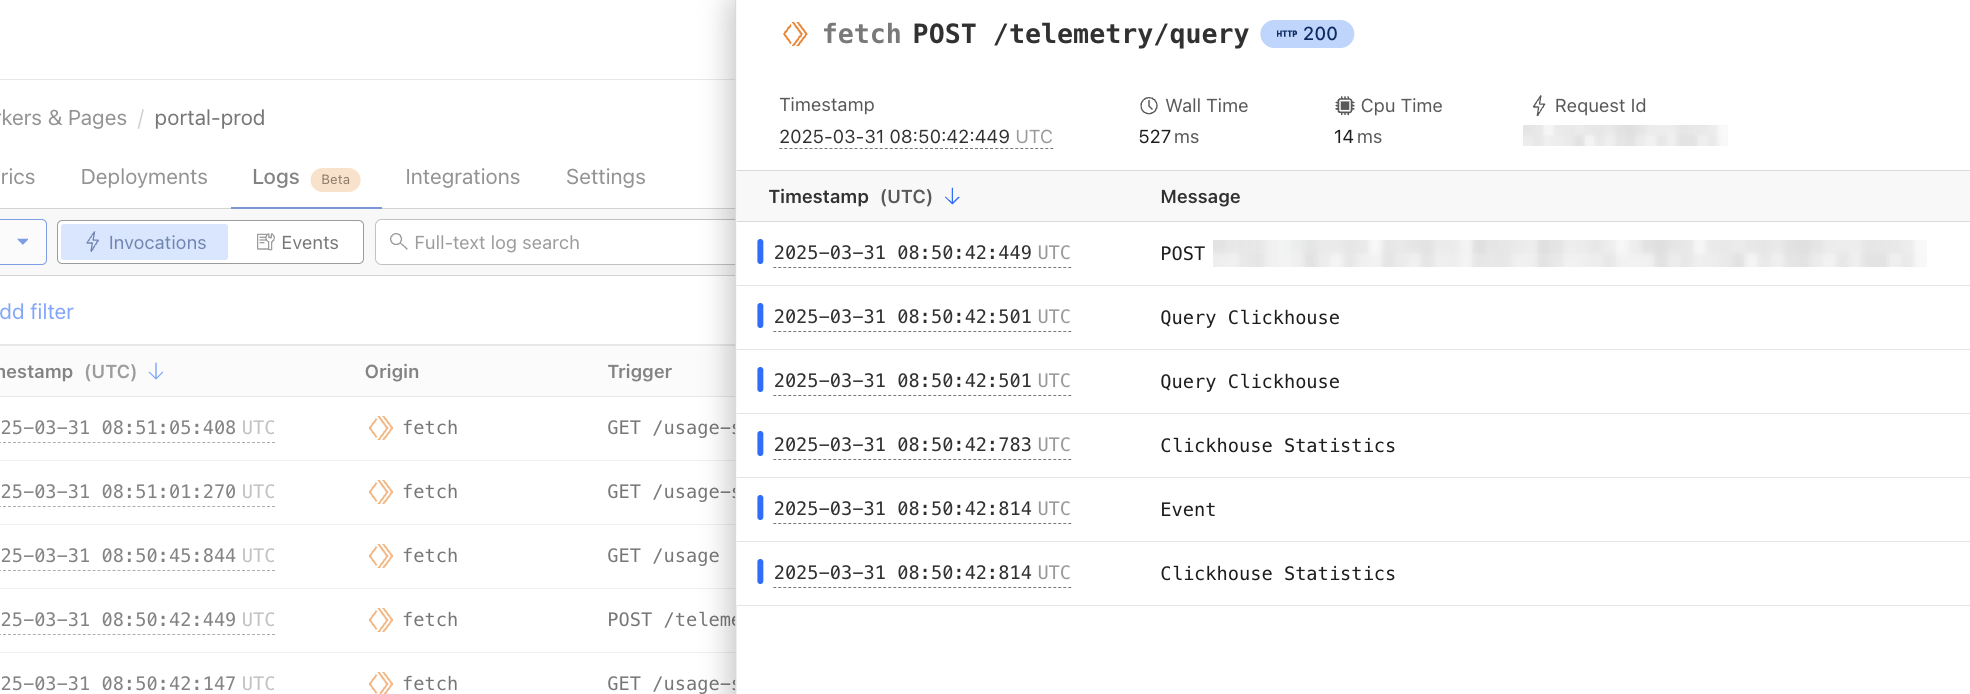
We’re excited to announce Workers Observability – a new section in the Cloudflare Dashboard that allows you to query detailed log events across all Workers in your account to extract deeper insights.

In 2024, we set out to build the best first-party observability for any cloud platform. Since then, we’ve improved metrics reporting for all resources, launched Workers Logs to automatically ingest and store logs for Workers, and rebuilt real-time logs with improved filtering. However, observability insights have been limited to a single Worker.

Starting today, you can use Workers Observability to understand what is happening across all of your Workers:

  • Workers Metrics Dashboard (Beta): A single dashboard to view metrics and logs from all of your Workers 

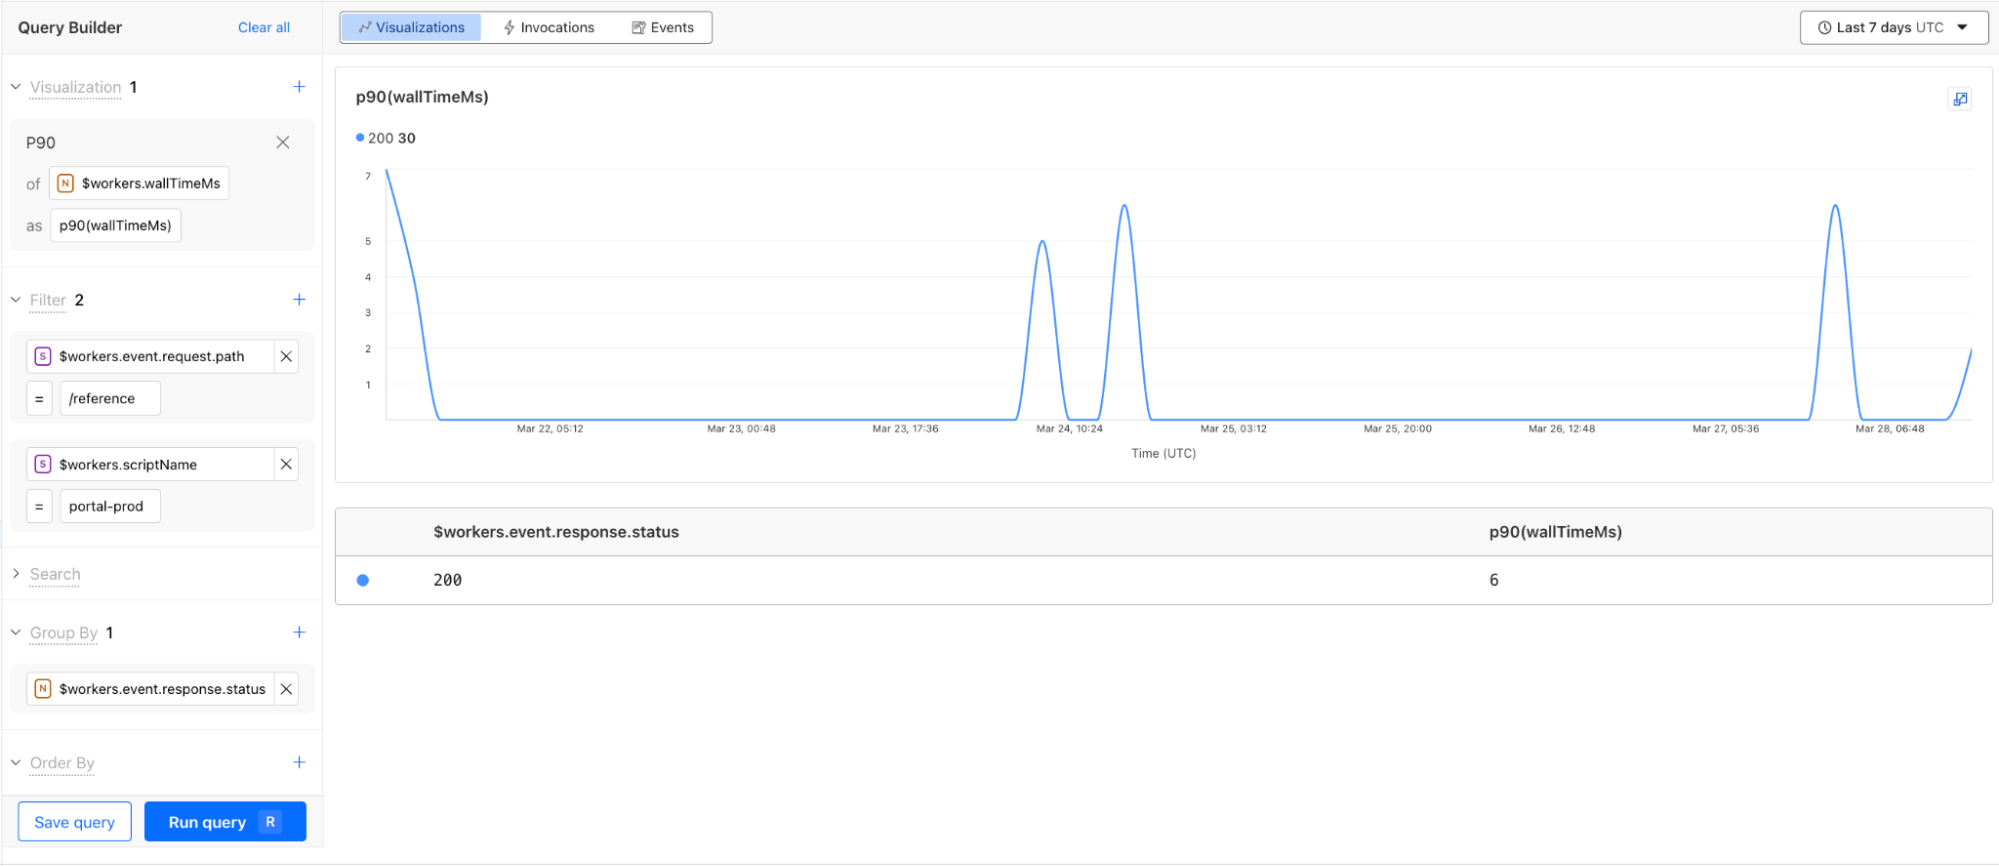
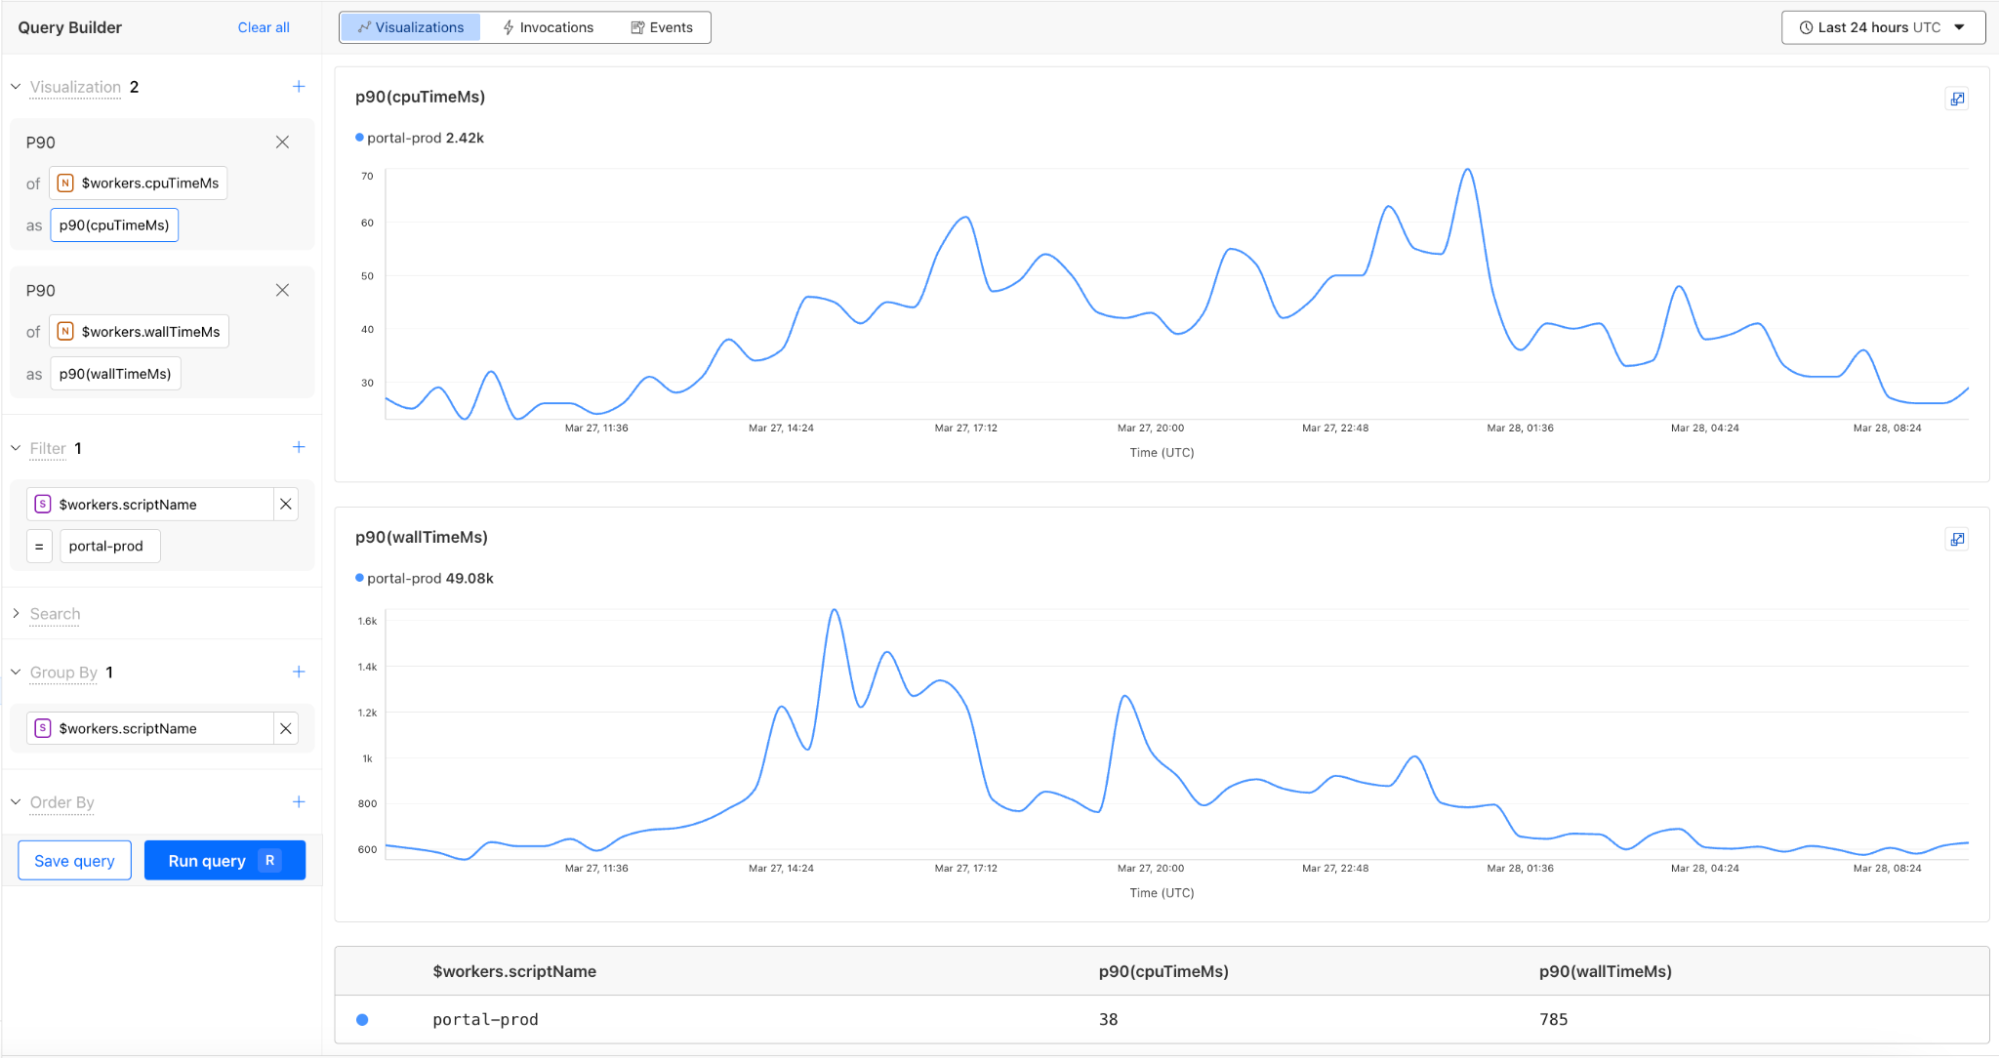
  • Query Builder (Beta): Construct structured queries to explore your logs, extract metrics from logs, create graphical and tabular visualizations, and save queries for faster future investigations.

  • Workers Logs: Now Generally Available, with a public API and improved invocation-based grouping.

Building queries 

The Query Builder allows you to interact with your logs, and answer the “why” to any question you have. You can find it by navigating to Workers & Pages > Observability in the dashboard.

Using the Query Builder, you can now answer more questions than ever. For example, this query shows the p90 wall time for 200 OK responses from the /reference endpoint is 6 milliseconds.


The key components to structuring a query in the Query Builder are:

  • Visualizations: An aggregate function like average, count, percentile, or unique that performs a calculation on a group of values to return a single value. Each aggregate function returns a graph visualization and a summary table.

  • Filters: A condition that allows you to exclude data not matching the criteria.

  • Search: A condition that only returns the data matching the specified string.

  • Group by: A function to collapse a field into only its distinct values, allowing you to more granularly apply aggregate functions.

  • Order by: A sorting function to order the returned rows.

  • Limits: A cap on the number of returned rows, allowing you to focus on what is important.

The Query Builder relies on structured logs for efficient indexed queries and extracting metrics from logs. Workers Observability natively supports and encourages structured logs. Structured logs store context-rich metadata as key-value pairs in the form of distinct fields (high dimensionality), each with many potential unique values (high cardinality). Invocation Logs, which can be enabled in your Worker, contain deep insights from Cloudflare’s network, and are a great example of a structured log. By logging important metadata as a structured log, you empower yourself to answer questions about your system that you couldn’t predict when writing the code. 

Internally at Cloudflare, we’ve already found tremendous value from this new product. During development, the Workers Observability team was able to use the Query Builder to discover a bug in the Workers Observability team’s staging environment. A query on the number of the events per script returned the following response:


After mapping this drop in recorded events against recent staging deployments, the team was able to isolate and root cause the introduction of the bug. Along with fixing the bug, the team also introduced new staging alerts to prevent errors like this from going unnoticed.


Queries built with the Query Builder or Workers Logs can be saved with a custom name and description. You can star your favorite queries, and also share them with your teammates using a shareable link, making it easier than ever to debug together and invest in developing visualizations from your telemetry data.

CPU time and wall time

You can now monitor CPU time and wall time for every Workers invocation across all of our observability offerings, including Tail Workers, Workers Logpush, and Workers Logs. These metrics help show how much time is spent executing code compared to the total elapsed time for the invocation, including I/O time.

For example, using the CPU time and wall time surfaced in the Invocation Log, you can use the Query Builder to show the p90 CPU time and wall time traffic for a single Worker script.


Revamped Workers metrics

In February, we released a new view into your Workers’ metrics to help you monitor your gradual deployments with improved visualizations. Today, we are also launching a new Workers Metrics overview page in the Observability tab. Now you can easily compare metrics across Workers and understand the current state of your deployments, all from a single view.


Invocations view

Invocations are mechanisms to trigger the execution of a Worker or Durable Object in response to an event, such as an alarm, cron job, or a fetch. 

When the Worker or Durable Object executes, log events are emitted. To date, we have surfaced logs in an events view where each log is ordered by the time it was published. 

We’re now introducing an Invocations View, so you can group and view all logs from each invocation. These views are available in each Worker’s view and the Workers Observability tab.


Workers Observability API

You can now use the Workers Observability API to programmatically retrieve your telemetry data and populate the tool of your choice.

The API allows you to automate, integrate, and customize in ways that our dashboard may not. For example, you may want to analyze your logs in a notebook or correlate your Workers logs with logs from a different source.  Leveraging the Workers Observability API can help you optimize your monitoring strategy, automate repetitive tasks, and improve flexibility in how you interact with your telemetry data.

Enable Workers Logs today

To use Workers Logs, enable it in your Workers’ settings in the dashboard or add the following configuration to your Workers’ wrangler file:

# wrangler.jsonc

{
  "observability": {
    "enabled": true,
    "logs": {
      "invocation_logs": true,
      "head_sampling_rate": 1
    }
  }
}

We’re just getting started. We have lots in store to help make Cloudflare’s developer observability best-in-class. Join us in Discord in the #workers-observability channel for feedback and feature requests.

[$] Improving hot-page detection and promotion

Post Syndicated from corbet original https://lwn.net/Articles/1016519/

Tiered-memory systems feature multiple types of memory with varying
performance characteristics; on such systems, good performance depends on
keeping the most frequently used data in the fastest memory. Identifying
that data and placing it properly is a challenge that has kept developers
busy for years. Bharata Rao, presenting remotely during a
memory-management-track session at the 2025 Linux Storage, Filesystem,
Memory-Management, and BPF Summit, led a discussion on a potential solution he has recently
posted; Raghavendra K T was also named on the
session proposal
. It seems likely, based on the discussion, that
developers working in this area will not run out of problems anytime soon.

[$] Two approaches to better kernel samepage merging

Post Syndicated from corbet original https://lwn.net/Articles/1016426/

The kernel
samepage merging (KSM)
subsystem works by finding pages in memory with
the same contents, then replacing the duplicated copies with a single,
shared copy. KSM can improve memory utilization in a system, but has some
problems as well. In two memory-management-track sessions at the 2025
Linux Storage, Filesystem, Memory-Management, and BPF Summit, Mathieu
Desnoyers and Sourav Panda proposed improvements to KSM to
make it work better for specific use cases.

OpenSSH 10.0 released

Post Syndicated from jzb original https://lwn.net/Articles/1016924/

OpenSSH
10.0
has been released. Support for the DSA signature algorithm,
which was disabled by default beginning in 2015, has been
removed. Other notable changes include using the post-quantum algorithm mlkem768x25519-sha256
for key agreement by default, support for systemd-style socket
activation in Portable OpenSSH, and moving code for user
authentication from the sshd-session binary to the new
ssh-auth binary:

Splitting this code into a separate binary ensures that the crucial
pre-authentication attack surface has an entirely disjoint address
space from the code used for the rest of the connection. It also
yields a small runtime memory saving as the authentication code will
be unloaded after the authentication phase completes. This change
should be largely invisible to users, though some log messages may now
come from “sshd-auth” instead of “sshd-session”. Downstream
distributors of OpenSSH will need to package the sshd-auth binary.

The release notes also warn that “software that naively matches
versions using patterns like “OpenSSH_1*”
” may be confused by the
new version number.

Security updates for Wednesday

Post Syndicated from jzb original https://lwn.net/Articles/1016923/

Security updates have been issued by Debian (lemonldap-ng, libbssolv-perl, and phpmyadmin), Fedora (augeas, mariadb10.11, and thunderbird), Oracle (gimp, libxslt, python3.11, python3.12, tomcat, and xorg-x11-server), Red Hat (expat, grafana, opentelemetry-collector, and webkit2gtk3), SUSE (azure-cli-core, doomsday, kernel, and poppler), and Ubuntu (dotnet8, dotnet9, erlang, and poppler).

Speaking Your Language: Expanded language support in Amazon Q Developer

Post Syndicated from Brian Beach original https://aws.amazon.com/blogs/devops/amazon-q-developer-global-capabilities/

As the world of software development becomes increasingly global, the need for tools that support multiple languages has become paramount. Today, I am excited to announce expanded language support in Amazon Q Developer. In this post, I explore the recent expansion of language support in Amazon Q Developer, a powerful platform used by developers worldwide to discuss architecture, create documentation, design interfaces, and build applications.

While English remains the lingua franca of programming, the reality of modern software development extends far beyond code. Developers worldwide use Amazon Q Developer to discuss architecture decisions, create documentation, design user interfaces, and build applications that serve global audiences. By expanding language support, Amazon Q Developer now enables developers to have more natural, fluid conversations about complex technical concepts in their preferred language, whether they’re designing system architecture, generating documentation, or planning application localization strategies.

The power of this expanded language support is demonstrated in the following image, where I asked the same container hosting question in English, Chinese, Hindi, and Spanish. Not only does Amazon Q Developer now provide complete responses in these languages, but it also maintains technical accuracy while adapting to linguistic nuances. Furthermore, Q Developer now suggests follow-up questions and responses in the user’s chosen language, creating a more intuitive and seamless experience for developers worldwide. This natural flow of conversation in any language helps maintain the developer’s focus and flow, eliminating the mental overhead of constant translation.

Four screenshots of Amazon Q chat interface showing the same conversation about hosting containers on AWS in different languages - English, Chinese, Hindi, and Spanish. Each screenshot displays Q&A format with detailed explanations about AWS container hosting options, focusing on Amazon Elastic Container Service (ECS) and including code snippets for container deployment.

Expanded language is available in the integrated development environment (IDE) and command line interface (CLI) with support coming to the AWS Management Console soon. In my IDE, chat, inline chat, inline suggestions, agents, etc. now support additional spoken languages. In the following example, I used inline chat to ask, in French, that Q Developer add TSDocs comments to my code. As you can see, Q Developer added comments, in French, documenting the method.

Code snippet showing error handling in JavaScript/TypeScript. The code includes JSDoc comments in French explaining fatal error management in the main function, followed by a catch block that logs the error and exits the process with code 1.

Whether you’re a developer in Seoul writing documentation in Korean, a startup in Madrid brainstorming architecture in Spanish, or a team in Brazil collaborating in Portuguese, Amazon Q Developer is now ready to support your journey and your preferred language. Expanded language support is available to users of both the Free and Pro Tier starting today. Get started with Amazon Q Developer, and share your feedback. Together, we’re building a more inclusive and accessible future for software development.

The IBM z17 Mainframe Brings AI with Telum II and Spyre

Post Syndicated from Patrick Kennedy original https://www.servethehome.com/the-ibm-z17-mainframe-brings-ai-with-telum-ii-and-spyre/

The IBM z17 mainframe brings new AI capabilities with the Telum II processor and its built-in AI accelerator and the PCIe-based Spyre AI cards

The post The IBM z17 Mainframe Brings AI with Telum II and Spyre appeared first on ServeTheHome.

The collective thoughts of the interwebz