Implement a CDC-based UPSERT in a data lake using Apache Iceberg and AWS Glue

Post Syndicated from Sakti Mishra original https://aws.amazon.com/blogs/big-data/implement-a-cdc-based-upsert-in-a-data-lake-using-apache-iceberg-and-aws-glue/

As the implementation of data lakes and modern data architecture increases, customers’ expectations around its features also increase, which include ACID transaction, UPSERT, time travel, schema evolution, auto compaction, and many more. By default, Amazon Simple Storage Service (Amazon S3) objects are immutable, which means you can’t update records in your data lake because it supports append-only transactions. But there are use cases where you might be receiving incremental updates with change data capture (CDC) from your source systems, and you might need to update existing data in Amazon S3 to have a golden copy. Previously, you had to overwrite the complete S3 object or folders, but with the evolution of frameworks such as Apache Hudi, Apache Iceberg, Delta Lake, and governed tables in AWS Lake Formation, you can get database-like UPSERT features in Amazon S3.

Apache Hudi integration is already supported with AWS analytics services, and recently AWS Glue, Amazon EMR, and Amazon Athena announced support for Apache Iceberg. Apache Iceberg is an open table format originally developed at Netflix, which got open-sourced as an Apache project in 2018 and graduated from incubator mid-2020. It’s designed to support ACID transactions and UPSERT on petabyte-scale data lakes, and is getting popular because of its flexible SQL syntax for CDC-based MERGE, full schema evolution, and hidden partitioning features.

In this post, we walk you through a solution to implement CDC-based UPSERT or MERGE in an S3 data lake using Apache Iceberg and AWS Glue.

Configure Apache Iceberg with AWS Glue

You can integrate Apache Iceberg JARs into AWS Glue through its AWS Marketplace connector. The connector supports AWS Glue versions 1.0, 2.0, and 3.0, and is free to use. Configuring this connector is as easy as clicking few buttons on the user interface.

The following steps guide you through the setup process:

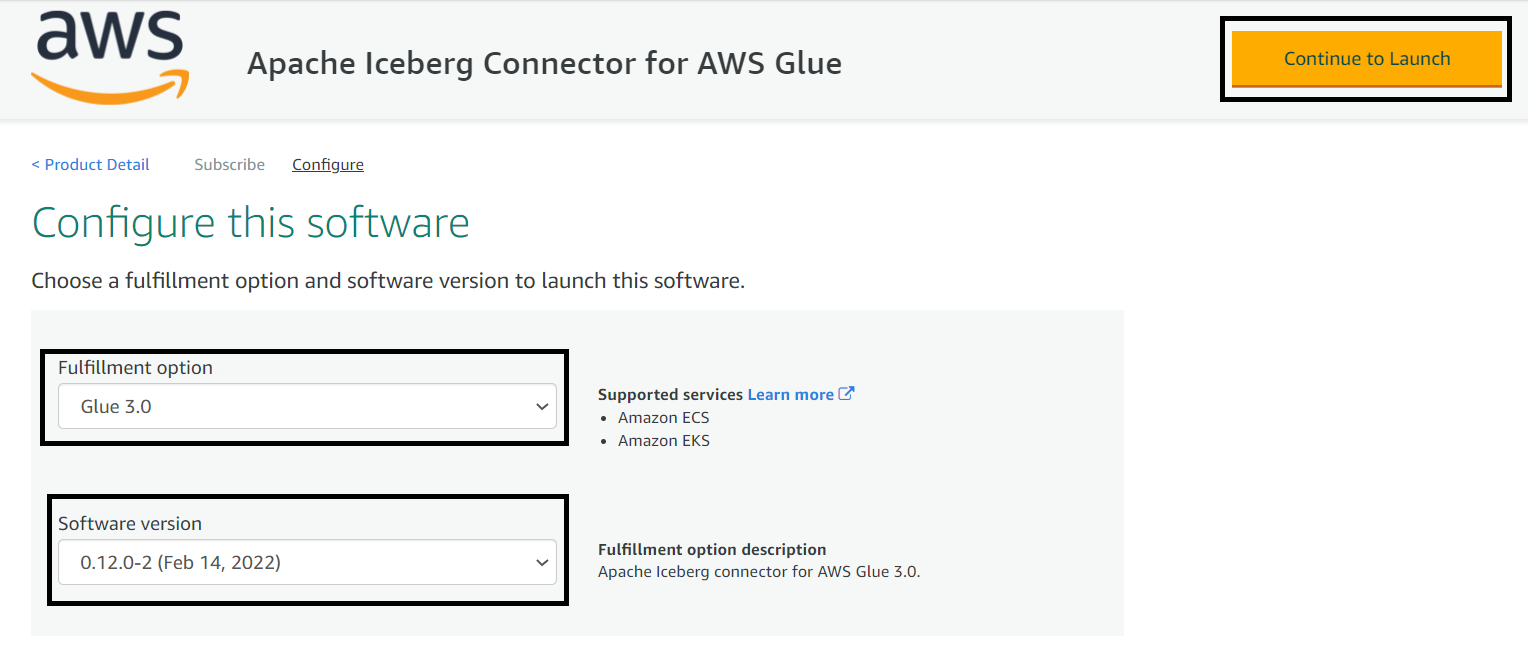
  1. Navigate to the AWS Marketplace connector page.
  2. Choose Continue to Subscribe and then Accept Terms.
  3. Choose Continue to Configuration.
  4. Choose the AWS Glue version and software version.
  5. Choose Continue to Launch.
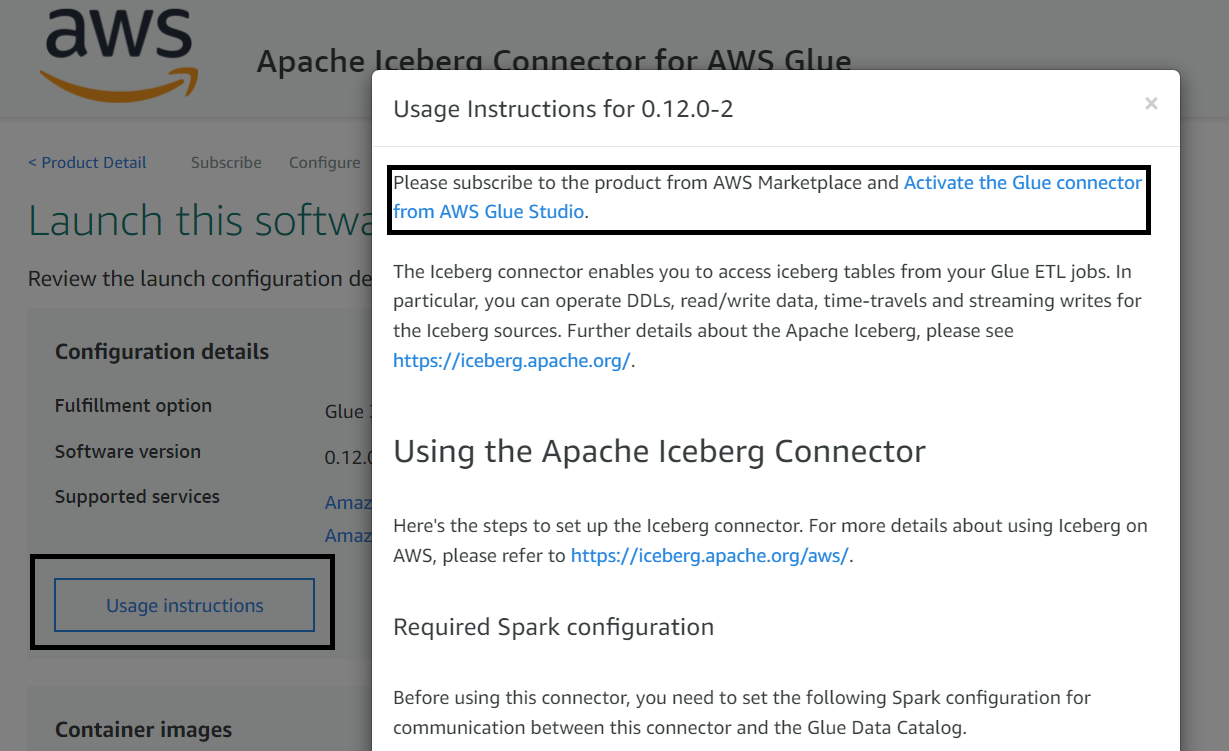
  6. Choose Usage Instruction, which opens a page that has a link to activate the connector.
  7. Create a connection by providing a name and choosing Create connection and activate connector.

You can confirm your new connection on the AWS Glue Studio Connectors page.

To use this connector, when you create an AWS Glue job, make sure you add this connector to your job. Later in the implementation steps, when you create an AWS Glue job, we show how to use the connector you just configured.

Solution overview

Let’s assume you have a relational database that has product inventory data, and you want to move it into an S3 data lake on a continuous basis, so that your downstream applications or consumers can use it for analytics. After your initial data movement to Amazon S3, you’re supposed to receive incremental updates from the source database as CSV files using AWS DMS or equivalent tools, where each record has an additional column to represent an insert, update, or delete operation. While processing the incremental CDC data, one of the primary requirements you have is merging the CDC data in the data lake and providing the capability to query previous versions of the data.

To solve this use case, we present the following simple architecture that integrates Amazon S3 for the data lake, AWS Glue with the Apache Iceberg connector for ETL (extract, transform, and load), and Athena for querying the data using standard SQL. Athena helps in querying the latest product inventory data from the Iceberg table’s latest snapshot, and Iceberg’s time travel feature helps in identifying a product’s price at any previous date.

The following diagram illustrates the solution architecture.

The solution workflow consists of the following steps:

  • Data ingestion:
    • Steps 1.1 and 1.2 use AWS Database Migration Service (AWS DMS), which connects to the source database and moves incremental data (CDC) to Amazon S3 in CSV format.
    • Steps 1.3 and 1.4 consist of the AWS Glue PySpark job, which reads incremental data from the S3 input bucket, performs deduplication of the records, and then invokes Apache Iceberg’s MERGE statements to merge the data with the target UPSERT S3 bucket.
  • Data access:
    • Steps 2.1 and 2.2 represent Athena integration to query data from the Iceberg table using standard SQL and validate the time travel feature of Iceberg.
  • Data Catalog:
    • The AWS Glue Data Catalog is treated as a centralized catalog, which is used by AWS Glue and Athena. An AWS Glue crawler is integrated on top of S3 buckets to automatically detect the schema.

We have referenced AWS DMS as part of the architecture, but while showcasing the solution steps, we assume that the AWS DMS output is already available in Amazon S3, and focus on processing the data using AWS Glue and Apache Iceberg.

To demo the implementation steps, we use sample product inventory data that has the following attributes:

  • op – Represents the operation on the source record. This shows values I to represent insert operations, U to represent updates, and D to represent deletes. You need to make sure this attribute is included in your CDC incremental data before it gets written to Amazon S3. AWS DMS enables you to include this attribute, but if you’re using other mechanisms to move data, make sure you capture this attribute, so that your ETL logic can take appropriate action while merging it.
  • product_id – This is the primary key column in the source database’s products table.
  • category – This column represents the product’s category, such as Electronics or Cosmetics.
  • product_name – This is the name of the product.
  • quantity_available – This is the quantity available in the inventory for a product. When we showcase the incremental data for UPSERT or MERGE, we reduce the quantity available for the product to showcase the functionality.
  • last_update_time – This is the time when the product record was updated at the source database.

If you’re using AWS DMS to move data from your relational database to Amazon S3, then by default AWS DMS includes the op attribute for incremental CDC data, but it’s not included by default for the initial load. If you’re using CSV as your target file format, you can include IncludeOpForFullLoad as true in your S3 target endpoint setting of AWS DMS to have the op attribute included in your initial full load file. To learn more about the Amazon S3 settings in AWS DMS, refer to S3Settings.

To implement the solution, we create AWS resources such as an S3 bucket and an AWS Glue job, and integrate the Iceberg code for processing. Before we run the AWS Glue job, we have to upload the sample CSV files to the input bucket and process it with AWS Glue PySpark code for the output.

Prerequisites

Before getting started on the implementation, make sure you have the required permissions to perform the following in your AWS account:

  • Create AWS Identity and Access Management (IAM) roles as needed
  • Read or write to an S3 bucket
  • Create and run AWS Glue crawlers and jobs
  • Manage a database, table, and workgroups, and run queries in Athena

For this post, we use the us-east-1 Region, but you can integrate it in your preferred Region if the AWS services included in the architecture are available in that Region.

Now let’s dive into the implementation steps.

Create an S3 bucket for input and output

To create an S3 bucket, complete the following steps:

  1. On the Amazon S3 console, choose Buckets in the navigation pane.
  2. Choose Create bucket.
  3. Specify the bucket name as glue-iceberg-demo, and leave the remaining fields as default.
    S3 bucket names are globally unique. While implementing the solution, you may get an error saying the bucket name already exists. Make sure to provide a unique name and use the same name while implementing the rest of the implementation steps. Formatting the bucket name as <Bucket-Name>-${AWS_ACCOUNT_ID}-${AWS_REGION_CODE} might help you get a unique name.
  4. Choose Create bucket.
  5. On the bucket details page, choose Create folder.
  6. Create two subfolders: raw-csv-input and iceberg-output.
  7. Upload the LOAD00000001.csv file into the raw-csv-input folder of the bucket.

The following screenshot provides a sample of the input dataset.

Create input and output tables using Athena

To create input and output Iceberg tables in the AWS Glue Data Catalog, open the Athena console and run the following queries in sequence:

-- Create database for the demo
CREATE DATABASE iceberg_demo;
-- Create external table in input CSV files. Replace the S3 path with your bucket name
CREATE EXTERNAL TABLE iceberg_demo.raw_csv_input(
  op string, 
  product_id bigint, 
  category string, 
  product_name string, 
  quantity_available bigint, 
  last_update_time string)
ROW FORMAT DELIMITED FIELDS TERMINATED BY ',' 
STORED AS INPUTFORMAT 'org.apache.hadoop.mapred.TextInputFormat' 
OUTPUTFORMAT 'org.apache.hadoop.hive.ql.io.HiveIgnoreKeyTextOutputFormat'
LOCATION 's3://glue-iceberg-demo/raw-csv-input/'
TBLPROPERTIES (
  'areColumnsQuoted'='false', 
  'classification'='csv', 
  'columnsOrdered'='true', 
  'compressionType'='none', 
  'delimiter'=',', 
  'typeOfData'='file');
-- Create output Iceberg table with partitioning. Replace the S3 bucket name with your bucket name
CREATE TABLE iceberg_demo.iceberg_output (
  product_id bigint,
  category string,
  product_name string,
  quantity_available bigint,
  last_update_time timestamp) 
PARTITIONED BY (category, bucket(16,product_id)) 
LOCATION 's3://glue-iceberg-demo/iceberg-output/' 
TBLPROPERTIES (
  'table_type'='ICEBERG',
  'format'='parquet',
  'write_target_data_file_size_bytes'='536870912' 
)
-- Validate the input data
SELECT * FROM iceberg_demo.raw_csv_input;

Alternatively, you can integrate an AWS Glue crawler on top of the input to create the table. Next, let’s create the AWS Glue PySpark job to process the input data.

Create the AWS Glue job

Complete the following steps to create an AWS Glue job:

  1. On the AWS Glue console, choose Jobs in the navigation pane.
  2. Choose Create job.
  3. Select Spark script editor.
  4. For Options, select Create a new script with boilerplate code.
  5. Choose Create.
  6. Replace the script with the following script:
    import sys
    from awsglue.transforms import *
    from awsglue.utils import getResolvedOptions
    from pyspark.context import SparkContext
    from awsglue.context import GlueContext
    from awsglue.job import Job
    
    from pyspark.sql.functions import *
    from awsglue.dynamicframe import DynamicFrame
    
    from pyspark.sql.window import Window
    from pyspark.sql.functions import rank, max
    
    from pyspark.conf import SparkConf
    
    args = getResolvedOptions(sys.argv, ['JOB_NAME', 'iceberg_job_catalog_warehouse'])
    conf = SparkConf()
    
    ## Please make sure to pass runtime argument --iceberg_job_catalog_warehouse with value as the S3 path 
    conf.set("spark.sql.catalog.job_catalog.warehouse", args['iceberg_job_catalog_warehouse'])
    conf.set("spark.sql.catalog.job_catalog", "org.apache.iceberg.spark.SparkCatalog")
    conf.set("spark.sql.catalog.job_catalog.catalog-impl", "org.apache.iceberg.aws.glue.GlueCatalog")
    conf.set("spark.sql.catalog.job_catalog.io-impl", "org.apache.iceberg.aws.s3.S3FileIO")
    conf.set("spark.sql.extensions", "org.apache.iceberg.spark.extensions.IcebergSparkSessionExtensions")
    conf.set("spark.sql.sources.partitionOverwriteMode", "dynamic")
    conf.set("spark.sql.iceberg.handle-timestamp-without-timezone","true")
    
    sc = SparkContext(conf=conf)
    glueContext = GlueContext(sc)
    spark = glueContext.spark_session
    job = Job(glueContext)
    job.init(args["JOB_NAME"], args)
    
    ## Read Input Table
    IncrementalInputDyF = glueContext.create_dynamic_frame.from_catalog(database = "iceberg_demo", table_name = "raw_csv_input", transformation_ctx = "IncrementalInputDyF")
    IncrementalInputDF = IncrementalInputDyF.toDF()
    
    if not IncrementalInputDF.rdd.isEmpty():
        ## Apply De-duplication logic on input data, to pickup latest record based on timestamp and operation 
        IDWindowDF = Window.partitionBy(IncrementalInputDF.product_id).orderBy(IncrementalInputDF.last_update_time).rangeBetween(-sys.maxsize, sys.maxsize)
                      
        # Add new columns to capture first and last OP value and what is the latest timestamp
        inputDFWithTS= IncrementalInputDF.withColumn("max_op_date",max(IncrementalInputDF.last_update_time).over(IDWindowDF))
        
        # Filter out new records that are inserted, then select latest record from existing records and merge both to get deduplicated output 
        NewInsertsDF = inputDFWithTS.filter("last_update_time=max_op_date").filter("op='I'")
        UpdateDeleteDf = inputDFWithTS.filter("last_update_time=max_op_date").filter("op IN ('U','D')")
        finalInputDF = NewInsertsDF.unionAll(UpdateDeleteDf)
    
        # Register the deduplicated input as temporary table to use in Iceberg Spark SQL statements
        finalInputDF.createOrReplaceTempView("incremental_input_data")
        finalInputDF.show()
        
        ## Perform merge operation on incremental input data with MERGE INTO. This section of the code uses Spark SQL to showcase the expressive SQL approach of Iceberg to perform a Merge operation
        IcebergMergeOutputDF = spark.sql("""
        MERGE INTO job_catalog.iceberg_demo.iceberg_output t
        USING (SELECT op, product_id, category, product_name, quantity_available, to_timestamp(last_update_time) as last_update_time FROM incremental_input_data) s
        ON t.product_id = s.product_id
        WHEN MATCHED AND s.op = 'D' THEN DELETE
        WHEN MATCHED THEN UPDATE SET t.quantity_available = s.quantity_available, t.last_update_time = s.last_update_time 
        WHEN NOT MATCHED THEN INSERT (product_id, category, product_name, quantity_available, last_update_time) VALUES (s.product_id, s.category, s.product_name, s.quantity_available, s.last_update_time)
        """)
    
        job.commit()

  7. On the Job details tab, specify the job name.
  8. For IAM Role, assign an IAM role that has the required permissions to run an AWS Glue job and read and write to the S3 bucket.
  9. For Glue version, choose Glue 3.0.
  10. For Language, choose Python 3.
  11. Make sure Job bookmark has default value of Enable.
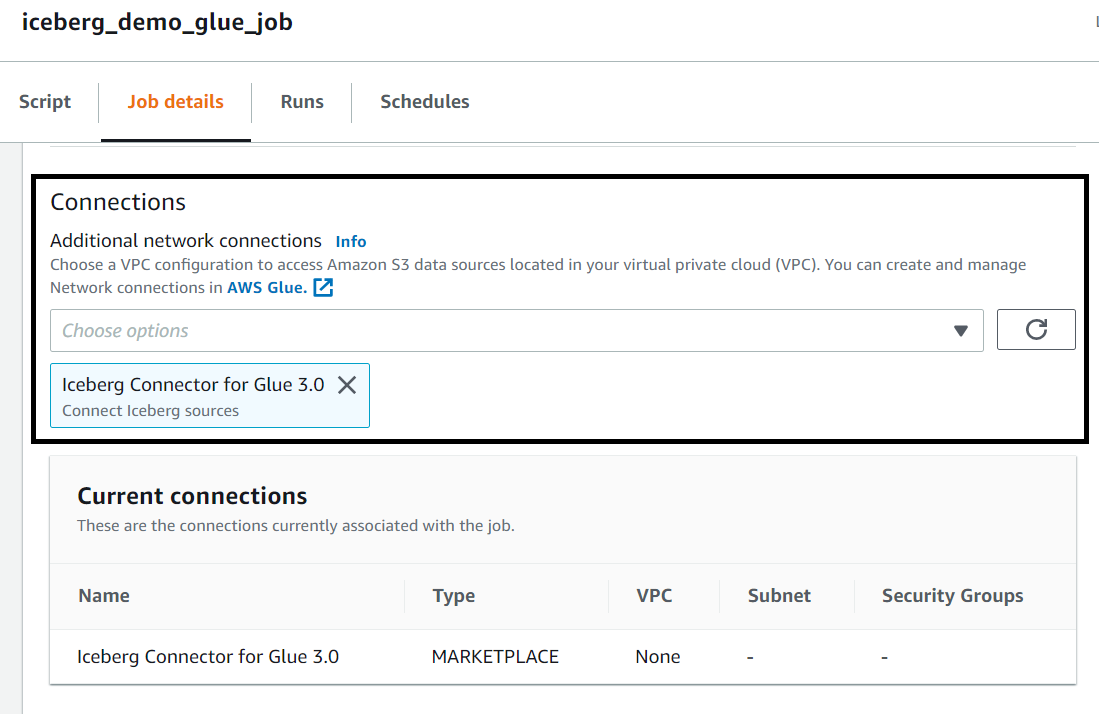
  12. Under Connections, choose the Iceberg connector.
  13. Under Job parameters, specify Key as --iceberg_job_catalog_warehouse and Value as your S3 path (e.g. s3://<bucket-name>/<iceberg-warehouse-path>).
  14. Choose Save and then Run, which should write the input data to the Iceberg table with a MERGE statement.

Because the target table is empty in the first run, the Iceberg MERGE statement runs an INSERT statement for all records.

Query the Iceberg table using Athena

After you have successfully run the AWS Glue job, you can validate the output in Athena with the following SQL query:

SELECT * FROM iceberg_demo.iceberg_output limit 10;

The output of the query should match the input, with one difference: The Iceberg output table doesn’t have the op column.

Upload incremental (CDC) data for further processing

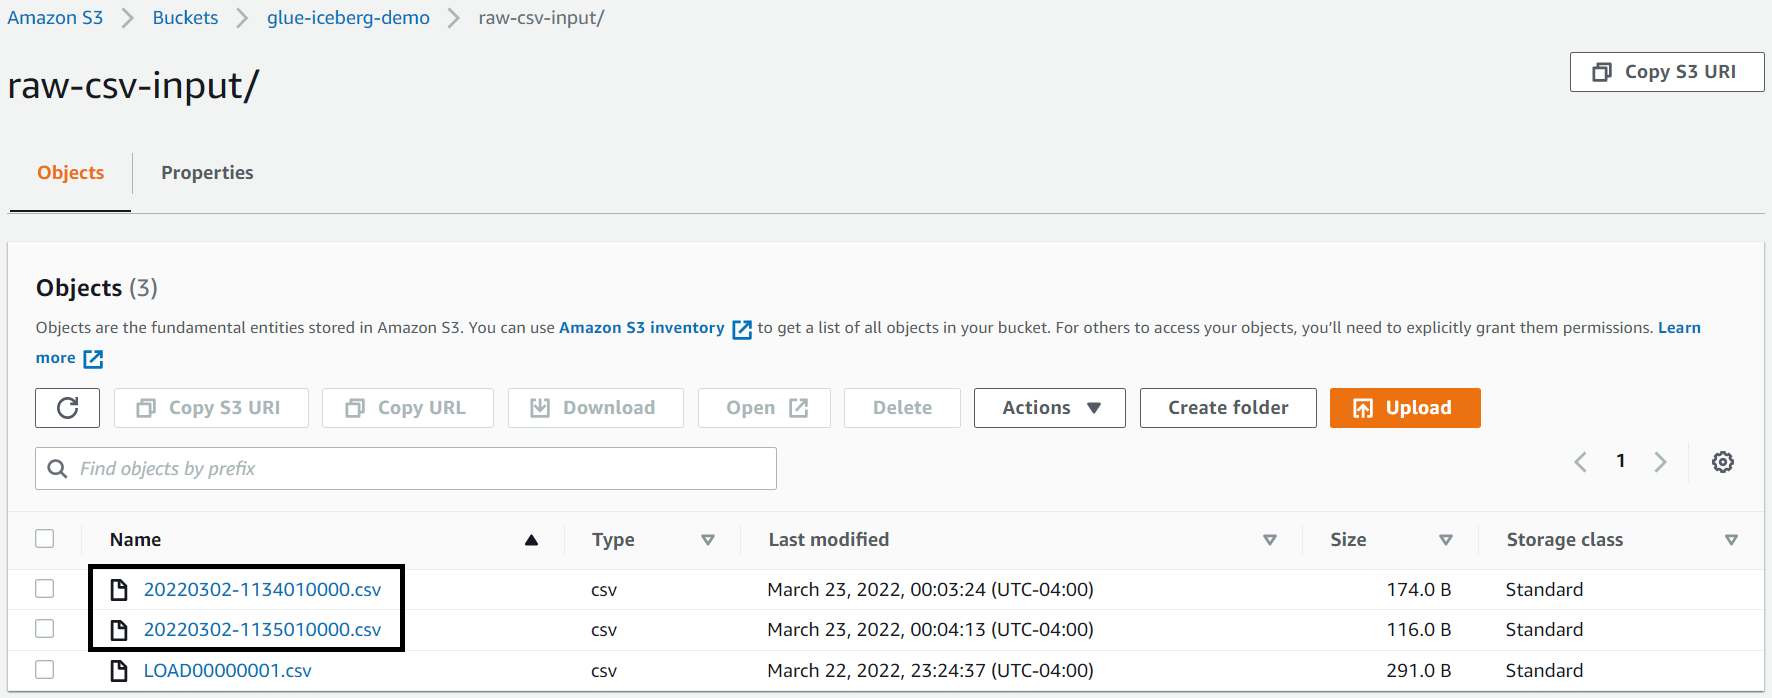
After we process the initial full load file, let’s upload the following two incremental files, which include insert, update, and delete records for a few products.

The following is a snapshot of first incremental file (20220302-1134010000.csv).

The following is a snapshot of the second incremental file (20220302-1135010000.csv), which shows that record 102 has another update transaction before the next ETL job processing.

After you upload both incremental files, you should see them in the S3 bucket.

Run the AWS Glue job again to process incremental files

Because we enabled bookmarks on the AWS Glue job, the next job picks up only the two new incremental files and performs a merge operation on the Iceberg table.

To run the job again, complete the following steps:

  • On the AWS Glue console, choose Jobs in the navigation pane.
  • Select the job and choose Run.

As explained earlier, the PySpark script is expected to deduplicate the input data before merging to the target Iceberg table, which means it only picks up the latest record of the 102 product.

For this post, we run the job manually, but you can configure your AWS Glue jobs to run as part of an AWS Glue workflow or via AWS Step Functions (for more information, see Manage AWS Glue Jobs with Step Functions).

Query the Iceberg table using Athena, after incremental data processing

After incremental data processing is complete, you can run the same SELECT statement again and validate that the quantity value is updated for record 102 and product record 103 is deleted.

The following screenshot shows the output.

Query the previous version of data with Iceberg’s time travel feature

You can run the following SQL query in Athena that uses the AS OF TIME statement of Iceberg to query the previous version of the data:

-SELECT * FROM iceberg_demo.iceberg_output FOR SYSTEM_TIME AS OF TIMESTAMP '2022-03-23 18:56:00'

The following screenshot shows the output. As you can see, the quantity value of product ID 102 is 30, which was available during the initial load.

Note that you have to change the AS OF TIMESTAMP value based on your runtime.

This concludes the implementation steps.

Considerations

The following are a few considerations you should keep in mind while integrating Apache Iceberg with AWS Glue:

  • Athena support for Iceberg became generally available recently, so make sure you review the considerations and limitations of using this feature.
  • AWS Glue provides DynamicFrame APIs to read from different source systems and write to different targets. For this post, we integrated Spark DataFrame instead of AWS Glue DynamicFrame because Iceberg’s MERGE statements aren’t supported with AWS Glue DynamicFrame APIs.
    To learn more about AWS integration, refer to Iceberg AWS Integrations.

Conclusion

This post explains how you can use the Apache Iceberg framework with AWS Glue to implement UPSERT on an S3 data lake. It provides an overview of Apache Iceberg, its features and integration approaches, and explains how you can implement it through a step-by-step guide.

I hope this gives you a great starting point for using Apache Iceberg with AWS analytics services and that you can build on top of it to implement your solution.

Appendix: AWS Glue DynamicFrame sample code to interact with Iceberg tables

  • The following code sample demonstrates how you can integrate the DynamicFrame method to read from an Iceberg table:
IcebergDyF = (
    glueContext.create_dynamic_frame.from_options(
        connection_type="marketplace.spark",
        connection_options={
            "path": "job_catalog.iceberg_demo.iceberg_output",
            "connectionName": "Iceberg Connector for Glue 3.0",
        },
        transformation_ctx="IcebergDyF",
    )
)

## Optionally, convert to Spark DataFrame if you plan to leverage Iceberg’s SQL based MERGE statements
InputIcebergDF = IcebergDyF.toDF()
  • The following sample code shows how you can integrate the DynamicFrame method to write to an Iceberg table for append-only mode:
## Use the following 2 lines to convert Spark DataFrame to DynamicFrame, if you plan to leverage DynamicFrame API to write to final target
from awsglue.dynamicframe import DynamicFrame 
finalDyF = DynamicFrame.fromDF(InputIcebergDF,glueContext,"finalDyF")

WriteIceberg = glueContext.write_dynamic_frame.from_options(
    frame= finalDyF,
    connection_type="marketplace.spark",
    connection_options={
        "path": "job_catalog.iceberg_demo.iceberg_output",
        "connectionName": "Iceberg Connector for Glue 3.0",
    },
    format="parquet",
    transformation_ctx="WriteIcebergDyF",
)

About the Author

Sakti Mishra is a Principal Data Lab Solution Architect at AWS, where he helps customers modernize their data architecture and help define end to end data strategy including data security, accessibility, governance, and more. He is also the author of the book Simplify Big Data Analytics with Amazon EMR. Outside of work, Sakti enjoys learning new technologies, watching movies, and visiting places with family.

How GE Proficy Manufacturing Data Cloud replatformed to improve TCO, data SLA, and performance

Post Syndicated from Jyothin Madari original https://aws.amazon.com/blogs/big-data/how-ge-proficy-manufacturing-data-cloud-replatformed-to-improve-tco-data-sla-and-performance/

This is post is co-authored by Jyothin Madari, Madhusudhan Muppagowni and Ayush Srivastava from GE.

GE Proficy Manufacturing Data Cloud (MDC), part of the GE Digital’s Manufacturing Execution Systems (MES) suite of solutions, allows GED’s customers to increase the derived value easily and quickly from the MES by reliably bringing enterprise-wide manufacturing data into the cloud and transforming it into a structured dataset for advanced analytics and deeper insights into the manufacturing processes.

In this post, we share how MDC modernized the hybrid cloud strategy by replatforming. This solution improved scalability, their data availability Service Level Agreement (SLA), and performance.

Challenge

MDC v1 was built on Predix services using industrial use case-optimized Predix services such as Predix Columnar Store (Cassandra) and Predix Insights (Amazon EMR). MDC evolved in both features and the underlying platform over the past year with a goal to improve TCO, data SLA, and performance. MDC’s customer base grew and the number of sites from customers grew to over 100 in the past couple of years. The increased number of sites needed more compute and storage capacity. This increased infrastructure and operational cost significantly, while introducing increased data latency and lowering the data freshness interval from the cloud.

How we started

MDC evaluated several vendors for their storage and compute capabilities using various measurements: security, performance, scalability, ease of management and operation, reduction of overall cost and increase in ROI, partnership, and migration help (technology assistance). The MDC team saw opportunities to improve the product by using native AWS services such as Amazon Redshift, AWS Glue, and Amazon Managed Workflows for Apache Airflow (Amazon MWAA), which made the product more performant and scalable while reducing operation costs and making it future-ready for advanced analytics and new customer use cases.

The GE Digital team, comprised of domain experts, developers, and QA, worked shoulder to shoulder with the AWS ProServe team, comprised of Solution Architects, Data Architects, and Big Data Experts, in determining the key architectural changes required and solutions to implementation challenges.

Overview of solution

The following diagram illustrates the high-level architecture of the solution.

This is a broad overview, and the specifics of networking and security between components are out of scope for this post.

The solution includes the following main steps and components:

  1. CDC and log collector – Compressed CSV data is collected from over 100 Manufacturing Data Sources Proficy Plant Applications and sinked into an Amazon Simple Storage Service (Amazon S3) bucket.
  2. S3 raw bucket – Our data lands in Amazon S3 without any transformation, but appropriately partitioned (tenant, site, date, and so on) for the ease of future processing.
  3. AWS Lambda – When the file lands in the S3 raw bucket, it triggers an S3 event notification, which invokes AWS Lambda. Lambda extracts metadata (bucket name, key name, date, and so on) from the event and saves it in Amazon DynamoDB.
  4. AWS Glue – Our goal is now to take CSV files, with varying schemas, and convert them into Apache Parquet format. An AWS Glue extract, transform, and load (ETL) job reads a list of files to be processed from the DynamoDB table and fetches them from the S3 raw bucket. We have preconfigured unified AVRO schemas in the AWS Glue Schema Registry for schema conversion. Converted data lands in the S3 raw Parquet bucket.
  5. S3 raw Parquet bucket – Data in this bucket is still raw and unmodified; only the format was changed. This intermediary storage is required due to schema and column order mismatch in CSV files.
  6. Amazon Redshift – The majority of transformations and data enrichment happens in this step. Amazon Redshift Spectrum consumes data from the S3 raw Parquet bucket and external PostgreSQL dimension tables (through a federated query). Transformations are performed via stored procedures, where we encapsulate logic for data transformation, data validation, and business-specific logic. The Amazon Redshift cluster is configured with concurrency scaling, auto workload management (WLM) with caching, and the latest RA3 instance types.
  7. MDC API – These custom-built, web-based, REST API microservices talk on the backend with Amazon Redshift and expose data to external users, business intelligence (BI) tools, and partners.
  8. Amazon Redshift data export and archival – On a scheduled basis, Amazon Redshift exports (UNLOAD command) contextualized and business-defined aggregated data. Exports are landed in the S3 bucket as Apache Parquet files.
  9. S3 Parquet export bucket – This bucket stores the exported data (hundreds of TBs) used by external users who need to run extensive, heavy analytics and AI or machine learning (ML) with various tools (such as Amazon EMR, Amazon Athena, Apache Spark, and Dremio).
  10. End-users – External users consume data from the API. The main use case here is reporting and visual analytics.
  11. Amazon MWAA – The orchestrator of the solution, Amazon MWAA is used for scheduling Amazon Redshift stored procedures, AWS Glue ETL jobs, and Amazon Redshift exports at regular intervals with error handling and retries built in.

Bringing it all together

MDC replaced both Predix Columnar Store (Cassandra) and Predix Insights (Amazon EMR) with Amazon Redshift for both storage of the MDC data models and compute (ELT). Amazon MWAA is used to schedule the workloads that do the bulk of the ELT. Lambda, AWS Glue, and DynamoDB are used to normalize the schema differences between sites. It was important not to disrupt MDC customers while replatforming. To achieve this, MDC used a phased approach to migrate the data models to Amazon Redshift. They used federated queries to query existing PostgreSQL for dimensional data, which facilitated having some of the data models in Amazon Redshift, while the others were in Cassandra with no interruption to MDC customers. Redshift Spectrum facilitated querying the raw data in Amazon S3 directly both for ETL and data validation.

75% of the MDC team along with the AWS ProServe team and AWS Solution Architects collaborated with the GE Digital Security Team and Platform Team to implement the architecture with AWS native services. It took approximately 9 months to implement, secure, and performance tune the architecture and migrate data models in three phases. Each phase has gone through a GE Digital internal security review. Amazon Redshift Auto WLM, short query acceleration, and tuning the sort keys to optimize querying patterns improved the Proficy MDC API performance. Because the unload of the data from Amazon Redshift was fast, Proficy MDC is now able to export the data much more frequently to our end customers.

Conclusion

With replatforming, Proficy MDC was able to improve ETL performance by approximately 75%. Data latency and freshness improved by approximately 87%. The solution reduced TCO of the platform by approximately 50%. Proficy MDC was also able reduce the infrastructure and operational cost. Improved performance and reduced latency has allowed us to speed up the next steps in our journey to modernize the enterprise data architecture and hybrid cloud data platform.


About the Authors

Jyothin Madari leads the Manufacturing Data Cloud (MDC) engineering team; part of the manufacturing suite of products at GE Digital. He has 18 years of experience, 4 of which is with GE Digital. Most recently he has been working on data migration projects with an aim to reduce costs and improve performance. He is an AWS Certified Cloud Practitioner, a keen learner and loves solving interesting problems. Connect with him on LinkedIn.

Madhusudhan (Madhu) Muppagowni is a Technical Architect and Principal Software Developer based in Silicon Valley, Bay Area, California.  He is passionate about Software Development and Architecture. He thrives on producing Well-Architected and Secure SaaS Products, Data Pipelines that can make a real impact.  He loves outdoors and an avid hiker and backpacker. Connect with him on LinkedIn.

Ayush Srivastava is a Senior Staff Engineer and Technical Anchor based in Hyderabad, India. He is passionate about Software Development and Architecture. He has Demonstrated track record of successfully technical anchoring small to large Secure SaaS Products, Data Pipelines from start to finish. He loves exploring different places and he says “I’m in love with cities I have never been to and people I have never met.” Connect with him on LinkedIn.

Karen Grygoryan is Data Architect with AWS ProServe. Connect with him on LinkedIn.

Gnanasekaran Kailasam is a Data Architect at AWS. He has worked with building data warehouses and big data solutions for over 16 years. He loves to learn new technologies and solving, automating, and simplifying customer problems with easy-to-use cloud data solutions on AWS. Connect with him on LinkedIn.

[$] Remote participation at LSFMM

Post Syndicated from original https://lwn.net/Articles/897915/

As with many conferences these days, the
2022 Linux Storage,
Filesystem, Memory-management and BPF Summit
(LSFMM) had a virtual
component. The main rooms were equipped with a camera trained on the
podium, thus the session leader, so that
remote participants could watch; this camera connected into a Zoom
conference that allowed participation from afar. In a session near the
end of the conference, led by conference organizer Josef Bacik, remote
participants were invited to share their
experiences—on camera—with those who were there in person. It was an
opportunity to discuss what went right—and wrong—with an eye toward
improving the experience for future events.

Let’s Architect! Architecting for front end

Post Syndicated from Luca Mezzalira original https://aws.amazon.com/blogs/architecture/lets-architect-architecting-for-front-end/

Many workloads in the cloud need a front-end interface for interacting with APIs, either for populating content or for consuming it. This edition of Let’s Architect! shows you how to scale your front-end applications and serve data across multiple devices.

Micro-frontend Architectures on AWS

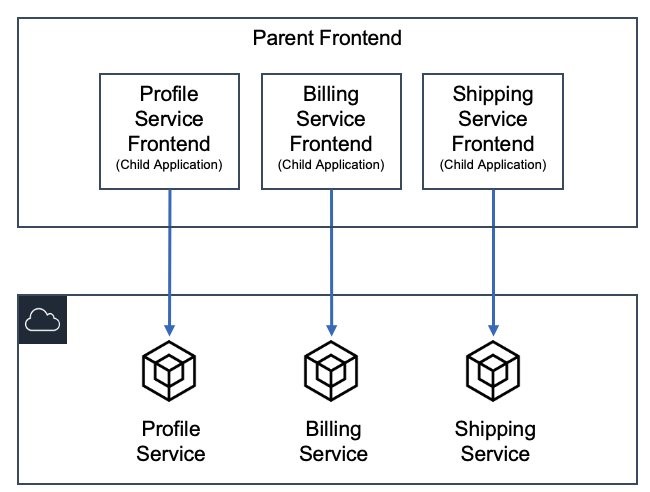
Micro-frontends are the technical representation of a business subdomain, they allow independent implementations with the same or different technology.

They help minimize the code shared with other subdomains and are owned by a single team. This blog post shows you how to apply client-side rendering micro-frontends in AWS.

Microservices backend with the micro-frontends

Microservices backend with the micro-frontends

Building serverless micro frontends at the edge

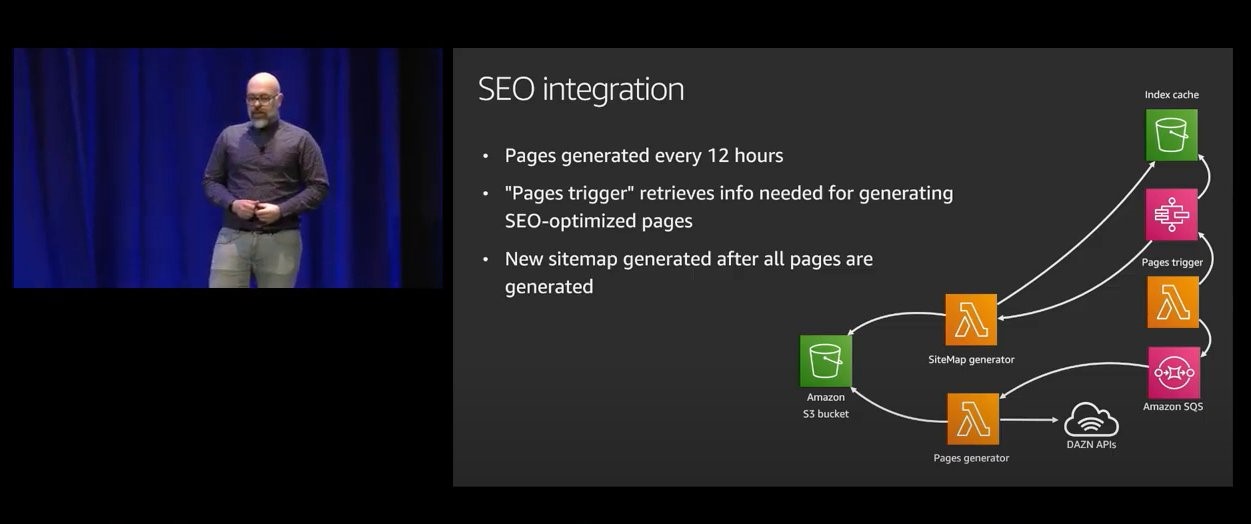
Microservices architectures use techniques like canary releases or blue-green deployments to reduce the blastradius of issues deployed in production. In this video, you’ll learn how Ryanair scaled their front-end practice across their website and how to implement these techniques using Lambda@Edge and Amazon CloudFront.

A serverless architecture designed using AWS Step Functions for SEO integration of micro-frontends

A serverless architecture designed using AWS Step Functions for SEO integration of micro-frontends

Introduction to GraphQL

Many companies build APIs with GraphQL because it gives front-end developers the ability to query multiple databases, microservices, and APIs with a single GraphQL endpoint.

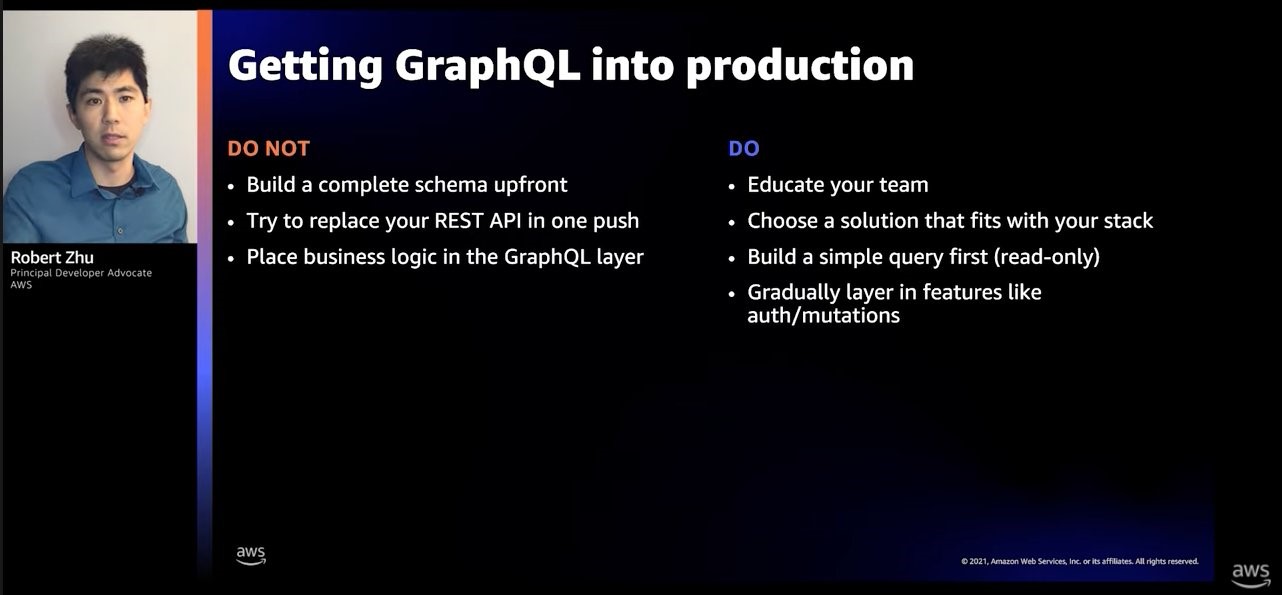
This video introduces asynchronous APIs, GraphQL, and the most common architectural patterns to work with. It also provides a starting point to understand the differences between REST and GraphQL as well as  mental models to identify the right tool for each job.

Some recommended practices to consider while getting a GraphQL API into production

Some recommended practices to consider while getting a GraphQL API into production

Mocking and Testing Serverless APIs with AWS Amplify

This video covers how to write successful tests against an API backend using AWS Amplify. Amplify speeds up the development of your front-end and serverless backend applications.

Thanks to its low-code approach, you can focus on writing the business logic of your applications without the need to create the plumbing between services. If you need to add more configurations using Amplify, review its custom resources.

The Amplify Command Line Interface (CLI) is a unified toolchain to create, integrate, and manage cloud services for your application

The Amplify Command Line Interface (CLI) is a unified toolchain to create, integrate, and manage cloud services for your application

See you next time!

Thanks for reading! See you in a couple of weeks when we discuss technological lock-in.

Other posts in this series

Looking for more architecture content?

AWS Architecture Center provides reference architecture diagrams, vetted architecture solutions, Well-Architected best practices, patterns, icons, and more!

Capturing GPU Telemetry on the Amazon EC2 Accelerated Computing Instances

Post Syndicated from Sheila Busser original https://aws.amazon.com/blogs/compute/capturing-gpu-telemetry-on-the-amazon-ec2-accelerated-computing-instances/

This post is written by Amr Ragab, Principal Solutions Architect EC2.

AWS is excited to announce the native integration of monitoring GPU metrics through the CloudWatch Agent. Customers can now easily monitor GPU utilization and its memory to scale their workloads more effectively without custom scripts. In this post, we’ll describe how to allow GPU monitoring and integrate it into your Amazon Machine Images (AMI). Furthermore, we’ll extend this to include the monitoring of GPU hardware events utilizing CloudWatch Log Streams. By combining this telemetry into the Amazon CloudWatch Console, customers can have a complete picture of GPU activity across their fleets.

Capturing GPU metrics

There is an extensive list of NVIDIA accelerator metrics that can be captured. Depending on the workload type, it may be unnecessary to capture all of the metrics at all times. The following table breaks down the suggested metrics to collect by workload type. This considers a balance of cost and impactful metrics at scale.

Compute (Machine Learning (ML), High Performance Computing (HPC)) Graphics/Gaming
utilization_gpu
power_draw
utilization_memory
memory_total
memory_used
memory_free
pcie_link_gen_current
pcie_link_width_current
clocks_current_smclocks_current_memory
utilization_gpu
utilization_memory
memory_total
memory_usedmemory_free
pcie_link_gen_current
pcie_link_width_current
encoder_stats_session_count
encoder_stats_average_fps
encoder_stats_average_latency
clocks_current_graphics
clocks_current_memory
clocks_current_video

Moreover, this is supported through custom AMIs that are deployed with managed service offerings, including Amazon Elastic Kubernetes Service (Amazon EKS), Amazon Elastic Container Services (Amazon ECS), and AWS ParallelCluster w/ SLURM for HPC clusters.

The following is an example screenshot from the CloudWatch Console showcasing the telemetry captured for a P4d instance. You can see that we captured the preceding metrics on a per-GPU index. Each Amazon Elastic Compute Cloud (Amazon EC2) P4d instance has 8x A100 GPUs.

Cloudwatch Console

Capturing GPU Xid events

Xid events are a reporting mechanism from GPU hardware vendors that emit notable events from the device to the OS in this case we are capturing the events through the NVRM kernel module. Current GPU architecture requires that the full GPU with protections are passed into the running instance. Thus, most errors that manifest inside of the customer instance aren’t directly visible to the Amazon EC2 virtualization stack. Although some of these errors are benign, others indicate problems with the customer application, the NVIDIA driver, and under rare circumstances a defect in the GPU hardware.

For NVIDIA-based Amazon EC2 instances, these errors will be logged in the system journal with an “NVRM:” regular expression.

These events can be collected and pushed to Amazon CloudWatch Logs as a stream. When an Xid event occurs on the GPU, it will parse the event and push it the log stream for that instance ID in the Region in which the instance is running. The following steps are required to get started capturing those events.

Deployment

We’ll cover the deployment in two different use-cases: 1. You have an existing instance running and you want to start to capture metrics and XID events. 2. You want to build and an AMI and use it within Amazon EC2 or additional services.

I. On a running Amazon EC2 instance

Step 1. Attach an IAM Role to the EC2 instance that has permission to CloudWatch Metrics/Logs. The following is an IAM policy that you can attach to your IAM Role.

{
    "Version": "2012-10-17",
    "Statement": [
        {
            "Sid": "1",
            "Effect": "Allow",
            "Action": [
                "cloudwatch:PutMetricStream",
                "logs:CreateLogDelivery",
                "logs:CreateLogStream",
                "cloudwatch:PutMetricData",
                "logs:UpdateLogDelivery",
                "logs:CreateLogGroup",
                "logs:PutLogEvents",
                "cloudwatch:ListMetrics"
            ],
            "Resource": "*"
        }
    ]
}

Step 2. Connect to a shell on the EC2 instance (through SSM or SSH). Install the CloudWatch Agent following the instructions here. There is support across architectures and distributions.

Step 3. Next, we can create our CloudWatch Agent JSON configuration file. The following JSON snippet will capture the logs from gpuerrors.log and push to CloudWatch Logs. Save the contents of the following JSON snippet to a file on the instance at /opt/aws/amazon-cloudwatch-agent/etc/amazon-cloudwatch-agent.json.

{
     "agent": {
         "run_as_user": "root"
     },
     "metrics": {
         "append_dimensions": {
             "AutoScalingGroupName": "${aws:AutoScalingGroupName}",
             "ImageId": "${aws:ImageId}",
             "InstanceId": "${aws:InstanceId}",
             "InstanceType": "${aws:InstanceType}"
         },
         "aggregation_dimensions": [["InstanceId"]],
         "metrics_collected": {
            "nvidia_gpu": {
                "measurement": [
                    "utilization_gpu",
                    "utilization_memory",
                    "memory_total",
                    "memory_used",
                    "memory_free",
                    "clocks_current_graphics",
                    "clocks_current_sm",
                    "clocks_current_memory"
                ]
            }
         }
     },
     "logs": {
         "logs_collected": {
             "files": {
                 "collect_list": [
                     {
                         "file_path": "/var/log/gpuevent.log",
                         "log_group_name": "/ec2/accelerated/accel-event-log",
                         "log_stream_name": "{instance_id}"
                     }
                 ]
             }
         }
     }
 }

Step 4. To start capturing the logs, restart the aws cloudwatch systemd service.

sudo systemctl restart amazon-cloudwatch-agent.service

At this point, if you navigate to the CloudWatch Console in the Region that the instance is running, – All metrics – CWAgent, you should see a table of metrics similar to the following screenshot.

Cloudwatch Agent Metrics

Step 5. To capture the XID events it’s possible to use the same CloudWatch Log directive used in the preceding image were set the GPU metrics to capture. The JSON following snippet defines that we will stream the log in /var/log/gpuevent.log to CloudWatch.

"logs": {
         "logs_collected": {
             "files": {
                 "collect_list": [
                     {
                         "file_path": "/var/log/gpuevent.log",
                         "log_group_name": "/ec2/accelerated/accel-event-log",
                         "log_stream_name": "{instance_id}"
                     }
                 ]
             }
         }
     }

The GitHub project is an open source reference design for capturing these errors in the CloudWatch agent.

https://github.com/aws-samples/aws-efa-nccl-baseami-pipeline

Step 6. Save the following file as /opt/aws/aws-hwaccel-event-parser.py|.go with the following contents, which will write the Xid errors parsed to /var/log/gpuevent.log:

The code is available in either Python3 or Go (> 1.16).

Golang code of the hwaccel-event-parser: https://github.com/aws-samples/aws-efa-nccl-baseami-pipeline/blob/master/nvidia-efa-ami_base/cloudwatch/nvidia/aws-hwaccel-event-parser.go

Python3 code: https://github.com/aws-samples/aws-efa-nccl-baseami-pipeline/blob/master/nvidia-efa-ami_base/cloudwatch/nvidia/aws-hwaccel-event-parser.py

As you can see from the code, this is a blocking thread, and it will be running during the lifetime of the instance or container.

Step 7. For ease of deployment, you can also create a systemd service (aws-hw-monitor.service), which will run at startup before the CloudWatch agent.

[Unit]
Description=HW Error Monitor
Before=amazon-cloudwatch-agent.service
After=syslog.target network-online.target

[Service]
Type=simple
ExecStart=/opt/aws/cloudwatch/aws-cloudwatch-wrapper.sh
RemainAfterExit=1
TimeoutStartSec=0

[Install]
WantedBy=multi-user.target

Where /opt/aws/cloudwatch/aws-cloudwatch-wrapper.sh is a script which contains:

#!/bin/bash
python3 /opt/aws/aws-hwaccel-event-parser.py &

Finally, enable and start the hw monitor service

sudo systemctl enable aws-hw-monitor.service –now

II. Building an AMI

For convenience, the following repo has what is needed to build the AMI for Amazon EC2, Amazon EKS, Amazon ECS, Amazon Linux 2, and Ubuntu 18.04/20.04 distributions. You must have Packer installed on your machine, and it must be authenticated to make API calls on your behalf to AWS. Generally you need to modify the variables:{} json and execute the packer build.

"variables": {
    "region": "us-east-1",
    "flag": "<flag>",
    "subnet_id": "<subnetid>",
    "security_groupids": "<security_group_id,security_group_id",
    "build_ami": "<buildami>",
    "efa_pkg": "aws-efa-installer-latest.tar.gz",
    "intel_mkl_version": "intel-mkl-2020.0-088",
    "nvidia_version": "510.47.03",
    "cuda_version": "cuda-toolkit-11-6 nvidia-gds-11-6",
    "cudnn_version": "libcudnn8",
    "nccl_version": "v2.12.7-1"
  },

After filling in the variables, check that the packer script is validated.

packer validate nvidia-efa-ml-al2.yml
packer build nvidia-efa-ml-al2.yml

The log group namespace is /ec2/accelerated/accel-event-log. However, you may change this to the namespace of your preference in the CloudWatch Agent config file created earlier.

Navigate to the CloudWatch Console – Logs – Log groups – /ec2/accelerated/accel-event-log. It’s sorted by instance ID, where the instance ID of the latest stream is on top.

CloudWatch Log-events

We can see in the preceding screenshot that an example workload ran on instance i-03a7b66de3198977e, which was a p4d.24xlarge triggered a Xid 63 event. Capturing these events is the first step. Next, we must interpret what these events mean. With each Xid error, there is a number associated with each event. As previously mentioned, these can be hardware errors, driver, and/or application errors. If you’re running on an Amazon EC2 accelerated instance, and after code execution run into one of these errors, contact AWS Support with the instance ID and Xid error. The following is a list of the more common Xid errors that you may encounter.

Xid Error Name Description Action
48 Double Bit ECC error Hardware memory error Contact AWS Support with Xid error and instance ID
74 GPU NVLink error Further SXid errors should also be populated which will inform on the error seen with the NVLink fabric Get information on which links are causing the issue by running nvidia-smi nvlink -e
63 GPU Row Remapping Event Specific to Ampere architecture –- a row bank is pending a memory remap Stop all CUDA processes, and reset the GPU (nvidia-smi -r), and make sure thatensure the remap is cleared in nvidia-smi -q
13 Graphics Engine Exception User application fault , illegal instruction or register Rerun the application with CUDA_LAUNCH_BLOCKING=1 enabled which should determine if it’s a NVIDIA driver or hardware issue
31 GPU memory page fault Illegal memory address access error Rerun the application with CUDA_LAUNCH_BLOCKING=1 enabled which should determine if it’s a NVIDIA driver or hardware issue

A quick way to check for row remapping failures is to run the below command on the instance.

nvidia-smi --query-remapped-
rows=gpu_name,gpu_bus_id,remapped_rows.failure,remapped_rows.pending,remapped_rows.correctable,remapped_rows.uncorrectable --format=csv
gpu_name, gpu_bus_id, remapped_rows.failure, remapped_rows.pending, remapped_rows.correctable, remapped_rows.uncorrectable
NVIDIA A100-SXM4-40GB, 00000000:10:1C.0, 0, 0, 0, 0
NVIDIA A100-SXM4-40GB, 00000000:10:1D.0, 0, 0, 0, 0
NVIDIA A100-SXM4-40GB, 00000000:20:1C.0, 0, 0, 0, 0
NVIDIA A100-SXM4-40GB, 00000000:20:1D.0, 0, 0, 0, 0
NVIDIA A100-SXM4-40GB, 00000000:90:1C.0, 0, 0, 0, 0
NVIDIA A100-SXM4-40GB, 00000000:90:1D.0, 0, 0, 0, 0
NVIDIA A100-SXM4-40GB, 00000000:A0:1C.0, 0, 0, 0, 0
NVIDIA A100-SXM4-40GB, 00000000:A0:1D.0, 0, 0, 0, 0

This isn’t an exhaustive list of Xid events, but it provides some of the more common ones that you may come across as you develop your accelerated workload. You can find a more complete table of events here. Furthermore, if you have questions, you can reach out to AWS Support with the output of the tar ball created by executing the nvidia-bug-report.sh script included with the NVIDIA driver.

Conclusion

Get started with integrating this monitoring into your AMIs if you use custom AMIs specifically for key services, such as Amazon EKS, Amazon ECS, or Amazon EC2 with AWS ParallelCluster. This will help you discover utilization metrics for your accelerated computing workloads. If you have any questions about this post, then reach out to your account team.

Prebuilding codespaces is generally available

Post Syndicated from Tanmayee Kamath original https://github.blog/2022-06-15-prebuilding-codespaces-is-generally-available/

Prebuilding codespaces is generally available 🎉

We’re excited to announce that the ability to prebuild codespaces is now generally available. As a quick recap, a prebuilt codespace serves as a “ready-to-go” template where your source code, editor extensions, project dependencies, commands, and configurations have already been downloaded, installed, and applied, so that you don’t have to wait for these tasks to finish each time you create a new codespace. This helps significantly speed up codespace creations–especially for complex or large codebases.

Codespaces prebuilds entered public beta earlier this year, and we received a ton of feedback around experiences you loved, as well as areas we could improve on. We’re excited to share those with you today.

How Vanta doubled its engineering team with Codespaces

With Codespaces prebuilds, Vanta was able to significantly reduce the time it takes for a developer to onboard. This was important, because Vanta’s Engineering Team doubled in size in the last few months. When a new developer joined the company, they would need to manually set up their dev environment; and once it was stable, it would diverge within weeks, often making testing difficult.

“Before Codespaces, the onboarding process was tedious. Instead of taking two days, now it only takes a minute for a developer to access a pristine, steady-state environment, thanks to prebuilds,” said Robbie Ostrow, Software Engineering Manager at Vanta. “Now, our dev environments are ephemeral, always updated and ready to go.”

Scheduled prebuilds to manage GitHub Actions usage

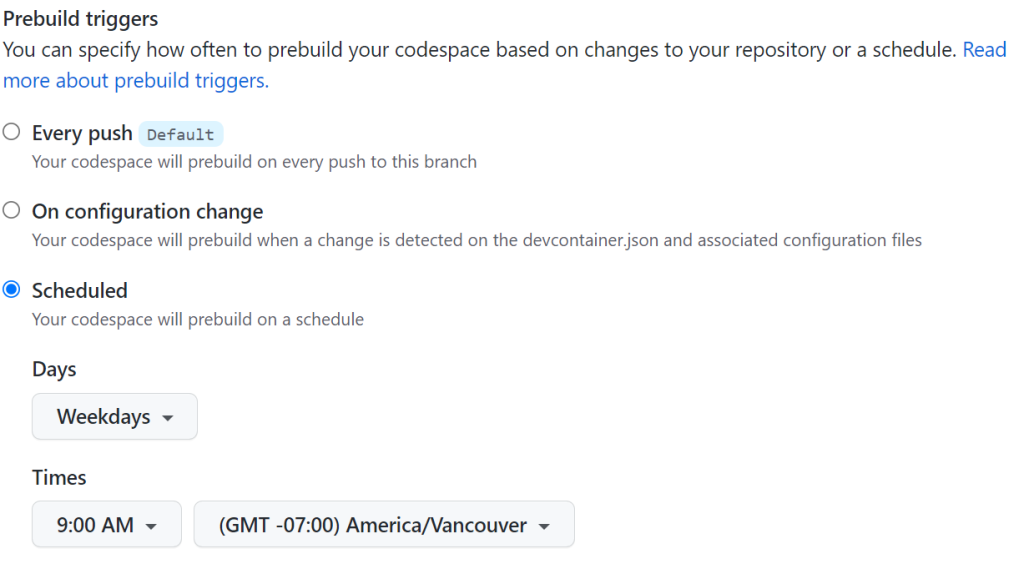
Repository admins can now decide how and when they want to update prebuild configurations based on their team’s needs. While creating or updating prebuilds for a given repository and branch, admins can choose from three available triggers to initiate a prebuild refresh:

  • Every push (default): Prebuild configurations are updated on every push made to the given branch. This ensures that new Codespaces always contain the latest configuration, including any recently added or updated dependencies.
  • On configuration change: Prebuild configurations are updated every time configuration files change. This ensures that the latest configuration changes appear in new Codespaces. The Actions workflow that generates the prebuild template will run less often, so this option will use fewer Actions minutes.
  • Scheduled: With this setting, you can have your prebuild configurations update on a custom schedule. This can help further reduce the consumption of Actions minutes.

With increased control, repository admins can make more nuanced trade-offs between “environment freshness” and Actions usage. For example, an admin working in a large organization may decide to update their prebuild configuration every hour rather than on every push to get the most economy and efficiency out of their Actions usage.

Failure notifications for efficient monitoring

Many of you shared with us the need to be notified when a prebuild workflow fails, primarily to be able to watch and fix issues if and when they arise. We heard you loud and clear and have added support for failure notifications within prebuilds. With this, repository admins can specify a set of individuals or teams to be informed via email in case a workflow associated with that prebuild configuration fails. This will enable team leads or developers in charge of managing prebuilds for their repository to stay up to date on any failures without having to manually monitor them. This will also enable them to make fixes faster, thus ensuring developers working on the project continue getting prebuilt codespaces.

To help with investigating failures, we’ve also added the ability to disable a prebuild configuration in the instance repository admins would like to temporarily pause the update of a prebuild template while fixing an underlying issue.

Improved ‘prebuild readiness’ indicators

Lastly, to help you identify prebuild-enabled machine types to avail fast creations, we have introduced a ‘prebuild in progress’ label in addition to the ‘prebuild ready’ label in cases where a prebuild template creation for a given branch is in progress.

Billing for prebuilds

With general availability, organizations will be billed for Actions minutes required to run prebuild associated workflows and storage of templates associated with each prebuild configuration for a given repository and region. As an admin, you can download the usage report for your organization to get a detailed view of prebuild-associated Actions and storage costs for your organization-owned repositories to help you manage usage.

Alongside enabling billing, we’ve also added a functionality to help manage prebuild-associated storage costs based on the valuable feedback that you shared with us.

Template retention to manage storage costs

Repository administrators can now specify the number of prebuild template versions to be retained with a default template retention setting of two. A default of two means that the codespace service will retain the latest and one previous prebuild template version by default, thus helping you save on storage for older versions.

How to get started

Prebuilds are generally available for the GitHub Enterprise Cloud and GitHub Team plans as of today.

As an organization or repository admin, you can head over to your repository’s settings page and create prebuild configurations under the “Codespaces” tab. As a developer, you can create a prebuilt codespace by heading over to a prebuild-enabled branch in your repository and selecting a machine type that has the “prebuild ready” label on it.

Here’s a link to the prebuilds documentation to help you get started!

Post general availability, we’ll continue working on functionalities to enable prebuilds on monorepos and multi-repository scenarios based on your feedback. If you have any feedback to help improve this experience, be sure to post it on our GitHub Discussions forum.

How Netflix Content Engineering makes a federated graph searchable (Part 2)

Post Syndicated from Netflix Technology Blog original https://netflixtechblog.com/how-netflix-content-engineering-makes-a-federated-graph-searchable-part-2-49348511c06c

By Alex Hutter, Falguni Jhaveri, and Senthil Sayeebaba

In a previous post, we described the indexing architecture of Studio Search and how we scaled the architecture by building a config-driven self-service platform that allowed teams in Content Engineering to spin up search indices easily.
This post will discuss how Studio Search supports querying the data available in these indices.

Data consumption from Studio Search DGS

Introduction

When we say Content Engineering teams are interested in searching against the federated graph, the use-case is mainly focused on known-item search (a user has an item or items in mind they are trying to view or navigate to but need to use an external information system to locate them) and data retrieval (typically the data is structured and there is no ambiguity as to whether a particular record matches the given search criteria except in the case of textual fields where there is limited ambiguity) within a vertical search experience (focus on enabling search for a specific sub-graph within the big federated graph)

Query Language

Given the above scope of the search (vertical search experience with a focus on known-item search and data retrieval), one of the first things we had to design was a language that users can use to easily express their search criteria. With a goal of abstracting users away from the complexity of interacting with Elasticsearch directly, we landed on a custom Studio Search DSL reminiscent of SQL.

The DSL supports specifying the search criteria as comparison expressions or inclusion/exclusion filters. The filter expressions can be combined together through logical operators (AND, OR, NOT) and grouped together through parentheses.

Sample Syntax

For example, to find all comedies from France or Spain, the query would be:

(genre == ‘comedy’) AND (country ANY [‘FR’, ‘SP’])

We used ANTLR to build the grammar for the Query DSL. From the grammar, ANTLR generates a parser that can walk the parse tree. By extending the ANTLR generated parse tree visitor, we were able to implement an Elasticsearch Query Builder component with the logic to generate the Elasticsearch query corresponding to the custom search query.

If you are familiar with Elasticsearch, then you might be familiar with how complicated it can be to build up the correct Elasticsearch query for complex queries, especially if the index includes nested JSON documents which add an additional layer of complexity with respect to building nested queries (Incorrectly constructed nested queries can lead to Elasticsearch quietly returning wrong results). By exposing just a generic query language to the users and isolating the complexity to just our Elasticsearch Query Builder, we have been able to empower users to write search queries without requiring familiarity with Elasticsearch. This also leaves the possibility of swapping Elasticsearch with a different search engine in the future.

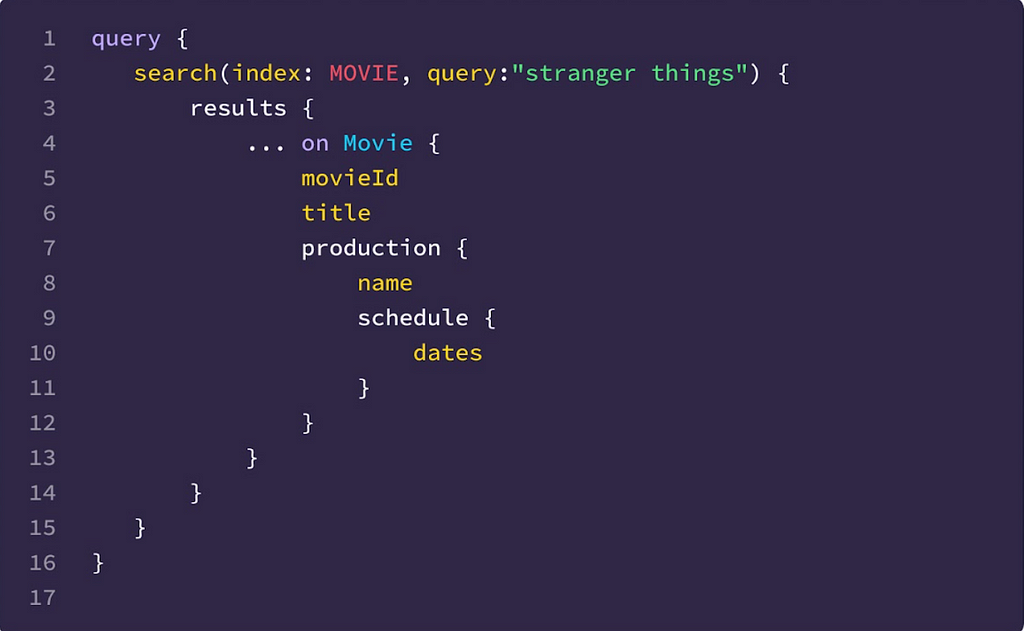
One other challenge for the users when writing the search queries is to understand the fields that are available in the index and the associated types. Since we index the data as-is from the federated graph, the indexing query itself acts as self-documentation. For example, given the indexing query –

Sample GraphQL query

To find movies based on the actors’ roles, the query filter is simply

`actors.role == ‘actor’`

Text Search

While the search DSL provides a powerful way to help narrow the scope of the search queries, users can also find documents in the index through free form text — either with just the input text or in combination with a filter expression in the search DSL. Behind the scenes during the indexing process, we have configured the Elasticsearch index with the appropriate analyzers to ensure that the most relevant matches for the input text are returned in the results.

Hydration through Federation

Given the wide adoption of the federated gateway within Content Engineering, we decided to implement the Studio Search service as a DGS (Domain Graph Service) that integrated with the federated gateway. The search APIs (besides search, we have other APIs to support faceted search, typeahead suggestions, etc) are exposed as GraphQL queries within the federated graph.

This integration with the federation gateway allows the search DGS to just return the matching entity keys from the search index instead of the whole matching document(s). Through the power of federation, users are then able to hydrate the search results with any data available in the federated graph. This allows the search indices to be lean by indexing only the fields necessary for the search experience and at the same time provides complete flexibility for the users to fetch any data available in the federated graph instead of being restricted to just the data available in the search index.

Example

Sample Search query

In the above example, users are able to fetch the production schedule as part of the search results even though the search index doesn’t hold that data.

Authorization

With the API to query the data in the search indices in place, the next thing we needed to tackle was figuring out how to secure access to the data in the indices. With several of the indices including sensitive data, and the source teams already having restrictive access policies in place to secure the data they own, the search indices which hosted a secondary copy of the source data needed to be secured as well.

We chose to apply “late binding” (or “query time”) security — on every incoming search query, we make an API call to the centralized access policy server with context including the identity of the caller making the request and the search index they are trying to access. The policy server evaluates the access policies defined by the source teams and returns a set of constraints. Ex. The caller has access to Movies where the type is ‘licensed’ (The caller does not have access to Netflix-produced content, but just the licensed content). The constraints are then translated to a set of filter expressions in the search query DSL format (Ex. movie.type == ‘licensed’) and combined with the user-specified search filter with a logical AND operator to form a new search query that then gets executed against the index.

By adding on the access constraints as additional filters before executing the query, we ensure that the user gets back only the data they have access to from the underlying search index. This also allows source teams to evolve their access policies independently knowing that the correct constraints will be applied at query time.

Customizing Search

With the decision to build Studio Search as a GraphQL service using the DGS framework and relying on federation for hydrating results, onboarding new search indices required updating various portions of the GraphQL schema (the enum of available indices, the union of all federated result types, etc.) manually and registering the updated schema with the federated gateway schema registry before the new index was available for querying through the GraphQL API.

Additionally, there are additional configurations that users can provide while onboarding a new index to customize the search behavior for their applications — including scripts to tune the relevance scoring algorithm, configuring fields for faceted search, and configuration to control the behavior of typeahead suggestions, etc. These configurations were initially stored in our source control repository which meant any changes to the configuration of any index required a deployment for the changes to take effect.

Recently, we automated this process as well by moving all the configurations to a persistence store and leveraging the power of dynamic schemas in the DGS framework. Users can now use an API to create/update search index configuration and we are able to validate the provided configuration, generate the updated DGS schema dynamically and register the updated schema with the federated gateway schema registry immediately. All configuration changes are reflected immediately in subsequent search queries.

Example configuration:

Sample Search configuration

UI Components

While the primary goal of Studio Search was to build an easy-to-use self-service platform to enable searching against the federated graph, another important goal was to help the Content Engineering teams deliver a visually consistent search experience to the users of their tools and workflows. To that end, we partnered with our UI/UX teams to build a robust set of opinionated presentational components. Studio Search’s offering of drop-in UI components based on our Hawkins design system for typeahead suggestion, faceted search, and extensive filtering ensure visual and behavioral consistency across the suite of applications within Content Engineering. Below are a couple of examples.

Typeahead Search Component

Faceted Search Component

What’s Next?

As a config-driven, self-serve platform, Studio Search has already been able to empower Content Engineering teams to quickly enable the functionality to search against the Content federated graph within their suite of applications. But, we are not quite done yet! There are several upcoming features that are in various stages of development including

  • Leveraging the percolate query functionality in Elasticsearch to support a notifications feature (users save their search criteria and are notified when documents are updated in the index that matches their search criteria)
  • Add support for metrics aggregation in our APIs
  • Leverage the managed delivery functionality in Spinnaker to move to a declarative model for onboarding the search indices
  • And, plenty more

If this sounds interesting to you, connect with us on LinkedIn.

Credits

Thanks to Anoop Panicker, Bo Lei, Charles Zhao, Chris Dhanaraj, Hemamalini Kannan, Jim Isaacs, Johnny Chang, Kasturi Chatterjee, Kishore Banala, Kevin Zhu, Tom Lee, Tongliang Liu, Utkarsh Shrivastava, Vince Bello, Vinod Viswanathan, Yucheng Zeng


How Netflix Content Engineering makes a federated graph searchable (Part 2) was originally published in Netflix TechBlog on Medium, where people are continuing the conversation by highlighting and responding to this story.

Cloudflare Zaraz launches new privacy features in response to French CNIL standards

Post Syndicated from Yair Dovrat original https://blog.cloudflare.com/zaraz-privacy-features-in-response-to-cnil/

Cloudflare Zaraz launches new privacy features in response to French CNIL standards

Cloudflare Zaraz launches new privacy features in response to French CNIL standards

Last week, the French national data protection authority (the Commission Nationale de l’informatique et des Libertés or “CNIL”), published guidelines for what it considers to be a GDPR-compliant way of loading Google Analytics and similar marketing technology tools. The CNIL published these guidelines following notices that the CNIL and other data protection authorities issued to several organizations using Google Analytics stating that such use resulted in impermissible data transfers to the United States. Today, we are excited to announce a set of features and a practical step-by-step guide for using Zaraz that we believe will help organizations continue to use Google Analytics and similar tools in a way that will help protect end user privacy and avoid sending EU personal data to the United States. And the best part? It takes less than a minute.

Enter Cloudflare Zaraz.

The new Zaraz privacy features

What we are releasing today is a new set of privacy features to help our customers enhance end user privacy. Starting today, on the Zaraz dashboard, you can apply the following configurations:

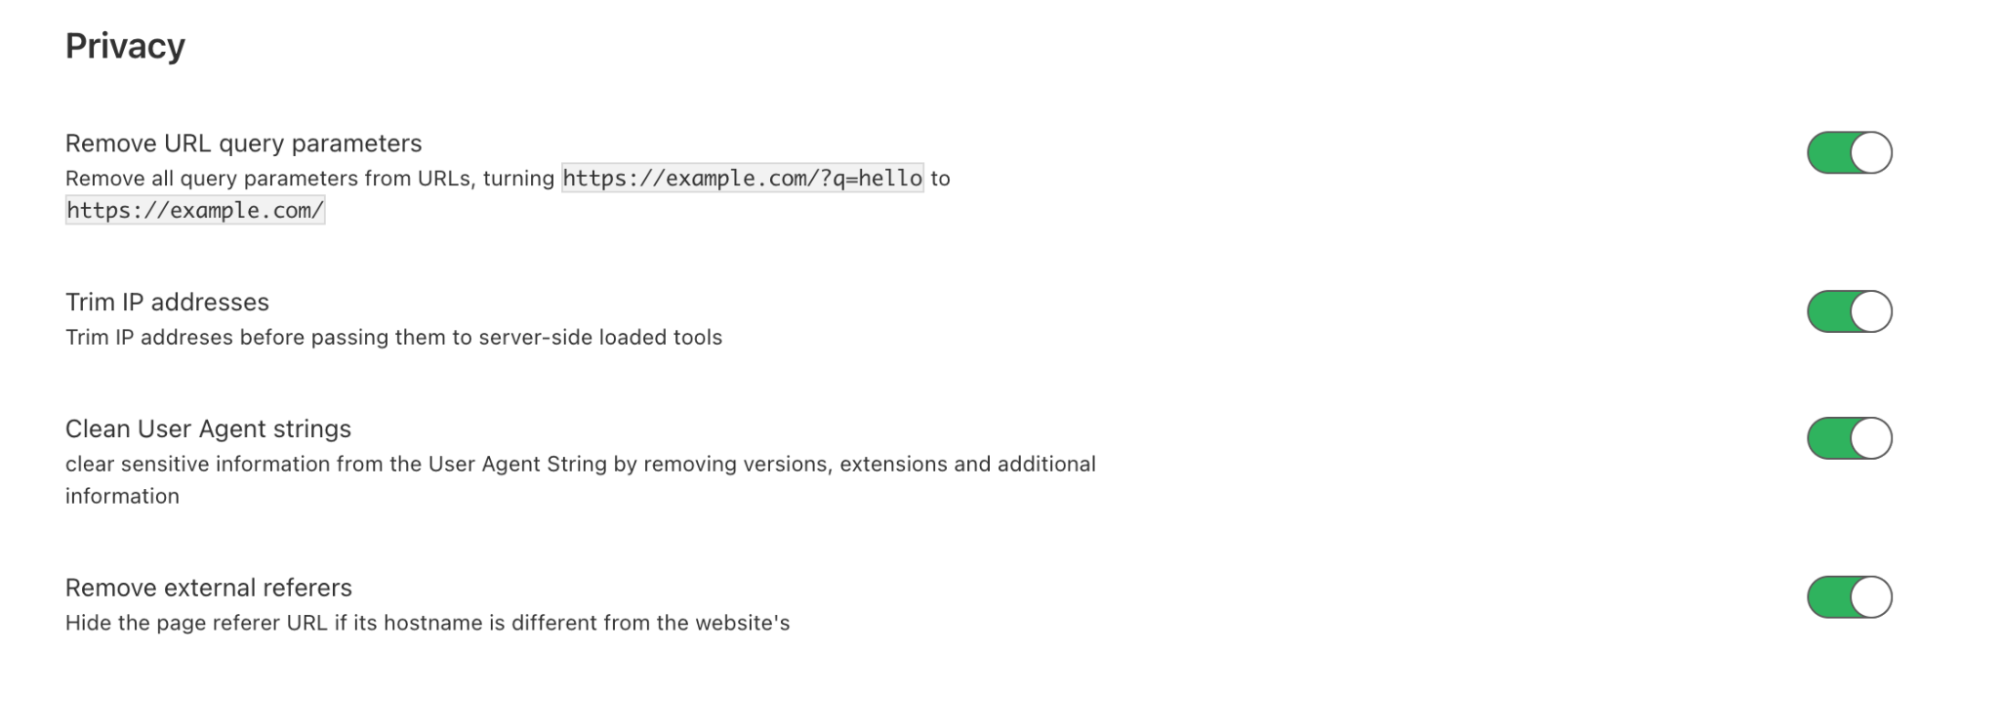
  • Remove URL query parameters: when toggled-on, Zaraz will remove all query parameters from a URL that is reported to a third-party server. It will turn https://example.com/?q=hello to https://example.com. This will allow users to remove  query parameters, such as UTM, gclid, and the sort that can be used for fingerprinting. This setting will apply to all of your Zaraz integrations.
  • Hide originating IP address: using Zaraz to load tools like Google Analytics entirely server-side while hiding visitor IP addresses from Google and Facebook has been doable for quite some time now. This will prevent sending the visitor IP address to a third-party tool provider’s server. This feature is configured at a tool level, currently offered for Google Analytics Universal, Google Analytics 4, and Facebook Pixel. We will add this capability to more and more tools as we go. In addition to hiding visitors’ IP addresses from specific tools, you can use Zaraz to trim visitors’ IP addresses across all tools to avoid sending originating IP addresses to third-party tool servers. This option is available on the Zaraz setting page, and is considered less strict.
  • Clear user agent strings: when toggled on, Zaraz will clear sensitive information from the User Agent String. The User-Agent is a request header that includes information about the operating system, browser, extensions and more of the site visitor. Zaraz clears this string by removing pieces of information (such as versions, extensions, and more) that could lead to user tracking or fingerprinting. This setting will apply only to server-side integrations.
  • Removal of external referrers: when toggled-on, Zaraz will hide the URL of the referring page from third-party servers. If the referring URL is on the same domain, it will not hide it, to keep analytics accurate and avoid the session from “splitting”. This setting will apply to all of your Zaraz integrations.
Cloudflare Zaraz launches new privacy features in response to French CNIL standards

How to set up Google Analytics with the new privacy features

We wrote this guide to help you implement our new features when using Google Analytics. We will use Google Analytics (Universal) as the example of this guide, because Google Analytics is widely used by Zaraz customers. You can follow the same principles to set up your Facebook Pixel, or other server-side integration that Zaraz offers.

Step 1: Install Zaraz on your website

Zaraz loads automatically for every website proxied by Cloudflare (Orange Clouded), no code changes are needed. If your website is not proxied by Cloudflare, you can load Zaraz manually with a JavaScript code snippet. If you are new to Cloudflare, or unsure if your website is proxied by Cloudflare, you can use this Chrome extension to find out if your site is Orange Clouded or not.

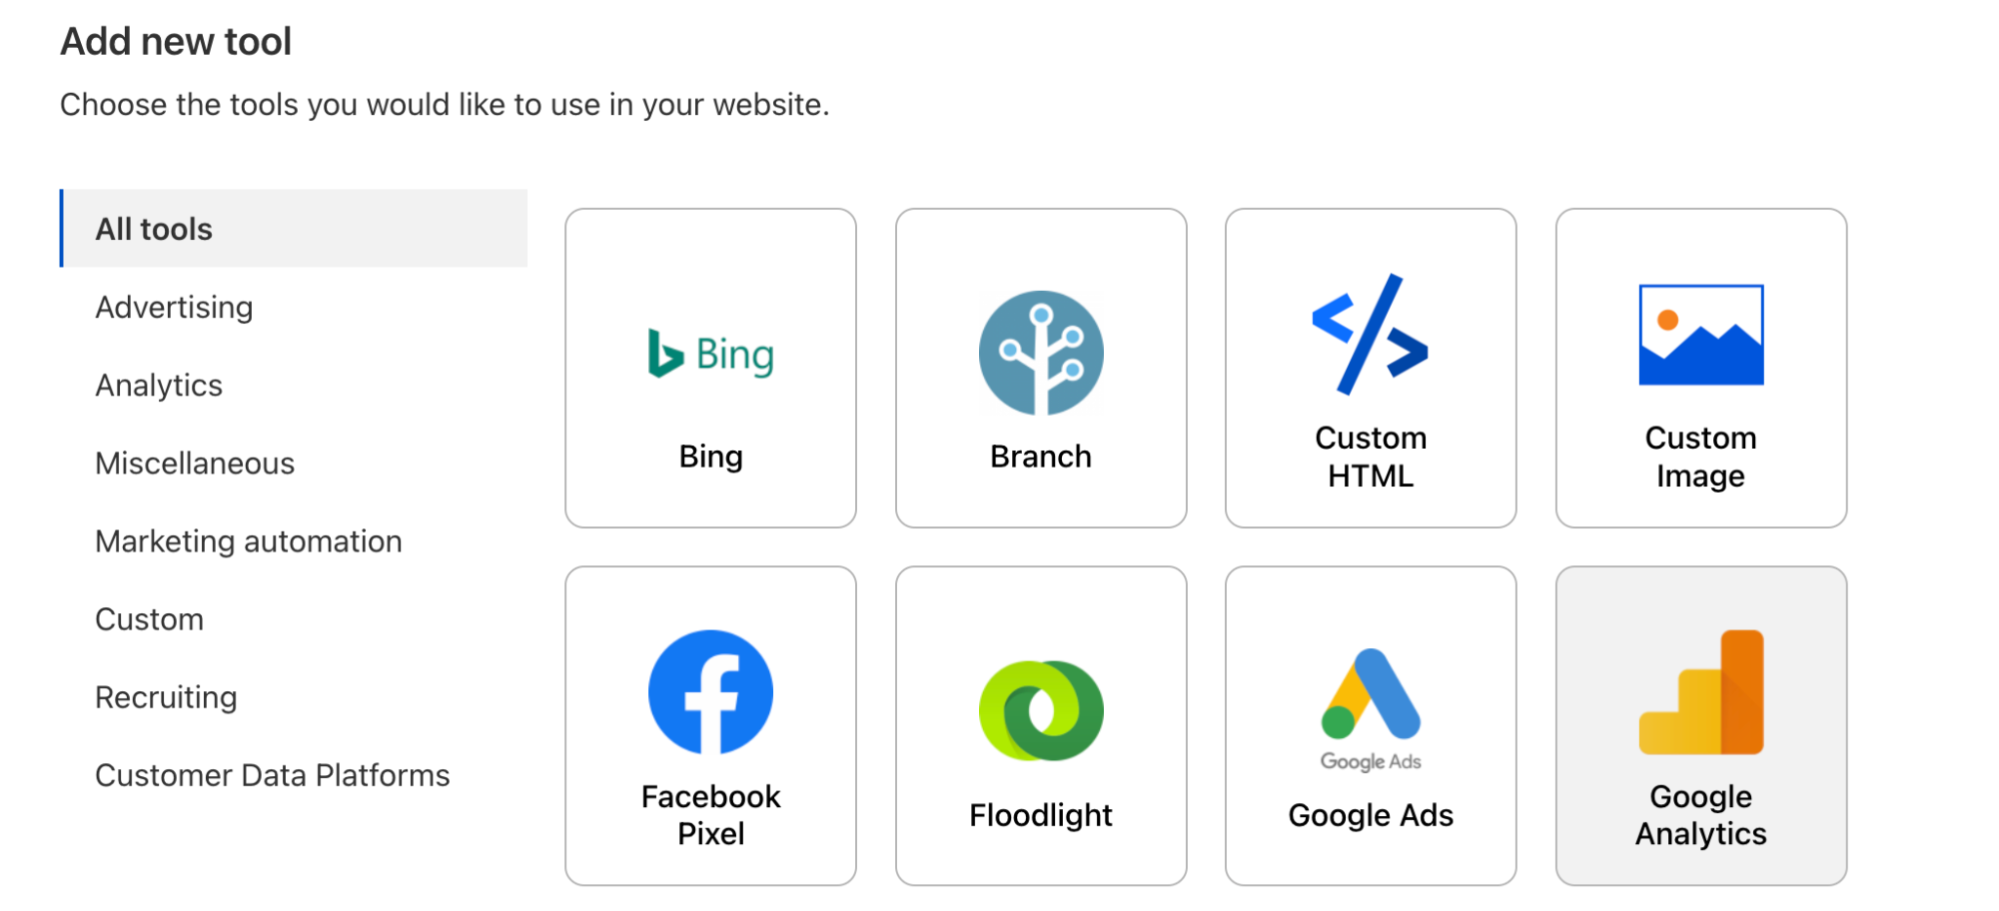
Step 2: Add Google Analytics via the Zaraz dashboard

Cloudflare Zaraz launches new privacy features in response to French CNIL standards

All customers have access to the Zaraz dashboard. By default, when you add Google Analytics using the Zaraz tools library, it will load server-side. You do not need to set up any cloud environment or proxy server. Zaraz handles this for you. When you add a tool, Zaraz will start loading on your website, and a request will leave from the end user’s browser to a Cloudflare Worker that sits on your own domain. Cloudflare Workers is our edge computing platform, and this Worker will communicate directly with Google Analytics’ servers. There will be no direct communication between an end user’s browser and Google’s servers. If you wish to learn more about how Zaraz works, please read our previous posts about the unique Zaraz architecture and how we use Workers. Note that “proxying” Google Analytics, by itself, is not enough, according to the CNIL’s guidance. You will have to take more actions to make sure you set up Google Analytics properly.

Step 3: Configure Google Analytics and hide IP addresses

Cloudflare Zaraz launches new privacy features in response to French CNIL standards

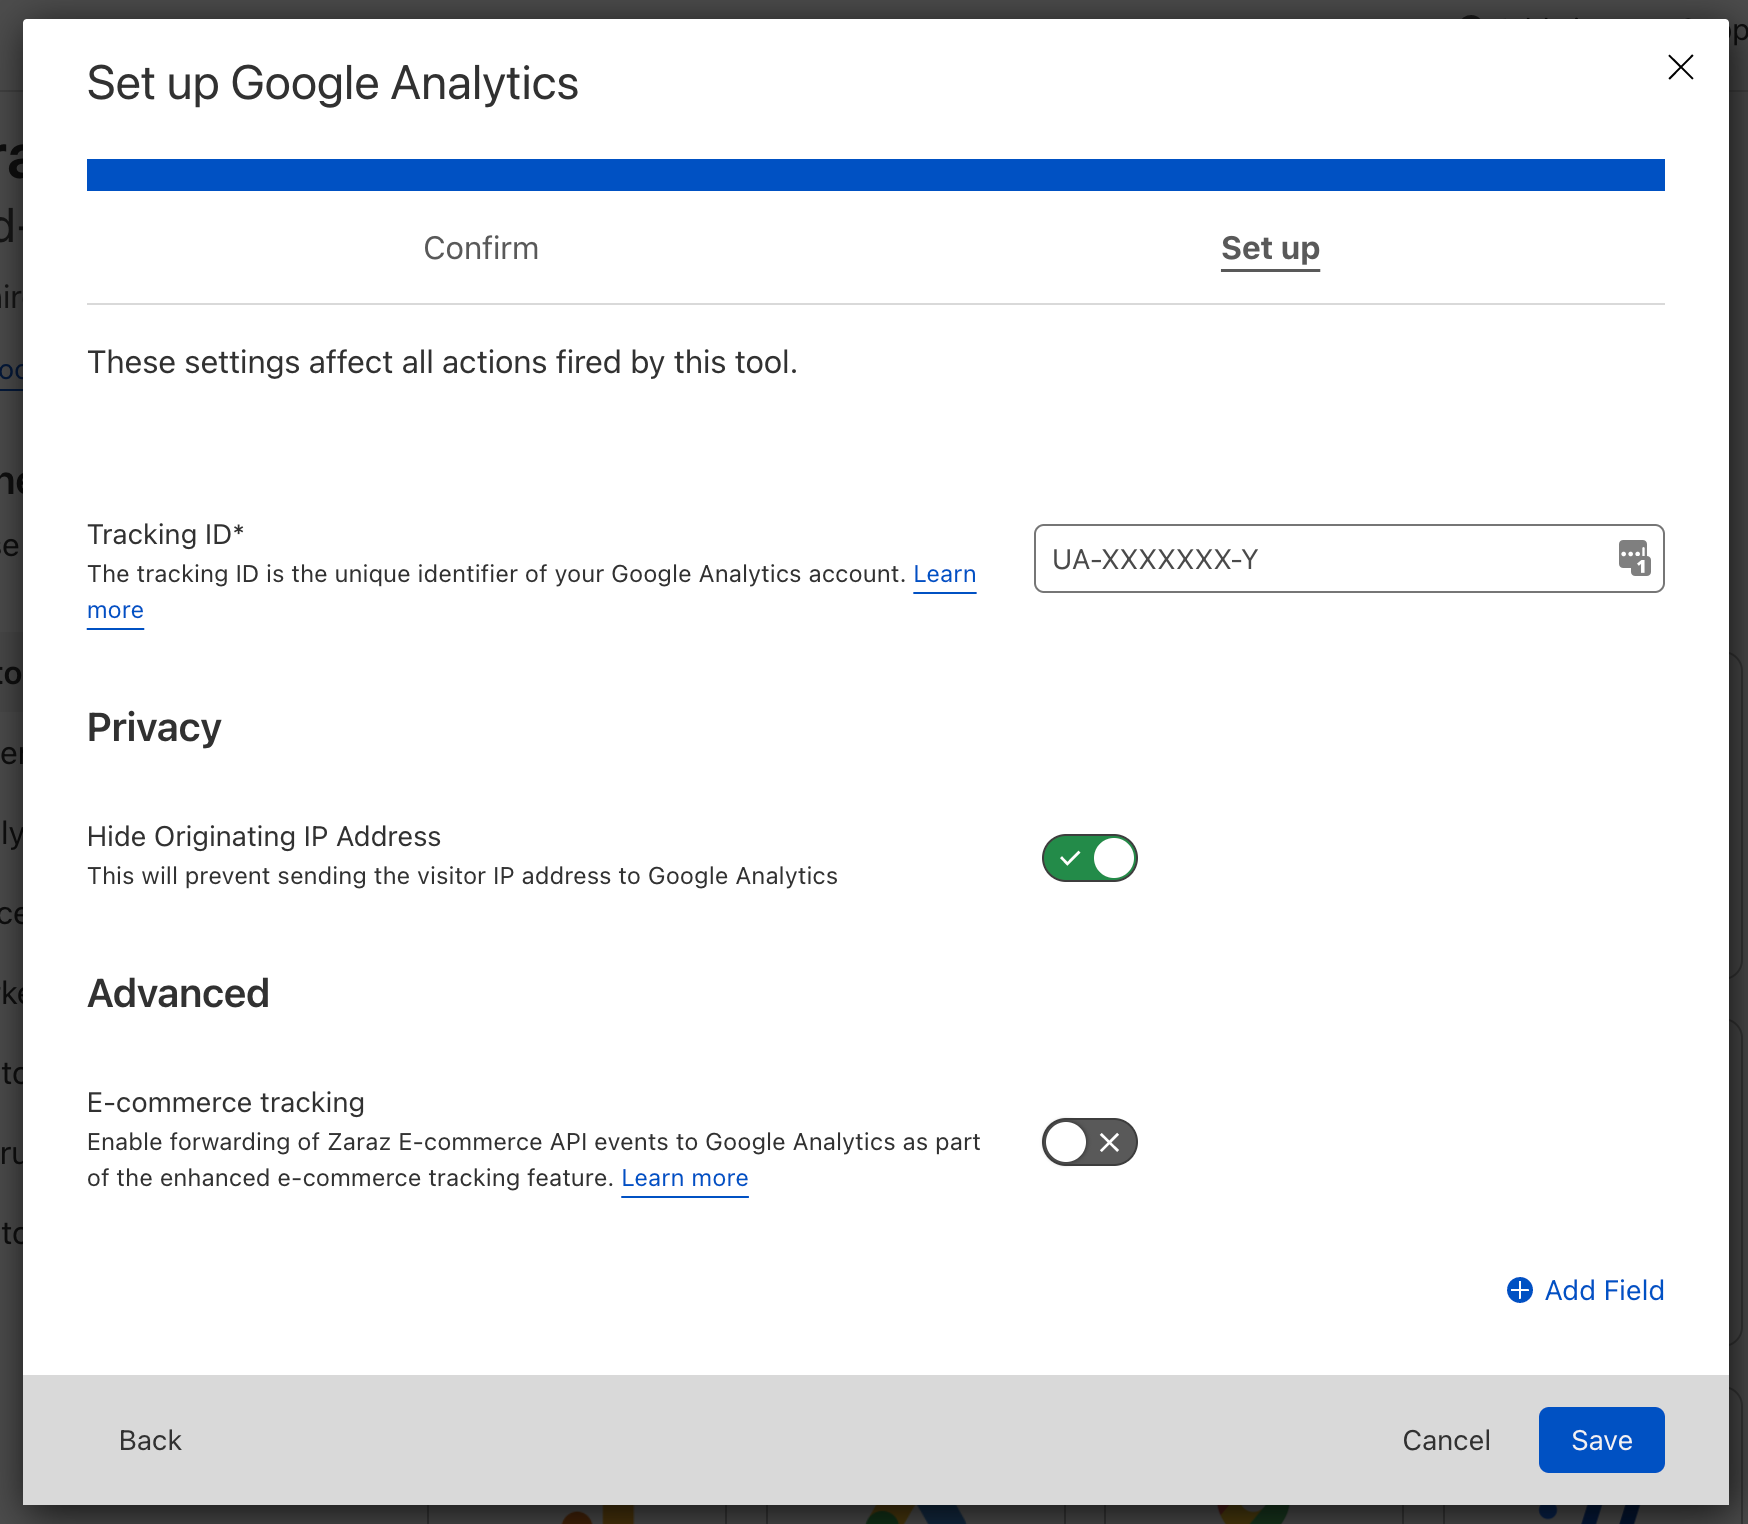
All you need to do to set up Google Analytics is to enter your Tracking ID. On the tools setting screen, you would also need to toggle-on the “Hide Originating IP Address” feature. This will prevent Zaraz from sending the visitor’s IP address to Google. Zaraz will remove the IP address on the Edge, before it hits Google’s servers. If you want to make sure Zaraz will run only in the EU, review Cloudflare’s Data Localization Suite.

According to your needs, you can of course set up more complex configurations of Google Analytics, including Ecommerce tracking, Custom Dimension, fields to set, Custom Metrics, etc. Follow this guide for more instructions.

Step 4: Toggle-on Zaraz’s new privacy features

Cloudflare Zaraz launches new privacy features in response to French CNIL standards

Next, you will need to toggle-on all of our new privacy features mentioned above. You can do this on the Zaraz Settings page, under the Privacy section.

Step 5: Clean your Google Analytics configuration

In this step, you would need to take actions to clean your specific Google Analytics setting. We gathered a list of suggestions for you to help preserve end user privacy:

  • Do not include any personal identifiable information. You will want to review the CNIL’s guidance on anonymization and determine how to apply it on your end. It is likely that such anonymization will make the unique identifier pretty much useless with most analytics tools. For example, according to our findings, features like Google Analytics’ User ID View, won’t work well with such anonymization. In such cases, you may want to stop using such analytics tools to avoid discrepancies and assure accuracy.
  • If you wish to hide Google Analytics’ Client ID, on the Google Analytics setting page, click “add field” and choose “Client ID”. To override the Client ID, you can insert any string as the field’s constant value. Please note that this will likely limit Google’s ability to aggregate data and will likely create discrepancies in session and user counts. Still, we’ve seen customers that are using Google Analytics to count events, and to our knowledge that should still be doable with this setting.
  • Clean your implementation from cross-site identifiers. This could include things like your CRM tool unique identifier, or URL query parameters passing identifiers to share them between different domains (avoid “cross-domain tracking” also known as “site linking”).
  • You would need to make sure not to include any personal data in your customized configuration and implementation. We recommend you go over the list of Custom Dimension, Event parameters/properties, Ecommerce Data, and User Properties to make sure they do not contain personal data. While this still demands some manual work, the good news is that soon we are about to announce a new set of Privacy features, Zaraz Data Loss Prevention, that will help you do that automatically, at scale. Stay tuned!

Step 6 – you are done! 🎉

A few more things you will want to consider is that implementing this guide will result in some limitations in your ability to use Google Analytics. For example, not collecting UTM parameters and referrers will disable your ability to track traffic sources and campaigns. Not tracking User ID, will prevent you from using the User ID View, and so on. Some companies will find these limitations extreme, but like most things in life, there is a trade-off. We’re taking a step towards a more privacy-oriented web, and this is just the beginning. In the face of new regulatory constraints, new technologies will appear which will unlock new abilities and features. Zaraz is dedicated to leading the way, offering privacy-focused tools that empower website operators and protect end users.

We recommend you learn more about Cloudflare’s Data Localization Suite, and how you can use Zaraz to keep analytics data in the EU.

To wrap up, we would really appreciate any feedback on this announcement, or new feature requests you might have. You can reach out to your Cloudflare account manager, or directly to us on our Discord channel. Privacy is at the heart of everything our team is building.

We always take a proactive approach towards privacy, and we believe privacy is not only about responding to different regulations, it is about building technology that helps customers do a better job protecting their users. It is about simplifying what it takes to respect and protect user privacy and personal information. It is about helping build a better Internet.

Fortune Favors the Backup: How One Media Brand Protected High-profile Video Footage

Post Syndicated from Molly Clancy original https://www.backblaze.com/blog/fortune-favors-the-backup-how-one-media-brand-protected-high-profile-video-footage/

Leading business media brand, Fortune, has amassed hundreds of thousands of hours of footage capturing conference recordings, executive interviews, panel discussions, and more showcasing some of the world’s most high-profile business leaders over the years. It’s the jewel in their content crown, and there are no second chances when it comes to capturing those moments. If any of those videos were to be lost or damaged, they’d be gone forever, with potential financial consequences to boot.

At the same time, Fortune’s distributed team of video editors needs regular and reliable access to that footage for use on the company’s sites, social media channels, and third-party web properties. So when Fortune divested from their parent company Meredith Corporation in 2018, revising its tech infrastructure was a priority.

Becoming an independent enterprise gave Fortune the freedom to escape legacy limitations and pop the cork on bottlenecks that were slowing productivity and raking up expenses. But their first attempt at a solution was expensive, unreliable, and difficult to use—until they migrated to Backblaze B2 Cloud Storage. Jeff Billark, Head of IT Infrastructure for Fortune Media Group, shared how it all went down.

Not Quite Camera-ready: An Overly Complex Tech Stack

Working with systems integrator CHESA, Fortune used a physical storage device to seed data to the cloud. They then built a tech stack that included:

  • An on-premises server housing Primestream Xchange media asset management (MAM) software for editing, tagging, and categorization.
  • Archive management software to handle backups and long-term archiving.
  • Cold object storage from one of the diversified cloud providers to hold backups and archive data.

But it didn’t take long for the gears to gum up. The MAM system couldn’t process the huge quantity of data in the archive they’d seeded to the cloud, so unprocessed footage stayed buried in cold storage. To access a video, Fortune editors had to work with the IT department to find the file, thaw it, and save it somewhere accessible. And the archiving software wasn’t reliable or robust enough to handle Fortune’s file volume; it indicated that video files had been archived without ever actually writing them to the cloud.

Time for a Close-up: Simplifying the Archive Process

If they hadn’t identified the issue quickly, Fortune could have lost 100TB of active project data. That’s when CHESA suggested Fortune simplify its tech stack by migrating from the diversified cloud provider to Backblaze B2. Two key tools allowed Fortune to eliminate archiving middleware by making the move:

  1. Thanks to Primestream’s new Backblaze data connector, Backblaze integrated seamlessly with the MAM system, allowing them to write files directly to the cloud.
  2. They implemented Panic’s Transmit tool to allow editors to access the archives themselves.

Backblaze’s Universal Data Migration program sealed the deal by eliminating the transfer and egress fees typically associated with a major data migration. Fortune transferred over 300TB of data in less than a week with zero downtime, business disruption, or egress costs.

For Fortune, the most important benefits of migrating to Backblaze B2 were:

  • Increasing reliability around both archiving and downloading video files.
  • Minimizing need for IT support with a system that’s easy to use and manage.
  • Unlocking self-service options within a modern digital tech experience.

“Backblaze really speeds up the archive process because data no longer has to be broken up into virtual tape blocks and sequences. It can flow directly into Backblaze B2.”
—Jeff Billark, Head of IT Infrastructure, Fortune Media Group

Unlocking Hundreds of Thousands of Hours of Searchable, Accessible Footage

Fortune’s video editing team now has access to two Backblaze B2 buckets that they can access without any additional IT support:

Bucket #1: 100TB of active video projects.
When any of the team’s video editors needs to find and manipulate footage that’s already been ingested into Primestream, it’s easy to locate the right file and kick off a streamlined workflow that leads to polished, new video content.

Bucket #2: 300TB of historical video files.
Using Panic’s Transmit tool, editors sync data between their Mac laptops and Backblaze B2 and can easily search historical footage that has not yet been ingested into Primestream. Once files have been ingested and manipulated, editors can upload the results back to Bucket #1 for sharing, collaboration, and storage purposes.

With Backblaze B2, Fortune’s approach to file management is simple and reliable. The risk of archiving failures and lost files is greatly reduced, and self-service workflows empower editors to collaborate and be productive without IT interruptions. Fortune also reduced storage and egress costs by about two-thirds, all while accelerating its content pipeline and maximizing the potential of its huge and powerful video archive.

“Backblaze is so simple to use, our editors can manage the entire file transfer and archiving process themselves.”
—Jeff Billark, Head of IT Infrastructure, Fortune Media Group

The post Fortune Favors the Backup: How One Media Brand Protected High-profile Video Footage appeared first on Backblaze Blog | Cloud Storage & Cloud Backup.

[$] A discussion on readahead

Post Syndicated from original https://lwn.net/Articles/897786/

Readahead is an I/O
optimization that causes the system to read more data than
has been requested by an application—in the belief that the extra data will
be requested soon thereafter. At the
2022 Linux Storage,
Filesystem, Memory-management and BPF Summit
(LSFMM), Matthew Wilcox
led a session to discuss readahead, especially as it relates to network
filesystems, with assistance from Steve French and
David Howells. The latency of the underlying storage needs to factor into
the calculation of how much data to read in advance, but it is not entirely
clear how to do so.

Processor MMIO stale-data vulnerabilities

Post Syndicated from original https://lwn.net/Articles/898011/

The mainline kernel has just received a set of patches addressing a new set
of (seemingly) Intel-specific hardware vulnerabilities.

Processor MMIO Stale Data Vulnerabilities are a class of
memory-mapped I/O (MMIO) vulnerabilities that can expose data. The
sequences of operations for exposing data range from simple to very
complex. Because most of the vulnerabilities require the attacker
to have access to MMIO, many environments are not affected. System
environments using virtualization where MMIO access is provided to
untrusted guests may need mitigation. These vulnerabilities are not
transient execution attacks. However, these vulnerabilities may
propagate stale data into core fill buffers where the data can
subsequently be inferred by an unmitigated transient execution
attack. Mitigation for these vulnerabilities includes a combination
of microcode update and software changes, depending on the platform
and usage model.

Three separate CVE numbers have been issued for variants of this
vulnerability; more information can be found in this documentation
patch
. Stable updates containing these fixes are in the review process
and should be released shortly.

CFP for the Kernel and Maintainers Summits

Post Syndicated from original https://lwn.net/Articles/897994/

The 2022 Kernel Summit and Maintainers Summit will be held in Dublin; the
Kernel Summit will run as part of the Linux Plumbers Conference (September 12-14)
while the Maintainers Summit will be on September 15. The call for
proposals
for both events has been posted. The deadline for the Kernel
Summit is tight (June 19), so this is not the time for anybody wanting
to speak to procrastinate.

Complimentary GartnerⓇ Report “How to Respond to the 2022 Cyberthreat Landscape”: Ransomware Edition

Post Syndicated from Tom Caiazza original https://blog.rapid7.com/2022/06/15/complimentary-gartner-report-how-to-respond-to-the-2022-cyberthreat-landscape-ransomware-edition/

Complimentary GartnerⓇ Report

First things first — if you’re a member of a cybersecurity team bouncing from one stressful identify vulnerability, patch, repeat cycle to another, claim your copy of the GartnerⓇ report “How to Respond to the 2022 Cyberthreat Landscape” right now. It will help you understand the current landscape and better plan for what’s happening now and in the near term.

Ransomware is on the tip of every security professional’s tongue right now, and for good reason. It’s growing, spreading, and evolving faster than many organizations can keep up with. But just because we may all be targets doesn’t mean we have to be victims.

The analysts at Gartner have taken a good, long look at the latest trends in security, with a particular eye toward ransomware, and they had this to say about attacker trends in their report.

Expect attackers to:

  • “Diversify their targets by pursuing lower-profile targets more frequently, using smaller attacks to avoid attention from well-funded nation states.”
  • “Attack critical CPS, particularly when motivated by geopolitical tensions and aligned ransomware actors.”
  • “Optimize ransomware delivery by using ‘known good’ cloud applications, such as enterprise productivity software as a service (SaaS) suites, and using encryption to hide their activities.”
  • “Target individual employees, particularly those working remotely using potentially vulnerable remote access services like Remote Desktop Protocol (RDP) services, or simply bribe employees for access to organizations with a view to launching larger ransomware campaigns.”
  • “Exfiltrate data as part of attempts to blackmail companies into paying ransom or risk data breach disclosure, which may result in regulatory fines and limits the benefits of the traditional mitigation method of ‘just restore quickly.'”
  • “Combine ransomware with other techniques, such as distributed denial of service (DDoS) attacks, to force public-facing services offline until organizations pay a ransom.”

Ransomware is most definitely considered a “top threat,” and it has moved beyond just an IT problem but one that involves governments around the globe. Attackers recognize that the game got a lot bigger with well-funded nations joining the fray to combat it, so their tactics will be targeted, small, diverse, and more frequent to avoid poking the bear(s). Expect to see smaller organizations targeted more often and as part of ransomware-as-a-service campaigns.

Gartner also says that attackers will use RaaS to attack critical infrastructure like CPS more frequently:

“Attackers will aim at smaller targets and deliver ‘ransomware as a service’ to other groups. This will enable more targeted and sophisticated attacks, as the group targeting an organization will have access to ransomware developed by a specialist group. Attackers will also target critical assets, such as CPS.”

Mitigating ransomware

But there are things we can do to mitigate ransomware attacks and push back against the attackers. Gartner suggests several key recommendations, including:

  • “Construct a pre-incident strategy that includes backup (including a restore test), asset management, and restriction of user privileges.”
  • “Build post-incident response procedures by training staff and scheduling regular drills.”
  • “Expand the scope of ransomware protection programs to CPS.”
  • “Increase cross-team training for the nontechnical aspects of a ransomware incident.
  • “Remember that payment of a ransom does not guarantee erasure of exfiltrated data, full recovery of encrypted data, or immediate restoration of operations.”
  • “Don’t rely on cyber insurance only. There is frequently a disconnect between what executive leaders expect a cybersecurity insurance policy to cover and what it actually does cover.”

At Rapid7, we have the risk management, detection and response, and threat intelligence tools your organization needs to not only keep up with the evolution in ransomware threat actors, but to implement best practices of the industry.

If you want to learn more about what cybersecurity threats are out there now and on the horizon, check out the complimentary Gartner report.

Gartner, How to Respond to the 2022 Cyberthreat Landscape, 1 April 2022, by Jeremy D’Hoinne, John Watts, Katell Thielemann

GARTNER is a registered trademark and service mark of Gartner, Inc. and/or its affiliates in the U.S. and internationally and is used herein with permission. All rights reserved.

NEVER MISS A BLOG

Get the latest stories, expertise, and news about security today.

Additional reading:

M1 Chip Vulnerability

Post Syndicated from Bruce Schneier original https://www.schneier.com/blog/archives/2022/06/m1-chip-vulnerability.html

This is a new vulnerability against Apple’s M1 chip. Researchers say that it is unpatchable.

Researchers from MIT’s Computer Science and Artificial Intelligence Laboratory, however, have created a novel hardware attack, which combines memory corruption and speculative execution attacks to sidestep the security feature. The attack shows that pointer authentication can be defeated without leaving a trace, and as it utilizes a hardware mechanism, no software patch can fix it.

The attack, appropriately called “Pacman,” works by “guessing” a pointer authentication code (PAC), a cryptographic signature that confirms that an app hasn’t been maliciously altered. This is done using speculative execution—a technique used by modern computer processors to speed up performance by speculatively guessing various lines of computation—to leak PAC verification results, while a hardware side-channel reveals whether or not the guess was correct.

What’s more, since there are only so many possible values for the PAC, the researchers found that it’s possible to try them all to find the right one.

It’s not obvious how to exploit this vulnerability in the wild, so I’m unsure how important this is. Also, I don’t know if it also applies to Apple’s new M2 chip.

Research paper. Another news article.

We’ll see you at CSTA 2022 Annual Conference

Post Syndicated from James Robinson original https://www.raspberrypi.org/blog/csta-2022/

Connecting face to face with educators around the world is a key part of our mission at the Raspberry Pi Foundation, and it’s something that we’ve sorely missed doing over the last two years. We’re therefore thrilled to be joining over 1000 computing educators in the USA at the Computer Science Teachers Association (CSTA) Annual Conference in Chicago in July.

You will find us at booth 521 in the expo hall throughout the conference, as well as running four sessions. Gemma, Kevin, James, Sue, and Jane are team members representing Hello World magazine, the Raspberry Pi Computing Education Research Centre, and our other free programmes and education initiatives. We thank the team at CSTA for involving us in what we know will be an amazing conference.

Talk to us about computer science pedagogy

Developing and sharing effective computing pedagogy is our theme for CSTA 2022. We’ll be talking to you about our 12 pedagogy principles, laid out in The Big Book of Computing Pedagogy, available to download for free.

Cover of The Big Book of Computing Pedagogy.

An exciting piece of news is that everyone attending CSTA 2022 will find a free print copy of the Big Book in their conference goodie bag!

We’re really looking forward to sharing and discussing the book and all our work with US educators, and to seeing some familiar faces. We’re also hoping to interview lots of old and new friends about your approaches to teaching computing and computer science for future Hello World podcast episodes.

Your sessions with us

Our team will also be running a number of sessions where you can join us to learn, discuss, and prepare lesson plans.

Semantic Waves and Wavy Lessons: Connecting Theory to Practical Activities and Back Again

Thursday 14 July, 9am–12pm: Pre-conference workshop (booking required) with James Robinson and Jane Waite

If you enjoy explaining concepts using unplugged activities, analogy, or storytelling, then this practical pre-conference session is for you. In the session, we’ll introduce the idea of semantic waves, a learning theory that supports learners in building knowledge of new concepts through careful consideration of vocabulary and contexts. Across the world, this approach has been successfully used to teach topics ranging from ballet to chemistry — and now computing.

Three computer science educators discuss something at a screen.

You’ll learn how this theory can be applied to deliver powerful explanations that connect abstract ideas and concrete experiences. By taking part in the session, you’ll gain a solid understanding of semantic wave theory, see it in practice in some freely available lesson plans, and apply it to your own planning.

Write for a Global Computing Community with Hello World Magazine

Friday 15 July, 1–2pm: Workshop with Gemma Coleman

Do you enjoy sharing your teaching ideas, successes, and challenges with others? Do you want to connect with a global community of over 30,000 computing educators? Have you always wanted to be a published author? Then come along to this workshop session.

Issues of Hello World magazine arranged to form a number five.
Hello World has been going strong for five years — find out how you can become one of its authors.

Every single computing or CS teacher out there has at least one lesson to share, idea to voice, or story to tell. In the session, you’ll discuss what makes a good article with Gemma Coleman, Hello World’s Editor, and you’ll learn top tips for how to communicate your ideas in writing. Gemma will also guide you through writing a plan for your very own article. Even if you’re not sure whether you want to write an article, doing this is a powerful way to reflect on your teaching practice.

Developing a Toolkit for Teaching Computer Science in School

Saturday 16 July, 4–5pm: Keynote talk by Sue Sentance

To teach any subject requires good teaching skills, knowledge about the subject being taught, and specific knowledge that a teacher gains about how to teach a particular topic, to their particular students, in a particular context. Teaching computer science is no different, and it’s a challenge for teachers to develop a go-to set of pedagogical strategies for such a new subject, especially for elements of the subject matter that they are just getting to grips with themselves.

12 principles of computing pedagogy: lead with concepts; structure lessons; make concrete; unplug, unpack, repack; work together; read and explore code first; foster program comprehension; model everything; challenge misconceptions; create projects; get hands-on; add variety.

In this keynote talk, our Chief Learning Officer Sue Sentance will focus on some of the 12 pedagogy principles that we developed to support the teaching of computer science. We created this set of principles together with other teachers and researchers to help us and everyone in computing and computer science education reflect on how we teach our learners. Sue will share how we arrived at the principles, and she’ll use classroom examples to illustrate how you can apply them in practice.

Exploring the Hello World Big Book of Computing Pedagogy

Sunday 17 July, 9–10am: Workshop with Sue Sentance

The set of 12 pedagogy principles we’ve developed for teaching computing are presented in our Hello World Big Book of Computing Pedagogy. The book includes summaries, teachers’ perspectives, and lesson plans for each of the 12 principles.

A tweet praising The Big Book of Computing Pedagogy.

All CSTA attendees will get their own print copy of the Big Book, and in this practical session, we will use the book to explore together how you can use the 12 principles in the planning and delivery of your lessons. The session will be very hands-on, so bring along something you know you want or need to teach.

See you at CSTA in July

CSTA is now just a month away, and we can’t wait to meet old friends, make new connections, and learn from each other! Come find us at booth 521 or at our sessions to meet the team, discover Hello World magazine and the Hello World podcast, and find out more about our educational work. We hope to see you soon.

The post We’ll see you at CSTA 2022 Annual Conference appeared first on Raspberry Pi.

The collective thoughts of the interwebz

By continuing to use the site, you agree to the use of cookies. more information

The cookie settings on this website are set to "allow cookies" to give you the best browsing experience possible. If you continue to use this website without changing your cookie settings or you click "Accept" below then you are consenting to this.

Close