Join me in Boston this July for AWS re:Inforce 2022

Post Syndicated from CJ Moses original https://aws.amazon.com/blogs/security/join-me-in-boston-this-july-for-aws-reinforce-2022/

I’d like to personally invite you to attend the Amazon Web Services (AWS) security conference, AWS re:Inforce 2022, in Boston, MA on July 26–27. This event offers interactive educational content to address your security, compliance, privacy, and identity management needs. Join security experts, customers, leaders, and partners from around the world who are committed to the highest security standards, and learn how to improve your security posture.

As the new Chief Information Security Officer of AWS, my primary job is to help our customers navigate their security journey while keeping the AWS environment safe. AWS re:Inforce offers an opportunity for you to understand how to keep pace with innovation in your business while you stay secure. With recent headlines around security and data privacy, this is your chance to learn the tactical and strategic lessons that will help keep your systems and tools secure, while you build a culture of security in your organization.

AWS re:Inforce 2022 will kick off with my keynote on Tuesday, July 26. I’ll be joined by Steve Schmidt, now the Chief Security Officer (CSO) of Amazon, and Kurt Kufeld, VP of AWS Platform. You’ll hear us talk about the latest innovations in cloud security from AWS and learn what you can do to foster a culture of security in your business. Take a look at the most recent re:Invent presentation, Continuous security improvement: Strategies and tactics, and the latest re:Inforce keynote for examples of the type of content to expect.

For those who are just getting started on AWS, as well as our more tenured customers, AWS re:Inforce offers an opportunity to learn how to prioritize your security investments. By using the Security pillar of the AWS Well-Architected Framework, sessions address how you can build practical and prescriptive measures to protect your data, systems, and assets.

Sessions are offered at all levels and for all backgrounds, from business to technical, and there are learning opportunities in over 300 sessions across five tracks: Data Protection & Privacy; Governance, Risk & Compliance; Identity & Access Management; Network & Infrastructure Security; and Threat Detection & Incident Response. In these sessions, connect with and learn from AWS experts, customers, and partners who will share actionable insights that you can apply in your everyday work. At AWS re:Inforce, the majority of our sessions are interactive, such as workshops, chalk talks, boot camps, and gamified learning, which provides opportunities to hear about and act upon best practices. Sessions will be available from the intermediate (200) through expert (400) levels, so you can grow your skills no matter where you are in your career. Finally, there will be a leadership session for each track, where AWS leaders will share best practices and trends in each of these areas.

At re:Inforce, hear directly from AWS developers and experts, who will cover the latest advancements in AWS security, compliance, privacy, and identity solutions—including actionable insights your business can use right now. Plus, you’ll learn from AWS customers and partners who are using AWS services in innovative ways to protect their data, achieve security at scale, and stay ahead of bad actors in this rapidly evolving security landscape.

A full conference pass is $1,099. However, if you register today with the code ALUMkpxagvkV you’ll receive a $300 discount (while supplies last).

We’re excited to get back to re:Inforce in person; it is emblematic of our commitment to giving customers direct access to the latest security research and trends. We’ll continue to release additional details about the event on our website, and you can get real-time updates by following @AWSSecurityInfo. I look forward to seeing you in Boston, sharing a bit more about my new role as CISO and providing insight into how we prioritize security at AWS.

 
If you have feedback about this post, submit comments in the Comments section below. If you have questions about this post, contact AWS Support.

Want more AWS Security news? Follow us on Twitter.

CJ Moses

CJ Moses

CJ Moses is the Chief Information Security Officer (CISO) at AWS. In his role, CJ leads product design and security engineering for AWS. His mission is to deliver the economic and security benefits of cloud computing to business and government customers. Prior to joining Amazon in 2007, CJ led the technical analysis of computer and network intrusion efforts at the U.S. Federal Bureau of Investigation Cyber Division. CJ also served as a Special Agent with the U.S. Air Force Office of Special Investigations (AFOSI). CJ led several computer intrusion investigations seen as foundational to the information security industry today.

Let’s Architect! Architecting for governance and management

Post Syndicated from Luca Mezzalira original https://aws.amazon.com/blogs/architecture/lets-architect-architecting-for-governance-and-management/

As you develop next-generation cloud-native applications and modernize existing workloads by migrating to cloud, you need cloud teams that can govern centrally with policies for security, compliance, operations and spend management.

In this edition of Let’s Architect!, we gather content to help software architects and tech leaders explore new ideas, case studies, and technical approaches to help you support production implementations for large-scale migrations.

Seamless Transition from an AWS Landing Zone to AWS Control Tower

A multi-account AWS environment helps businesses migrate, modernize, and innovate faster. With the large number of design choices, setting up a multi-account strategy can take a significant amount of time, because it involves configuring multiple accounts and services and requires a deep understanding of AWS.

This blog post shows you how AWS Control Tower helps customers achieve their desired business outcomes by setting up a scalable, secure, and governed multi-account environment. This post describes a strategic migration of 140 AWS accounts from customer Landing Zone to an AWS Control Tower-based solution.

Multi-account landing zone architecture that uses AWS Control Tower

Multi-account landing zone architecture that uses AWS Control Tower

Build a strong identity foundation that uses your existing on-premises Active Directory

How do you use your existing Microsoft Active Directory (AD) to reliably authenticate access for AWS accounts, infrastructure running on AWS, and third-party applications?

The architecture shown in this blog post is designed to be highly available and extends access to your existing AD to AWS, which enables your users to use their existing credentials to access authorized AWS resources and applications. This post highlights the importance of implementing a cloud authentication and authorization architecture that addresses the variety of requirements for an organization’s AWS Cloud environment.

Multi-account Complete AD architecture with trusts and AWS SSO using AD as the identity source

Multi-account Complete AD architecture with trusts and AWS SSO using AD as the identity source

Migrate Resources Between AWS Accounts

AWS customers often start their cloud journey with one AWS account, and over time they deploy many resources within that account. Eventually though, they’ll need to use more accounts and migrate resources across AWS Regions and accounts to reduce latency or increase resiliency.

This blog post shows four approaches to migrate resources based on type, configuration, and workload needs across AWS accounts.

Migration infrastructure approach

Migration infrastructure approach

Transform your organization’s culture with a Cloud Center of Excellence

As enterprises seek digital transformation, their efforts to use cloud technology within their organizations can be a bit disjointed. This video introduces you to the Cloud Center of Excellence (CCoE) and shows you how it can help transform your business via cloud adoption, migration, and operations. By using the CCoE, you’ll establish and us a cross-functional team of people  for developing and managing your cloud strategy, governance, and best practices that your organization can use to transform the business using the cloud.

Benefits of CCoE

Benefits of CCoE

See you next time!

Thanks for reading! If you want to dive into this topic even more, don’t miss the Management and Governance on AWS product page.

See you in a couple of weeks with novel ways to architect for front-end web and mobile!

Other posts in this series

Looking for more architecture content?

AWS Architecture Center provides reference architecture diagrams, vetted architecture solutions, Well-Architected best practices, patterns, icons, and more!

GitHub Availability Report: May 2022

Post Syndicated from Jakub Oleksy original https://github.blog/2022-06-01-github-availability-report-may-2022/

In May, we experienced three distinct incidents that resulted in significant impact and degraded state of availability to multiple services across GitHub.com. This report also sheds light into the billing incident that impacted GitHub Actions and Codespaces users in April.

May 20 09:44 UTC (lasting 49 minutes)

During this incident, our alerting systems detected increased CPU utilization on one of the GitHub Container registry databases. When we received the alert we immediately began investigating. Due to this preemptive monitoring added from the last incident in April at 8:59 UTC, the on-call was readily monitoring and prepared to run mitigation for this incident.

As CPU utilization on the database continued to rise, the Container registry began responding to requests with increased latency, followed by an internal server error for a percentage of requests. At this point we knew there was customer impact and changed the public status of the service. This increased CPU activity was due to a high volume of the “Put Manifest” command. Other package registries were not impacted.

The reason for the CPU utilization was that the throttling criteria configured at the API side for this command was too permissive, and a database query was found to be non-performant under that degree of scale. This caused an outage for anyone using the GitHub Container registry. Users were experiencing latency issues when pushing or pulling packages, as well as getting slow access to the packages UI.

In order to limit impact we throttled the requests from all organizations/users and to restore normal operation, we had to reset our database state by restarting our front-end servers and then the database.

To avoid this in the future, we have added separate rate limiting for operation types from specific organizations/users and will continue working on performance improvements for SQL queries.

May 27 04:26 UTC (lasting 21 minutes)

Our alerting systems detected degraded availability for API requests during this time. Due to the recency of these incidents, we are still investigating the contributing factors and will provide a more detailed update on the causes and remediations in the June Availability Report, which will be published the first Wednesday of July.

May 27 07:36 UTC (lasting 1 hour and 21 minutes)

During this incident, services including GitHub Actions, API Requests, Codespaces, Git Operations, Issues, GitHub Packages, GitHub Pages, Pull Requests, and Webhooks were impacted. As we continue to investigate the contributing factors, we will provide a more detailed update in the June Availability Report. We will also share more about our efforts to minimize the impact of similar incidents in the future.

Follow up to April 14 20:35 UTC (lasting 4 hours and 53 minutes)

As we mentioned in the April Availability Report, we are now providing a more detailed update on this incident following further investigation.

On April 14, GitHub Actions and Codespaces customers started reporting incorrect charges for metered services shown in their GitHub billing settings. As a result, customers were hitting their GitHub spending limits and unable to run new Actions or create new Codespaces. We immediately started an incident bridge. Our first step was to unblock all customers by giving unlimited Actions and Codespaces usage for no additional charge during the time of this incident.

From looking at the timing and list of recently pushed changes, we determined that the issue was caused by a code change in the metered billing pipeline. When attempting to improve performance of our metered usage processor, Actions and Codespaces minutes were mistakenly multiplied by 1,000,000,000 to convert gigabytes into bytes when this was not necessary for these products. This was due to a change to shared metered billing code that was not thought to impact these products.

To fix the issue, we reverted the code change and started repairing the corrupted data recorded during the incident. We did not re-enable metered billing for GitHub products until we had repaired the incorrect billing data, which happened 24 hours after this incident.

To prevent this incident in the future, we added a Rubocop (Ruby static code analyzer) rule to block pull requests containing non-safe billing code updates. In addition, we added anomaly monitoring for the billed quantity, so next time we are alerted before impacted customers. We also tightened the release process to require a feature flag and end-to-end test when shipping such changes.

In summary

We will continue to keep you updated on the progress and investments we’re making to ensure the reliability of our services. To receive real-time updates on status changes, please follow our status page. You can also learn more about what we’re working on on the GitHub Engineering Blog.

Testing Amazon EventBridge events using AWS Step Functions

Post Syndicated from James Beswick original https://aws.amazon.com/blogs/compute/testing-amazon-eventbridge-events-using-aws-step-functions/

This post is written by Siarhei Kazhura, Solutions Architect and Riaz Panjwani, Solutions Architect.

Amazon EventBridge is a serverless event bus that can be used to ingest and process events from a variety of sources, such as AWS services and SaaS applications. With EventBridge, developers can build loosely coupled and independently scalable event-driven applications.

It can be useful to know with EventBridge when events are not able to reach the desired destination. This can be caused by multiple factors, such as:

  1. Event pattern does not match the event rule
  2. Event transformer failure
  3. Event destination expects a different payload (for example, API destinations) and returns an error

EventBridge sends metrics to Amazon CloudWatch, which allows for the detection of failed invocations on a given event rule. You can also use EventBridge rules with a dead-letter queue (DLQ) to identify any failed event deliveries. The messages delivered to the queue contain additional metadata such as error codes, error messages, and the target ARN for debugging.

However, understanding why events fail to deliver is still a manual process. Checking CloudWatch metrics for failures, and then the DLQ takes time. This is evident when developing new functionality, when you must constantly update the event matching patterns and event transformers, and run tests to see if they provide the desired effect. EventBridge sandbox functionality can help with manual testing but this approach does not scale or help with automated event testing.

This post demonstrates how to automate testing for EventBridge events. It uses AWS Step Functions for orchestration, along with Amazon DynamoDB and Amazon S3 to capture the results of your events, Amazon SQS for the DLQ, and AWS Lambda to invoke the workflows and processing.

Overview

Using the solution provided in this post, users can track events from its inception to delivery and identify where any issues or errors are occurring. This solution is also customizable, and can incorporate integration tests against events to test pattern matching and transformations.

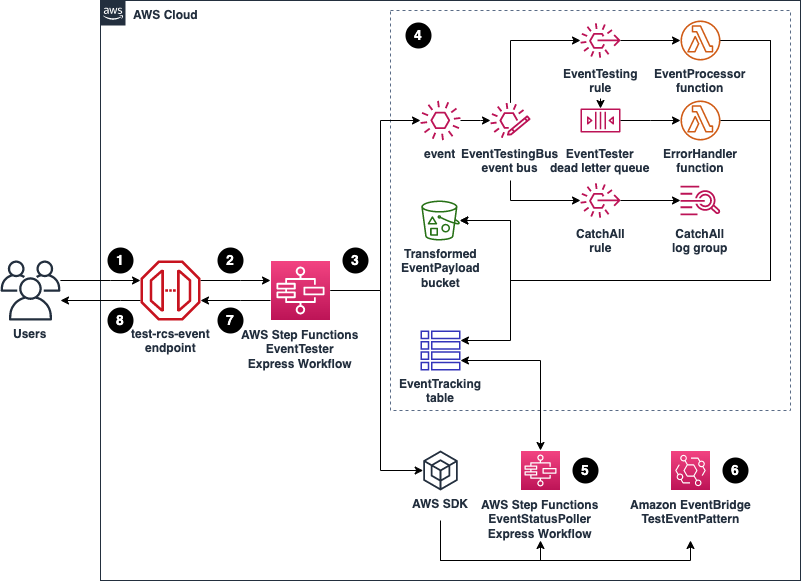
Reference architecture

At a high level:

  1. The event testing workflow is exposed via an API Gateway endpoint, and users can send a request.
  2. This request is validated and routed to a Step Functions EventTester workflow, which performs the event test.
  3. The EventTester workflow creates a sample event based on the received payload, and performs multiple tests on the sample event.
  4. The sample event is matched against the rule that is being tested. The results are stored in an Amazon DynamoDB EventTracking table, and the transformed event payload is stored in the TransformedEventPayload Amazon S3 bucket.
  5. The EventTester workflow has an embedded AWS Step Functions workflow called EventStatusPoller. The EventStatusPoller workflow polls the EventTracking table.
  6. The EventStatusPoller workflow has a customizable 10-second timeout. If the timeout is reached, this may indicate that the event pattern does not match. EventBridge tests if the event does not match against a given pattern, using the AWS SDK for EventBridge.
  7. After completing the tests, the response is formatted and sent back to the API Gateway. By default, the timeout is set to 15 seconds.
  8. API Gateway processes the response, strips the unnecessary elements, and sends the response back to the issuer. You can use this response to verify if the test event delivery is successful, or identify the reason a failure occurred.

EventTester workflow

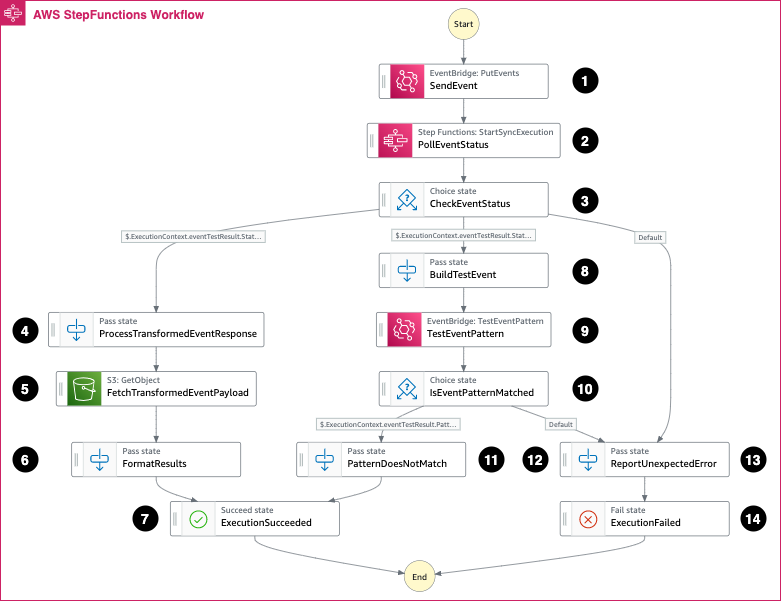
After an API call, this event is sent to the EventTester express workflow. This orchestrates the automated testing, and returns the results of the test.

EventTester workflow

In this workflow:

1. The test event is sent to EventBridge to see if the event matches the rule and can be transformed. The result is stored in a DynamoDB table.
2. The PollEventStatus synchronous Express Workflow is invoked. It polls the DynamoDB table until a record with the event ID is found or it reaches the timeout. The configurable timeout is 15 seconds by default.
3. If a record is found, it checks the event status.

From here, there are three possible states. In the first state, if the event status has succeeded:

4. The response from the PollEventStatus workflow is parsed and the payload is formatted.
5. The payload is stored in an S3 bucket.
6. The final response is created, which includes the payload, the event ID, and the event status.
7. The execution is successful, and the final response is returned to the user.

In the second state, if no record is found in the table and the PollEventStatus workflow reaches the timeout:

8. The most likely explanation for reaching the timeout is that the event pattern does not match the rule, so the event is not processed. You can build a test to verify if this is the issue.
9. From the EventBridge SDK, the TestEventPattern call is made to see if the event pattern matches the rule.
10. The results of the TestEventPattern call are checked.
11. If the event pattern does not match the rule, then the issue has been successfully identified and the response is created to be sent back to the user. If the event pattern matches the rule, then the issue has not been identified.
12. The response shows that this is an unexpected error.

In the third state, this acts as a catch-all to any other errors that may occur:

13. The response is created with the details of the unexpected error.
14. The execution has failed, and the final response is sent back to the user.

Event testing process

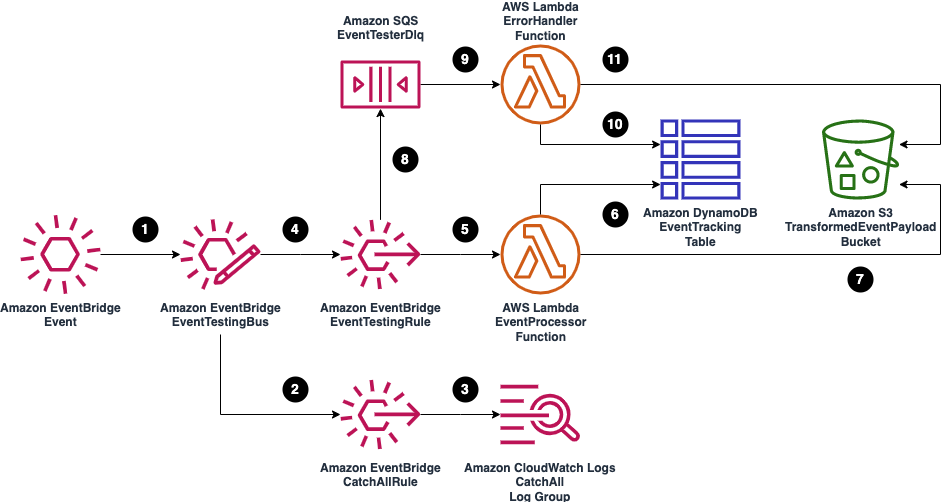
The following diagram shows how events are sent to EventBridge and their results are captured in S3 and DynamoDB. This is the first step of the EventTester workflow:

Event testing process

When the event is tested:

  1. The sample event is received and sent to the EventBridge custom event bus.
  2. A CatchAll rule is triggered, which captures all events on the custom event bus.
  3. All events from the CatchAll rule are sent to a CloudWatch log group, which allows for an original payload inspection.
  4. The event is also propagated to the EventTesting rule. The event is matched against the rule pattern, and if successful the event is transformed based on the transformer provided.
  5. If the event is matched and transformed successfully, the Lambda function EventProcessor is invoked to process the transformed event payload. You can add additional custom code to this function for further testing of the event (for example, API integration with the transformed payload).
  6. The event status is updated to SUCCESS and the event metadata is saved to the EventTracking DynamoDB table.
  7. The transformed event payload is saved to the TransformedEventPayload S3 bucket.
  8. If there’s an error, EventBridge sends the event to the SQS DLQ.
  9. The Lambda function ErrorHandler polls the DLQ and processes the errors in batches.
  10. The event status is updated to ERROR and the event metadata is saved to the EventTracking DynamoDB table.
  11. The event payload is saved to the TransformedEventPayload S3 bucket.

EventStatusPoller workflow

EventStatusPoller workflow

When the poller runs:

  1. It checks the DynamoDB table to see if the event has been processed.
  2. The result of the poll is checked.
  3. If the event has not been processed, the workflow loops and polls the DynamoDB table again.
  4. If the event has been processed, the results of the event are passed to next step in the Event Testing workflow.

Visit Composing AWS Step Functions to abstract polling of asynchronous services for additional details.

Testing at scale

Testing at scale

The EventTester workflow uses Express Workflows, which can handle testing high volume event workloads. For example, you can run the solution against large volumes of historical events stored in S3 or CloudWatch.

This can be achieved by using services such as Lambda or AWS Fargate to read the events in batches and run tests simultaneously. To achieve optimal performance, some performance tuning may be required depending on the scale and events that are being tested.

To minimize the cost of the demo, the DynamoDB table is provisioned with 5 read capacity units and 5 write capacity units. For a production system, consider using on-demand capacity, or update the provisioned table capacity.

Event sampling

Event sampling

In this implementation, the EventBridge EventTester can be used to periodically sample events from your system for testing:

  1. Any existing rules that must be tested are provisioned via the AWS CDK.
  2. The sampling rule is added to an existing event bus, and has the same pattern as the rule that is tested. This filters out events that are not processed by the tested rule.
  3. SQS queue is used for buffering.
  4. Lambda function processes events in batches, and can optionally implement sampling. For example, setting a 10% sampling rate will take one random message out of 10 messages in a given batch.
  5. The event is tested against the endpoint provided. Note that the EventTesting rule is also provisioned via AWS CDK from the same code base as the tested rule. The tested rule is replicated into the EventTesting workflow.
  6. The result is returned to a Lambda function, and is then sent to CloudWatch Logs.
  7. A metric is set based on the number of ERROR responses in the logs.
  8. An alarm is configured when the ERROR metric crosses a provided threshold.

This sampling can complement existing metrics exposed for EventBridge via CloudWatch.

Solution walkthrough

To follow the solution walkthrough, visit the solution repository. The walkthrough explains:

  1. Prerequisites required.
  2. Detailed solution deployment walkthrough.
  3. Solution customization and testing.
  4. Cleanup process.
  5. Cost considerations.

Conclusion

This blog post outlines how to use Step Functions, Lambda, SQS, DynamoDB, and S3 to create a workflow that automates the testing of EventBridge events. With this example, you can send events to the EventBridge Event Tester endpoint to verify that event delivery is successful or identify the root cause for event delivery failures.

For more serverless learning resources, visit Serverless Land.

Amazon EMR Serverless Now Generally Available – Run Big Data Applications without Managing Servers

Post Syndicated from Channy Yun original https://aws.amazon.com/blogs/aws/amazon-emr-serverless-now-generally-available-run-big-data-applications-without-managing-servers/

At AWS re:Invent 2021, we introduced three new serverless options for our data analytics services – Amazon EMR Serverless, Amazon Redshift Serverless, and Amazon MSK Serverless – that make it easier to analyze data at any scale without having to configure, scale, or manage the underlying infrastructure.

Today we announce the general availability of Amazon EMR Serverless, a serverless deployment option for customers to run big data analytics applications using open-source frameworks like Apache Spark and Hive without configuring, managing, and scaling clusters or servers.

With EMR Serverless, you can run analytics workloads at any scale with automatic scaling that resizes resources in seconds to meet changing data volumes and processing requirements. EMR Serverless automatically scales resources up and down to provide just the right amount of capacity for your application, and you only pay for what you use.

During the preview, we heard from customers that EMR Serverless is cost-effective because they do not incur cost from having to overprovision resources to deal with demand spikes. They do not have to worry about right-sizing instances or applying OS updates, and can focus on getting products to market faster.

Amazon EMR provides various deployment options to run applications to fit varied needs such as EMR clusters on Amazon Elastic Compute Cloud (Amazon EC2), Amazon Elastic Kubernetes Service (Amazon EKS) clusters, AWS Outposts, or EMR Serverless.

  • EMR on Amazon EC2 clusters is suitable for customers that need maximum control and flexibility over how to run their application. With EMR clusters, customers can choose the EC2 instance type to enhance the performance of certain applications, customize the Amazon Machine Image (AMI), choose EC2 instance configuration, customize, and extend open-source frameworks and install additional custom software on cluster instances.
  • EMR on Amazon EKS is suitable for customers that want to standardize on EKS to manage clusters across applications or use different versions of an open-source framework on the same cluster.
  • EMR on AWS Outposts is for customers who want to run EMR closer to their data center within an Outpost.
  • EMR Serverless is suitable for customers that want to avoid managing and operating clusters, and simply want to run applications using open-source frameworks.

Also, when you build an application using an EMR release (for example, a Spark job using EMR release 6.4), you can choose to run it on an EMR cluster, EMR on EKS, or EMR Serverless without having to rewrite the application. This allows you to build applications for a given framework version and retain the flexibility to change the deployment model based on future operational needs.

Getting Started with Amazon EMR Serverless
To get started with EMR Serverless, you can use Amazon EMR Studio, a free EMR feature which provides an end to end development and debugging experience. With EMR Studio, you can create EMR Serverless applications (Spark or Hive), choose the version of open-source software for your application, submit jobs, check the status of running jobs, and invoke Spark UI or Tez UI for job diagnostics.

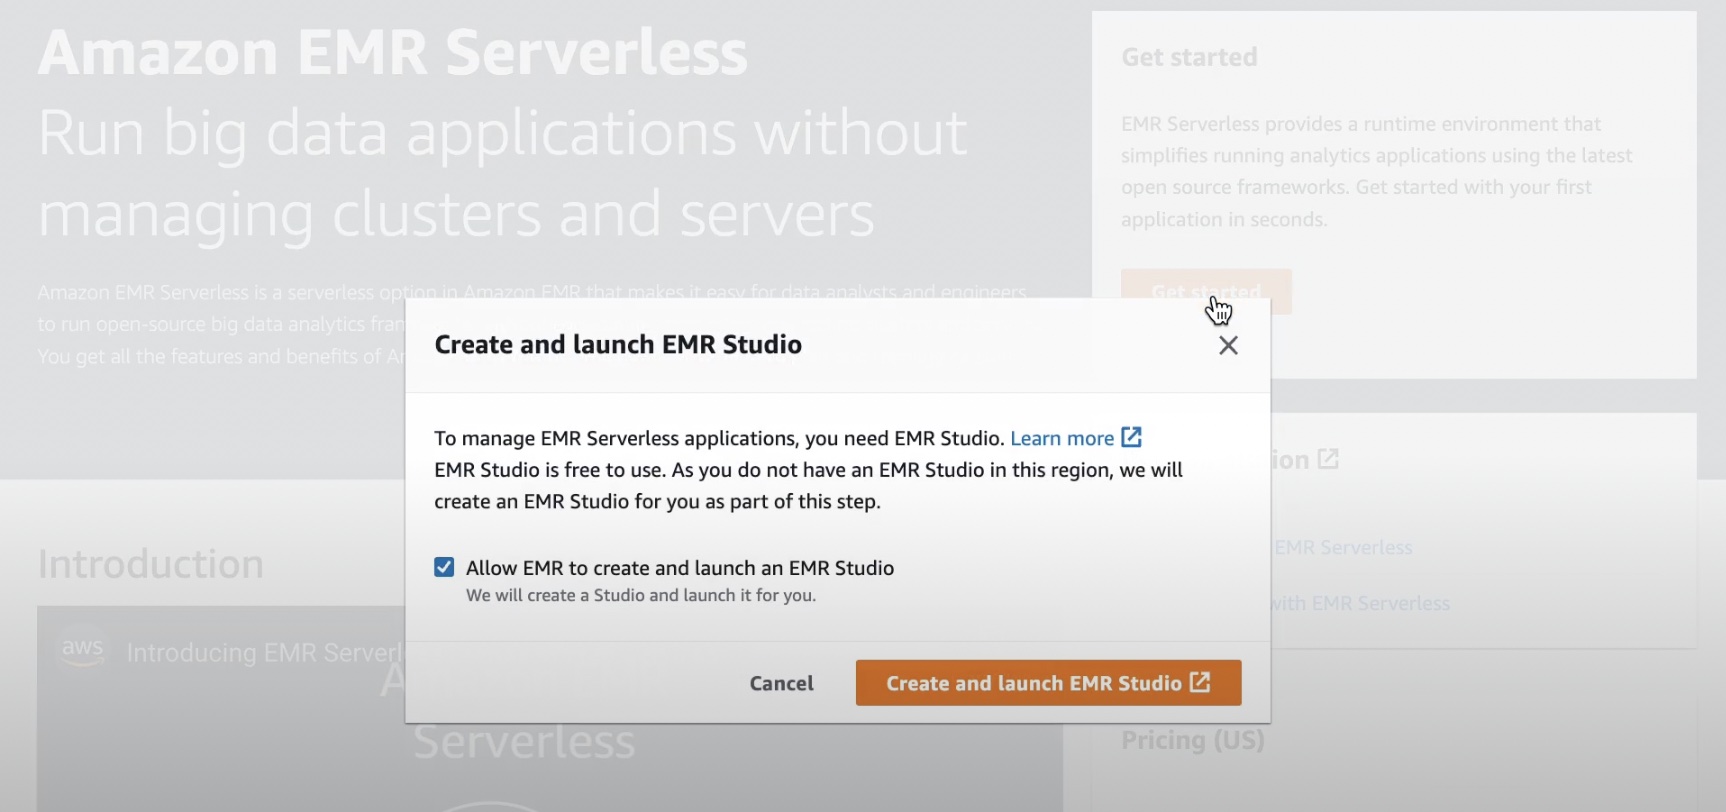
When you select the Get started button in the EMR Serverless Console, you can create and set up EMR Studio with preconfigured EMR Serverless applications.

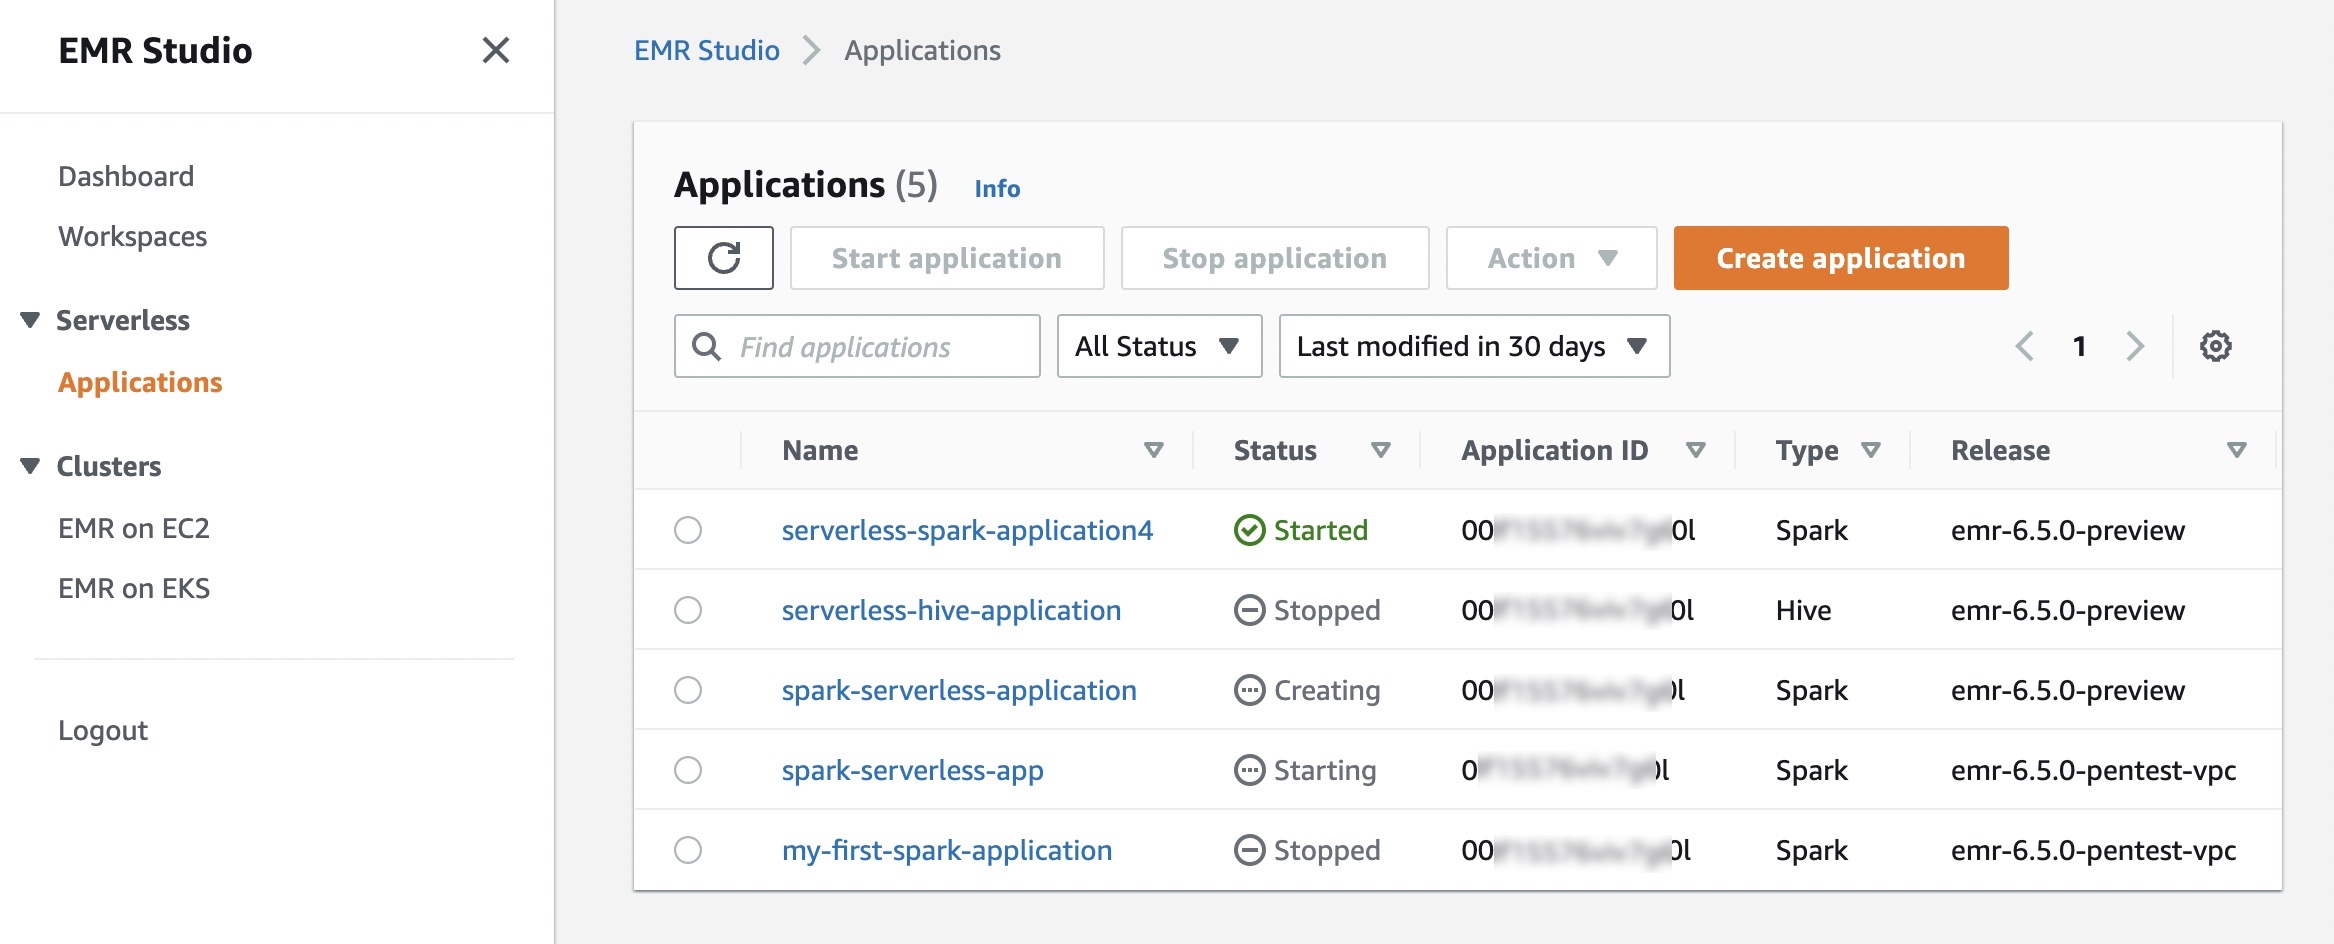
In EMR Studio, when you choose Applications in the Serverless menu, you can create one or more EMR Serverless applications and choose the open source framework and version for your use case. If you want separate logical environments for test and production or for different line-of-business use cases, you can create separate applications for each logical environment.

An EMR Serverless application is a combination of (a) the EMR release version for the open-source framework version you want to use and (b) the specific runtime that you want your application to use, such as Apache Spark or Apache Hive.

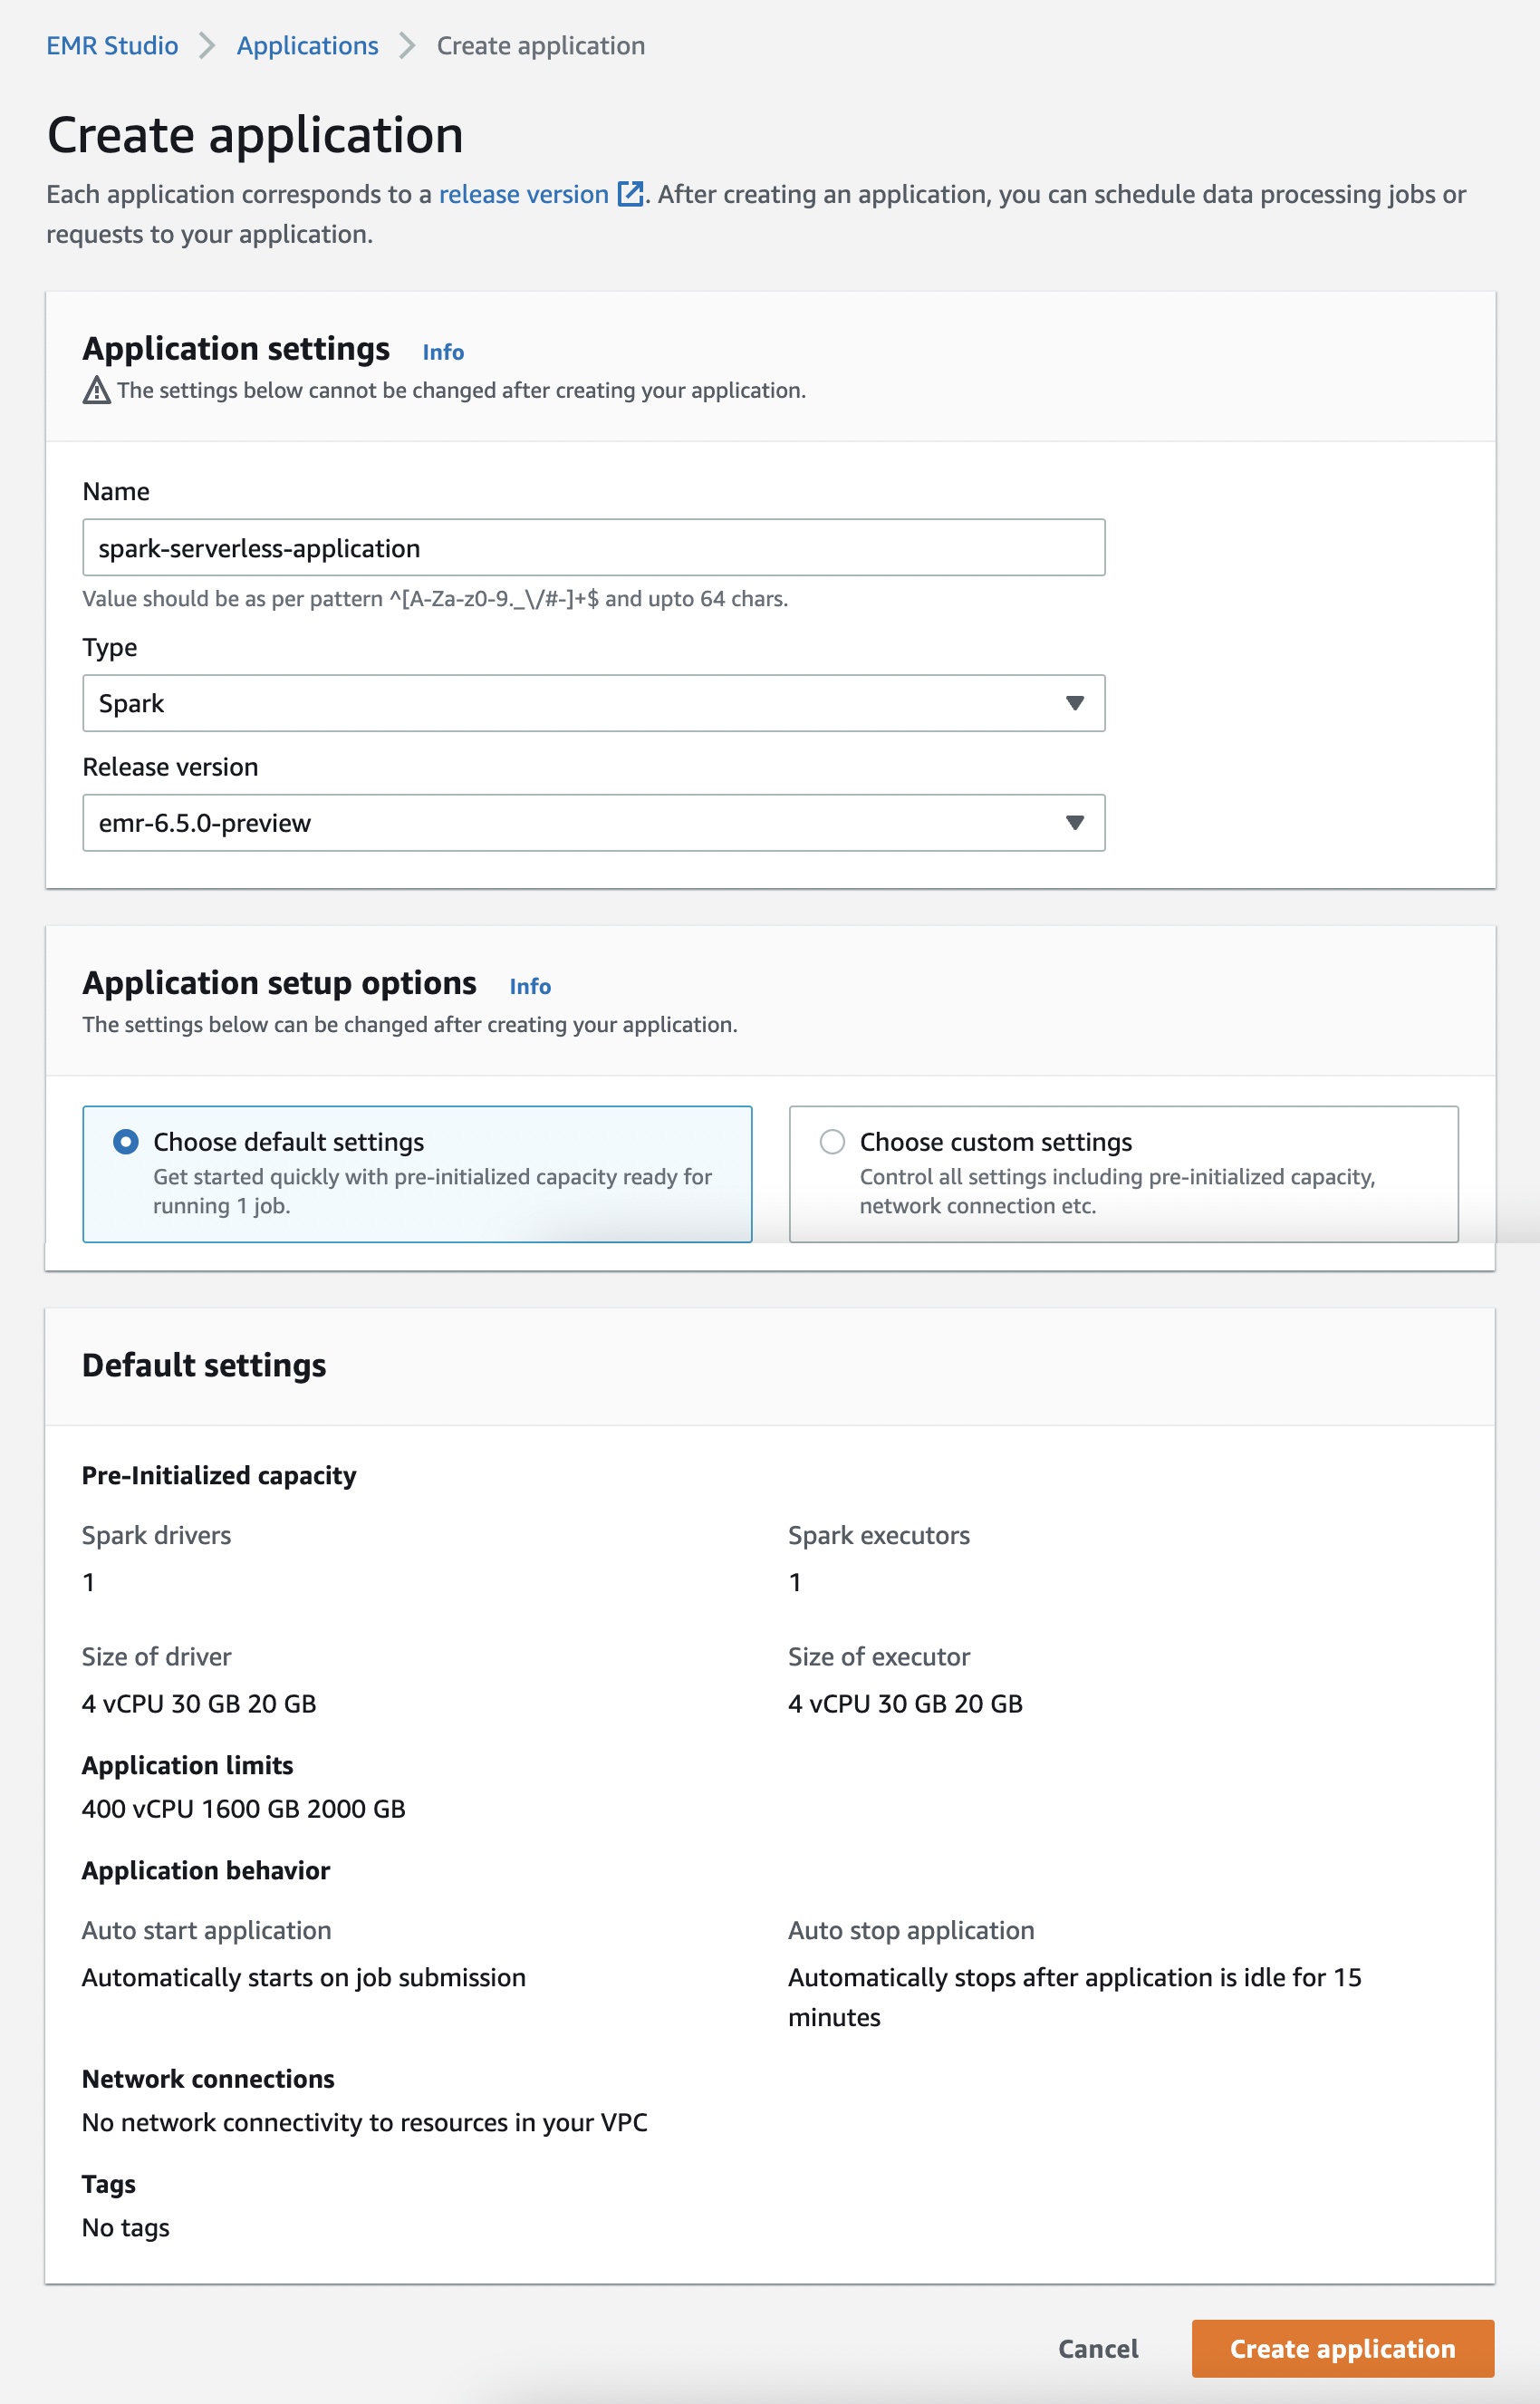
When you choose Create application, you can set your application NameType of either Spark or Hive, and supported Release version. You can also select the option of default or custom settings for pre-initialized capacity, application limits, and Amazon Virtual Private Cloud (Amazon VPC) connectivity options. Each EMR Serverless application is isolated from other applications and runs within a secure VPC.

Use the default option if you want jobs to start immediately. But charges apply for each worker when the application is started. To learn more about pre-initialized capacity, see Configuring and managing pre-initialized capacity.

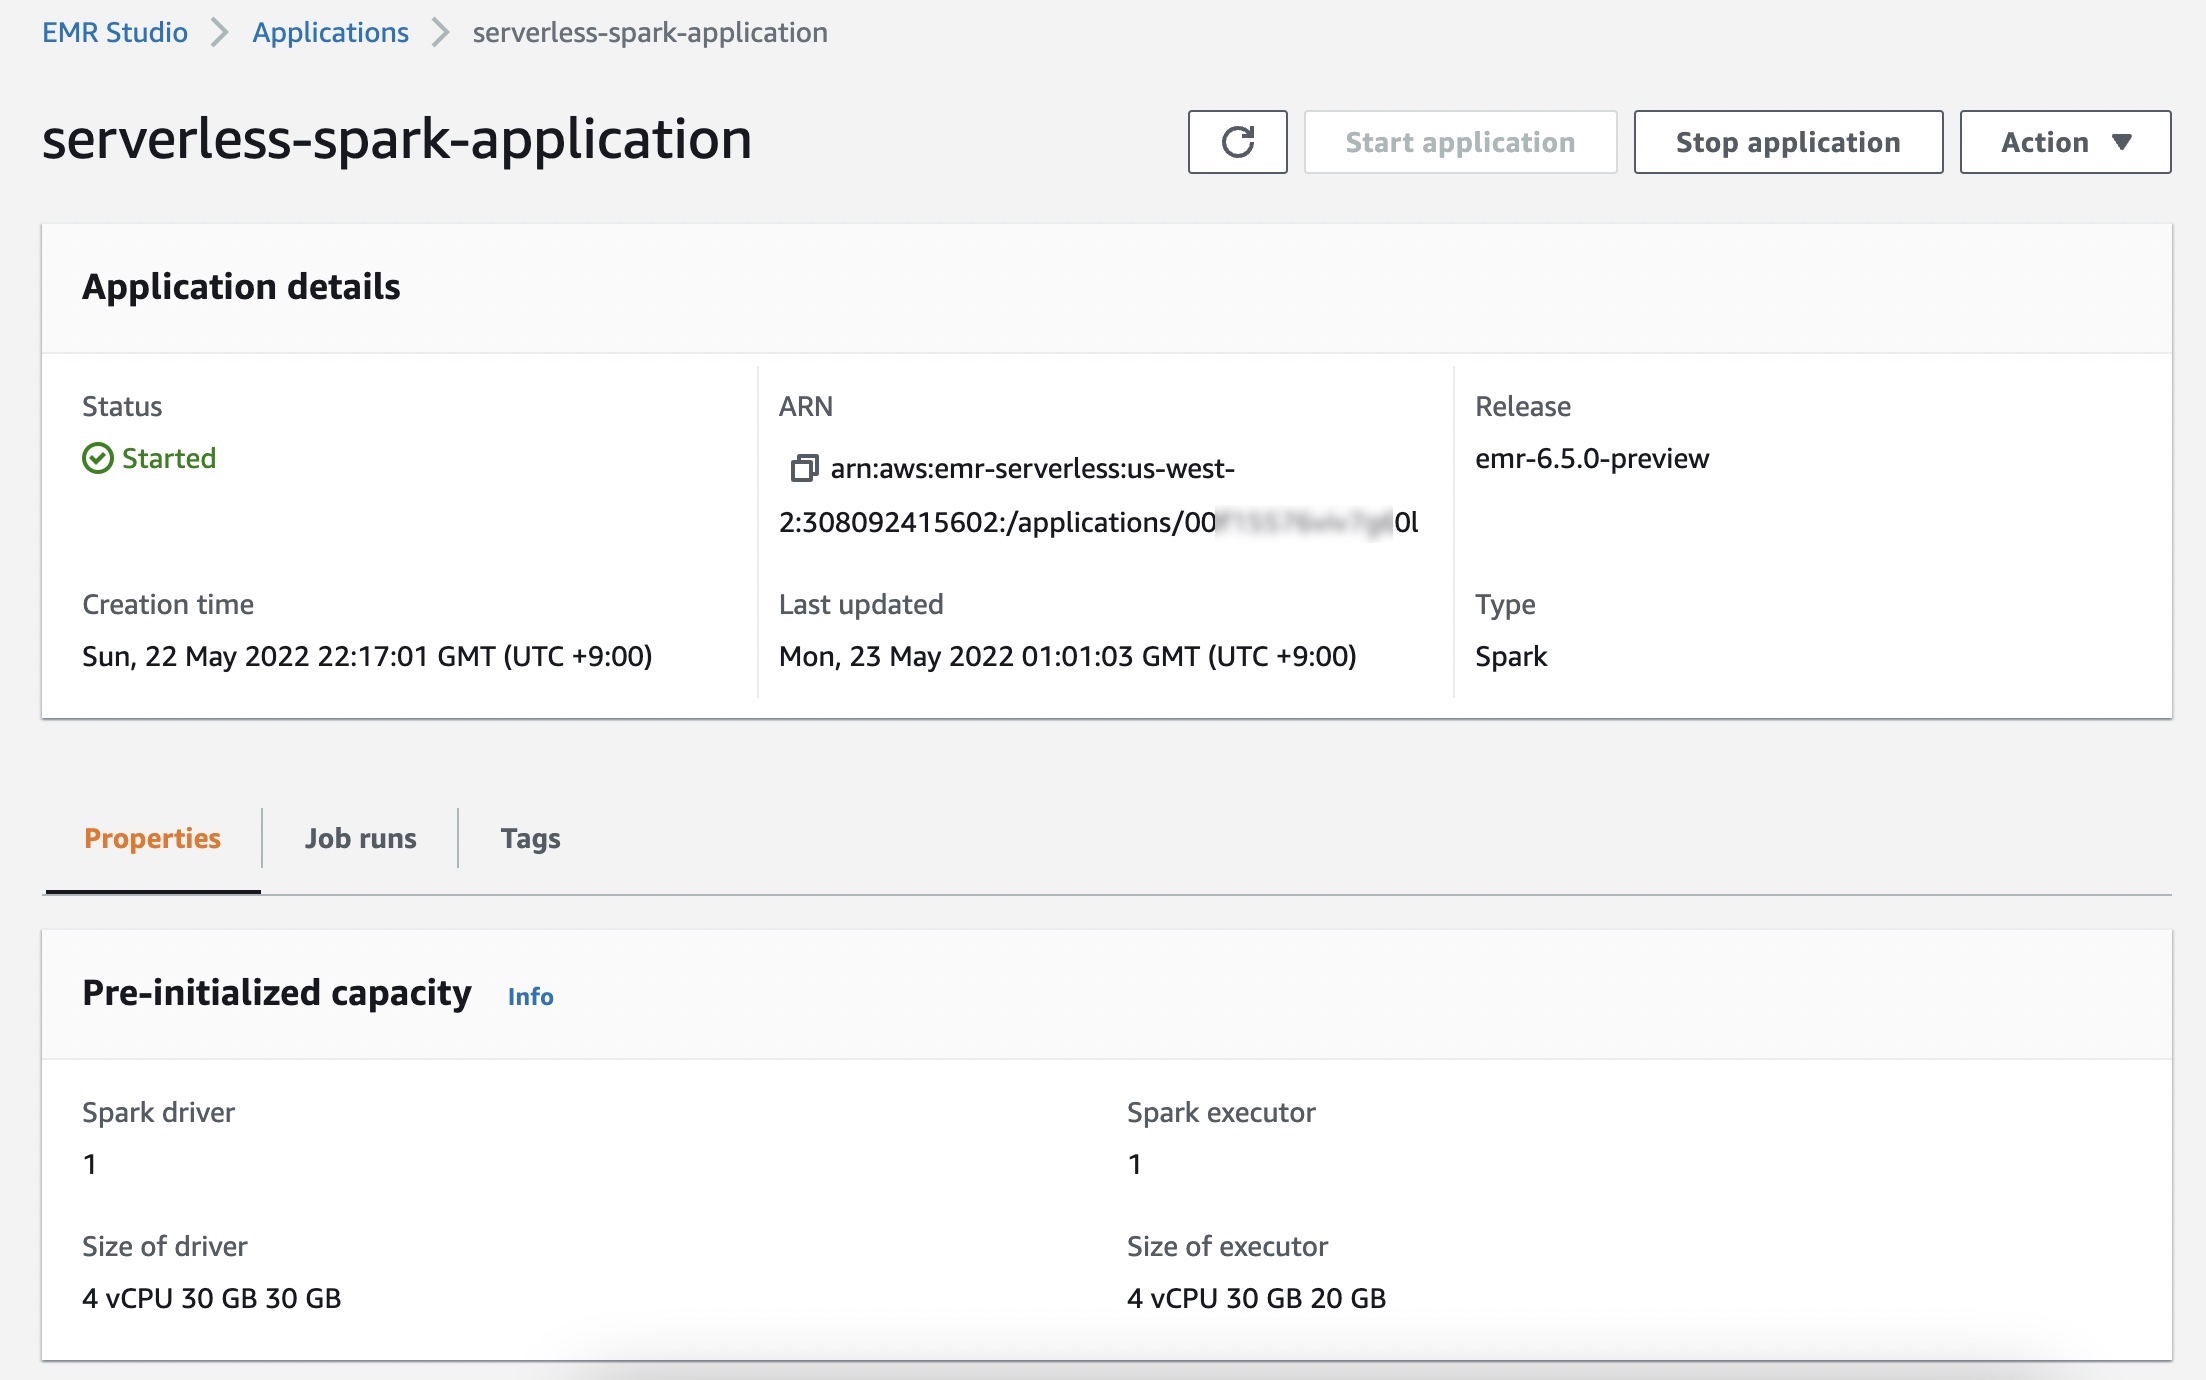
When you select Start application, your application is setup to start with pre-initialized capacity of 1 Spark driver and 1 Spark executor. Your application is by default configured to start when jobs are submitted and stop when the application is idle for more than 15 minutes.

You can customize these settings and setup different application limits by selecting Choose custom settings.

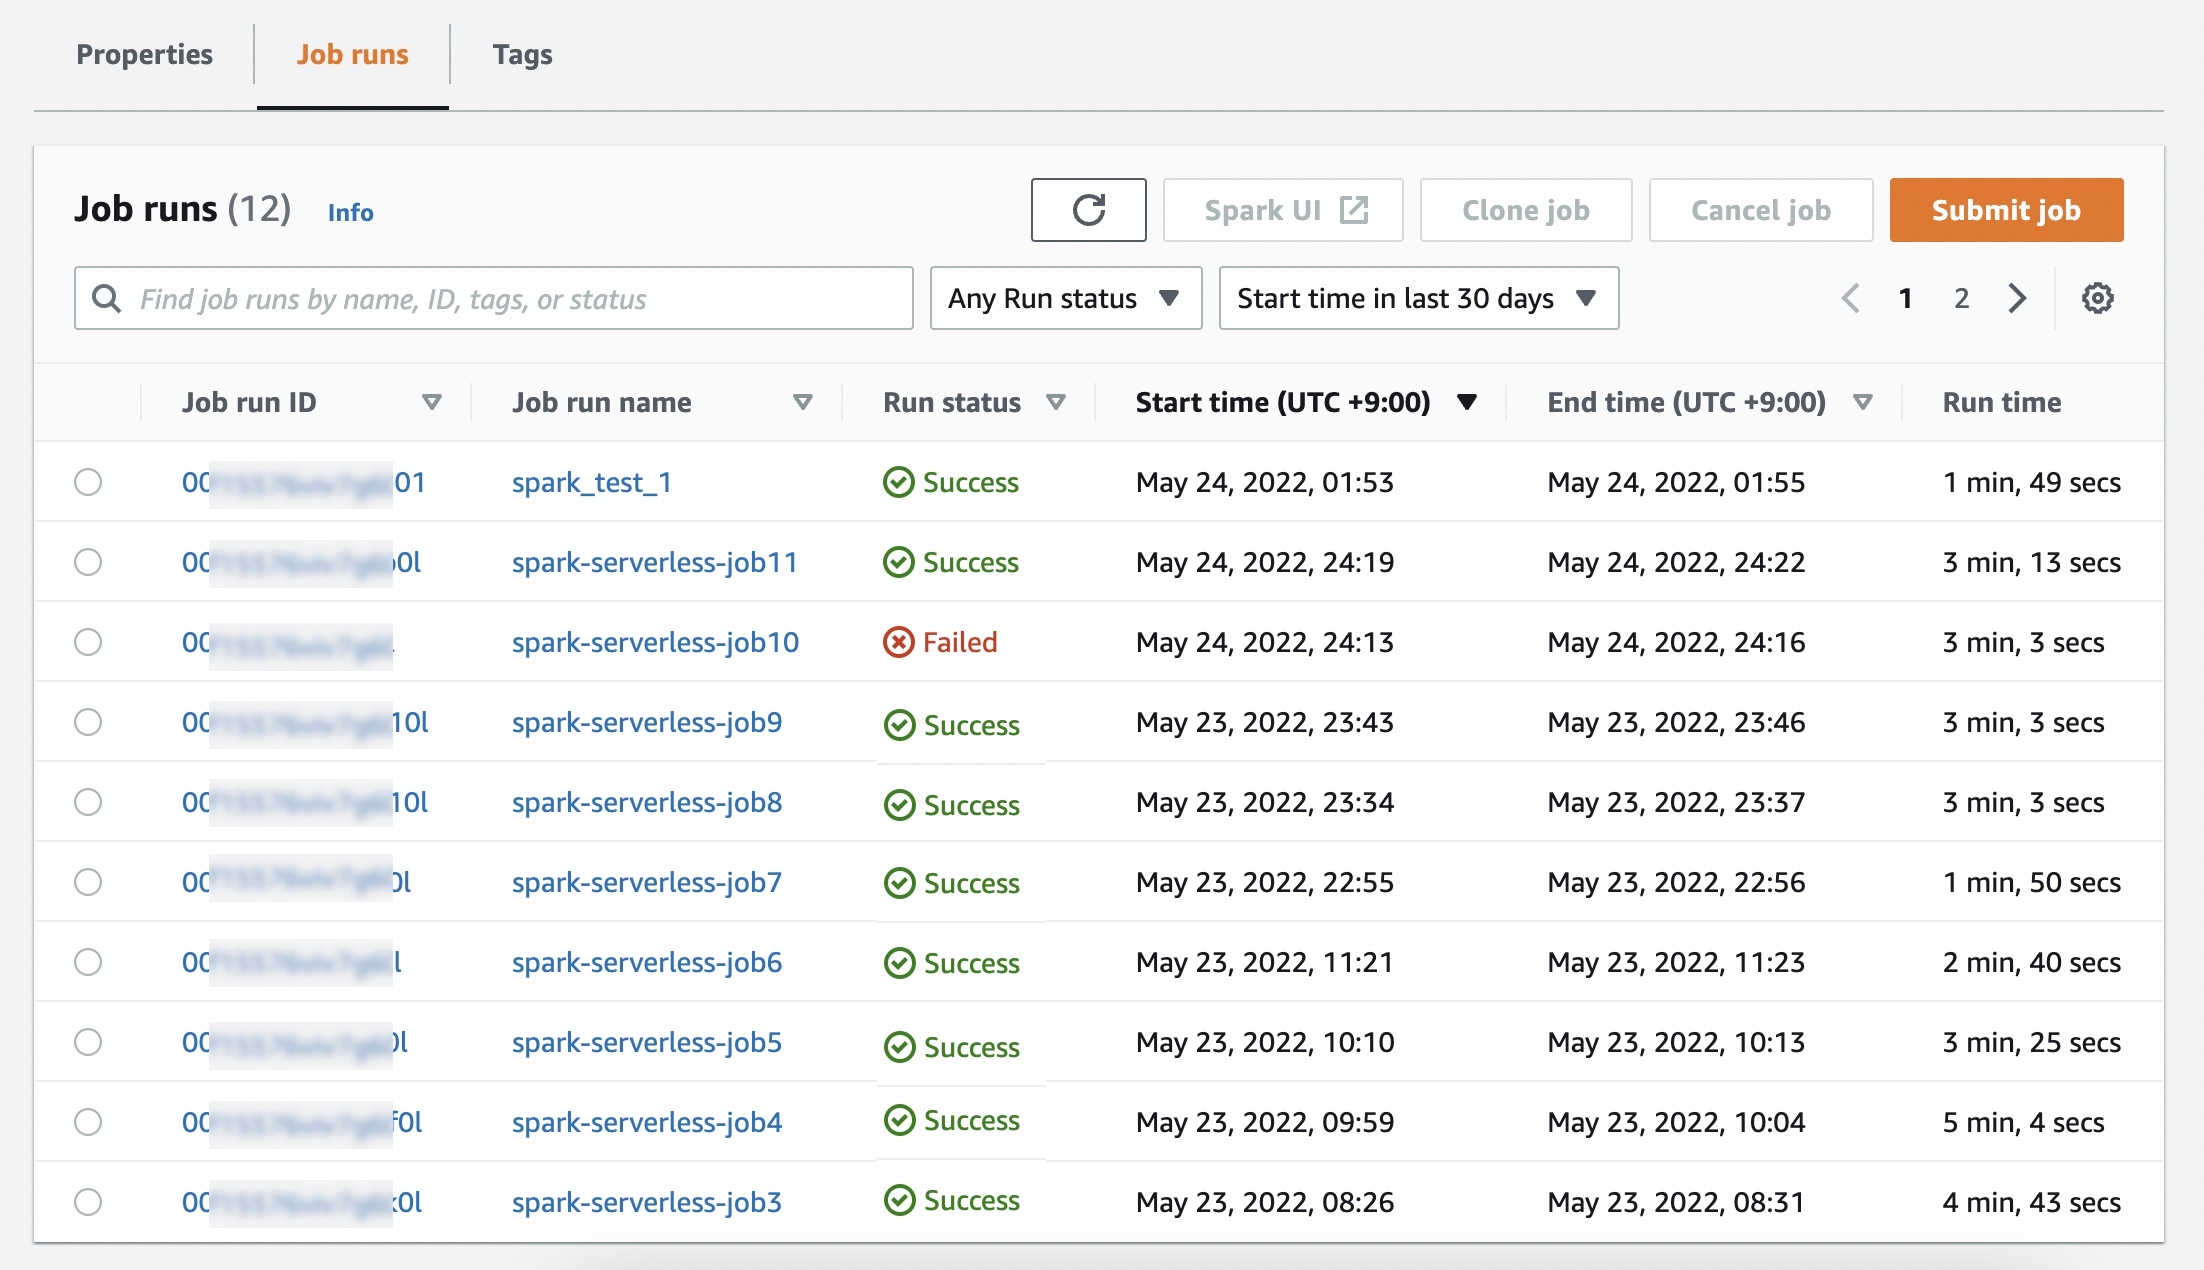
In the Job runs menu, you can see a list of run jobs for your application.

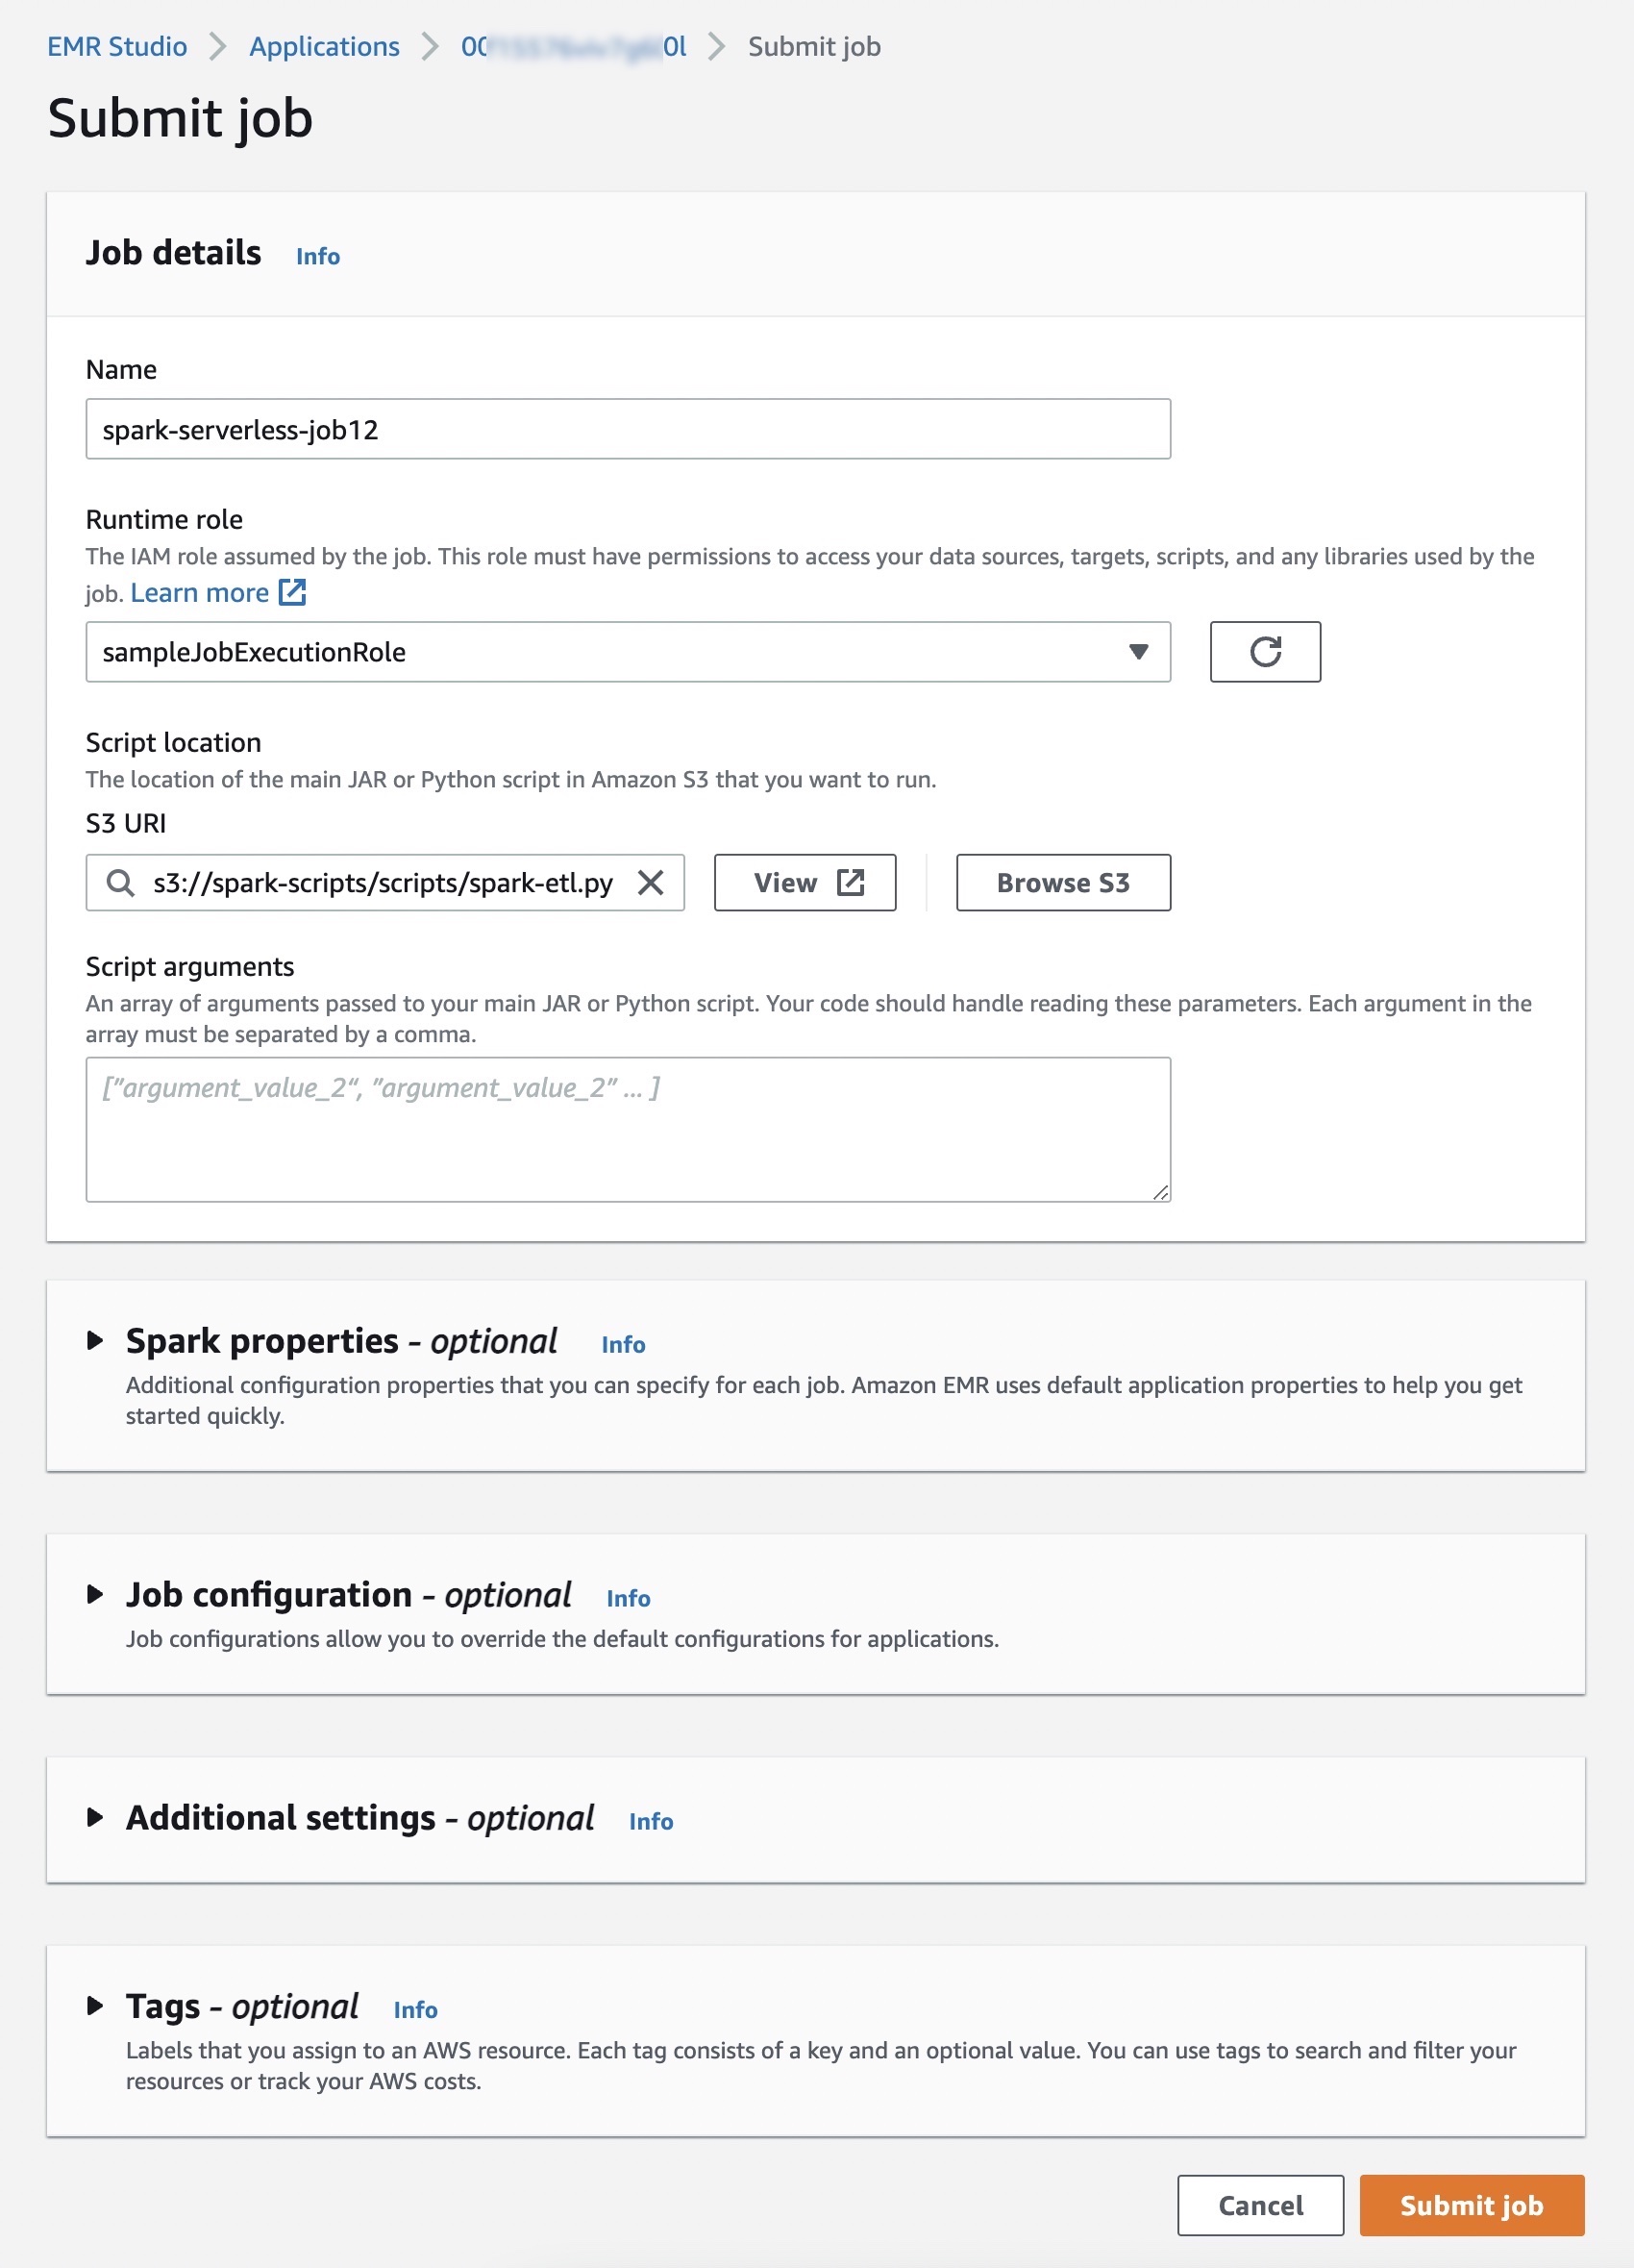
Choose Submit job and set up job details such as the name, AWS Identity and Access Management (IAM) role used by the job, script location, and arguments of the JAR or Python script in the Amazon Simple Storage Service (Amazon S3) bucket that you want to run.

If you want logs for your Spark or Hive jobs to be submitted to your S3 bucket, you will need to setup the S3 bucket in the same Region where you are running EMR Serverless jobs.

Optionally, you can set additional configuration properties that you can specify for each job, such as Spark properties, job configurations to override the default configurations for applications (such as using the AWS Glue Data Catalog as its metastore), storing logs to Amazon S3, and retaining logs for 30 days.

The following is an example of running a Python script using the StartJobRun API.

$ aws emr-serverless start-job-run \
    --application-id <application_id> \
    --execution-role-arn <iam_role_arn> \
    --job-driver '{
        "sparkSubmit": {
            "entryPoint": "s3://spark-scripts/scripts/spark-etl.py",
            "entryPointArguments": "s3://spark-scripts/output",
            "sparkSubmitParameters": "--conf spark.executor.cores=1 --conf spark.executor.memory=4g --conf spark.driver.cores=1 --conf spark.driver.memory=4g --conf spark.executor.instances=1"
        }
    }' \
    --configuration-overrides '{
        "monitoringConfiguration": {
           "s3MonitoringConfiguration": {
             "logUri": "s3://spark-scripts/logs/"
           }
        }
    }'

You can check on job results in your S3 bucket. For details, you can use Spark UI for Spark Application, and Hive/Tez UI in the Job runs menu to understand how the job ran or to debug it if it failed.

For more debugging, EMR Serverless will push event logs to the sparklogs folder in your S3 log destination for Spark applications. In the case of Hive applications, EMR Serverless will continuously upload the Hive driver and Tez tasks logs to the HIVE_DRIVER or TEZ_TASK folders of your S3 log destination. To learn more, see Logging in the AWS documentation.

Things to Know
With EMR Serverless, you can get all the benefits of running Amazon EMR. I want to quote some things to know about EMR Serverless from an AWS Big Data Blog post of preview announcements:

  • Automatic and fine-grained scaling – EMR Serverless automatically scales up workers at each stage of processing your job and scales them down when they’re not required. You’re charged for aggregate vCPU, memory, and storage resources used from the time a worker starts running until it stops, rounded up to the nearest second with a 1-minute minimum. For example, your job may require 10 workers for the first 10 minutes of processing the job and 50 workers for the next 5 minutes. With fine-grained automatic scaling, you only incur cost for 10 workers for 10 minutes and 50 workers for 5 minutes. As a result, you don’t have to pay for underutilized resources.
  • Resilience to Availability Zone failures – EMR Serverless is a Regional service. When you submit jobs to an EMR Serverless application, it can run in any Availability Zone in the Region. In case an Availability Zone is impaired, a job submitted to your EMR Serverless application is automatically run in a different (healthy) Availability Zone. When using resources in a private VPC, EMR Serverless recommends that you specify the private VPC configuration for multiple Availability Zones so that EMR Serverless can automatically select a healthy Availability Zone.
  • Enable shared applications – When you submit jobs to an EMR Serverless application, you can specify the IAM role that must be used by the job to access AWS resources such as S3 objects. As a result, different IAM principals can run jobs on a single EMR Serverless application, and each job can only access the AWS resources that the IAM principal is allowed to access. This enables you to set up scenarios where a single application with a pre-initialized pool of workers is made available to multiple tenants wherein each tenant can submit jobs using a different IAM role but use the common pool of pre-initialized workers to immediately process requests.

Now Available
Amazon EMR Serverless is available in US East (N. Virginia), US West (Oregon), Europe (Ireland), and Asia Pacific (Tokyo) Regions. With EMR Serverless, there are no upfront costs, and you pay only for the resources you use. You pay for the amount of vCPU, memory, and storage resources consumed by your applications. For pricing details, see the EMR Serverless pricing page.

To learn more, visit the Amazon EMR Serverless User Guide. Please send feedback to AWS re:Post for Amazon EMR Serverless or through your usual AWS support contacts.

Learn all the details about Amazon EMR Serverless and get started today.

Channy

When and where to use IAM permissions boundaries

Post Syndicated from Umair Rehmat original https://aws.amazon.com/blogs/security/when-and-where-to-use-iam-permissions-boundaries/

Customers often ask for guidance on permissions boundaries in AWS Identity and Access Management (IAM) and when, where, and how to use them. A permissions boundary is an IAM feature that helps your centralized cloud IAM teams to safely empower your application developers to create new IAM roles and policies in Amazon Web Services (AWS). In this blog post, we cover this common use case for permissions boundaries, some best practices to consider, and a few things to avoid.

Background

Developers often need to create new IAM roles and policies for their applications because these applications need permissions to interact with AWS resources. For example, a developer will likely need to create an IAM role with the correct permissions for an Amazon Elastic Compute Cloud (Amazon EC2) instance to report logs and metrics to Amazon CloudWatch. Similarly, a role with accompanying permissions is required for an AWS Glue job to extract, transform, and load data to an Amazon Simple Storage Service (Amazon S3) bucket, or for an AWS Lambda function to perform actions on the data loaded to Amazon S3.

Before the launch of IAM permissions boundaries, central admin teams, such as identity and access management or cloud security teams, were often responsible for creating new roles and policies. But using a centralized team to create and manage all IAM roles and policies creates a bottleneck that doesn’t scale, especially as your organization grows and your centralized team receives an increasing number of requests to create and manage new downstream roles and policies. Imagine having teams of developers deploying or migrating hundreds of applications to the cloud—a centralized team won’t have the necessary context to manually create the permissions for each application themselves.

Because the use case and required permissions can vary significantly between applications and workloads, customers asked for a way to empower their developers to safely create and manage IAM roles and policies, while having security guardrails in place to set maximum permissions. IAM permissions boundaries are designed to provide these guardrails so that even if your developers created the most permissive policy that you can imagine, such broad permissions wouldn’t be functional.

By setting up permissions boundaries, you allow your developers to focus on tasks that add value to your business, while simultaneously freeing your centralized security and IAM teams to work on other critical tasks, such as governance and support. In the following sections, you will learn more about permissions boundaries and how to use them.

Permissions boundaries

A permissions boundary is designed to restrict permissions on IAM principals, such as roles, such that permissions don’t exceed what was originally intended. The permissions boundary uses an AWS or customer managed policy to restrict access, and it’s similar to other IAM policies you’re familiar with because it has resource, action, and effect statements. A permissions boundary alone doesn’t grant access to anything. Rather, it enforces a boundary that can’t be exceeded, even if broader permissions are granted by some other policy attached to the role. Permissions boundaries are a preventative guardrail, rather than something that detects and corrects an issue. To grant permissions, you use resource-based policies (such as S3 bucket policies) or identity-based policies (such as managed or in-line permissions policies).

The predominant use case for permissions boundaries is to limit privileges available to IAM roles created by developers (referred to as delegated administrators in the IAM documentation) who have permissions to create and manage these roles. Consider the example of a developer who creates an IAM role that can access all Amazon S3 buckets and Amazon DynamoDB tables in their accounts. If there are sensitive S3 buckets in these accounts, then these overly broad permissions might present a risk.

To limit access, the central administrator can attach a condition to the developer’s identity policy that helps ensure that the developer can only create a role if the role has a permissions boundary policy attached to it. The permissions boundary, which AWS enforces during authorization, defines the maximum permissions that the IAM role is allowed. The developer can still create IAM roles with permissions that are limited to specific use cases (for example, allowing specific actions on non-sensitive Amazon S3 buckets and DynamoDB tables), but the attached permissions boundary prevents access to sensitive AWS resources even if the developer includes these elevated permissions in the role’s IAM policy. Figure 1 illustrates this use of permissions boundaries.

Figure 1: Implementing permissions boundaries

Figure 1: Implementing permissions boundaries

  1. The central IAM team adds a condition to the developer’s IAM policy that allows the developer to create a role only if a permissions boundary is attached to the role.
  2. The developer creates a role with accompanying permissions to allow access to an application’s Amazon S3 bucket and DynamoDB table. As part of this step, the developer also attaches a permissions boundary that defines the maximum permissions for the role.
  3. Resource access is granted to the application’s resources.
  4. Resource access is denied to the sensitive S3 bucket.

You can use the following policy sample for your developers to allow the creation of roles only if a permissions boundary is attached to them. Make sure to replace <YourAccount_ID> with an appropriate AWS account ID; and the <DevelopersPermissionsBoundary>, with your permissions boundary policy.

   "Effect": "Allow",
   "Action": "iam:CreateRole",
   "Condition": {
      "StringEquals": {
         "iam:PermissionsBoundary": "arn:aws:iam::<YourAccount_ID&gh;:policy/<DevelopersPermissionsBoundary>"
      }
   }

You can also deny deletion of a permissions boundary, as shown in the following policy sample.

   "Effect": "Deny",
   "Action": "iam:DeleteRolePermissionsBoundary"

You can further prevent detaching, modifying, or deleting the policy that is your permissions boundary, as shown in the following policy sample.

   "Effect": "Deny", 
   "Action": [
      "iam:CreatePolicyVersion",
      "iam:DeletePolicyVersion",
	"iam:DetachRolePolicy",
"iam:SetDefaultPolicyVersion"
   ],

Put together, you can use the following permissions policy for your developers to get started with permissions boundaries. This policy allows your developers to create downstream roles with an attached permissions boundary. The policy further denies permissions to detach, delete, or modify the attached permissions boundary policy. Remember, nothing is implicitly allowed in IAM, so you need to allow access permissions for any other actions that your developers require. To learn about allowing access permissions for various scenarios, see Example IAM identity-based policies in the documentation.

{
   "Version": "2012-10-17",
   "Statement": [
      {
         "Sid": "AllowRoleCreationWithAttachedPermissionsBoundary",
   "Effect": "Allow",
   "Action": "iam:CreateRole",
   "Resource": "*",
   "Condition": {
      "StringEquals": {
         "iam:PermissionsBoundary": "arn:aws:iam::<YourAccount_ID>:policy/<DevelopersPermissionsBoundary>"
      }
         }
      },
      {
   "Sid": "DenyPermissionsBoundaryDeletion",
   "Effect": "Deny",
   "Action": "iam:DeleteRolePermissionsBoundary",
   "Resource": "*",
   "Condition": {
      "StringEquals": {
         "iam:PermissionsBoundary": "arn:aws:iam::<YourAccount_ID>:policy/<DevelopersPermissionsBoundary>"
      }
   }
      },
      {
   "Sid": "DenyPolicyChange",
   "Effect": "Deny", 
   "Action": [
      "iam:CreatePolicyVersion",
      "iam:DeletePolicyVersion",
      "iam:DetachRolePolicy",
      "iam:SetDefaultPolicyVersion"
   ],
   "Resource":
"arn:aws:iam::<YourAccount_ID>:policy/<DevelopersPermissionsBoundary>"
      }
   ]
}

Permissions boundaries at scale

You can build on these concepts and apply permissions boundaries to different organizational structures and functional units. In the example shown in Figure 2, the developer can only create IAM roles if a permissions boundary associated to the business function is attached to the IAM roles. In the example, IAM roles in function A can only perform Amazon EC2 actions and Amazon DynamoDB actions, and they don’t have access to the Amazon S3 or Amazon Relational Database Service (Amazon RDS) resources of function B, which serve a different use case. In this way, you can make sure that roles created by your developers don’t exceed permissions outside of their business function requirements.

Figure 2: Implementing permissions boundaries in multiple organizational functions

Figure 2: Implementing permissions boundaries in multiple organizational functions

Best practices

You might consider restricting your developers by directly applying permissions boundaries to them, but this presents the risk of you running out of policy space. Permissions boundaries use a managed IAM policy to restrict access, so permissions boundaries can only be up to 6,144 characters long. You can have up to 10 managed policies and 1 permissions boundary attached to an IAM role. Developers often need larger policy spaces because they perform so many functions. However, the individual roles that developers create—such as a role for an AWS service to access other AWS services, or a role for an application to interact with AWS resources—don’t need those same broad permissions. Therefore, it is generally a best practice to apply permissions boundaries to the IAM roles created by developers, rather than to the developers themselves.

There are better mechanisms to restrict developers, and we recommend that you use IAM identity policies and AWS Organizations service control policies (SCPs) to restrict access. In particular, the Organizations SCPs are a better solution here because they can restrict every principal in the account through one policy, rather than separately restricting individual principals, as permissions boundaries and IAM identity policies are confined to do.

You should also avoid replicating the developer policy space to a permissions boundary for a downstream IAM role. This, too, can cause you to run out of policy space. IAM roles that developers create have specific functions, and the permissions boundary can be tailored to common business functions to preserve policy space. Therefore, you can begin to group your permissions boundaries into categories that fit the scope of similar application functions or use cases (such as system automation and analytics), and allow your developers to choose from multiple options for permissions boundaries, as shown in the following policy sample.

"Condition": {
   "StringEquals": { 
      "iam:PermissionsBoundary": [
"arn:aws:iam::<YourAccount_ID>:policy/PermissionsBoundaryFunctionA",
"arn:aws:iam::<YourAccount_ID>:policy/PermissionsBoundaryFunctionB"
      ]
   }
}

Finally, it is important to understand the differences between the various IAM resources available. The following table lists these IAM resources, their primary use cases and managing entities, and when they apply. Even if your organization uses different titles to refer to the personas in the table, you should have separation of duties defined as part of your security strategy.

IAM resource Purpose Owner/maintainer Applies to
Federated roles and policies Grant permissions to federated users for experimentation in lower environments Central team People represented by users in the enterprise identity provider
IAM workload roles and policies Grant permissions to resources used by applications, services Developer IAM roles representing specific tasks performed by applications
Permissions boundaries Limit permissions available to workload roles and policies Central team Workload roles and policies created by developers
IAM users and policies Allowed only by exception when there is no alternative that satisfies the use case Central team plus senior leadership approval Break-glass access; legacy workloads unable to use IAM roles

Conclusion

This blog post covered how you can use IAM permissions boundaries to allow your developers to create the roles that they need and to define the maximum permissions that can be given to the roles that they create. Remember, you can use AWS Organizations SCPs or deny statements in identity policies for scenarios where permissions boundaries are not appropriate. As your organization grows and you need to create and manage more roles, you can use permissions boundaries and follow AWS best practices to set security guard rails and decentralize role creation and management. Get started using permissions boundaries in IAM.

 
If you have feedback about this post, submit comments in the Comments section below. If you have questions about this post, contact AWS Support.

Want more AWS Security news? Follow us on Twitter.

Umair Rehmat

Umair Rehmat

Umair is a cloud solutions architect and technologist based out of the Seattle WA area working on greenfield cloud migrations, solutions delivery, and any-scale cloud deployments. Umair specializes in telecommunications and security, and helps customers onboard, as well as grow, on AWS.

How to Back Up and Restore WhatsApp Messages and Files

Post Syndicated from Barry Kaufman original https://www.backblaze.com/blog/how-to-back-up-and-restore-whatsapp-messages-and-files/

June is Backup Awareness Month and we’re kicking it off with the next installment in our series of guides to help you protect social content across many different platforms. We’re working on developing this list—please comment below if you’d like to see another platform covered.

Some of your most valuable digital assets are memories, scattered across the digital ether. For a lot of us, these mementoes of our meta life are tied up in one of Meta’s most popular apps, WhatsApp. The last group chat you had with old college friends. An inspiring note from a loved one. A funny meme that proves your weird uncle does, in fact, have a sense of humor. They’re all out there, drifting through the cloud.

These are treasured memories, and worth preserving, especially in the always uncertain world online. You might find yourself gravitating towards a new messaging app as the technology changes. You might get locked out of your account. It might even be that your country winds up banning the app. (So far, it’s only happened in places like Cuba and Uganda, and while those were temporary, the app was “temporarily” blocked in China in 2017 and is still blocked. The point being, you never know which way the wind is going to blow).

So obviously, it’s worth it to make sure you have some kind of backup for these treasured memories. Now it’s just a matter of creating those backups, and finding somewhere (or, more accurately, several somewheres) to securely store them.

How to Create Backups of Your WhatsApp Data

Back Up Individual Messages and Group Chats

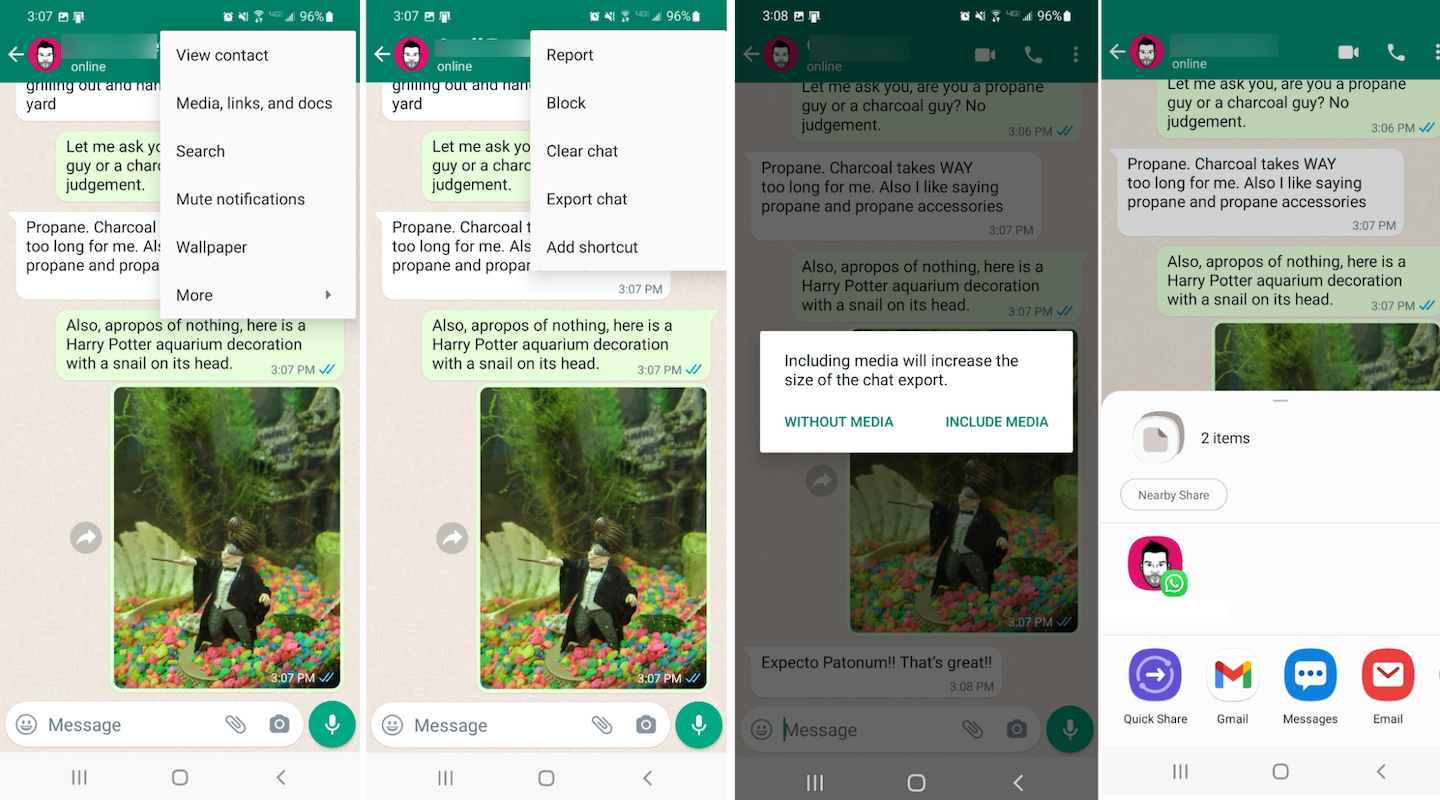
By default, WhatsApp automatically archives your chats every day onto your device, with the option to back them up to Google Drive. As you’ll see, this is not quite sufficient if you really want to preserve those memories. To create a backup that you can preserve elsewhere, use the following steps:

  1. Tap the three vertical dots within an individual message or group chat.
  2. Tap More, and then Export Chat.
  3. You can then choose whether to export with or without media, with the most recent media being added as attachments.
  4. From here, you can choose how to share the attachments, which will consist of a .txt file as well as individual attachments for each piece of media in the chat.
Here we see it as a step-by-step guide, which also helpfully demonstrates the idiotic conversations the author has with his friends on WhatsApp.

Choose Your Backup Destination

We suggest downloading your backup to your device at this point. This step creates a local backup on your phone. From here, you can either download the attachment onto your computer from that same email, or connect your phone and make a copy from local storage onto your desktop. This will create two copies, but we’re just getting started.

Initiating Backup in 3…2…1…

As with anything you back up, the best strategy to employ is the classic 3-2-1 backup strategy. In essence, this is creating a trio of redundant copies, giving your backups their own backups in case anything should go wrong. Typically, you’ll want two copies stored on two different local devices and a third in the cloud.

Is this a little bit of overkill? Absolutely, and we mean that in the best possible way. You’ll thank us when a spilled cup of coffee doesn’t wipe out some of your favorite WhatsApp chats.

Backup #1: Local Storage (i.e., PC)

If you’ve followed the directions so far, you’ll now have a copy of your chats on your phone as well as on your desktop. This constitutes your first local copy.

Backup #2: Options

For your second local copy, you have a few options:

  1. Flash drive: Your computer is prone to any number of breakdowns, outages, or viruses that a flash drive simply isn’t, providing a safe, secondary, local place to store those all-important chats. As anyone who has ever accidentally sat on, stepped on, lost, or otherwise accidentally mutilated a flash drive can tell you, it’s not the end-all-be-all solution. However, having this redundant safety measure could be the thing that saves you from losing your data forever.
  2. External hard drive: An external hard drive is another good option to house a second copy of your data, and we know a little bit about them—we monitor 203,168 hard drives used to store data in our data centers. If you’re new to using an external hard drive, check out this handy guide.
  3. SSD: Like flash and hard drives, external SSDs are another form of external storage you can use to keep backup copies of your data. If you really want to get into the weeds on external storage, check out our guide on the difference between SSD vs. NVMe vs. M.2 drives.

Backup #3: Cloud Storage

We’ll admit to being a bit biased here, but for true peace of mind that your backups will survive any number of disasters and mishaps, you have to incorporate cloud storage into your 3-2-1 solution. (If for no other reason than without it, you have a 2-1 situation which doesn’t quite have the same ring to it. But believe us, there are plenty of other reasons, mainly so you don’t lose your data when your computer suddenly dies or you drop your flash drive down the sewer.)

If you are one of the millions of extraordinarily clever people who use Backblaze Personal Backup, this might just be the easiest step in the process because it’s all done automatically. Simply by having your WhatsApp backups on your computer, you’ll rest easy knowing that the software is one step ahead of you, storing your chats and online memories safely in the cloud.

If space is limited locally, and you don’t necessarily need the WhatsApp files on your own computer, Backblaze B2 Cloud Storage gives you plenty of space in the cloud to stash them until they’re needed. Paired with local copies elsewhere, you could also use this method to achieve a 3-2-1 strategy without taking up a huge amount of space locally on your machine.

Bonus Pro Tips: Transferring Your WhatsApp Data to a New Phone

While it’s all well and good to have your data securely tucked away using the 3-2-1 strategy, what happens when you get a new phone and want to have easy access through the app to all of your old chats? When that happens, you’re going to be glad you squirreled it away, and thrilled that we’ve outlined step-by-step how to get your new phone up and running with all of your old memories intact.

How to Restore Your Backup to an Android Phone

Restoring your WhatsApp backup to an Android phone takes a few steps. In these steps, we will assume you have reinstalled WhatsApp on your new phone.

  1. Install a file manager app on your Android phone.
  2. Copy the backup file to your Android phone.
  3. Open the file manager app.
  4. Copy the backup file to WhatsApp > Databases.
  5. Remember to restore the most recently created backup file to the device’s Databases folder.
  6. Restore your WhatsApp backup from local storage.

How to Restore Your Backup to an iPhone

The restore process for WhatsApp on an iPhone is similar. We will assume you do not have WhatsApp installed with the Android steps.

  1. Connect your iPhone to your computer.
  2. Open iTunes.
  3. Back up your iPhone using iTunes. This step will create a WhatsApp backup (along with your other phone data) to your computer.
  4. Back up your iTunes backup to the cloud. Backing up your iTunes data to a cloud storage service is advisable because your PC’s local storage might fail. For detailed guidance, see our post: “A Quick Guide to iCloud and iTunes Backups for Your iPhone and iPad.”
  5. Restore data to your iPhone using iTunes. Restoring your WhatsApp data to your iPhone is simple. Connect your iPhone to the computer where you ran the backup. Open iTunes and use the “restore a backup” feature.

Keep Your WhatsApp Archive Safe

When it comes to your digital assets, backups matter. Even the most mundane conversations you engage in on WhatsApp now might end up being a treasured memory of old friends later on. Preserving them is important, and if you’ve followed these steps and backed up your memories to your computer and to the cloud, you’ll have those memories available at a moment’s notice wherever you are.

The post How to Back Up and Restore WhatsApp Messages and Files appeared first on Backblaze Blog | Cloud Storage & Cloud Backup.

Integrate AWS Glue Schema Registry with the AWS Glue Data Catalog to enable effective schema enforcement in streaming analytics use cases

Post Syndicated from Sam Mokhtari original https://aws.amazon.com/blogs/big-data/integrate-aws-glue-schema-registry-with-the-aws-glue-data-catalog-to-enable-effective-schema-enforcement-in-streaming-analytics-use-cases/

Metadata is an integral part of data management and governance. The AWS Glue Data Catalog can provide a uniform repository to store and share metadata. The main purpose of the Data Catalog is to provide a central metadata store where disparate systems can store, discover, and use that metadata to query and process the data.

Another important aspect of data governance is serving and managing the relationship between data stores and external clients, which are the producers and consumers of data. As the data evolves, especially in streaming use cases, we need a central framework that provides a contract between producers and consumers to enable schema evolution and improved governance. The AWS Glue Schema Registry provides a centralized framework to help manage and enforce schemas on data streaming applications using convenient integrations with Apache Kafka and Amazon Managed Streaming for Apache Kafka (Amazon MSK), Amazon Kinesis Data Streams, Apache Flink and Amazon Kinesis Data Analytics for Apache Flink, and AWS Lambda.

In this post, we demonstrate how to integrate Schema Registry with the Data Catalog to enable efficient schema enforcement in streaming analytics use cases.

Stream analytics on AWS

There are many different scenarios where customers want to run stream analytics on AWS while managing the schema evolution effectively. To manage the end-to-end stream analytics life cycle, there are many different applications involved for data production, processing, analytics, routing, and consumption. It can be quite hard to manage changes across different applications for stream analytics use cases. Adding/removing a data field across different stream analytics applications can lead to data quality issues or downstream application failures if it is not managed appropriately.

For example, a large grocery store may want to send orders information using Amazon KDS to it’s backend systems. While sending the order information, customer may want to make some data transformations or run analytics on it. The orders may be routed to different targets depending upon the type of orders and it may be integrated with many backend applications which expect order stream data in specific format. But the order details schema can change due to many different reasons such as new business requirements, technical changes, source system upgrades or something else.

The changes are inevitable but customers want a mechanism to manage these changes effectively while running their stream analytics workloads.  To support stream analytics use cases on AWS and enforce schema and governance, customers can make use of AWS Glue Schema Registry along with AWS Stream analytics services.

You can use Amazon Kinesis Data Firehose data transformation to ingest data from Kinesis Data Streams, run a simple data transformation on a batch of records via a Lambda function, and deliver the transformed records to destinations such as Amazon Simple Storage Service (Amazon S3), Amazon Redshift, Amazon OpenSearch Service, Splunk, Datadog, NewRelic, Dynatrace, Sumologic, LogicMonitor, MongoDB, and an HTTP endpoint. The Lambda function transforms the current batch of records with no information or state from previous batches.

Lambda function also has the stream analytics capability for Amazon Kinesis Data Analytics and Amazon DynamoDB. This feature enables data aggregation and state management across multiple function invocations. This capability uses a tumbling window, which is a fixed-size, non-overlapping time interval of up to 15 minutes. When you apply a tumbling window to a stream, records in the stream are grouped by window and sent to the processing Lambda function. The function returns a state value that is passed to the next tumbling window.

Kinesis Data Analytics provides SQL-based stream analytics against streaming data. This service also enables you to use an Apache Flink application to process stream data. Data can be ingested from Kinesis Data Streams and Kinesis Data Firehose while supporting Kinesis Data Firehose (Amazon S3, Amazon Redshift, Amazon OpenSearch Service, and Splunk), Lambda, and Kinesis Data Streams as destinations.

Finally, you can use the AWS Glue streaming extract, transform, and load (ETL) capability as a serverless method to consume data from Kinesis and Apache Kafka or Amazon MSK. The job aggregates, transforms, and enriches the data using Spark streaming, then continuously loads the results into Amazon S3-based data lakes, data warehouses, DynamoDB, JDBC, and more.

Managing stream metadata and schema evolution is becoming more important for stream analytics use cases. To enable these on AWS, the Data Catalog and Schema Registry allow you to centrally control and discover schemas. Before the release of schema referencing in the Data Catalog, you relied on managing schema evolution separately in the Data Catalog and Schema Registry, which usually leads to inconsistencies between these two. With the new release of the Data Catalog and Schema Registry integration, you can now reference schemas stored in the schema registry when creating or updating AWS Glue tables in the Data Catalog. This helps avoid inconsistency between the schema registry and Data Catalog, which results in end-to-end data quality enforcement.

In this post, we walk you through a streaming ETL example in AWS Glue to better showcase how this integration can help. This example includes reading streaming data from Kinesis Data Streams, schema discovery with Schema Registry, using the Data Catalog to store the metadata, and writing out the results to an Amazon S3 as a sink.

Solution overview

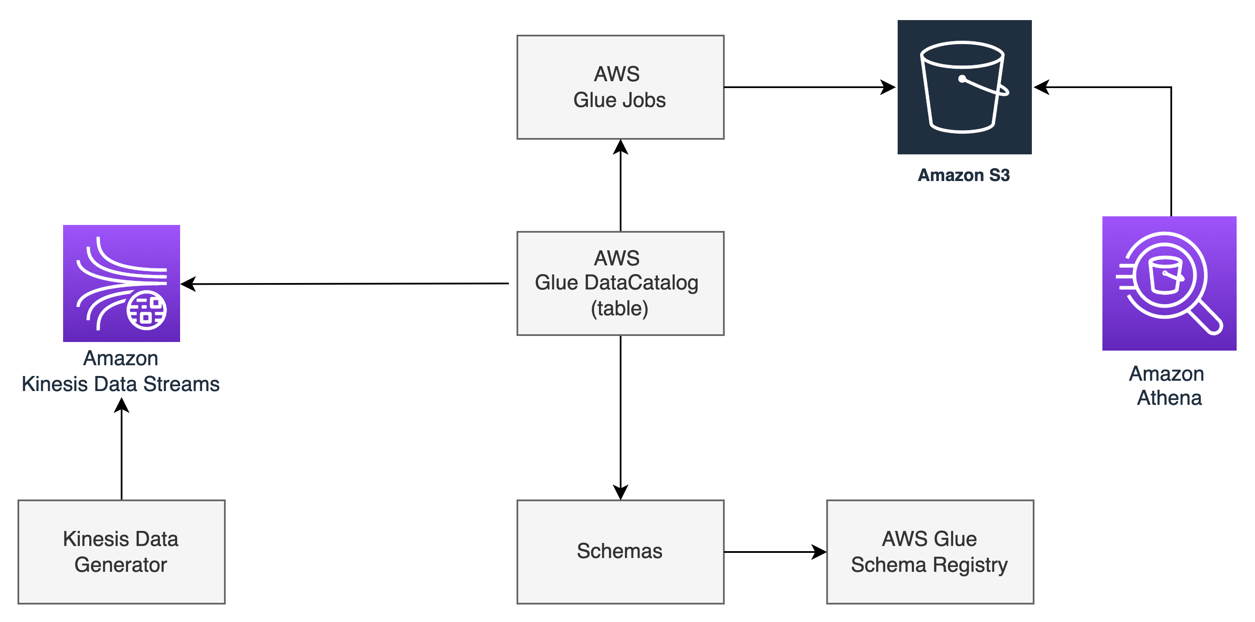
The following high-level architecture diagram shows the components to integrate Schema Registry and the Data Catalog to run streaming ETL jobs. In this architecture, Schema Registry helps centrally track and evolve Kinesis Data Streams schemas.

At a high level, we use the Amazon Kinesis Data Generator (KDG) to stream data to a Kinesis data stream, use AWS Glue to run streaming ETL, and use Amazon Athena to query the data.

In the following sections, we walk you through the steps to build this architecture.

Create a Kinesis data stream

To set up a Kinesis data stream, complete the following steps:

  1. On the Kinesis console, choose Data streams.
  2. Choose Create data stream.
  3. Give the stream a name, such as ventilator_gsr_stream.
  4. Complete stream creation.

Configure Kinesis Data Generator to generate sample data

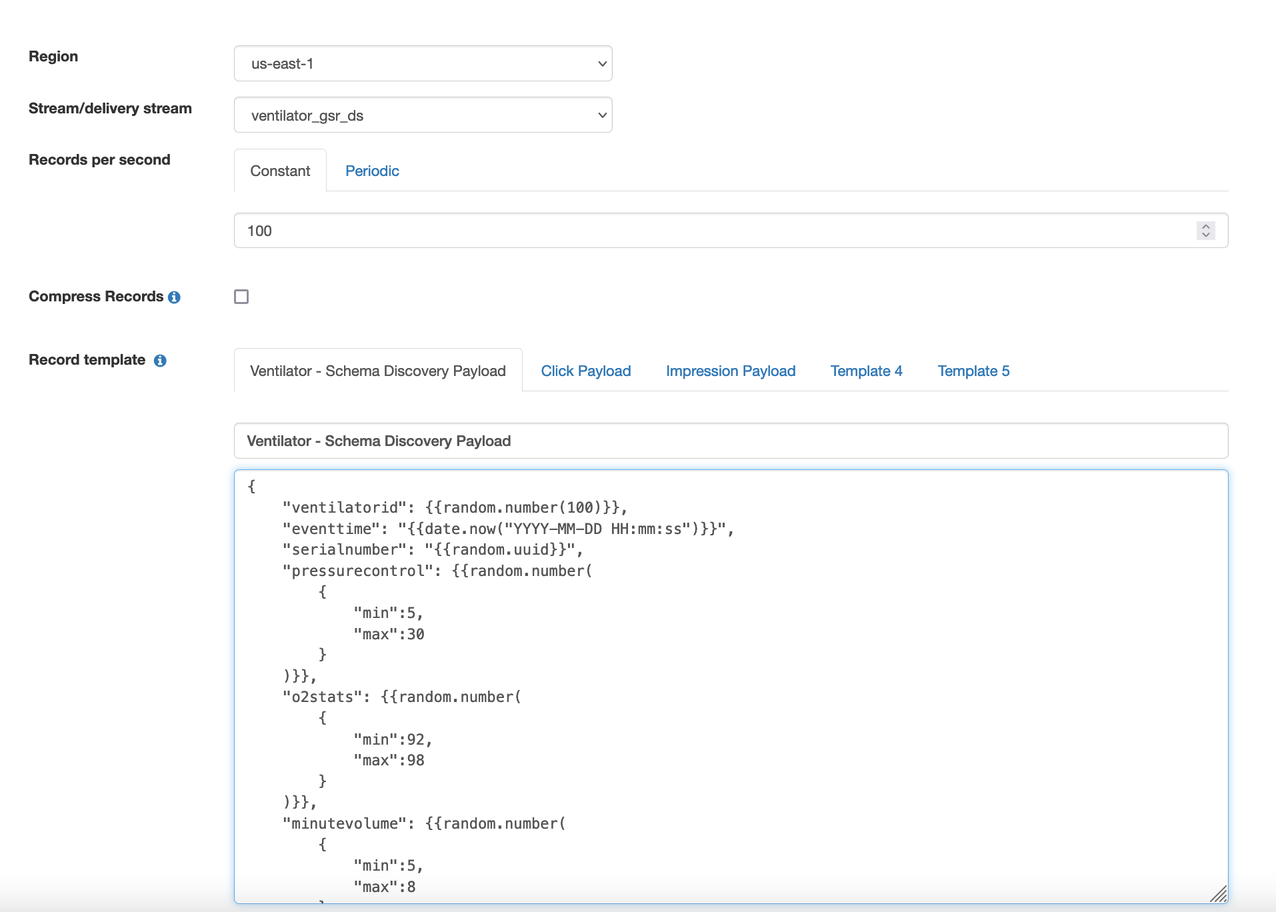
You can use the KDG with the ventilator template available on the GitHub repo to generate sample data. The following diagram shows the template on the KDG console.

Add a new AWS Glue schema registry

To add a new schema registry, complete the following steps:

  1. On the AWS Glue console, under Data catalog in the navigation pane, choose Schema registries.
  2. Choose Add registry.
  3. For Registry name, enter a name (for example, MyDemoSchemaReg).
  4. For Description, enter an optional description for the registry.
  5. Choose Add registry.

Add a schema to the schema registry

To add a new schema, complete the following steps:

  1. On the AWS Glue console, under Schema registries in the navigation pane, choose Schemas.
  2. Choose Add schema.
  3. Provide the schema name (ventilatorstream_schema_gsr) and attach the schema to the schema registry defined in the previous step.
  4. AWS Glue schemas currently support Avro or JSON formats; for this post, select JSON.
  5. Use the default Compatibility mode and provide the necessary tags as per your tagging strategy.

Compatibility modes allow you to control how schemas can or cannot evolve over time. These modes form the contract between applications producing and consuming data. When a new version of a schema is submitted to the registry, the compatibility rule applied to the schema name is used to determine if the new version can be accepted. For more information on different compatibility modes, refer to Schema Versioning and Compatibility.

  1. Enter the following sample JSON:
    {
      "$id": "https://example.com/person.schema.json",
      "$schema": "http://json-schema.org/draft-07/schema#",
      "title": "Ventilator",
      "type": "object",
      "properties": {
        "ventilatorid": {
          "type": "integer",
          "description": "Ventilator ID"
        },
        "eventtime": {
          "type": "string",
          "description": "Time of the event."
        },
        "serialnumber": {
          "description": "Serial number of the device.",
          "type": "string",
          "minimum": 0
        },
        "pressurecontrol": {
          "description": "Pressure control of the device.",
          "type": "integer",
          "minimum": 0
        },
        "o2stats": {
          "description": "O2 status.",
          "type": "integer",
          "minimum": 0
        },
        "minutevolume": {
          "description": "Volume.",
          "type": "integer",
          "minimum": 0
        },
        "manufacturer": {
          "description": "Volume.",
          "type": "string",
          "minimum": 0
        }
      }
    }

  2. Choose Create schema and version.

Create a new Data Catalog table

To add a new table in the Data Catalog, complete the following steps:

  1. On the AWS Glue Console, under Data Catalog in the navigation pane, choose Tables.
  2. Choose Add table.
  3. Select Add tables from existing schema.
  4. Enter the table name and choose the database.
  5. Select the source type as Kinesis and choose a data stream in your own account.
  6. Choose the respective Region and choose the stream ventilator_gsr_stream.
  7. Choose the MyDemoSchemaReg registry created earlier and the schema (ventilatorstream_schema_gsr) with its respective version.

You should be able to preview the schema.

  1. Choose Next and then choose Finish to create your table.

Create the AWS Glue job

To create your AWS Glue job, complete the following steps:

  1. On the AWS Glue Studio console, choose Jobs in the navigation pane.
  2. Select Visual with a source and target.
  3. Under Source, select Amazon Kinesis and under Target, select Amazon S3.
  4. Choose Create.
  5. Choose Data source.
  6. Configure the job properties such as name, AWS Identity and Access Management (IAM) role, type, and AWS version.

For the IAM role, specify a role that is used for authorization to resources used to run the job and access data stores. Because streaming jobs require connecting to sources and sinks, you need to make sure that the IAM role has permissions to read from Kinesis Data Streams and write to Amazon S3.

  1. For This job runs, select A new script authored by you.
  2. Under Advanced properties, keep Job bookmark disabled.
  3. For Log Filtering, select Standard filter and Spark UI.
  4. Under Monitoring options, enable Job metrics and Continuous logging with Standard filter.
  5. Enable the Spark UI and provide the S3 bucket path to store the Spark event logs.
  6. For Job parameters, enter the following key-values:
    • –output_path – The S3 path where the final aggregations are persisted
    • –aws_region – The Region where you run the job
  7. Leave Connections empty and choose Save job and edit script.
  8. Use the following code for the AWS Glue job (update the values for database, table_name, and checkpointLocation):
import sys
import datetime
import boto3
import base64
from pyspark.sql import DataFrame, Row
from pyspark.context import SparkContext
from pyspark.sql.types import *
from pyspark.sql.functions import *
from awsglue.transforms import *
from awsglue.utils import getResolvedOptions
from awsglue.context import GlueContext
from awsglue.job import Job
from awsglue import DynamicFrame

args = getResolvedOptions(sys.argv, \
['JOB_NAME', \
'aws_region', \
'output_path'])

sc = SparkContext()
glueContext = GlueContext(sc)
spark = glueContext.spark_session
job = Job(glueContext)
job.init(args['JOB_NAME'], args)

# S3 sink locations
aws_region = args['aws_region']
output_path = args['output_path']

s3_target = output_path + "ventilator_metrics"
checkpoint_location = output_path + "cp/"
temp_path = output_path + "temp/"


def processBatch(data_frame, batchId):
now = datetime.datetime.now()
year = now.year
month = now.month
day = now.day
hour = now.hour
minute = now.minute
if (data_frame.count() > 0):
dynamic_frame = DynamicFrame.fromDF(data_frame, glueContext, "from_data_frame")
apply_mapping = ApplyMapping.apply(frame = dynamic_frame, mappings = [ \
("ventilatorid", "long", "ventilatorid", "long"), \
("eventtime", "string", "eventtime", "timestamp"), \
("serialnumber", "string", "serialnumber", "string"), \
("pressurecontrol", "long", "pressurecontrol", "long"), \
("o2stats", "long", "o2stats", "long"), \
("minutevolume", "long", "minutevolume", "long"), \
("manufacturer", "string", "manufacturer", "string")],\
transformation_ctx = "apply_mapping")

dynamic_frame.printSchema()

# Write to S3 Sink
s3path = s3_target + "/ingest_year=" + "{:0>4}".format(str(year)) + "/ingest_month=" + "{:0>2}".format(str(month)) + "/ingest_day=" + "{:0>2}".format(str(day)) + "/ingest_hour=" + "{:0>2}".format(str(hour)) + "/"
s3sink = glueContext.write_dynamic_frame.from_options(frame = apply_mapping, connection_type = "s3", connection_options = {"path": s3path}, format = "parquet", transformation_ctx = "s3sink")

# Read from Kinesis Data Stream
sourceData = glueContext.create_data_frame.from_catalog( \
database = "kinesislab", \
table_name = "ventilator_gsr_new", \
transformation_ctx = "datasource0", \
additional_options = {"startingPosition": "TRIM_HORIZON", "inferSchema": "true"})

sourceData.printSchema()

glueContext.forEachBatch(frame = sourceData, batch_function = processBatch, options = {"windowSize": "100 seconds", "checkpointLocation": "s3://<bucket name>/ventilator_gsr/checkpoint/"})
job.commit()

Our AWS Glue job is ready to read the data from the Kinesis data stream and send it to Amazon S3 in Parquet format.

Query the data using Athena

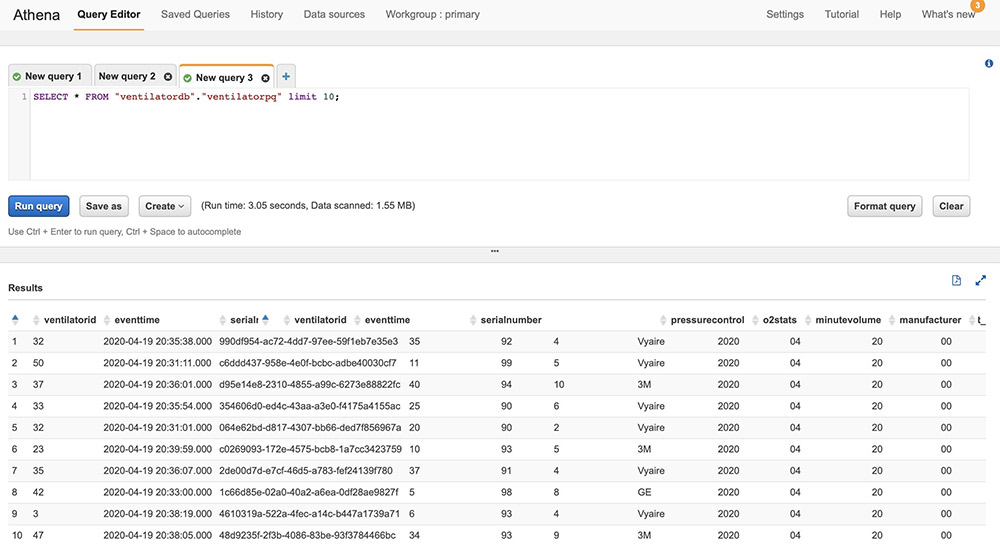
The processed streaming data is written in Parquet format to Amazon S3. Run an AWS Glue crawler on the Amazon S3 location where the streaming data is written; the crawler updates the Data Catalog. You can then run queries using Athena to start driving relevant insights from the data.

Clean up

It’s always a good practice to clean up all the resources created as part of this post to avoid any undue cost. To clean up your resources, delete the AWS Glue database, tables, crawlers, jobs, service role, and S3 buckets.

Additionally, be sure to clean up all other AWS resources that you created using AWS CloudFormation. You can delete these resources on the AWS CloudFormation console by deleting the stack used for the Kinesis Data Generator.

Conclusion

This post demonstrated the importance of centrally managing metadata and schema evolution in stream analytics use cases. It also described how the integration of the Data Catalog and Schema Registry can help you achieve this on AWS. We used a streaming ETL example in AWS Glue to better showcase how this integration can help to enforce end-to-end data quality.

To learn more and get started, you can check out AWS Glue Data Catalog and AWS Glue Schema Registry.


About the Authors

Dr. Sam Mokhtari is a Senior Solutions Architect at AWS. His main area of depth is data and analytics, and he has published more than 30 influential articles in this field. He is also a respected data and analytics advisor, and has led several large-scale implementation projects across different industries, including energy, health, telecom, and transport.

Amar Surjit is a Sr. Solutions Architect based in the UK who has been working in IT for over 20 years designing and implementing global solutions for enterprise customers. He is passionate about streaming technologies and enjoys working with customers globally to design and build streaming architectures and drive value by analyzing their streaming data.

Supercharging Dream11’s Data Highway with Amazon Redshift RA3 clusters

Post Syndicated from Dhanraj Gaikwad original https://aws.amazon.com/blogs/big-data/supercharging-dream11s-data-highway-with-amazon-redshift-ra3-clusters/

This is a guest post by Dhanraj Gaikwad, Principal Engineer on Dream11 Data Engineering team.

Dream11 is the world’s largest fantasy sports platform, with over 120 million users playing fantasy cricket, football, kabaddi, basketball, hockey, volleyball, handball, rugby, futsal, American football, and baseball. Dream11 is the flagship brand of Dream Sports, India’s leading Sports Technology company, and has partnerships with several national and international sports bodies and cricketers.

In this post, we look at how we supercharged our data highway, the backbone of our major analytics pipeline, by migrating our Amazon Redshift clusters to RA3 nodes. We also look at why we were excited about this migration, the challenges we faced during the migration and how we overcame them, as well as the benefits accrued from the migration.

Background

The Dream11 Data Engineering team runs the analytics pipelines (what we call our Data Highway) across Dream Sports. In near-real time, we analyze various aspects that directly impact the end-user experience, which can have a profound business impact for Dream11.

Initially, we were analyzing upwards of terabytes of data per day with Amazon Redshift clusters that ran mainly on dc2.8xlarge nodes. However, due to a rapid increase in our user participation over the last few years, we observed that our data volumes increased multi-fold. Because we were using dc2.8xlarge clusters, this meant adding more nodes of dc2.8xlarge instance types to the Amazon Redshift clusters. Not only was this increasing our costs, it also meant that we were adding additional compute power when what we really needed was more storage. Because we anticipated significant growth during the Indian Premier League (IPL) 2021, we actively explored various options using our AWS Enterprise Support team. Additionally, we were expecting more data volume over the next few years.

The solution

After discussions with AWS experts and the Amazon Redshift product team, we at Dream11 were recommended the most viable option of migrating our Amazon Redshift clusters from dc2.8xlarge to the newer RA3 nodes. The most obvious reason for this was the decoupled storage from compute. As a result, we could use lesser nodes and move our storage to Amazon Redshift managed storage. This allowed us to respond to data volume growth in the coming years as well as reduce our costs.

To start off, we conducted a few elementary tests using an Amazon Redshift RA3 test cluster. After we were convinced that this wouldn’t require many changes in our Amazon Redshift queries, we decided to carry out a complete head-to-head performance test between the two clusters.

Validating the solution

Because the user traffic on the Dream11 app tends to spike during big ticket tournaments like the IPL, we wanted to ensure that the RA3 clusters could handle the same traffic that we usually experience during our peak. The AWS Enterprise Support team suggested using the Simple Replay tool, an open-sourced tool released by AWS that you can use to record and replay the queries from one Amazon Redshift cluster to another. This tool allows you to capture queries on a source Amazon Redshift cluster, and then replay the same queries on a destination Amazon Redshift cluster (or clusters). We decided to use this tool to capture our performance test queries on the existing dc2.8xlarge clusters and replay them on a test Amazon Redshift cluster composed of RA3 nodes. During this time of our experimentation, the newer version of the automated AWS CloudFormation-based toolset (now on GitHub), was not available.

Challenges faced

The first challenge came up when using the Simple Replay tool because there was no easy way to compare the performance of like-to-like queries on the two types of clusters. Although Amazon Redshift provides various statistics using meta-tables about individual queries and their performance, the Simple Replay tool adds additional comments in each Amazon Redshift query on the target cluster to make it easier to know if these queries were run by the Simple Replay tool. In addition, the Simple Replay tool drops comments from the queries on the source cluster.

Comparing each query performance with the Amazon Redshift performance test suite would mean writing additional scripts for easy performance comparison. An alternative would have been to modify the Simple Replay tool code, because it’s open source on GitHub. However, with the IPL 2022 beginning in just a few days, we had to explore another option urgently.

After further discussions with the AWS Enterprise Support team, we decided to use two test clusters: one with the old dc2.8xlarge nodes, and another with the newer RA3 nodes. The idea was to use the Simple Replay tool to run the captured queries from our original cluster on both test clusters. This meant that the queries would be identical on both test clusters, making it easier to compare. Although this meant running an additional test cluster for a few days, we went ahead with this option. As a side note, the newer automated AWS CloudFormation-based toolset does exactly the same in an automated way.

After we were convinced that most of our Amazon Redshift queries performed satisfactorily, we noticed that certain queries were performing slower on the RA3-based cluster than the dc2.8xlarge cluster. We narrowed down the problem to SQL queries with full table scans. We rectified it by following proper data modelling practices in the ETL workflow. Then we were ready to migrate to the newer RA3 nodes.

The migration to RA3

The migration from the old cluster to the new cluster was smoother than we thought. We used the elastic resize approach, which meant we only had a few minutes of Amazon Redshift downtime. We completed the migration successfully with a sufficient buffer timeline for more tests. Additional tests indicated that the new cluster performed how we wanted it to.

The trial by fire

The new cluster performed satisfactorily during our peak performance loads in the IPL as well as the following ICC T20 Cricket World Cup. We’re excited that the new RA3 node-based Amazon Redshift cluster can support our data volume growth needs without needing to increase the number of instance nodes.

We migrated from dc2 to RA3 in April 2021. The data volume has grown by 50% since then. If we had continued with dc2 instances, the cluster cost would have increased by 50%. However, because of the migration to RA3 instances, even with an increase in data volume by 50% since April 2021, the cluster cost has increased by 0.7%, which is attributed to an increase in storage cost.

Conclusion

Migrating to the newer RA3-based Amazon Redshift cluster helped us decouple our computing needs from our storage needs, and now we’re prepared for our expected data volume growth for the next few years. Moreover, we don’t need to add compute nodes if we only need storage, which is expected to bring down our costs in the long run. We did need to fine-tune some of our queries on the newer cluster. With the Simple Replay tool, we could do a direct comparison between the older and the newer cluster. You can also use the newer automated AWS CloudFormation-based toolset if you want to follow a similar approach.

We highly recommend RA3 instances. They give you the flexibility to size your RA3 cluster based on the
amount of data stored without increasing your compute costs.


About the Authors

Dhanraj Gaikwad is a Principal Data Engineer at Dream11. Dhanraj has more than 15 years of experience in the field of data and analytics. In his current role, Dhanraj is responsible for building the data platform for Dream Sports and is specialized in data warehousing, including data modeling, building data pipelines, and query optimizations. He is passionate about solving large-scale data problems and taking unique approaches to deal with them.

Sanket Raut is a Principal Technical Account Manager at AWS based in Vasai ,India. Sanket has more than 16 years of industry experience, including roles in cloud architecture, systems engineering, and software design. He currently focuses on enabling large startups to streamline their cloud operations and optimize their cloud spend. His area of interest is in serverless technologies.

[$] Challenges with fstests and blktests

Post Syndicated from original https://lwn.net/Articles/896670/

The challenges of testing filesystems and the block layer were the topic of a
combined storage and filesystem session led by Luis Chamberlain at the
2022 Linux Storage,
Filesystem, Memory-management and BPF Summit
(LSFMM). His goal is to
reduce the amount of time it takes to test new features in those areas, but
one of the problems that he has encountered is a lack of determinism in the
test results. It is sometimes hard to distinguish problems in the kernel
code from problems in the tests themselves.

Security updates for Wednesday

Post Syndicated from original https://lwn.net/Articles/896803/

Security updates have been issued by Debian (libjpeg-turbo, webkit2gtk, and wpewebkit), Fedora (golang-github-opencontainers-runc, mingw-pcre2, python-jwt, python-ujson, and weechat), Oracle (nodejs:16 and rsyslog), Red Hat (container-tools:3.0, expat, fapolicyd, kernel, kernel-rt, kpatch-patch, mariadb:10.3, postgresql:12, rsyslog and rsyslog7, and zlib), Slackware (mozilla), SUSE (bind, dpdk, fribidi, hdf5, librelp, php74, postgresql12, and postgresql13), and Ubuntu (cups, linux-gcp-5.13, linux-oracle, linux-oracle-5.13, linux-gcp-5.4, linux-gkeop, linux-gkeop-5.4, linux-ibm-5.4, linux-oracle, linux-oracle-5.4, linux-raspi, linux-raspi-5.4, and webkit2gtk).

Automating detection of security vulnerabilities and bugs in CI/CD pipelines using Amazon CodeGuru Reviewer CLI

Post Syndicated from Akash Verma original https://aws.amazon.com/blogs/devops/automating-detection-of-security-vulnerabilities-and-bugs-in-ci-cd-pipelines-using-amazon-codeguru-reviewer-cli/

Watts S. Humphrey, the father of Software Quality, had famously quipped, “Every business is a software business”. Software is indeed integral to any industry. The engineers who create software are also responsible for making sure that the underlying code adheres to industry and organizational standards, are performant, and are absolved of any security vulnerabilities that could make them susceptible to attack.

Traditionally, security testing has been the forte of a specialized security testing team, who would conduct their tests toward the end of the Software Development lifecycle (SDLC). The adoption of DevSecOps practices meant that security became a shared responsibility between the development and security teams. Now, development teams can, on their own or as advised by their security team, setup and configure various code scanning tools to detect security vulnerabilities much earlier in the software delivery process (aka “Shift Left”). Meanwhile, the practice of Static code analysis and security application testing (SAST) has become a standard part of the SDLC. Furthermore, it’s imperative that the development teams expect SAST tools that are easy to set-up, seamlessly fit into their DevOps infrastructure, and can be configured without requiring assistance from security or DevOps experts.

In this post, we’ll demonstrate how you can leverage Amazon CodeGuru Reviewer Command Line Interface (CLI) to integrate CodeGuru Reviewer into your Jenkins Continuous Integration & Continuous Delivery (CI/CD) pipeline. Note that the solution isn’t limited to Jenkins, and it would be equally useful with any other build automation tool. Moreover, it can be integrated at any stage of your SDLC as part of the White-box testing. For example, you can integrate the CodeGuru Reviewer CLI as part of your software development process, as well as run it on your dev machine before committing the code.

Launched in 2020, CodeGuru Reviewer utilizes machine learning (ML) and automated reasoning to identify security vulnerabilities, inefficient uses of AWS APIs and SDKs, as well as other common coding errors. CodeGuru Reviewer employs a growing set of detectors for Java and Python to provide recommendations via the AWS Console. Customers that leverage the CodeGuru Reviewer CLI within a CI/CD pipeline also receive recommendations in a machine-readable JSON format, as well as HTML.

CodeGuru Reviewer offers native integration with Source Code Management (SCM) systems, such as GitHub, BitBucket, and AWS CodeCommit. However, it can be used with any SCM via its CLI. The CodeGuru Reviewer CLI is a shim layer on top of the AWS Command Line Interface (AWS CLI) that simplifies the interaction with the tool by handling the uploading of artifacts, triggering of the analysis, and fetching of the results, all in a single command.

Many customers, including Mastercard, are benefiting from this new CodeGuru Reviewer CLI.

“During one of our technical retrospectives, we noticed the need to integrate Amazon CodeGuru recommendations in our build pipelines hosted on Jenkins. Not all our developers can run or check CodeGuru recommendations through the AWS console. Incorporating CodeGuru CLI in our build pipelines acts as an important quality gate and ensures that our developers can immediately fix critical issues.”
                                           Claudio Frattari, Lead DevOps at Mastercard

Solution overview

The application deployment workflow starts by placing the application code on a GitHub SCM. To automate the scenario, we have added GitHub to the Jenkins project under the “Source Code” section. We chose the GitHub option, which would clone the chosen GitHub repository in the Jenkins local workspace directory.

In the build stage of the pipeline (see Figure 1), we configure the appropriate build tool to perform the code build and security analysis. In this example, we will be using Maven as the build tool.

Figure 1: Jenkins pipeline with Amazon CodeGuru Reviewer

Figure 1: Jenkins pipeline with Amazon CodeGuru Reviewer

In the post-build stage, we configure the CodeGuru Reviewer CLI to generate the recommendations based on the review.

Lastly, in the concluding stage of the pipeline, we’ll be analyzing the JSON results using jq – a lightweight and flexible command-line JSON processor, and then failing the Jenkins job if we encounter observations that are of a “Critical” severity.

Jenkins will trigger the “CodeGuru Reviewer” (see Figure 1) based review process in the post-build stage, i.e., after the build finishes. Furthermore, you can configure other stages, such as automated testing or deployment, after this stage. Additionally, passing the location of the build artifacts to the CLI lets CodeGuru Reviewer perform a more in-depth security analysis. Build artifacts are either directories containing jar files (e.g., build/lib for Gradle or /target for Maven) or directories containing class hierarchies (e.g., build/classes/java/main for Gradle).

Walkthrough

Now that we have an overview of the workflow, let’s dive deep and walk you through the following steps in detail:

  1. Installing the CodeGuru Reviewer CLI
  2. Creating a Jenkins pipeline job
  3. Reviewing the CodeGuru Reviewer recommendations
  4. Configuring CodeGuru Reviewer CLI’s additional options

1. Installing the CodeGuru CLI Wrapper

a. Prerequisites

To run the CLI, we must have Git, Java, Maven, and the AWS CLI installed. Verify that they’re installed on our machine by running the following commands:

java -version 
mvn --version 
aws --version 
git –-version

If they aren’t installed, then download and install Java here (Amazon Corretto is a no-cost, multiplatform, production-ready distribution of the Open Java Development Kit), Maven from here, and Git from here. Instructions for installing AWS CLI are available here.

We would need to create an Amazon Simple Storage Service (Amazon S3) bucket with the prefix codeguru-reviewer-. Note that the bucket name must begin with the mentioned prefix, since we have used the name pattern in the following AWS Identity and Access Management (IAM) permissions, and CodeGuru Reviewer expects buckets to begin with this prefix. Refer to the following section 4(a) “Specifying S3 bucket name” for more details.

Furthermore, we’ll need working credentials on our machine to interact with our AWS account. Learn more about setting up credentials for AWS here. You can find the minimal permissions to run the CodeGuru Reviewer CLI as follows.

b. Required Permissions

To use the CodeGuru Reviewer CLI, we need at least the following AWS IAM permissions, attached to an AWS IAM User or an AWS IAM role:

{
    "Version": "2012-10-17",
    "Statement": [
        {
            "Action": [
                "codeguru-reviewer:ListRepositoryAssociations",
                "codeguru-reviewer:AssociateRepository",
                "codeguru-reviewer:DescribeRepositoryAssociation",
                "codeguru-reviewer:CreateCodeReview",
                "codeguru-reviewer:DescribeCodeReview",
                "codeguru-reviewer:ListRecommendations",
                "iam:CreateServiceLinkedRole"
            ],
            "Resource": "*",
            "Effect": "Allow"
        },
        {
            "Action": [
                "s3:CreateBucket",
                "s3:GetBucket*",
                "s3:List*",
                "s3:GetObject",
                "s3:PutObject",
                "s3:DeleteObject"
            ],
            "Resource": [
                "arn:aws:s3:::codeguru-reviewer-*",
                "arn:aws:s3:::codeguru-reviewer-*/*"
            ],
            "Effect": "Allow"
        }
    ]
}

c.  CLI installation

Please download the latest version of the CodeGuru Reviewer CLI available at GitHub. Then, run the following commands in sequence:

curl -OL https://github.com/aws/aws-codeguru-cli/releases/download/0.0.1/aws-codeguru-cli.zip
unzip aws-codeguru-cli.zip
export PATH=$PATH:./aws-codeguru-cli/bin

d. Using the CLI

The CodeGuru Reviewer CLI only has one required parameter –root-dir (or just -r) to specify to the local directory that should be analyzed. Furthermore, the –src option can be used to specify one or more files in this directory that contain the source code that should be analyzed. In turn, for Java applications, the –build option can be used to specify one or more build directories.

For a demonstration, we’ll analyze the demo application. This will make sure that we’re all set for when we leverage the CLI in Jenkins. To proceed, first we download and install the sample application, as follows:

git clone https://github.com/aws-samples/amazon-codeguru-reviewer-sample-app
cd amazon-codeguru-reviewer-sample-app
mvn clean compile

Now that we have built our demo application, we can use the aws-codeguru-cli CLI command that we added to the path to trigger the code scan:

aws-codeguru-cli --root-dir ./ --build target/classes --src src --output ./output

For additional assistance on the CLI command, reference the readme here.

2.  Creating a Jenkins Pipeline job

CodeGuru Reviewer can be integrated in a Jenkins Pipeline as well as a Freestyle project. In this example, we’re leveraging a Pipeline.

a. Pipeline Job Configuration

  1.  Log in to Jenkins, choose “New Item”, then select “Pipeline” option.
  2. Enter a name for the project (for example, “CodeGuruPipeline”), and choose OK.
Figure 2: Creating a new Jenkins pipeline

Figure 2: Creating a new Jenkins pipeline

  1. On the “Project configuration” page, scroll down to the bottom and find your pipeline. In the pipeline script, paste the following script (or use your own Jenkinsfile). The following example is a valid Jenkinsfile to integrate CodeGuru Reviewer with a project built using Maven.
pipeline {
    agent any
    stages {
        stage('Build') {
            steps {
                // Get code from a GitHub repository
                git clone https://github.com/aws-samples/amazon-codeguru-reviewer-java-detectors.git

                // Run Maven on a Unix agent
                sh "mvn clean compile"

                // To run Maven on a Windows agent, use following
                // bat "mvn -Dmaven.test.failure.ignore=true clean package"
            }
        }
        stage('CodeGuru Reviewer') {
            steps{
                sh 'ls -lsa *'
                sh 'pwd'
                // Here we’re setting an absolute path, but we can 
                // also use JENKINS environment variables
                sh '''
                    export BASE=/var/jenkins_home/workspace/CodeGuruPipeline/amazon-codeguru-reviewer-java-detectors
                    export SRC=${BASE}/src
                    export OUTPUT = ./output
                    /home/codeguru/aws-codeguru-cli/bin/aws-codeguru-cli --root-dir $BASE --build $BASE/target/classes --src $SRC --output $OUTPUT -c $GIT_PREVIOUS_COMMIT:$GIT_COMMIT --no-prompt
                    '''
            }
        }    
        stage('Checking findings'){
            steps{
                // In this example we are stopping our pipline on  
                // detecting Critical findings. We are using jq 
                // to count occurrences of Critical severity 
                sh '''
                CNT = $(cat ./output/recommendations.json |jq '.[] | select(.severity=="Critical")|.severity' | wc -l)'
                if (( $CNT > 0 )); then
                  echo "Critical findings discovered. Failing."
                  exit 1
                fi
                '''
            }
        }
    }
}
  1. Save the configuration and select “Build now” on the side bar to trigger the build process (see Figure 3).
Figure 3: Jenkins pipeline in triggered state

Figure 3: Jenkins pipeline in triggered state

3. Reviewing the CodeGuru Reviewer recommendations

Once the build process is finished, you can view the review results from CodeGuru Reviewer by selecting the Jenkins build history for the most recent build job. Then, browse to Workspace output. The output is available in JSON and HTML formats (Figure 4).

Figure 4: CodeGuru CLI Output

Figure 4: CodeGuru CLI Output

Snippets from the HTML and JSON reports are displayed in Figure 5 and 6 respectively.

In this example, our pipeline analyzes the JSON results with jq based on severity equal to critical and failing the job if there are any critical findings. Note that this output path is set with the –output option. For instance, the pipeline will fail on noticing the “critical” finding at Line 67 of the EventHandler.java class (Figure 5), flagged due to use of an insecure code. Till the time the code is remediated, the pipeline would prevent the code deployment. The vulnerability could have gone to production undetected, in absence of the tool.

Figure 5: CodeGuru HTML Report

Figure 5: CodeGuru HTML Report

Figure 6: CodeGuru JSON recommendations

Figure 6: CodeGuru JSON recommendations

4.  Configuring CodeGuru Reviewer CLI’s additional options

a.  Specifying Amazon S3 bucket name and policy

CodeGuru Reviewer needs one Amazon S3 bucket for the CLI to store the artifacts while the analysis is running. The artifacts are deleted after the analysis is completed. The same bucket will be reused for all the repositories that are analyzed in the same account and region (unless specified otherwise by the user). Note that CodeGuru Reviewer expects the S3 bucket name to begin with codeguru-reviewer-. At this time, you can’t use a different naming pattern. However, if you want to use a different bucket name, then you can use the –bucket-name option.

Select the Permissions tab of your S3 bucket. Update the Block public access and add the following S3 bucket policy.

Figure 7: S3 bucket settings

Figure 7: S3 bucket settings

S3 bucket policy:

{
   "Version":"2012-10-17",
   "Statement":[
      {
         "Sid":"PublicRead",
         "Effect":"Allow",
         "Principal":"*",
         "Action":"s3:GetObject",
         "Resource":"[Change to ARN for your S3 bucket]/*"
      }
   ]
}

Note that if you must change the bucket’s name, then you can remove the associated S3 bucket in the AWS console under CodeGuru → CI workflows and select Disassociate Workflow.

b.  Analyzing a single commit

The CLI also lets us specify a specific commit range to analyze. This can lead to faster and more cost-effective scans for the incremental code changes, instead of a full repository scan. For example, if we just want to analyze the last commit, we can run:

aws-codeguru-cli -r ./ -s src/main/java -b build/libs -c HEAD^:HEAD --no-prompt

Here, we use the -c option to specify that we only want to analyze the commits between HEAD^ (the previous commit) and HEAD (the current commit). Moreover, we add the –no-prompt option to automatically answer questions by the CLI with yes. This option is useful if we plan to use the CLI in an automated way, such as in our CI/CD workflow.

c.  Encrypting artifacts

CodeGuru Reviewer lets us use a customer managed key to encrypt the content of the S3 bucket that is used to store the source and build artifacts. To achieve this, create a customer owned key in AWS Key Management Service (AWS KMS) (see Figure 8).

Figure 8: KMS settings

Figure 8: KMS settings

We must grant CodeGuru Reviewer the permission to decrypt artifacts with this key by adding the following Statement to your Key policy:

{
   "Sid":"Allow CodeGuru to use the key to decrypt artifact",
   "Effect":"Allow",
   "Principal":{
      "AWS":"*"
   },
   "Action":[
      "kms:Decrypt",
      "kms:DescribeKey"
   ],
   "Resource":"*",
   "Condition":{
      "StringEquals":{
         "kms:ViaService":"codeguru-reviewer.amazonaws.com",
         "kms:CallerAccount":[
            "YOUR AWS ACCOUNT ID"
         ]
      }
   }
}

Then, enable server-side encryption for the S3 bucket that we’re using with CodeGuru Reviewer (Figure 9).

S3 bucket settings:

Figure 9: S3 bucket encryption settings

Figure 9: S3 bucket encryption settings

After we enable encryption on the bucket, we must delete all the CodeGuru repository associations that use this bucket, and then recreate them by analyzing the repositories while providing the key (as in the following example, Figure 10):

Figure10: CodeGuru CI Workflow

Figure 10: CodeGuru CI Workflow

Note that the first time you check out your repository, it will always trigger a full repository scan. Consider setting the -c option, as this will allow a commit range.

Cleaning Up

At this stage, you may choose to delete the resources created while following this blog, to avoid incurring any unwanted costs.

  1. Delete Amazon S3 bucket.
  2. Delete AWS KMS key.
  3. Delete the Jenkins installation, if not required further.

Conclusion

In this post, we outlined how you can integrate Amazon CodeGuru Reviewer CLI with the Jenkins open-source build automation tool to perform code analysis as part of your code build pipeline and act as a quality gate. We showed you how to create a Jenkins pipeline job and integrate the CodeGuru Reviewer CLI to detect issues in your Java and Python code, as well as access the recommendations for remediating these issues. We presented an example where you can stop the build upon finding critical violations. Furthermore, we discussed how you can specify a commit range to avoid a full repo scan, and how the S3 bucket used by CodeGuru Reviewer to store artifacts can be encrypted using customer managed keys.

The CodeGuru Reviewer CLI offers you a one-line command to scan any code on your machine and retrieve recommendations. You can run the CLI anywhere where you can run AWS commands. In other words, you can use the CLI to integrate CodeGuru Reviewer into your favourite CI tool, as a pre-commit hook, or anywhere else in your workflow. In turn, you can combine CodeGuru Reviewer with Dynamic Application Security Testing (DAST) and Software Composition Analysis (SCA) tools to achieve a hybrid application security testing method that helps you combine the inside-out and outside-in testing approaches, cross-reference results, and detect vulnerabilities that both exist and are exploitable.

Hopefully, you have found this post informative, and the proposed solution useful. If you need helping hands, then AWS Professional Services can help implement this solution in your enterprise, as well as introduce you to our AWS DevOps services and offerings.

About the Authors

Akash Verma

Akash Verma

Akash is a Software Development Engineer 2 at Amazon India. He is passionate about writing clean code and building maintainable software. He also enjoys learning modern technologies. Outside of work, Akash loves to travel, interact with new people, and try different cuisines. He also relishes gardening and watching Stand-up comedy.

Debashish Chakrabarty

Debashish Chakrabarty

Debashish is a Sr. Engagement Manager at AWS Professional Services, India with over 21+ years of experience in various IT roles. At ProServe he leads engagements on Security, App Modernization and Migrations to help ProServe customers accelerate their cloud journey and achieve their business goals. Off work, Debashish has been a Hindi Blogger & Podcaster. He loves binge-watching OTT shows and spending time with family.
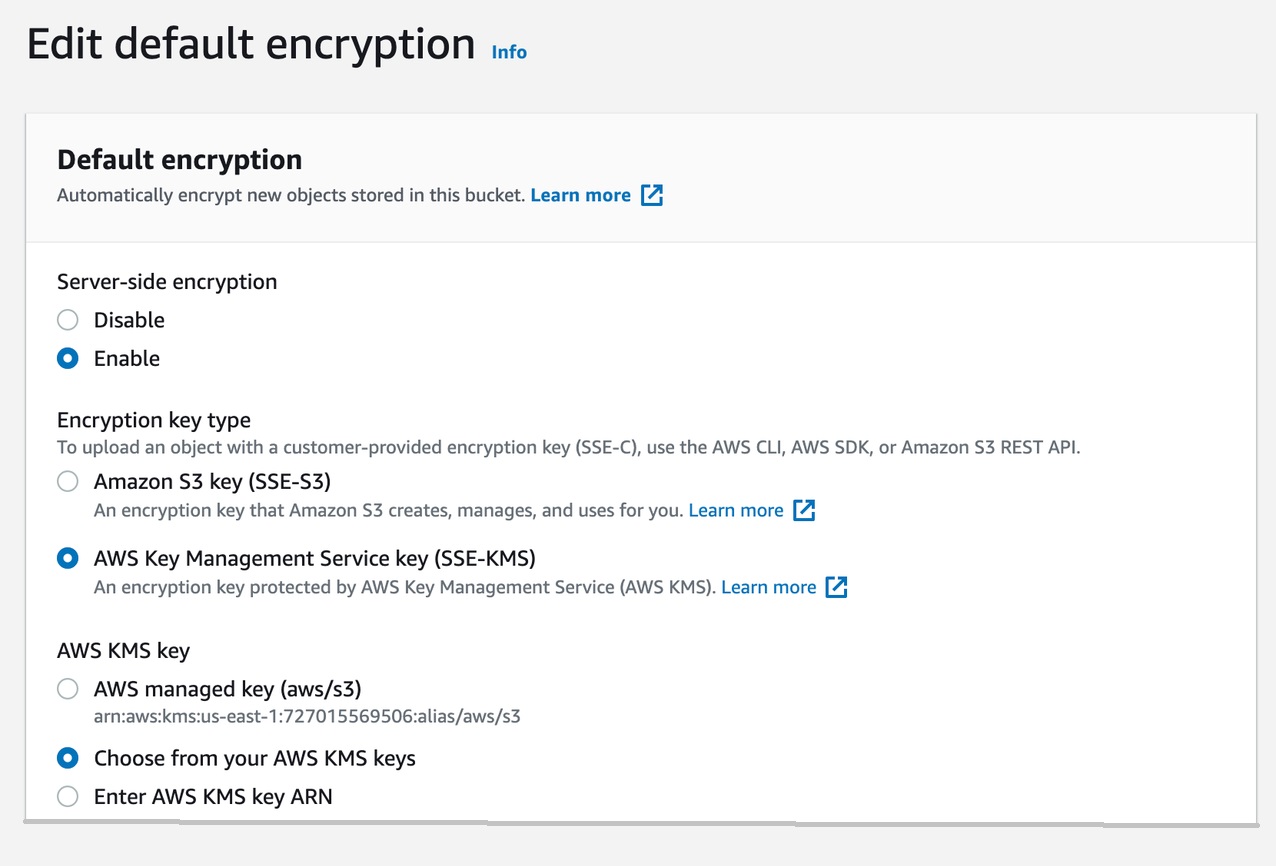
David Ernst

David Ernst

David is a Sr. Specialist Solution Architect – DevOps, with 20+ years of experience in designing and implementing software solutions for various industries. David is an automation enthusiast and works with AWS customers to design, deploy, and manage their AWS workloads/architectures.

Интервю за подкаста на International Press Institute (IPI) Войната срещу свободата на словото в България

Post Syndicated from Николай Марченко original https://bivol.bg/%D0%B2%D0%BE%D0%B9%D0%BD%D0%B0%D1%82%D0%B0-%D1%81%D1%80%D0%B5%D1%89%D1%83-%D1%81%D0%B2%D0%BE%D0%B1%D0%BE%D0%B4%D0%B0%D1%82%D0%B0-%D0%BD%D0%B0-%D1%81%D0%BB%D0%BE%D0%B2%D0%BE%D1%82%D0%BE-%D0%B2-%D0%B1.html

сряда 1 юни 2022


“В България се води война срещу свободата на словото”. Това констатира основателят на Сайта за разследваща журналистика “Биволъ” Асен Йорданов в интервю за подкаста ‘MFRR in Focus’ на Ане тер…

Join us at the launch event of the Raspberry Pi Computing Education Research Centre

Post Syndicated from Sue Sentance original https://www.raspberrypi.org/blog/raspberry-pi-computing-education-research-centre-launch-event-invitation/

Last summer, the Raspberry Pi Foundation and the University of Cambridge Department of Computer Science and Technology created a new research centre focusing on computing education research for young people in both formal and non-formal education. The Raspberry Pi Computing Education Research Centre is an exciting venture through which we aim to deliver a step-change for the field.

school-aged girls and a teacher using a computer together.

Computing education research that focuses specifically on young people is relatively new, particularly in contrast to established research disciplines such as those focused on mathematics or science education. However, computing is now a mandatory part of the curriculum in several countries, and being taken up in education globally, so we need to rigorously investigate the learning and teaching of this subject, and do so in conjunction with schools and teachers.

You’re invited to our in-person launch event

To celebrate the official launch of the Raspberry Pi Computing Education Research Centre, we will be holding an in-person event in Cambridge, UK on Weds 20 July from 15.00. This event is free and open to all: if you are interested in computing education research, we invite you to register for a ticket to attend. By coming together in person, we want to help strengthen a collaborative community of researchers, teachers, and other education practitioners.

The launch event is your opportunity to meet and mingle with members of the Centre’s research team and listen to a series of short talks. We are delighted that Prof. Mark Guzdial (University of Michigan), who many readers will be familiar with, will be travelling from the US to join us in cutting the ribbon. Mark has worked in computer science education for decades and won many awards for his research, so I can’t think of anybody better to be our guest speaker. Our other speakers are Prof. Alastair Beresford from the Department of Computer Science and Technology, and Carrie Anne Philbin MBE, our Director of Educator Support at the Foundation.

The event will take place at the Department of Computer Science and Technology in Cambridge. It will start at 15.00 with a reception where you’ll have the chance to talk to researchers and see the work we’ve been doing. We will then hear from our speakers, before wrapping up at 17.30. You can find more details about the event location on the ticket registration page.

Our research at the Centre

The aim of the Raspberry Pi Computing Education Research Centre is to increase our understanding of teaching and learning computing, computer science, and associated subjects, with a particular focus on young people who are from backgrounds that are traditionally under-represented in the field of computing or who experience educational disadvantage.

Young learners at computers in a classroom.

We have been establishing the Centre over the last nine months. In October, I was appointed Director, and in December, we were awarded funding by Google for a one-year research project on culturally relevant computing teaching, following on from a project at the Raspberry Pi Foundation. The Centre’s research team is uniquely positioned, straddling both the University and the Foundation. Our two organisations complement each other very well: the University is one of the highest-ranking universities in the world and renowned for its leading-edge academic research, and the Raspberry Pi Foundation works with schools, educators, and learners globally to pursue its mission to put the power of computing into the hands of young people.

In our research at the Centre, we will make sure that:

  1. We collaborate closely with teachers and schools when implementing and evaluating research projects
  2. We publish research results in a number of different formats, as promptly as we can and without a paywall
  3. We translate research findings into practice across the Foundation’s extensive programmes and with our partners

We are excited to work with a large community of teachers and researchers, and we look forward to meeting you at the launch event.

Stay up to date

At the end of June, we’ll be launching a new website for the Centre at computingeducationresearch.org. This will be the place for you to find out more about our projects and events, and to sign up to our newsletter. For announcements on social media, follow the Raspberry Pi Foundation on Twitter or Linkedin.

The post Join us at the launch event of the Raspberry Pi Computing Education Research Centre appeared first on Raspberry Pi.

The collective thoughts of the interwebz

By continuing to use the site, you agree to the use of cookies. more information

The cookie settings on this website are set to "allow cookies" to give you the best browsing experience possible. If you continue to use this website without changing your cookie settings or you click "Accept" below then you are consenting to this.

Close