Security updates have been issued by Debian (mutt, netatalk, and python2.7), Fedora (chromium, golang-github-prometheus-exporter-toolkit, golang-github-xhit-str2duration, and golang-gopkg-alecthomas-kingpin-2), Oracle (dmidecode, frr, libwebp, open-vm-tools, and thunderbird), Red Hat (libwebp and open-vm-tools), SUSE (cups, frr, mariadb, openvswitch3, python39, qemu, redis7, rubygem-rails-html-sanitizer, and skopeo), and Ubuntu (bind9, cups, and libppd).
The 5.10.196 stable kernel has been
released. It fixes a single regression:
This release is only needed by any 5.10.y user that uses configfs, it
resolves a regression in 5.10.195 in that subsystem. Note that many
kernel subsystems use configfs for configuration so to be safe, you
probably want to upgrade if you are not sure.
A variety of tools exist that can be used to troubleshoot different Zabbix components. In this article I will demonstrate how Wireshark can be used to rule out network connectivity issues as the root cause of data collection problems.
A user has a Zabbix agent that collects the used disk space information on a host. The item interval is one minute:
However, the user complains that Zabbix fails to collect the data appropriately, as the graph has empty areas with occasional dots:
In Zabbix implementations with very high NVPS (new values per second) this may indicate some kind of performance problem where not all data is collected or saved to the database properly. However, that does not seem likely in this particular setup as there are only a couple of hosts and items configured and the NVPS value is under 2.
One question to ask whenever data is missing from Zabbix is: Did the data even arrive to the Zabbix server? If all the data never arrived, it is quite natural that there won’t be full data in the graphs or in the database.
As a networking professional one of the tools I always have at hand is Wireshark, the world-famous protocol analyzer (that just had its 25th anniversary!). Starting from Wireshark version 4.1.0, which is the current development release for the upcoming 4.2.0 stable release, it has built-in support for Zabbix protocol. This means that if you have a network capture of Zabbix agent or proxy traffic, you can analyze the Zabbix traffic contents using Wireshark. Previously this was possible also using manually-installed Lua-based scripts, but I was able to write the same functionality in C language and it was quickly accepted in the official Wireshark codebase as well.
Starting from Zabbix version 4.0, all of the traffic between Zabbix server and Zabbix proxies as well as Zabbix agent 2 traffic is compressed to save bandwidth and improve performance. The Zabbix protocol dissector in Wireshark is able to automatically decompress any compressed Zabbix traffic so that application-level analysis is possible. TLS-encrypted Zabbix protocol traffic is also supported if the session keys are available. I’ll write another post about that later.
In this example case I will use Wireshark to confirm that the agent really collects the disk space usage data and sends it to the server.
Note: Zabbix components (server, proxies, agents) are well-known for their stable network communications. They don’t just pretend to send data, so if they really have problems communicating, they should log those events in their own log files. The components also just do whatever they are configured to do, so usually the roots of any item-collecting problems are found by just checking the Zabbix logs and configurations. In this post I still want to highlight one network-centric way to troubleshoot Zabbix-related issues.
I’ll start by capturing the agent traffic on the server, as the agent is communicating directly with the server, not via a Zabbix proxy. On the Zabbix server I will use sudo tcpdump -v port 10051 -w zabbix-traffic.pcap command to start the capture and see its progress.
I will then restart the Zabbix agent using sudo systemctl restart zabbix-agent2 command (on the agent host, this is a Linux host with Zabbix agent 2).
After capturing traffic for a few minutes I’ll stop the capture with Ctrl-C on the server:
markku@zabbix-server:~$ sudo tcpdump -v port 10051 -w zabbix-traffic.pcap
tcpdump: listening on ens192, link-type EN10MB (Ethernet), snapshot length 262144 bytes
^C958 packets captured
958 packets received by filter
0 packets dropped by kernel
markku@zabbix-server:~$
If you want to test the following steps yourself, you can download the capture file here:
After copying the capture file to my workstation I can open it in Wireshark:
This is still the default Wireshark profile, but I’ll right-click the Profile: Default text in the bottom right corner, select New, and create a new profile called “Zabbix” to continue with some adjustments. (For more information about configuring Wireshark to fit your taste, see my earlier post on my personal blog about customizing Wireshark settings.)
In the display filter field I’ll first type “zabbix” and press Enter.
Note: If your Wireshark does not recognize the “zabbix” display filter, check that you are running Wireshark version 4.1.0 or newer to support Zabbix protocol dissection, as mentioned earlier in this post.
I’ll expand the Zabbix tree in the lower half of the screen to see the Zabbix-specific fields:
I’ll drag the “Agent name: Zabbix70-agent” field to the column headings to add it as a column:
Now I have the agent name conveniently visible in the packet list. The same can be done for any other field as needed. Instead of dragging and dropping the fields, you can also right-click any of the fields and select Apply as column.
I will now filter the packet list based on the agent name, and since the problem agent “Zabbix70-agent” is already visible in the list, I can just drag the agent name into the display filter as “zabbix.agent.name == "Zabbix70-agent"“:
Now, the original issue is that I want to ensure that the agent really sends the monitored data to Zabbix server, so let’s check one of the “Zabbix Send agent data” packets:
This is Zabbix agent 2 so the packet is compressed, but as you notice Wireshark automatically uncompressed and showed the contents for me.
The JSON data is a bit hard to read there in the packet bytes pane, but I can right-click the “Data [truncated]” field and select Show packet bytes to see it better:
In the Show as dropdown list there is a selection for JSON to show it even better:
So, what does it show us? It shows that in this particular packet there are two data values sent, one for item ID 45797 and one for item ID 45738, with appropriate Unix-style timestamps (clock).
But how do we find out the item ID for the disk usage item?
You can find it in the Zabbix frontend GUI when editing the item: the item ID is shown in the browser address bar as itemid=45797.
But, since we have Wireshark at hand, we can also check the agent config packets that the server sent to the agent. First, add “and zabbix.agent.config and zabbix.response” in the display filter:
Most of the responses just contain {"response":"success"} to indicate that there were no changes in the configuration (this is the new incremental configuration update feature in Zabbix protocol since Zabbix version 6.4), but since we restarted the agent during the capture, we have a full agent configuration in one of the responses (the one packet that is larger than the others, packet #36). In that packet there is:
So there we see that the item ID corresponding to the vfs.fs.size[/,used] key is 45797.
(In this demo agent we only had two items configured, so the output was very short. In practical cases you certainly have many more items configured.)
Ok, after that small detour, let’s try to filter the agent data packets based on the item ID using display filter:
zabbix.agent.name == "Zabbix70-agent" and zabbix.agent.data and zabbix.data contains "45797"
The “zabbix.data contains” filter is very simple in this example, you may get additional (false) matches in some more complicated cases, so be sure to check your results and adjust the filter as needed.
In this case we got six packets in the list (the capture length was about six minutes). When checking the data field contents more closely, we can see that the agent really sent the server the item values once every minute as configured. The values in the packets are (I copied the clock field from each packet separately and converted to local time using Epoch converter site):
Packet number
“value” for itemid 45797
“clock” for itemid 45797
Absolute local time
(from “clock”)
14
1394282496
1690631357
14:49:17
182
1394290688
1690631417
14:50:17
330
1394290688
1690631477
14:51:17
508
1394290688
1690631537
14:52:17
676
1394290688
1690631597
14:53:17
834
1394290688
1690631657
14:54:17
But, when checking the same timespan in the item latest values in Zabbix frontend, there is only one value:
Thus, our collected evidence shows that the Zabbix agent did its configured job properly and it sent the disk usage information every minute to Zabbix server, but Zabbix server decided for some reason to discard some of the values.
In this example the saved value 1394290688 (at 14:50:17) is especially interesting, because the previous value was different (1394282496). The next collected values are the same, and they weren’t saved.
Let’s see the item configuration more carefully:
In the top of the screen there is a hint: “Preprosessing 1”, meaning that there is one preprocessing step configured for this item. Let’s open that tab:
Aha! There is a preprocessing step that says: Discard unchanged with heartbeat: 5 minutes.
It means that whenever Zabbix server receives a value it compares it to the previously saved value, and if the value is the same as earlier, it doesn’t save it, unless the specified heartbeat time has elapsed since the last saved value.
This preprocessing rule is frequently used for items whose values aren’t changing that often, because this can dramatically reduce the database size while still enabling Zabbix to quickly react to changes.
So in this case there wasn’t any problem in the system. The configured behavior just didn’t match the user’s expectations.
Finally, some key takeaways when considering using Wireshark for Zabbix protocol troubleshooting in the application level:
Ensure that you capture in the correct place to get the expected data in the capture. In this example I captured on the Zabbix server, but since I was only interested in a single agent, I could have also captured on that agent host, using whatever tool is appropriate for the operating system (like tcpdump, Wireshark, tshark, or see also my post about using Packet Monitor on Windows). Or, if there are capable network devices like firewalls in the path, maybe they can be used for capturing as well (check with your network team).
Ensure that you capture with a suitable capture filter. In case of Zabbix protocol the interesting TCP (Transmission Control Protocol, the transport protocol on which Zabbix protocol runs) port is usually 10051, but if you are using Zabbix agents in passive mode (where server/proxy connects to the agents), then you need to also capture TCP port 10050. Also, in your Zabbix setup the ports may have been reconfigured to something else, so check the Zabbix configurations if unsure.
When looking at the Zabbix protocol captures in Wireshark, experiment with the display filters to find out exactly what you are looking for. When you type “zabbix.” (with the dot) in the display filter, Wireshark will automatically suggest you all possible Zabbix protocol fields that can be used in the filter. The field names are also shown in the status bar when you click on the fields.
Also, be aware of the fact that if your Zabbix components won’t talk to each other at all because of some misconfiguration or connectivity error, the Zabbix protocol display filter won’t show you anything in Wireshark. In those cases you need to resort to other ways of troubleshooting, maybe looking for any TCP-level issues in the captures.
Practice! See what the Zabbix traffic (or any other network traffic) looks like when everything works. If you can, try to cause some errors in a testing environment (pull some cable out, disable the firewall rule, stop the server, etc.), and see how it then looks in your captures.
This post was originally published on the author’s blog.
Simple applications routinely include dozens of packages. Large enterprise applications might have hundreds of dependencies. These packages help developers speed up the development and testing process by providing code that solves common programming challenges such as network access, cryptographic functions, or data format manipulation. Developers also embed SDKs–such as the AWS SDKs–to access remote services. These packages might be produced by other teams in your organization or maintained by third-parties, such as open-source projects. Managing packages and their dependencies is an integral part of the software development process. Modern programming languages include tools to download and resolve dependencies: Maven in Java, NuGet in C#, npm or yarn in JavaScript, and pip in Python just to mention a few. Developers for Apple platforms use CocoaPods or the Swift Package Manager (SwiftPM).
Downloading and integrating packages is a routine operation for application developers. However, it presents at least two significant challenges for organizations.
The first challenge is legal. Organizations must ensure that licenses for third-party packages are compatible with the expected use of licenses for your specific project and that the package doesn’t violate someone else’s intellectual property (IP). The second challenge is security. Organizations must ensure that the included code is safe to use and doesn’t include back doors or intentional vulnerabilities designed to introduce security flaws in your app. Injecting vulnerabilities in popular open-source projects is known as a supply chain attack and has become increasingly popular in recent years.
To address these challenges, organizations typically install private package servers on premises or in the cloud. Developers can only use packages vetted by their organization’s security and legal teams and made available through private repositories.
AWS CodeArtifact is a managed service that allows you to safely distribute packages to your internal teams of developers. There is no need to install, manage, or scale the underlying infrastructure. We take care of that for you, giving you more time to work on your apps instead of the software development infrastructure.
I’m excited to announce that CodeArtifact now supports native Swift packages, in addition to npm, PyPI, Maven, NuGet, and generic package formats. Swift packages are a popular way to package and distribute reusable Swift code elements. To learn how to create your own Swift package, you can follow this tutorial. The community has also created more than 6,000 Swift packages that you can use in your Swift applications.
You can now publish and download your Swift package dependencies from your CodeArtifact repository in the AWS Cloud. CodeArtifact SwiftPM works with existing developer tools such as Xcode, VSCode, and the Swift Package Manager command line tool. After your packages are stored in CodeArtifact, you can reference them in your project’s Package.swift file or in your Xcode project, in a similar way you use Git endpoints to access public Swift packages.
After the configuration is complete, your network-jailed build system will download the packages from the CodeArtifact repository, ensuring that only approved and controlled packages are used during your application’s build process.
How To Get Started As usual on this blog, I’ll show you how it works. Imagine I’m working on an iOS application that uses Amazon DynamoDB as a database. My application embeds the AWS SDK for Swift as a dependency. To comply with my organization policies, the application must use a specific version of the AWS SDK for Swift, compiled in-house and approved by my organization’s legal and security teams. In this demo, I show you how I prepare my environment, upload the package to the repository, and use this specific package build as a dependency for my project.
Now that I have the repository endpoint and an authentication token, I use the AWS Command Line Interface (AWS CLI) to configure SwiftPM on my machine.
SwiftPM can store the repository configurations at user level (in the file ~/.swiftpm/configurations) or at project level (in the file <your project>/.swiftpm/configurations). By default, the CodeArtifact login command creates a project-level configuration to allow you to use different CodeArtifact repositories for different projects.
I use the AWS CLI to configure SwiftPM on my build machine.
The command invokes swift package-registry login with the correct options, which in turn, creates the required SwiftPM configuration files with the given repository name (MySwiftRepo) and scope name (aws).
Now that my build machine is ready, I prepare my organization’s approved version of the AWS SDK for Swift package and then I upload it to the repository.
Notice the format of the package name after the URI of the repository: <scope>/<package name>/<package version>. The package version must follow the semantic versioning scheme.
I can use the CLI or the console to verify that the package is available in the repository.
Now that the package is available, I can use it in my projects as usual.
Xcode uses SwiftPM tools and configuration files I just created. To add a package to my Xcode project, I select the project name on the left pane, and then I select the Package Dependencies tab. I can see the packages that are already part of my project. To add a private package, I choose the + sign under Packages.
On the top right search field, I enter aws.aws-sdk-swift (this is <scope name>.<package name>). After a second or two, the package name appears on the list. On the top right side, you can verify the source repository (next to the Registry label). Before selecting the Add Package button, select the version of the package, just like you do for publicly available packages.
Alternatively, for my server-side or command-line applications, I add the dependency in the Package.swift file. I also use the format (<scope>.<package name>) as the first parameter of .package(id:from:)function.
You have to use Swift version 5.8 or newer to use CodeArtifact with the swift package command. On macOS, the Swift toolchain comes with Xcode. Swift 5.8 is available on macOS 13 (Ventura) and Xcode 14. On Linux and Windows, you can download the Swift toolchain from swift.org.
You have to use Xcode 15 for your iOS, iPadOS, tvOS, or watchOS applications. I tested this with Xcode 15 beta8.
The swift package-registry publish command is available with Swift 5.9 or newer. When you use Swift 5.8, you can use curlto upload your package, as I showed in the demo (or use any HTTP client of your choice).
Swift packages have the concept of scope. A scope provides a namespace for related packages within a package repository. Scopes are mapped to CodeArtifact namespaces.
The authentication token expires after 12 hours. We suggest writing a script to automate its renewal or using a scheduled AWS Lambda function and securely storing the token in AWS Secrets Manager (for example).
Troubleshooting If Xcode can not find your private package, double-check the registry configuration in ~/.swiftpm/configurations/registries.json. In particular, check if the scope name is present. Also verify that the authentication token is present in the keychain. The name of the entry is the URL of your repository. You can verify the entries in the keychain with the /Application/Utilities/Keychain Access.app application or using the security command line tool.
Pricing and Availability CodeArtifact costs for Swift packages are the same as for the other package formats already supported. CodeArtifact billing depends on three metrics: the storage (measured in GB per month), the number of requests, and the data transfer out to the internet or to other AWS Regions. Data transfer to AWS services in the same Region is not charged, meaning you can run your CICD jobs on Amazon EC2 Mac instances, for example, without incurring a charge for the CodeArtifact data transfer. As usual, the pricing page has the details.
Over seven years ago, we set out to change the way that SOCs approach threat detection and response. With the introduction of InsightIDR, we wanted to address the false positives and snowballing complexity that was burning out analysts, deteriorating security posture, and inhibiting necessary scale. We wanted to deliver a more intuitive and pragmatic approach, providing the most comprehensive coverage, with the strongest signal-to-noise. Today, as the robust XDR platform at the core of our leading MDR offering, InsightIDR has evolved to stay in front of emergent threats and expanding attack surfaces, while maintaining our commitment to eliminating the complexity and noise that distract and stall successful security teams.
Now we are proud to share our participation and results from the most recent MITRE Engenuity ATT&CK Evaluation: Enterprise, which highlights our ability to recognize advanced persistent threats early and across the kill chain, while maintaining disciplined signal-to-noise ratio to drive successful, real-world threat detection and response. You can find the detailed results and information about this evaluation on the MITRE Engenuity ATT&CK Evaluation: Enterprise website.
What You Need to Know
There is a lot of information to parse through in these results, so here we’ve broken down the key takeaways when it comes to this evaluation.
What is MITRE Engenuity ATT&CK Evaluations?
First, a quick primer: The MITRE ATT&CK framework is a catalog and reference point for cyberattack tactics, techniques, and procedures (TTPs). The framework provides security and risk teams with a common vernacular and guide to visualize detection coverage and map out plans to strengthen defenses. MITRE Engenuity’s ATT&CK Evaluations are a vehicle for the community to understand how technologies can help defend against known adversary behaviors. In this most recent Enterprise evaluation, the focus was on emulating Turla – a sophisticated Russia-based threat group known for their targeted intrusions and innovative stealth.
Rapid7 Delivers Complete Kill Chain Coverage
InsightIDR was able to capture relevant telemetry and detections across all 19 phases of this attack, demonstrating the ability to catch the earliest threat indicators and consistently identifying evasive behaviors as the attack progressed. This year’s attack was particularly complex, evaluating a diverse range of detections and leveraging multiple forms of endpoint telemetry. While not all techniques leave remnants for incident responders to analyze, the majority leave traces – if you have the right tools to help you look for them.
To address the need for deeper visibility to identify these traces of stealthy attacker behavior – like those emulated in this evaluation – Rapid7 has leveraged Velociraptor. In addition to providing one of the premier DFIR tools to support this kind of analysis, Velociraptor also enables real-time detection that sends alerts directly into the existing InsightIDR investigation experience so analysts do not need to pivot. This is one of the emerging capabilities of Velociraptor that the vibrant open source community continues to help strengthen day in and day out. The version of Velociraptor used in this evaluation is embedded into our existing Insight Agent and is hosted by Rapid7, which benefits from all of the open source generated artifacts and crowdsourced insights of the rapidly developed community feature set.
Strongest Signal-to-Noise for Real World Efficiency
Most importantly, we approached the evaluation with the intention of showing exactly what the experience would be for an InsightIDR customer today; no messing with our Insight Agent configurations or creating new, unrealistic exceptions just for this evaluation. What you see is what you get. And consistently, when we talk to customers, they aren’t looking for technology that fires alerts on every nuanced technique or procedure. They want to know that when something bad happens they’ll be able to pinpoint the threat as early as possible, quickly understand the scope of the attack, and know what to do about it. That’s our focus, and we are thrilled to showcase it with this evaluation.
Looking Ahead: Layered Defenses to Supercharge our Agent for Future-Ready SecOps
While IT environments continue to grow in diversity and surface area, endpoint fleets remain a critical security focus as they become increasingly distributed and remain rich sources of data and proprietary information. Endpoint detections, like those showcased in this evaluation, are one important piece of the puzzle, but successful security programs must encompass layered endpoint defenses – alongside broader ecosystem coverage.
We continue to invest to provide these layered defenses with our single, lightweight Insight Agent. From expanded pre-execution prevention and proactive risk mitigation, to high-efficacy detection of known and unknown threats, to detailed investigations, forensics, response, and automated playbooks, customers trust our Insight Agent as the nucleus of their complete endpoint security. With layered defenses across cloud, network, applications, and users, we’re also ready when attacks inevitably extend beyond the endpoint.
We are grateful once again to MITRE Engenuity for the opportunity to participate in their evaluation and for their shared commitment to open intelligence sharing and transparency. If you’re looking for a transparent partner to help you kick the complexity out of your SOC and proactively stop threats across the attack surface, we would love the opportunity to help you. Learn more about how we are driving real-world security success for customers like you.
The views and opinions expressed here are those of Rapid7 and do not necessarily reflect the views or positions of any entities they represent.
AWS Identity and Access Management (IAM) Roles Anywhere enables workloads that run outside of Amazon Web Services (AWS), such as servers, containers, and applications, to use X.509 digital certificates to obtain temporary AWS credentials and access AWS resources, the same way that you use IAM roles for workloads on AWS. Now, IAM Roles Anywhere allows you to use PKCS #11–compatible cryptographic modules to help you securely store private keys associated with your end-entity X.509 certificates.
Cryptographic modules allow you to generate non-exportable asymmetric keys in the module hardware. The cryptographic module exposes high-level functions, such as encrypt, decrypt, and sign, through an interface such as PKCS #11. Using a cryptographic module with IAM Roles Anywhere helps to ensure that the private keys associated with your end-identity X.509 certificates remain in the module and cannot be accessed or copied to the system.
In this post, I will show how you can use PKCS #11–compatible cryptographic modules, such as YubiKey 5 Series and Thales ID smart cards, with your on-premises servers to securely store private keys. I’ll also show how to use those private keys and certificates to obtain temporary credentials for the AWS Command Line Interface (AWS CLI) and AWS SDKs.
Cryptographic modules use cases
IAM Roles Anywhere reduces the need to manage long-term AWS credentials for workloads running outside of AWS, to help improve your security posture. Now IAM Roles Anywhere has added support for compatible PKCS #11 cryptographic modules to the credential helper tool so that organizations that are currently using these (such as defense, government, or large enterprises) can benefit from storing their private keys on their security devices. This mitigates the risk of storing the private keys as files on servers where they can be accessed or copied by unauthorized users.
Note: If your organization does not implement PKCS #11–compatible modules, IAM Roles Anywhere credential helper supports OS certificate stores (Keychain Access for macOS and Cryptography API: Next Generation (CNG) for Windows) to help protect your certificates and private keys.
Solution overview
This authentication flow is shown in Figure 1 and is described in the following sections.
Figure 1: Authentication flow using crypto modules with IAM Roles Anywhere
How it works
As a prerequisite, you must first create a trust anchor and profile within IAM Roles Anywhere. The trust anchor will establish trust between your public key infrastructure (PKI) and IAM Roles Anywhere, and the profile allows you to specify which roles IAM Roles Anywhere assumes and what your workloads can do with the temporary credentials. You establish trust between IAM Roles Anywhere and your certificate authority (CA) by creating a trust anchor. A trust anchor is a reference to either AWS Private Certificate Authority (AWS Private CA) or an external CA certificate. For this walkthrough, you will use the AWS Private CA.
The one-time initialization process (step “0 – Module initialization” in Figure 1) works as follows:
You first generate the non-exportable private key within the secure container of the cryptographic module.
You then create the X.509 certificate that will bind an identity to a public key:
Create a certificate signing request (CSR).
Submit the CSR to the AWS Private CA.
Obtain the certificate signed by the CA in order to establish trust.
The certificate is then imported into the cryptographic module for mobility purposes, to make it available and simple to locate when the module is connected to the server.
After initialization is done, the module is connected to the server, which can then interact with the AWS CLI and AWS SDK without long-term credentials stored on a disk.
To obtain temporary security credentials from IAM Roles Anywhere:
The server will use the credential helper tool that IAM Roles Anywhere provides. The credential helper works with the credential_process feature of the AWS CLI to provide credentials that can be used by the CLI and the language SDKs. The helper manages the process of creating a signature with the private key.
The credential helper tool calls the IAM Roles Anywhere endpoint to obtain temporary credentials that are issued in a standard JSON format to IAM Roles Anywhere clients via the API method CreateSession action.
The server uses the temporary credentials for programmatic access to AWS services.
Alternatively, you can use the update or serve commands instead of credential-process. The update command will be used as a long-running process that will renew the temporary credentials 5 minutes before the expiration time and replace them in the AWS credentials file. The serve command will be used to vend temporary credentials through an endpoint running on the local host using the same URIs and request headers as IMDSv2 (Instance Metadata Service Version 2).
Supported modules
The credential helper tool for IAM Roles Anywhere supports most devices that are compatible with PKCS #11. The PKCS #11 standard specifies an API for devices that hold cryptographic information and perform cryptographic functions such as signature and encryption.
I will showcase how to use a YubiKey 5 Series device that is a multi-protocol security key that supports Personal Identity Verification (PIV) through PKCS #11. I am using YubiKey 5 Series for the purpose of demonstration, as it is commonly accessible (you can purchase it at the Yubico store or Amazon.com) and is used by some of the world’s largest companies as a means of providing a one-time password (OTP), Fast IDentity Online (FIDO) and PIV for smart card interface for multi-factor authentication. For a production server, we recommend using server-specific PKCS #11–compatible hardware security modules (HSMs) such as the YubiHSM 2, Luna PCIe HSM, or Trusted Platform Modules (TPMs) available on your servers.
Note: The implementation might differ with other modules, because some of these come with their own proprietary tools and drivers.
Implement the solution: Module initialization
You need to have the following prerequisites in order to initialize the module:
The Security Officer (SO) should have permissions to use the AWS Private CA service
Following are the high-level steps for initializing the YubiKey device and generating the certificate that is signed by AWS Private Certificate Authority (AWS Private CA). Note that you could also use your own public key infrastructure (PKI) and register it with IAM Roles Anywhere.
To initialize the module and generate a certificate
Verify that the YubiKey PIV interface is enabled, because some organizations might disable interfaces that are not being used. To do so, run the YubiKey Manager CLI, as follows:
ykman info
The output should look like the following, with the PIV interface enabled for USB.
Figure 2:YubiKey Manager CLI showing that the PIV interface is enabled
Use the YubiKey Manager CLI to generate a new RSA2048 private key on the security module in slot 9a and store the associated public key in a file. Different slots are available on YubiKey, and we will use the slot 9a that is for PIV authentication purpose. Use the following command to generate an asymmetric key pair. The private key is generated on the YubiKey, and the generated public key is saved as a file. Enter the YubiKey management key to proceed:
Create a certificate request (CSR) based on the public key and specify the subject that will identify your server. Enter the user PIN code when prompted.
Import the certificate file on the module by using the YubiKey Manager CLI or through the YubiKey Manager UI. Enter the YubiKey management key to proceed.
The security module is now initialized and can be plugged into the server.
Configuration to use the security module for programmatic access
The following steps will demonstrate how to configure the server to interact with the AWS CLI and AWS SDKs by using the private key stored on the YubiKey or PKCS #11–compatible device.
Install the p11-kit package. Most providers (including opensc) will ship with a p11-kit “module” file that makes them discoverable. Users shouldn’t need to specify the PKCS #11 “provider” library when using the credential helper, because we use p11-kit by default.
If your device library is not supported by p11-kit, you can install that library separately.
Verify the content of the YubiKey by using the following command:
ykman --device 123456 piv info
The output should look like the following.
Figure 3: YubiKey Manager CLI output for the PIV information
This command provides the general status of the PIV application and content in the different slots such as the certificates installed.
Use the credential helper command with the security module. The command will require at least:
The ARN of the trust anchor
The ARN of the target role to assume
The ARN of the profile to pull policies from
The certificate and/or key identifiers in the form of a PKCS #11 URI
You can use the certificate flag to search which slot on the security module contains the private key associated with the user certificate.
To specify an object stored in a cryptographic module, you should use the PKCS #11 URI that is defined in RFC7512. The attributes in the identifier string are a set of search criteria used to filter a set of objects. See a recommended method of locating objects in PKCS #11.
In the following example, we search for an object of type certificate, with the object label as “Certificate for Digital Signature”, in slot 1. The pin-value attribute allows you to directly use the pin to log into the cryptographic device.
From the folder where you have installed the credential helper tool, use the following command. Because we only have one certificate on the device, we can limit the filter to the certificate type in our PKCS #11 URI.
If everything is configured correctly, the credential helper tool will return a JSON that contains the credentials, as follows. The PIN code will be requested if you haven’t specified it in the command.
Please enter your user PIN:
  			{
                    "Version":1,
                    "AccessKeyId": <String>,
                    "SecretAccessKey": <String>,
                    "SessionToken": <String>,
                    "Expiration": <Timestamp>
                 }
To use temporary security credentials with AWS SDKs and the AWS CLI, you can configure the credential helper tool as a credential process. For more information, see Source credentials with an external process. The following example shows a config file (usually in ~/.aws/config) that sets the helper tool as the credential process.
You can provide the PIN as part of the credential command with the option pin-value=<PIN> so that the user input is not required.
If you prefer not to store your PIN in the config file, you can remove the attribute pin-value. In that case, you will be prompted to enter the PIN for every CLI command.
You can use the serve and update commands of the credential helper mentioned in the solution overview to manage credential rotation for unattended workloads. After the successful use of the PIN, the credential helper will store it in memory for the duration of the process and not ask for it anymore.
Auditability and fine-grained access
You can audit the activity of servers that are assuming roles through IAM Roles Anywhere. IAM Roles Anywhere is integrated with AWS CloudTrail, a service that provides a record of actions taken by a user, role, or an AWS service in IAM Roles Anywhere.
For Lookup attributes, filter by Event source and enter rolesanywhere.amazonaws.com in the textbox. You will find all the API calls that relate to IAM Roles Anywhere, including the CreateSession API call that returns temporary security credentials for workloads that have been authenticated with IAM Roles Anywhere to access AWS resources.
Figure 4: CloudTrail Events filtered on the “IAM Roles Anywhere” event source
When you review the CreateSession event record details, you can find the assumed role ID in the form of <PrincipalID>:<serverCertificateSerial>, as in the following example:
Figure 5: Details of the CreateSession event in the CloudTrail console showing which role is being assumed
If you want to identify API calls made by a server, for Lookup attributes, filter by User name, and enter the serverCertificateSerial value from the previous step in the textbox.
Figure 6: CloudTrail console events filtered by the username associated to our certificate on the security module
The API calls to AWS services made with the temporary credentials acquired through IAM Roles Anywhere will contain the identity of the server that made the call in the SourceIdentity field. For example, the EC2 DescribeInstances API call provides the following details:
Figure 7: The event record in the CloudTrail console for the EC2 describe instances call, with details on the assumed role and certificate CN.
Additionally, you can include conditions in the identity policy for the IAM role to apply fine-grained access control. This will allow you to apply a fine-grained access control filter to specify which server in the group of servers can perform the action.
To apply access control per server within the same IAM Roles Anywhere profile
In the IAM Roles Anywhere console, select the profile used by the group of servers, then select one of the roles that is being assumed.
Apply the following policy, which will allow only the server with CN=server1-demo to list all buckets by using the condition on aws:SourceIdentity.
In this blog post, I’ve demonstrated how you can use the YubiKey 5 Series (or any PKCS #11 cryptographic module) to securely store the private keys for the X.509 certificates used with IAM Roles Anywhere. I’ve also highlighted how you can use AWS CloudTrail to audit API actions performed by the roles assumed by the servers.
AWS Glue interactive sessions offer a powerful way to iteratively explore datasets and fine-tune transformations using Jupyter-compatible notebooks. Interactive sessions enable you to work with a choice of popular integrated development environments (IDEs) in your local environment or with AWS Glue or Amazon SageMaker Studio notebooks on the AWS Management Console, all while seamlessly harnessing the power of a scalable, on-demand Apache Spark backend. This post is part of a series exploring the features of AWS Glue interactive sessions.
AWS Glue interactive sessions now include native support for the matplotlib visualization library (AWS Glue version 3.0 and later). In this post, we look at how we can use matplotlib and Seaborn to explore and visualize data using AWS Glue interactive sessions, facilitating rapid insights without complex infrastructure setup.
Solution overview
You can quickly provision new interactive sessions directly from your notebook without needing to interact with the AWS Command Line Interface (AWS CLI) or the console. You can use magic commands to provide configuration options for your session and install any additional Python modules that are needed.
In this post, we use the classic Iris and MNIST datasets to navigate through a few commonly used visualization techniques using matplotlib on AWS Glue interactive sessions.
Create visualizations using AWS Glue interactive sessions
We start by installing the Sklearn and Seaborn libraries using the additional_python_modules Jupyter magic command:
%additional_python_modules scikit-learn, seaborn
You can also upload Python wheel modules to Amazon Simple Storage Service (Amazon S3) and specify the full path as a parameter value to the additional_python_modules magic command.
Now, let’s run a few visualizations on the Iris and MNIST datasets.
Create a pair plot using Seaborn to uncover patterns within sepal and petal measurements across the iris species:
import seaborn as sns
import matplotlib.pyplot as plt

# Load the Iris dataset
iris = sns.load_dataset("iris")

# Create a pair plot
sns.pairplot(iris, hue="species")
%matplot plt
Create a violin plot to reveal the distribution of the sepal width measure across the three species of iris flowers:
# Create a violin plot of the Sepal Width measure
plt.figure(figsize=(10, 6))
sns.violinplot(x="species", y="sepal_width", data=iris)
plt.title("Violin Plot of Sepal Width by Species")
plt.show()
%matplot plt
Create a heat map to display correlations across the iris dataset variables:
# Calculate the correlation matrix
correlation_matrix = iris.corr()

# Create a heatmap using Seaborn
plt.figure(figsize=(8, 6))
sns.heatmap(correlation_matrix, annot=True, cmap="coolwarm")
plt.title("Correlation Heatmap")
%matplot plt
Create a scatter plot on the MNIST dataset using PCA to visualize distributions among the handwritten digits:
import matplotlib.pyplot as plt
from sklearn.datasets import fetch_openml
from sklearn.decomposition import PCA

# Load the MNIST dataset
mnist = fetch_openml('mnist_784', version=1)
X, y = mnist['data'], mnist['target']

# Apply PCA to reduce dimensions to 2 for visualization
pca = PCA(n_components=2)
X_pca = pca.fit_transform(X)

# Scatter plot of the reduced data
plt.scatter(X_pca[:, 0], X_pca[:, 1], c=y.astype(int), cmap='viridis', s=5)
plt.xlabel("Principal Component 1")
plt.ylabel("Principal Component 2")
plt.title("PCA - MNIST Dataset")
plt.colorbar(label="Digit Class")

%matplot plt
Create another visualization using matplotlib and the mplot3d toolkit:
import numpy as np
import matplotlib.pyplot as plt
from mpl_toolkits.mplot3d import Axes3D

# Generate mock data
x = np.linspace(-5, 5, 100)
y = np.linspace(-5, 5, 100)
x, y = np.meshgrid(x, y)
z = np.sin(np.sqrt(x**2 + y**2))

# Create a 3D plot
fig = plt.figure(figsize=(10, 8))
ax = fig.add_subplot(111, projection='3d')

# Plot the surface
surface = ax.plot_surface(x, y, z, cmap='viridis')

# Add color bar to map values to colors
fig.colorbar(surface, ax=ax, shrink=0.5, aspect=10)

# Set labels and title
ax.set_xlabel('X')
ax.set_ylabel('Y')
ax.set_zlabel('Z')
ax.set_title('3D Surface Plot Example')

%matplot plt
As illustrated by the preceding examples, you can use any compatible visualization library by installing the required modules and then using the %matplot magic command.
Conclusion
In this post, we discussed how extract, transform, and load (ETL) developers and data scientists can efficiently visualize patterns in their data using familiar libraries through AWS Glue interactive sessions. With this functionality, you’re empowered to focus on extracting valuable insights from their data, while AWS Glue handles the infrastructure heavy lifting using a serverless compute model. To get started today, refer to Developing AWS Glue jobs with Notebooks and Interactive sessions.
About the authors
Annie Nelson is a Senior Solutions Architect at AWS. She is a data enthusiast who enjoys problem solving and tackling complex architectural challenges with customers.
Keerthi Chadalavada is a Senior Software Development Engineer at AWS Glue. She is passionate about designing and building end-to-end solutions to address customer data integration and analytic needs.
Zach Mitchell is a Sr. Big Data Architect. He works within the product team to enhance understanding between product engineers and their customers while guiding customers through their journey to develop their enterprise data architecture on AWS.
Gal Heyne is a Product Manager for AWS Glue with a strong focus on AI/ML, data engineering and BI. She is passionate about developing a deep understanding of customer’s business needs and collaborating with engineers to design easy to use data products.
AWS Glue interactive sessions allow you to run interactive AWS Glue workloads on demand, which enables rapid development by issuing blocks of code on a cluster and getting prompt results. This technology is enabled by the use of notebook IDEs, such as the AWS Glue Studio notebook, Amazon SageMaker Studio, or your own Jupyter notebooks.
In this post, we discuss the following new management features recently added and how can they give you more control over the configurations and security of your AWS Glue interactive sessions:
Tags magic – You can use this new cell magic to tag the session for administration or billing purposes. For example, you can tag each session with the name of the billable department and later run a search to find all spending associated with this department on the AWS Billing console.
Assume role magic – Now you can create a session in an account different than the one you’re connected with by assuming an AWS Identity and Access Management (IAM) role owned by the other account. You can designate a dedicated role with permissions to create sessions and have other users assume it when they use sessions.
IAM VPC rules – You can require your users to use (or restrict them from using) certain VPCs or subnets for the sessions, to comply with your corporate policies and have control over how your data travels in the network. This feature existed for AWS Glue jobs and is now available for interactive sessions.
Solution overview
For our use case, we’re building a highly secured app and want to have users (developers, analysts, data scientists) running AWS Glue interactive sessions on specific VPCs to control how the data travels through the network.
In addition, users are not allowed to log in directly to the production account, which has the data and the connections they need; instead, users will run their own notebooks via their individual accounts and get permission to assume a specific role enabled on the production account to run their sessions. Users can run AWS Glue interactive sessions by using both AWS Glue Studio notebooks via the AWS Glue console, as well as Jupyter notebooks that run on their local machine.
Lastly, all new resources be tagged with the name of the department for proper billing allocation and cost control.
The following architecture diagram highlights the different roles and accounts involved:
Account A – The individual user account. The user ISBlogUser has permissions to create AWS Glue notebook servers via the AWSGlueServiceRole-notebooks role and assume a role in account B (directly or indirectly).
Account B – The production account that owns the GlueSessionsCreationRole role, which users assume to create AWS Glue interactive sessions in this account.
Prerequisites
In this section, we walk through the steps to set up the prerequisite resources and security configurations.
Optionally, if you want to use run a local notebook from your computer, install Python 3.7 or later and then install Jupyter and the AWS Glue interactive sessions kernels. For instructions, refer to Getting started with AWS Glue interactive sessions. You can then run Jupyter directly from the command line using jupyter notebook, or via an IDE like VSCode or PyCharm.
Get access to two AWS accounts
If you have access to two accounts, you can reproduce the use case described in this post. The instructions refer to account A as the user account that runs the notebook and account B as the account that runs the sessions (the production account in the use case). This post assumes you have enough administration permissions to create the different components and manage the account security roles.
If you have access to only one account, you can still follow this post and perform all the steps on that single account.
Create a VPC and subnet
We want to limit users to use AWS Glue interactive session only via a specific VPC network. First, let’s create a new VPC in account B using Amazon Virtual Private Cloud (Amazon VPC). We use this VPC connection later to enforce the network restrictions.
On the Amazon VPC console, choose Your VPCs in the navigation pane.
Choose Create VPC.
Enter 10.0.0.0/24 as the IP CIDR.
Leave the remaining parameters as default and create your VPC.
Make a note of the VPC ID (starting with vpc-) to use later.
For more information about creating VPCs, refer to Create a VPC.
In the navigation pane, choose Subnets.
Choose Create subnet.
Select the VPC you created, enter the same CIDR (10.0.0.0/24), and create your subnet.
In the navigation pane, choose Endpoints.
Choose Create endpoint.
For Service category, select AWS services.
Search for the option that ends in s3, such as com.amazonaws.{region}.s3.
In the search results, select the Gateway type option.
Choose your VPC on the drop-down menu.
For Route tables, select the subnet you created.
Complete the endpoint creation.
Create an AWS Glue network connection
You now need to create an AWS Glue connection that uses the VPC, so sessions created with it can meet the VPC requirement.
Sign in to the console with account B.
On the AWS Glue console, choose Data connections in the navigation pane.
Choose Create connection.
For Name, enter session_vpc.
For Connection type, choose Network.
In the Network options section, choose the VPC you created, a subnet, and a security group.
Choose Create connection.
Account A security setup
Account A is the development account for your users (developers, analysts, data scientists, and so on). They are provided IAM users to access this account programmatically or via the console.
Create the assume role policy
The assume role policy allows users and roles in account A to assume roles in account B (the role in account B also has to allow it). Complete the following steps to create the policy:
On the IAM console, choose Policies in the navigation pane.
Choose Create policy.
Switch to the JSON tab in the policy editor and enter the following policy (provide the account B number):{
Name the role AssumeRoleAccountBPolicy and complete the creation.
Create an IAM user
Now you create an IAM user for account A that you can use to run AWS Glue interactive sessions locally or on the console.
On the IAM console, choose Users in the navigation pane.
Choose Create user.
Name the user ISBlogUser.
Select Provide user access to the AWS Management Console.
Select I want to create an IAM user and choose a password.
Attach the policies AWSGlueConsoleFullAccess and AssumeRoleAccountBPolicy.
Review the settings and complete the user creation.
Create an AWS Glue Studio notebook role
To start an AWS Glue Studio notebook, a role is required. Usually, the same role is used both to start a notebook and run a session. In this use case, users of account A only need permissions to run a notebook, because they will create sessions via the assumed role in account B.
On the IAM console, choose Roles in the navigation pane.
Choose Create role.
Select Glue as the use case.
Attach the policies AWSGlueServiceNotebookRole and AssumeRoleAccountBPolicy.
Name the role AWSGlueServiceRole-notebooks (because the name starts with AWSGlueServiceRole, the user doesn’t need explicit PassRole permission), then complete the creation.
Optionally, you can allow Amazon CodeWhisperer to provide code suggestions on the notebook by adding the permission to the role. To do so, navigate to the role AWSGlueServiceRole-notebooks on the IAM console. On the Add permissions menu, choose Create inline policy. Use the following JSON policy and name it CodeWhispererPolicy:
Account B is considered the production account that contains the data and connections, and runs the AWS Glue data integration pipelines (using either AWS Glue sessions or jobs). Users don’t have direct access to it; they use it assuming the role created for this purpose.
To follow this post, you need two roles: one the AWS Glue service will assume to run and another that creates sessions, enforcing the VPC restriction.
Create an AWS Glue service role
To create an AWS Glue service role, complete the following steps:
On the IAM console, choose Roles in the navigation pane.
Choose Create role.
Choose Glue for the use case.
Attach the policy AWSGlueServiceRole.
Name the role AWSGlueServiceRole-blog and complete the creation.
Create an AWS Glue interactive session role
This role will be used to create sessions following the VPC requirements. Complete the following steps to create the role:
On the IAM console, choose Policies in the navigation pane.
Choose Create policy.
Switch to the JSON tab in the policy editor and enter the following code (provide your VPC ID). You can also replace the * in the policy with the full ARN of the role AWSGlueServiceRole-blog you just created, to force the notebook to only use that role when creating sessions.
This policy complements the AWSGlueServiceRole you attached before and restricts the session creation based on the VPC. You could also restrict the subnet and security group in a similar way using conditions for the resources glue:SubnetIds and glue:SecurityGroupIds respectively.
In this case, the sessions creation requires a VPC, which has to be in the list of IDs listed. If you need to just require any valid VPC to be used, you can remove the first statement and leave the one that denies the creation when the VPC is null.
Name the policy CustomCreateSessionPolicy and complete the creation.
Choose Roles in the navigation pane.
Choose Create role.
Select Custom trust policy.
Replace the trust policy template with the following code (provide your account A number):
This allows the role to be assumed directly by the user when using a local notebook and also when using an AWS Glue Studio notebook with a role.
Attach the policies AWSGlueServiceRole and CustomCreateSessionPolicy (which you created on the previous step, so you might need to refresh for them to be listed).
Name the role GlueSessionCreationRole and complete the role creation.
Create the Glue interactive session in the VPC, with assumed role and tags
Now that you have the accounts, roles, VPC, and connection ready, you use them to meet the requirements. You start a new notebook using account A, which assumes the role of account B to create a session in the VPC, and tag it with the department and billing area.
Start a new notebook
Using account A, start a new notebook. You may use either of the following options.
Option 1: Create an AWS Glue Studio notebook
The first option is to create an AWS Glue Studio notebook:
Sign in to the console with account A and the ISBlogUser user.
On the AWS Glue console, choose Notebooks in the navigation pane under ETL jobs.
Select Jupyter Notebook and choose Create.
Enter a name for your notebook.
Specify the role AWSGlueServiceRole-notebooks.
Choose Start notebook.
Option 2: Create a local notebook
Alternatively, you can create a local notebook. Before you start the process that runs Jupyter (or if you run it indirectly, then the IDE that runs it), you need to set the IAM ID and key for the user ISBlogUser, either using aws configure on the command line or setting the values as environment variables AWS_ACCESS_KEY_ID and AWS_SECRET_ACCESS_KEY for the user ID and secret key, respectively. Then create a new Jupyter notebook and select the kernel Glue PySpark.
Start a session from the notebook
After you start the notebook, select the first cell and add four new empty code cells. If you are using an AWS Glue Studio notebook, the notebook already contains some prepopulated cells as examples; we don’t use those sample cells in this post.
In the first cell, enter the following magic configuration with the session creation role ARN, using the ID of account B:
# Configure the role we assume for creating the sessions
# Tip: assume_role is a cell magic (meaning it needs its own cell)
%%assume_role
"arn:aws:iam::{account B}:role/GlueSessionCreationRole"
Run the cell to set up that configuration, either by choosing the button on the toolbar or pressing Shift + Enter.
It should confirm the role was assumed correctly. Now when the session is launched, it will be done by this role. This allowed you to use a role from a different account to run a session on that account.
In the second cell, enter sample tags like the following and run the cell in the same way:
# Set a tag to associate the session with billable department
# Tip: tags is a cell magic (meaning it needs its own cell)
%%tags
{'team':'analytics', 'billing':'Data-Platform'}
In the third cell, enter the following sample configuration (provide the role ARN with account B) and run the cell to set up the configuration:
# Set the configuration of your sessions using magics
# Tip: non-cell magics can share the same cell
%idle_timeout 2880
%glue_version 4.0
%worker_type G.1X
%number_of_workers 5
%iam_role arn:aws:iam::{account B}:role/AWSGlueServiceRole-blog
Now the session is configured but hasn’t started yet because you didn’t run any Python code.
In the fourth empty cell, enter the following code to set up the objects required to work with AWS Glue and run the cell:
import sys
from awsglue.transforms import *
from awsglue.utils import getResolvedOptions
from pyspark.context import SparkContext
from awsglue.context import GlueContext
from awsglue.job import Job

sc = SparkContext.getOrCreate()
glueContext = GlueContext(sc)
spark = glueContext.spark_session
job = Job(glueContext)
It should fail with a permission error saying that there is an explicit deny policy activated. This is the VPC condition you set before. By default, the session doesn’t use a VPC, so this is why it’s failing.
You can solve the error by assigning the connection you created before, so the session runs inside the VPC authorized.
In the third cell, add the %connections magic with the value session_vpc.
The session needs to run in the same Region in which the connection is defined. If that’s not the same as the notebook Region, you can explicitly configure the session Region using the %region magic.
After you have added the new config settings, run the cell again so the magics take effect.
Run the fourth cell again (the one with the code).
This time, it should start the session and after a brief period confirm it has been created correctly.
Add a new cell with the following content and run it: %status
This will display the configuration and other information about the session that the notebook is using, including the tags set before.
You started a notebook in account A and used a role from account B to create a session, which uses the network connection so it runs in the required VPC. You also tagged the session to be able to easily identify it later.
In the next section, we discuss more ways to monitor sessions using tags.
Interactive session tags
Before tags were supported, if you wanted to identify the purpose of sessions running the account, you had to use the magic %session_id_prefix to name your session with something meaningful.
Now, with the new tags magic, you can use more sophisticated ways to categorize your sessions.
In the previous section, you tagged the session with a team and billing department. Let’s imagine now you are an administrator checking the sessions that different teams run in an account and Region.
Explore tags via the AWS CLI
On the command line where you have the AWS CLI installed, run the following command to list the sessions running in the account and Regions configured (use the Region and max results parameters if needed):
aws glue list-sessions
You also have the option to just list sessions that have a specific tag:
aws glue list-sessions --tags team=analytics
You can also list all the tags associated with a specific session with the following command. Provide the Region, account, and session ID (you can get it from the list-sessions command):
You can also use tags to keep track of cost and do more accurate cost assignment in your company. After you have used a tag in your session, the tag will become available for billing purposes (it can take up to 24 hours to be detected).
On the AWS Billing console, choose Cost allocation tags under Billing in the navigation pane.
Search for and select the tags you used in the session: “team” and “billing”.
Choose Activate.
This activation can take up to 24 hours additional hours until the tag is applied for billing purposes. You only have to do this one time when you start using a new tag on an account.
After the tags have been correctly activated and applied, choose Cost explorer under Cost Management in the navigation pane.
In the Report parameters pane, for Tag, choose one of the tags you activated.
This adds a drop-down menu for this tag, where you can choose some or all of the tag values to use.
Make your selection and choose Apply to use the filter on the report.
Clean up
Run the %stop_session magic in a cell to stop the session and avoid further charges. If you no longer need the notebook, VPC, or roles you created, you can delete them as well.
Conclusion
In this post, we showed how to use these new features in AWS Glue to have more control over your interactive sessions for management and security. You can enforce network restrictions, allow users from other accounts to use your session, and use tags to help you keep track of the session usage and cost reports. These new features are already available, so you can start using them now.
About the authors
Gonzalo Herreros is a Senior Big Data Architect on the AWS Glue team.
Gal Heyne is a Technical Product Manager on the AWS Glue team.
The “limited” C API for CPython extensions has been around for well over a
decade at this point, but it has not seen much uptake. It is meant to give
extensions an API that will allow binaries built with it to be used for
multiple versions of CPython, because those binaries will only access the stable
ABI that will not change when CPython does. Victor Stinner has been
working on better
definition for the
API; as part of that work, he suggested that some of the C extensions in the
standard
library start using it in an effort for CPython to “eat its
own dog food“. The resulting discussion showed that there is still a fair
amount of confusion about this API—and the thrust of Stinner’s overall plan.
Amazon CodeCatalyst is a unified software development service for building and delivering applications on AWS. With CodeCatalyst, you can implement your team’s preferred branching strategy. Whether you follow popular models like GitFlow or have your own approach, CodeCatalyst Workflows allow you to design your development process and deploy to multiple environments.
Introduction
In a previous post in this series, Using Workflows to Build, Test, and Deploy with Amazon CodeCatalyst, we discussed creating a continuous integration and continuous delivery (CI/CD) pipeline in CodeCatalyst and how you can continually deliver high-quality updates through the use of one workflow. I will build on these concepts by focusing on how you collaborate across your codebase by using multiple CodeCatalyst Workflows to model your team’s branching strategy.
Having a standardized process for managing changes to the codebase allows developers to collaborate predictably and focus on delivering software. Some popular branching models include GitFlow, GitHub flow, and trunk-based development.
GitFlow is designed to manage large projects with parallel development and releases, featuring multiple long-running branches.
GitHub flow is a lightweight, branch-based workflow that involves creating feature branches and merging changes into the main branch.
Trunk-based development is focused on keeping the main branch always stable and deployable. All changes are made directly to the main branch, and issues are identified and fixed using automated testing and deployment tools.
In this post, I am going to demonstrate how to implement GitFlow with CodeCatalyst. GitFlow uses two permanent branches, main and develop, with supporting branches. The prefix names of the supporting branches give the function they serve — feature, release, and hotfix. I will apply this strategy by separating these branches into production and integration, both with their own workflow and environment. The main branch will deploy to production and the develop branch plus the supporting branches will deploy to integration.
Figure 1. Implementing GitFlow with CodeCatalyst.
Upon completing the walkthrough, you will have the ability to utilize these techniques to implement any of the popular models or even your own.
Prerequisites
If you would like to follow along with the walkthrough, you will need to:
Have an AWS account associated with your space and have the IAM role in that account. For more information about the role and role policy, see Creating a CodeCatalyst service role.
Walkthrough
For this walkthrough, I am going use the Static Website blueprint with the default configuration. A CodeCatalyst blueprint creates new project with everything you need to get started. To try this out yourself, launch the blueprint by following the steps outlined in the Creating a project in Amazon CodeCatalyst.
Once the new project is launched, I navigate to CI/CD > Environments. I see one environment called production. This environment was setup when the project was created by the blueprint. I will now add my integration environment. To do this, I click the Create environment above the list of environments.
Figure 2. Initial environment list with only production.
A CodeCatalyst environment is where code is deployed and are configured to be associated with your AWS account using AWS account connections. Multiple CodeCatalyst environments can be associated with a single AWS account, allowing you to have environments in CodeCatalyst for development, test, and staging associated with one AWS account.
In the next screen, I enter the environment name as integration, select Non-production for the environment type, provide a brief description of the environment, and select the connection of the AWS account I want to deploy to. To learn more about connecting AWS accounts review Working with AWS accounts in Amazon CodeCatalyst. I will make note of my connection Name and Role, as I will need it later in my workflow. After I have entered all the details for the integration environment, I click Create environment on the bottom of the form. When I navigate back to CI/CD > Environments I now see both environments listed.
Figure 3. Environment list with integration and production.
Now that I have my production and integration environment, I want to setup my workflows to deploy my branches into each separate environment. Next, I navigate to CI/CD > Workflows. Just like with the environments, there is already a workflow setup by the blueprint created called OnPushBuildTestAndDeploy. In order to review the workflow, I select Edit under the Actions menu.
By reviewing the workflow YAML, I see the OnPushBuildTestAndDeploy workflow is triggered by the main branch and deploys to production. Below I have highlighted the parts of the YAML that define each of these. The Triggers in the definition determine when a workflow run should start and Environment where code is deployed to.
Since this confirms the production workflow is already done, I will copy this YAML and use it to create my integration workflow. After copying the entire OnPushBuildTestAndDeploy YAML to my clipboard (not just the highlights above), I navigate back to CI/CD > Workflows and click Create Workflow. Then in the Create workflow dialog window click Create.
Figure 5. Create workflow dialog window.
Inside the workflow YAML editor, I replace all the existing content by pasting the OnPushBuildTestAndDeploy YAML from my clipboard. The first thing I edit in the YAML is the name of the workflow. I do this by finding the property called Name and replacing OnPushBuildTestAndDeploy to OnIntegrationPushBuildTestAndDeploy.
Next, I want to change the triggers to the develop branch and match the supporting branches by their prefixes. Triggers allow you to specify multiple branches and you can use regex to define your branch names to match multiple branches. To explore triggers further read Working with triggers.
After my triggers are updated, I need to update the Environment property with my integration environment. I replace both the Name and the Connections properties with the correct values for my integration environment. I use the Name and Role from the integration environment connection I made note of earlier. For additional details about environments in workflows review Working with environments.
Before finishing the integration workflow, I have highlighted the use of ${WorkflowSource.BranchName} in the Deploy action. The workflow uses the BranchName variable to prevent different branch deployments from overwriting one another. This is important to verify as all integration branches use the same environment. The WorkflowSource action outputs both CommitId and BranchName to workflow variables automatically. To learn more about variables in workflows review Working with variables.
I have included the complete sample OnIntegrationPushBuildTestAndDeploy workflow below. It is the developer’s responsibility to delete resources their branches create even after merging and deleting branches as there is no automated cleanup.
Figure 6. Entire sample integration workflow.
After I have validated the syntax of my workflow by clicking Validate, I then click Commit. Confirm this action by clicking Commit in the Commit workflow modal window.
Figure 7. Commit workflow dialog window.
Immediately after committing the workflow, I can see the new OnIntegrationPushBuildTestAndDeploy workflow in my list of workflows. I see that the workflow shows the “Workflow is inactive”. This is expected as I am looking at the main branch and the trigger is not invoked from main.
Now that I have finished the implementation details of GitFlow, I am now going to create the permanent develop branch and a feature branch to test my integration workflow. To add a new branch, I go to Code > Source repositories > static-website-content, select Create branch under the More menu.
Figure 8. Source repository Actions menu.
Enter develop as my branch name, create the branch from main, and then click Create.
Figure 9. Create the develop branch from main.
I now add a feature branch by navigating back to the create branch screen. This time, I enter feature/gitflow-demo as my branch name, create the branch from develop, and then click Create.
Figure 10. Create a feature branch from develop.
To confirm that I have successfully implemented GitFlow, I need to verify that the feature branch workflow is running. I return to CI/CD > Workflows, select feature/gitflow-demo from the branch dropdown, and see the integration workflow is running.
To complete my testing of my implementation of GitFlow, I wait for the workflow to succeed. Then I view the newly deployed branch by navigating to the workflow and clicking on the View app link located on the last workflow action.
Lastly, now that GitFlow is implemented and tested, I will step through getting the feature branch to production. After I make my code changes to the feature branch, I create a pull request to merge feature/gitflow-demo into develop. Note that pull requests were covered in the prior post in this series. When merging the pull request select Delete the source branch after merging this pull request, as the feature branch is not a permanent branch.
Figure 12. Deleting the feature branch when merging.
Now that my changes are in the develop branch, I create a release branch. I navigate back to the create branch screen. This time I enter release/v1 as my branch name, create the branch from develop, and then click Create.
Figure 13. Create the release branch from main.
I am ready to release to production, so I create a pull request to merge release/v1 into main. The release branch is not a permanent branch, so it can also be deleted on merge. When the pull request is merged to main, the OnPushBuildTestAndDeploy workflow runs. After the workflow finishes running, I can verify my changes are in production.
Cleanup
If you have been following along with this workflow, you should delete the resources you deployed so you do not continue to incur charges. First, delete the two stacks that deployed using the AWS CloudFormation console in the AWS account(s) you associated when you launched the blueprint and configured the new environment. These stacks will have names like static-web-XXXXX. Second, delete the project from CodeCatalyst by navigating to Project settings and choosing Delete project.
Conclusion
In this post, you learned how to use triggers and environments in multiple workflows to implement GitFlow with Amazon CodeCatalyst. By consuming variables inside workflows, I was able to further customize my deployment design. Using these concepts, you can now implement your team’s branching strategy with CodeCatalyst. Learn more about Amazon CodeCatalyst and get started today!
This week, Rapid7 was named a Strong Performer in The Forrester Wave™: Vulnerability Risk Management, Q3 2023. The report, which included 11 vulnerability risk management vendors, represented Rapid7’s inclusion in the Wave report for vulnerability management. We are proud to be recognized for our consolidated platform approach, speedy response to actively exploited emergency vulnerabilities, and a deep commitment to the cybersecurity community through open-source tools and community research.
As organizations move to the cloud, security teams need to adapt their vulnerability management programs to secure their ever-increasing attack surface, including both on-premise assets and more ephemeral cloud resources. While the market has many tools that security teams can use to meet specific use cases—either a component of vulnerability management process or specific technology like Cloud or OT or applications—working with multiple tools/solutions can add to challenges of security operations.
As a result, security teams are continually leaning toward vendors who can consolidate their security needs. Gartner recently stated that “Seventy-five percent of organizations are pursuing a security vendor consolidation—in 2020, this figure was only 29%. More organizations consolidate to improve risk posture than to save on budget.*” Rapid7 will continue to build a consolidated, practitioner-first platform that helps security teams meet their vulnerability management and compliance needs for a hybrid environment with a single solution.
Building A Comprehensive Risk Management Solution
Our Cloud Risk Complete solution unifies on-prem risk management, cloud security, and application security testing with a practitioner-first approach. It offers security teams:
Visibility in their attack surface – Unlock a comprehensive view of risk across applications, cloud environments, and on-prem infrastructure. Forrester gave Rapid7 the perfect score for comprehensive coverage of assets across hybrid environments and provides valuable information regarding assets for several types of remediation teams across a typical enterprise. Our asset coverage includes cloud service providers like AWS, Azure, GCP, Oracle & Alibaba; Applications; Infrastructure – Networking devices; Data; Operating systems and software; OT/IoT coverage; Web Applications and APIs
Unlimited risk assessment – Accelerate risk assessment with purpose-built solutions that scan and assess each environment. Our agentless approach in cloud environments allows customers to auto detect new resources and configuration changes within seconds. Project SONAR provides external attack surface visibility. In addition to native scanning capabilities, we continually add to our partner ecosystem and integrations, particularly ingesting 3rd-party assets, including IoT/OT, to help customers maintain complete asset inventory.
Enforce compliance and accelerate remediation – A successful VM program looks to remediate risk, efficiently with minimal manual intervention. Rapid7 provides several ways to automate remediation-related tasks – for instance, killing non-gold images and searching for vulnerable applications and containing them – for which Forrester provided us with perfect scores.The built-in automated workflows and third-party integrations (both customizable) helps security teams to drive collaboration and remediate risk faster.
Drive operational efficiency and results – with a single vendor that has industry leading solutions across cloud environments, applications and on-prem infrastructure.
As part of helping Security teams reduce risk posed by actively exploited vulnerabilities, our Emergent Threat Response (ETR) program flags multiple CVEs as part of an ongoing process to deliver fast, expert analysis alongside first-rate security content for the highest-priority security threats. You can learn more about the recent threats we have disclosed or responded to here.
As we continue to double down on our strategy of providing a consolidated, comprehensive risk management platform, we’ve made a number of recent investments and product releases, including:
Enterprise Risk View – provides the visibility and context needed to track total risk across the entire attack surface (cloud and on-prem) and understand organizational risk posture.
Attack Path Analysis – visualize risk across cloud environments in real-time, mapping relationships between compromised resources and the rest of the environment.
Active Risk – a unified vulnerability risk scoring and prioritization strategy across hybrid environments
“Rapid7 has been a reliable and effective tool allowing us to reduce our vulnerabilities by over 95% and effectively maintain a well patched, well configured environment”. – Director of Cybersecurity at Kutak Rock LLP.
Thank you to our customers and partners for always supporting and guiding us! We’re excited to keep investing in a platform that helps security teams prevent and manage risk from the endpoint to the cloud and simplify security operations.
*Source: Gartner, Inc: Top Trends in Cybersecurity — Survey Analysis: Cybersecurity Platform Consolidation, Dionisio Zumerle, John Watt, February 22, 2023
Almost three years ago, we launched Cloudflare Waiting Room to protect our customers’ sites from overwhelming spikes in legitimate traffic that could bring down their sites. Waiting Room gives customers control over user experience even in times of high traffic by placing excess traffic in a customizable, on-brand waiting room, dynamically admitting users as spots become available on their sites. Since the launch of Waiting Room, we’ve continued to expand its functionality based on customer feedback with features like mobile app support, analytics, Waiting Room bypass rules, and more.
We love announcing new features and solving problems for our customers by expanding the capabilities of Waiting Room. But, today, we want to give you a behind the scenes look at how we have evolved the core mechanism of our product–namely, exactly how it kicks in to queue traffic in response to spikes.
How was the Waiting Room built, and what are the challenges?
The diagram below shows a quick overview of where the Waiting room sits when a customer enables it for their website.
Waiting Room is built on Workers that runs across a global network of Cloudflare data centers. The requests to a customer’s website can go to many different Cloudflare data centers. To optimize for minimal latency and enhanced performance, these requests are routed to the data center with the most geographical proximity. When a new user makes a request to the host/path covered by the Waiting room, the waiting room worker decides whether to send the user to the origin or the waiting room. This decision is made by making use of the waiting room state which gives an idea of how many users are on the origin.
The waiting room state changes continuously based on the traffic around the world. This information can be stored in a central location or changes can get propagated around the world eventually. Storing this information in a central location can add significant latency to each request as the central location can be really far from where the request is originating from. So every data center works with its own waiting room state which is a snapshot of the traffic pattern for the website around the world available at that point in time. Before letting a user into the website, we do not want to wait for information from everywhere else in the world as that adds significant latency to the request. This is the reason why we chose not to have a central location but have a pipeline where changes in traffic get propagated eventually around the world.
This pipeline which aggregates the waiting room state in the background is built on Cloudflare Durable Objects. In 2021, we wrote a blog talking about how the aggregation pipeline works and the different design decisions we took there if you are interested. This pipeline ensures that every data center gets updated information about changes in traffic within a few seconds.
The Waiting room has to make a decision whether to send users to the website or queue them based on the state that it currently sees. This has to be done while making sure we queue at the right time so that the customer's website does not get overloaded. We also have to make sure we do not queue too early as we might be queueing for a falsely suspected spike in traffic. Being in a queue could cause some users to abandon going to the website. Waiting Room runs on every server in Cloudflare’s network, which spans over 300 cities in more than 100 countries. We want to make sure, for every new user, the decision whether to go to the website or the queue is made with minimal latency.This is what makes the decision of when to queue a hard question for the waiting room. In this blog, we will cover how we approached that tradeoff. Our algorithm has evolved to decrease the false positives while continuing to respect the customer’s set limits.
How a waiting room decides when to queue users
The most important factor that determines when your waiting room will start queuing is how you configured the traffic settings. There are two traffic limits that you will set when configuring a waiting room–total active users and new users per minute.The total active users is a target threshold for how many simultaneous users you want to allow on the pages covered by your waiting room. New users per minute defines the target threshold for the maximum rate of user influx to your website per minute. A sharp spike in either of these values might result in queuing. Another configuration that affects how we calculate the total active users is session duration. A user is considered active for session duration minutes since the request is made to any page covered by a waiting room.
The graph below is from one of our internal monitoring tools for a customer and shows a customer's traffic pattern for 2 days. This customer has set their limits, new users per minute and total active users to 200 and 200 respectively.
If you look at their traffic you can see that users were queued on September 11th around 11:45. At that point in time, the total active users was around 200. As the total active users ramped down (around 12:30), the queued users progressed to 0. The queueing started again on September 11th around 15:00 when total active users got to 200. The users that were queued around this time ensured that the traffic going to the website is around the limits set by the customer.
Once a user gets access to the website, we give them an encrypted cookie which indicates they have already gained access. The contents of the cookie can look like this.
The cookie is like a ticket which indicates entry to the waiting room.The bucketId indicates which cluster of users this user is part of. The acceptedAt time and lastCheckInTime indicate when the last interaction with the workers was. This information can ensure if the ticket is valid for entry or not when we compare it with the session duration value that the customer sets while configuring the waiting room. If the cookie is valid, we let the user through which ensures users who are on the website continue to be able to browse the website. If the cookie is invalid, we create a new cookie treating the user as a new user and if there is queueing happening on the website they get to the back of the queue. In the next section let us see how we decide when to queue those users.
To understand this further, let's see what the contents of the waiting room state are. For the customer we discussed above, at the time "Mon, 11 Sep 2023 11:45:54 GMT", the state could look like this.
{
  "activeUsers": 50,
}
As mentioned above the customer’s configuration has new users per minute and total active users equal to 200 and 200 respectively.
So the state indicates that there is space for the new users as there are only 50 active users when it's possible to have 200. So there is space for another 150 users to go in. Let's assume those 50 users could have come from two data centers San Jose (20 users) and London (30 users). We also keep track of the number of workers that are active across the globe as well as the number of workers active at the data center in which the state is calculated. The state key below could be the one calculated at San Jose.
Imagine at the time "Mon, 11 Sep 2023 11:45:54 GMT", we get a request to that waiting room at a datacenter in San Jose.
To see if the user that reached San Jose can go to the origin we first check the traffic history in the past minute to see the distribution of traffic at that time. This is because a lot of websites are popular in certain parts of the world. For a lot of these websites the traffic tends to come from the same data centers.
Looking at the traffic history for the minute "Mon, 11 Sep 2023 11:44:00 GMT" we see San Jose has 20 users out of 200 users going there (10%) at that time. For the current time "Mon, 11 Sep 2023 11:45:54 GMT" we divide the slots available at the website at the same ratio as the traffic history in the past minute. So we can send 10% of 150 slots available from San Jose which is 15 users. We also know that there are three active workers as "dataCenterWorkersActive" is 3.
The number of slots available for the data center is divided evenly among the workers in the data center. So every worker in San Jose can send 15/3 users to the website. If the worker that received the traffic has not sent any users to the origin for the current minute they can send up to five users (15/3).
At the same time ("Mon, 11 Sep 2023 11:45:54 GMT"), imagine a request goes to a data center in Delhi. The worker at the data center in Delhi checks the trafficHistory and sees that there are no slots allotted for it. For traffic like this we have reserved the Anywhere slots as we are really far away from the limit.
The Anywhere slots are divided among all the active workers in the globe as any worker around the world can take a part of this pie. 75% of the remaining 150 slots which is 113.
The state key also keeps track of the number of workers (globalWorkersActive) that have spawned around the world. The Anywhere slots allotted are divided among all the active workers in the world if available. globalWorkersActive is 10 when we look at the waiting room state. So every active worker can send as many as 113/10 which is approximately 11 users. So the first 11 users that come to a worker in the minute Mon, 11 Sep 2023 11:45:00 GMT gets admitted to the origin. The extra users get queued. The extra reserved slots (5) in San Jose for minute Mon, 11 Sep 2023 11:45:00 GMT discussed before ensures that we can admit up to 16(5 + 11) users from a worker from San Jose to the website.
Queuing at the worker level can cause users to get queued before the slots available for the data center
As we can see from the example above, we decide whether to queue or not at the worker level. The number of new users that go to workers around the world can be non-uniform. To understand what can happen when there is non-uniform distribution of traffic to two workers, let us look at the diagram below.
Imagine the slots available for a data center in San Jose are ten. There are two workers running in San Jose. Seven users go to worker1 and one user goes to worker2. In this situation worker1 will let in five out of the seven workers to the website and two of them get queued as worker1 only has five slots available. The one user that shows up at worker2 also gets to go to the origin. So we queue two users, when in reality ten users can get sent from the datacenter San Jose when only eight users show up.
This issue while dividing slots evenly among workers results in queueing before a waiting room’s configured traffic limits, typically within 20-30% of the limits set. This approach has advantages which we will discuss next. We have made changes to the approach to decrease the frequency with which queuing occurs outside that 20-30% range, queuing as close to limits as possible, while still ensuring Waiting Room is prepared to catch spikes. Later in this blog, we will cover how we achieved this by updating how we allocate and count slots.
What is the advantage of workers making these decisions?
The example above talked about how a worker in San Jose and Delhi makes decisions to let users through to the origin. The advantage of making decisions at the worker level is that we can make decisions without any significant latency added to the request. This is because to make the decision, there is no need to leave the data center to get information about the waiting room as we are always working with the state that is currently available in the data center. The queueing starts when the slots run out within the worker. The lack of additional latency added enables the customers to turn on the waiting room all the time without worrying about extra latency to their users.
Waiting Room’s number one priority is to ensure that customer’s sites remain up and running at all times, even in the face of unexpected and overwhelming traffic surges. To that end, it is critical that a waiting room prioritizes staying near or below traffic limits set by the customer for that room. When a spike happens at one data center around the world, say at San Jose, the local state at the data center will take a few seconds to get to Delhi.
Splitting the slots among workers ensures that working with slightly outdated data does not cause the overall limit to be exceeded by an impactful amount. For example, the activeUsers value can be 26 in the San Jose data center and 100 in the other data center where the spike is happening. At that point in time, sending extra users from Delhi may not overshoot the overall limit by much as they only have a part of the pie to start with in Delhi. Therefore, queueing before overall limits are reached is part of the design to make sure your overall limits are respected. In the next section we will cover the approaches we implemented to queue as close to limits as possible without increasing the risk of exceeding traffic limits.
Allocating more slots when traffic is low relative to waiting room limits
The first case we wanted to address was queuing that occurs when traffic is far from limits. While rare and typically lasting for one refresh interval (20s) for the end users who are queued, this was our first priority when updating our queuing algorithm. To solve this, while allocating slots we looked at the utilization (how far you are from traffic limits) and allotted more slots when traffic is really far away from the limits. The idea behind this was to prevent the queueing that happens at lower limits while still being able to readjust slots available per worker when there are more users on the origin.
To understand this let's revisit the example where there is non-uniform distribution of traffic to two workers. So two workers similar to the one we discussed before are shown below. In this case the utilization is low (10%). This means we are far from the limits. So the slots allocated(8) are closer to the slotsAvailable for the datacenter San Jose which is 10. As you can see in the diagram below, all the eight users that go to either worker get to reach the website with this modified slot allocation as we are providing more slots per worker at lower utilization levels.
The diagram below shows how the slots allocated per worker changes with utilization (how far you are away from limits). As you can see here, we are allocating more slots per worker at lower utilization. As the utilization increases, the slots allocated per worker decrease as it’s getting closer to the limits, and we are better prepared for spikes in traffic. At 10% utilization every worker gets close to the slots available for the data center. As the utilization is close to 100% it becomes close to the slots available divided by worker count in the data center.
How do we achieve more slots at lower utilization?
This section delves into the mathematics which helps us get there. If you are not interested in these details, meet us at the “Risk of over provisioning” section.
To understand this further, let's revisit the previous example where requests come to the Delhi data center. The activeUsers value is 50, so utilization is 50/200 which is around 25%.
The idea is to allocate more slots at lower utilization levels. This ensures that customers do not see unexpected queueing behaviors when traffic is far away from limits. At time Mon, 11 Sep 2023 11:45:54 GMT requests to Delhi are at 25% utilization based on the local state key.
To allocate more slots to be available at lower utilization we added a workerMultiplier which moves proportionally to the utilization. At lower utilization the multiplier is lower and at higher utilization it is close to one.
utilization – how far away from the limits you are.
curveFactor – is the exponent which can be adjusted which decides how aggressive we are with the distribution of extra budgets at lower worker counts. To understand this let's look at the graph of how y = x and y = x^2 looks between values 0 and 1.
The graph for y=x is a straight line passing through (0, 0) and (1, 1).
The graph for y=x^2 is a curved line where y increases slower than x when x < 1 and passes through (0, 0) and (1, 1)
Using the concept of how the curves work, we derived the formula for workerCountMultiplier where y=workerCountMultiplier,x=utilization and curveFactor is the power which can be adjusted which decides how aggressive we are with the distribution of extra budgets at lower worker counts. When curveFactor is 1, the workerMultiplier is equal to the utilization.
Let's come back to the example we discussed before and see what the value of the curve factor will be. At time Mon, 11 Sep 2023 11:45:54 GMT requests to Delhi are at 25% utilization based on the local state key. The Anywhere slots are divided among all the active workers in the globe as any worker around the world can take a part of this pie. i.e. 75% of the remaining 150 slots (113).
globalWorkersActive is 10 when we look at the waiting room state. In this case we do not divide the 113 slots by 10 but instead divide by the adapted worker count which is globalWorkersActive * workerMultiplier. If curveFactor is 1, the workerMultiplier is equal to the utilization which is at 25% or 0.25.
So effective workerCount = 10 * 0.25 = 2.5
So, every active worker can send as many as 113/2.5 which is approximately 45 users. The first 45 users that come to a worker in the minute Mon, 11 Sep 2023 11:45:00 GMT gets admitted to the origin. The extra users get queued.
Therefore, at lower utilization (when traffic is farther from the limits) each worker gets more slots. But, if the sum of slots are added up, there is a higher chance of exceeding the overall limit.
Risk of over provisioning
The method of giving more slots at lower limits decreases the chances of queuing when traffic is low relative to traffic limits. However, at lower utilization levels a uniform spike happening around the world could cause more users to go into the origin than expected. The diagram below shows the case where this can be an issue. As you can see the slots available are ten for the data center. At 10% utilization we discussed before, each worker can have eight slots each. If eight users show up at one worker and seven show up at another, we will be sending fifteen users to the website when only ten are the maximum available slots for the data center.
With the range of customers and types of traffic we have, we were able to see cases where this became a problem. A traffic spike from low utilization levels could cause overshooting of the global limits. This is because we are over provisioned at lower limits and this increases the risk of significantly exceeding traffic limits. We needed to implement a safer approach which would not cause limits to be exceeded while also decreasing the chance of queueing when traffic is low relative to traffic limits.
Taking a step back and thinking about our approach, one of the assumptions we had was that the traffic in a data center directly correlates to the worker count that is found in a data center. In practice what we found is that this was not true for all customers. Even if the traffic correlates to the worker count, the new users going to the workers in the data centers may not correlate. This is because the slots we allocate are for new users but the traffic that a data center sees consists of both users who are already on the website and new users trying to go to the website.
In the next section we are talking about an approach where worker counts do not get used and instead workers communicate with other workers in the data center. For that we introduced a new service which is a durable object counter.
Decrease the number of times we divide the slots by introducing Data Center Counters
From the example above, we can see that overprovisioning at the worker level has the risk of using up more slots than what is allotted for a data center. If we do not over provision at low levels we have the risk of queuing users way before their configured limits are reached which we discussed first. So there has to be a solution which can achieve both these things.
The overprovisioning was done so that the workers do not run out of slots quickly when an uneven number of new users reach a bunch of workers. If there is a way to communicate between two workers in a data center, we do not need to divide slots among workers in the data center based on worker count. For that communication to take place, we introduced counters. Counters are a bunch of small durable object instances that do counting for a set of workers in the data center.
To understand how it helps with avoiding usage of worker counts, let's check the diagram below. There are two workers talking to a Data Center Counter below. Just as we discussed before, the workers let users through to the website based on the waiting room state. The count of the number of users let through was stored in the memory of the worker before. By introducing counters, it is done in the Data Center Counter. Whenever a new user makes a request to the worker, the worker talks to the counter to know the current value of the counter. In the example below for the first new request to the worker the counter value received is 9. When a data center has 10 slots available, that will mean the user can go to the website. If the next worker receives a new user and makes a request just after that, it will get a value 10 and based on the slots available for the worker, the user will get queued.
The Data Center Counter acts as a point of synchronization for the workers in the waiting room. Essentially, this enables the workers to talk to each other without really talking to each other directly. This is similar to how a ticketing counter works. Whenever one worker lets someone in, they request tickets from the counter, so another worker requesting the tickets from the counter will not get the same ticket number. If the ticket value is valid, the new user gets to go to the website. So when different numbers of new users show up at workers, we will not over allocate or under allocate slots for the worker as the number of slots used is calculated by the counter which is for the data center.
The diagram below shows the behavior when an uneven number of new users reach the workers, one gets seven new users and the other worker gets one new user. All eight users that show up at the workers in the diagram below get to the website as the slots available for the data center is ten which is below ten.
This also does not cause excess users to get sent to the website as we do not send extra users when the counter value equals the slotsAvailable for the data center. Out of the fifteen users that show up at the workers in the diagram below ten will get to the website and five will get queued which is what we would expect.
Risk of over provisioning at lower utilization also does not exist as counters help workers to communicate with each other.
To understand this further, let's look at the previous example we talked about and see how it works with the actual waiting room state.
The waiting room state for the customer is as follows.
The objective is to not divide the slots among workers so that we don’t need to use that information from the state. At time Mon, 11 Sep 2023 11:45:54 GMT requests come to San Jose. So, we can send 10% of 150 slots available from San Jose which is 15.
The durable object counter at San Jose keeps returning the counter value it is at right now for every new user that reaches the data center. It will increment the value by 1 after it returns to a worker. So the first 15 new users that come to the worker get a unique counter value. If the value received for a user is less than 15 they get to use the slots at the data center.
Once the slots available for the data center runs out, the users can make use of the slots allocated for Anywhere data-centers as these are not reserved for any particular data center. Once a worker in San Jose gets a ticket value that says 15, it realizes that it's not possible to go to the website using the slots from San Jose.
The Anywhere slots are available for all the active workers in the globe i.e. 75% of the remaining 150 slots (113). The Anywhere slots are handled by a durable object that workers from different data centers can talk to when they want to use Anywhere slots. Even if 128 (113 + 15) users end up going to the same worker for this customer we will not queue them. This increases the ability of Waiting Room to handle an uneven number of new users going to workers around the world which in turn helps the customers to queue close to the configured limits.
Why do counters work well for us?
When we built the Waiting Room, we wanted the decisions for entry into the website to be made at the worker level itself without talking to other services when the request is in flight to the website. We made that choice to avoid adding latency to user requests. By introducing a synchronization point at a durable object counter, we are deviating from that by introducing a call to a durable object counter.
However, the durable object for the data center stays within the same data center. This leads to minimal additional latency which is usually less than 10 ms. For the calls to the durable object that handles Anywhere data centers, the worker may have to cross oceans and long distances. This could cause the latency to be around 60 or 70 ms in those cases. The 95th percentile values shown below are higher because of calls that go to farther data centers.
The design decision to add counters adds a slight extra latency for new users going to the website. We deemed the trade-off acceptable because this reduces the number of users that get queued before limits are reached. In addition, the counters are only required when new users try to go into the website. Once new users get to the origin, they get entry directly from workers as the proof of entry is available in the cookies that the customers come with, and we can let them in based on that.
Counters are really simple services which do simple counting and do nothing else. This keeps the memory and CPU footprint of the counters minimal. Moreover, we have a lot of counters around the world handling the coordination between a subset of workers.This helps counters to successfully handle the load for the synchronization requirements from the workers. These factors add up to make counters a viable solution for our use case.
Summary
Waiting Room was designed with our number one priority in mind–to ensure that our customers’ sites remain up and running, no matter the volume or ramp up of legitimate traffic. Waiting Room runs on every server in Cloudflare’s network, which spans over 300 cities in more than 100 countries. We want to make sure, for every new user, the decision whether to go to the website or the queue is made with minimal latency and is done at the right time. This decision is a hard one as queuing too early at a data center can cause us to queue earlier than the customer set limits. Queuing too late can cause us to overshoot the customer set limits.
With our initial approach where we divide slots among our workers evenly we were sometimes queuing too early but were pretty good at respecting customer set limits. Our next approach of giving more slots at low utilization (low traffic levels compared to customer limits) ensured that we did better at the cases where we queued earlier than the customer set limits as every worker has more slots to work with at each worker. But as we have seen, this made us more likely to overshoot when a sudden spike in traffic occurred after a period of low utilization.
With counters we are able to get the best of both worlds as we avoid the division of slots by worker counts. Using counters we are able to ensure that we do not queue too early or too late based on the customer set limits. This comes at the cost of a little bit of latency to every request from a new user which we have found to be negligible and creates a better user experience than getting queued early.
We keep iterating on our approach to make sure we are always queuing people at the right time and above all protecting your website. As more and more customers are using the waiting room, we are learning more about different types of traffic and that is helping the product be better for everyone.
В Село Марково пак недоволстват хората, че нямало рейс.
Лошото е, че само се констатира без да се потърси реалния проблем. А без да се дефинира няма как да бъде решен.
Понеже в групата на с. Марково не ми одобряват публикациите (май причината е някакви политически възгледи на админите) я поствам на моята стена и моля някой, който има достъп, да я шерне.
Та има една фирма – Хеброс Бус, която би трябвало да осъществява превоза от с. Марково до гр. Пловдив по предварително договорен график.
Злите езици обаче кават, че тази фирма има договор с Община Пловдив, а не с Община Родопи, където е с. Марково. Евала на местните жители и кметицата, че се организират и дават гласност на проблема, обаче надали той ще се реши от кмета на Община Родопи, просто защото реално няма визия за решението му.
Между другото същият проблем съществува във всички останали села от Община Родопи, но само с. Марково повдига този въпрос публично (респект за което).
Какъв е случаят и каква си решенията?
Фирмата Хебрус бус има договор с Община Пловдив за извършването на тези превози, а не с Община Родопи. Ако на администрацията на Родопи това не и харесва, може тя да си подпише договор с друг превозвач, но това няма как да стане по няколко причини.
Първо този превозвач трябва да спира на някоя автогара и то в пределите на гр. Пловдив. Тоест те ще бъдат на 100% зависими от Община Пловдив, а не от Родопи, защото няма да имат Автогара където да оперират.
Да преположим, колкото и да е невероятно, че Община Пловдив се съгласи и определи Автогара за целта (макар в Пловдив мисля, че остана само една Общинска Автогара – от другата страна на града), тогава „ползите” от договорът за превоз ще се взимат от Община Родопи, а Пловдив само ще обслужва „за сините им очи”. Но нека предположим, че изобщо не иде реч за „ползи”, колкото и смело да е това предположение. То тогава по пътя на логиката, Пловдив ще се наложи да „забие” толкова тлъста такса на този нов оператор, че жителите на Община Родопи надали ще могат и искат да я плащат. И това ще е нормално. В случая с Хебрус бус автогарата си е тяхна и поне за това не плащат. Дори и в най-смелите си мечти не виждам как Община Пловдив ще се съгласи да предостави парцел и обслужване на оператор, който се е „заиграл” със съседната община.
Нали не сте забравили за референдума в Белащица, който уж бил незаконен, пък се оказа съвсем законен, според Областия управител? Виж ако Белащица е част от Пловдив, то тогава ще си има и градски транспорт, което е и първото възможно решение на проблема.
Но на повечето хора това решение не им се струва удачно, защото данъкът МПС в Родопи е по-нисък и това им е по-важно. Само да уточня, защото з атов аще говорим в друг материал – данъкът е веднъж годишно, а транспорта ежедневен.
Уточнихме вече, че няма как превозвач да има договор с Община Родопи, а да се обслужва от Община Пловдив. Мисля, че по този въпрос две мнения няма или поне не би трябвало да има. Но ако има, то тогава приемете, че написаното до тук са пълни глупости и не си губете времето с по-нататъчно четене.
Ако обаче сте схванали идеята и сте на мнение, че има резон, то тогава нека разгледаме варианта с обществен превозвач. Тоест Община Родопи закупува бусове или маршрутки и създава Общинско предприятие. Да си призная честно, като знам капацитета на администрацията и най-вече липсата на всякаква визия мисля направо да отхвърля този вариант и да не го обсъждам. Излишно е. Тук се опитваме да направим анализ, а не да развиваме фантастични истории. Финансирането на това начинане пък съвсем не е по силите на община Родопи. Така е по-цял свят – превозвачът или е с договор от Областта или е държавен.
Друг изключително съществен проблем е дотацията и цената на билета. У наше село – Бойково (пак в община Родопи), транспортът е спонсориран. Плащат се по 3.00 лв (мисля) за 12 места при всеки курс. Има, няма хора на превозвача са гарантирани тези 36 лева (или нещо подобно).
Сега моля всеки с ръка на сърцето да си каже, колко са му важни 36 лева на курс, в които се включват гориво, заплата, осигуровка, печалба и амортизация, м? Като имате предвид обаче, че пътят е планински – завои, дупки, наклони…
Аз ще Ви кажа как расъждава един превозвач. „- То шофьора го няма днес, пък и да е тук, кой знае колко хора ще се качат… Я изкарам 20-30 лева от тоя курс, я не. По-добре да го чакам да се върне на работа, вместо да поддържам още един шофьор.”
Как се решава този проблем ли? Ами Община Родопи се бърка с една допълнителна дотация за всеки курс и тогава на превозвача започва да му пука дали ще направи курса или не.
Е да де, ама то бюджета на общината е изпълнен едва на 55%. Откъде да дойдат тези пари?
А и кметовете на селата като гледам не се заинтересуваха много от изпълнението на бюджета. Познайте кой кмет единствено присъства на заседанието за отчета на изпълнението на Бюджет 2022? – Правилно, единствено кметицата на с. Марково. И двама общински съветници въпреки, че тяхна е работата да контролират и гласуват този бюджет. Но за тази среща ще направя отделно видео, понеже е важно да знаете защо няма пари за това и онова във Вашето село.
Е как искате тогава да имате редовен траспорт бе хора? Мислите ли, че друга фирма ще е по-съвестна при този начин на заплащане?
А мислите ли, че при 55% изпълнение на бюджета ще можете да си позволите разходи за дотации на транспорт?
Айде… казахме, че към Пловдив няма да се присъдиняваме и не можем да разчитаме на градски транспорт, който между другото и в Пловдив е гола вода, но май е по-добър от междуградския.
За срещa с мен моля използвайте посочената форма.
[contact-form-7]
Ако очакваме, че с констатация ще се промени нещо, жестоко се лъжем. На срещите за бюджета и неговия отчет сме обикновено по 5-10 човка граждани. А тези заседания не случайно са регламентирани по закон. Те са предвидени за да можем да упражняваме контрол, доколкото можем. Ами ние и това не правим. Ами няма как да се промени нещо, ако ние самите не направим или не изискаме нещо да се промени.
Да…! възможно е да се намери някакво временно решение до изборите (примерно), но лично аз и в това се съмнявам. Въпреки че от друга страна в тази община PR-ът е издигнат в култ, та не се знае. Едно е сигурно обаче – дългосрочно не са на лице предпоставките проблемът с транспорта да се реши. Няма я и визията. PR – ДА, Визия – НЕ!
In April, Cybersecurity Ventures reported on extreme cybersecurity job shortage:
Global cybersecurity job vacancies grew by 350 percent, from one million openings in 2013 to 3.5 million in 2021, according to Cybersecurity Ventures. The number of unfilled jobs leveled off in 2022, and remains at 3.5 million in 2023, with more than 750,000 of those positions in the U.S. Industry efforts to source new talent and tackle burnout continues, but we predict that the disparity between demand and supply will remain through at least 2025.
The numbers never made sense to me, and Ben Rothke has dug in and explained the reality:
…there is not a shortage of security generalists, middle managers, and people who claim to be competent CISOs. Nor is there a shortage of thought leaders, advisors, or self-proclaimed cyber subject matter experts. What there is a shortage of are computer scientists, developers, engineers, and information security professionals who can code, understand technical security architecture, product security and application security specialists, analysts with threat hunting and incident response skills. And this is nothing that can be fixed by a newbie taking a six-month information security boot camp.
[…]
Most entry-level roles tend to be quite specific, focused on one part of the profession, and are not generalist roles. For example, hiring managers will want a network security engineer with knowledge of networks or an identity management analyst with experience in identity systems. They are not looking for someone interested in security.
In fact, security roles are often not considered entry-level at all. Hiring managers assume you have some other background, usually technical before you are ready for an entry-level security job. Without those specific skills, it is difficult for a candidate to break into the profession. Job seekers learn that entry-level often means at least two to three years of work experience in a related field.
That makes a lot more sense, and matches what I experience.
To provide the best experiences, we use technologies like cookies to store and/or access device information. Consenting to these technologies will allow us to process data such as browsing behavior or unique IDs on this site. Not consenting or withdrawing consent, may adversely affect certain features and functions.
Functional
Always active
The technical storage or access is strictly necessary for the legitimate purpose of enabling the use of a specific service explicitly requested by the subscriber or user, or for the sole purpose of carrying out the transmission of a communication over an electronic communications network.
Preferences
The technical storage or access is necessary for the legitimate purpose of storing preferences that are not requested by the subscriber or user.
Statistics
The technical storage or access that is used exclusively for statistical purposes.The technical storage or access that is used exclusively for anonymous statistical purposes. Without a subpoena, voluntary compliance on the part of your Internet Service Provider, or additional records from a third party, information stored or retrieved for this purpose alone cannot usually be used to identify you.
Marketing
The technical storage or access is required to create user profiles to send advertising, or to track the user on a website or across several websites for similar marketing purposes.
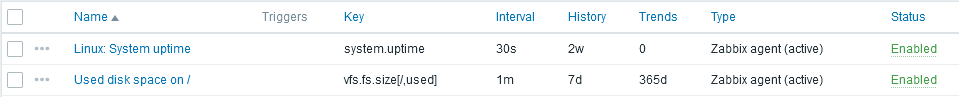
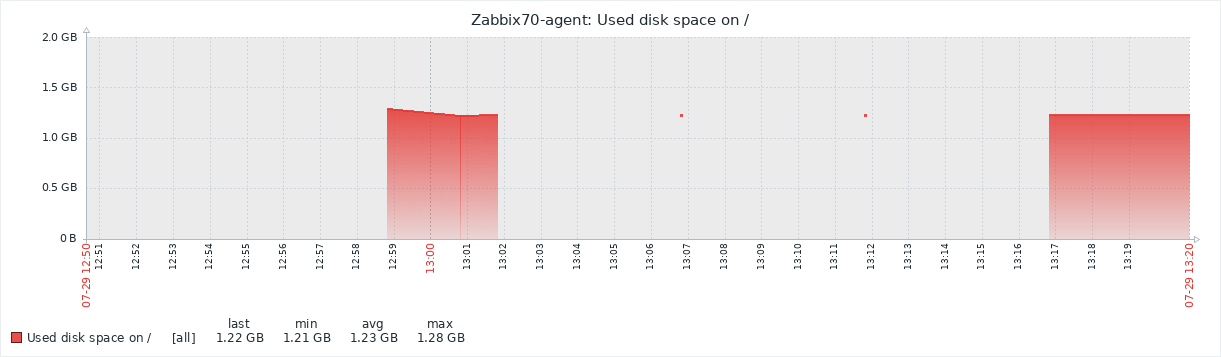
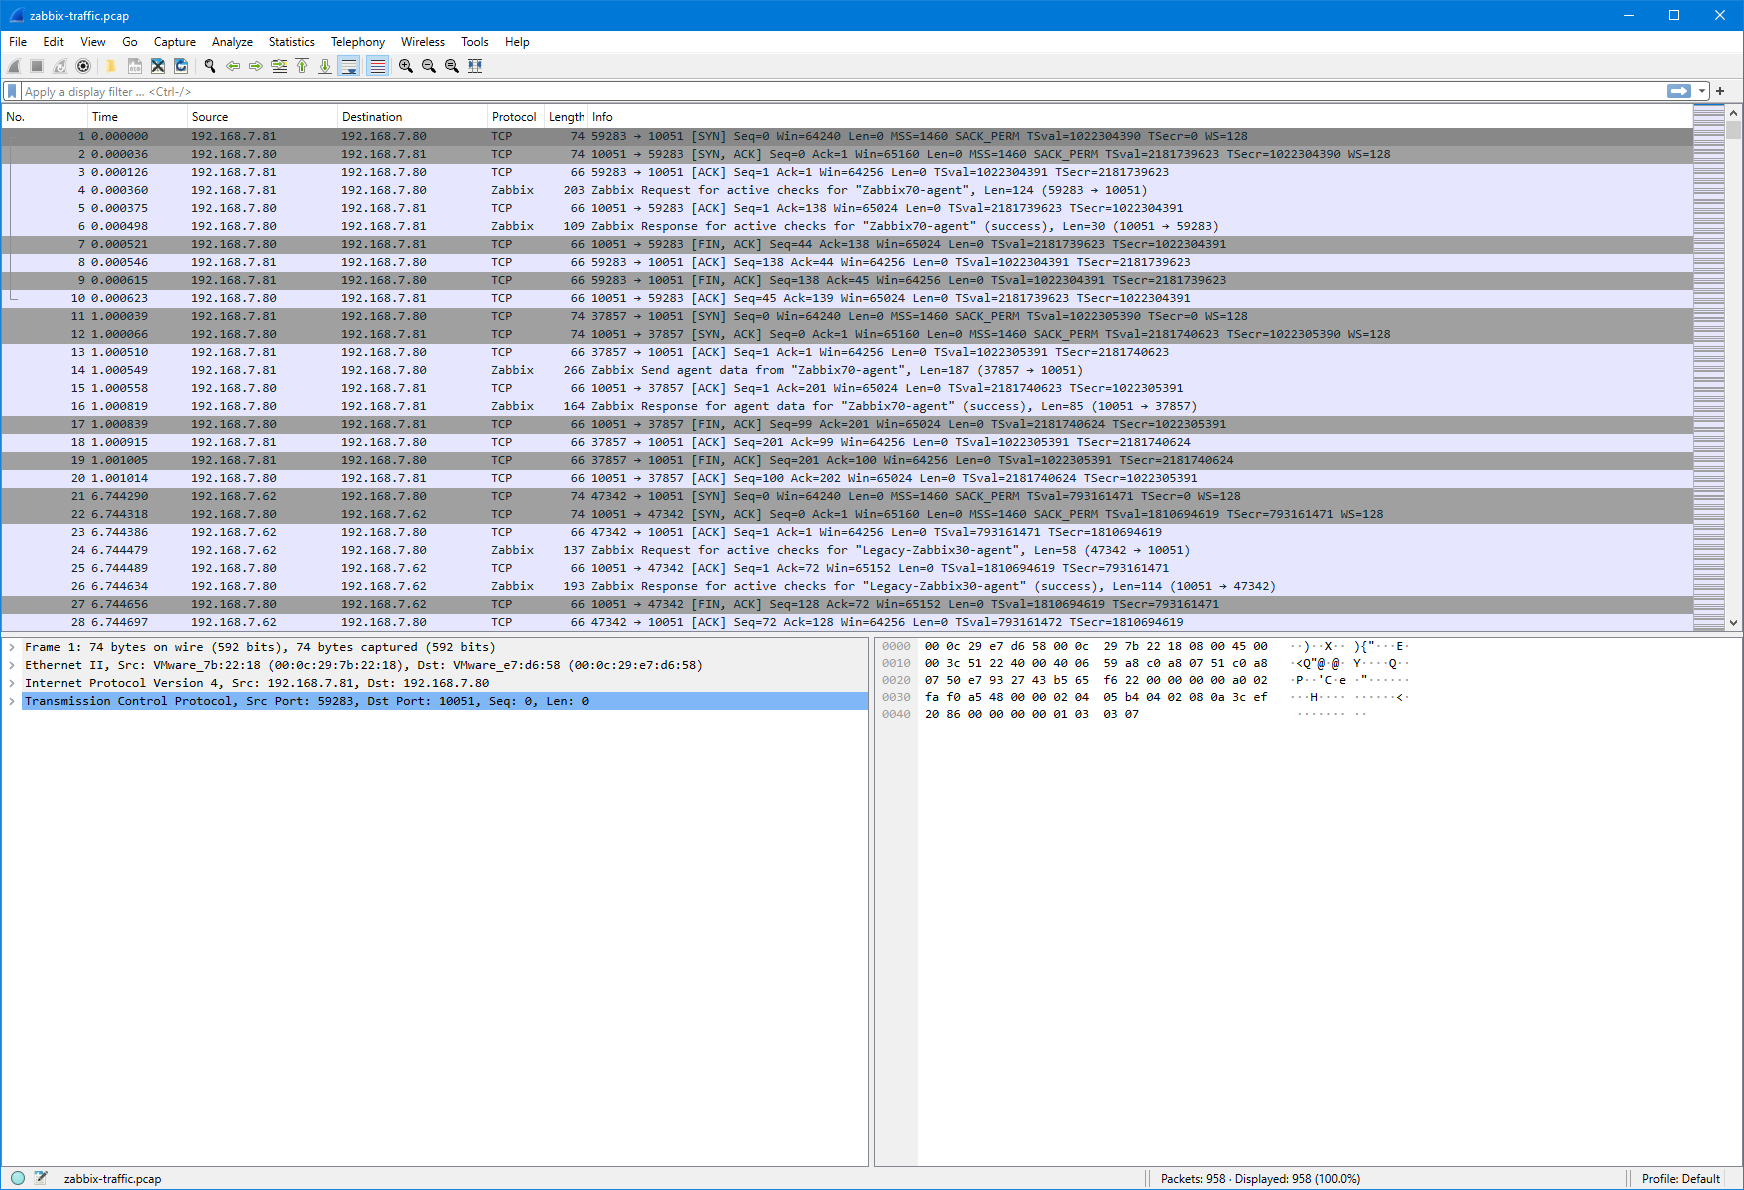
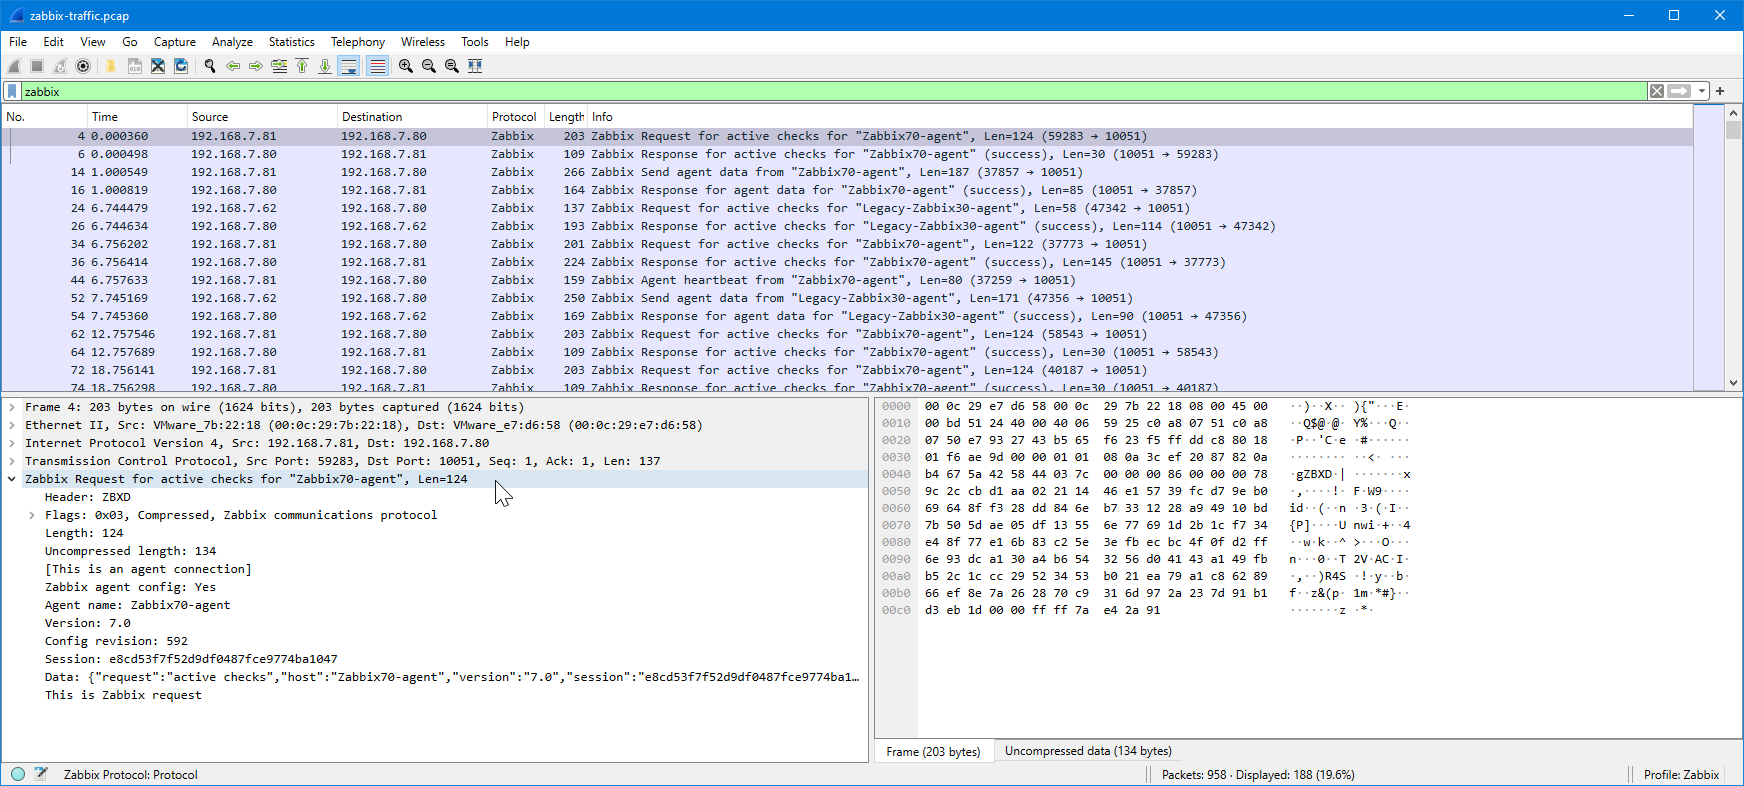
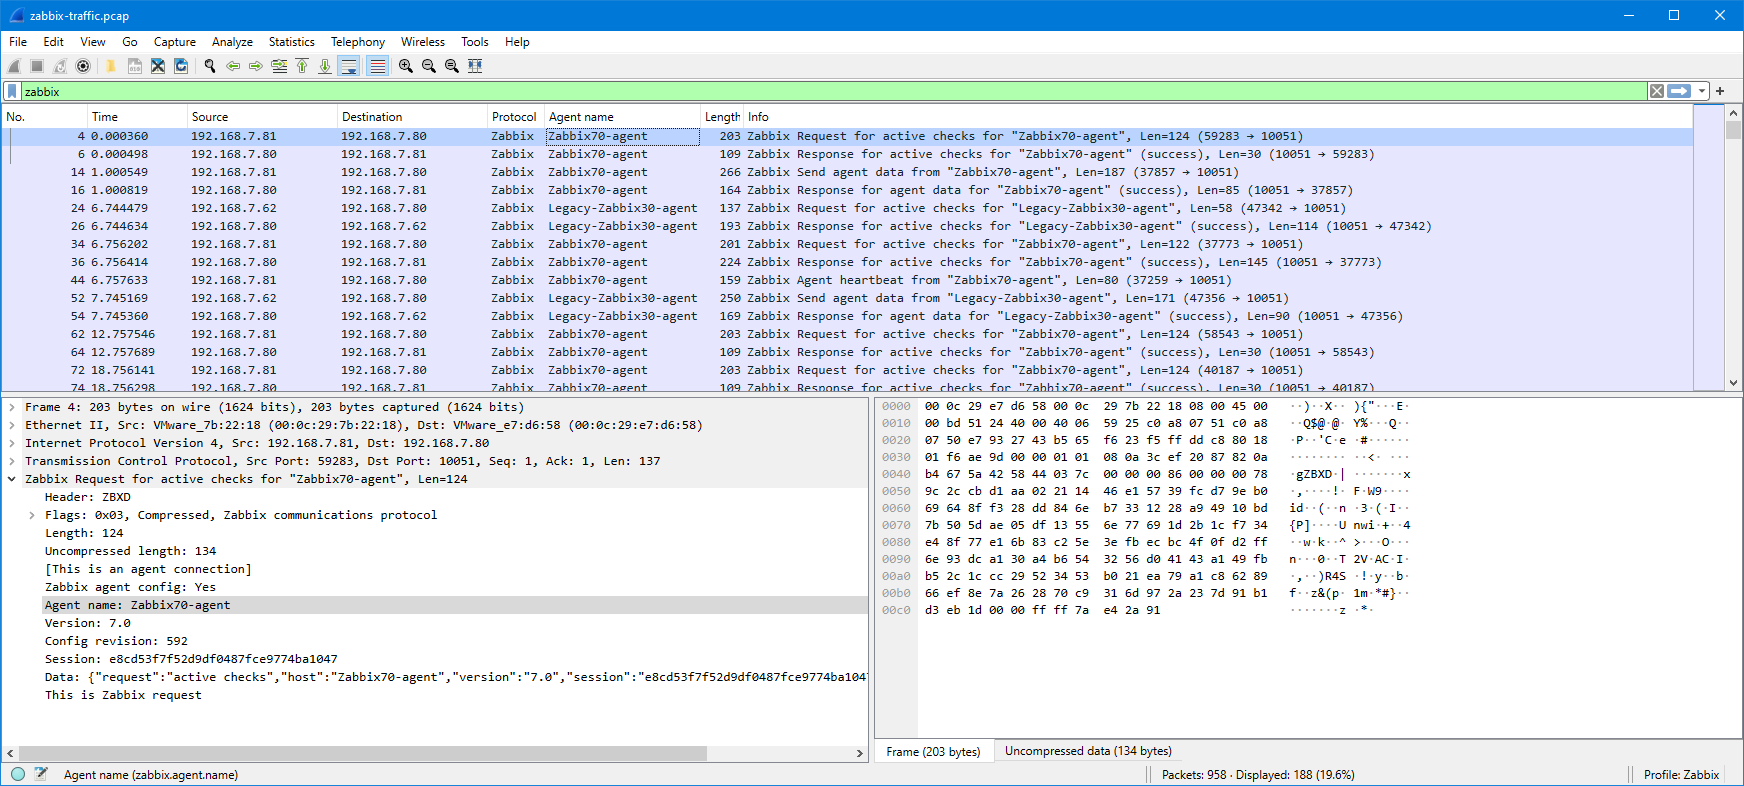
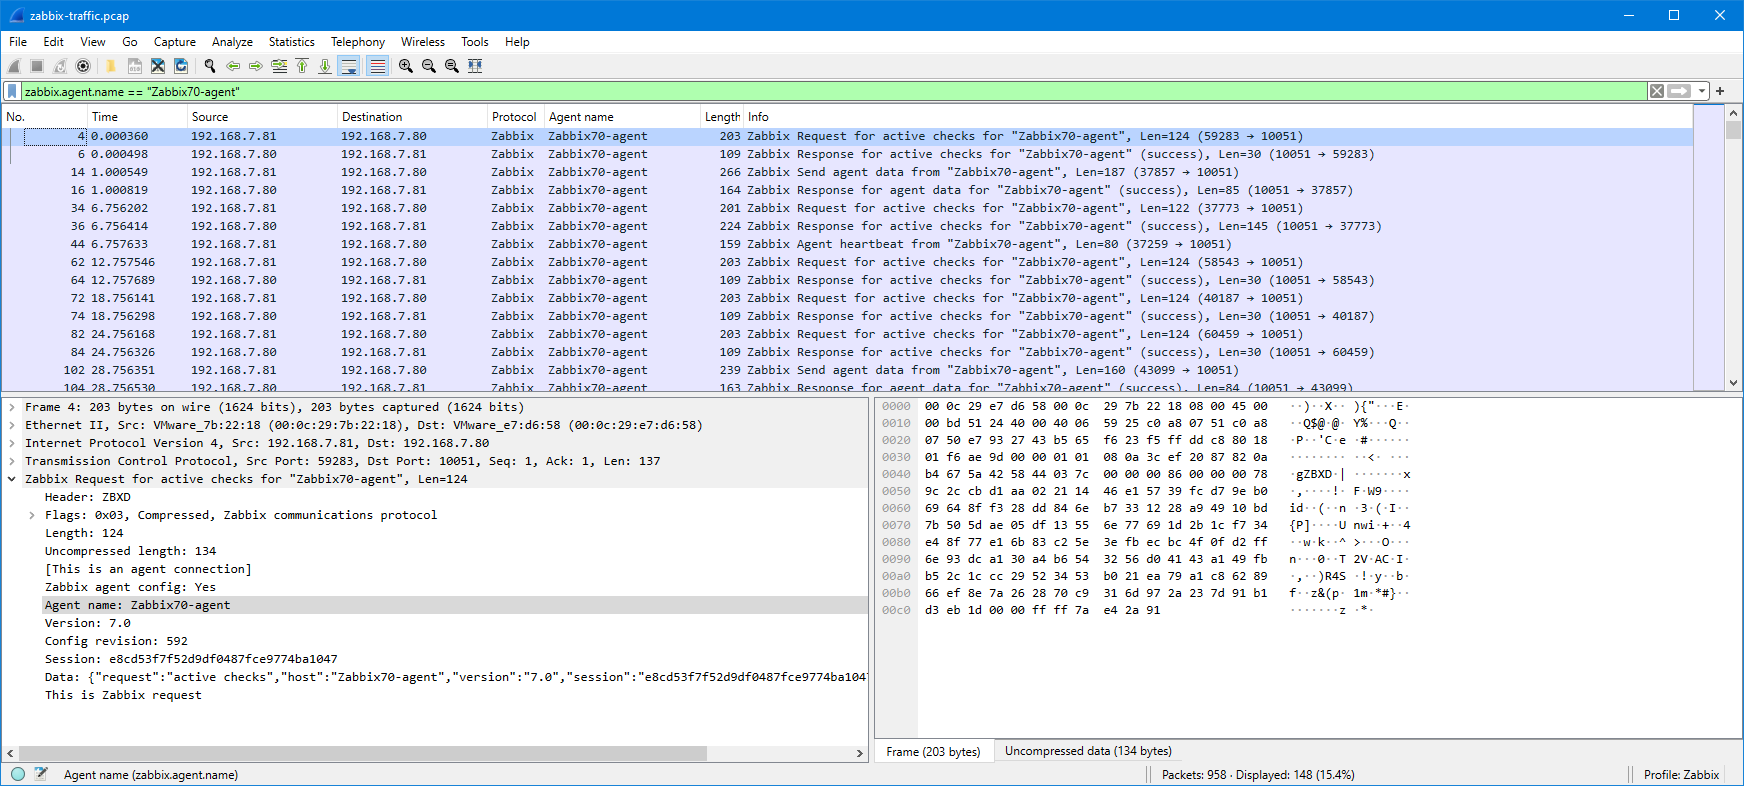
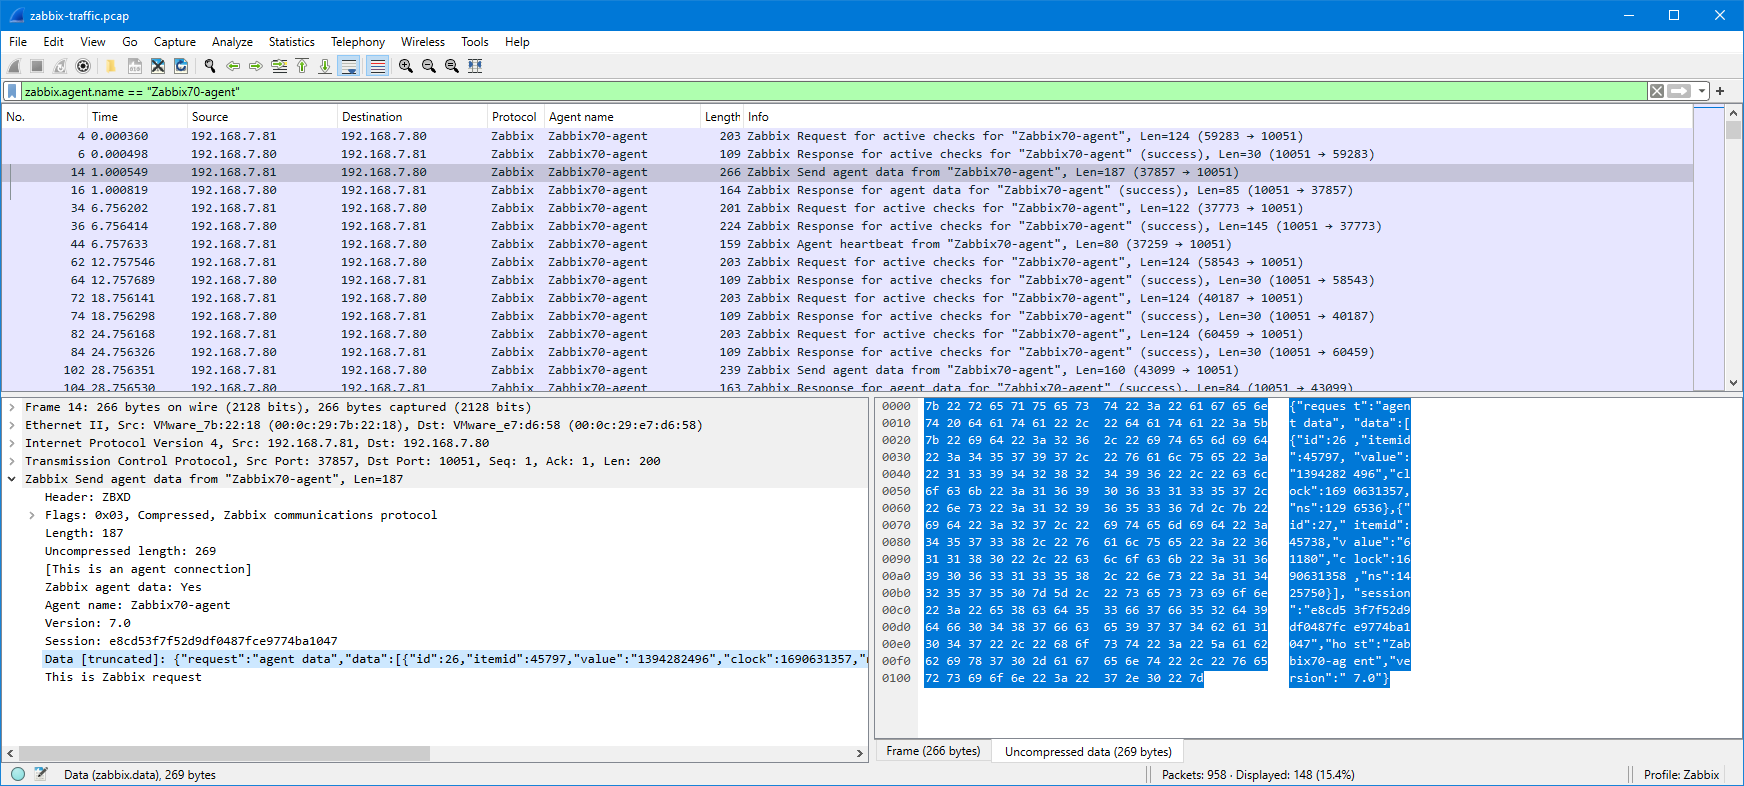
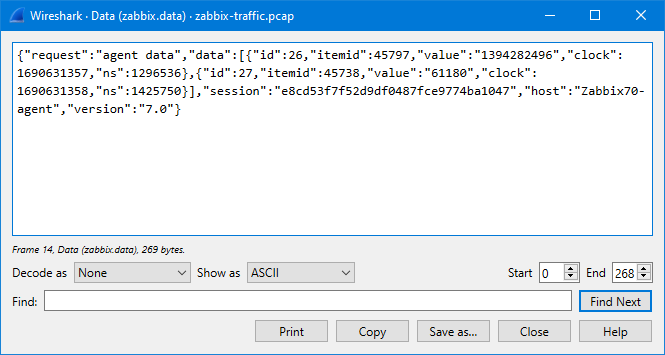
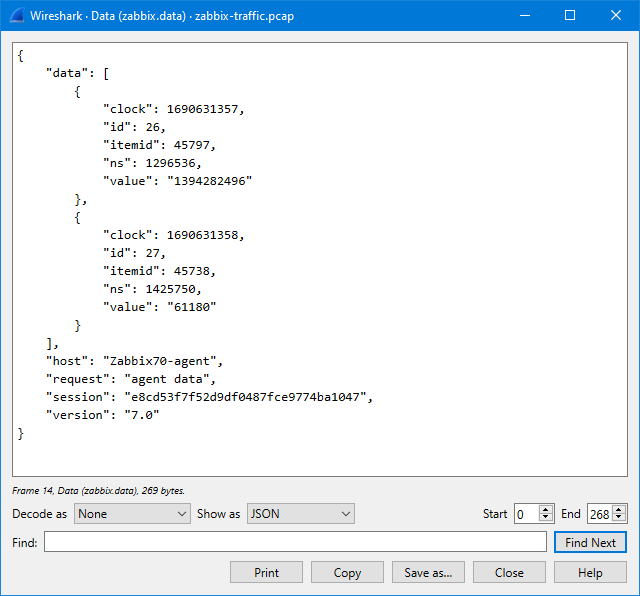
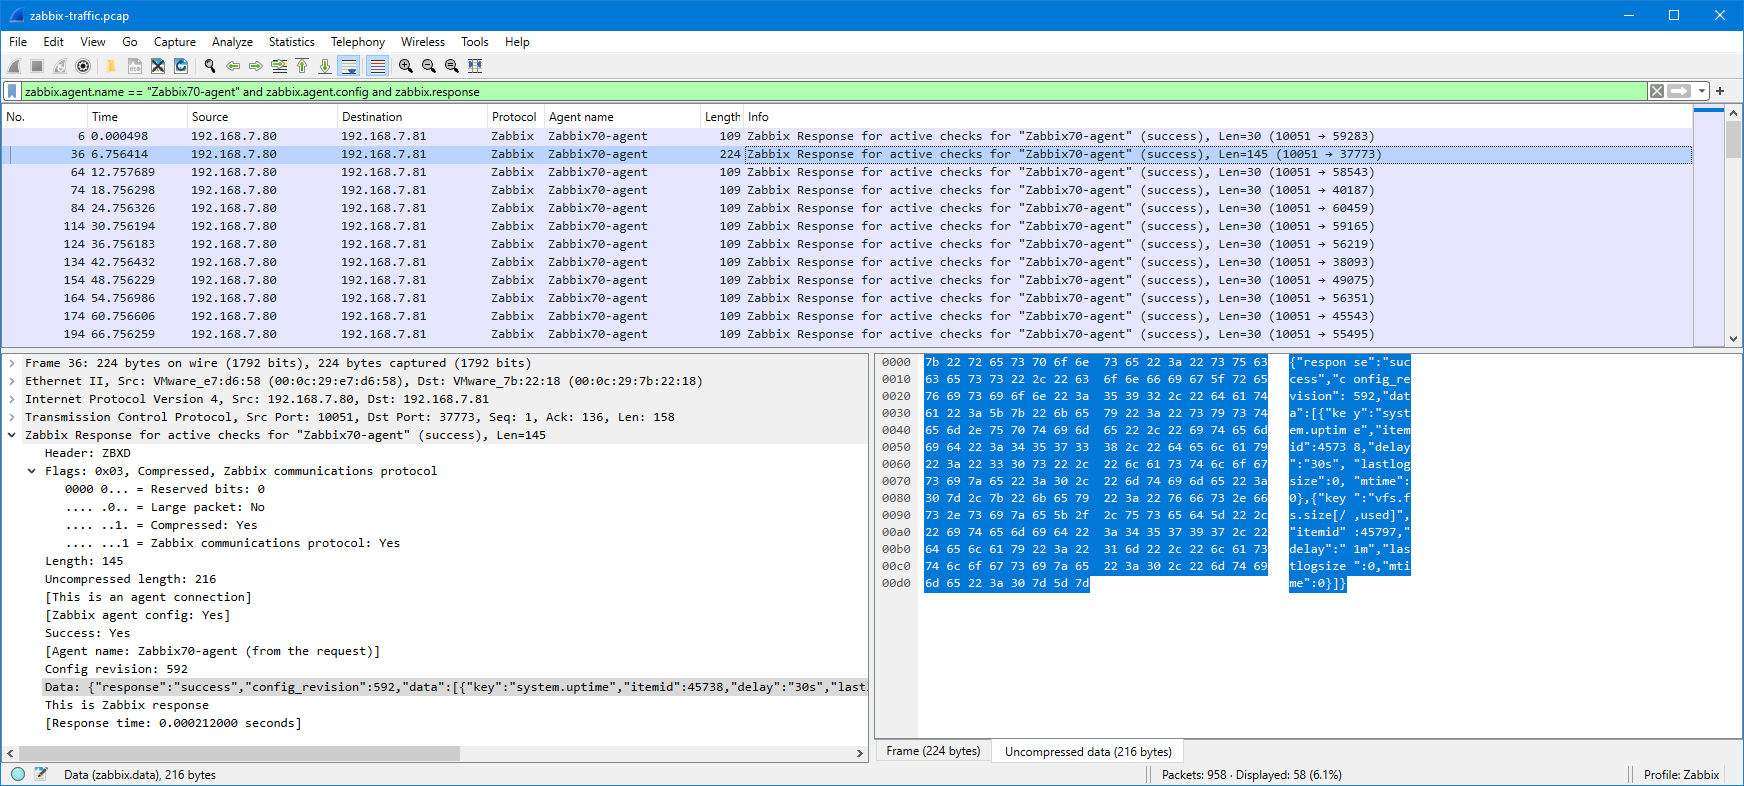
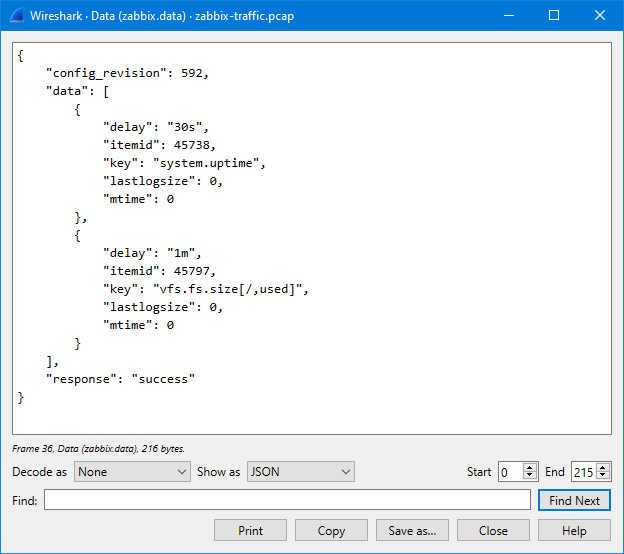
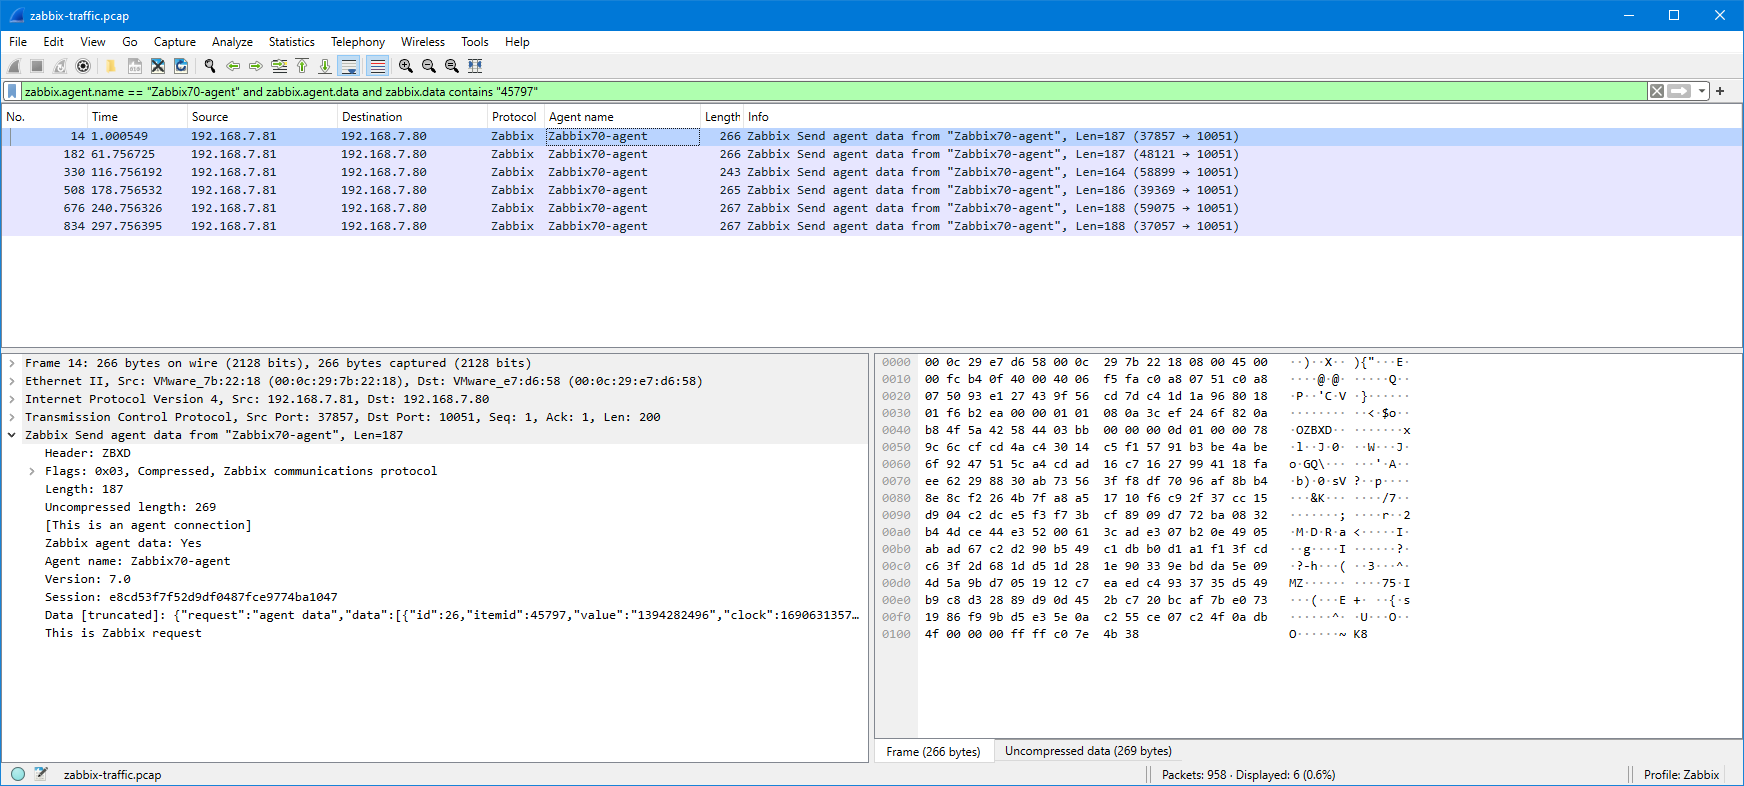
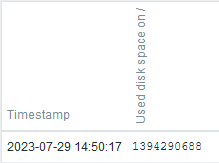
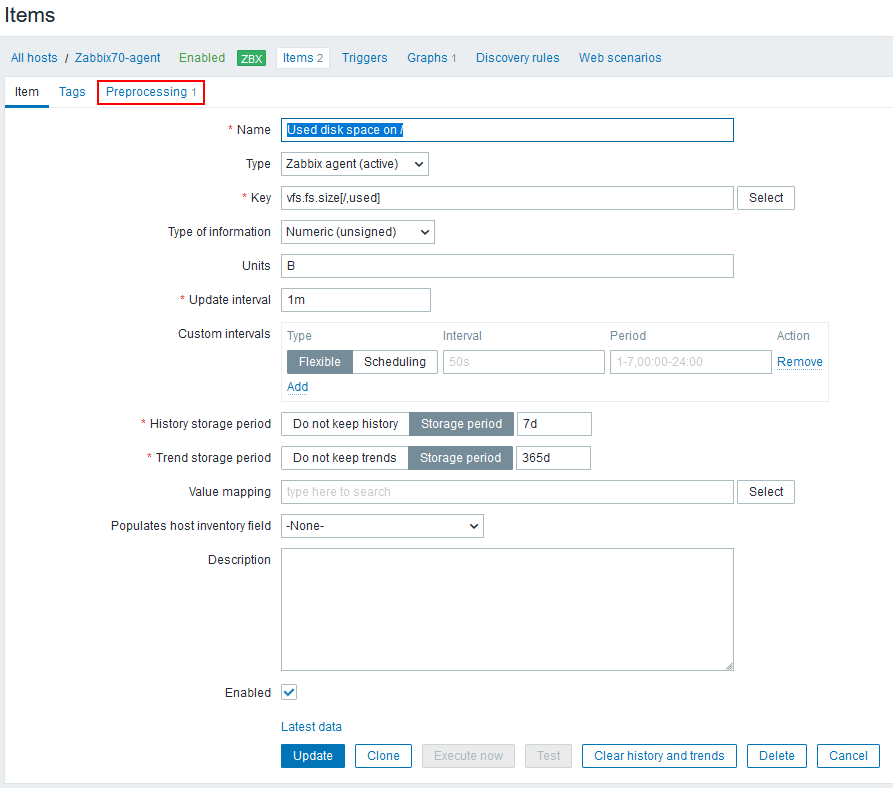
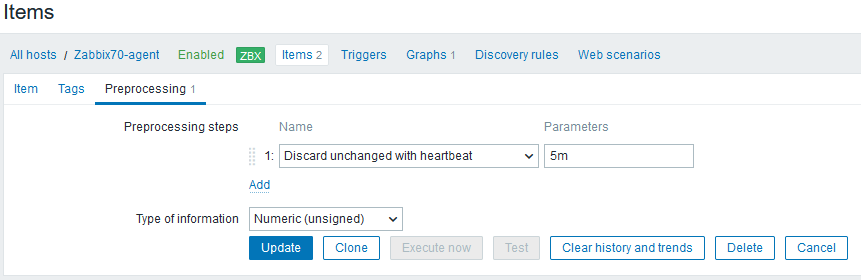


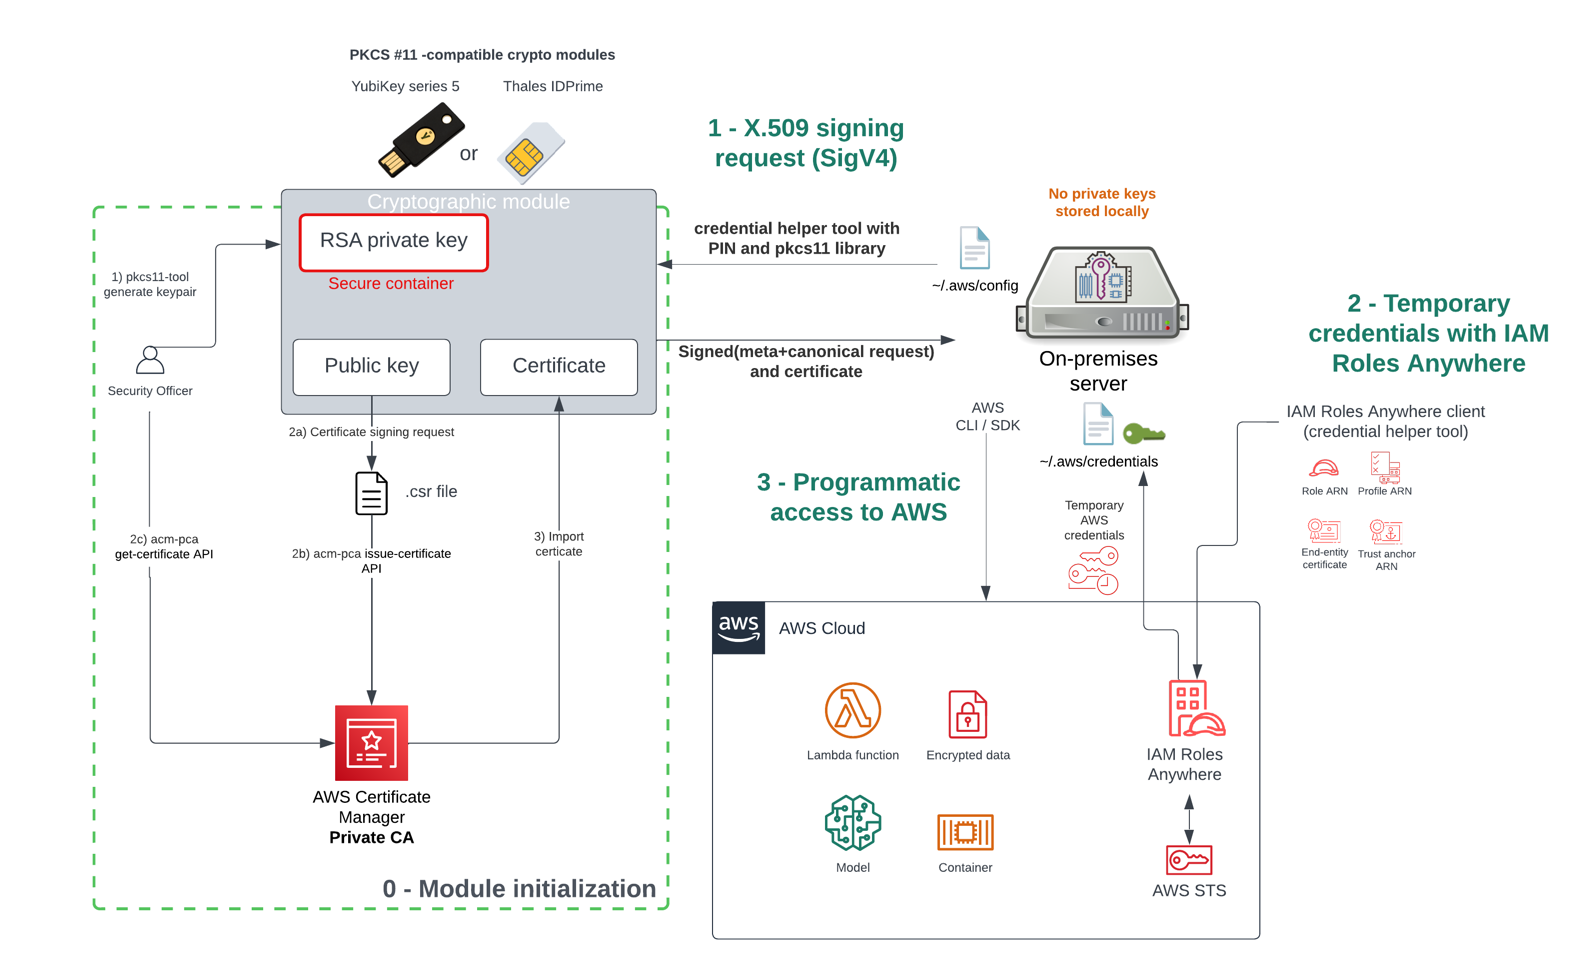


 Annie Nelson is a Senior Solutions Architect at AWS. She is a data enthusiast who enjoys problem solving and tackling complex architectural challenges with customers.
 Keerthi Chadalavada is a Senior Software Development Engineer at AWS Glue. She is passionate about designing and building end-to-end solutions to address customer data integration and analytic needs.
 Zach Mitchell is a Sr. Big Data Architect. He works within the product team to enhance understanding between product engineers and their customers while guiding customers through their journey to develop their enterprise data architecture on AWS.
 Gal Heyne is a Product Manager for AWS Glue with a strong focus on AI/ML, data engineering and BI. She is passionate about developing a deep understanding of customer’s business needs and collaborating with engineers to design easy to use data products.


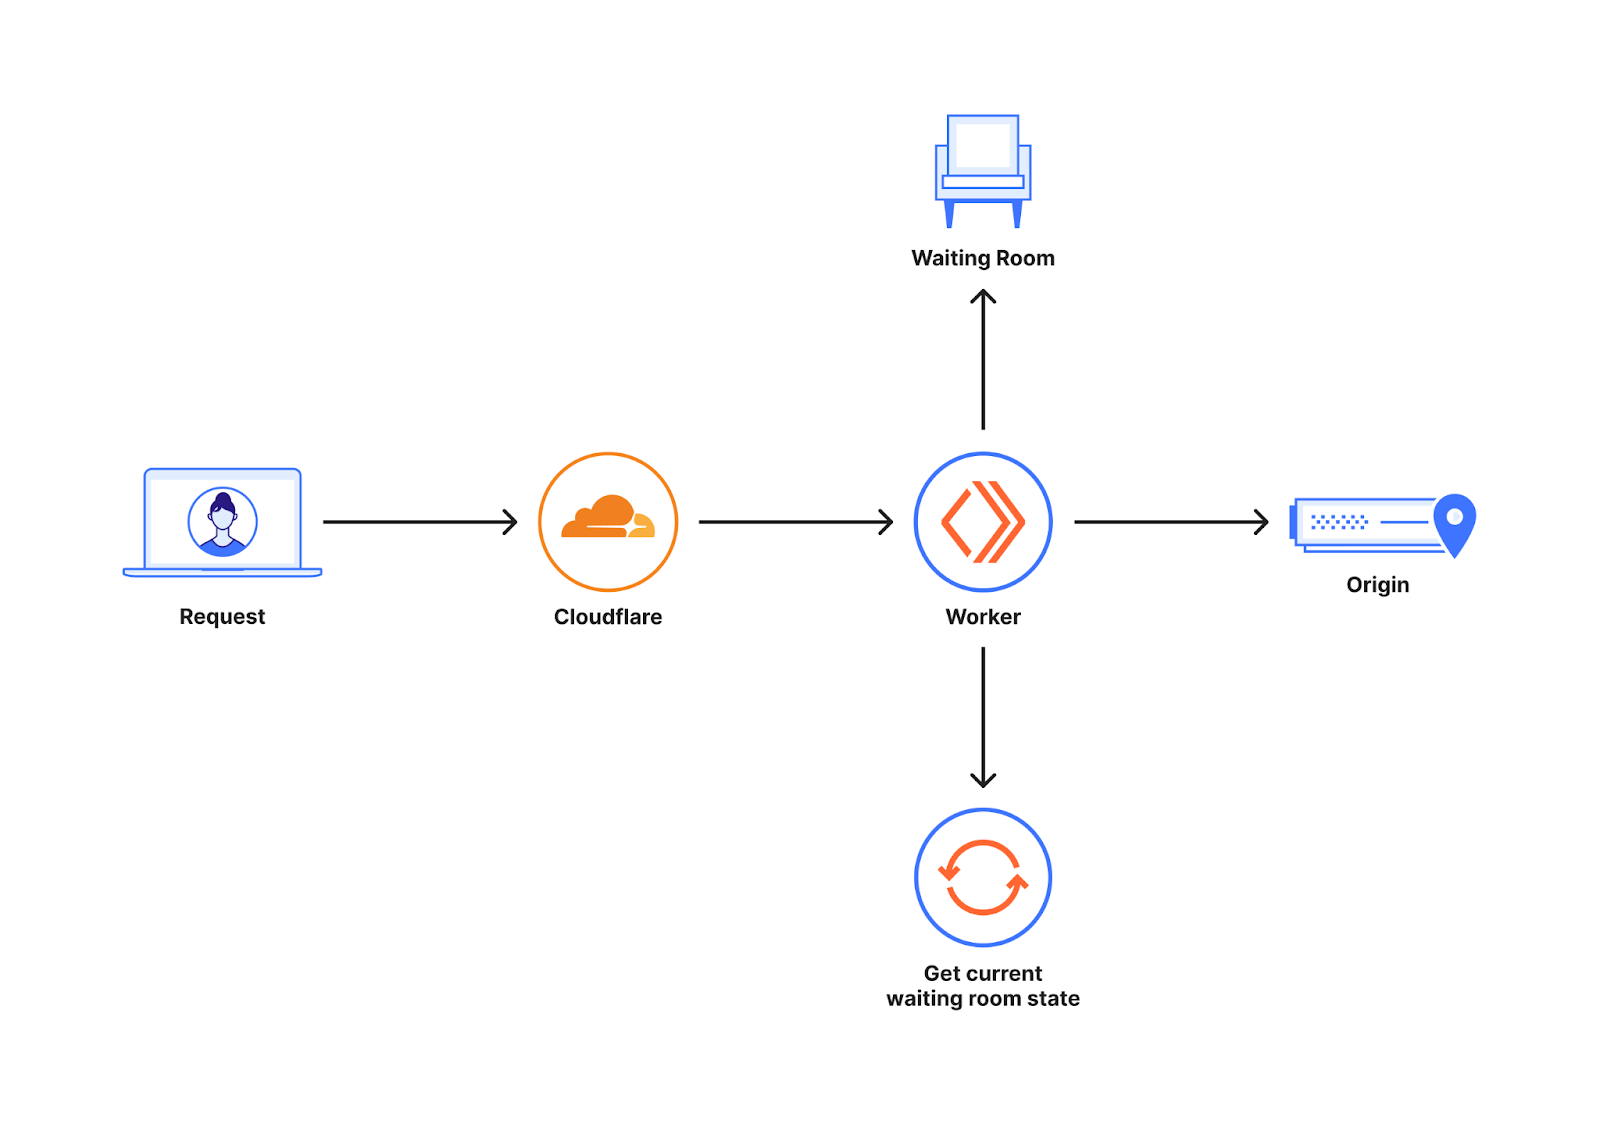
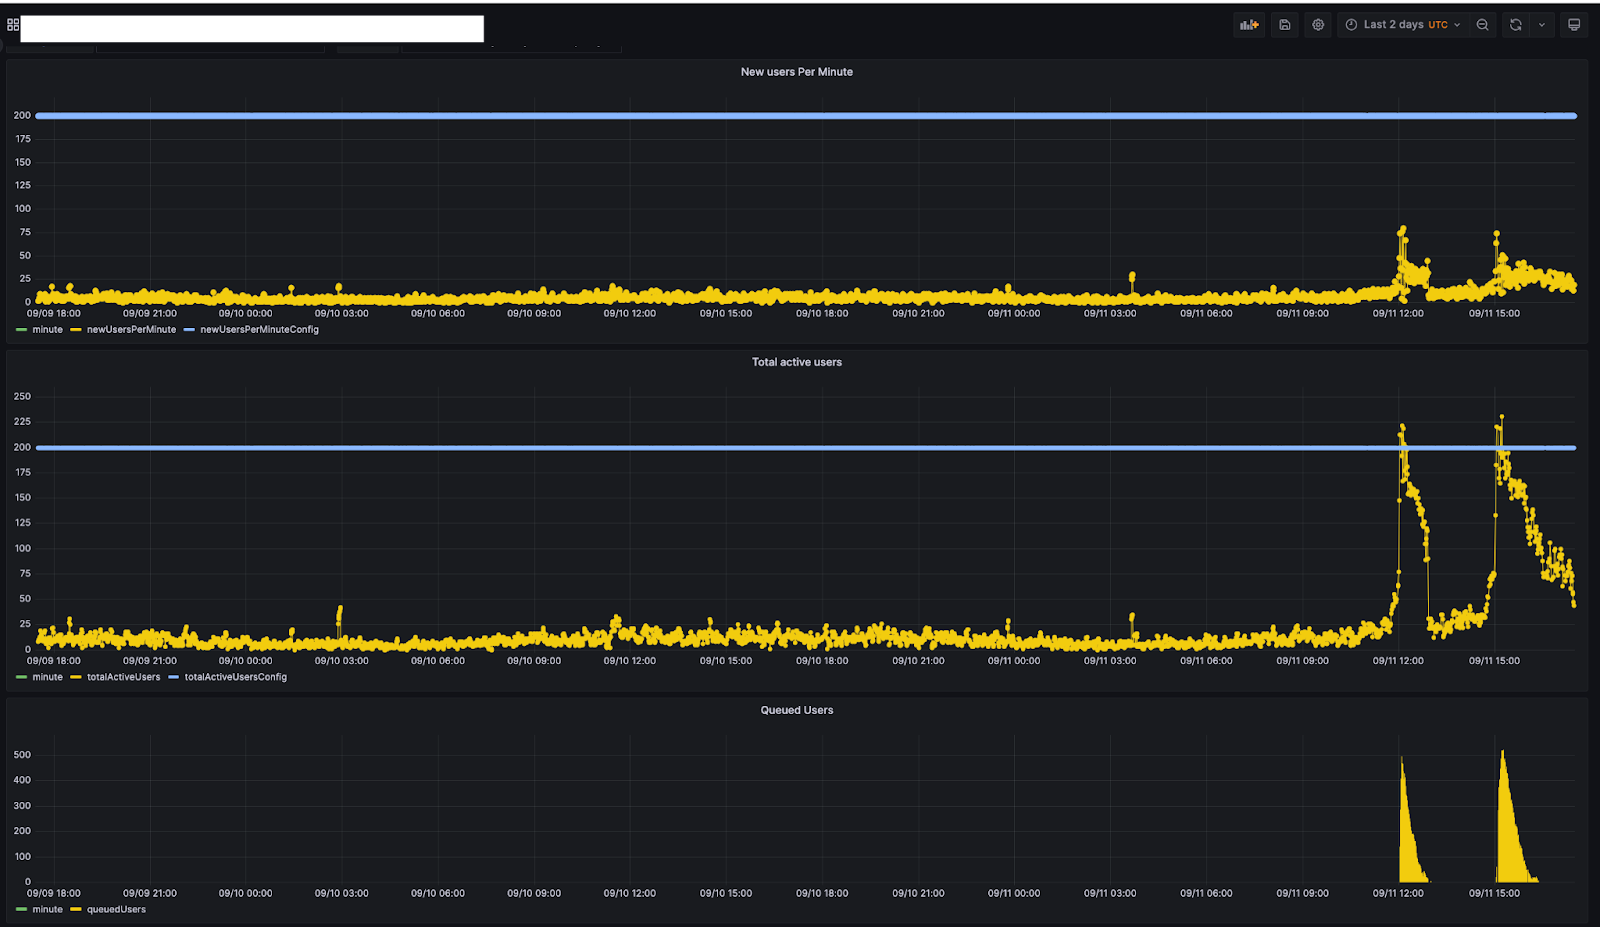
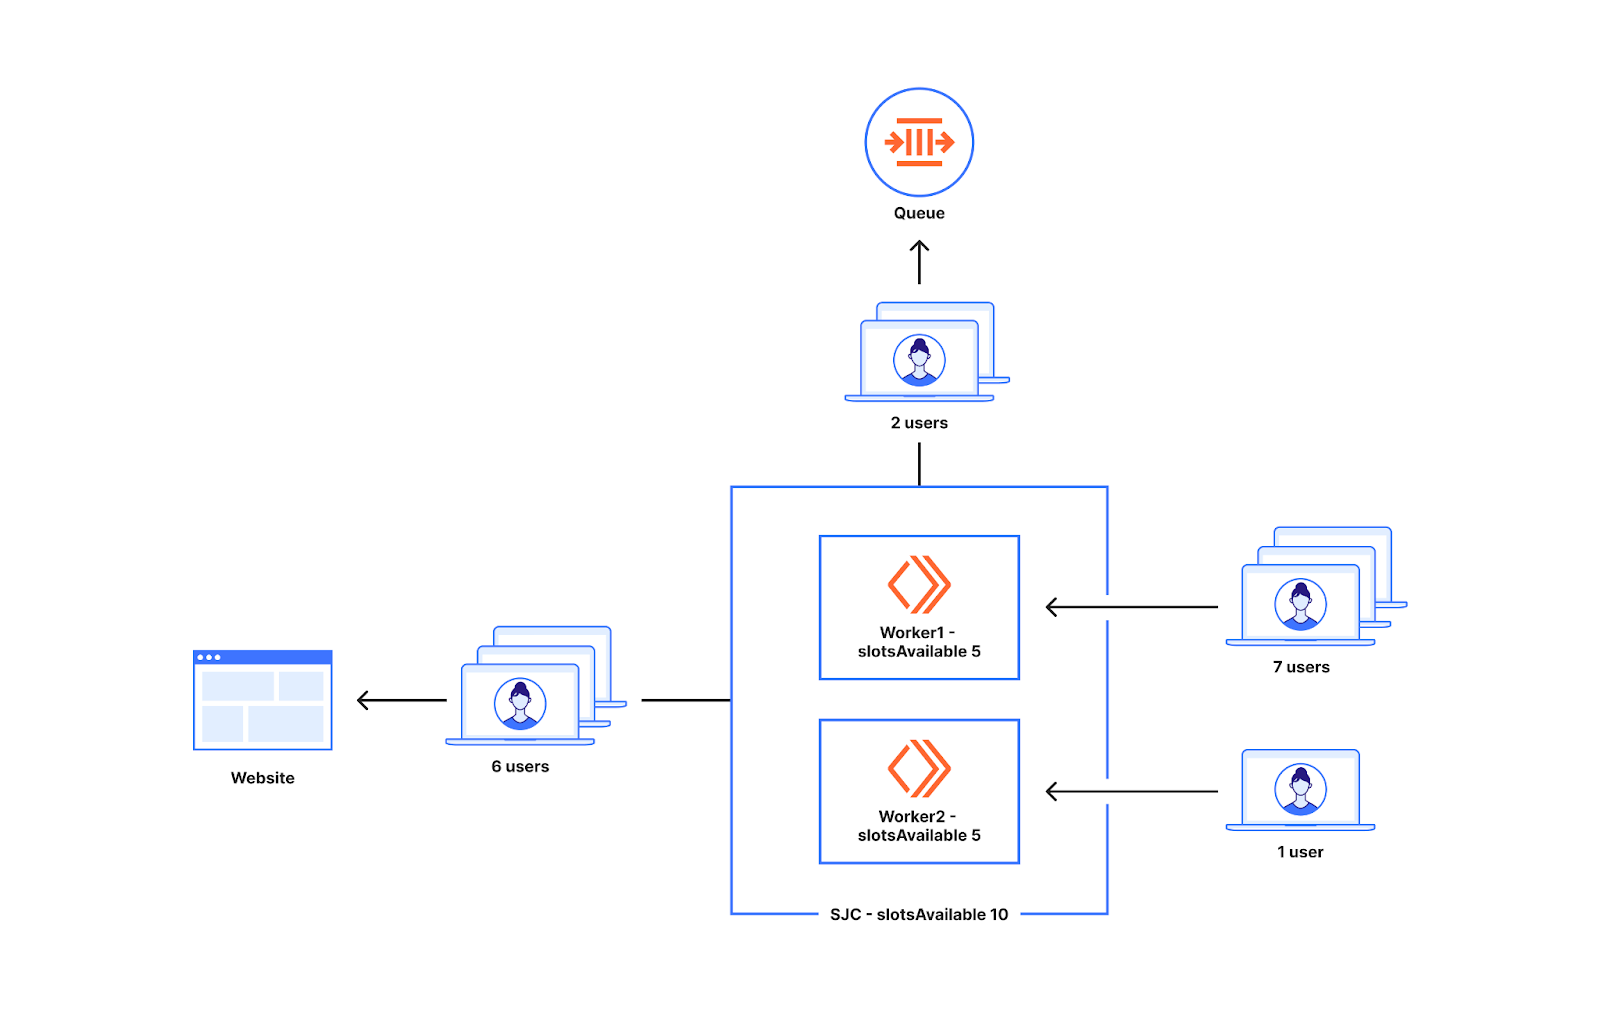
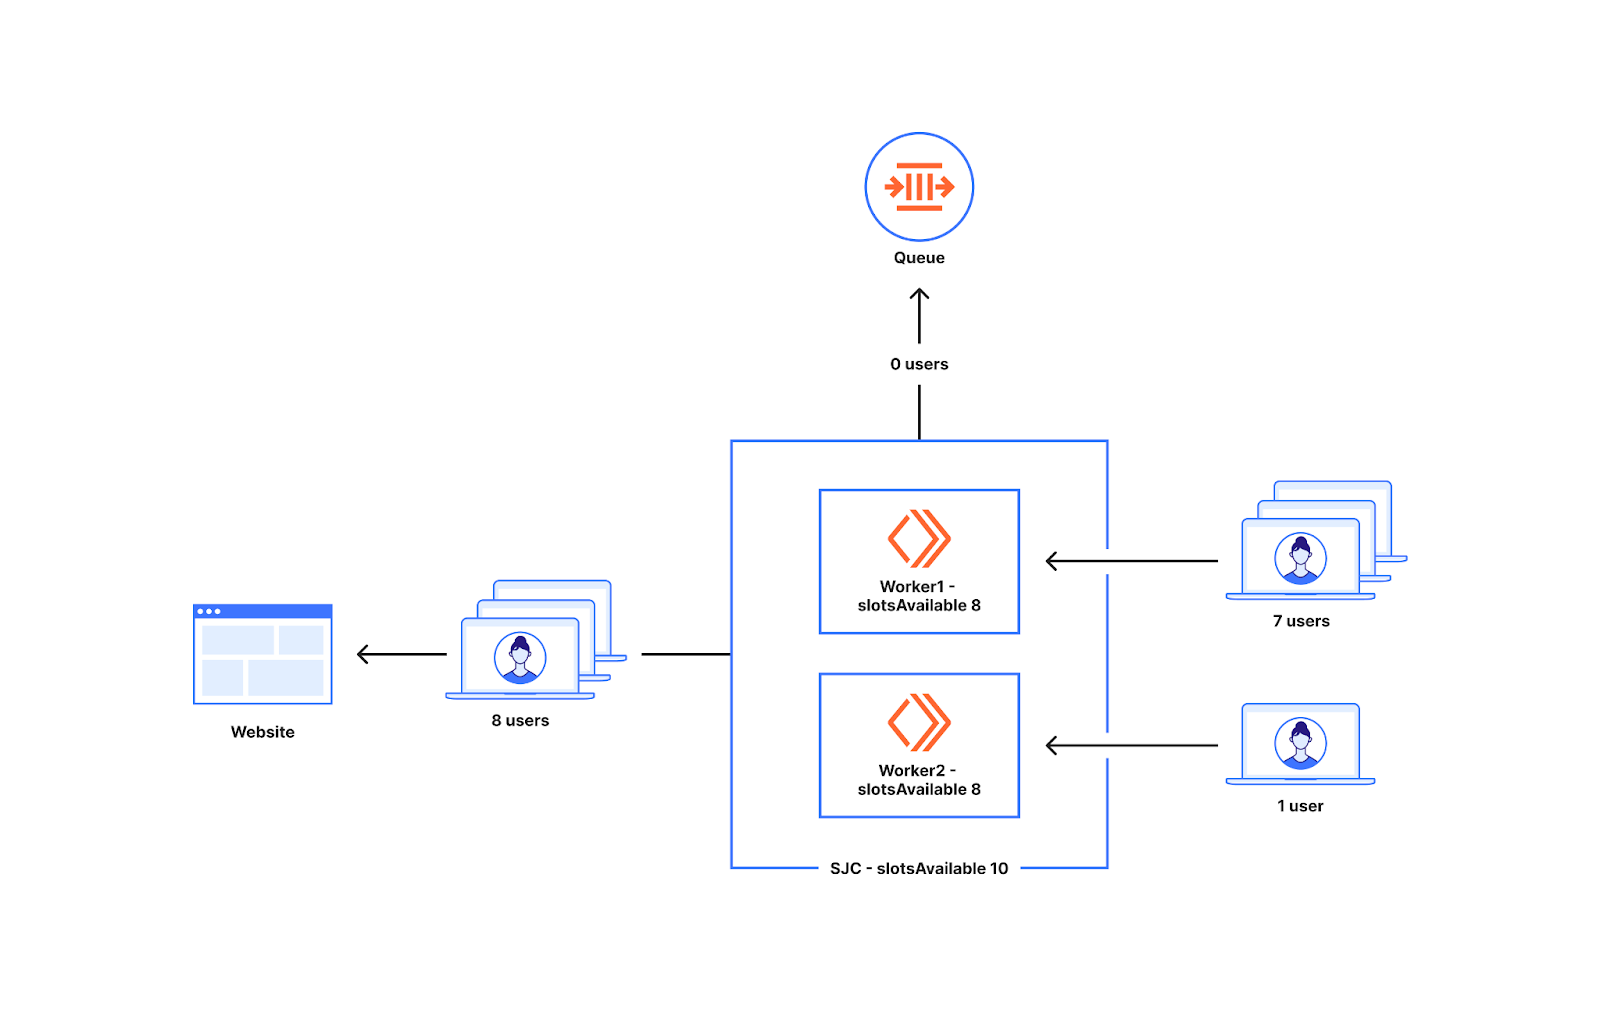


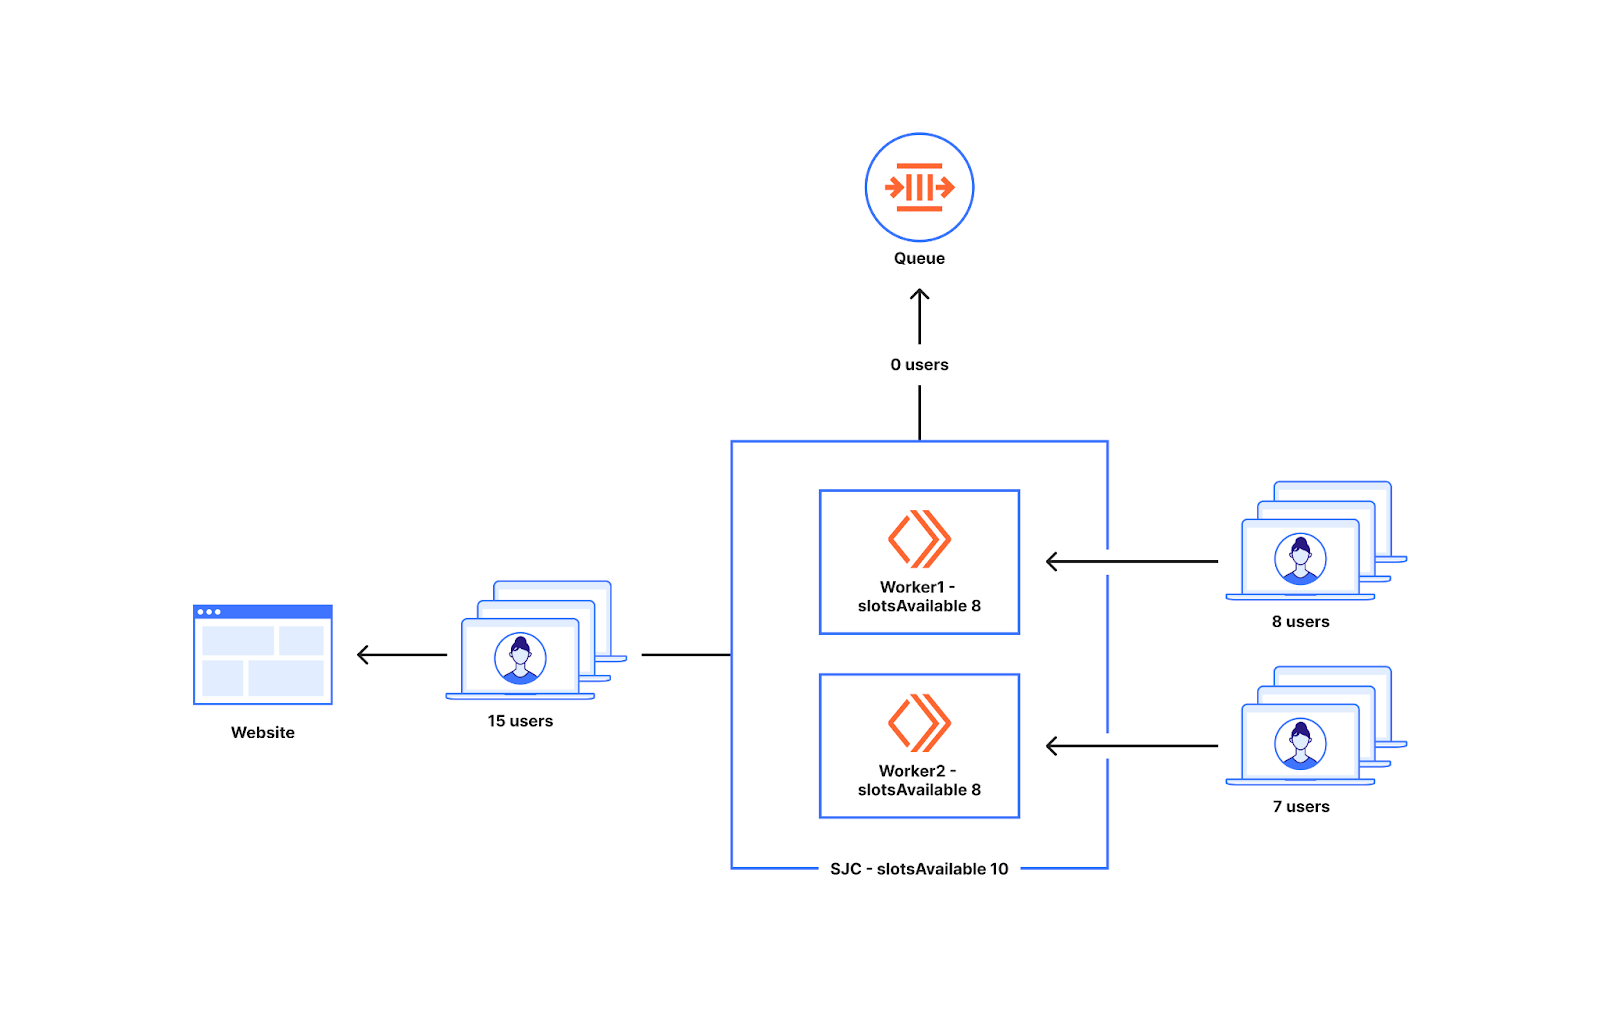
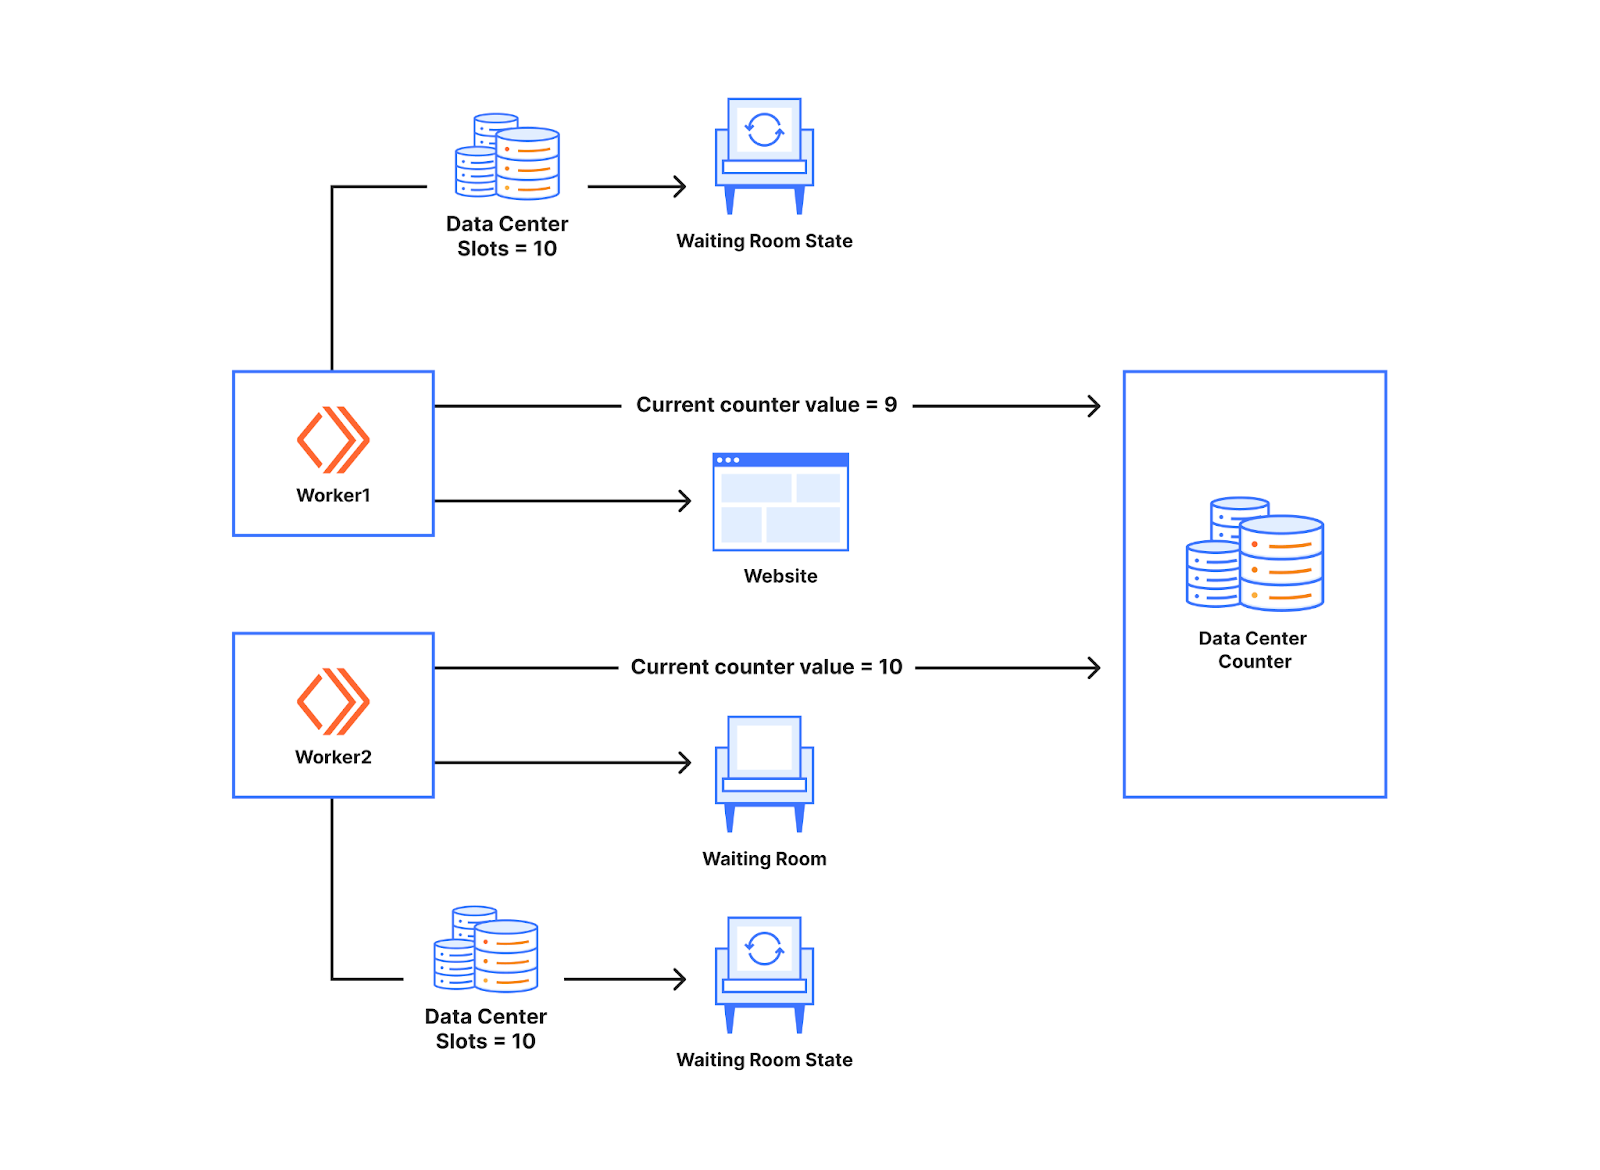
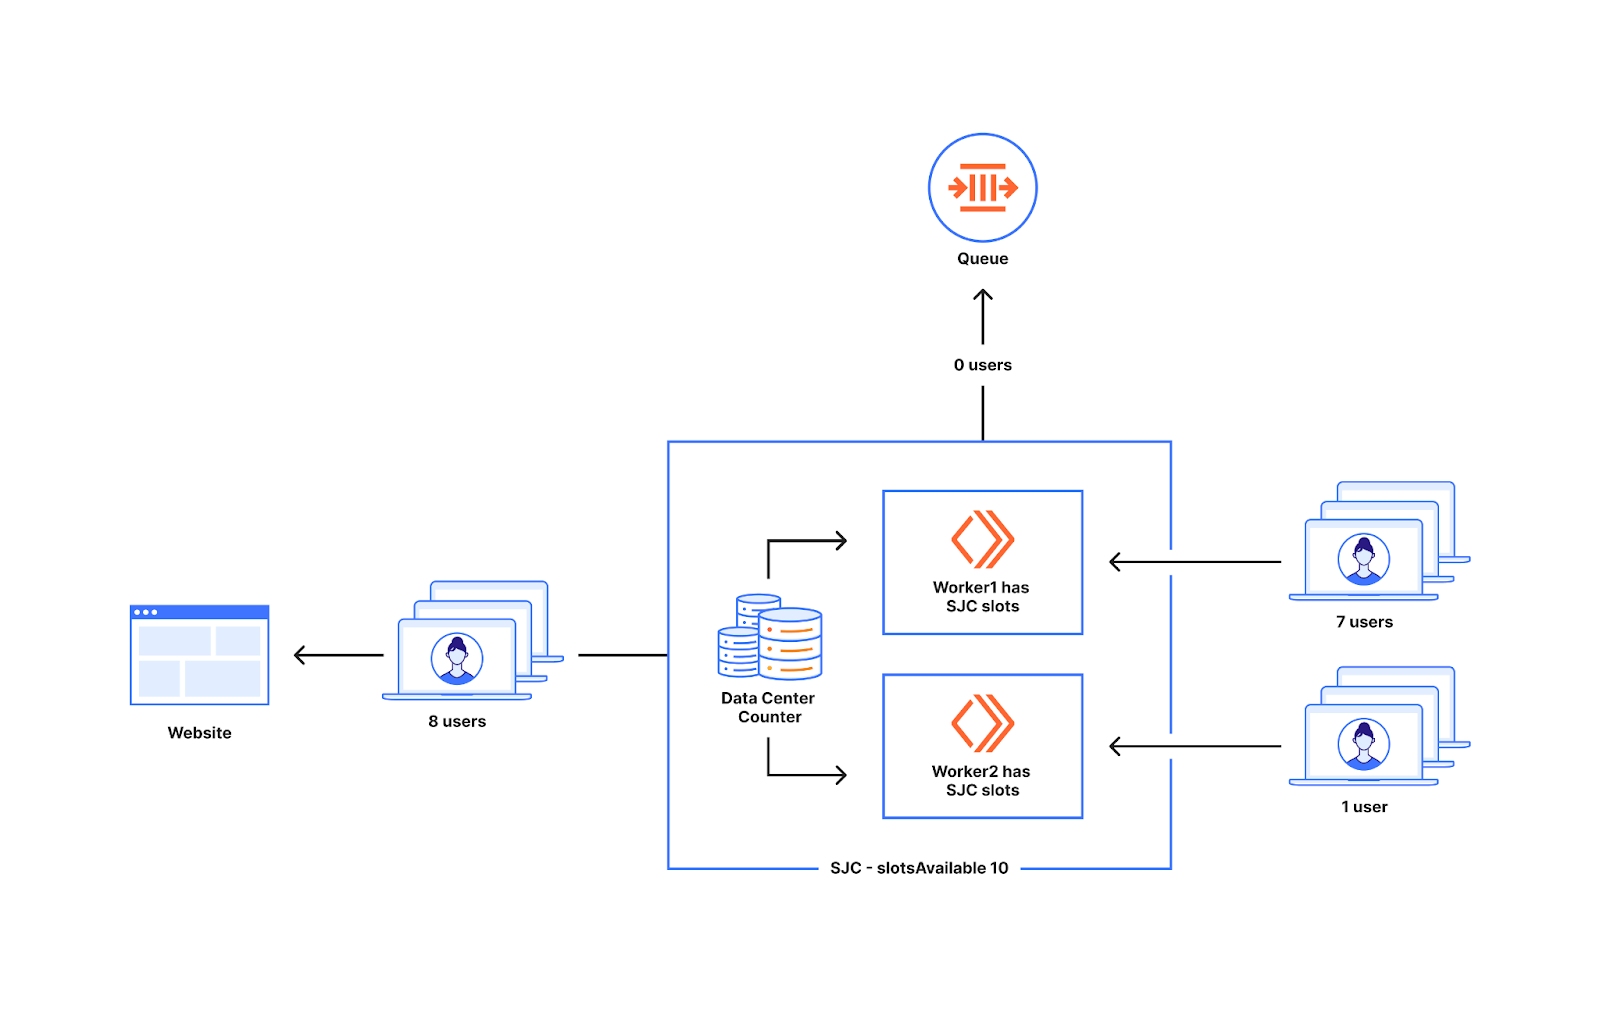
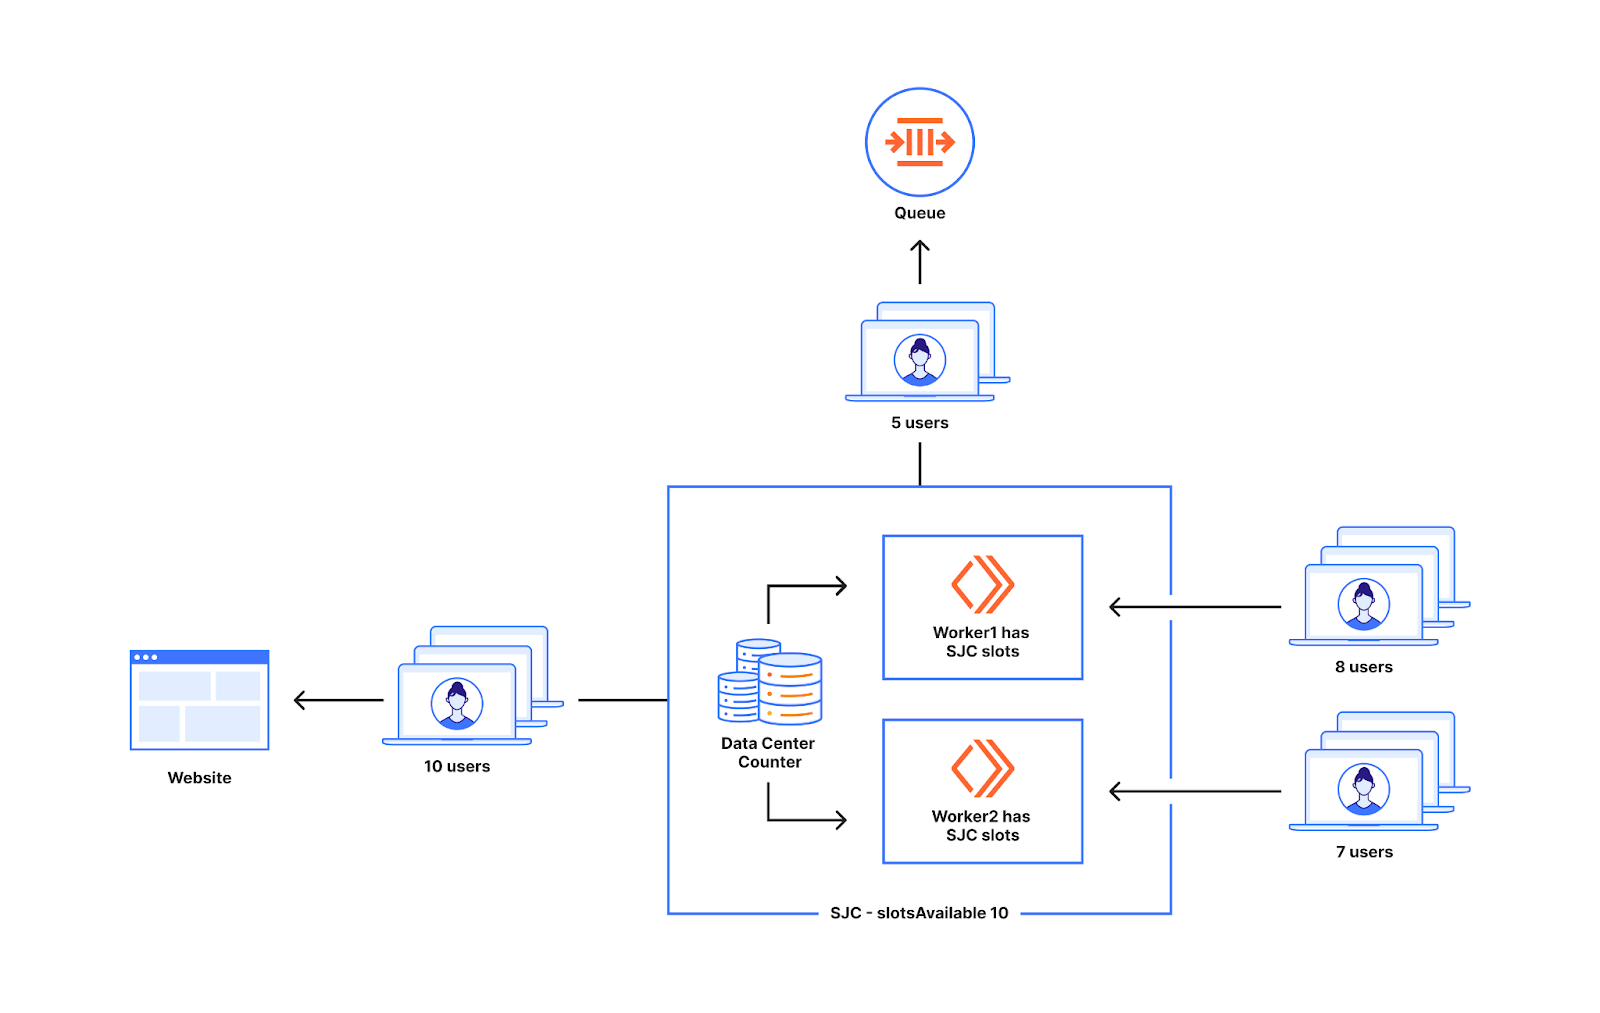
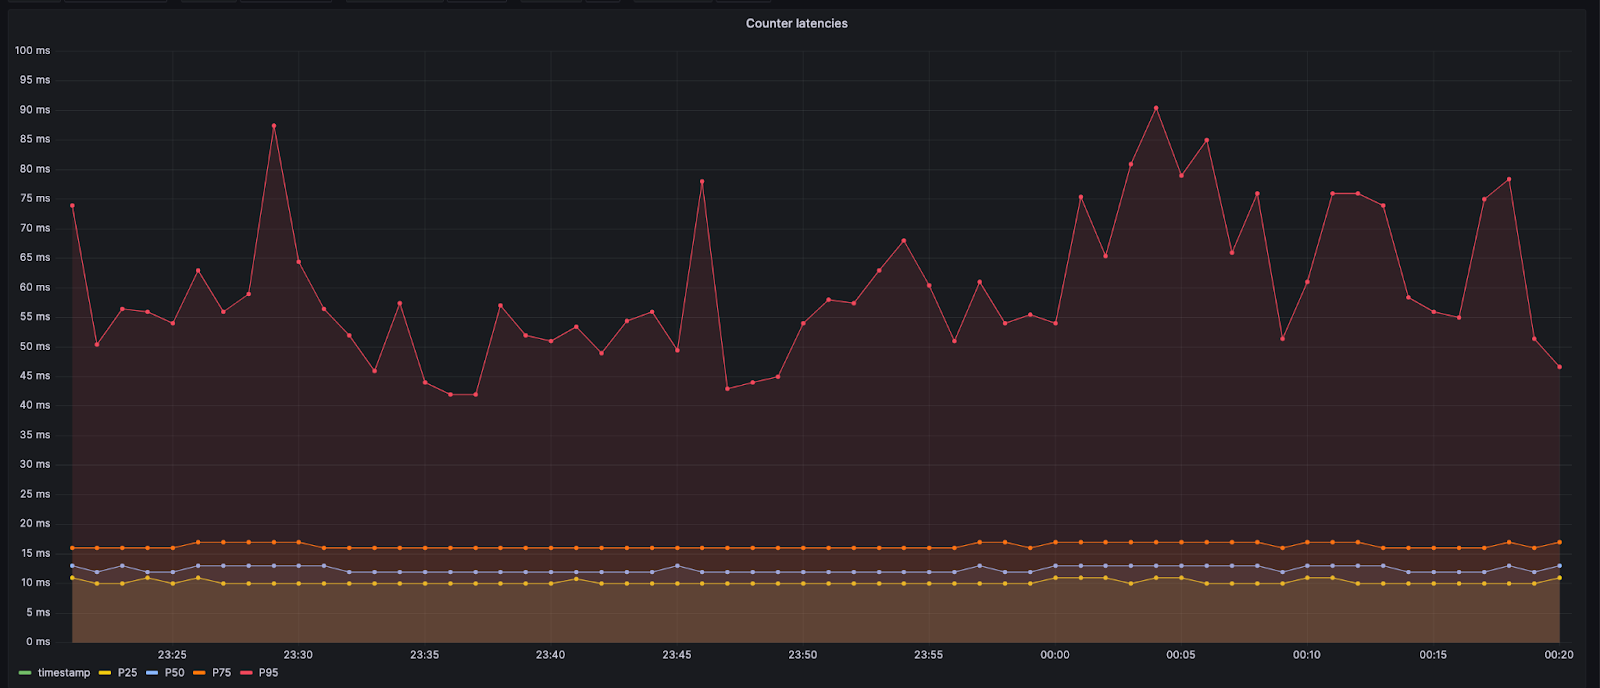
 В Село Марково пак недоволстват хората, че нямало рейс.