Post Syndicated from original https://xkcd.com/2736/

Post Syndicated from original https://xkcd.com/2736/
Post Syndicated from James Beswick original https://aws.amazon.com/blogs/compute/introducing-new-asynchronous-invocation-metrics-for-aws-lambda/
This post is written by Arthi Jaganathan, Principal SA, Serverless and Dhiraj Mahapatro, Principal SA, Serverless.
Today, AWS is announcing three new Amazon CloudWatch metrics for asynchronous AWS Lambda function invocations: AsyncEventsReceived, AsyncEventAge, and AsyncEventsDropped. These metrics provide visibility for asynchronous Lambda function invocations.
Previously, customers found it challenging to monitor the processing of asynchronous invocations. With these new metrics for asynchronous function invocations, you can identify the root cause of processing issues. These issues include throttling, concurrency limit, function errors, processing latency because of retries, missing events, and taking corrective action.
This blog and the sample application provide examples that highlight the usage of the new metrics.

AWS services such as Amazon S3, Amazon SNS, and Amazon EventBridge invoke Lambda functions asynchronously. Lambda uses an internal queue to store events. A separate process reads events from the queue and sends them to the function.
By default, Lambda discards events from its event queue if the retry policy has exceeded the number of configured retries or the event reached its maximum age. However, the event once discarded from the event queue goes to the destination or DLQ, if configured.
This table summarizes the retry behavior. Visit the asynchronous Lambda invocations documentation to learn more:
| Cause | Retry behavior | Override |
| Function errors (returned from code or runtime, such as timeouts) | Retry twice | Set retry attempt on function between 0-2 |
| Throttles (429) and system errors (5xx) | Retry for a maximum of 6 hours | Set maximum age of event on function between 60 seconds to 6 hours |
| Zero reserved concurrency | No retry | N/A |
The AsyncEventsReceived metric is a measure of the number of events enqueued in Lambda’s internal queue. You can track events from the client using custom CloudWatch metrics or extract it from logs using Embedded Metric Format (EMF). In case this metric is lower than the number of events that you expect, it shows that the source did not emit events or events did not arrive at the Lambda service. This is possible because of transient networking issues. Lambda does not emit this metric for retried events.
The AsyncEventAge metric is a measure of the difference between the time that an event is first enqueued in the internal queue and the time the Lambda service invokes the function. With retries, Lambda emits this metric every time it attempts to invoke the function with the event. An increasing value shows retries because of error or throttles. Customers can set alarms on this metric to alert on SLA breaches.
The AsyncEventsDropped metric is a measure of the number of events dropped because of processing failure.
This flowchart shows the way that you can combine the new metrics with existing metrics to troubleshoot problems with asynchronous processing:

You can deploy a sample Lambda function to show how to use the new metrics for troubleshooting.
To test the following scenarios, you must install:
To set up the application:
export REGION=<your AWS region>git clone https://github.com/aws-samples/lambda-async-metrics-sample.git
cd lambda-async-metrics-samplesam build
sam deploy --guided --region $REGIONFUNCTION_NAME=$(aws cloudformation describe-stacks \
--region $REGION \
--stack-name lambda-async-metric \
--query 'Stacks[0].Outputs[?OutputKey==`HelloWorldFunctionResourceName`].OutputValue' --output text)
aws lambda invoke \
  --region $REGION \
  --function-name $FUNCTION_NAME \
  --invocation-type Event out_file.txt


These scenarios show how you can use the three new metrics.
Lambda retries processing the asynchronous invocation event for a maximum of two times, in case of function error or exception. Lambda drops the event from its internal queue if the retries are exhausted.
To simulate a function error, throw an exception from the Lambda handler:
def handler(event, context):
  print(“Hello from AWS Lambda”)
  raise Exception(“Lambda function throwing exception”)
sam build && sam deploy –region $REGIONaws lambda invoke \
--region $REGION \
--function-name $FUNCTION_NAME \
--invocation-type Event out_file.txt
It is best practice to alert on function errors using the error metric and use the metrics to get better insights into retry behavior, such as interval between retries. For example, if a function errors because of a downstream system being overwhelmed, you can use AsyncEventAge and Concurrency metrics.
If you received an alert for function error, you see data points for AsyncEventsDropped. It is 1 for this scenario. Overlaying the Errors and Throttles metrics reconfirms function error causes this.

There are two retries before the Lambda service drops the event. No throttling confirms the function error. Next, you can confirm that the AsyncEventAge is increasing. Lambda publishes this metric every time it polls from the event queue and sends it to the function. This creates multiple data points for the metric.
You can duplicate the metric to see both statistics on a single graph. Here, the two lines overlap because there is only one data point published in each 1-minute interval.

The event spent 37ms in the internal queue before the first invoke attempt. Lambda’s first retry happens after 63.5 seconds. The second and final retry happens after 189.6 seconds.
In case of throttling or system errors, Lambda retries invoking the event up to the configured MaximumEventAgeInSeconds (the maximum is 6 hours). To simulate the throttling error without hitting the account concurrency limit, you can:
The Lambda service throttles new invocations while the first request is in progress. You invoke the function in quick succession from the command line to simulate throttling and observe the retry behavior:
HelloWorldFunction:
  Type: AWS::Serverless::Function
  Properties:
    CodeUri: hello_world/
    Handler: app.lambda_handler
    Runtime: python3.9
    Timeout: 100
    MemorySize: 128
    Architectures:
    - x86_64
    ReservedConcurrentExecutions: 1
import time

def handler(event, context):
  time.sleep(90)
  print("Hello from AWS Lambda")
sam build && sam deploy --region $REGIONfor i in {1..2}; do aws lambda invoke \
--region $REGION \
--function-name $FUNCTION_NAME \
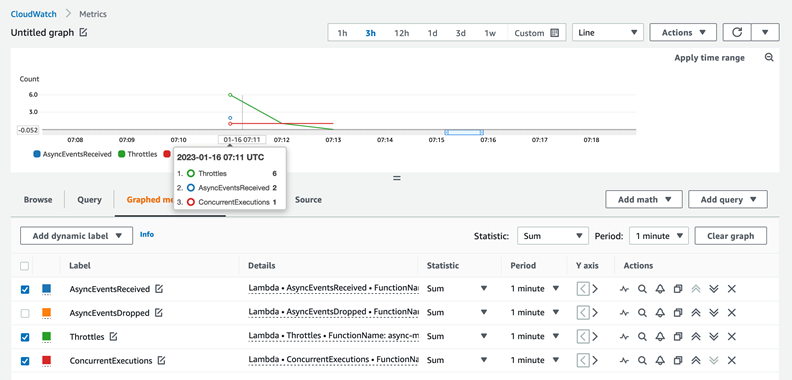
--invocation-type Event out_file.txt; doneIn a real-world use case, missing the processing SLA should trigger the troubleshooting workflow. Start with AsyncEventsReceived to confirm events enqueued by the Lambda service. This is 2 in this scenario. Look for dropped events using AsyncEventsDropped metric.

AsyncEventAge verifies delays in processing. As mentioned in the previous section, there can be multiple data points for this metric in a one-minute interval. You can duplicate the metric to compare minimum and maximum values.

There are 2 data points in the first minute. The event age increases to 31 seconds during this period.

There is only one data point for the metric in the remaining one-minute intervals, so the lines overlap. The event age increases to 59,153ms (~59 seconds) in one interval and then to 130,315ms (~130 seconds) in the next one-minute interval. Since the function sleeps for 90 seconds, it explains why the final retry is at around 2 minutes since the function received the event.
Checking function throttling, this screenshot confirms throttling six times in the first minute (07:12 UTC timestamp) and once in the subsequent minute (07:13 UTC timestamp).

This is because of the back-off behavior of Lambda’s internal queue. The data for AsyncEventAge shows that there is only one throttle in the second interval. Lambda delivers the event during the next one-minute interval after spending around 2 minutes in the internal queue.
Overlaying the ConcurrentExecutions and AsyncEventsReceived metrics provides more information. You see receipt of two events, but concurrency stayed at 1. This results in one event being throttled:
There are multiple ways to resolve throttling errors. You optimize the function to run faster or increase the function or account concurrency limits to address throttling errors.
The sample application covers other scenarios such as troubleshooting dropped events on event expiration, and troubleshooting dropped events when a function’s reserved concurrency is set to zero.
Use the following command and follow the prompts to clean up the resources:
sam delete lambda-async-metric --region $REGIONUsing these new CloudWatch metrics, you can gain visibility into the processing of Lambda asynchronous invocations. This blog explained the new metrics AsyncEventsReceived, AsyncEventAge, and AsyncEventsDropped and how to use them to troubleshoot issues. With these new metrics, you can track the asynchronous invocation requests sent to Lambda functions. You monitor any delays in processing, and take corrective actions if required.
The Lambda service sends these new metrics to CloudWatch at no cost to you. However, charges apply for CloudWatch Metric Streams and CloudWatch Alarms. See CloudWatch pricing for more information.
For more serverless learning resources, visit Serverless Land.
Post Syndicated from Vinod Santhanam original https://aws.amazon.com/blogs/security/improve-security-of-amazon-rds-master-database-credentials-using-secrets-manager/
Amazon Relational Database Service (Amazon RDS) makes it simpler to set up, operate, and scale a relational database in the AWS Cloud. AWS Secrets Manager helps you manage, retrieve, and rotate database credentials, API keys, and other secrets.
Amazon RDS now offers integration with Secrets Manager to manage master database credentials. You no longer have to manage master database credentials, such as creating a secret in Secrets Manager or setting up rotation, because Amazon RDS does it for you.
In this blog post, you will learn how to set up an Amazon RDS database instance and use the Secrets Manager integration to manage master database credentials. You will also learn how to set up alternating users rotation for application credentials.
Managing Amazon RDS master database credentials with Secrets Manager provides the following benefits:
In this blog post, we’ll show you how to use the console to do the following:
In this section, you will create a database instance with Secrets Manager integration.

Figure 1: Select Secrets Manager integration

Figure 2: Choose KMS key
In this section you will learn how to create and secure a credential that could be used in your application to connect to the database. You will learn how to access the master database credentials and use the master database credentials to create and set up rotation on child (application) credentials.

Figure 3: View DB configuration

Figure 4: View secret details
Note: Your applications can retrieve these credentials by using the AWS Command Line Interface (AWS CLI) or AWS SDK if they have IAM permission to read the secret.
CREATE USER 'child'@'%' IDENTIFIED by <password>;
For more information about creating users, see the MySQL documentation.
In this section, you will learn how to use the master database credential to set up multi-user rotation for application credentials.

Figure 5: Select the RDS instance

Figure 6: Select automatic rotation
Note: To find the name of your master database secret, in the Amazon RDS console, on your Amazon RDS instance details page, choose the Configuration tab and then see the Master Credentials ARN.

Figure 7: Select separate credentials for rotation
It will take a few minutes for the Secrets Manager workflow to set up the rotation Lambda function before the new database user secret is ready to be rotated.

Figure 8: View the child secret

Figure 9: Verify the rotation status
For more details and troubleshooting on this process, see Set up alternating users rotation for AWS Secrets Manager.
By deleting the Amazon RDS instance, you will automatically clean up the managed master database credential secret.

Figure 10: Create snapshots and backups
For more information, see Deleting a DB instance.

Figure 11: Select child secret

Figure 12: View the rotation function

Figure 13: Open application

Figure 14: Choose delete

Figure 15: Delete child secret
Amazon RDS integration with Secrets Manager helps you better secure and manage master DB credentials. This integration helps you store the credentials when the DB instances are created and eliminates the effort for you to set up credential rotation.
In this blog post, you learned how to do the following:
For instructions on how to create database users for other Amazon RDS engine types, see the following resources:
If you have feedback about this post, submit comments in the Comments section below. If you have questions about this post, contact AWS Support.
Want more AWS Security news? Follow us on Twitter.
Post Syndicated from Ramesh Ranganathan original https://aws.amazon.com/blogs/big-data/synchronize-your-salesforce-and-snowflake-data-to-speed-up-your-time-to-insight-with-amazon-appflow/
This post was co-written with Amit Shah, Principal Consultant at Atos.
Customers across industries seek meaningful insights from the data captured in their Customer Relationship Management (CRM) systems. To achieve this, they combine their CRM data with a wealth of information already available in their data warehouse, enterprise systems, or other software as a service (SaaS) applications. One widely used approach is getting the CRM data into your data warehouse and keeping it up to date through frequent data synchronization.
Integrating third-party SaaS applications is often complicated and requires significant effort and development. Developers need to understand the application APIs, write implementation and test code, and maintain the code for future API changes. Amazon AppFlow, which is a low-code/no-code AWS service, addresses this challenge.
Amazon AppFlow is a fully managed integration service that enables you to securely transfer data between SaaS applications, like Salesforce, SAP, Zendesk, Slack, and ServiceNow, and AWS services like Amazon Simple Storage Service (Amazon S3) and Amazon Redshift in just a few clicks. With Amazon AppFlow, you can run data flows at enterprise scale at the frequency you choose—on a schedule, in response to a business event, or on demand.
In this post, we focus on synchronizing your data from Salesforce to Snowflake (on AWS) without writing code. This post walks you through the steps to set up a data flow to address full and incremental data load using an example use case.
Our use case involves the synchronization of the Account object from Salesforce into Snowflake. In this architecture, you use Amazon AppFlow to filter and transfer the data to your Snowflake data warehouse.
You can configure Amazon AppFlow to run your data ingestion in three different ways:
We use the on-demand trigger for the initial load of data from Salesforce to Snowflake, because it helps you pull all the records, irrespective of their creation. To then synchronize data periodically with Snowflake, after we run the on-demand trigger, we configure a scheduled trigger with incremental transfer. With this approach, Amazon AppFlow pulls the records based on a chosen timestamp field from the Salesforce Account object periodically, based on the time interval specified in the flow.
The Account_Staging table is created in Snowflake to act as a temporary storage that can be used to identify the data change events. Then the permanent table (Account) is updated from the staging table by running a SQL stored procedure that contains the incremental update logic. The following figure depicts the various components of the architecture and the data flow from the source to the target.

The data flow contains the following steps:
Account_Staging table.Account_Staging table.LastModifiedDate field to determine incremental changes.To get started, you need the following prerequisites:
Complete the following steps to configure Snowflake and set up your data in Amazon S3:
A best practice when creating your S3 bucket is to make sure you block public access to the bucket to ensure your data is not accessible by unauthorized users.
Follow the instructions for steps 1 and 2 in Configuring a Snowflake Storage Integration to Access Amazon S3 to create an IAM policy and role. Replace the placeholders with your S3 bucket names.
SALESFORCE and database called SALESTEST.These steps create a storage integration with your S3 bucket, update IAM roles with Snowflake account and user details, and creates an external stage.
This completes the setup in Snowflake. In the next section, you create the required objects in Snowflake.
In your Snowflake account, complete the following steps to create the tables, stored procedures, and tasks for implementing the use case:
Account and Account_staging tables:staging to the Account table:This stored procedure determines whether the data contains new records that need to be inserted or existing records that need to be updated or deleted. After a successful run, the stored procedure clears any data from your staging table.
This completes the Snowflake part of configuration and setup.
First, let’s create a Salesforce connection that can be used by AppFlow to authenticate and pull records from your Salesforce instance. On the AWS console, make sure you are in the same Region where your Snowflake instance is running.
Salesforce-blog). |
 |
Complete the following steps to create your Snowflake connection:

Snowflake-blog.
Now you create a flow in Amazon AppFlow to load the data from Salesforce to Snowflake. Complete the following steps:
AccountData-SalesforceToSnowflake).
Salesforce-blog).SALESTEST.PUBLIC. ACCOUNT_STAGING).

Account Number, Account Name, Account Type, Annual Revenue, Active, Deleted, and Last Modified Date.

Because the schema for the Account_Staging table in Snowflake database has a NOT NULL constraint for the fields Account_Number and Active, records containing a null value for these fields should be ignored.


When the flow run completes successfully, it will bring all records into your Snowflake staging table.

The data will be loaded into the Account_staging table. To verify that data is loaded in Snowflake, complete the following steps:
ACCOUNT_STAGING table in Snowflake.ACCOUNT table and the ACCOUNT_STAGING table is truncated.Now let’s configure an incremental data load from Salesforce:
LastModifiedDate field.This ensures that deleted records from the source are also ingested.
Now your flow is configured to capture all incremental changes.
Log in to your Salesforce account, and edit any record in the Account object.
Within 5 minutes or less, a scheduled flow will pick up your change and write the changed record into your Snowflake staging table and trigger the synchronization process.

You can see the details of the run, including number of records transferred, on the Run History tab of your flow.

Clean up the resources in your AWS account by completing the following steps:
AccountData-SalesforceToSnowflakeand delete it.Salesforce-blog, and delete it.Snowflake-blog, and delete it.TASK_ACCOUNT_LOAD:sp_account_load:ACCOUNT_STAGING and ACCOUNT:In this post, we walked you through how to integrate and synchronize your data from Salesforce to Snowflake using Amazon AppFlow. This demonstrates how you can set up your ETL jobs without having to learn new programming languages by using Amazon AppFlow and your familiar SQL language. This is a proof of concept, but you can try to handle edge cases like failure of Snowflake tasks or understand how incremental transfer works by making multiple changes to a Salesforce record within the scheduled time interval.
For more information on Amazon AppFlow, visit Amazon AppFlow.
 Ramesh Ranganathan is a Senior Partner Solution Architect at AWS. He works with AWS customers and partners to provide guidance on enterprise cloud adoption, application modernization and cloud native development. He is passionate about technology and enjoys experimenting with AWS Serverless services.
 Kamen Sharlandjiev is an Analytics Specialist Solutions Architect and Amazon AppFlow expert. He’s on a mission to make life easier for customers who are facing complex data integration challenges. His secret weapon? Fully managed, low-code AWS services that can get the job done with minimal effort and no coding.
 Amit Shah is a cloud based modern data architecture expert and currently leading AWS Data Analytics practice in Atos. Based in Pune in India, he has 20+ years of experience in data strategy, architecture, design and development. He is on a mission to help organization become data-driven.
Post Syndicated from Erick Galinkin original https://blog.rapid7.com/2023/02/09/nearly-19-000-esxi-servers-still-vulnerable-to-cve-2021-21974/

Last week, multiple organizations issued warnings that a ransomware campaign dubbed “ESXiArgs” was targeting VMware ESXi servers by leveraging CVE-2021-21974—a nearly two-year-old heap overflow vulnerability. Two years. And yet, Rapid7 research has found that a significant number of ESXi servers likely remain vulnerable. We believe, with high confidence, that there are at least 18,581 vulnerable internet-facing ESXi servers at the time of this writing.
That 18,581 number is based on Project Sonar telemetry. We leverage the TLS certificate Recog signature to determine that a particular server is a legitimate ESXi server. Then, after removing likely honeypots from the results, we checked the build ids of the scanned servers against a list of vulnerable build ids.
Project Sonar is a Rapid7 research effort aimed at improving security through the active analysis of public networks. As part of the project, we conduct internet-wide surveys across more than 70 different services and protocols to gain insights into global exposure to common vulnerabilities.
We have also observed additional incidents targeting ESXi servers, unrelated to the ESXiArgs campaign, that may also leverage CVE-2021-21974. RansomExx2—a relatively new strain of ransomware written in Rust and targeting Linux has been observed exploiting vulnerable ESXi servers. According to a recent IBM Security X-Force report, ransomware written in Rust has lower antivirus detection rates compared to those written in more common languages.
The U.S. Cybersecurity and Infrastructure Security Agency (CISA) on Wednesday released a ransomware decryptor to help victims recover from ESXiArgs attacks. However, it’s important to note the script is not a cure all and requires additional tools for a full recovery. Moreover, reporting suggests that the threat actor behind the campaign has modified their attack to mitigate the decryptor.
The script works by allowing users to unregister virtual machines that have been encrypted by the ransomware and re-register them with a new configuration file. However, you still need to have a backup of the encrypted parts of the VM to make a full restore.
The main benefit of the decryptor script is that it enables users to bring virtual machines back to a working state while data restore from backup occurs in the background. This is particularly useful for users of traditional backup tools without virtualization-based disaster recovery capabilities.
Deny access to servers. Unless a service absolutely needs to be on the internet, do not expose it to the internet. Some victims of these attacks had these servers exposed to the open internet, but could have gotten just as much business value out of them by restricting access to allowlisted IP addresses. If you are running an ESXi server, or any server, default to denying access to that server except from trusted IP space.
Patch vulnerable ESXi Servers. VMware issued a patch for CVE-2021-21974 nearly two years ago. If you have unpatched ESXi servers in your environment, click on that link and patch them now.
Develop and adhere to a patching strategy. Patching undoubtedly has challenges. However, this event illustrates perfectly why it’s essential to have a patching strategy in place and stick to it.
Back up virtual machines. Make sure you have a backup solution in place, even for virtual machines. As noted above, the decryptor script issued by the CIA is only a partial fix. The only way to completely recover from attacks associated with CVE-2021-21974 is via operational backups. There are a wide variety of backup solutions available to protect virtual machines today.
Drew Burton contributed to this article.
Post Syndicated from original https://lwn.net/Articles/922811/
The 6.1.11 and 5.15.93 stable kernel updates have been
released; each contains another set of important fixes.
Post Syndicated from Eric Smith original https://www.servethehome.com/memory-bandwidth-per-core-and-per-socket-for-intel-xeon-and-amd-epyc/
We take a look at the theoretical memory bandwidth per socket and per core over the past decade for Intel Xeon and AMD EPYC to see the trend
The post Memory Bandwidth Per Core and Per Socket for Intel Xeon and AMD EPYC appeared first on ServeTheHome.
Post Syndicated from original https://lwn.net/Articles/922793/
The Thunderbird email client blog has a
plan for where the project is going.
Throughout the next 3 years, the Thunderbird project is aiming at
these primary objectives:
- Make the code base leaner and more reliable, rewrite ancient code,
remove technical debt.- Rebuild the interface from scratch to create a consistent design
system, as well as developing and maintaining an adaptable and extremely
customizable user interface.- Switch to a monthly release schedule.
Post Syndicated from original https://lwn.net/Articles/922545/
Serial litigant Craig Wright recently won
a procedural ruling in a London court that allows a
multi-billion-dollar Bitcoin-related lawsuit to proceed. This case has
raised a fair amount of concern within the free-software community, where
it is seen as threatening the “no warranty” language included in almost
every free-software license. As it happens, this case does not actually
involve that language, but it has some potentially worrisome implications
anyway.
Post Syndicated from Rapid7 original https://blog.rapid7.com/2023/02/09/evasion-techniques-uncovered-an-analysis-of-apt-methods/

By Christiaan Beek, with special thanks to Matt Green
DLL search order hijacking is a technique used by attackers to elevate privileges on the compromised system, evade restrictions, and/or establish persistence on the system. The Windows operating system uses a common method to look for required dynamic link libraries (DLLs) to load into a program. Attackers can hijack this search order to get their malicious payload executed.
DLL sideloading is similar to the above mentioned technique; however, instead of manipulating the search order, attackers place their payload alongside the victim’s application or a trusted third-party application. Abusing trusted applications to load their payload may bypass restrictions and evade endpoint security detections since they are loaded into a trusted process.
Attribution remains a topic of significant subjectivity, especially when attempting to connect an attack to a nation state. A common approach in determining the source has been to evaluate the techniques used by the perpetrator(s). DLL search order hijacking (T1574.001) or DLL sideloading (T1574.002) are common approaches used by nation state sponsored attackers.
The PlugX malware family, which has been around for more than a decade, is famous for using both techniques to bypass endpoint security and inject itself into trusted third party applications. PlugX is a remote access trojan with modular plugins. It is frequently updated with new functionalities and plugins.


In recent years, MITRE ATT&CK, CISA, and others have associated the PlugX family with various Chinese actors. Builders of the PlugX malware have been leaked to the public and can be used by other actors having access to the builders.
In January 2023, we observed activity from a China-based group called Mustang Panda using PlugX in one of their campaigns. In this particular case, they used a virtual hard disk (VHD) file, to hide the malicious files from antivirus detection. The VHD, which automatically mounted when opened contained a single archive file (RAR) that extracted the typical three files associated with PlugX:
The trusted binary ranged from compromised AV vendor files, operating system files, and third-party vendor files. These files are signed and therefore most of the time trusted by endpoint technology.
This approach is known as a Mark-of-the-Web bypass or MOTW (T1553.005). In short, container files that are downloaded from the Internet are marked with MOTW, but the files within do not inherit the MOTW after the container files are extracted and/or mounted. When files are marked with the MOTW, if they are not trusted or downloaded from the Internet, they will not be executed.
While we observed Mustang Panda using aVHD file to hide malicious files, it is worth noting that ISO files may also be used, as they are also automatically mounted.
Since PlugX is injecting itself into a trusted process, abusing a trusted executable, this threat is often detected when the outgoing Command & Control Server (C2) traffic is being discovered (usually by accident or that someone flagged the IP address as being malicious). One classic mistake I’ve observed over the years is that when companies see in their AV logs that malware has been removed, they often don’t look further into what type of malware it is, its capabilities, and whether it is nation-state related or cybercrime related. However, the appropriate incident response handling differs in approach for each.
Many nation-state actors want to be long term persistent into a network and have established ways of staying inside, even if a few of their open doors are being closed (think about valid accounts added, webshells, other backdoors, etc.). A dead C2 server can indicate this, as the actor may have used it as a first entry to the network.
For example, we recently observed what appeared to be an incident where some suspicious password dumping tools were discovered. Although the security team removed the tools, they seemed to come back into the network.
After meeting with the team and reviewing some of the logs of the incidents, it was time to grab one of my favorite (and free) tools: Velociraptor. Velociraptor is Rapid7’s advanced open-source endpoint monitoring, digital forensic and cyber response platform. It enables users to effectively respond to a wide range of digital forensic and cyber incident response investigations and data breaches.
With a ton of forensic options and hunting possibilities, the first thing was to acquire live collections of data to investigate.
After investigating the initial memory dumps, remnants were discovered where a process was talking to an outside IP address. The process itself was using a DLL that was not located in a standard location on disk. After retrieving the folder from the victim’s machine and reversing the process, it became clear: PlugX was discovered.
There are several ways Velociraptor can be used to hunt for DLL search order hijacking or sideloading. In this particular case, we’ll discuss the approach for PlugX malware.
We could hunt for:
Using the YARA toolset, we created rules for malicious or suspicious binaries and/or memory patterns. Velociraptor can use these rules to scan a bulk of data or process memory or raw memory using the ‘yara()’ or ‘proc_yara’ options.
Based on recent PlugX samples (end of 2022, beginning 2023), the we created the following rule (which can be downloaded from my Github page):

Using this rule, which is based on code patterns from the DLL component used in PlugX, Velociraptor will hunt for these DLL files and detect them. Once detected, you can look at the systems impacted, make a memory-dump, process dumps, etc., and investigate the system for suspicious activity. The directory where the DLL is stored will most likely also have the payload and trusted binary included, all written to disk at the same time.
Recently my colleague Matt Green released a repository on Github called DetectRaptor to share publicly available Velociraptor detection content. It provides you with easy-to-consume detection content to hunt for suspicious activity. One of the libraries Matt is importing is from https://hijacklibs.net/, a list of files and locations that are indicators of DLL hijacking (including PlugX). If you look at the non-Microsoft entries in the ‘hijacklibs.csv’, several instances are related to PlugX incidents reported by multiple vendors.
After importing the content, Velociraptor can start hunting and detecting possible signs of DLL hijacking and, for example, PlugX.
Happy Hunting!
Post Syndicated from original https://lwn.net/Articles/922756/
Security updates have been issued by Debian (chromium, libsdl2, and wireshark), Fedora (pesign, tpm2-tss, and webkitgtk), Oracle (hsqldb, krb5, libksba, tigervnc, and tigervnc and xorg-x11-server), Red Hat (openvswitch2.13, openvswitch2.15, openvswitch2.16, openvswitch2.17, rh-varnish6-varnish, tigervnc, and tigervnc and xorg-x11-server), Scientific Linux (tigervnc and xorg-x11-server), and SUSE (apache2, apache2-mod_security2, apr-util, netatalk, podman, python-swift3, rubygem-globalid, syslog-ng, and thunderbird).
Post Syndicated from Николай Марченко original https://bivol.bg/peevski-zlatev-gerb-gorite.html

Без много шум българските гори отново се връщат в ръцете на ДПС и ГЕРБ, с което се обясняват продължаващите кражби, незаконни сечи и източване на държавните горски предприятия, въпреки всички…
Post Syndicated from James Beswick original https://aws.amazon.com/blogs/compute/securing-ci-cd-pipelines-with-aws-sam-pipelines-and-oidc/
This post is written by Rahman Syed, Sr. Solutions Architect, State & Local Government and Brian Zambrano, Sr. Specialist Solutions Architect, Serverless.
Developers of serverless applications use the AWS Serverless Application Model (AWS SAM) CLI to generate continuous integration and deployment (CI/CD) pipelines. In October 2022, AWS released OpenID Connect (OIDC) support for AWS SAM Pipelines. This improves your security posture by creating integrations that use short-lived credentials from your CI/CD provider.
OIDC is an authentication layer based on open standards that makes it easier for a client and an identity provider to exchange information. CI/CD tools like GitHub, GitLab, and Bitbucket provide support for OIDC, which ensures that you can integrate with AWS for secure deployments.
This blog post shows how to create a GitHub Actions workflow that securely integrates with AWS using GitHub as an identity provider.
AWS SAM Pipelines is a feature of AWS SAM CLI that generates CI/CD pipeline configurations for six CI/CD systems. These include AWS CodePipeline, Jenkins, GitHub Actions, GitLab CI/CD, and BitBucket. You can get started with these AWS-curated pipeline definitions or create your own to support your organization’s standards.
CI/CD pipelines hosted outside of AWS require credentials to deploy to your AWS environment. One way of integrating is to use an AWS Identity and Access Management (IAM) user, which requires that you store the access key and secret access key within your CI/CD provider. Long-term access keys remain valid unless you revoke them, unlike temporary security credentials that are valid for shorter periods of time.
It is a best practice to use temporary, scoped security credentials generated by AWS Security Token Service (AWS STS) to reduce your risk if credentials are exposed. Temporary tokens are generated dynamically as opposed to being stored. Because they expire after minutes or hours, temporary tokens limit the duration of any potential compromise. A token scoped with least privilege limits permissions to a set of resources and prevents wider access within your environment. AWS SAM Pipelines supports short-term credentials with three OIDC providers: GitHub, GitLab, and Bitbucket.
This post shows how AWS SAM Pipelines can integrate GitHub Actions with your AWS environment using these short-term, scoped credentials powered by the OIDC open standard. It uses a two-stage pipeline, representing a development and production environment.

This example uses GitHub as the identity provider. When the dev task in the GitHub Actions workflow attempts to assume the dev pipeline execution role in the AWS account, IAM validates that the supplied OIDC token originates from a trusted source. Configuration in IAM allows role assumption from specified GitHub repositories and branches. AWS SAM Pipelines performs the initial heavy lifting of configuring both GitHub Actions and IAM using the principle of least-privileged.
To create a new serverless application:
sam init --name sam-app --runtime python3.9 --app-template hello-world --no-tracingcd sam-app
git init -b main
git add .
git commit -m "Creating a new SAM application"git remote add origin <REMOTE_URL> # e.g. https://github.com/YOURUSER/sam-app.git
git push -u origin mainGitHub offers multiple authentication mechanisms. Regardless of how you authenticate, ensure you have the “workflow” scope. GitHub Actions only allow changes to your pipeline when you push with credentials that have this scope attached.
Once the AWS SAM application is hosted in a GitHub repository, you can create CI/CD resources in AWS that support two deployment stages for the serverless application environment. This is a one-time operation.
Run the command for the first stage, answering the interactive questions:
sam pipeline bootstrap --stage devWhen prompted to choose a “user permissions provider”, make sure to select OpenID Connect (OIDC). In the next question, select GitHub Actions as the OIDC provider. These selections result in additional prompts for information that later result in a least privilege integration with GitHub Actions.
The following screenshot shows the interaction with AWS SAM CLI (some values may appear differently for you):

Run the following command and answer the interactive questions:
sam pipeline bootstrap --stage prodWith these commands, AWS SAM CLI bootstraps the AWS resources that the GitHub Actions workflow later uses to deploy the two stages of the serverless application. This includes Amazon S3 buckets for artifacts and logs, and IAM roles for deployments. AWS SAM CLI also creates the IAM identity provider to establish GitHub Actions as a trusted OIDC provider.
The following screenshot shows these resources from within the AWS CloudFormation console. These resources do not represent a serverless application, but the AWS resources a GitHub Actions workflow must perform deployments. The aws-sam-cli-managed-dev-pipeline-resources stack creates an IAM OIDC identity provider used to establish trust between your AWS account and GitHub.

The final step to creating a CI/CD pipeline in GitHub Actions is to use a GitHub source repository and two deployment targets in a GitHub Actions workflow.
To generate a pipeline configuration with AWS SAM Pipelines, run the following command and answer interactive questions:
sam pipeline initThe following screenshot shows the interaction with AWS SAM CLI (some values may appear differently for you):

AWS SAM CLI has created a local file named pipeline.yaml which is the GitHub Actions workflow definition. Inspect the pipeline.yaml file to see how the GitHub Actions workflow deploys within your AWS account:

In this example task, GitHub Actions initiates an Action named configure-aws-credentials that uses OIDC as the method for assuming an AWS IAM role for deployment activity. The credentials are valid for 3600 seconds (one hour).
To deploy the GitHub Actions workflow, commit the new file and push to GitHub:
git add .
git commit -m "Creating a CI/CD Pipeline"
git push origin main
Once GitHub receives this commit, the repository creates a new GitHub Actions Workflow, as defined by the new pipeline.yaml configuration file.
1. Navigate to the GitHub repository’s Actions view to see the first workflow run in progress.

2. Choosing the workflow run, you can see details about the deployment.

3. Once the deploy-testing step starts, open the CloudFormation console to see the sam-app-dev stack deploying.

4. The GitHub Actions Pipeline eventually reaches the deploy-prod step, which deploys the production environment of your AWS SAM application. At the end of the Pipeline run, you have two AWS SAM applications in your account deployed by CloudFormation via GitHub Actions. Every change pushed to the GitHub repository now triggers your new multi-stage CI/CD pipeline.

You have successfully created a CI/CD pipeline for a system located outside of AWS that can deploy to your AWS environment without the use of long-lived credentials.
To clean up your AWS based resources, run following AWS SAM CLI commands, answering “y” to all questions:
sam delete --stack-name sam-app-prod
sam delete --stack-name sam-app-dev
sam delete --stack-name aws-sam-cli-managed-dev-pipeline-resources
sam delete --stack-name aws-sam-cli-managed-prod-pipeline-resources
You may also return to GitHub and delete the repository you created.
AWS SAM Pipeline support for OIDC is a new feature of AWS SAM CLI that simplifies the integration of CI/CD pipelines hosted outside of AWS. Using short-term credentials and scoping AWS actions to specific pipeline tasks reduces risk for your organization. This post shows you how to get started with AWS SAM Pipelines to create a GitHub Actions-based CI/CD pipeline with two deployment stages.
The Complete AWS SAM Workshop provides you with hands-on experience for many AWS SAM features, including CI/CD with GitHub Actions.
Watch guided video tutorials to learn how to create deployment pipelines for GitHub Actions, GitLab CI/CD, and Jenkins.
For more learning resources, visit https://serverlessland.com/explore/sam-pipelines.
Post Syndicated from original https://www.backblaze.com/blog/our-journey-to-soc-2-type-2-certification/
In late December of 2022, the email arrived from the auditor. A deep breath and a mouse click later and the word “Congratulations” jumped from the screen. Backblaze had passed our SOC 2 Type 2 examination with no exceptions noted. The examination covered both our Backblaze B2 Cloud Storage service and our Backblaze Computer Backup service.
It was the end of an important milestone that had begun years ago, and we wanted to take a few minutes to look back and share the lessons we learned along the way as we created and built a successful SOC 2 certification program. Whether you’re interested in how we made the journey, or how your organization might follow in some of our footsteps, we thought the things we learned along the way were worth sharing.
SOC stands for System and Organization Controls, with SOC 2 being a voluntary compliance standard for service organizations developed by the American Institute of CPAs (AICPA). The standard is based on the Trust Services Criteria (TSC) which specifies how organizations should manage and protect customer data. The specific criteria you will use are based on your organization’s business operation and practices. An outside auditor reviews and tests your practices and procedures to ensure you are complying with those criteria.
“When it comes to selection of criteria and implementation of controls, there is no one-size-fits-all approach to identifying the scope, as it is critical for a company to first understand what controls are applicable to their products and services, and how they would fit within their very own environment.”
—Evangeline Cheung, VP and Associate General Counsel, Backblaze
Given the uniqueness of the criteria each organization will use, we are not going to get into the mechanics of SOC 2 criteria selection here. Instead we will focus on the process you can expect as you go through your SOC 2 journey.
Over the past several years, many organizations have started asking, and even requiring, their vendors to be SOC 2 compliant and verified by a third party auditor to ensure the vendor is providing a service which adheres to a defined set of industry best practices for data protection.
While Backblaze utilizes data centers which have a current SOC 2 report and/or other similar certifications such as ISAE 3402, ISO 27001, or ISO 20000, we are seeing an upward trend of customers and prospects asking for a SOC 2 report covering the Backblaze service and platform. This makes sense—while everyone is comfortable their data is safe in the data centers we use, they want to ensure our cloud storage platform and its associated applications are also safe. To address their concerns, the compliance group under our legal department kicked off our SOC 2 program.
There are many tasks you do at the beginning of any project, such as conducting a kickoff meeting, creating a project plan, and so on. We’ll focus on a handful of things you will need to do for your SOC 2 project.
Executive Buy-In: Okay, every significant company project needs this, but given the resources and support you will need for project success, this is a must. You will not be able to fly the SOC 2 certification under the radar of your CEO or CFO.
Stakeholder Buy-In: While a SOC 2 evaluation affects nearly every department in your organization, technical operations, information technology (IT), and engineering are the most impacted. Without buy-in from those departments to provide the necessary resources to create, document, and follow the required policies, procedures, and controls, you will not get far.
Seek Out Experience: Ask key stakeholders and others in their sphere if they’ve been through a SOC 2 or a similar certification before. Experience in the process is helpful, and having that knowledge with respect to your infrastructure and internal processes will provide you with meaningful inputs and feedback as you define your policies, procedures, and controls.
Build a Strong Core: Forming a core team with the key stakeholders is one of the most impactful steps in the SOC 2 process, as it helps provide visibility on the status of the project and identifies any roadblock issues.
“Having alignment cross-functionally through communication and transparency is key to the success of our SOC 2 program. Not only is getting buy-in from leadership key, but it is just as important to ensure that any process change is transparent to the rest of the organization and that input from process owners are thoughtfully considered as new controls are being introduced and implemented.”
—Evangeline Cheung, VP and Associate General Counsel, Backblaze
Outside Help Is Okay: Another source of help to consider (and budget for) is an outside consulting firm. This can be very useful, especially if your organization is new to the SOC 2 framework. Choose a consulting firm that understands and supports your objectives and is familiar with your business, preferably with references for having worked with similar firms.
Choose an Audit Firm That Knows Your Business: The audit firm you select is one of the more important decisions you’ll make. We reviewed and interviewed several firms before selecting Schellman as our auditor for our SOC 2 efforts. They had completed hundreds of audits for SOC 2, ISO 27001, PCI-DSS, and so on, and they had worked with Lumen Technologies (CenturyLink), Iron Mountain, and others on the data center side, and Litmus and others on the Software as a Service (SaaS) side. That breadth and depth of experience was a great fit for us.
Tools of the Trade: A SOC 2 examination is a large multi-departmental project. While some organizations have managed the project using spreadsheets, the complexity often leads you to look at solutions built specifically for SOC 2 and similar certifications. The category is known as Governance, Risk, and Compliance (GRC) with offerings ranging from a few hundred dollars to $50K+ a year. For Backblaze, we wanted a system that could be used for multiple types of certifications, that way we could leverage the work we did for one certification towards the next one. If you are new to SOC 2, you may want to start out with a simple, purpose-built solution. If you do, ensure that your data can be exported as needed should you decide to upgrade later on.
Don’t underestimate how long the “getting started” stage will take. Activities like selecting an auditor, choosing a consulting firm, and selecting your tools can consume months. So, start your preparation work early!
One of the decisions you’ll have to make early is where to start. The three basic steps are as follows:
If your company is new to SOC 2 and audits in general, then starting with an assessment makes the most sense, but where you start is up to you. We’ll dig into each of the steps below.
The assessment step starts with you educating your auditor about your organization. Typically the auditor will provide you with a long list of questions about your organization, how it operates, what equipment you use, what type of policies and procedures are already in place and so on. You need to be brutally honest here as many downstream actions will be based on this information. For example, based on the information you provide, the auditor will work with you to define the scope of the assessment; that is, the systems and services that will be reviewed. If you leave an important system out and the auditor finds it later, that’s—well, it’s not good. On the other hand, giving the auditor everything, whether it matters or not, can lead to an expansive, overly intrusive audit.
You’ll also spend much of your preparation time understanding the SOC 2 framework and determining what evidence you are going to use to address the SOC 2 criteria. As noted previously, the criteria and controls which apply to your business will be unique to you, although basics like risk management, disaster preparedness, encryption practices, and so on will apply in varying degrees to everyone.
We used the word evidence above; you will become very familiar with that term in the process. Evidence is the proof you need to provide the auditor to prove that your organization does indeed meet the criteria that is applicable to your organization. Evidence comes in many forms: policies, procedures, tickets, scripts, and so on.
You’ll find some evidence is useful in helping comply with multiple criteria, and you’ll find that some criteria can take 10 or more pieces of evidence to address the issue at hand. Understanding the mapping from evidence to criteria and keeping track of the evidence you have and where it applies are two of the biggest challenges in your SOC 2 project.
The actual assessment will typically be a couple of weeks long. The auditor will review your evidence and interview key employees about that evidence. Think of an assessment as a dress rehearsal. You should be ready, but the process is flexible enough for you to ask questions and fix things along the way.
The two most important learnings of an assessment are first, to determine the sufficiency of your evidence, and second, to determine how your company’s employees do in the audit process. We’ll talk more about sufficiency in a bit, because the second point is often overlooked. For example, if during the interviews your IT manager is a wall-flower—or worse, combative—in front of the auditor, you have some work to do beyond getting the evidence right.
Evidence sufficiency is a subjective term that ranges from the concrete to the creative. Sufficiency is also related to context or use. For example, a list of employees with hire dates is sufficient when you need to demonstrate who was hired in the last three months. But if the list does not have terminated employees, it does not help identify who should have access to your systems. Do you want two lists or just one? The assessment period is the time to pose and answer such questions.
After the assessment is complete, you’ll get a report outlining how well you did. It should contain a pass or fail on each of the points of focus within each criteria group. At this point, you’ll need to address how to fix the failed items and how you are going to move forward towards an actual audit.
The SOC 2 Type 1 audit is based on a date in time. The audit is all about proving to the auditor that:
As an example, you have a checklist in place for new hire onboarding. The checklist has sufficient inputs from all departments involved in bringing a new person onboard. Each quarter the human resources (HR) manager will review all new hire checklists to ensure compliance with the controls in place. You have evidence of the completed HR manager’s most recent review via a ticket in your service management or other activity tracking system.
Preparation for a SOC 2 Type 1 audit is about cleaning up any missing or incomplete items (policies, procedures, controls, etc.) found in the assessment, and taking a deep breath before you plow forward towards the audit. The assessment itself can be exhausting, especially if such a task is new to the organization and the people involved. This is a good time to assess whether you had the right employees to answer questions on the subject at hand. Were they too senior or junior? How well did they answer the questions? If you need to make changes or coach up your folks, now’s the time.
You should have at least a quarter between completing the assessment and starting the SOC 2 Type 1 audit. This gives you time to test your controls, at least the quarterly ones, and have them ready as evidence for the audit. The more “we just finished that yesterday” policies, procedures, and untested controls you have when starting the actual audit, the less prepared you will feel. The auditor may also want to dig deeper into those items to make sure they do, in fact, address the criteria appropriately and you are ready to act on them when the time comes. In short, the more evidence you have that demonstrates you have done a given task, the better off you will be.
While the SOC 2 Type 1 audit is about a point in time, the SOC 2 Type 2 audit is an evaluation of how well you document and maintain your controls over a specified evaluation period. The evaluation period is at least six months and usually no more than one year. And it is not a one-and-done thing. You will be audited at least annually to maintain your SOC 2 Type 2 certification.
The difference in the evaluation period between a Type 1 and a Type 2 is the primary reason not to jump from an assessment directly to a Type 2 audit. If you jump straight into Type 2 and you have missing or insufficient controls, you won’t know until the Type 2 audit itself, and it is too late at that point. This could lead to an exception or worse for a given criterion.
You may be able to pass a SOC 2 Type 2 examination with a limited number of exceptions, but they will be listed in the SOC 2 Type 2 audit report for all to see. You will be able to respond to any exceptions found, with your response being part of the final report. Still, it is not a good look regardless of the circumstances. Doing the SOC 2 Type 1 audit first allows you to determine whether your controls are sufficient before placing them into practice. This will minimize potential exceptions in your SOC 2 Type 2 audit that are based solely on insufficient controls.
One mistake that is easy to make is to have all your quarterly reviews done on the same date each quarter, or even in the same month. This is especially vexing to everyone when the reviews are piled into the last month of a fiscal reporting period. Spread out the reviews of the various controls. They can be done anytime as long as they meet the cadence you specified. It’s perfectly fine to have a quarterly review on the 15th of February, May, and so on.
One way reviews can be scheduled is by using the GRC application we mentioned earlier. The nice part of using the GRC application here is that the review can be tied directly to the control, which in turn is tied to the criteria you are attempting to satisfy. The evidence gathered in the review can be captured (or linked to) in the application, then, at audit time, the review and supporting documentation are readily available.
For a SOC 2 Type 2 audit you will have to demonstrate that you performed and recorded the actions specified by the policies, procedures, and controls you devised to meet the SOC 2 criteria over the evaluation period. Here are a few examples:
At its core, the SOC 2 Type 2 is about demonstrating your ability to consistently enact and follow industry best practices across your organization over a period of time and then demonstrate that to the auditor.
During the initial SOC 2 Type 1 assessment you will meet the actual auditors who are doing the audit. There are usually two or three auditors, each focusing on a different area where they have some expertise. As you work with each of these folks, you need to decide if this is the auditor you’ll want to use in future audits, including SOC 2 Type 1, and so on. After completing the assessment, the auditor will have a decent understanding of your organization and its quirks and capabilities. Swapping out auditors or even audit firms between the different SOC 2 phases means you’ll be starting from nearly ground zero each time.
The only downside to wanting to use the same auditor for each SOC 2 audit is you may have to wait for them to have a future hole in their schedule to conduct the next audit. Still, the consistency gained is worth the wait if, each time, you can have the same auditor with prior knowledge of how your company works.
The entire SOC 2 process, from the initial assessment through annual SOC 2 Type 2 renewals, adds rigor and consistency to many of the processes and procedures you already have in place. It also helps you identify deficiencies and correct them along the way. You don’t have any deficiencies you say? Well good on you, but keep an open mind as you go through the process—just in case.
Thanks for joining us as we celebrate our first SOC 2 journey. In the end there was little tomfoolery, no bloodshed, and no one got lost under a mound of paperwork. Hopefully there were a few nuggets of useful information that can help you along the way on your own SOC 2 odyssey. Of course, as this SOC 2 Type 2 journey ends, we start a new one, as each year we will be audited to ensure our continued compliance. Onward.
The post Our Journey to SOC 2 Type 2 Certification appeared first on Backblaze Blog | Cloud Storage & Cloud Backup.
Post Syndicated from BeardedTinker original https://www.youtube.com/watch?v=-BxQ0BH0HHk
Post Syndicated from Bruce Schneier original https://www.schneier.com/blog/archives/2023/02/mary-queen-of-scots-letters-decrypted.html
This is a neat piece of historical research.
The team of computer scientist George Lasry, pianist Norbert Biermann and astrophysicist Satoshi Tomokiyo—all keen cryptographers—initially thought the batch of encoded documents related to Italy, because that was how they were filed at the Bibliothèque Nationale de France.
However, they quickly realised the letters were in French. Many verb and adjectival forms being feminine, regular mention of captivity, and recurring names—such as Walsingham—all put them on the trail of Mary. Sir Francis Walsingham was Queen Elizabeth’s spymaster.
The code was a simple replacement system in which symbols stand either for letters, or for common words and names. But it would still have taken centuries to crunch all the possibilities, so the team used an algorithm that homed in on likely solutions.
EDITED TO ADD (2/13): More news.
Post Syndicated from Claire Given original https://www.raspberrypi.org/blog/codealong-astro-pi-mission-zero-2023/
Today we’re sharing an Astro Pi Mission Zero codealong video to help even more young people send their code into space.
In Mission Zero, young people write a simple program and display a colourful image on an Astro Pi computer on board the International Space Station (ISS). When the astronauts on mission on the ISS are working nearby, they can see the images young people have designed.
No coding experience is needed for Mission Zero. It’s a free and inspiring beginners’ coding activity. All young people need is an hour to write the program, a web browser on any computer with internet access, and an adult mentor who can register online to access the Mission Hub (see below).
In the codealong video, Rebecca from our team shows young people how to write their Mission Zero program step by step. We hope that it will open up this amazing coding activity to even more young people. (There’s also the written guide to creating your program, available in 20 languages.)

Young people up to age 19 in ESA Member States are invited to take part, individually or as teams (see the eligibility details).
Every participant will receive a piece of space science history to keep: a personalised certificate they can download, which shows their Mission Zero program’s exact start and end time, and the position of the ISS while their program ran.

The theme to inspire images for Mission Zero this year is ‘flora and fauna’, to remind the ISS astronauts of their home. The images can show anything from flowers and trees to birds, insects, and other animals. Young people could even create a series of images to show as an animation during the 30 seconds their program will run.
Mission Zero 2022/23 is open until 17 March 2023.
If you’re an adult mentor supporting young people to take part, read the mission guidelines to find out all you need to know. You can also watch this short video showing you exactly how to register to access the Mission Hub and get the code to identify your young people’s programs.

The post Code along with our Astro Pi Mission Zero video appeared first on Raspberry Pi.
Post Syndicated from David Boyne original https://aws.amazon.com/blogs/compute/implementing-architectural-patterns-with-amazon-eventbridge-pipes/
This post is written by Dominik Richter (Solutions Architect)
Architectural patterns help you solve recurring challenges in software design. They are blueprints that have been used and tested many times. When you design distributed applications, enterprise integration patterns (EIP) help you integrate distributed components. For example, they describe how to integrate third-party services into your existing applications. But patterns are technology agnostic. They do not provide any guidance on how to implement them.
This post shows you how to use Amazon EventBridge Pipes to implement four common enterprise integration patterns (EIP) on AWS. This helps you to simplify your architectures. Pipes is a feature of Amazon EventBridge to connect your AWS resources. Using Pipes can reduce the complexity of your integrations. It can also reduce the amount of code you have to write and maintain.
The content filter pattern removes unwanted content from a message before forwarding it to a downstream system. Use cases for this pattern include reducing storage costs by removing unnecessary data or removing personally identifiable information (PII) for compliance purposes.
In the following example, the goal is to retain only non-PII data from “ORDER”-events. To achieve this, you must remove all events that aren’t “ORDER” events. In addition, you must remove any field in the “ORDER” events that contain PII.
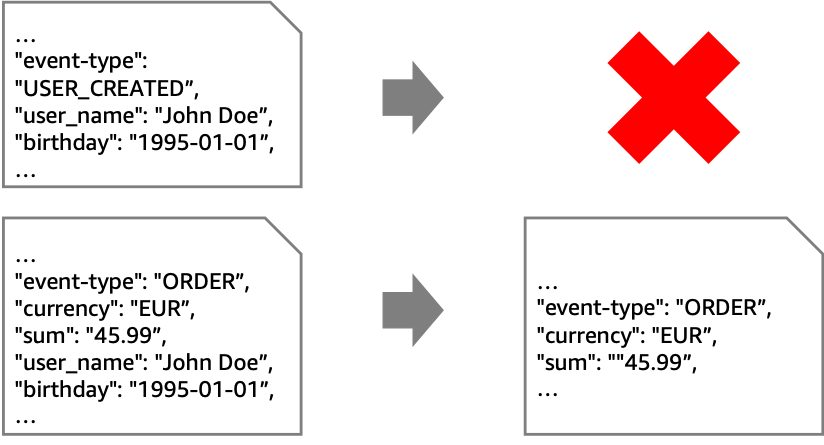
While you can use this pattern with various sources and targets, the following architecture shows this pattern with Amazon Kinesis. EventBridge Pipes filtering discards unwanted events. EventBridge Pipes input transformers remove PII data from events that are forwarded to the second stream with longer retention.

Instead of using Pipes, you could connect the streams using an AWS Lambda function. This requires you to write and maintain code to read from and write to Kinesis. However, Pipes may be more cost effective than using a Lambda function.
Some situations require an enrichment function. For example, if your goal is to mask an attribute without removing it entirely. For example, you could replace the attribute “birthday” with an “age_group”-attribute.

In this case, if you use Pipes for integration, the Lambda function contains only your business logic. On the other hand, if you use Lambda for both integration and business logic, you do not pay for Pipes. At the same time, you add complexity to your Lambda function, which now contains integration code. This can increase its execution time and cost. Therefore, your priorities determine the best option and you should compare both approaches to make a decision.
To implement Pipes using the AWS Cloud Development Kit (AWS CDK), use the following source code. The full source code for all of the patterns that are described in this blog post can be found in the AWS samples GitHub repo.
const filterPipe = new pipes.CfnPipe(this, 'FilterPipe', {
  roleArn: pipeRole.roleArn,
  source: sourceStream.streamArn,
  target: targetStream.streamArn,
  sourceParameters: { filterCriteria: { filters: [{ pattern: '{"data" : {"event_type" : ["ORDER"] }}' }] }, kinesisStreamParameters: { startingPosition: 'LATEST' } },
  targetParameters: { inputTemplate: '{"event_type": <$.data.event_type>, "currency": <$.data.currency>, "sum": <$.data.sum>}', kinesisStreamParameters: { partitionKey: 'event_type' } },
});
To allow access to source and target, you must assign the correct permissions:
const pipeRole = new iam.Role(this, 'FilterPipeRole', { assumedBy: new iam.ServicePrincipal('pipes.amazonaws.com') });

sourceStream.grantRead(pipeRole);
targetStream.grantWrite(pipeRole);
In an event-driven architecture, event producers and consumers are independent of each other. Therefore, they may exchange events of different formats. To enable communication, the events must be translated. This is known as the message translator pattern. For example, an event may contain an address, but the consumer expects coordinates.

If a computation is required to translate messages, use the enrichment step. The following architecture diagram shows how to accomplish this enrichment via API destinations. In the example, you can call an existing geocoding service to resolve addresses to coordinates.

There may be cases where the translation is purely syntactical. For example, a field may have a different name or structure.

You can achieve these translations without enrichment by using input transformers.

Here is the source code for the pipe, including the role with the correct permissions:
const pipeRole = new iam.Role(this, 'MessageTranslatorRole', { assumedBy: new iam.ServicePrincipal('pipes.amazonaws.com'), inlinePolicies: { invokeApiDestinationPolicy } });

sourceQueue.grantConsumeMessages(pipeRole);
targetStepFunctionsWorkflow.grantStartExecution(pipeRole);

const messageTranslatorPipe = new pipes.CfnPipe(this, 'MessageTranslatorPipe', {
  roleArn: pipeRole.roleArn,
  source: sourceQueue.queueArn,
  target: targetStepFunctionsWorkflow.stateMachineArn,
  enrichment: enrichmentDestination.apiDestinationArn,
  sourceParameters: { sqsQueueParameters: { batchSize: 1 } },
});
The normalizer pattern is similar to the message translator but there are different source components with different formats for events. The normalizer pattern routes each event type through its specific message translator so that downstream systems process messages with a consistent structure.

The example shows a system where different source systems store the name property differently. To process the messages differently based on their source, use an AWS Step Functions workflow. You can separate by event type and then have individual paths perform the unifying process. This diagram visualizes that you can call a Lambda function if needed. However, in basic cases like the preceding “name” example, you can modify the events using Amazon States Language (ASL).

In the example, you unify the events using Step Functions before putting them on your event bus. As is often the case with architectural choices, there are alternatives. Another approach is to introduce separate queues for each source system, connected by its own pipe containing only its unification actions.
![]()
This is the source code for the normalizer pattern using a Step Functions workflow as enrichment:
const pipeRole = new iam.Role(this, 'NormalizerRole', { assumedBy: new iam.ServicePrincipal('pipes.amazonaws.com') });

sourceQueue.grantConsumeMessages(pipeRole);
enrichmentWorkflow.grantStartSyncExecution(pipeRole);
normalizerTargetBus.grantPutEventsTo(pipeRole);

const normalizerPipe = new pipes.CfnPipe(this, 'NormalizerPipe', {
  roleArn: pipeRole.roleArn,
  source: sourceQueue.queueArn,
  target: normalizerTargetBus.eventBusArn,
  enrichment: enrichmentWorkflow.stateMachineArn,
  sourceParameters: { sqsQueueParameters: { batchSize: 1 } },
});
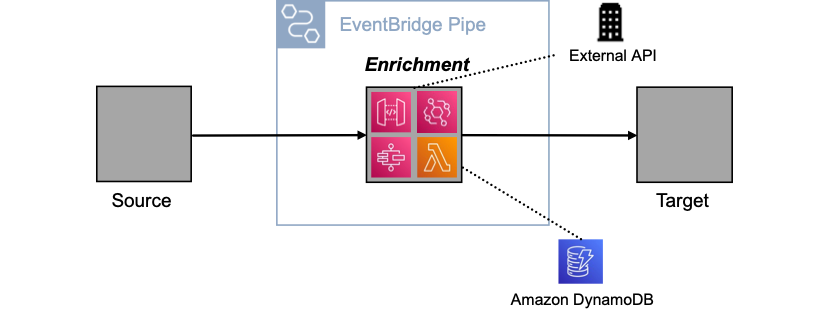
To reduce the size of the events in your event-driven application, you can temporarily remove attributes. This approach is known as the claim check pattern. You split a message into a reference (“claim check”) and the associated payload. Then, you store the payload in external storage and add only the claim check to events. When you process events, you retrieve relevant parts of the payload using the claim check. For example, you can retrieve a user’s name and birthday based on their userID.

The claim check pattern has two parts. First, when an event is received, you split it and store the payload elsewhere. Second, when the event is processed, you retrieve the relevant information. You can implement both aspects with a pipe.
In the first pipe, you use the enrichment to split the event, in the second to retrieve the payload. Below are several enrichment options, such as using an external API via API Destinations, or using Amazon DynamoDB via Lambda. Other enrichment options are Amazon API Gateway and Step Functions.
Using a pipe to split and retrieve messages has three advantages. First, you keep events concise as they move through the system. Second, you ensure that the event contains all relevant information when it is processed. Third, you encapsulate the complexity of splitting and retrieving within the pipe.
The following code implements a pipe for the claim check pattern using the CDK:
const pipeRole = new iam.Role(this, 'ClaimCheckRole', { assumedBy: new iam.ServicePrincipal('pipes.amazonaws.com') });

claimCheckLambda.grantInvoke(pipeRole);
sourceQueue.grantConsumeMessages(pipeRole);
targetWorkflow.grantStartExecution(pipeRole);

const claimCheckPipe = new pipes.CfnPipe(this, 'ClaimCheckPipe', {
  roleArn: pipeRole.roleArn,
  source: sourceQueue.queueArn,
  target: targetWorkflow.stateMachineArn,
  enrichment: claimCheckLambda.functionArn,
  sourceParameters: { sqsQueueParameters: { batchSize: 1 } },
  targetParameters: { stepFunctionStateMachineParameters: { invocationType: 'FIRE_AND_FORGET' } },
});
This blog post shows how you can implement four enterprise integration patterns with Amazon EventBridge Pipes. In many cases, this reduces the amount of code you have to write and maintain. It can also simplify your architectures and, in some scenarios, reduce costs.
You can find the source code for all the patterns on the AWS samples GitHub repo.
For more serverless learning resources, visit Serverless Land. To find more patterns, go directly to the Serverless Patterns Collection.
Post Syndicated from Анета Василева original https://www.toest.bg/venetsia-bulgaria-i-izostavenitie-sgradi/

През 2014 г., точно на символната дата 10 ноември, съвсем случайно попаднах в едно изоставено училище. Намираше се в малко село близо до София, в подножието на Средна гора. Подобно на повечето български села, през социализма и това е било снабдено със задължителния комплект обществени сгради и пространства, които се редуваха край река Тополница: площад с читалище, после училище, а малко по-нагоре от тях – кметство с поща. Училището беше голямо, триетажно, но напълно изоставено – по онзи начин, по който хипстъри и урбекс фотографи обожават: с раздут паркет на големи вълнообразни бабуни, с туфи от гъби, прораснали между разместените дъбови паркетини, със старо дървено сметало, облегнато в ъгъла, прашен портрет на Георги Димитров, нахвърляни детски книжки с прекрасни шрифтове и илюстрации и едно „Здравейте“, надраскано с тебешир на зелената дъска.
Тогава написах, че и най-обикновената сграда може да послужи за метафора на близкото ни минало: от универсалното градоустройство (на социалистическите села), през доброто пропорциониране (на сградите) и продуктовия дизайн (на книгите), до урбанистичните и икономическите катастрофи, довели до обезлюдени села и пренаселени панелни комплекси.
Сега бих добавила: та чак до екзотично-колоритния начин, по който сградите умират.
През 2023 г. България ще участва за пръв път от 15 години във Венецианското архитектурно биенале с проект за изоставените училища в страната.
обявен от Министерството на културата на 20 декември 2022 г. Те работят с белгийския фотограф Александър Думарей, който от 2016 г. документира стотици неизползвани и рушащи се училища в България като портрет на обезлюдяването в една държава с рекордно намаляващо население.
Снимковият материал ще бъде обогатен и съпътстван от социологическа информация, архивни снимки на изоставените училища, архитектурно заснемане на някои от сградите, както и от предмети, донесени от училищата на Биеналето,
пишат архитектите.
България се завръща на венецианска сцена в една трудна година. Пандемията промени календара на събитията на La Biennale di Venezia и спря инерцията от предходните силни последователни архитектурни издания – на холандеца Рем Кулхас през 2014 г. (с темите Fundamentals и Defining Modernity 1914–2014), на чилиеца Алехандро Аравена през 2016 г. (с ярко социалната тема Reporting from the Front) и на ирландките Ивон Фарел и Шели Макнамара от Grafton Architects (с темата Freespace) през 2018 г. Това бяха три много фокусирани биеналета, които действаха като рупор – хващаха идеята на куратора и я усилваха в общия хор на всички участници така, че да отекне по цял свят и да се запомни. След пауза, през 2021 г., ливанецът Хашим Саркис, декан на Училището по архитектура и урбанизъм към Масачузетския технологичен институт, имаше шанс да се обърне към постпандемичния свят с темата си How do we live together?, но не успя да каже нищо ново във време, което беше натежало от очаквания за архитектурен коментар на глобалния пандемичен феномен.
И така, вече сме 2023 г., когато британската архитектка от ганайски произход Лесли Локо стана първата цветнокожа жена куратор на Архитектурното биенале във Венеция и призова целия свят да мисли за бъдещето през темата Африка – най-младия континент, който може да се окаже една „Лаборатория на бъдещето“. Тя възприема думата „лаборатория“ по-скоро като „работилница“, където архитектите от цял свят да се съберат и да ангажират публиката и себе си в едно колективно усилие да гледаме напред.
Още преди откриването на Биеналето и само няколко дни след обявяването на българските участници, нашата публика вече беше ангажирана да коментира – точно както Лесли Локо призовава. „Развита Африка срещу загнила България: позорен проект представя страната ни във Венеция“, пише BGNES в анонимна статия от 29 януари. „Архитекти скочиха срещу проекта с изоставени училища за Венеция“, алармира вестник „Сега“ на 30 януари. На пресконференцията, организирана от Министерството на културата на 30 януари, се чуха мнения, че проектът няма нищо общо с темата, че няма нищо общо с Африка, че няма нищо общо с архитектурата и е прекалено фотографски, че излага България. „Шокирани сме от избора на журито. Има ли смисъл да участваме с такъв скандално лош проект?“, изказа се участвалият в конкурса архитект Стефан Добрев. „Журито е некомпетентно и трябва да понесе отговорност за този огромен провал, а членовете му никога повече да не участват в никакво жури!“, продължи да коментира той в социалните мрежи.
„Изглежда, че ще е поредното носталгично, самосъжалително и милозливо позьорство. На мен лично отдавна ми писна да ни представят като просяци на съчувствие и снизхождение „от чужденците“. Сигурно и на тях им е писнало да ни гледат какви сме порутени и изостанали – и буквално, и преносно“, пише бившият председател на Камарата на архитектите и участник в конкурса Борислав Игнатов. „Дали докато се въртим около тия стари изоставени сгради и тяхната социална и сантиментална стойност – първо няма да ни нагазят бежанците, а после няма да дойдат роботите с техния изкуствен интелект и да ни отвеят?“, пита друг участник, архитект Димитър Паскалев.
„Участието на България в Архитектурното биенале във Венеция след 15 години отсъствие очаквано затъна в скандал“, заключава вестник „Сега“ след министерската пресконференция.
Има ли реално скандал и къде наистина е проблемът?
Скандал няма. Но има една мечта – Венеция.
Мобилизацията на българските архитекти за участие в конкурса за кураторски проект и българско присъствие на 18-тото Архитектурно биенале във Венеция беше забележителна. Въпреки изключително късното обявяване (27 дни преди финалното предаване на проектите за национални павилиони към организаторите във Венеция, за което някои страни са готови година и повече предварително), въпреки шокиращо краткия срок (14 работни дни около коледно-новогодишните празници), въпреки абсурдния бюджет (70 000 лв. за изложба във Венеция), въпреки трудната тема (Африка и бъдещето заедно си е тегав постколониализъм), конкурсът успя да събере в срок 33 предложения, повечето от които съвсем адекватни. Това показва силната амбиция на българските архитекти най-после да излязат на истинска международна сцена.
Сред проектите има футуристи, които се занимават с изкуствен интелект, augmented reality и иновации („Тунел на ускореното време“, „Архилект“, Augmented History, „Бъдеще споделено“), има еколози, които показват възобновяеми източници и използването на неизползваеми материали, включително клони (Wind Up Future, „Раз,клон“), има комуникатори, които събират хора и показват, че архитектурата е и общуване („Пясъчник – временно училище за градско взаимодействие“, „Играй! Пробвай! Греши!“), има и такива, които събират и екология, и общуване, и преизползване, и бъдеще в едно комплексно и осмислено цяло („От нищо нещо“).
Изобщо, все теми, които стоят добре във Венеция.


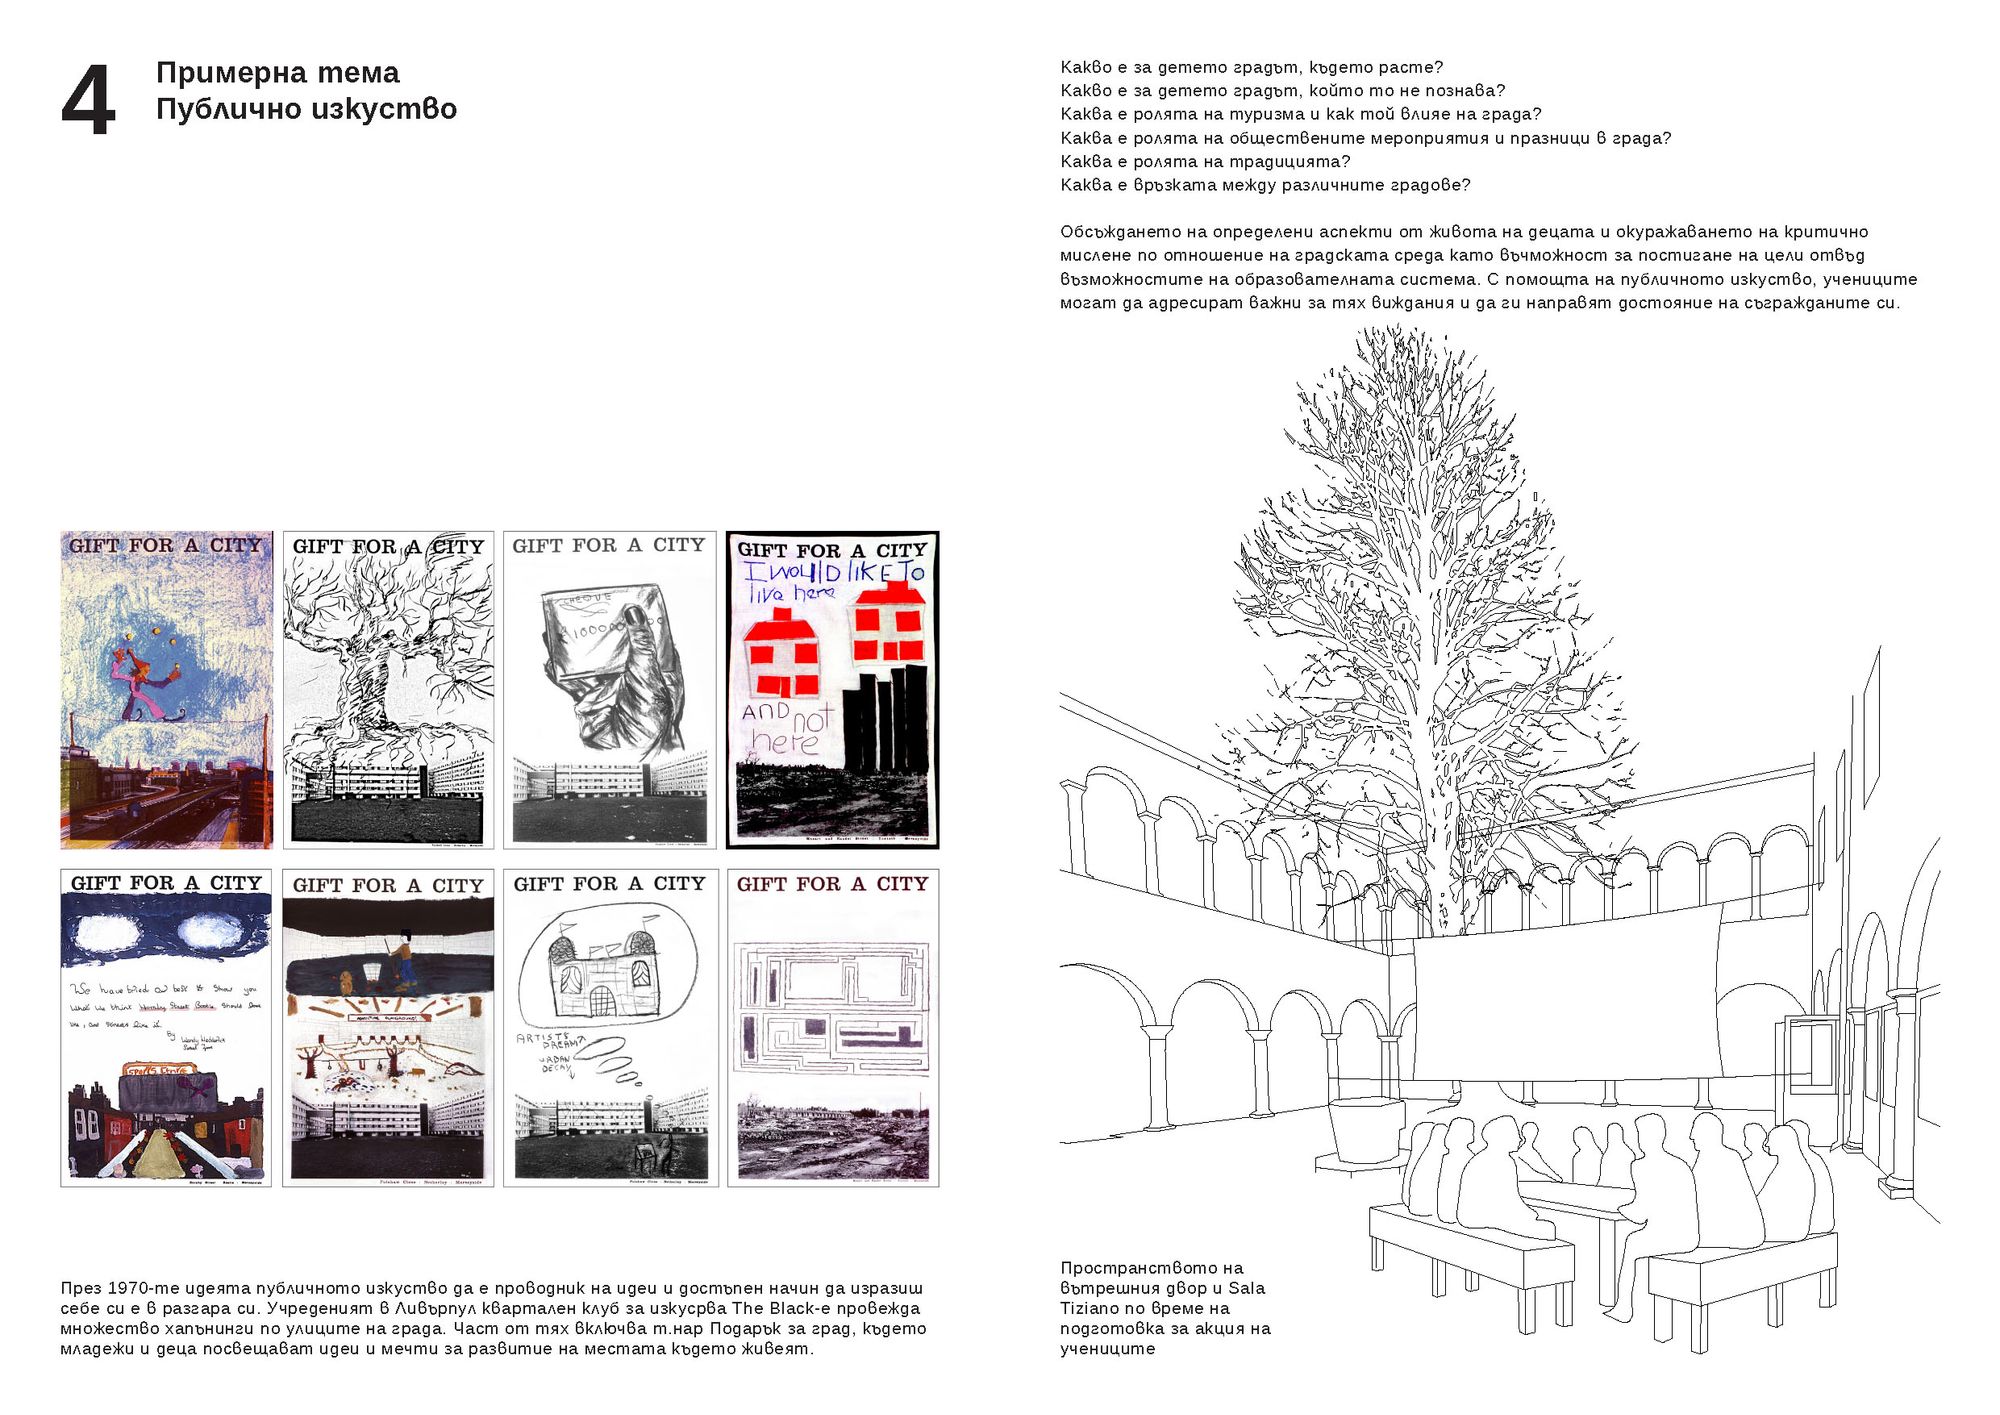
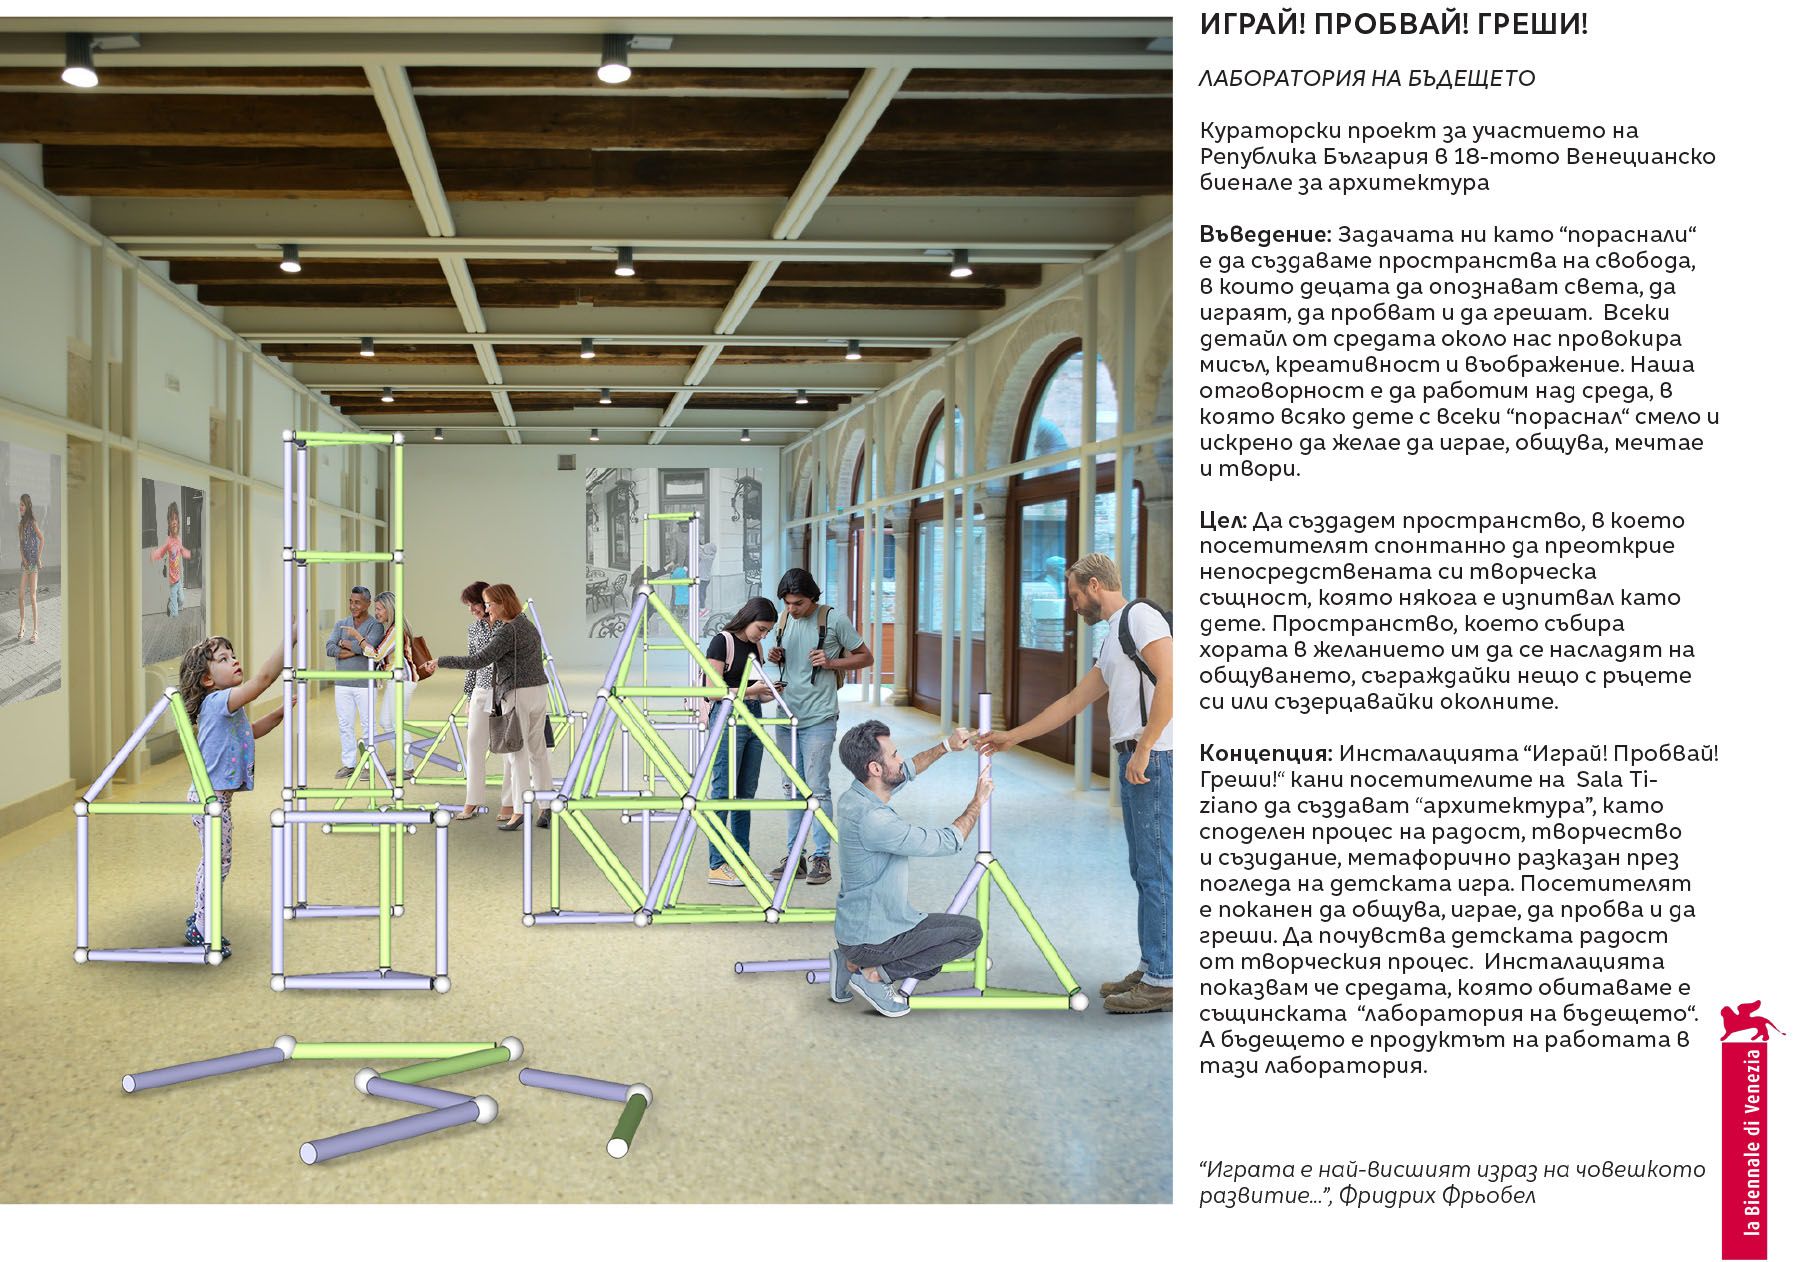

Избраните POV Architects са се захванали с не по-малко важна тема.
напълно в духа на последните архитектурни изложби във Венеция, които обикновено не странят от проблемите. Нарочно не се съобразяваме с темата на Биеналето („Лаборатория на бъдещето“), казва Борис Тикварски в скорошно интервю пред БНР, защото човек може да мисли за бъдещето едва когато е решил проблемите на настоящето. Възможен отговор. POV Architects впрочем не са нито неопитни, нито непознати и освен всичко друго са умели конкурсаджии, обикновено на челни позиции в повечето смислени архитектурни конкурси, организирани у нас през последните години.
Къде е проблемът тогава?
Печелившият проект на POV Architects не е единственият от участниците в конкурса, който се занимава със стари сгради, с образованието и обезлюдяването. Темата за наследството и изоставените сгради се просмуква в предложенията на повечето участници, които с право свързват бъдещето с преработване на миналото.
„Училище на бъдещето“ на Ая Тодорова преизползва стари мебели в класна стая, превърната в ретрофутуристка лаборатория. „Ретроспекции в бъдеще време“ на Студио НАДА се занимава с изоставените места като „времеубежища“, по Георги Господинов, и също не дава рецепта за бъдещето, а само очертава път. „Времево разфокусиране“ на „Аедес студио“ работи със „Сляпата Вайша“, пак на Господинов, за да гледа едновременно назад и напред. „Минало бъдеще“ на Studio 8 ½ призовава на изоставените сгради да се погледне като възможност за развитие, а не като бреме. Laboratory of Future (Tomorrow) на Надежда Сучева преоткрива българското село – включително изоставените къщи и обезлюдените места, които могат да имат бъдещ живот.
Имаме всякакви изоставени обекти – училища, къщи, села. Честно казано, очаквах и изоставени бани да видя.

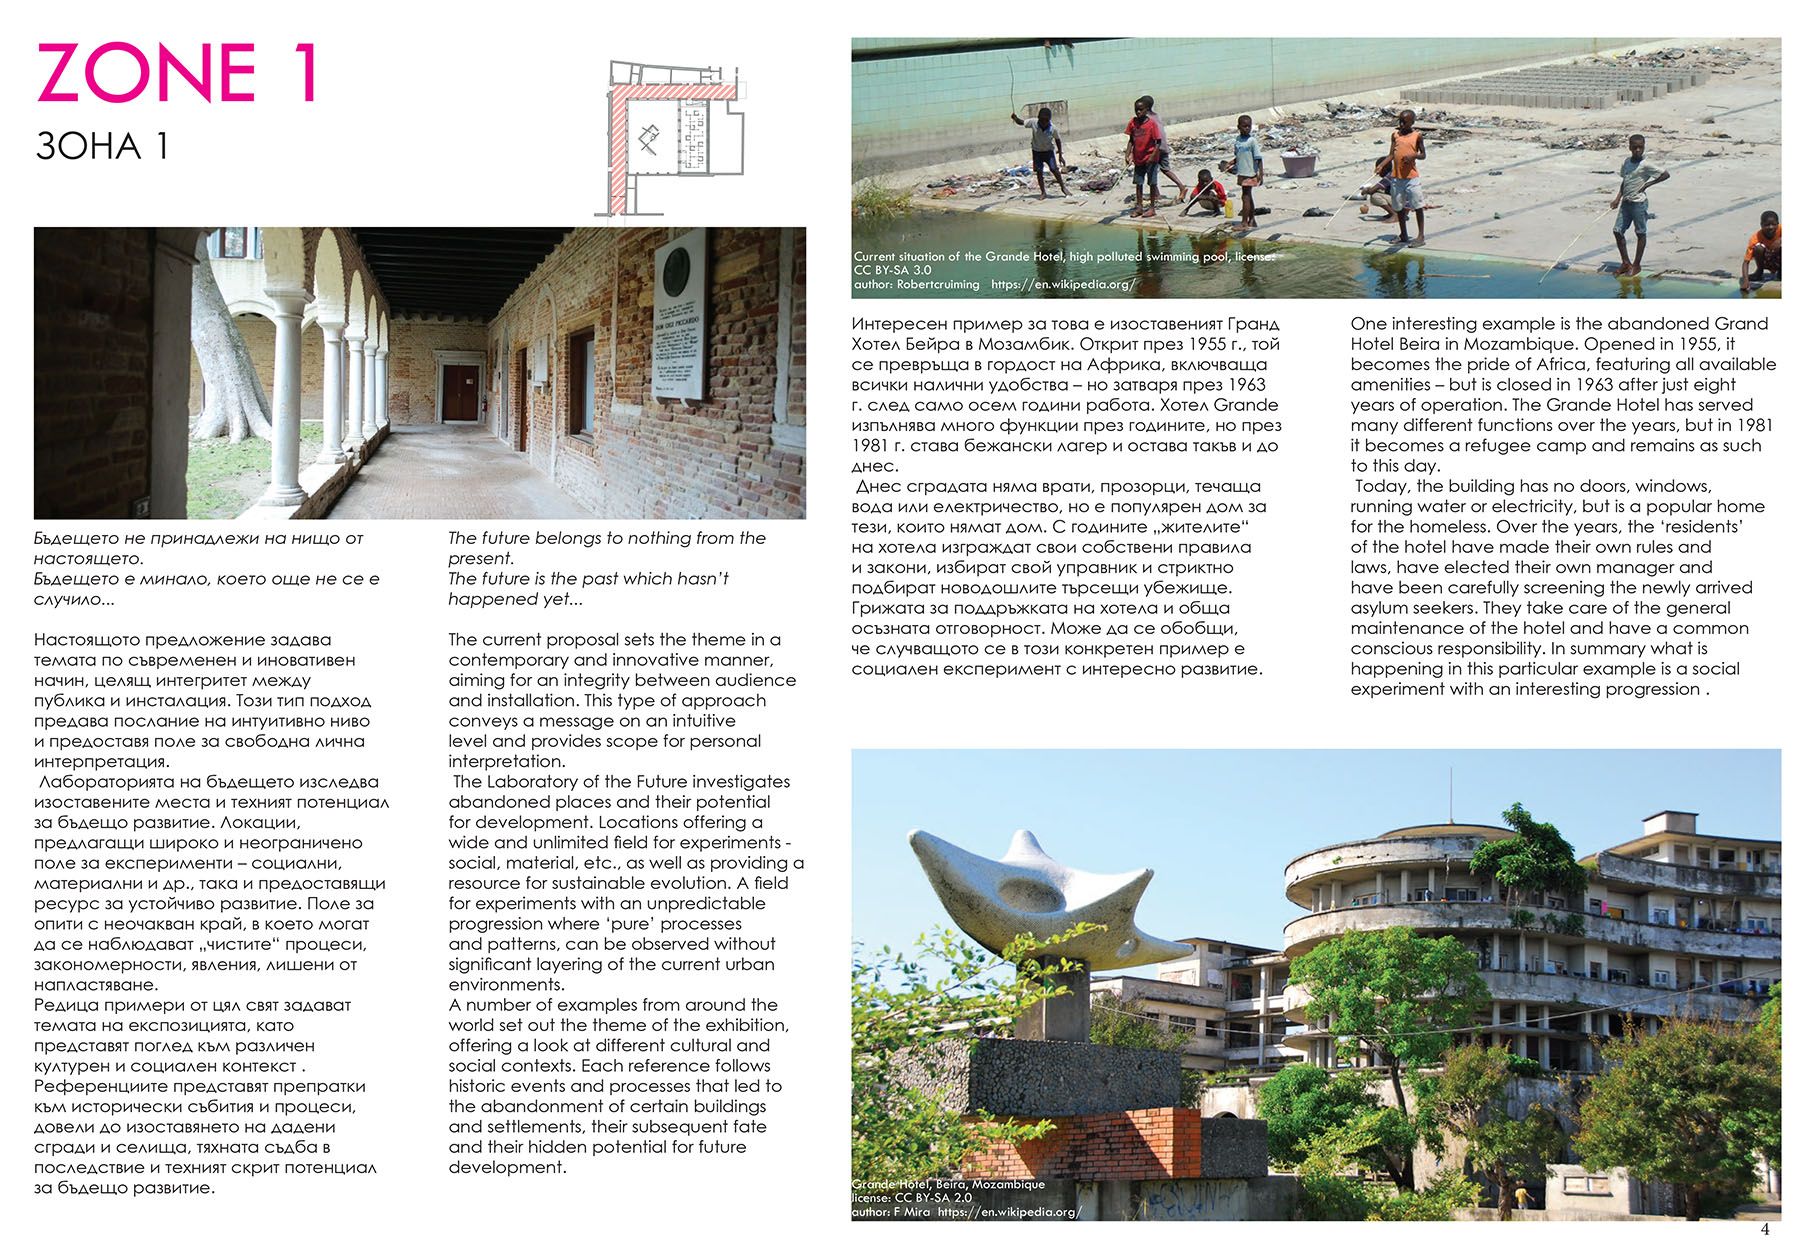


Фотографите обичат изоставени сгради. Uchilishte не е единственият подобен проект и на фотографа Александър Думарей. Той има серии с изоставени плувни басейни, бензиностанции, с рушащи се индустриални сгради. Обикновено не става ясно къде са тези места – те са безименни и безконтекстни, може да бъдат навсякъде, а авторът е само в позицията на регистриращ. Серията с училищата обаче е позиционирана в България – дори само чрез транслитерираната българска дума, която я озаглавява. Но отново Думарей документира, без да коментира, училищата нямат локация, нито информация кога са били изоставени, всичко е едно.
Имаме възможност да изследваме сградите, преди те да станат неузнаваеми или просто празни имоти. Целта на експозицията е да се улови един миг във времето и обективно, а не емоционално да зададем въпроси и да извлечем поуки. Това е опит да поемем отговорност и да приемем тези сгради като стопани,
пишат POV Architects в аргументацията на проекта си.
А после? Как постигаме промяната?
Има две причини да се отиде до Венеция: да кажеш нещо на света и да кажеш нещо вкъщи през света.
От много години България настига света и се опитва да прави второто – през погледа на чужденците да се фокусира върху местни проблеми. Ако ги изнесем навън, ако станат популярни, то тогава може би и вкъщи ще им обърнат внимание: ще преборим корупцията, ще спрем да събаряме паметници на културата и прочее.
Това неизказано въжделение се бори с още едно. Да се покажем навън в най-добрата си светлина, като накипрена мома, която танцува на световно изложение в Париж – колоритна, красива, невиждана.
Аз обаче смятам, че българското общество вече е достатъчно зряло – или поне не е по-различно от всички останали в глобалния свят, в който живеем. България отдавна страда от проблемите и на „първия свят“ – включително архитектурни – и може съвсем спокойно да ги коментира редом с „големите играчи“. Нещо повече, има потенциал да задава нови теми за разговор, а защо не и да предлага решения. Такива са всички теми на българските участници, които изброих по-горе, и не само.
Трябва смелост – ние не сме екзотична дестинация, която само да забавлява света с черги, песни, шевици и Бузлуджа. Имаме какво да кажем и можем да го направим дори и през осветляването на проблемите – отпадъците и преизползването, изоставените сгради и обезлюдяването, образованието и ниската раждаемост, самотата на високите технологии.
И ето тук се крие същинският въпрос.
Сякаш не смее да каже нещо отвъд instagramable снимките на Думарей. А би могло – има цяла една зона в изложбеното пространство, отделена за това.


Изоставените и неизползваните сгради са проблем – проблем и на България, и на света. Той няма да се реши днес. През него обаче може да се говори за демография, за екология, за строителство, за културно наследство, за общество, образование и култура, за градска среда и урбанистични процеси, за климатичната криза, бетон и преизползване на материали, за паметта и миналото, за бъдещето (на архитектурата) и изобщо.
POV Architects имат три месеца до откриването, в които да изпълнят зала „Тициан“ със съдържание, да организират събития, да направят връзки с други национални павилиони, които се занимават със същата проблематика, да създадат онази работилница на бъдещето, за която си мечтае Лесли Локо. Хайде!
Защото това е голямата тема на тазгодишното Биенале – или би трябвало да бъде. В едно разделено общество да спрем да се спасяваме в миналото, в изолация, национализъм и регрес и да посмеем да гледаме напред, пък дори и да изглеждаме наивни и демодирано-утопични.
Post Syndicated from original https://lwn.net/Articles/921958/
The LWN.net Weekly Edition for February 9, 2023 is available.