January 25, 2023: We updated this post to reflect the fact that CloudHSM SDK3 does not support serverless environments and we strongly recommend deploying SDK5.
AWS CloudHSM provides hardware security modules (HSMs) in the AWS Cloud. With CloudHSM, you can generate and use your own encryption keys in the AWS Cloud, and manage your keys by using FIPS 140-2 Level 3 validated HSMs. Your HSMs are part of a CloudHSM cluster. CloudHSM automatically manages synchronization, high availability, and failover within a cluster.
CloudHSM is part of the AWS Cryptography suite of services, which also includes AWS Key Management Service (AWS KMS), AWS Secrets Manager, and AWS Private Certificate Authority (AWS Private CA). AWS KMS, Secrets Manager, and AWS Private CA are fully managed services that are convenient to use and integrate. You’ll generally use CloudHSM only if your workload requires single-tenant HSMs under your own control, or if you need cryptographic algorithms or interfaces that aren’t available in the fully managed alternatives.
This solution demonstrates how to create a Docker container that uses the CloudHSM JCE SDK to generate a key and use it to encrypt and decrypt data.
Note: In this example, you must manually enter the crypto user (CU) credentials as environment variables when you run the container. For production workloads, you’ll need to consider how to secure and automate the handling and distribution of these credentials. You should work with your security or compliance officer to ensure that you’re using an appropriate method of securing HSM login credentials. For more information on securing credentials, see AWS Secrets Manager.
Figure 1 shows the solution architecture. The Java application, running in a Docker container, integrates with JCE and communicates with CloudHSM instances in a CloudHSM cluster through HSM elastic network interfaces (ENIs). The Docker container runs in an EC2 instance, and access to the HSM ENIs is controlled with a security group.
Figure 1: Architecture diagram
Prerequisites
To implement this solution, you need to have working knowledge of the following items:
CloudHSM
Docker 20.10.17 – used at the time of this post
Java 8 or Java 11 – supported at the time of this post
Maven 3.05 – used at the time of this post
Here’s what you’ll need to follow along with my example:
An active CloudHSM cluster with at least one active HSM instance. You can follow the CloudHSM getting started guide to create, initialize, and activate a CloudHSM cluster.
Note: For a production cluster, you should have at least two active HSM instances spread across Availability Zones in the Region.
An Amazon Linux 2 EC2 instance in the same virtual private cloud (VPC) in which you created your CloudHSM cluster. The Amazon Elastic Compute Cloud (Amazon EC2) instance must have the CloudHSM cluster security group attached—this security group is automatically created during the cluster initialization and is used to control network access to the HSMs. To learn about attaching security groups to allow EC2 instances to connect to your HSMs, see Create a cluster in the AWS CloudHSM User Guide.
In this section, I’ll walk you through how to download, configure, compile, and run a solution in Docker.
To set up Docker and run the application that encrypts and decrypts data with a key in AWS CloudHSM
On your Amazon Linux EC2 instance, install Docker by running the following command.
# sudo yum -y install docker
Start the docker service.
# sudo service docker start
Create a new directory and move to it. In my example, I use a directory named cloudhsm_container. You’ll use the new directory to configure the Docker image.
 # mkdir cloudhsm_container
 # cd cloudhsm_container
Copy the CloudHSM cluster’s trust anchor certificate (customerCA.crt) to the directory that you just created. You can find the trust anchor certificate on a working CloudHSM client instance under the path /opt/cloudhsm/etc/customerCA.crt. The certificate is created during initialization of the CloudHSM cluster and is required to connect to the CloudHSM cluster. This enables our application to validate that the certificate presented by the CloudHSM cluster was signed by our trust anchor certificate.
In your new directory (cloudhsm_container), create a new file with the name run_sample.sh that includes the following contents. The script runs the Java class that is used to generate an Advanced Encryption Standard (AES) key to encrypt and decrypt your data.
In the new directory, create another new file and name it Dockerfile (with no extension). This file will specify that the Docker image is built with the following components:
The CloudHSM client package.
The CloudHSM Java JCE package.
OpenJDK 1.8 (Java 8). This is needed to compile and run the Java classes and JAR files.
Maven, a build automation tool that is needed to assist with building the Java classes and JAR files.
Cut and paste the following contents into Dockerfile.
Note: You will need to customize your Dockerfile, as follows:
Make sure to specify the SDK version to replace the one specified in the pom.xml file in the sample code. As of the writing of this post, the most current version is 5.7.0. To find the SDK version, follow the steps in the topic Check your client SDK version. For more information, see the Building section in the README file for the Cloud HSM JCE examples.
Make sure to update the HSM_IP line with the IP of an HSM in your CloudHSM cluster. You can get your HSM IPs from the CloudHSM console, or by running the describe-clusters AWS CLI command.
	# Use the amazon linux image
	FROM amazonlinux:2

	# Pass HSM IP address as a build argument
	ARG HSM_IP

	# Install CloudHSM client
	RUN yum install -y https://s3.amazonaws.com/cloudhsmv2-software/CloudHsmClient/EL7/cloudhsm-jce-latest.el7.x86_64.rpm

	# Install Java, Maven, wget, unzip and ncurses-compat-libs
	RUN yum install -y java maven wget unzip ncurses-compat-libs

	# Create a work dir
	WORKDIR /app

	# Download sample code
	RUN wget https://github.com/aws-samples/aws-cloudhsm-jce-examples/archive/refs/heads/sdk5.zip

	# unzip sample code
	RUN unzip sdk5.zip

	# Change to the create directory
	WORKDIR aws-cloudhsm-jce-examples-sdk5

# Build JAR files using the installed CloudHSM JCE Provider version
RUN export CLOUDHSM_CLIENT_VERSION=`rpm -qi cloudhsm-jce | awk -F': ' '/Version/ {print $2}'` \
        && mvn validate -DcloudhsmVersion=$CLOUDHSM_CLIENT_VERSION \
        && mvn clean package -DcloudhsmVersion=$CLOUDHSM_CLIENT_VERSION

  # Configure cloudhsm-client
  COPY customerCA.crt /opt/cloudhsm/etc/
  RUN /opt/cloudhsm/bin/configure-jce -a $HSM_IP

  # Copy the run_sample.sh script
  COPY run_sample.sh .

  # Run the script
  CMD ["bash","run_sample.sh"]
Now you’re ready to build the Docker image. Run the following command, with the name jce_sample. This command will let you use the Dockerfile that you created in step 6 to create the image.
To run a Docker container from the Docker image that you just created, run the following command. Make sure to replace the user and password with your actual CU username and password. (If you need help setting up your CU credentials, see prerequisite 3. For more information on how to provide CU credentials to the AWS CloudHSM Java JCE Library, see Providing credentials to the JCE provider in the CloudHSM User Guide).
# sudo docker run --env HSM_USER=<user> --env HSM_PASSWORD=<password> jce_sample
This solution provides an example of how to run CloudHSM client workloads in Docker containers. You can use the solution as a reference to implement your cryptographic application in a way that benefits from the high availability and load balancing built in to CloudHSM without compromising the flexibility that Docker provides for developing, deploying, and running applications.
If you have comments about this post, submit them in the Comments section below.
Want more AWS Security how-to content, news, and feature announcements? Follow us on Twitter.
Amazon QuickSight is a fast and cloud-powered business intelligence (BI) service that makes it easy to create and deliver insights to everyone in your organization without any servers or infrastructure. QuickSight dashboards can also be embedded into applications and portals to deliver insights to external stakeholders. Additionally, with Amazon QuickSight Q, end-users can simply ask questions in natural language to get machine learning (ML)-powered visual responses to their questions.
Recently, Amazon FinTech migrated all their financial reporting to QuickSight. This involved migrating complex tables and pivot tables, helping them slice and dice large datasets and deliver pixel-perfect views of their data to their stakeholders. Amazon FinTech, like all QuickSight customers, needs fast performance on very large pivot tables in order to drive adoption of their dashboards. We have specifically launched two new features focused on scaling our pivot tables with the following improvements:
Faster loading of pivot tables during expand and collapse operations
Increased field limits for rows, columns, and values
In this post, we discuss these improvements to pivot tables in QuickSight.
Blazing fast pivot tables during expand and collapse operations
Today, QuickSight pivot tables work as an infinite load. As users scroll vertically or horizontally on the visual, new queries are run to fetch additional rows and columns of data with fixed row and column configurations for every query request.
For example, in the following table, we would load all carrier/city combinations nested under Dec 7, 2014 before we can continue querying the next date. Let’s say we have more than 500 carrier/city rows for a specific date; this will take more than a single query to get to the next date. The count of queries run depends on the cardinality of the dimension used in the pivot table.
In the following example of a collapsed pivot table, since the reader doesn’t see anything beyond the flight dates, having all carrier/city rows doesn’t change what is actively displayed on the pivot table. Even though individual SQL queries can be fast, users can perceive this table to load slowly due to the sheer number of queries being fired to load the hidden (collapsed) data. Therefore, loading every single row up to the Destination City field isn’t very useful when the pivot table in the collapsed state.
Therefore, to make our pivot tables load faster, we now only fetch the data for visible fields (expanded fields) along with a small subset of values under the collapsed field. This makes sure that data fetched in every new query is used to render new values that can be displayed immediately. We have seen customers improve their load time from 2–10 times faster depending on the complexity of their dataset.
This new behavior is automatically enabled, without requiring users to do anything on their side. Please note that while we plan to support all kinds of pivot tables to use this optimization, our current rollout only includes pivot tables with only row or only column fields not sorted by any metric.
Increased field limits for pivot tables
With the ever-growing depth and granularity of data being collected, our customers asked us to increase the number of fields and data points they can display in their visuals. We have been actively listening to your needs, and just like supporting more data points in line charts, we now are increasing our field limits for pivot tables.
The value field well limits have been increased from 20 to 40, and rows and columns have been increased from 20 each to a combined limit of 40. For example, if the user has 34 fields in rows, then they can add up to 6 fields to the column field well.
This will help unblock use cases requiring increased limits such as:
Metrics reporting – Monthly and weekly business reporting often requires having dozens of metrics presented in tabular formats. With the updated limits, you can display detailed, robust financial reports in a single pivot table rather than having to split it across multiple pivot tables.
Migration from legacy BI and reporting tools – Existing reports in these legacy systems require displaying and slicing across a large number of row hierarchies, for example a cost center expense analysis.
Custom use cases – These are specific industry and organization use cases where you can add dozens of values and row fields to display additional attributes. For example, a customer 360 report sliced by different regions.
As soon as you hit the limit, you receive an error message to indicate that the limit has been reached for that field well. For more details, refer to here.
Get started and stay updated!
Learn more about our new features in our newly launched QuickSight community’s Announcement section and supercharge your dashboards with the latest features from QuickSight!
About the authors
Bhupinder Chadha is a senior product manager for Amazon QuickSight focused on visualization and front end experiences. He is passionate about BI, data visualization and low-code/no-code experiences. Prior to QuickSight he was the lead product manager for Inforiver, responsible for building a enterprise BI product from ground up. Bhupinder started his career in presales, followed by a small gig in consulting and then PM for xViz, an add on visualization product.
Igal Mizrahi is a Senior Software Engineer for AWS QuickSight Charting team. He has been part of the team for the past 3 years, and previously worked on Amazon’s mobile shopping application for 4 years.
While there are still systems with both byte orders,
little-endian has
largely “won” the battle at this point since the vast majority of today’s
systems store data with the least-significant byte first (at the lowest
address). But when the X11 protocol was developed in the 1980s, there were
lots of systems of each byte order, so the X protocol allowed either order
and the server (display side) would swap the bytes to its byte order as
needed. Over time,
the code for swapping data in the messages, which was written in a
more-trusting era, has bit-rotted so that it is now a
largely untested attack surface that is nearly always unused. Peter
Hutterer has been doing some work to stop using that code by default, both
in upstream
X.org code and in downstream Fedora.
The IAR provides management and technical information security controls to establish, implement, maintain, and continuously improve information assurance. AWS alignment with IAR requirements demonstrates our ongoing commitment to adhere to the heightened expectations for cloud service providers. As such, IAR-regulated customers can use AWS services with confidence.
Independent third-party auditors from BDO evaluated AWS for the period of November 1, 2021, to October 31, 2022. The assessment report illustrating the status of AWS compliance is available through AWS Artifact. AWS Artifact is a self-service portal for on-demand access to AWS compliance reports. Sign in to AWS Artifact in the AWS Management Console, or learn more at Getting Started with AWS Artifact.
AWS strives to continuously bring services into the scope of its compliance programs to help you meet your architectural and regulatory needs. If you have questions or feedback about IAR compliance, reach out to your AWS account team.
To learn more about our compliance and security programs, see AWS Compliance Programs. As always, we value your feedback and questions; reach out to the AWS Compliance team through the Contact Us page.
If you have feedback about this post, submit comments in the Comments section below.
Want more AWS Security how-to content, news, and feature announcements? Follow us on Twitter.
Today is the 20th anniversary of the Slammer worm. I’m still angry over it, so I thought I’d write up my anger. This post will be of interest to nobody, it’s just me venting my bitterness and get off my lawn!!
Back in the day, I wrote “BlackICE”, an intrusion detection and prevention system that ran as both a desktop version and a network appliance. Most cybersec people from that time remember it as the desktop version, but the bulk of our sales came from the network appliance.
The network appliance competed against other IDSs at the time, such as Snort, an open-source product. For much the cybersec industry, IDS was Snort — they had no knowledge of how intrusion-detection would work other than this product, because it was open-source.
My intrusion-detection technology was radically different. The thing that makes me angry is that I couldn’t explain the differences to the community because they weren’t technical enough.
When Slammer hit, Snort and Snort-like products failed. Mine succeeded extremely well. Yet, I didn’t get the credit for this.
The first difference is that I used a custom poll-mode driver instead of interrupts. This the now the norm in the industry, such as with Linux NAPI drivers. The problem with interrupts is that a computer could handle less than 50,000 interrupts-per-second. If network traffic arrived faster than this, then the computer would hang, spending all it’s time in the interrupt handler doing no other useful work. By turning off interrupts and instead polling for packets, this problem is prevented. The cost is that if the computer isn’t heavily loaded by network traffic, then polling causes wasted CPU and electrical power. Linux NAPI drivers switch between them, interrupts when traffic is light and polling when traffic is heavy.
The consequence is that a typical machine of the time (dual Pentium IIIs) could handle 2-million packets-per-second running my software, far better than the 50,000 packets-per-second of the competitors.
When Slammer hit, it filled a 1-gbps Ethernet with 300,000 packets-per-second. As a consequence, pretty much all other IDS products fell over. Those that survived were attached to slower links — 100-mbps was still common at the time.
An industry luminary even gave a presentation at BlackHat saying that my claimed performance (2-million packets-per-second) was impossible, because everyone knew that computers couldn’t handle traffic that fast. I couldn’t combat that, even by explaining with very small words “but we disable interrupts”.
Now this is the norm. All network drivers are written with polling in mind. Specialized drivers like PF_RING and DPDK do even better. Networks appliances are now written using these things. Now you’d expect something like Snort to keep up and not get overloaded with interrupts. What makes me bitter is that back then, this was inexplicable magic.
I wrote an article in PoC||GTFO 0x15 that shows how my portscanner masscan uses this driver, if you want more info.
The second difference with my product was how signatures were written. Everyone else used signatures that triggered on the pattern-matching. Instead, my technology included protocol-analysis, code that parsed more than 100 protocols.
The difference is that when there is an exploit of a buffer-overflow vulnerability, pattern-matching searched for patterns unique to the exploit. In my case, we’d measure the length of the buffer, triggering when it exceeded a certain length, finding any attempt to attack the vulnerability.
The reason we could do this was through the use of state-machine parsers. Such analysis was considered heavy-weight and slow, which is why others avoided it. State-machines are faster than pattern-matching, many times faster. Better and faster.
Such parsers are now more common. Modern web-servers (nginx, ISS, LightHTTPD, etc.) use them to parse HTTP requests. You can tell if a server does this by sending 1-gigabyte of spaces between “GET” and “/”. Apache gives up after 64k of input. State-machines keep going, because while in that state (“between-method-and-uri”), they’ll accept any number of spaces — the only limit is a timeout. Go read the nginx source-code to understand how this works.
I wrote a paper in PoC||GTFO 0x21 that shows the technique to implement the common wc (word-count) program. A simplified version of this wc2o.c. Go read the code — it’s crazy.
The upshot is that when Slammer hit, most IDSs didn’t have a signature for it. If they didn’t just fall over, what they triggered on were things like “UDP flood”, not “SQL buffer overflow”. This lead many to believe what was happening was DDoS attack. My product correctly identified the vulnerability being exploited.
The third difference with my product was the event coalescer. Instead of a timestamp, my events had a start-time, end-time, and count of the number of times the event triggered.
Other event systems sometimes have this, with such events as “last event repeated 39003 times”, to prevent the system from clogging up with events.
My system was more complex. For one things, an attacker may deliberately intermix events, so it can’t simply be 1 event that gets coalesced this way. For another thing, the attacker could sweep targets or spoof sources. Thus, coalescing needed to aggregate events over address ranges as well as time.
Slammer easily filled a gigabit link with 300,000 packets-per-second. Every packet triggered the signature, thus creating 300,000 events-per-second. No system could handle that. To keep up with the load, events had to be reduced somehow.
My event coalescing logic worked. It reduced the load of events from 300,000 down to roughly 500 events-per-second. This was still a little bit higher load than the system could handle, forwarding to the remote management system. Customers reported that at their consoles, they saw the IDS slowly fall behind, spooling events at the sensor and struggling to ship them up to the management system.
The problem is so accurate that it’s a big flaw in IDS still to this day. Snort often has signatures that throw away the excess data, but it’s still easy to flood them with packets that overload their event logging.
What was exciting for me is that I’d designed all this in theory, tested using artificial cases, unsure how it would stand up to the real world. Watching it stand up to the real world was exciting: big customers saw it successfully work in practice, with the only complaint that at the centralized console, it fell behind a little.
The point is that I made three radical design choices, unprecedented at the time though more normal now, and they worked. And yet, the industry wasn’t technical enough to recognize that it worked.
For example, a few months later I had a meeting at the Pentagon where a Gartner analyst gave a presentation claiming that only hardware-based IDS would work, because software-based IDS couldn’t keep up. Well, these were my customer. I didn’t refute Gartner so much as my customer did, with their techies standing up and pointing out that when Slammer hit, my “software” product did keep up. Gartner doesn’t test products themselves. They rightly identified the problem with other software using interrupts, but couldn’t conceive there was a third alternative, “poll mode” drivers.
I apologize to you, the reader, for subjecting you to this vain bitching, but I just want to get this off my chest.
This post is written by Ankur Sethi, Sr. Product Manager, EC2, and Kinnar Sen, Sr. Specialist Solution Architect, AWS Compute.
Amazon EC2 Auto Scaling helps customers optimize their Amazon EC2 capacity by dynamically responding to varying demand. Based on customer feedback, we enhanced the scaling experience with the launch of predictive scaling policies. Predictive scaling proactively adds EC2 instances to your Auto Scaling group in anticipation of demand spikes. This results in better availability and performance for your applications that have predictable demand patterns and long initialization times. We recently launched a couple of features designed to help you assess the value of predictive scaling – prescriptive recommendations on whether to use predictive scaling based on its potential availability and cost impact, and integration withAmazon CloudWatch to continuously monitor the accuracy of predictions. In this post, we discuss the features in detail and the steps that you can easily adopt to enjoy the benefits of predictive scaling.
Recap: Predictive Scaling
EC2 Auto Scaling helps customers maintain application availability by managing the capacity and health of the underlying cluster. Prior to predictive scaling, EC2 Auto Scaling offered dynamic scaling policies such as target tracking and step scaling. These dynamic scaling policies are configured with an Amazon CloudWatch metric that represents an application’s load. EC2 Auto Scaling constantly monitors this metric and responds according to your policies, thereby triggering the launch or termination of instances. Although it’s extremely effective and widely used, this model is reactive in nature, and for larger spikes, may lead to unfulfilled capacity momentarily as the cluster is scaling out. Customers mitigate this by adopting aggressive scale out and conservative scale in to manage the additional buffer of instances. However, sometimes applications take a long time to initialize or have a recurring pattern with a sudden spike of high demand. These can have an impact on the initial response of the system when it is scaling out. Customers asked for a proactive scaling mechanism that can scale capacity ahead of predictable spikes, and so we delivered predictive scaling.
Predictive scaling was launched to make the scaling action proactive as it anticipates the changes required in the compute demand and scales accordingly. The scaling action is determined by ensemble machine learning (ML) built with data from your Auto Scaling group’s scaling patterns, as well as billions of data points from our observations. Predictive scaling should be used for applications where demand changes rapidly but with a recurring pattern, instances require a long time to initialize, or where you’re manually invoking scheduled scaling for routine demand patterns. Predictive scaling not only forecasts capacity requirements based on historical usage, but also learns continuously, thereby making forecasts more accurate with time. Furthermore, predictive scaling policy is designed to only scale out and not scale in your Auto Scaling groups, eliminating the risk of ending with lesser capacity because of inexact predictions. You must use dynamic scaling policy, scheduled scaling, or your own custom mechanism for scale-ins. In case of exceptional demand spikes, this addition of dynamic scaling policy can also improve your application performance by bridging the gap between demand and predicted capacity.
What’s new with predictive scaling
Predictive scaling policies can be configured in a non-mutative ‘Forecast Only’ mode to evaluate the accuracy of forecasts. When you’re ready to start scaling, you can switch to the ‘Forecast and Scale’ mode. Now we prescriptively recommend whether your policy should be switched to ‘Forecast and Scale’ mode if it can potentially lead to better availability and lower costs, saving you the time and effort of doing such an evaluation manually. You can test different configurations by creating multiple predictive scaling policies in ‘Forecast Only’ mode, and choose the one that performs best in terms of availability and cost improvements.
Monitoring and observability are key elements of AWS Well Architected Framework. Now we also offer CloudWatch metrics for your predictive scaling policies so that that you can programmatically monitor your predictive scaling policy for demand pattern changes or prolonged periods of inaccurate predictions. This will enable you to monitor the key performance metrics and make it easier to adopt AWS Well-Architected best practices.
In the following sections, we deep dive into the details of these two features.
Recommendations for predictive scaling
Once you set up an Auto Scaling group with predictive scaling policy in Forecast Only mode as explained in this introduction to predictive scaling blog post , you can review the results of the forecast visually and adjust any parameters to more accurately reflect the behavior that you desire. Evaluating simply on the basis of visualization may not be very intuitive if the scaling patterns are erratic. Moreover, if you keep higher minimum capacities, then the graph may show a flat line for the actual capacity as your Auto Scaling group capacity is an outcome of existing scaling policy configurations and the minimum capacity that you configured. This makes it difficult to contemplate whether the lower capacity predicted by predictive scaling wouldn’t leave your Auto Scaling group under-scaled.
This new feature provides a prescriptive guidance to switch on predictive scaling in Forecast and Scale mode based on the factors of availability and cost savings. To determine the availability and cost savings, we compare the predictions against the actual capacity and the optimal, required capacity. This required capacity is inferred based on whether your instances were running at a higher or lower value than the target value for scaling metric that you defined as part of the predictive scaling policy configuration. For example, if an Auto Scaling group is running 10 instances at 20% CPU Utilization while the target defined in predictive scaling policy is 40%, then the instances are running under-utilized by 50% and the required capacity is assumed to be 5 instances (half of your current capacity). For an Auto Scaling group, based on the time range in which you’re interested (two weeks as default), we aggregate the cost saving and availability impact of predictive scaling. The availability impact measures for the amount of time that the actual metric value was higher than the target value that you defined to be optimal for each policy. Similarly, cost savings measures the aggregated savings based on the capacity utilization of the underlying Auto Scaling group for each defined policy. The final cost and availability will lead us to a recommendation based on:
If availability increases (or remains same) and cost reduces (or remains same), then switch on Forecast and Scale
If availability reduces, then disable predictive scaling
If availability increase comes at an increased cost, then the customer should take the call based on their cost-availability tradeoff threshold
Figure 1: Predictive Scaling Recommendations on EC2 Auto Scaling console
The preceding figure shows how the console reflects the recommendation for a predictive scaling policy. You get information on whether the policy can lead to higher availability and lower cost, which leads to a recommendation to switch to Forecast and Scale. To achieve this cost saving, you might have to lower your minimum capacity and aim for higher utilization in dynamic scaling policies.
To get the most value from this feature, we recommend that you create multiple predictive scaling policies in Forecast Only mode with different configurations, choosing different metrics and/or different target values. Target value is an important lever that changes how aggressive the capacity forecasts must be. A lower target value increases your capacity forecast resulting in better availability for your application. However, this also means more dollars to be spent on the Amazon EC2 cost. Similarly, a higher target value can leave you under-scaled while reactive scaling bridges the gap in just a few minutes. Separate estimates of cost and availability impact are provided for each of the predictive scaling policies. We recommend using a policy if either availability or cost are improved and the other variable improves or stays the same. As long as there is a predictable pattern, Auto Scaling enhanced with predictive scaling maintains high availability for your applications.
Continuous Monitoring of predictive scaling
Once you’re using a predictive scaling policy in Forecast and Scale mode based on the recommendation, you must monitor the predictive scaling policy for demand pattern changes or inaccurate predictions. We introduced two new CloudWatch Metrics for predictive scaling called ‘PredictiveScalingLoadForecast’ and ‘PredictiveScalingCapacityForecast’. Using CloudWatch mertic math feature, you can create a customized metric that measures the accuracy of predictions. For example, to monitor whether your policy is over or under-forecasting, you can publish separate metrics to measure the respective errors. In the following graphic, we show how the metric math expressions can be used to create a Mean Absolute Error for over-forecasting on the load forecasts. Because predictive scaling can only increase capacity, it is useful to alert when the policy is excessively over-forecasting to prevent unnecessary cost.Figure 2: Graphing an accuracy metric using metric math on CloudWatch
In the previous graph, the total CPU Utilization of the Auto Scaling group is represented by m1 metric in orange color while the predicted load by the policy is represented by m2 metric in green color. We used the following expression to get the ratio of over-forecasting error with respect to the actual value.
IF((m2-m1)>0, (m2-m1),0))/m1
Next, we will setup an alarm to automatically send notifications using Amazon Simple Notification Service (Amazon SNS). You can create similar accuracy monitoring for capacity forecasts, but remember that once the policy is in Forecast and Scale mode, it already starts influencing the actual capacity. Hence, putting alarms on load forecast accuracy might be more intuitive as load is generally independent of the capacity of an Auto Scaling group.
Figure 3: Creating a CloudWatch Alarm on the accuracy metric
In the above screenshot, we have set an alarm that triggers when our custom accuracy metric goes above 0.02 (20%) for 10 out of last 12 data points which translates to 10 hours of the last 12 hours. We prefer to alarm on a greater number of data points so that we get notified only when predictive scaling is consistently giving inaccurate results.
Conclusion
With these new features, you can make a more informed decision about whether predictive scaling is right for you and which configuration makes the most sense. We recommend that you start off with Forecast Only mode and switch over to Forecast and Scale based on the recommendations. Once in Forecast and Scale mode, predictive scaling starts taking proactive scaling actions so that your instances are launched and ready to contribute to the workload in advance of the predicted demand. Then continuously monitor the forecast to maintain high availability and cost optimization of your applications. You can also use the new predictive scaling metrics and CloudWatch features, such as metric math, alarms, and notifications, to monitor and take actions when predictions are off by a set threshold for prolonged periods.
We ended 2022 on a high note with the preview release of Amazon OpenSearch Serverless at re:Invent. Today, we are happy to announce the general availability of Amazon OpenSearch Serverless, the serverless option for Amazon OpenSearch Service that makes it easier to run search and analytics workloads without even having to think about infrastructure management. In this post, we share our approach and high-level architecture of OpenSearch Serverless.
Background
Self-managed OpenSearch and managed OpenSearch Service are widely used to search and analyze petabytes of data. Both options give you full control over the configuration of compute, memory, and storage resources in clusters, which allows you to optimize cost and performance for their applications.
However, you might often run applications that could be highly variable, where the usage is not always known. Such applications may experience sudden bursts in ingestion data or irregular and unpredictable query requests. To maintain consistent performance, you must constantly tune and resize clusters or over-provision for peak demand, which results in excess costs. Many customers wanted an even simpler experience to run search and analytics workloads that allows you to focus on your business applications without having to worry about the backend infrastructure and data management.
What does simpler mean? It means you don’t want to worry about these tasks:
Choose and provision instances
Manage the shard or the index size
Index and data management for sizing and operational purposes
Monitor or tune the settings continuously to meet workload demands
Plan for system failures and resource threshold breaches
Security updates and service software updates
We translated this checklist into requirements and goals under the following product themes:
Simple and secure
Auto scaling, fault tolerance, and durability
Cost efficiency
Ecosystem integrations
Before we delve into how OpenSearch Serverless addresses these needs, let’s review the target use cases for OpenSearch Serverless, as their distinctive characteristics heavily influenced our design approach and architecture.
Target use cases
The target use cases for OpenSearch Serverless are the same as OpenSearch:
Time series analytics (also popularly known as log analytics) focuses on analyzing large volumes of semi-structured machine-generated data in real time for operational, security, and user behavior insights
Search powers customer applications in their internal networks (application search, content management systems, legal documents) and internet-facing applications such as ecommerce website search and content search
Let’s understand the differences between the typical time series and search workloads (exceptions may vary):
Time series workloads are write-heavy, whereas search workloads are read-heavy
Search workloads have a smaller data corpus compared to time series
Search workloads are more sensitive to latencies and require faster response times than time series workloads
Queries for time series are run on recent data, whereas search queries scan the entire corpus
These characteristics heavily influenced our approach to handling and managing shards, indexes, and data for the workloads. In the next section, we review the broad themes of how OpenSearch Serverless meets customer challenges while efficiently catering to these distinctive workload traits.
Simple and secure
To get started with OpenSearch Serverless, you create a collection. Collections are a logical grouping of indexed data that works together to support a workload, while the physical resources are automatically managed in the backend. You don’t have to declare how much compute or storage is needed, or monitor the system to make sure it’s running well. To adeptly handle the two predominant workloads, OpenSearch Serverless applies different sharding and indexing strategies. Therefore, in the workflow to create a collection, you must define the collection type—time series or search. You don’t have to worry about re-indexing or rollover of indexes to support your growing data sizes, because it’s handled automatically by the system.
Next, you make the configuration choices about the encryption key to use, network access to your collections (public endpoint or VPC), and who should access your collection. OpenSearch Serverless has an easy-to-use and highly effective security model that supports hierarchical policies for your collections and indexes. You can create granular collection-level and account-level security policies for all your collections and indexes. The centralized account-level policy provides you with comprehensive visibility and control, and makes it operationally simple to secure collections at scale. For encryption policies, you can specify an AWS Key Management Service (AWS KMS) key for a single collection, all collections, or a subset of collections using a wildcard matching pattern. If rules from multiple policies match a collection, the rule closest to the fully qualified name takes precedence. You can also specify wildcard matching patterns in network and data access policies. Multiple network and data access policies can apply to a single collection, and the permissions are additive. You can update the network and data access policies for your collection at any time.
OpenSearch Dashboards can now be accessed using your SAML and AWS Identity and Access Management (IAM) credentials. OpenSearch Serverless also supports fine-grained IAM permissions so that you can define who can create, update, and delete encryption, network, and data access policies, thereby enabling organizational alignment. All the data in OpenSearch Serverless is encrypted in transit and at rest by default.
Auto scaling, fault-tolerance, and durability
OpenSearch Serverless decouples storage and compute, which allows for every layer to scale independently based on workload demands. This decoupling also allows for the isolation of indexing and query compute nodes so the fleets can run concurrently without any resource contention. The compute resources like CPU, disk utilization, memory, and hot shard state are monitored and managed by the service. When these system thresholds are breached, the service adjusts capacity so you don’t have to worry about scaling resources. For example, when an application monitoring workload receives a sudden burst of logging activities during an availability event, OpenSearch Serverless will scale out the indexing compute nodes. When these logging activities decrease and the resource consumption in the compute nodes falls below a certain threshold, OpenSearch Serverless scales the nodes back in. Similarly, when a website search engine receives a sudden spike of queries after a news event, OpenSearch Serverless automatically scales the query compute nodes to process the queries without impacting the data ingestion performance.
The following diagram illustrates this high-level architecture.
OpenSearch Serverless is designed for production workloads with redundancy for Availability Zone outages and infrastructure failures. By default, OpenSearch Serverless will replicate indexes across Availability Zones. The indexing compute nodes run in an active-standby mode. The service control plane is also built with redundancy and automatic failure recovery. All the indexed data is stored in Amazon Simple Storage Service (Amazon S3) to provide the same data durability as Amazon S3 (11 nines). The query compute instances download the indexed data directly from Amazon S3, run search operations, and perform aggregations. Redundant query compute is deployed across Availability Zones in an active-active mode to maintain availability during failures. The refresh interval (the time from when a document is ingested by OpenSearch Serverless to when it is available to search) is currently under 15 seconds.
Cost and cost efficiency
With OpenSearch Serverless, you don’t have to size or provision resources upfront, nor do you have to over-provision for peak load in production environments. You only pay for the compute and storage resources consumed by your workloads. The compute capacity used for data ingestion, and search and query is measured in OpenSearch Compute Units (OCUs). The number of OCUs corresponds directly to the CPU, memory, Amazon Elastic Block Store (Amazon EBS) storage, and the I/O resources required to ingest data or run queries. One OCU comprises 6 GB of RAM, corresponding vCPU, 120 GB of GP3 storage (used to provide fast access to the most frequently accessed data), and data transfers to Amazon S3. After data is ingested, the indexed data is stored in Amazon S3. You have the ability to control retention and delete data using the APIs.
When you create the first collection endpoint in an account, OpenSearch Serverless provisions 4 OCUs (2 ingest that include primary and standby, and 2 search that include two copies for high availability). These OCUs are instantiated even though there is no activity on the serverless endpoint to avoid any cold start latencies. All subsequent collections in that account using the same KMS key share those OCUs. During auto scaling, OpenSearch Serverless will add more OCUs to support the compute needed by your collections. These OCUs copy the indexed data from Amazon S3 before they can start responding to the indexing or query requests. Similarly, the OpenSearch Serverless control plane continuously monitors the OCUs’ resource consumption. When the indexing or search request rate decreases and the OCU consumption falls below a certain threshold, OpenSearch Serverless will reduce the OCU count to the minimum capacity required for your workload. The minimum OCUs prevent cold start delays.
OpenSearch Serverless also provides a built-in caching tier for time series workloads to provide better price-performance. OpenSearch Serverless caches the most recent log data, typically the first 24 hours, on ephemeral disk. For data older than 24 hours, OpenSearch Serverless only caches metadata and fetches the necessary data blocks from Amazon S3 based on query access. This model also helps pack more data while controlling the costs. For search collections, the query compute node caches the entire data corpus locally on ephemeral disks to provide fast, millisecond query responses.
Ecosystem integrations
Most tools that work with OpenSearch also work with OpenSearch Serverless. You don’t have to rewrite existing pipelines and applications. OpenSearch Serverless has the same logical data model and query engine of OpenSearch, so you can use the same ingest and query APIs you are familiar with, and use serverless OpenSearch Dashboards for interactive data analysis and visualization. Because of its compatible interface, OpenSearch Serverless also supports the existing rich OpenSearch ecosystem of high-level clients and streaming ingestion pipelines—Amazon Kinesis Data Firehose, FluentD, FluentBit, Logstash, Apache Kafka, and Amazon Managed Streaming for Apache Kafka (Amazon MSK). For more information, see Ingesting data into Amazon OpenSearch Serverless collections. You can also automate the process of collection creation using AWS CloudFormation and the AWS CDK. With Amazon CloudWatch integration, you can monitor key OpenSearch Serverless metrics and set alarms to notify you of any threshold breaches.
Choosing between managed clusters and OpenSearch Serverless
Both managed clusters and OpenSearch Serverless are deployment options under OpenSearch Service, and powered by the open-source OpenSearch project. OpenSearch Serverless makes it easier to run cyclical, intermittent, or unpredictable workloads without having to think about sizing, monitoring, and tuning OpenSearch clusters. You may, however, prefer to use managed clusters in scenarios where you need tight control over cluster configuration or specific customizations. With managed clusters, you can choose your preferred instances and versions, and have more control on configuration such as lower refresh intervals or data sharding strategies, which may be critical for use cases that fall outside of the typical patterns supported by OpenSearch Serverless. Also, OpenSearch Serverless currently doesn’t support all advanced OpenSearch features and plugins such as alerting, anomaly detection, and k-NN. You can use the managed clusters for these features until OpenSearch Serverless adds support for them.
Updates since the preview
With the general availability release, OpenSearch Serverless will now scale out and scale in to the minimum resources required to support your workloads. The maximum OCU limit per account has been increased from 20 to 50 for both indexing and query. Additionally, you can now use the high-level OpenSearch clients to ingest and query your data, and also migrate data from your OpenSearch clusters using Logstash. Also, we added support for three more Regions. OpenSearch Serverless is now available in eight Regions globally: US East (Ohio), US East (N. Virginia), US West (Oregon), Asia Pacific (Singapore), Asia Pacific (Sydney), Asia Pacific (Tokyo), Europe (Frankfurt), and Europe (Ireland).
Summary
The serverless journey has just begun. Most of the initial efforts were spent defining and building the right service architecture that can efficiently support the growing performance and scale demands. OpenSearch Serverless separates storage and compute components, and indexing and query compute, so they can be managed and scaled independently. OpenSearch Serverless uses Amazon S3 as the primary data storage for indexes, so you don’t need to worry about durability. We have decoupled your configuration choices from the proper provisioning of resources, so configuration mistakes won’t cause outages. OpenSearch Serverless will also apply security and software updates in the future with no disruption to your workloads. This flexible, microservices-based architecture will enable us to keep pushing out new features regularly, raising the bar on scale and performance, and driving down the costs further, for example, spinning down the compute nodes completely when there is no activity.
We encourage you to try out OpenSearch Serverless and provide your feedback in the comments section with your use cases and questions. We have a number of resources to get you started:
The Free Software Foundation has announced
a bylaw change requiring a 66% vote by the FSF board for any new or revised
copyright licenses. The FSF has also announced
an expansion of its board of directors and a call for nominations from
among its associate members.
Kostya Shishkov has just posted the
concluding installment of an extensive history of the FFmpeg project:
See, unlike many people I don’t regard FFmpeg as something unique
(in the sense that it’s a project only Fabrice Bellard could
create). It was nice to have around and it helped immeasurably but
without it something else would fill the niche. There were other
people working on similar tasks after all (does anybody remember
transcode? or gmerlin?). Hopefully you got an idea on how many
talented unsung heroes had been working on FFmpeg and libav over
the years.
The full set can be found on this
page. (Thanks to Paul Wise).
Users of the openSUSE Leap 15.3 distribution will want to be looking at
moving on; support for that release has come to an end. “The currently
maintained stable release is openSUSE Leap 15.4, which will be maintained
until around end of 2023 (same lifetime as SLES 15 SP4 regular
support)“.
Uncovering the root cause of an Amazon GuardDuty finding can be a complex task, requiring security operations center (SOC) analysts to collect a variety of logs, correlate information across logs, and determine the full scope of affected resources.
Sometimes you need to do this type of in-depth analysis because investigating individual security findings in insolation doesn’t always capture the full impact of affected resources.
With Amazon Detective, you can analyze and visualize various logs and relationships between AWS entities to streamline your investigation. In this post, you will learn how to use a feature of Detective—finding groups—to simplify and expedite the investigation of a GuardDuty finding.
Detective uses machine learning, statistical analysis, and graph theory to generate visualizations that help you to conduct faster and more efficient security investigations. The finding groups feature reduces triage time and provides a clear view of related GuardDuty findings. With finding groups, you can investigate entities and security findings that might have been overlooked in isolation. Finding groups also map GuardDuty findings and their relevant tactics, techniques, and procedures to the MITRE ATT&CK framework. By using MITRE ATT&CK, you can better understand the event lifecycle of a finding group.
Finding groups are automatically enabled for both existing and new customers in AWS Regions that support Detective. There is no additional charge for finding groups. If you don’t currently use Detective, you can start a free 30-day trial.
Use finding groups to simplify an investigation
Because finding groups are enabled by default, you start your investigation by simply navigating to the Detective console. You will see these finding groups in two different places: the Summary and the Finding groups pages. On the Finding groups overview page, you can also use the search capability to look for collected metadata for finding groups, such as severity, title, finding group ID, observed tactics, AWS accounts, entities, finding ID, and status. The entities information can help you narrow down finding groups that are more relevant for specific workloads.
Figure 1 shows the finding groups area on the Summary page in the Amazon Detective console, which provides high-level information on some of the individual finding groups.
Figure 1: Detective console summary page
Figure 2 shows the Finding groups overview page, with a list of finding groups filtered by status. The finding group shown has a status of Active.
Figure 2: Detective console finding groups overview page
You can choose the finding group title to see details like the severity of the finding group, the status, scope time, parent or child finding groups, and the observed tactics from the MITRE ATT&CK framework. Figure 3 shows a specific finding group details page.
Figure 3: Detective console showing a specific finding group details page
Below the finding group details, you can review the entities and associated findings for this finding group, as shown in Figure 4. From the Involved entities tab, you can pivot to the entity profile pages for more details about that entity’s behavior. From the Involved findings tab, you can select a finding to review the details pane.
Figure 4: Detective console showing involved entities of a finding group
In Figure 4, the search functionality on the Involved entities tab is being used to look at involved entities that are of type AWS role or EC2 instance. With such a search filter in Detective, you have more data in a single place to understand which Amazon Elastic Compute Cloud (Amazon EC2) instances and AWS Identity and Access Management (IAM) roles were involved in the GuardDuty finding and what findings were associated with each entity. You can also select these different entities to see more details. With finding groups, you no longer have to craft specific log searches or search for the AWS resources and entities that you should investigate. Detective has done this correlation for you, which reduces the triage time and provides a more comprehensive investigation.
With the release of finding groups, Detective infers relationships between findings and groups them together, providing a more convenient starting point for investigations. Detective has evolved from helping you determine which resources are related to a single entity (for example, what EC2 instances are communicating with a malicious IP), to correlating multiple related findings together and showing what MITRE tactics are aligned across those findings, helping you better understand a more advanced single security event.
Conclusion
In this blog post, we showed how you can use Detective finding groups to simplify security investigations through grouping related GuardDuty findings and AWS entities, which provides a more comprehensive view of the lifecycle of the potential security incident. Finding groups are automatically enabled for both existing and new customers in AWS Regions that support Detective. There is no additional charge for finding groups. If you don’t currently use Detective, you can start a free 30-day trial. For more information on finding groups, see Analyzing finding groups in the Amazon Detective User Guide.
If you have feedback about this post, submit comments in the Comments section below. You can also start a new thread on the Amazon Detective re:Post or contact AWS Support.
Want more AWS Security news? Follow us on Twitter.
The most effective backups are the ones you never have to think about—It’s that simple. For anyone in charge of data protection—IT Admins, IT Directors, CTOs and CIOs, managed service providers, and others—driving to that level of simplicity is always the goal. A new partnership between Backblaze and Commvault brings you one step closer to achieving that goal.
Now, Commvault customers can select Backblaze B2 as a cloud storage destination for their Commvault backups and data management needs. Read on to learn more about the partnership.
What Is Commvault?
Commvault is a global leader in data management. Their Intelligent Data Services help organizations transform how they protect, store, and use data. They offer a simple, unified Data Management Platform that spans all of a company’s data, no matter where it lives—on-premises, or in a hybrid or multi-cloud environment—or how it’s structured—in legacy applications, databases, virtual machines, or in containers.
How Does This Partnership Benefit Joint Customers?
Joint customers gain access to easy, affordable cloud storage that integrates with Commvault’s software. The partnership benefits joint customers in a few key ways:
Quick setup: Get started with a seamless integration.
Easy administration: Manage data in one platform.
Better backups: Protect your data from ransomware risks, equipment failure, damage, theft, and human error.
Faster recoveries: Restore your environment quickly in the event of a disaster.
Affordable storage: Backblaze is ⅕ the cost of major cloud providers.
Take Advantage of Capacity-Based Pricing with Backblaze B2 Reserve
Joint customers who prefer predictable cloud spend rather than consumption-based pricing can take advantage of Backblaze B2 Reserve. The Backblaze B2 Reserve offering is capacity-based, starting at 20TB, with key features, including:
Free egress up to the amount of storage purchased per month.
Customers can purchase B2 Reserve through our channel partners. If you’re interested in participating or just want to learn more, contact our Sales team.
If you’re a channel partner and Commvault is in your suite of offerings, we’d love to engage with you. Register on our Partner Portal to get started with offering Backblaze B2 as a backup target.
Customer Spotlight: How Pittsburg State Protects Data in Tornado Alley
Pittsburg State University, located in the heart of Tornado Alley in Kansas, took steps to protect their data by deploying private cloud infrastructure via Commvault Distributed Storage. They established two nodes on-premises and a third across the state for geographic separation, but they wanted another layer of protection. They added Backblaze B2 Cloud Storage giving them peace of mind that their data would be better protected from threats like ransomware. Since Backblaze is integrated with Commvault, Commvault de-duplicates the data, then sends a copy to Backblaze nightly.
“Backblaze B2 had the capability we lacked. I bolted it onto our system, so now I have off-site backup that is safe and well-protected from a regional disaster in Kansas.”
—Tim Pearson, Director for IT Infrastructure and Security, Pittsburg State University
Getting Started with Backblaze B2 and Commvault
Ready to simplify your Commvault backup storage? Check out our Commvault Quickstart Guide for a walk through on how to set up Backblaze B2 as your Commvault cloud storage target.
This post is co-written with Byungjun Choi and Sangha Yang from SikSin.
SikSin is a technology platform connecting customers with restaurant partners serving their multiple needs. Customers use the SikSin platform to search and discover restaurants, read and write reviews, and view photos. From the restaurateurs’ perspective, SikSin enables restaurant partners to engage and acquire customers in order to grow their business. SikSin has a partnership with 850 corporate companies and more than 50,000 restaurants. They issue restaurant e-vouchers to more than 220,000 members, including individuals as well as corporate members. The SikSin platform receives more than 3 million users in a month. SikSin was listed in the top 100 of the Financial Times’s Asia-Pacific region’s high-growth companies in 2022.
SikSin was looking to deliver improved customer experiences and increase customer engagement. SikSin confronted two business challenges:
Customer engagement – SikSin maintains data on more than 750,000 restaurants and has more than 4,000 restaurant articles (and growing). SikSin was looking for a personalized and customized approach to provide restaurant recommendations for their customers and get them engaged with the content, thereby providing a personalized customer experience.
Data analysis activities – The SikSin Food Service team experienced difficulties in regards to report generation due to scattered data across multiple systems. The team previously had to submit a request to the IT team and then wait for answers that might be outdated. For the IT team, they needed to manually pull data out of files, databases, and applications, and then combine them upon every request, which is a time-consuming activity. The SikSin Food Service team wanted to view web analytics log data by multiple dimensions, such as customer profiles and places. Examples include page view, conversion rate, and channels.
To overcome these two challenges, SikSin participated in the AWS Data Lab program to assist them in building a prototype solution. The AWS Data Lab offers accelerated, joint-engineering engagements between customers and AWS technical resources to create tangible deliverables that accelerate data and analytics modernization initiatives. The Build Lab is a 2–5-day intensive build with a technical customer team.
In this post, we share how SikSin built the basis for accelerating their data project with the help of the Data Lab and Amazon Personalize.
Use cases
The Data Lab team and SikSin team had three consecutive meetings to discuss business and technical requirements, and decided to work on two uses cases to resolve their two business challenges:
Build personalized recommendations – SikSin wanted to deploy a machine learning (ML) model to produce personalized content on the landing page of the platform, particularly restaurants and restaurant articles. The success criteria was to increase the number of page views per session and membership subscription, reduce their bounce rate, and ultimately engage more visitors and members in SikSin’s contents.
Establish self-service analytics – SikSin’s business users wanted to reduce time to insight by making data more accessible while removing the reliance on the IT team by giving business users the ability to query data. The key was to consolidate web logs from BigQuery and operational business data from Amazon Relational Data Service (Amazon RDS) into a single place and analyze data whenever they need.
Solution overview
The following architecture depicts what the SikSin team built in the 4-day Build Lab. There are two parts in the solution to address SikSin’s business and technical requirements. The first part (1–8) is for building personalized recommendations, and the second part (A–D) is for establishing self-service analytics.
SikSin deployed an ML model to produce personalized content recommendations by using the following AWS services:
AWS Database Migration Service (AWS DMS) helps migrate databases to AWS quickly and securely with minimal downtime. The SikSin team used AWS DMS to perform full load to bring data from the database tables into Amazon Simple Storage Service (Amazon S3) as a target. Amazon S3 is an object storage service offering industry-leading scalability, data availability, security, and performance. An AWS Glue crawler populates the AWS Glue Data Catalog with the data schema definitions (in a landing folder).
An AWS Lambda function checks if any previous files still exist in the landing folder and archives the files into a backup folder, if any.
AWS Glue is a serverless data integration service that makes it easier to discover, prepare, move, and integrate data from multiple sources for analytics, ML, and application development. The SikSin team created AWS Glue Spark extract, transform, and load (ETL) jobs to prepare input datasets for ML models. These datasets are used to train ML models in bulk mode. There are a total of five datasets for training and two datasets for batch inference jobs.
Amazon Personalize allows developers to quickly build and deploy curated recommendations and intelligent user segmentation at scale using ML. Because Amazon Personalize can be tailored to your individual needs, you can deliver the right customer experience at the right time and in the right place. Also, users will select existing ML models (also known as recipes), train models, and run batch inference to make recommendations.
An Amazon Personalize job predicts for each line of input data (restaurants and restaurant articles) and produces ML-generated recommendations in the designated S3 output folder. The recommendation records are surfaced using interaction data, product data, and predictive models. An AWS Glue crawler populates the AWS Glue Data Catalog with the data schema definitions (in an output folder).
The SikSin team applied business logics and filters in an AWS Glue job to prepare the final datasets for recommendations.
AWS Step Functions enables you to build scalable, distributed applications using state machines. The SikSin team used AWS Step Functions Workflow Studio to visually create, run, and debug workflow runs. This workflow is triggered based on a schedule. The process includes data ingestion, cleansing, processing, and all steps defined in Amazon Personalize. This also involves managing run dependencies, scheduling, error-catching, and concurrency in accordance with the logical flow of the pipeline.
Amazon Simple Notification Service (Amazon SNS) sends notifications. The SikSin team used Amazon SNS to send a notification via email and Google Hangouts with a Lambda function as a target.
To establish a self-service analytics environment to enable business users to perform data analysis, SikSin used the following services:
The Google BigQuery Connector for AWS Glue simplifies the process of connecting AWS Glue jobs to extract data from BigQuery. The SikSin team used the connector to extract web analytics logs from BigQuery and load them to an S3 bucket.
AWS Glue DataBrew is a visual data preparation tool that makes it easy for data analysts and data scientists to clean and normalize data to prepare it for analytics and ML. You can choose from over 250 pre-built transformations to automate data preparation tasks, all without the need to write any code. The SikSin Food Service team used it to visually inspect large datasets and shape the data for their data analysis activities. An S3 bucket (in the intermediate folder) contains business operational data such as customers, places, articles, and products, and reference data loaded from AWS DMS and web analytics logs and data by AWS Glue jobs.
An AWS Glue Python shell runs a job to cleanse and join data, and apply business rules to prepare the data for queries. The SikSin team used AWS SDK Pandas, an AWS Professional Service open-source Python initiative, which extends the power of the Pandas library to AWS, connecting DataFrames and AWS data related services. The output files are stored in an Apache Parquet format in a single folder. An AWS Glue crawler populates the data schema definitions (in an output folder) into the AWS Glue Data Catalog.
The SikSin Food Service team used Amazon Athena and Amazon Quicksight to query and visualize the data analysis. Athena is an interactive query service that makes it easy to analyze data in Amazon S3 using standard SQL. QuickSight is an ML-powered business intelligence service built for the cloud.
Business outcomes
The SikSin Food Service team is now able to access the available data for performing data analysis and manipulation operations efficiently, as well as for getting insights on their own. This immediately allows the team as well as other lines of business to understand how customers are interacting with SikSin’s contents and services on the platform and make decisions sooner. For example, with the data output, the Food Service team was able to provide insights and data points for their external stakeholder and customer to initiate a new business idea. Moreover, the team shared, “We anticipate the recommendations and personalized content will increase conversion rates and customer engagement.”
The AWS Data Lab enabled SikSin to review and assess thoroughly what data is actually usable and available. With SikSin’s objective to successfully build a data pipeline for data analytics purposes, the SikSin team came to realize the importance of data cleansing, categorization, and standardization. “Only fruitful analysis and recommendation are possible when data is intact and properly cleansed,” said Byungjun Choi (the Head of SikSin’s Food Service Team). After completing the Data Lab, SikSin completed and set up an internal process that can streamline the data cleansing pipeline.
SikSin was stuck in the research phase of looking for a solution to solve their personalization challenges. The AWS Data Lab enabled the SikSin IT Team to get hands-on with the technology and build a minimum viable product (MVP) to explore how Amazon Personalize would work in their environment with their data. They achieved this via the Data Lab by adopting AWS DMS, AWS Glue, Amazon Personalize, and Step Functions. “Though it is still the early stage of building a prototype, I am very confident with the right enablement provided from AWS that an effective recommendation system can be adopted on production level very soon,” commented Sangha Yang (the Head of SikSin IT Team).
Conclusion
As a result of the 4-day Build Lab, the SikSin team left with a working prototype that is custom fit to their needs, gaining a clear path forward for enabling end-users to gain valuable insights into its data. The Data Lab allowed the SikSin team to accelerate the architectural design and prototype build of this solution by months. Based on the lessons and learnings obtained from Data Lab, SikSin is planning to launch a Global News Content Platform equipped with a recommendation feature in FY23.
As demonstrated by SikSin’s achievements, Amazon Personalize allows developers to quickly build and deploy curated recommendations and intelligent user segmentation at scale using ML. Because Amazon Personalize can be tailored to your individual needs, you can deliver the right customer experience at the right time and in the right place. Whether you want to optimize recommendations, target customers more accurately, maximize your data’s value, or promote items using business rules.
To accelerate your digital transformation with ML, the Data Lab program is available to support you by providing prescriptive architectural guidance on a particular use case, sharing best practices, and removing technical roadblocks. You’ll leave the engagement with an architecture or working prototype that is custom fit to your needs, a path to production, and deeper knowledge of AWS services.
Please contact your AWS Account Manager or Solutions Architect to get started. If you don’t have an AWS Account Manager, please contact Sales.
About the Authors
Byungjun Choi is the Head of SikSin Food Service at SikSin.
Sangha Yang is the Head of IT team at SinSin.
Younggu Yun is a Senior Data Lab Architect at AWS. He works with customers around the APAC region to help them achieve business goals and solve technical problems by providing prescriptive architectural guidance, sharing best practices, and building innovative solutions together.
Junwoo Lee is an Account Manager at AWS. He provides technical and business support to help customer resolve their problems and enrich customer journey by introducing local and global programs for his customers.
Jinwoo Park is a Senior Solutions Architect at AWS. He provides technical support for AWS customers to succeed with their cloud journey. He helps customers build more secure, efficient, and cost-optimized architectures and solutions, and delivers best practices and workshops.
In an ongoing effort to help security organizations gain greater visibility into risk, we’re pleased to offer this complimentary Gartner® report, 3 Ways to Apply a Risk-Based Approach to Threat Detection, Investigation, and Response. This insightful research can help a security organization realize what its exposure to risk could be at a given time.
Have you measured risk recently?
This is a critical question, but there may be an even more important one: How would you go about implementing a security program to mitigate risk? A tech stack opens itself to all kinds of ongoing vulnerabilities as it expands in more directions, so hopefully its also innovating and driving profits on behalf of the business.
Therefore, a security operations center (SOC) must constantly contort itself to keep that growing attack surface secure via a threat detection, investigation, and response program. According to Gartner, a SOC should:
Break through silos and open dialogue by establishing a quorum of business leaders to openly discuss cybersecurity and its requirements.
Reduce unnecessary delays in investigation by ensuring threat detection use cases are fully enriched with internal business context at the point which alerts are generated.
Enable incident responders to make effective prioritization and response decisions by centrally recording asset-based and business-level risk information.
A binding factor for risk
Technology: It’s the solution to and cause of business risk and the many issues that follow. Relying on the internet means operations and deployments move faster while the attack surface is simultaneously expanding. As the speed of business increases, so does the “noise” security analysts must sift through to get to the real issue. Gartner says:
“Business-dependent technologies are a focal point for criminals moving into cyberspace, as anonymity is now a commodity, making the dash for profits an exceedingly easy gain. Therefore, SecOps must consider and understand business risk and the impact cyber elements have on these risks. However, the question remains: How do these inundated security technologists reduce the noise and achieve their objectives in an environment where time is a limiting factor?”
Faster risk-based prioritization
If time is indeed a limiting factor, then faster risk-based prioritization is a key step on the road to faster incident response, especially as organizations across all industries are migrating to the cloud at an unprecedented pace to support innovation, scale, and digital transformation. Uniting cloud risk and threat detection has been at the forefront of Rapid7’s effort to prioritize and respond to an incident faster.
Integrating multiple threat feeds and sources of telemetry while correlating that intelligence back to assets in your environment provides the visibility needed to target higher-risk areas. It also lends business context, depending on where those higher risk levels are, empowering security practitioners to quickly prioritize and mitigate risk. Gartner posits that, “risk is the sum of your assets, active threats, resident vulnerabilities, and potential organizational impact.”
In the report, Gartner highlights and dives deep into three key areas for enabling risk-based threat detection, investigation, and response:
Use risk-based prioritization for faster incident response: Once the incident responders receive the escalation from the SOC (L3s), they’re typically charged with establishing or validating infection boundaries, identifying the root cause of the infection and offering containment and remediation actions.
Enrich risk information into threat detection processes: Cyber risk varies in its measurement; to be effective, organizations must define at least four core areas to measure and collect data: sums of assets, resident vulnerabilities, active threats and organizational impact.
Break through silos and open the dialogue: To help executives make the most informed decisions, security risk management (SRM) leaders should cultivate relationships with key stakeholders and report effective risk-based metrics, promoting a business-integrated security capability.
For much more context on each of these areas, read the report linked below. Incident response teams need all the help they can get when attempting to work nearly round-the-clock, always-on, multiple incidents at a time.
A perpetual effort
This is also the fun of the job; attackers constantly evolve, which forces security practitioners to innovate, evolve, and outpace bad actors. When it comes to threat detection, investigation, and response, it is essential to pump up visibility and stay several steps ahead of attackers by unifying and transforming multiple telemetry sources.
We’re pleased to continually offer leading research to help you gain clarity into that risk and supercharge security efforts. Read the complimentary Gartner report to better understand how risk applies to your critical assets and how to mitigate the impact of a potential threat.
Gartner, “3 Ways to Apply a Risk-Based Approach to Threat Detection, Investigation, and Response” Jonathan Nunez, Andrew Davies, Pete Shoard, Al Price. 16 November 2022.
GARTNER is a registered trademark and service mark of Gartner, Inc. and/or its affiliates in the U.S. and internationally and is used herein with permission. All rights reserved.
If you’ve made it to 2023 without ever receiving a notice that your personal information was compromised in a security breach, consider yourself lucky. In a best case scenario, bad actors only got your email address and name – information that won’t cause you a huge amount of harm. Or in a worst-case scenario, maybe your profile on a dating app was breached and intimate details of your personal life were exposed publicly, with life-changing impacts. But there are also more hidden, insidious ways that your personal data can be exploited. For example, most of us use an Internet Service Provider (ISP) to connect to the Internet. Some of those ISPs are collecting information about your Internet viewing habits, your search histories, your location, etc. – all of which can impact the privacy of your personal information as you are targeted with ads based on your online habits.
You also probably haven’t made it to 2023 without hearing at least something about Internet privacy laws around the globe. In some jurisdictions, lawmakers are driven by a recognition that the right to privacy is a fundamental human right. In other locations, lawmakers are passing laws to address the harms their citizens are concerned about – data breaches and mining of data about private details of people’s lives to sell targeted advertising. At the core of most of this legislation is an effort to give users more control over their personal data. And many of these regulations require data controllers to ensure adequate protections are in place for cross-border data transfers. In recent years, we’ve seen an increasing number of regulators interpreting these regulations in a way that would leave no room for cross-border data transfers, however. These interpretations are problematic – not only are they harmful to global commerce, but they also disregard the idea that data might be more secure if cross-border data transfers are allowed. Some regulators instead assert that personal data will be safer if it stays within their borders because their law protects privacy better than that of another jurisdiction.
So with Data Privacy Day 2023 just a few days away on January 28, we think it’s important to focus on all the ways security measures and privacy-enhancing technologies help keep personal data private and why security measures are so much more critical to protecting privacy than merely implementing the requirements of data protection laws or keeping data in a jurisdiction because regulators think that jurisdiction has stronger laws than another.
The role of data security in protecting personal information
Most data protection regulations recognize the role security plays in protecting the privacy of personal information. That’s not surprising. An entity’s efforts to follow a data protection law’s requirements for how personal data should be collected and used won’t mean much if a third party can access the data for their own malicious purposes.
The laws themselves provide few specifics about what security is required. For example, the EU General Data Protection Regulation (“GDPR”) and similar comprehensive privacy laws in other jurisdictions require data controllers (the entities that collect your data) to implement “reasonable and appropriate” security measures. But it’s almost impossible for regulators to require specific security measures because the security landscape changes so quickly. In the United States, state security breach laws don’t require notification if the data obtained is encrypted, suggesting that encryption is at least one way regulators think data should be protected.
Enforcement actions brought by regulators against companies that have experienced data breaches provide other clues for what regulators think are “best practices” for ensuring data protection. For example, on January 10 of this year, the U.S. Federal Trade Commission entered into a consent order with Drizly, an online alcohol sales and delivery platform, outlining a number of security failures that led to a data breach that exposed the personal information of about 2.5 million Drizly users and requiring Drizly to implement a comprehensive security program that includes a long list of intrusion detection and logging procedures. In particular, the FTC specifically requires Drizly to implement “…(c) data loss prevention tools; [and] (d) properly configured firewalls” among other measures.
What many regulatory post-breach enforcement actions have in common is the requirement of a comprehensive security program that includes a number of technical measures to protect data from third parties who might seek access to it. The enforcement actions tend to be data location-agnostic, however. It’s not important where the data might be stored – what is important is the right security measures are in place. We couldn’t agree more wholeheartedly.
Cloudflare’s portfolio of products and services helps our customers put protections in place to thwart would-be attackers from accessing their websites or corporate networks. By making it less likely that users’ data will be accessed by malicious actors, Cloudflare’s services can help organizations save millions of dollars, protect their brand reputations, and build trust with their users. We also spend a great deal of time working to develop privacy-enhancing technologies that directly support the ability of individual users to have a more privacy-preserving experience on the Internet.
Cloudflare is most well-known for its application layer security services – Web Application Firewall (WAF), bot management, DDoS protection, SSL/TLS, Page Shield, and more. As the FTC noted in its Drizly consent order, firewalls can be a critical line of defense for any online application. Think about what happens when you go through security at an airport – your body and your bags are scanned for something bad that might be there (e.g. weapons or explosives), but the airport security personnel are not inventorying or recording the contents of your bags. They’re simply looking for dangerous content to make sure it doesn’t make its way onto an airplane. In the same way, the WAF looks at packets as they are being routed through Cloudflare’s network to make sure the Internet equivalent of weapons and explosives are not delivered to a web application. Governments around the globe have agreed that these quick security scans at the airport are necessary to protect us all from bad actors. Internet traffic is the same.
We embrace the critical importance of encryption in transit. In fact, we see encryption as so important that in 2014, Cloudflare introduced Universal SSL to support SSL (and now TLS) connections to every Cloudflare customer. And at the same time, we recognize that blindly passing along encrypted packets would undercut some of the very security that we’re trying to provide. Data privacy and security are a balance. If we let encrypted malicious code get to an end destination, then the malicious code may be used to access information that should otherwise have been protected. If data isn’t encrypted in transit, it’s at risk for interception. But by supporting encryption in transit and ensuring malicious code doesn’t get to its intended destination, we can protect private personal information even more effectively.
Let’s take another example – In June 2022, Atlassian released a Security Advisory relating to a remote code execution (RCE) vulnerability affecting Confluence Server and Confluence Data Center products. Cloudflare responded immediately to roll out a new WAF rule for all of our customers. For customers without this WAF protection, all the trade secret and personal information on their instances of Confluence were potentially vulnerable to data breach. These types of security measures are critical to protecting personal data. And it wouldn’t have mattered if the personal data were stored on a server in Australia, Germany, the U.S., or India – the RCE vulnerability would have exposed data wherever it was stored. Instead, the data was protected because a global network was able to roll out a WAF rule immediately to protect all of its customers globally.
Global network to thwart global attacks
The power of a large, global network is often overlooked when we think about using security measures to protect the privacy of personal data. Regulators who would seek to wall off their countries from the rest of the world as a method of protecting data privacy often miss how such a move can impact the security measures that are even more critical to keeping private data protected from bad actors.
Global knowledge is necessary to stop attacks that could come from anywhere in the world. Just as an international network of counterterrorism units helps to prevent physical threats, the same approach is needed to prevent cyberthreats. The most powerful security tools are built upon identified patterns of anomalous traffic, coming from all over the world. Cloudflare’s global network puts us in a unique position to understand the evolution of global threats and anomalous behaviors. To empower our customers with preventative and responsive cybersecurity, we transform global learnings into protections, while still maintaining the privacy of good-faith Internet users.
For example, Cloudflare’s tools to block threats at the DNS or HTTP level, including DDoS protection for websites and Gateway for enterprises, allow users to further secure their entities beyond customized traffic rules by screening for patterns of traffic known to contain phishing or malware content. We use our global network to improve our identification of vulnerabilities and malicious content and to roll out rules in real time that protect everyone. This ability to identify and instantly protect our customers from security vulnerabilities that they may not have yet had time to address reduces the possibility that their data will be compromised or that they will otherwise be subjected to nefarious activity.
Similarly, Cloudflare’s Bot Management product only increases in accuracy with continued use on the global network: it detects and blocks traffic coming from likely bots before feeding back learnings to the models backing the product. And most importantly, we minimize the amount of information used to detect these threats by fingerprinting traffic patterns and forgoing reliance on PII. Our Bot Management products are successful because of the sheer number of customers and amount of traffic on our network. With approximately 20 percent of all websites protected by Cloudflare, we are uniquely positioned to gather the signals that traffic is from a bad bot and interpret them into actionable intelligence. This diversity of signal and scale of data on a global platform is critical to help us continue to evolve our bot detection tools. If the Internet were fragmented – preventing data from one jurisdiction being used in another – more and more signals would be missed. We wouldn’t be able to apply learnings from bot trends in Asia to bot mitigation efforts in Europe, for example.
A global network is equally important for resilience and effective security protection, a reality that the war in Ukraine has brought into sharp relief. In order to keep their data safe, the Ukrainian government was required to change their laws to remove data localization requirements. As Ukraine’s infrastructure came under attack during Russia’s invasion, the Ukrainian government migrated their data to the cloud, allowing it to be preserved and easily moved to safety in other parts of Europe. Likewise, Cloudflare’s global network played an important role in helping maintain Internet access inside Ukraine. Sites in Ukraine at times came under heavy DDoS attack, even as infrastructure was being destroyed by physical attacks. With bandwidth limited, it was important that the traffic that was getting through inside Ukraine was useful traffic, not attack traffic. Instead of allowing attack traffic inside Ukraine, Cloudflare’s global network identified it and rejected it in the countries where the attacks originated. Without the ability to inspect and reject traffic outside of Ukraine, the attack traffic would have further congested networks inside Ukraine, limiting network capacity for critical wartime communications.
Although the situation in Ukraine reflects the country’s wartime posture, Cloudflare’s global network provides the same security benefits for all of our customers. We use our entire network to deliver DDoS mitigation, with a network capacity of over 172 Tbps, making it possible for our customers to stay online even in the face of the largest attacks. That enormous capacity to protect customers from attack is the result of the global nature of Cloudflare’s network, aided by the ability to restrict attack traffic to the countries where it originated. And a network that stays online is less likely to have to address the network intrusions and data loss that are frequently connected to successful DDoS attacks.
Zero Trust security for corporate networks
Some of the biggest data breaches in recent years have happened as a result of something pretty simple – an attacker uses a phishing email or social engineering to get an employee of a company to visit a site that infects the employee’s computer with malware or enter their credentials on a fake site that lets the bad actor capture the credentials and then use those to impersonate the employee and log into a company’s systems. Depending on the type of information compromised, these kinds of data breaches can have a huge impact on individuals’ privacy. For this reason, Cloudflare has invested in a number of technologies designed to protect corporate networks, and the personal data on those networks.
As we noted during our recent CIO week, the FBI’s latest Internet Crime Report shows that business email compromise and email account compromise, a subset of malicious phishing campaigns, are the most costly – with U.S. businesses losing nearly $2.4 billion. Cloudflare has invested in a number of Zero Trust solutions to help fight this very problem:
Link Isolation means that when an employee clicks a link in an email, it will automatically be opened using Cloudflare’s Remote Browser Isolation technology that isolates potentially risky links, downloads, or other zero-day attacks from impacting that user’s computer and the wider corporate network.
With our Data Loss Prevention tools, businesses can identify and stop exfiltration of data.
Our Area 1 solution identifies phishing attempts, emails containing malicious code, and emails containing ransomware payloads and prevents them from landing in the inbox of unsuspecting employees.
These Zero Trust tools, combined with the use of hardware keys for multi-factor authentication, were key in Cloudflare’s ability to prevent a breach by an SMS phishing attack that targeted more than 130 companies in July and August 2022. Many of these companies reported the disclosure of customer personal information as a result of employees falling victim to this SMS phishing effort.
And remember the Atlassian Confluence RCE vulnerability we mentioned earlier? Cloudflare remained protected not only due to our rapid update of our WAF rules, but also because we use our own Cloudflare Access solution (part of our Zero Trust suite) to ensure that only individuals with Cloudflare credentials are able to access our internal systems. Cloudflare Access verified every request made to a Confluence application to ensure it was coming from an authenticated user.
All of these Zero Trust solutions require sophisticated machine learning to detect patterns of malicious activity, and none of them require data to be stored in a specific location to keep the data safe. Thwarting these kinds of security threats aren’t only important for protecting organizations’ internal networks from intrusion – they are critical for keeping large scale data sets private for the benefit of millions of individuals.
Cutting-edge technologies
Cloudflare’s security services enable our customers to screen for cybersecurity risks on Cloudflare’s network before those risks can reach the customer’s internal network. This helps protect our customers and our customers’ data from a range of cyber threats. By doing so, Cloudflare’s services are essentially fulfilling a privacy-enhancing function in themselves. From the beginning, we have built our systems to ensure that data is kept private, even from us, and we have made public policy and contractual commitments about keeping that data private and secure. But beyond securing our network for the benefit of our customers, we’ve invested heavily in new technologies that aim to secure communications from bad actors; the prying eyes of ISPs or other man-in-the-middle machines that might find your Internet communications of interest for advertising purpose; or government entities that might want to crack down on individuals exercising their freedom of speech.
For example, Cloudflare operates part of Apple’s iCloud Private Relay system, which ensures that no single party handling user data has complete information on both who the user is and what they are trying to access. Instead, a user’s original IP address is visible to the access network (e.g. the coffee shop you’re sitting in, or your home ISP) and the first relay (operated by Apple), but the server or website name is encrypted and not visible to either. The first relay hands encrypted data to a second relay (e.g. Cloudflare), but is unable to see “inside” the traffic to Cloudflare. And the Cloudflare-operated relays know only that it is receiving traffic from a Private Relay user, but not specifically who or their client IP address. Cloudflare relays then forward traffic on to the destination server.
And of course any post on how security measures enable greater data privacy would be remiss if it failed to mention Cloudflare’s privacy-first 1.1.1.1 public resolver. By using 1.1.1.1, individuals can search the Internet without their ISPs seeing where they are going. Unlike most DNS resolvers, 1.1.1.1 does not sell user data to advertisers.
Together, these many technologies and security measures ensure the privacy of personal data from many types of threats to privacy – behavioral advertising, man-in-the-middle attacks, malicious code, and more. On this data privacy day 2023, we urge regulators to recognize that the emphasis currently being placed on data localization has perhaps gone too far – and has foreclosed the many benefits cross-border data transfers can have for data security and, therefore, data privacy.
Security updates have been issued by Debian (libde265, nodejs, and swift), Fedora (nautilus), Oracle (bash, bind, curl, dbus, expat, firefox, go-toolset, golang, java-1.8.0-openjdk, java-11-openjdk, java-17-openjdk, libreoffice, libtiff, libxml2, libXpm, nodejs, nodejs-nodemon, postgresql-jdbc, qemu, ruby:2.5, sqlite, sssd, sudo, and usbguard), Red Hat (bind, go-toolset-1.18, go-toolset:rhel8, kernel, kernel-rt, kpatch-patch, pcs, sssd, and virt:rhel, virt-devel:rhel), Scientific Linux (bind, java-1.8.0-openjdk, kernel, and sssd), SUSE (mozilla-nss, rubygem-websocket-extensions, rust1.65, rust1.66, and samba), and Ubuntu (mysql-5.7, mysql-5.7, mysql-8.0, pam, and samba).
The collective thoughts of the interwebz
Manage Consent
To provide the best experiences, we use technologies like cookies to store and/or access device information. Consenting to these technologies will allow us to process data such as browsing behavior or unique IDs on this site. Not consenting or withdrawing consent, may adversely affect certain features and functions.
Functional
Always active
The technical storage or access is strictly necessary for the legitimate purpose of enabling the use of a specific service explicitly requested by the subscriber or user, or for the sole purpose of carrying out the transmission of a communication over an electronic communications network.
Preferences
The technical storage or access is necessary for the legitimate purpose of storing preferences that are not requested by the subscriber or user.
Statistics
The technical storage or access that is used exclusively for statistical purposes.The technical storage or access that is used exclusively for anonymous statistical purposes. Without a subpoena, voluntary compliance on the part of your Internet Service Provider, or additional records from a third party, information stored or retrieved for this purpose alone cannot usually be used to identify you.
Marketing
The technical storage or access is required to create user profiles to send advertising, or to track the user on a website or across several websites for similar marketing purposes.
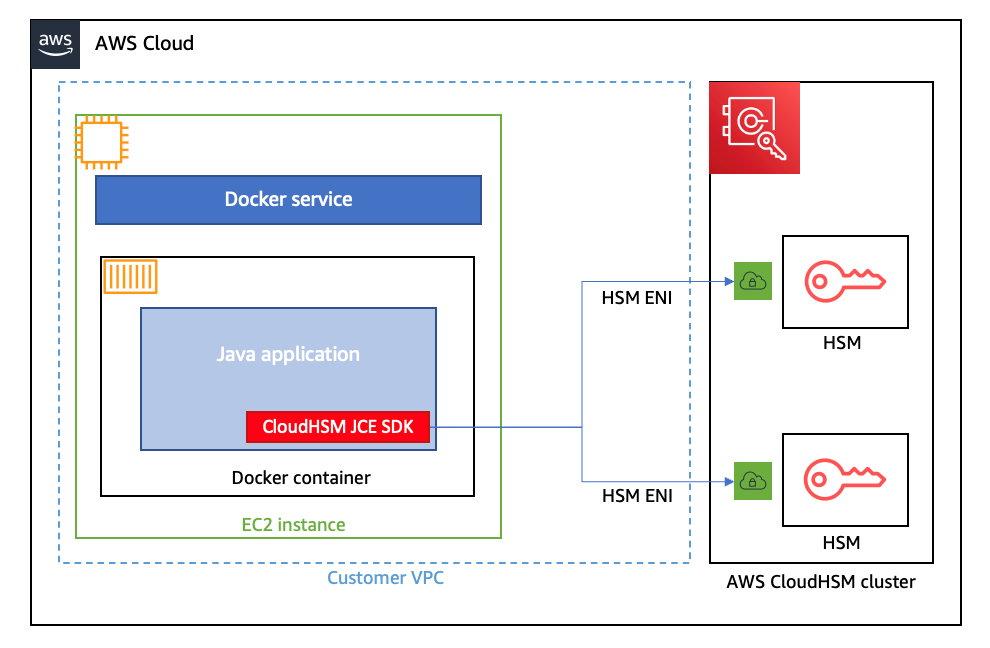
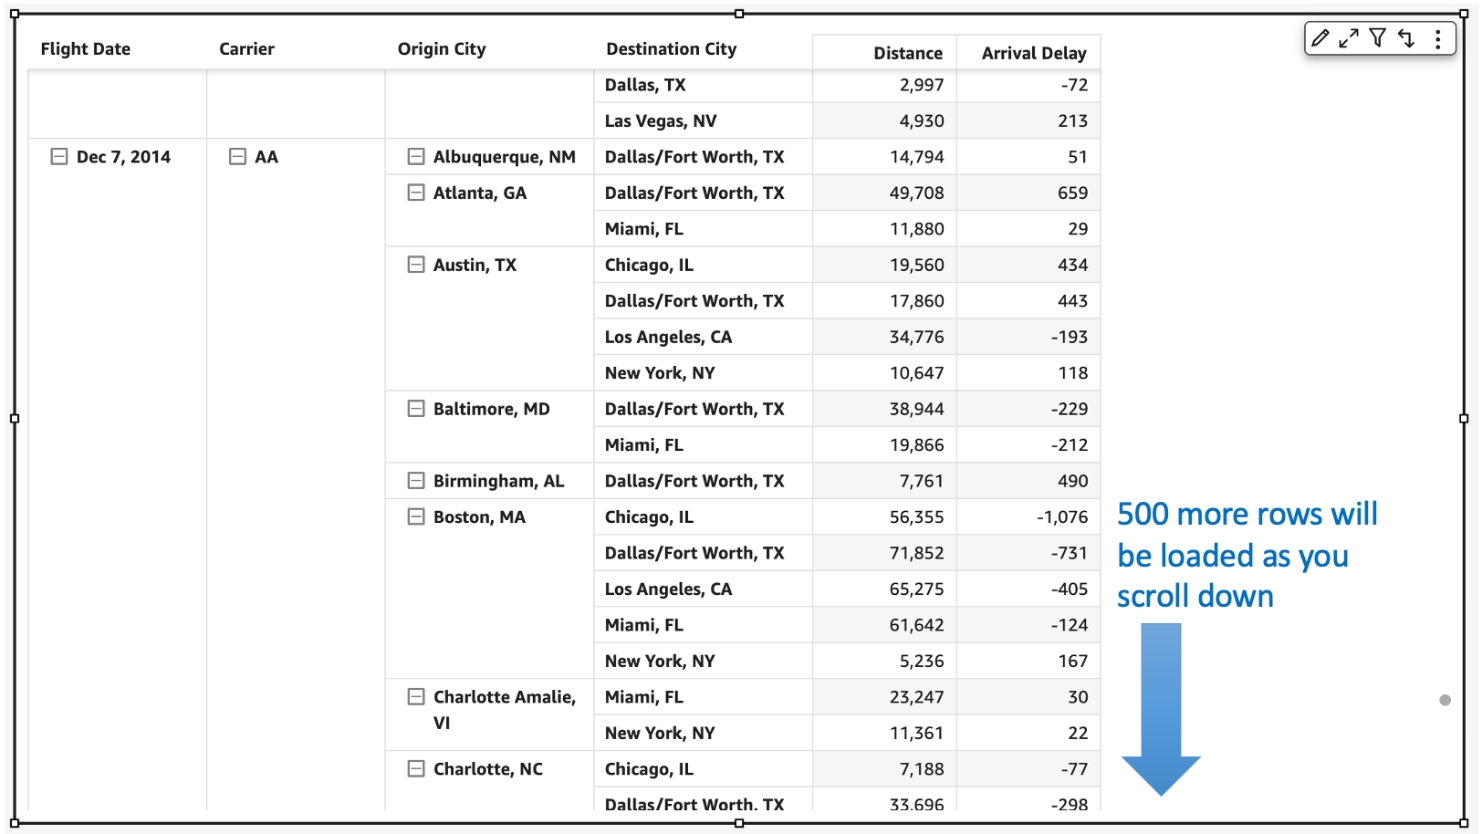
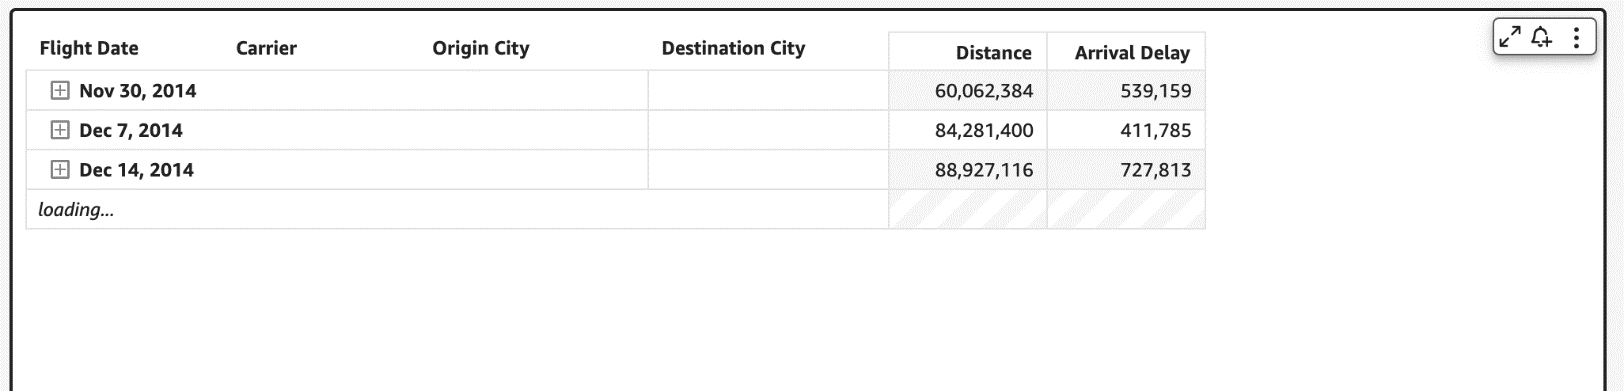
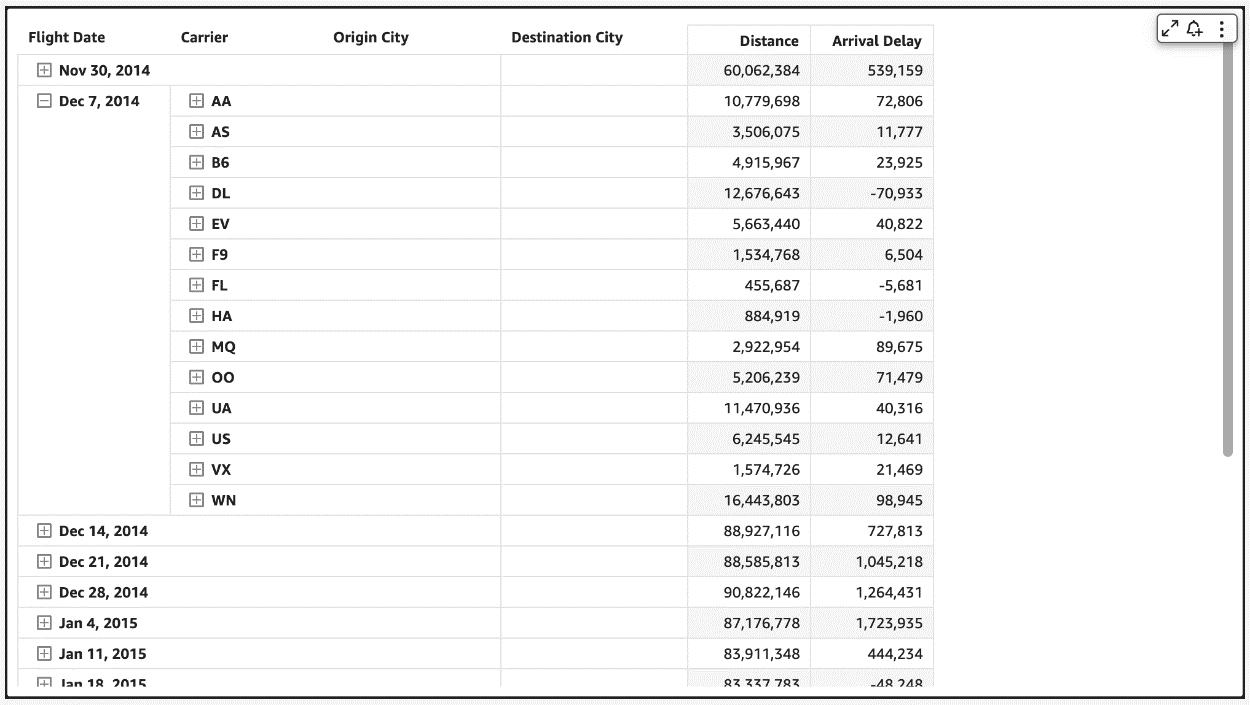


 Bhupinder Chadha is a senior product manager for Amazon QuickSight focused on visualization and front end experiences. He is passionate about BI, data visualization and low-code/no-code experiences. Prior to QuickSight he was the lead product manager for Inforiver, responsible for building a enterprise BI product from ground up. Bhupinder started his career in presales, followed by a small gig in consulting and then PM for xViz, an add on visualization product.
 Igal Mizrahi is a Senior Software Engineer for AWS QuickSight Charting team. He has been part of the team for the past 3 years, and previously worked on Amazon’s mobile shopping application for 4 years.


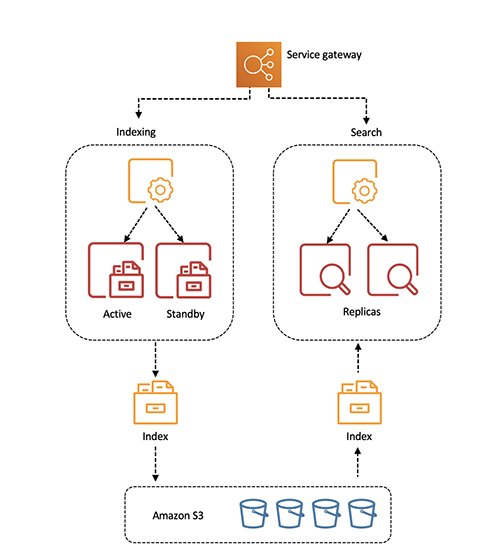
 Pavani Baddepudi is a senior product manager working in search services at AWS. Her interests include distributed systems, networking, and security.