Why do CIOs choose Cloudflare One?

Post Syndicated from Sam Rhea original https://blog.cloudflare.com/why-cios-select-cloudflare-one/

Why do CIOs choose Cloudflare One?

Why do CIOs choose Cloudflare One?

Cloudflare’s first customers sought us out as the “Web Application Firewall vendor” or their DDoS-mitigating Content Delivery Network. We earned their trust by solving their problems in those categories and dozens of others. Today, over 100,000 customers now rely on Cloudflare to secure and deliver their Internet properties.

However, our conversations with CIOs evolved over the last few years. The discussions stopped centering around a specific product. CIOs, and CSOs too, approached us with the challenge of managing connectivity and security for their entire enterprise. Whether they described their goals as Zero Trust or Secure Access Service Edge (SASE), their existing appliances and point solutions could no longer keep up. So we built Cloudflare One to help them.

Today, over 10,000 organizations trust Cloudflare One to connect and secure their users, devices, applications, and data. As part of CIO Week, we spoke with the leaders of some of our largest customers to better understand why they selected Cloudflare.

The feedback centered around six themes:

  1. Cloudflare One delivers more complete security.
  2. Cloudflare One makes your team faster.
  3. Cloudflare One is easier to manage.
  4. Cloudflare One products work better together.
  5. Cloudflare One is the most cost-efficient comprehensive SASE offering.
  6. Cloudflare can be your single security vendor.

If you are new to Cloudflare, or more familiar with our Internet property products, we’re excited to share how other customers approached this journey and why they partnered with Cloudflare. Today’s post breaks down their feedback in serious detail. If you’d prefer to ask us directly, skip ahead to the bottom, and we’d be glad to find time to chat.

Cloudflare One delivers more complete security

The first SASE conversations we had with customers started when they asked us how we keep Cloudflare safe. Their Internet properties relied on us for security and availability – our own policies mattered to their decisions to trust us.

That’s fair. We are a popular target for attack. However, we could not find anything on the market that could keep us safe without slowing us down. Instead, we decided to use our own network to connect employees to internal resources and secure how those same team members connected to the rest of the Internet.

After learning what we built to replace our own private network, our customers started to ask if they could use it too. CIOs were on the same Zero Trust journey with us. They trusted our commitment to delivering the most comprehensive security on the market for their public-facing resources and started partnering with us to do the same thing for their entire enterprise.

We kept investing in Cloudflare One over the last several years based on feedback from our own internal teams and those CIOs. Our first priority was to replace our internal network with a model that applies Zero Trust controls by default. We created controls that could adapt to the demands of security teams without the need to modify applications. We added rules to force hard keys on certain applications, restrict access to specific countries, or require users to ask for approval from an administrator. The flexibility meant that every request, and every connection, could be scrutinized in a way that matched the sensitivity of internal tools.

We then turned that skepticism in the other direction. Customers on this journey with us asked “how could we have Zero Trust in the rest of the Internet?” To solve that, we turned Cloudflare’s network in the other direction. We built our DNS filtering product by combining the world’s fastest DNS resolver with our unique view into threat patterns on the Internet. We layered on a comprehensive Secure Web Gateway and network firewall. We sent potentially risky sites to Cloudflare’s isolated browser, a unique solution that pushes the industry forward in terms of usability.

More recently, we started to create tools that help control the data sitting in SaaS applications and to prevent sensitive data from leaving the enterprise. We’ve been delighted to watch customers adopt every stage in this progression with us, but we kept comparing notes with other CIOs and CSOs about the risk of something that most vendors do not consider part of the SASE stack: email.

We also spent so many hours monitoring email-based phishing attacks aimed at Cloudflare. To solve that challenge, we deployed Area 1 Email Security. The efficacy of Area 1 stunned our team to the point that we acquired the company, so we could offer the same security to our customers as part of Cloudflare One.

When CIOs describe the security challenges they need to solve, we can recommend a complete solution built on our experience addressing those same concerns. We cannot afford shortcuts in how we secure Cloudflare and know they cannot either in how they keep their enterprises safe.

Zero Trust security at a social media company

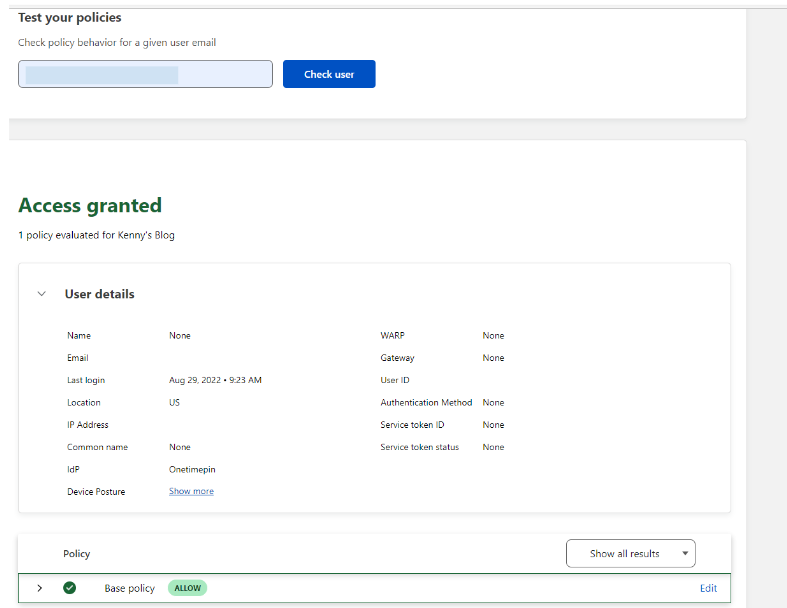
Like Cloudflare, social media services are a popular target for attack. When the security team at one of the world’s most prominent social media platforms began a project to overhaul their access controls, they ran a comprehensive evaluation of vendors who could keep their platform safe from phishing attacks and lateral movement. They selected Cloudflare One due to the granular access control our network provides and the layers of security policies that can be evaluated on any request or connection without slowing down end users.

Cloudflare One makes your team faster

Many of our customers start with our Application Services products, like our cache and smart routing, because they have a need for speed. The performance of their Internet properties directly impacts revenue. These customers hunt down opportunities to use Cloudflare to shave off milliseconds.

The CIOs who approach us to solve their SASE problems tend to rank performance lower than security and maintainability. In early conversations they describe their performance goals as “good enough that my users do not complain.”

Those complaints drive IT help desk tickets, but CIOs are used to sacrificing speed for security. We don’t believe they should have to compromise. CIOs select Cloudflare One because the performance of our network improves the experience of their end users and reduces overhead for their IT administrators.

We accelerate your users from the first moment they connect. When your team members visit a destination on the Internet, their experience starts with a DNS query to find the address of the website. Cloudflare runs the world’s fastest DNS resolver, 1.1.1.1, and the DNS filtering features of our SASE offering use the same technology.

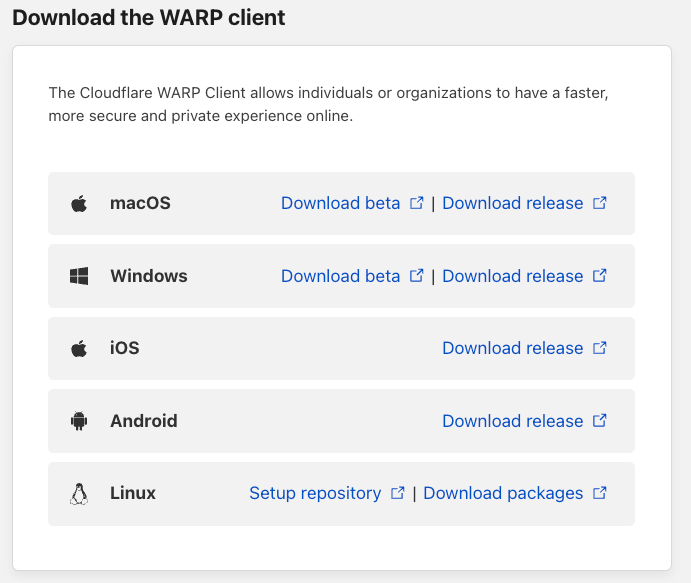
Next, your users’ devices open a connection and send an HTTP request to their destination. The Cloudflare agent on their device does so by using a BoringTun, our Rust-based and open sourced WireGuard implementation. WireGuard allows us to provide a highly-performant on-ramp to the Internet through our network without compromising battery life or security. The same technology supports the millions of users who choose to use our WARP consumer offering. We take their feedback and optimize WARP constantly to improve how our enterprise users connect.

Finally, your users rely on our network to connect them to their destination and return the responses. Out of the 3,000 top networks in the world, measured by IPv4 addresses advertised, we rank the fastest in 1,310. Once connected, we apply our smart routing technology to route users through our network to find the fastest path to and from their destination.

We develop new technologies to improve the speed of Cloudflare One, but we cannot change the speed of light. Instead, we make the distance shorter by bringing websites closer to your users. Cloudflare is the reverse proxy for more than 20% of the HTTP Internet. We serve those websites from the same data centers where your employees connect to our Secure Web Gateway. In many cases, we can deliver content from a server centimeters away from where we apply Cloudflare One’s filtering, shaving off milliseconds and reducing the need for more hops.

Faster DNS filtering for the United States Federal Government

The Cybersecurity and Infrastructure Security Agency (CISA) works within the United States Department of Homeland Security as the “nation’s risk advisor.”1 Last year they launched a program to find a protective DNS resolver for the civilian government. These agencies and departments operate around the country, in large cities and rural areas, and they need a solution that would deliver fast DNS resolutions close to where those users sit. After a thorough evaluation, they selected Cloudflare, in partnership with Accenture Federal Services, as the country’s protective DNS resolver.

Performance at a Fortune 500 Energy Company

An American energy company attempted to deploy Zscaler, but became frustrated after spending eight months attempting to integrate and maintain systems that slowed down their users. This organization already observed Cloudflare’s ability to accelerate their traffic with our network-layer DDoS protection product and ran a pilot with Cloudflare One. Following an exhaustive test, the team observed significant performance improvements, particularly with Cloudflare’s isolated browser product, and decided to rip out Zscaler and consolidate around Cloudflare.

Cloudflare One products are easier to manage

The tools that a SASE solution like Cloudflare One replaces are cumbersome to manage. Hardware appliances or virtual equivalents require upfront deployment work and ongoing investment to maintain and upgrade them. Migrating to other cloud-based SASE vendors can reduce pain for some IT teams, but that is a low bar.

CIOs tell us that the ability to manage the solution is nearly as important as the security outcomes. If their selected vendor is difficult to deploy, the migration drags on and discourages adoption of more advanced features. If the solution is difficult to use or manage, team members find ways to avoid using it or IT administrators waste time.

We built Cloudflare One to make the most advanced SASE technologies available to teams of any size, including those that lack full IT departments. We invested in building a system that could be configured and deployed without operational overhead. Over 10,000 teams rely on Cloudflare One as a result. That same commitment to ease-of-use extends to the enterprise IT and Security teams who manage Cloudflare One deployments for some of the world’s largest organizations.

We also provide features tailored to the feedback we hear from CIOs and their teams about the unique challenges of managing larger deployments at global scale. In some cases, their teams need to update hundreds of policies or their global departments rely on dozens of administrators who need to coordinate changes. We provide API support for managing every Cloudflare One feature, and we also maintain a Terraform provider for teams that need the option for peer reviewed configuration-as-code management.

Ease-of-use at a Fortune 500 telecommunications provider

We make our free and pay-as-you-go plans available to anyone with a credit card in order to make these technologies accessible to teams of any size. Sometimes, the largest teams in the world start with those plans too. A European Fortune 500 telecommunications company began adopting our Zero Trust platform on a monthly subscription when their Developer Operations (DevOps) lost their patience with their existing VPN. Developers across their organization complained about how their legacy private network slowed down their access to the tools they needed to do their job.

Their DevOps administrators adopted Cloudflare One after being able to set it up in a matter of minutes without talking to a sales rep at Cloudflare. Their company now relies on Cloudflare One to secure their internal resources and their path to the Internet for over 100,000 employees.

Cloudflare One products work better together

CIOs who start their SASE evaluation often attempt to replace a collection of point solutions. The work to glue together those products demands more time from IT departments and the gaps between those tools present security blind spots.

However, many SASE vendors offer a platform that just cobbles together point solutions. There might be one invoice, but the same pain points remain around interoperability and security challenges. We talk to CIOs and CSOs who expand their vendor search radius after realizing that the cloud-based alternative from their existing hardware provider still includes those challenges.

When CIOs select Cloudflare One, they pick a single, comprehensive SASE solution. We don’t believe that any feature, or product, should be an island. The sum should be greater than the parts. Every capability that we build in Cloudflare One adds more value to what is already available without adding more maintenance overhead.

When an organization secures their applications behind our Zero Trust access control, they can enable Cloudflare’s Web Application Firewall (WAF) to run in-line with a single button. Users who click on an unknown link open that website in our isolated browser without any additional steps. Launching soon, the same Data Loss Prevention (DLP) rules that administrators build for data-in-transit filters will apply to data sitting at rest with our API-driven Cloud Access Security Broker (CASB).

Product integration at national residential services provider

Just a few months ago, a US-based national provider of residential services, like plumbing and climate control repair, selected Cloudflare One because they could consolidate their disparate stack of existing cloud-based security vendors into a single solution. After evaluating other vendors who stitch together point solutions under a single brand name, they found more value in deploying Cloudflare’s Zero Trust network access solution together with our outbound filtering products for thousands of employees.

Cloudflare One is the most cost-efficient comprehensive SASE offering

Some CIOs approach Cloudflare to replace their collection of hardware appliances that perform, or attempt to perform, Zero Trust functions. The decision to migrate to a cloud-based solution can deliver immediate cost savings by eliminating the cost to continue to license and maintain that hardware or by avoiding the need for new capital expenditure to purchase the latest generation of hardware that can better attempt to support SSE Goals.

We’re happy to help you throw out those band-aid boxes. We’ve spent the last decade helping over 100,000 organizations get rid of their hardware in favor of a faster, safer, and more cost-efficient solution. However, we have seen CIOs approach us in the last with a newer form of this problem: renewals. CIOs who first adopted a cloud-based SSE solution two or three years ago now describe extortionate price increases from their existing vendors.

Unlike Cloudflare, many of these vendors rely on dedicated appliances that struggle to scale with increased traffic. To meet that demand, they purchased more appliances and now need to find a way to bake that cost into the price they charge existing and new customers. Other vendors rely on public cloud providers to run their services. As those providers increase their costs, these vendors pass them on to their customers at a rate that scales with usage.

Cloudflare’s network provides a different model that allows Cloudflare One to deliver a comprehensive SASE offering that is more cost-efficient than anything in the market. Rather than deploying dedicated appliances, Cloudflare deploys commodity hardware on top of which any Cloudflare service can run allowing us to scale up and down for any use case from our Bot Management features to our Workers, including our SASE products. We also purchase server hardware from multiple vendors in the exact same configuration, providing us with supply chain flexibility and reducing the risk that any one component from a specific vendor drives up our hardware costs.

We obsess over the efficiency of the computing costs of that hardware because we have no choice – over 20% of the world’s HTTP Internet relies on it today. Since every service can run on every server, including Cloudflare One, that investment in computing efficiency also benefits Cloudflare One. We also avoid the need to buy more hardware specifically for Cloudflare One capacity. We built our network to scale with the demands of some of the world’s largest Internet properties. That model allows us to absorb the traffic spikes of any enterprise SASE deployment without noticing.

However, Cloudflare One, like all of our network-driven products, has another cost component: transit. We need to reliably deliver your employee’s traffic to its destination. While that destination is increasingly on our network already if it uses our reverse proxy, sometimes employees need other websites.

Thankfully we’ve spent the last decade reducing or eliminating the cost of transit. In many cases, our reverse proxy motivates exchanges and ISPs to waive transit fees for us. It is in their best interest to provide their users with the fastest, most reliable, path to the ever-increasing number of websites that use our network. When we turn our network in the other direction for our SASE customers we still benefit from the same savings.

Cost-savings at an African infrastructure company

Earlier this year, an infrastructure based in South Africa came to Cloudflare with this exact problem. Their existing cloud-based Secure Web Gateway vendor, Zscaler, insisted on a significant price increase for the same services and threatened to turn off the system if the customer did not agree. Instead, this infrastructure company already trusted our network for their Internet properties and decided to rip out their existing SASE vendor in favor of Cloudflare One’s more cost-efficient model without the loss of any functionality.

Cloudflare can be your single security and connectivity vendor

We hear from more and more CIOs who want to reduce the number of invoices they pay and vendors they manage. Hundreds of enterprises who have adopted our SASE platform started as customers of our Application Services and Application Security products.

We’ve seen this take two forms. In one form, CIOs describe the challenge of stitching together multiple security point solutions into a single SASE deployment. They choose our network for the reasons described above; the CIO’s team benefits from features that work better together, and they avoid the need to maintain multiple systems.

In the second form, the migration to more cloud-based services across use cases ranging from SASE to public cloud infrastructure led to vendor bloat. We hear from customers who struggle to inventory which vendors their team has purchased and which of those services they even use.

That proliferation of vendors introduces more cost in terms of dollars and time. In financial terms, each vendor’s contract model might introduce new fees, like fixed platform costs, that would be redundant when paying for a single vendor. In management terms, every new vendor adds one more account manager to go find during issues or one more vendor to involve when debugging an issue that could impact multiple systems.

Bundling Cloudflare One with our Application Services, and Application Security allows your organization to rely on a single vendor for every connection that you need to secure and accelerate. Your teams can rely on a single control plane for everything from customizing your website’s cache rules to reviewing potential gaps in your Zero Trust deployment. CIOs have one point of contact, a Cloudflare Customer Success Manager, they can reach out to if they need help escalating a request across what used to require dozens of potential vendors.

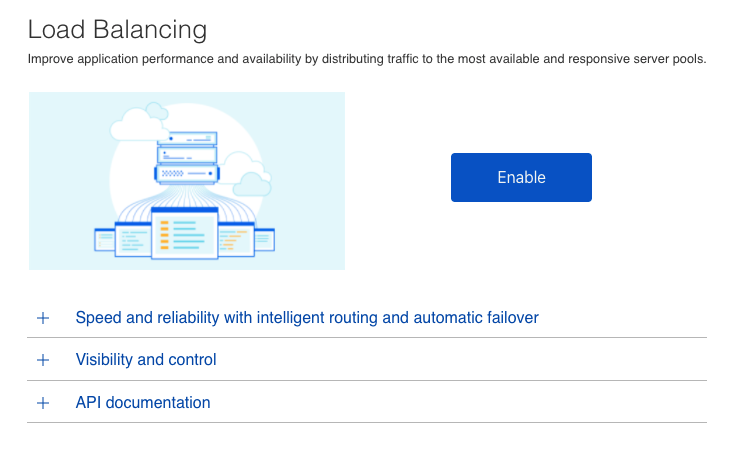
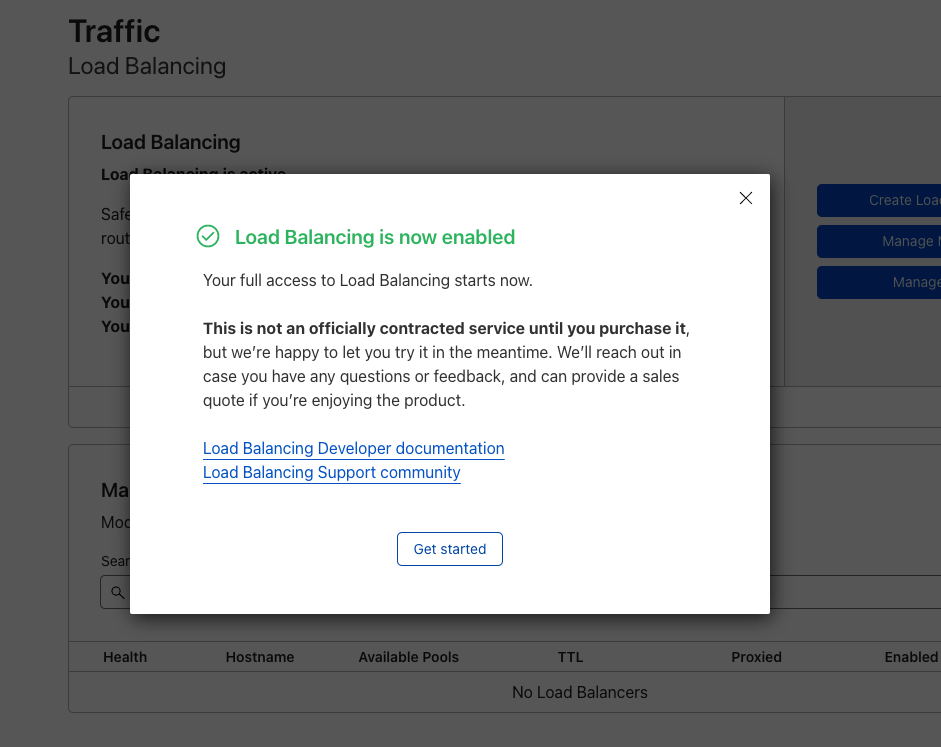
Vendor consolidation at a 10,000 person research publication company

A large American data analytics company chose Cloudflare One as part of that same journey. They first sought Cloudflare to help load-balance their applications and protect their sites from DDoS attacks. After becoming familiar with our platform, and learning how performance features they used for their public-facing applications could be delivered to their internal resources, they selected Cloudflare One over Zscaler and Cisco.

What’s next?

Not every CIO shares the same motivations. One of the reasons above might be more important to you based on your business, your industry, or your stage in a Zero Trust adoption journey.

That’s fine by us! We’d love to learn more about what drives your search and how we can help. We have a team dedicated to listening to organizations who are evaluating SASE options and helping them understand and experiment with Cloudflare One. If you’d like to get started, let us know here, and we’ll reach out.

Do you prefer to avoid talking to someone just yet? Nearly every feature in Cloudflare One is available at no cost for up to 50 users. Many of our largest enterprise customers start by exploring the products themselves on our free plan, and we invite you to do so by following the link here.

……
1https://www.cisa.gov/about-cisa

New ways to troubleshoot Cloudflare Access ‘blocked’ messages

Post Syndicated from Kenny Johnson original https://blog.cloudflare.com/403-logs-cloudflare-access/

New ways to troubleshoot Cloudflare Access 'blocked' messages

New ways to troubleshoot Cloudflare Access 'blocked' messages

Cloudflare Access is the industry’s easiest Zero Trust access control solution to deploy and maintain. Users can connect via Access to reach the resources and applications that power your team, all while Cloudflare’s network enforces least privilege rules and accelerates their connectivity.

Enforcing least privilege rules can lead to accidental blocks for legitimate users. Over the past year, we have focused on adding tools to make it easier for security administrators to troubleshoot why legitimate users are denied access. These block reasons were initially limited to users denied access due to information about their identity (e.g. wrong identity provider group, email address not in the Access policy, etc.)

Zero Trust access control extends beyond identity and device. Cloudflare Access allows for rules that enforce how a user connects. These rules can include their location, IP address, the presence of our Secure Web Gateway and other controls.

Starting today, you can investigate those allow or block decisions based on how a connection was made with the same level of ease that you can troubleshoot user identity. We’re excited to help more teams make the migration to a Zero Trust model as easy as possible and ensure the ongoing maintenance is a significant reduction compared to their previous private network.

Why was I blocked?

All Zero Trust deployments start and end with identity. In a Zero Trust model, you want your resources (and the network protecting them) to have zero trust by default of any incoming connection or request. Instead, every attempt should have to prove to the network that they should be allowed to connect.

Organizations provide users with a mechanism of proof by integrating their identity provider (IdP) like Azure Active Directory or Okta. With Cloudflare, teams can integrate multiple providers simultaneously to help users connect during activities like mergers or to allow contractors to reach specific resources. Users authenticate with their provider and Cloudflare Access uses that to determine if we should trust a given request or connection.

After integrating identity, most teams start to layer on new controls like device posture. In some cases, or in every case, the resources are so sensitive that you want to ensure only approved users connecting from managed, healthy devices are allowed to connect.

While that model significantly improves security, it can also create strain for IT teams managing remote or hybrid workforces. Troubleshooting “why” a user cannot reach a resource becomes a guessing game over chat. Earlier this year, we launched a new tool to tell you exactly why a user’s identity or device posture did not meet the rules that your administrators created.

New ways to troubleshoot Cloudflare Access 'blocked' messages

What about how they connected?

As organizations advance in their Zero Trust journey, they add rules that go beyond the identity of the user or the posture of the device. For example, some teams might have regulatory restrictions that prevent users from accessing sensitive data from certain countries. Other enterprises need to understand the network context before granting access.

These adaptive controls enforce decisions around how a user connects. The user (and their device) might otherwise be allowed, but their current context like location or network prohibits them from doing so. These checks can extend to automated services, too, like a trusted chatbot that uses a service token to connect to your internal ticketing system.

While user and device posture checks require at least one step of authentication, these contextual rules can consist of policies that make it simple for a bad actor to retry over and over again like an IP address check. While the user will still be denied, that kind of information can overwhelm and flood your logs while you attempt to investigate what should be a valid login attempt.

With today’s release, your team can now have the best of both worlds.

However, other checks are not based on a user’s identity, these include looking at a device’s properties, network context, location, presence of a certificate and more. Requests that fail these “non-identity” checks are immediately blocked. These requests are immediately blocked in order to prevent a malicious user from seeing which identity providers are used by a business.

New ways to troubleshoot Cloudflare Access 'blocked' messages

Additionally, these blocks were not logged in order to avoid overloading the Access request logs of an individual account. A malicious user attempting hundreds of requests or a misconfigured API making thousands of requests should not cloud a security admin’s ability to analyze legitimate user Access requests.

These logs would immediately become overloaded if every blocked request were logged. However, we heard from users that in some situations, especially during initial setup, it is helpful to see individual block requests even for non-identity checks.

We have released a GraphQL API that allows Access administrators to look up a specific blocked request by RayID, User or Application. The API response will return a full output of the properties of the associated request which makes it much easier to diagnose why a specific request was blocked.

New ways to troubleshoot Cloudflare Access 'blocked' messages

In addition to the GraphQL API, we also improved the user facing block page to include additional detail about a user’s session. This will make it faster for end users and administrators to diagnose why a legitimate user was not allowed access.

New ways to troubleshoot Cloudflare Access 'blocked' messages

How does it work?

Collecting blocked request logs for thousands of Access customers presented an interesting scale challenge. A single application in a single customer account could have millions of blocked requests in a day, multiple that out across all protected applications across all Access customers and the number of logs start to get large quickly.

We were able to leverage our existing analytics pipeline that was built to handle the scale of our global network which is far beyond the scale of Access. The analytics pipeline is configured to intelligently begin sampling data if an individual account begins generating too many requests. The majority of customers will have all non-identity block logs captured while accounts generating large traffic volumes will retain a significant portion to diagnose issues.

How can I get started?

We have built an example guide to use the GraphQL API to diagnose Access block reasons. These logs can be manually checked using an GraphQL API client or periodically ingested into a log storage database.

We know that achieving a Zero Trust Architecture is a journey and a significant part of that is troubleshooting and initial configuration. We are committed to making Cloudflare Zero Trust the easiest Zero Trust solution to troubleshoot and configure at scale. Keep an eye out for additional announcements in the coming months that make Cloudflare Zero Trust even easier to troubleshoot.

If you don’t already have Cloudflare Zero Trust set up, getting started is easy – see the platform yourself with 50 free seats by signing up here.

Or if you would like to talk with a Cloudflare representative about your overall Zero Trust strategy, reach out to us here for a consultation.

For those who already know and love Cloudflare Zero Trust, this feature is enabled for all accounts across all pricing tiers.

Network detection and settings profiles for the Cloudflare One agent

Post Syndicated from Kyle Krum original https://blog.cloudflare.com/location-aware-warp/

Network detection and settings profiles for the Cloudflare One agent

Network detection and settings profiles for the Cloudflare One agent

Teams can connect users, devices, and entire networks to Cloudflare One through several flexible on-ramps. Those on-ramps include traditional connectivity options like GRE or IPsec tunnels, our Cloudflare Tunnel technology, and our Cloudflare One device agent.

Each of these on-ramps send nearly all traffic to Cloudflare’s network where we can filter security threats with products like our Secure Web Gateway and Data Loss Prevention service. In other cases, the destination is an internal resource deployed in Cloudflare’s Zero Trust private network.

However, sometimes users want traffic to stay local. If a user is sitting within a few meters of their printer, they might prefer to connect through their local network instead of adding a hop through Cloudflare. They could configure Cloudflare to always ignore traffic bound for the printer, keeping it local, but when they leave the office they still need to use Cloudflare’s network to reach that printer remotely.

Solving this use case and others like it previously required manual changes from an administrator every time a user moved. An administrator would need to tell Cloudflare’s agent to include traffic sometimes and, in other situations, ignore it. This does not scale.

Starting today, any team using Cloudflare One has the flexibility to decide what traffic is sent to Cloudflare and what traffic stays local depending on the network of the user. End users do not need to change any settings when they enter or exit a managed network. Cloudflare One’s device agent will automatically detect and make the change for them.

Not everyone needs the same controls

Not every user in your enterprise needs the same network configuration. Sometimes you need to make exceptions for teams, certain members of staff, or speciality hardware/software based on business needs. Those exceptions can become a manual mess when you compound how locations and networks might also require different settings.

We’ve heard several examples from customers who run into that type of headache. Each case below describes a common theme: rigid network configuration breaks when it means real world usage.

In some cases, a user will work physically close to a server or another device that their device needs to reach. We talk to customers in manufacturing or lab environments who prefer to send all Internet-bound traffic to Cloudflare but want to continue to operate a private network inside their facility.

Today’s announcement allows teams to adapt to this type of model. When users operate inside the physical location in the trusted network, they can connect directly. When they leave, they can use Cloudflare’s network to reach back into the trusted network after they meet the conditions of the Zero Trust rules configured by an administrator.

In other situations, customers are in the process of phasing out legacy appliances in favor of Cloudflare One. However, the migration to a Zero Trust model sometimes needs to be stepwise and deliberate. In these cases, customers maintain some existing on-premise infrastructure while they deploy Cloudflare’s SASE solution.

As part of this release, teams can configure Cloudflare’s device agent to detect that a user sits inside a known location where those appliances still operate. The agent will automatically stop directing traffic to Cloudflare and instead send it to your existing appliances while you deprecate them over time.

Configuration Profiles and Managed Networks

Today’s release introduces the ability to create a profile, a defined set of configuration options. You can create rules that decide when and where profiles apply, changing settings without manual intervention.

For our network-aware work, administrators can define a profile that decides what traffic is sent to Cloudflare and what stays local. Next, that profile can apply when users are in specific networks and not when they are in other locations.

Beyond network detection, profiles can apply based on user group membership. Not every user in your workforce needs the same on-ramp configuration. Some developers might need certain traffic excluded due to local development work. As part of this launch, you can configure profiles to apply based on who the user is in addition to where the user sits.

Defining a secure way to detect a network you manage

Cloudflare needs to be able to decide what network a device is using in a way that can’t easily be spoofed by someone looking to skirt policy. To solve that challenge, today’s release introduces the ability to define a known TLS endpoint which Cloudflare’s agent can reach. In just a few minutes, an administrator can create a certificate-validated check to indicate a device is operating within a managed network.

First, an administrator can create a TLS certificate that Cloudflare will use and match based on the SHA-256 hash of the certificate. You can leverage existing infrastructure or create a new TLS endpoint via the following example:

1. Create a local certificate you can use

openssl req -x509 -newkey rsa:4096 -sha256 -days 3650 -nodes -keyout example.key -out example.pem -subj "/CN=example.com" -addext "subjectAltName=DNS:example.com"

2. Extract the sha256 thumbprint of that certificate

openssl x509 -noout -fingerprint -sha256 -inform pem -in example.pem | tr -d :

Which will output something like this:

SHA256 Fingerprint=DD4F4806C57A5BBAF1AA5B080F0541DA75DB468D0A1FE731310149500CCD8662

Next, the Cloudflare agent running on the device needs to be able to reach that certificate to validate that it is connected to a network you manage. We recommend running a simple HTTP server inside your network which the device can reach to validate the certificate.

3. Create a python3 script and save as myserver.py as part of setting up a simple HTTP server.

import ssl, http.server
server = http.server.HTTPServer(('0.0.0.0', 4443), http.server.SimpleHTTPRequestHandler)
sslcontext = ssl.create_default_context(ssl.Purpose.CLIENT_AUTH)
sslcontext.load_cert_chain(certfile='./example.pem', keyfile='./example.key')
server.socket = sslcontext.wrap_socket(server.socket, server_side=True)
server.serve_forever()

Run the server

python3 myserver.py

Configure the network location in Zero Trust dashboard

Once you’ve created the example TLS endpoint above, provide the fingerprint to Cloudflare to define a managed network.

  1. Login to your Zero Trust Dashboard and navigate to Settings → WARP Client
  2. Scroll down to Network Locations and click Add new and complete the form. Use the Fingerprint generated in the previous step as the TLS Cert SHA-256 and the IP address of the device running the python script
Network detection and settings profiles for the Cloudflare One agent

Configure a Device Profile

Once the network is defined, you can create profiles that apply based on whether the agent is operating in this network. To do so, follow the steps below.

  1. Login to your Zero Trust Dashboard and navigate to Settings → WARP Client
  2. Scroll down to Device Settings and create a new profile that includes Your newly created managed network as a location
Network detection and settings profiles for the Cloudflare One agent

Reconnect your Agent

Each time the device agent detects a network change event from the operating systems (ex. waking up the device, changing Wi-Fi networks, etc.) the agent will also attempt to reach that endpoint inside your network to prove that it is operating within a network you manage.

If an endpoint that matches the SHA-256 fingerprint you’ve defined is detected, the device will get the settings profile as configured above. You can quickly validate that the device agent received the required settings by using warp-cli settings or warp-cli get-alternate-network from your command line / terminal.

What’s next?

Managed network detection and settings profiles are both new and available for you to use today. While settings profiles will work with any modern version of the agent from this last year, network detection requires at least version 2022.12.

The WARP device client currently runs on all major operating systems and is easy to deploy with the device management tools your organization already uses. You can find the download links to all version of our agent by visiting Settings →Downloads

Network detection and settings profiles for the Cloudflare One agent

Starting a Zero Trust journey can be daunting. We’re spending this week, CIO Week, to share features like this to make it less of a hassle to begin. If you want to talk to us to learn more about how to take that first step, please reach out.

Preview any Cloudflare product today

Post Syndicated from Angie Kim original https://blog.cloudflare.com/preview-today/

Preview any Cloudflare product today

Preview any Cloudflare product today

With Cloudflare’s pace of innovation, customers want to be able to see how our products work and sooner to address their needs without having to contact someone. Now they can, without any commitments or limits on monetary value and usage caps.

Ready to get started? Here’s how it works.

For any product* that is currently not part of an enterprise contract, users with administrative access will have the ability to enable the product on the Cloudflare dashboard. With a single click of a button, they can start configuring any required features within seconds.

Preview any Cloudflare product today

You have access to resources that can help you get started as well as the ongoing support of your sales team. You will be otherwise left to enjoy the product and our team members will be in contact after about 2 weeks. We always look to collect feedback and can also discuss how to have it added to your contract. If more time is needed in the evaluation phase, no problem. If it is decided that it is not a right product fit, we will offboard the product without any penalties.

We are working on offering more and more self-service capabilities that traditionally have not been offered to our enterprise customers. We’ll also be enhancing this overall experience over the next few months to increase visibility and improve the self-guided journey.

Log into the dashboard to start exploring any products today!

*There are some products that will never be fully self-service, but we will look for opportunities to streamline the onboarding as much as possible. Examples include access to our China Network and Registrar. Support for the following products is still on the roadmap: R2, Cache Reserve, Image Resizing, CASB, DLP and BYOIP.

Announcing Custom DLP profiles

Post Syndicated from Adam Chalmers original https://blog.cloudflare.com/custom-dlp-profiles/

Announcing Custom DLP profiles

Introduction

Announcing Custom DLP profiles

Where does sensitive data live? Who has access to that data? How do I know if that data has been improperly shared or leaked? These questions keep many IT and security administrators up at night. The goal of data loss prevention (DLP) is to give administrators the desired visibility and control over their sensitive data.

We shipped the general availability of DLP in September 2022, offering Cloudflare One customers better protection of their sensitive data. With DLP, customers can identify sensitive data in their corporate traffic, evaluate the intended destination of the data, and then allow or block it accordingly — with details logged as permitted by your privacy and sovereignty requirements. We began by offering customers predefined detections for identifier numbers (e.g. Social Security #s) and financial information (e.g. credit card #s). Since then, nearly every customer has asked:

“When can I build my own detections?”

Most organizations care about credit card numbers, which use standard patterns that are easily detectable. But the data patterns of intellectual property or trade secrets vary widely between industries and companies, so customers need a way to detect the loss of their unique data. This can include internal project names, unreleased product names, or unannounced partner names.

As of today, your organization can build custom detections to identify these types of sensitive data using Cloudflare One. That’s right, today you are able to build Custom DLP Profile using the same regular expression approach that is used in policy building across our platform.

How to use it

Cloudflare’s DLP is embedded in our secure web gateway (SWG) product, Cloudflare Gateway, which routes your corporate traffic through Cloudflare for fast, safe Internet browsing. As your traffic passes through Cloudflare, you can inspect that HTTP traffic for sensitive data and apply DLP policies.

Building DLP custom profiles follows the same intuitive approach you’ve come to expect from Cloudflare.

First, once within the Zero Trust dashboard, navigate to the DLP Profiles tab under Gateway:

Announcing Custom DLP profiles

Here you will find any available DLP profiles, either predefined or custom:

Announcing Custom DLP profiles

Select to Create Profile to begin a new one.  After providing a name and description, select Add detection entry to add a custom regular expression. A regular expression, or regex, is a sequence of characters that specifies a search pattern in text, and is a standard way for administrators to achieve the flexibility and granularity they need in policy building.

Cloudflare Gateway currently supports regexes in HTTP policies using the Rust regex crate. For consistency, we used the same crate to offer custom DLP detections. For documentation on our regex support, see our documentation.

Regular expressions can be used to build custom PII detections of your choosing, such as email addresses, or to detect keywords for sensitive intellectual property.

Announcing Custom DLP profiles

Provide a name and a regex of your choosing. Every entry in a DLP profile is a new detection that you can scan for in your corporate traffic. Our documentation provides resources to help you create and test Rust regexes.

Below is an example of regex to detect a simple email address:

Announcing Custom DLP profiles

When you are done, you will see the entry in your profile.  You can turn entries on and off in the Status field for easier testing.

Announcing Custom DLP profiles

The custom profile can then be applied to traffic using an HTTP policy, just like a predefined profile. Here both a predefined and custom profile are used in the same policy, blocking sensitive traffic to dlptest.com:

Announcing Custom DLP profiles

Our DLP roadmap

This is just the start of our DLP journey, and we aim to grow the product exponentially in the coming quarters. In Q4 we delivered:

  • Expanded Predefined DLP Profiles
  • Custom DLP Profiles
  • PDF scanning support
  • Upgraded file name logging

Over the next quarters, we will add a number of features, including:

  • Data at rest scanning with Cloudflare CASB
  • Minimum DLP match counts
  • Microsoft Sensitivity Label support
  • Exact Data Match (EDM)
  • Context analysis
  • Optical Character Recognition (OCR)
  • Even more predefined DLP detections
  • DLP analytics
  • Many more!

Each of these features will offer you new data visibility and control solutions, and we are excited to bring these features to customers very soon.

How do I get started?

DLP is part of Cloudflare One, our Zero Trust network-as-a-service platform that connects users to enterprise resources. Our GA blog announcement provides more detail about using Cloudflare One to onboard traffic to DLP.

To get access to DLP via Cloudflare One, reach out for a consultation, or contact your account manager.

Announcing the Magic WAN Connector: the easiest on-ramp to your next generation network

Post Syndicated from Annika Garbers original https://blog.cloudflare.com/magic-wan-connector/

Announcing the Magic WAN Connector: the easiest on-ramp to your next generation network

Announcing the Magic WAN Connector: the easiest on-ramp to your next generation network

Cloudflare One enables organizations to modernize their corporate networks by connecting any traffic source or destination and layering Zero Trust security policies on top, saving cost and complexity for IT teams and delivering a better experience for users. Today, we’re excited to make it even easier for you to get connected with the Magic WAN Connector: a lightweight software package you can install in any physical or cloud network to automatically connect, steer, and shape any IP traffic.

You can install the Magic WAN Connector on physical or virtual hardware you already have, or purchase it pre-installed on a Cloudflare-certified device. It ensures the best possible connectivity to the closest Cloudflare network location, where we’ll apply security controls and send traffic on an optimized route to its destination. Embracing SASE has never been simpler.

Solving today’s problems and setting up for tomorrow

Over the past few years, we’ve had the opportunity to learn from IT teams about how their corporate networks have evolved and the challenges they’re facing today. Most organizations describe a starting point of private connectivity and “castle and moat” security controls: a corporate WAN composed of point-to-point and MPLS circuits and hardware appliances at the perimeter of physical networks. This architecture model worked well in a pre-cloud world, but as applications have shifted outside of the walls of the corporate data center and users can increasingly work from anywhere, the concept of the perimeter has crumbled.

In response to these shifts, traditional networking and security vendors have developed a wide array of point solutions to fill specific gaps: a virtual appliance to filter web traffic, a physical one to optimize bandwidth use across multiple circuits, a cloud-based tool to prevent data loss, and so on. IT teams now need to manage a broader-than-ever set of tools and contend with gaps in security, visibility, and control as a result.

Announcing the Magic WAN Connector: the easiest on-ramp to your next generation network
Today’s fragmented corporate network

We view this current state, with IT teams contending with a patchwork of tools and a never-ending ticket queue, as a transitional period to a world where the Internet forms the foundation of the corporate network. Cloudflare One is enabling organizations of all sizes to make the transition to SASE: connecting any traffic source and destination to a secure, fast, reliable global network where all security functions are enforced and traffic is optimized on the way to its destination, whether that’s within a private network or on the public Internet.

Announcing the Magic WAN Connector: the easiest on-ramp to your next generation network
Secure Access Service Edge architecture

Magic WAN Connector: the easiest way to connect your network to Cloudflare

The first step to adopting SASE is getting connected – establishing a secure path from your existing network to the closest location where Zero Trust security policies can be applied. Cloudflare offers a broad set of “on-ramps” to enable this connectivity, including client-based and clientless access options for roaming users, application-layer tunnels established by deploying a lightweight software daemon, network-layer connectivity with standard GRE or IPsec tunnels, and physical or virtual interconnection.

Today, to make this first step to SASE even easier, we’re introducing a new member to this family of on-ramps. The Magic WAN Connector can be deployed in any physical or cloud network to provide automatic connectivity to the closest Cloudflare network location, leveraging your existing last mile Internet connectivity and removing the requirement for IT teams to manually configure network gear to get connected.

Announcing the Magic WAN Connector: the easiest on-ramp to your next generation network
Magic WAN Connector provides easy connectivity to Cloudflare’s network

End-to-end traffic management

Hundreds of customer conversations over the past few years have helped us define a slim set of functionality that customers need within their on-premise and cloud networks. They’ve described this as “light branch, heavy cloud” architecture – minimizing the footprint at corporate network locations and shifting the majority of functions that used to be deployed in on-premise hardware to a globally distributed network.

The Magic WAN Connector includes a critical feature set to make the best possible use of available last mile connectivity. This includes traffic routing, load balancing, and failover; application-aware traffic steering and shaping; and automatic configuration and orchestration. These capabilities connect you automatically to the closest Cloudflare location, where traffic is optimized and routed to its destination. This approach allows you to use Cloudflare’s network – presence in 275 cities and 100 countries across the globe, 11,000+ interconnects and a growing fiber backbone – as an extension of your own.

Network function Magic WAN Connector Cloudflare Network
Branch routing (traffic shaping, failover, QoS) Application-aware routing and traffic steering between multiple last mile Internet circuits Application-aware routing and traffic steering across the middle mile to get traffic to its destination
Centralized device management Connector config controlled from unified Cloudflare dashboard Cloudflare unified dashboard portal, observability, Zero Trust services
Zero-touch configuration Automagic config; boots with smart defaults and sets up tunnels + routes Automagic config; Magic WAN Connector pulls down updates from central control plane
VPN + Firewall VPN termination + basic network segmentation included Full-featured SASE platform including ZTNA, FWaaS, DDoS, WAAP, and Email Security
Application-aware path selection Application-aware traffic shaping for last mile Application-aware Enhanced Internet for middle mile
Application auto discovery Works with Cloudflare network to perform application discovery and classification in real time 1+1=3: Cloudflare Zero Trust application classification tools reused in this context
Application performance visibility Acts as telemetry source for Cloudflare observability tools Cloudflare One Analytics platform & Digital Experience Monitoring
Software can be deployed in the cloud Software can be deployed as a public cloud VM All configuration controlled via unified Cloudflare dashboard

Fully integrated security from day 0

The Magic WAN Connector, like all of Cloudflare’s products, was developed from the ground up to natively integrate with the rest of the Cloudflare One portfolio. Connecting your network to Cloudflare’s with the Magic WAN Connector means automatic access to a full suite of SASE security capabilities, including our Firewall-as-a-Service, Zero Trust Network Access, Secure Web Gateway, Data Loss Prevention, Browser Isolation, Cloud Access Security Broker, Email Security, and more.

Optionally pre-packaged to make deployment easy

Cloudflare’s goal is to make it as easy as possible to on-ramp to our network, so there are flexible deployment options available for the Magic WAN Connector. You can install the software on physical or virtual Linux appliances that you manage, or purchase it pre-installed and configured on a hardware appliance for the lowest-friction path to SASE connectivity. Plug the device into your existing network and you’ll be automatically connected to and secured by the Cloudflare network within minutes.

And open source to make it even easier

We’re excited to make access to these capabilities available to all kinds of organizations, including those who want to DIY more aspects of their network deployments. To do this, we’ll be open sourcing the Magic WAN Connector software, so customers can even more easily connect to Cloudflare’s network from existing hardware.

Part of a growing family of on-ramps

In addition to introducing the Magic WAN Connector today, we’re continuing to grow the options for how customers can connect to us using existing hardware. We are excited to expand our Network On-Ramp partnerships to include leading networking companies Cisco, SonicWall, and Sophos, joining previous partners Aruba, VMWare, and Arista, to help you onboard traffic to Cloudflare smoothly.

Customers can connect to us from appliances offered by these vendors using either Anycast GRE or IPSec tunnels. Our partners have validated their solutions and tested that their networking hardware can connect to Cloudflare using these standards. To make setup easier for our mutual customers, detailed configuration instructions will be available soon at both the Cloudflare Developer Docs and partner websites.

If you are a networking solutions provider and are interested in becoming a Network On-Ramp partner, please reach out to us here.

Ready to start building the future of your corporate network?

We’re beyond excited to get the Magic WAN Connector into customer hands and help you jumpstart your transition to SASE. Learn more and sign up for early access here.

Real Life Business Service Monitoring

Post Syndicated from Alexander Petrov-Gavrilov original https://blog.zabbix.com/real-life-business-service-monitoring/24915/

Learn more about Zabbix business service monitoring features and check out our real-life use cases. The article is based on a Zabbix Summit 2022 speech by Aleksandrs Petrovs-Gavrilovs.

Business service monitoring with Zabbix

Hello everyone, my name is Alex and today I am going to write about Advanced business service and SLA monitoring and the related use cases.

Some of you may already be familiar with business services and the core idea behind them. In the vast majority of organizations, we have services that we provide to our customers or/and for internal use. The availability of those services is usually based either on hardware, software or people’s presence and availability. 

But no matter how well our monitoring is configured, there are times when we can miss how each specific device affects our business and that is where business service monitoring can help us.

With the help of business service monitoring it is possible to see what exactly is going on with your business depending on the state of every single part of your infrastructure. This allows us, the admins and service owners, to understand what it really means when a piece of hardware breaks or a device becomes unreachable. With business service monitoring, we see what exactly impacts our business and how severe the situation is, including calculating SLA (Service Level Agreement) and evaluating it against the defined SLO (Service Level Objective).

Business service hierarchy example

So let’s check out some examples of what business real-life business services may look like.

An average service tree example

In this example, we have a service tree that is based on support services. It has phones and phones are plugged into PBX, while PBX is plugged into the switch. And this is just one example, in reality, we could have a more complex infrastructure consisting of containers, CRM services and so on. And we of course monitor all of them, but what if we are interested in the business perspective as well?

To see the business perspective we need to go to the new service section in the main menu, where we can create and view the service tree itself. In addition, in the same section, we can configure the actions, which enable us to react in cases when something happens with one of the services.
We can also specify the SLO we strive to achieve and see SLA reports on the current situation.

Basic service overview

The service view also lets us see if we have problems affecting our services and track their root cause.

Service with active problems

Defining which service is affected by what problem is done by utilizing problem tags, which essentially link them together. Services can also have their own tags, which we use to group services and understand how one service relates to another. We can also use service tags to build an SLA report or execute actions in case a service is affected by a problem. Permissions too are based on service tags, allowing to creation of different views for different users.

But those are just the basics – what’s more interesting are the actual use cases. Let’s take a look at how Zabbix users actually use business service monitoring to their advantage based on real business examples. 

Business service tree for a financial institution

Real business service use cases can be helpful examples that can help you design your own Zabbix business service trees. Maybe you already have a similar business of your own and you need that starting point for everything to “click” – that starting point can be a real-life example.

Example service tree of a bank

The first example will seem a bit convoluted while actually being very straightforward. Here we can see an actual financial institution business service tree. You can see they have quite a lot of different interconnected services. First look at the service tree raw schema may be a bit confusing, but in Zabbix it’s pretty straightforward.

The internal service is connected to emails and emails are related to customer services at the same since we do need to communicate with the customers, not only internally! In addition, we also have to define services representing the underlying systems and applications which support our email services. That is easy to do with Zabbix services.

Easy to read e-mail service state

Imagine now, if you don’t have the services functionality at all, how fast can you check the status of the email service when all you have is only a list of problems for multiple devices? How can you check the service statistics for an entire year? That was the question that the service owners and administrators had in this use case and they solved it by defining Zabbix business service trees.

The “root” service

We start by defining the root business service – Financial institution. It is linked to 15 main services. The 15 services are grouped into internal or external ones. The lower-level services also contain the sub-services that the main services are based on. I.e., we have an Accounting service based on specific VM availability, where the accounting software resides on.

Detailed service tree

The services are divided into specific categories so the service owners can read the situation a lot easier without spending a lot of time figuring out which problem causes which situation. With a single click, the service owners can immediately see which components or child services each service is based on and the actual service SLA. This also gives the benefit of displaying the root cause problem and being able to quickly identify which child services are causing issues with a particular business service.

Parent-Child service relationship

Don’t forget, that the business service trees can be multi-level –  child services can have their own child services and services can also be interconnected with each other. For example – in the Parent-Child service relationship screenshot, we can see that we have an Accounting service. Accounting uses Microsoft services. Microsoft services are also used internally. So what happens when Microsoft services stop working? We will know that accounting will be affected, the internal services will be affected and we will see the exact chain of events – what and how exactly went wrong in the organization and which components need fixing.

Service state configuration

Services can have a varying impact on your business. Some services are more critical than others. Additional rules enable Zabbix to take the potential service impact into account. The first two additional rules analyze the percentage of affected child services and set the severity of the service problem accordingly.
But if the two most critical services are affected, that will immediately become a disaster. For example, online banking – you can imagine that any bank now has an online banking service and if it goes down – all the customers will be affected; it could even hit the news, not only monitoring. So of course they want to immediately know about that kind of a disaster, and with Zabbix services – they will. By defining additional rules and service weights, you can react to problems preemptively and fix the issues before they cause downtime for your end users.

SLA reporting

In Zabbix, we can choose for what periods SLA should be calculated – daily, weekly, monthly, yearly, or a mixed selection of those. Based on our selection, we can see real-time reports for services and as an example, by the end of the year or a day, understand what needs the most attention and review the service performance. Or to put in a closer-to-reality example – find out by accounting reports if the licenses were renewed in time so that the software which is used by accounting is always available.  We can also build a dashboard that will contain the reports, showing what is the current summary for the service so they can plan, buy new software, buy a new license and get new hardware and always be ahead again of whatever might happen.

Service state dashboard

Service permissions in user roles can be used to create different service views. This can be used to hide sensitive service information or simply display the services at the required level of detail. For example, a more detailed view can be provided for internal support users since they will need as much information as possible to fix any service-related issues. Separate views can be provided for Accounting and Management teams, showing only the relevant data to ensure a quick and reliable decision-making process. 

What if we want to make things even more simple for our Accounting and Management teams? We can use actions and scheduled report functionality to deliver the required information to the user’s mailbox without having them periodically log into Zabbix.

Service permissions

Business service tree for an MSP

Another example is an MSP (managed service provider) service tree. This use case is encountered pretty frequently and the tree is always easy to read even in the raw schema view as this:

Manager Service Provider service tree

We use a hosting company for our example. The company provides a particular set of services for its users. There are also some internal services that can also be used by the customers – for example, Zabbix itself.

Zabbix can be a great tool in MSP scenarios since it’s straightforward to provide customers with access to Zabbix and build a dashboard view with the latest statistics related to a particular user.
In this example, we can see the main service which is hosting, divided across customers, where each customer is a branch of that tree, using the hosting services the company provides. We also see that monitoring is a service itself because in this case customers also have the advantage of using Zabbix to get detailed information about the services they use and their current state. Seeing the current level of SLA for the servers they use and does it match the expectations.

Customer overview

The MSP, of course, retains the full view of the customers and all customers are equally important and deserve a proper quality of service so of course each customer will have an equal weight assigned to them. As soon as any customer has a problem, the related service will be marked with a high-level severity on the service tree. This way, the MSP will immediately see which customer is affected, making it possible to assist them as quickly as possible.

If you have a bigger environment – maybe you have hundreds of customers, you may opt out of defining service weights in your configuration since the number of services changes very rapidly. How can we react to global issues then?
We can use percentage rules instead of reacting to just the static weight number. This way, we can check is the problem related to a single customer or is it something global and everyone is now affected.

Root cause view in the services will allow you to start fixing everything immediately. Meanwhile, each customer can be informed individually using the service actions and conditions. This should be easy to do if we have properly named or tagged the services.

Customer service configuration

Don’t forget to define the permissions so that any customer, as Mooyani here, can have access to their Services immediately after login, ensuring that information not only remains private but also relevant for the current user.

Customer view

All information for Customers can be placed on their personal dashboards where they can see all the details whenever they need to. Monitoring the traffic going through their VMs, resource usage, application statuses and any other monitored entities. Don’t forget that service SLA reports can also be placed on Zabbix dashboards. This way your customers can see that the MSP meets the terms defined in the agreement and everything is performing as expected. 

To summarize – monitoring your infrastructure is great from any perspective, including business monitoring. it’s always a good idea to provide this view as an MSP to your customers, so they can see we meet the standards we define for ourselves and course promise for our users.

Cloudflare DDoS threat report for 2022 Q4

Post Syndicated from Omer Yoachimik original https://blog.cloudflare.com/ddos-threat-report-2022-q4/

Cloudflare DDoS threat report for 2022 Q4

Cloudflare DDoS threat report for 2022 Q4

Welcome to our DDoS Threat Report for the fourth and final quarter of 2022. This report includes insights and trends about the DDoS threat landscape – as observed across Cloudflare’s global network.

In the last quarter of the year, as billions around the world celebrated holidays and events such as Thanksgiving, Christmas, Hanukkah, Black Friday, Singles’ Day, and New Year, DDoS attacks persisted and even increased in size, frequency, and sophistication whilst attempting to disrupt our way of life.

Cloudflare’s automated DDoS defenses stood firm and mitigated millions of attacks in the last quarter alone. We’ve taken all of those attacks, aggregated, analyzed, and prepared the bottom lines to help you better understand the threat landscape.

Global DDoS insights

In the last quarter of the year, despite a year-long decline, the amount of HTTP DDoS attack traffic still increased by 79% YoY. While most of these attacks were small, Cloudflare constantly saw terabit-strong attacks, DDoS attacks in the hundreds of millions of packets per second, and HTTP DDoS attacks peaking in the tens of millions of requests per second launched by sophisticated botnets.

  • Volumetric attacks surged; the number of attacks exceeding rates of 100 gigabits per second (Gbps) grew by 67% quarter-over-quarter (QoQ), and the number of attacks lasting more than three hours increased by 87% QoQ.
  • Ransom DDoS attacks steadily increased this year. In Q4, over 16% of respondents reported receiving a threat or ransom demand as part of the DDoS attack that targeted their Internet properties.

Industries most targeted by DDoS attacks

  • HTTP DDoS attacks constituted 35% of all traffic to Aviation and Aerospace Internet properties.
  • Similarly, over a third of all traffic to the Gaming/Gambling and Finance industries was network-layer DDoS attack traffic.
  • A whopping 92% of traffic to Education Management companies was part of network-layer DDoS attacks. Likewise, 73% of traffic to the Information Technology and Services and the Public Relations & Communications industries were also network-layer DDoS attacks.

Source and targets of DDoS attacks

  • In Q4, 93% of network-layer traffic to Chinese Internet properties behind Cloudflare were part of network-layer DDoS attacks. Similarly, over 86% of traffic to Cloudflare customers in Lithuania and 80% of traffic to Cloudflare customers in Finland was attack traffic.
  • On the application-layer, over 42% of all traffic to Georgian Internet properties behind Cloudflare was part of HTTP DDoS attacks, followed by Belize with 28%, and San Marino in third place with just below 20%. Almost 20% of all traffic from Libya that Cloudflare saw was application-layer DDoS attack traffic.
  • Over 52% of all traffic recorded in Cloudflare’s data centers in Botswana was network-layer DDoS attack traffic. Similarly, in Cloudflare’s data centers in Azerbaijan, Paraguay, and Palestine, network-layer DDoS attack traffic constituted approximately 40% of all traffic.

Quick note: this quarter, we’ve made a change to our algorithms to improve the accuracy of our data which means that some of these data points are incomparable to previous quarters. Read more about these changes in the next section Changes to the report methodologies.

To skip to the report, click here.

Sign up to the DDoS Trends Webinar to learn more about the emerging threats and how to defend against them.

Changes to the report methodologies

Since our first report in 2020, we’ve always used percentages to represent attack traffic, i.e., the percentage of attack traffic out of all traffic including legitimate/user traffic. We did this to normalize the data, avoid data biases, and be more flexible when it comes to incorporating new mitigation system data into the report.

In this report, we’ve introduced changes to the methods used to calculate some of those percentages when we bucket attacks by certain dimensions such as target country, source country, or target industry. In the application-layer sections, we previously divided the amount of attack HTTP/S requests to a given dimension by all the HTTP/S requests to all dimensions. In the network-layer section, specifically in Target industries and Target countries, we used to divide the amount of attack IP packets to a given dimension by the total attack packets to all dimensions.

From this report onwards, we now divide the attack requests (or packets) to a given dimension only by the total requests (or packets) to that given dimension. We made these changes in order to align our calculation methods throughout the report and improve the data accuracy so it better represents the attack landscape.

For example, the top industry attacked by application-layer DDoS attacks using the previous method was the Gaming and Gambling industry. The attack requests towards that industry accounted for 0.084% of all traffic (attack and non-attack) to all industries. Using that same old method, the Aviation and Aerospace industry came in 12th place. Attack traffic towards the Aviation and Aerospace industry accounted for 0.0065% of all traffic (attack and non-attack) to all industries. However, using the new method, the Aviation and Aerospace industry came in as the number one most attacked industry — attack traffic formed 35% of all traffic (attack and non-attack) towards that industry alone. Again using the new method, the Gaming and Gambling industry came in 14th place — 2.4% of its traffic was attack traffic.

The old calculation method used in previous reports to calculate the percentage of attack traffic for each dimension was the following:

Cloudflare DDoS threat report for 2022 Q4

The new calculation method used from this report onwards is the following:

Cloudflare DDoS threat report for 2022 Q4

The changes apply to the following metrics:

  1. Target industries of application-layer DDoS attacks
  2. Target countries of application-layer DDoS attacks
  3. Source of application-layer DDoS attacks
  4. Target industries of network-layer DDoS attacks
  5. Target countries of network-layer DDoS attacks

No other changes were made in the report. The Source of network-layer DDoS attacks metrics already use this method since the first report. Also, no changes were made to the Ransom DDoS attacks, DDoS attack rate, DDoS attack duration, DDoS attack vectors, and Top emerging threats sections. These metrics do not take legitimate traffic into consideration and no methodology alignment was needed.

With that in mind, let’s dive in deeper and explore these insights and trends. You can also view an interactive version of this report on Cloudflare Radar.

Ransom DDoS attacks

As opposed to Ransomware attacks, where the victim is tricked into downloading a file or clicking on an email link that encrypts and locks their computer files until they pay a ransom fee, Ransom DDoS attacks can be much easier for attackers to launch. Ransom DDoS attacks don’t require tricking the victim into opening an email or clicking a link, nor do they require a network intrusion or a foothold to be carried out.

In a Ransom DDoS attack, the attacker doesn’t need access to the victim’s computer but rather just floods them with enough traffic to negatively impact their Internet services. The attacker will demand a ransom payment, usually in the form of Bitcoin, to stop and/or avoid further attacks.

In the last quarter of 2022, 16% of Cloudflare customers that responded to our survey reported being targeted by HTTP DDoS attacks accompanied by a threat or a ransom note. This represents a 14% increase QoQ but a 16% decrease YoY in reported Ransom DDoS attacks.

Cloudflare DDoS threat report for 2022 Q4
Distribution of Ransom DDoS attacks over 2021 and 2022 by quarter (each column represents the percentage of users reporting a ransom attack)

How we calculate Ransom DDoS attack trends
Cloudflare’s systems constantly analyze traffic and automatically apply mitigation when DDoS attacks are detected. Each DDoS’d customer is prompted with an automated survey to help us better understand the nature of the attack and the success of the mitigation. For over two years, Cloudflare has been surveying attacked customers. One of the questions in the survey asks the respondents if they received a threat or a ransom note. Over the past two years, on average, we collected 187 responses per quarter. The responses of this survey are used to calculate the percentage of Ransom DDoS attacks.

Application-layer DDoS attack landscape

Application-layer DDoS attacks, specifically HTTP/S DDoS attacks, are cyber attacks that usually aim to disrupt web servers by making them unable to process legitimate user requests. If a server is bombarded with more requests than it can process, the server will drop legitimate requests and – in some cases – crash, resulting in degraded performance or an outage for legitimate users.

Cloudflare DDoS threat report for 2022 Q4

When we look at the graph below, we can see a clear downward trend in attacks each quarter this year. However, despite the downward trend, HTTP DDoS attacks still increased by 79% when compared to the same quarter of previous year.

Cloudflare DDoS threat report for 2022 Q4
Distribution of HTTP DDoS attacks over the last year by quarter

Target industries of application-layer DDoS attacks

In the quarter where many people travel for the holidays, the Aviation and Aerospace was the most attacked industry. Approximately 35% of traffic to the industry was part of HTTP DDoS attacks. In second place, the Events Services industry saw over 16% of its traffic as HTTP DDoS attacks.

In the following places were the Media and Publishing, Wireless, Government Relations, and Non-profit industries. To learn more about how Cloudflare protects non-profit and human rights organizations, read our recent Impact Report.

Cloudflare DDoS threat report for 2022 Q4
Top industries targeted by HTTP DDoS attacks in 2022 Q4

When we break it down regionally, and after excluding generic industry buckets like Internet and Software, we can see that in North America and Oceania the Telecommunications industry was the most targeted. In South America and Africa, the Hospitality industry was the most targeted. In Europe and Asia, Gaming & Gambling industries were the most targeted. And in the Middle East, the Education industry saw the most attacks.

Cloudflare DDoS threat report for 2022 Q4
Top industries targeted by HTTP DDoS attacks in 2022 Q4, by region

Target countries of application-layer DDoS attacks

Bucketing attacks by our customers’ billing address helps us understand which countries are more frequently attacked. In Q4, over 42% of all traffic to Georgian HTTP applications behind Cloudflare was DDoS attack traffic.

In second place, Belize-based companies saw almost a third of their traffic as DDoS attacks, followed by San Marino in third with just below 20% of its traffic being DDoS attack traffic.

Cloudflare DDoS threat report for 2022 Q4
Top countries targeted by HTTP DDoS attacks in 2022 Q4

Source of application-layer DDoS attacks

Quick note before we dive in. If a country is found to be a major source of DDoS attacks, it doesn’t necessarily mean that it is that country that launches the attacks. Most often with DDoS attacks, attackers are launching attacks remotely in an attempt to hide their true location. Top source countries are more often indicators that there are botnet nodes operating from within that country, perhaps hijacked servers or IoT devices.

In Q4, almost 20% of all HTTP traffic originating from Libya was part of HTTP DDoS attacks. Similarly, 18% of traffic originating from Timor-Leste, an island country in Southeast Asia just north of Australia, was attack traffic. DDoS attack traffic also accounted for 17% of all traffic originating from the British Virgin Islands and 14% of all traffic originating from Afghanistan.

Cloudflare DDoS threat report for 2022 Q4
Top source countries of HTTP DDoS attacks in 2022 Q4

Network-layer DDoS attacks

While application-layer attacks target the application (Layer 7 of the OSI model) running the service that end users are trying to access (HTTP/S in our case), network-layer DDoS attacks aim to overwhelm network infrastructure, such as in-line routers and servers, and the Internet link itself.

Cloudflare DDoS threat report for 2022 Q4

After a year of steady increases in network-layer DDoS attacks, in the fourth and final quarter of the year, the amount of attacks actually decreased by 14% QoQ and 13% YoY.

Cloudflare DDoS threat report for 2022 Q4
Distribution of Network-layer DDoS attacks over the last year by quarter

Now let’s dive a little deeper to understand the various attack properties such as the attack volumetric rates, durations, attack vectors, and emerging threats.

DDoS attack rate
While the vast majority of attacks are relatively short and small, we did see a spike in longer and larger attacks this quarter. The amount of volumetric network-layer DDoS attacks with a rate exceeding 100 Gbps increased by 67% QoQ. Similarly, attacks in the range of 1-100 Gbps increased by ~20% QoQ, and attacks in the range of 500 Mbps to 1 Gbps increased by 108% QoQ.

Cloudflare DDoS threat report for 2022 Q4
QoQ change in DDoS attack rates in 2022 Q4

Below is an example of one of those attacks exceeding 100 Gbps that took place the week after Thanksgiving. This was a 1 Tbps DDoS attack targeted at a Korean-based hosting provider. This particular attack was an ACK flood, and it lasted roughly one minute. Since the  hosting provider was using Magic Transit, Cloudflare’s L3 DDoS protection service, the attack was automatically detected and mitigated.

Cloudflare DDoS threat report for 2022 Q4
Graph of a 1 Tbps DDoS attack

While bit-intensive attacks usually aim to clog up the Internet connection to cause a denial of service event, packet-intensive attacks attempt to crash in-line devices. If an attack sends more packets than you can handle, the servers and other in-line appliances might not be able to process legitimate user traffic, or even crash altogether.

DDoS attack duration
In Q4, the amount of shorter attacks lasting less than 10 minutes decreased by 76% QoQ, and the amount of longer attacks increased. Most notably, attacks lasting 1-3 hours increased by 349% QoQ and the amount of attacks lasting more than three hours increased by 87% QoQ. Most of the attacks, over 67% of them, lasted 10-20 minutes.

Cloudflare DDoS threat report for 2022 Q4
QoQ change in the duration of DDoS attacks in 2022 Q4

DDoS attack vectors
The attack vector is a term used to describe the attack method. In Q4, SYN floods remained the attacker’s method of choice — in fact, almost half of all network-layer DDoS attacks were SYN floods.

As a recap, SYN floods are a flood of SYN packets (TCP packets with the Synchronize flag turned on, i.e., the bit set to 1). SYN floods take advantage of the statefulness of the Three-way TCP handshake — which is the way to establish a connection between a server and a client.

Cloudflare DDoS threat report for 2022 Q4
The Three-way TCP Handshake

The client starts off by sending a SYN packet, the server responds with a Synchronize-acknowledgement (SYN/ACK) packet and waits for the client’s Acknowledgement (ACK) packet. For every connection, a certain amount of memory is allocated. In the SYN flood, the source IP addresses may be spoofed (altered) by the attacker, causing the server to respond with the SYN/ACK packets to the spoofed IP addresses — which most likely ignore the packet. The server then naively waits for the never arriving ACK packets to complete the handshake. After a while, the server times out and releases those resources. However, given a sufficient amount of SYN packets in a short amount of time, they may be enough to drain the server’s resources and render it unable to handle legitimate user connections or even crash altogether.

After SYN floods, with a massive drop in share, DNS floods and amplification attacks came in second place, accounting for ~15% of all network-layer DDoS attacks. And in third UDP-based DDoS attacks and floods with a 9% share.

Cloudflare DDoS threat report for 2022 Q4
Top attack vectors in 2022 Q4

Emerging DDoS threats
In Q4, Memcached-based DDoS attacks saw the highest growth — a 1,338% increase QoQ. Memcached is a database caching system for speeding up websites and networks. Memcached servers that support UDP can be abused to launch amplification/reflection DDoS attacks. In this case, the attacker would request content from the caching system and spoof the victim’s IP address as the source IP in the UDP packets. The victim will be flooded with the Memcache responses which can be amplified by a factor of up to 51,200x.

In second place, SNMP-based DDoS attacks increased by 709% QoQ. Simple Network Management Protocol (SNMP) is a UDP-based protocol that is often used to discover and manage network devices such as printers, switches, routers, and firewalls of a home or enterprise network on UDP well-known port 161. In an SNMP reflection attack, the attacker sends out numerous SNMP queries while spoofing the source IP address in the packet as the targets to devices on the network that, in turn, reply to that target’s address. Numerous responses from the devices on the network results in the target network being DDoSed.

In third place, VxWorks-based DDoS attacks increased by 566% QoQ. VxWorks is a real-time operating system (RTOS) often used in embedded systems such as Internet of Things (IoT) devices. It also is used in networking and security devices, such as switches, routers, and firewalls. By default, it has a debug service enabled which not only allows anyone to do pretty much anything to those systems, but it can also be used for DDoS amplification attacks. This exploit (CVE-2010-2965) was exposed as early as 2010 and as we can see it is still being used in the wild to generate DDoS attacks.

Cloudflare DDoS threat report for 2022 Q4
Top emerging threats in 2022 Q4

Target industries of network-layer DDoS attacks

In Q4, the Education Management industry saw the highest percentage of network-layer DDoS attack traffic — 92% of all traffic routed to the industry was network-layer DDoS attack traffic.

Not too far behind, in the second and third places, the Information Technology and Services alongside the Public Relations and Communications industries also saw a significant amount of network-layer DDoS attack traffic (~73%). With a high margin, the Finance, Gaming / Gambling, and Medical Practice industries came in next with approximately a third of their traffic flagged as attack traffic.

Cloudflare DDoS threat report for 2022 Q4
Top industries targeted by network-layer DDoS attacks in 2022 Q4

Target countries of network-layer DDoS attacks

Grouping attacks by our customers’ billing country lets us understand which countries are subject to more attacks. In Q4, a staggering 93% of traffic to Chinese Internet properties behind Cloudflare was network-layer DDoS attack traffic.

In second place, Lithuanian Internet properties behind Cloudflare saw 87% of their traffic belonging to network-layer DDoS attack traffic. Following were Finland, Singapore, and Taiwan with the highest percentage of attack traffic.

Cloudflare DDoS threat report for 2022 Q4
Top countries targeted by network-layer DDoS attacks in 2022 Q4

Source of network-layer DDoS attacks

In the application-layer, we used the attacking IP addresses to understand the origin country of the attacks. That is because at that layer, IP addresses cannot be spoofed (i.e., altered). However, in the network layer, source IP addresses can be spoofed. So, instead of relying on IP addresses to understand the source, we instead use the location of our data centers where the attack packets were ingested. We’re able to get geographical accuracy due to our large global coverage in over 275+ locations around the world.

In Q4, over 52% of the traffic we ingested in our Botswana-based data center was attack traffic. Not too far behind, over 43% of traffic in Azerbaijan was attack traffic, followed by Paraguay, Palestine, Laos, and Nepal.

Cloudflare DDoS threat report for 2022 Q4
Top Cloudflare data center locations with the highest percentage of DDoS attack traffic in 2022 Q4

Please note: Internet Service Providers may sometimes route traffic differently which may skew results. For example, traffic from China may be hauled through California due to various operational considerations.

Understanding the DDoS threat landscape

This quarter, longer and larger attacks became more frequent. Attack durations increased across the board, volumetric attacks surged, and Ransom DDoS attacks continued to rise. During the 2022 holiday season, the top targeted industries for DDoS attacks at the application-layer were Aviation/Aerospace and Events Services. Network-layer DDoS attacks targeted Gaming/Gambling, Finance, and Education Management companies. We also saw a shift in the top emerging threats, with Memcashed-based DDoS attacks continuing to increase in prevalence.

Defending against DDoS attacks is critical for organizations of all sizes. While attacks may be initiated by humans, they are executed by bots — and to play to win, you must fight bots with bots. Detection and mitigation must be automated as much as possible, because relying solely on humans puts defenders at a disadvantage. Cloudflare’s automated systems constantly detect and mitigate DDoS attacks for our customers, so they don’t have to.

Over the years, it has become easier, cheaper, and more accessible for attackers and attackers-for-hire to launch DDoS attacks. But as easy as it has become for the attackers, we want to make sure that it is even easier – and free – for defenders of organizations of all sizes to protect themselves against DDoS attacks of all types. We’ve been providing unmetered and unlimited DDoS protection for free to all of our customers since 2017 — when we pioneered the concept. Cloudflare’s mission is to help build a better Internet. A better Internet is one that is more secure, faster, and reliable for everyone – even in the face of DDoS attacks.

Sign up to the DDoS Trends Webinar to learn more about the emerging threats and how to defend against them.

ChatGPT-Written Malware

Post Syndicated from Bruce Schneier original https://www.schneier.com/blog/archives/2023/01/chatgpt-written-malware.html

I don’t know how much of a thing this will end up being, but we are seeing ChatGPT-written malware in the wild.

…within a few weeks of ChatGPT going live, participants in cybercrime forums—­some with little or no coding experience­—were using it to write software and emails that could be used for espionage, ransomware, malicious spam, and other malicious tasks.

“It’s still too early to decide whether or not ChatGPT capabilities will become the new favorite tool for participants in the Dark Web,” company researchers wrote. “However, the cybercriminal community has already shown significant interest and are jumping into this latest trend to generate malicious code.”

Last month, one forum participant posted what they claimed was the first script they had written and credited the AI chatbot with providing a “nice [helping] hand to finish the script with a nice scope.”

The Python code combined various cryptographic functions, including code signing, encryption, and decryption. One part of the script generated a key using elliptic curve cryptography and the curve ed25519 for signing files. Another part used a hard-coded password to encrypt system files using the Blowfish and Twofish algorithms. A third used RSA keys and digital signatures, message signing, and the blake2 hash function to compare various files.

Check Point Research report.

ChatGPT-generated code isn’t that good, but it’s a start. And the technology will only get better. Where it matters here is that it gives less skilled hackers—script kiddies—new capabilities.

Киберсигурност на стратегически обекти

Post Syndicated from Bozho original https://blog.bozho.net/blog/4001

Вчера изпратих въпрос до ДАНС относно видеокамери и валидатори в столичния градски транспорт

В малка част от реакциите и медийни публикации, това беше иронизирано като „Божанов се притесни, че руснаци и китайци ще ни следят в градския транспорт“. Разбирам тази интерпретация, тъй като ако човек няма целия контекст на киберсигурността и националната сигурност, всяко такова притеснение изглежда параноично. Затова ще си позволя малко по-дълго и техническо обяснение защо съществува риск и той трябва да бъде изследван.

Не казвам, че „руснаци и китайци ще ни следят“, обаче. Казвам, че чрез китайски и руски технологии, които са потенциално компрометирани, може да се въздейства негативно на стратегическата дейност – обществен транспорт в столицата.

По отношение на камерите – китайските (и не само) камери с известни уязвимости се използват по много начини от всякакви хакерски групи – и „частни“ и такива, които са свързани с чужди служби. Ако „хакването“ на тези камери е лесно (а то е, при някои модели), това допуска отдалечен контрол на тези устройства. Камерите едва ли са свързани директно с интернет, така че рискът е по-малък, но в зависимост от това как е сегментирана и защитена мрежата, пробив в една част може да доведе до достъп до камерите и извеждането на стрийм към трета страна.

Заради дългогодишни проблеми с евтини и незащитени устройства, Европейската комисия предлага „Регламент относно хоризонтални изисквания за киберсигурност за продукти с цифрови елементи и за изменение на Регламент (ЕС) 2019/1020“, с което да въведе изисквания към такъв тип устройства, вкл. за регулярни обновления, за докладване на уязвимости и др. Т.е. този проблем е доста масов и Европейската комисия е предприел законодателна инициатива.

Относно валидаторите, произведени в Русия – валидаторите имат задължително връзка с интернет (едва ли директно, но през вътрешна мрежа, която „излиза“ навън) защото трябва да извършва картови транзакции. Това означава, че са идеален обект на т.нар. supply chain атаки („атаки чрез веригата на доставки“). Дори в момента на производство и доставка да няма никаква уязвимост, при получаване на обновления такава може да бъде въведена.

Supply chain атаките са едни от най-трудните за установяване и предотвратяване, особено когато идват от място, на което имаш доверие, но то се оказва компрометирано. Една от най-мащабните хакерски атаки от последните години е т.нар. Solorigate, при което държавни институции и големи компании са атакувани през обновление за софтуер на SolarWinds. Затова големите компании правят оценка на риска на доставчиците си, за да оценят къде да фокусират повече усилия. Има цели компании, които се занимават изцяло с оценка на риска на доставчиците и на техните доставчици (защото един руски производител сам по себе си може да не е компрометиран, но негов подизпълнител може да бъде). Тъй като в Русия има репресивен режим, дори на добронамерена компания може да бъде въздействано, което увеличава риска. Такива са за хипотезите, поради които Касперски беше обявена за рискова компания от някои западни служби. Сложността при софтуерните системи е висока и това създава рискове за сигурността, които трябва да се изследват.

В конкретика, при въвеждане на „задна врата“ във валидатор и при недобра сегментация и защита на мрежата, това може да позволи „прескачане“ на хакерите от канала на валидатора към други системи. Вкл., например, за управление на стрелките или на електрическата мрежа в метрото, което вече води до рискове за физическата сигурност, а не само за мрежовата. Може да звучи параноично, и се надявам да остане такова, но това са реални рискове. Наскоро на една конференция, генерал от израелската армия сподели с половин уста за практиките на тяхната армия и служби спрямо неприятелски държави. Техните действия, по неговите думи, са с цел превенция и възпиране (deterrance), но други служби могат да имат други цели – от Христо Грозев и Белингкат разбрахме, че взривовете в български складове са дело на ГРУ (руското разузнаване).

С въпроса ми всъщност питам ДАНС дали ЦГМ и Метрополитен са взели необходимите мерки да ограничат тези рискове. Напр. дали са настроили защитните стени (firewall) правилно, дали следят за необичайни портове, за необичаен изходящ трафик към непознати адреси, дали пароли по подразбиране са сменени, как се управляват, дали се прилагат обновления (patch-ове), дали се следи трафика след прилагане на обновления, и други добри практики.

Винаги, когато се говори за киберсигурност и национална сигурност, нещата звучат притеснително за страничния наблюдател. А не трябва – всичко се свежда до управление на риска и прилагане на добри практики. В ДАНС има професионалисти, които разбират това и затова очаквам позитивен отговор, но съм длъжен да поставя тези въпроси. Киберсигурността на стратегически обекти е в компетенцията на ДАНС, но докато бях министър работихме добре съвместно с тях, тъй като министерството отговаря за киберсигурността в администрацията. А понякога дори за най-техническите неща се изисква политическа воля.

Материалът Киберсигурност на стратегически обекти е публикуван за пръв път на БЛОГодаря.

Integrating Linux with Okta Device Trust

Post Syndicated from original https://mjg59.dreamwidth.org/64311.html

I’ve written about bearer tokens and how much pain they cause me before, but sadly wishing for a better world doesn’t make it happen so I’m making do with what’s available. Okta has a feature called Device Trust which allows to you configure access control policies that prevent people obtaining tokens unless they’re using a trusted device. This doesn’t actually bind the tokens to the hardware in any way, so if a device is compromised or if a user is untrustworthy this doesn’t prevent the token ending up on an unmonitored system with no security policies. But it’s an incremental improvement, other than the fact that for desktop it’s only supported on Windows and MacOS, which really doesn’t line up well with my interests.

Obviously there’s nothing fundamentally magic about these platforms, so it seemed fairly likely that it would be possible to make this work elsewhere. I spent a while staring at the implementation using Charles Proxy and the Chrome developer tools network tab and had worked out a lot, and then Okta published a paper describing a lot of what I’d just laboriously figured out. But it did also help clear up some points of confusion and clarified some design choices. I’m not going to give a full description of the details (with luck there’ll be code shared for that before too long), but here’s an outline of how all of this works. Also, to be clear, I’m only going to talk about the desktop support here – mobile is a bunch of related but distinct things that I haven’t looked at in detail yet.

Okta’s Device Trust (as officially supported) relies on Okta Verify, a local agent. When initially installed, Verify authenticates as the user, obtains a token with a scope that allows it to manage devices, and then registers the user’s computer as an additional MFA factor. This involves it generating a JWT that embeds a number of custom claims about the device and its state, including things like the serial number. This JWT is signed with a locally generated (and hardware-backed, using a TPM or Secure Enclave) key, which allows Okta to determine that any future updates from a device claiming the same identity are genuinely from the same device (you could construct an update with a spoofed serial number, but you can’t copy the key out of a TPM so you can’t sign it appropriately). This is sufficient to get a device registered with Okta, at which point it can be used with Fastpass, Okta’s hardware-backed MFA mechanism.

As outlined in the aforementioned deep dive paper, Fastpass is implemented via multiple mechanisms. I’m going to focus on the loopback one, since it’s the one that has the strongest security properties. In this mode, Verify listens on one of a list of 10 or so ports on localhost. When you hit the Okta signin widget, choosing Fastpass triggers the widget into hitting each of these ports in turn until it finds one that speaks Fastpass and then submits a challenge to it (along with the URL that’s making the request). Verify then constructs a response that includes the challenge and signs it with the hardware-backed key, along with information about whether this was done automatically or whether it included forcing the user to prove their presence. Verify then submits this back to Okta, and if that checks out Okta completes the authentication.

Doing this via loopback from the browser has a bunch of nice properties, primarily around the browser providing information about which site triggered the request. This means the Verify agent can make a decision about whether to submit something there (ie, if a fake login widget requests your creds, the agent will ignore it), and also allows the issued token to be cross-checked against the site that requested it (eg, if g1thub.com requests a token that’s valid for github.com, that’s a red flag). It’s not quite at the same level as a hardware WebAuthn token, but it has many of the anti-phishing properties.

But none of this actually validates the device identity! The entire registration process is up to the client, and clients are in a position to lie. Someone could simply reimplement Verify to lie about, say, a device serial number when registering, and there’d be no proof to the contrary. Thankfully there’s another level to this to provide stronger assurances. Okta allows you to provide a CA root[1]. When Okta issues a Fastpass challenge to a device the challenge includes a list of the trusted CAs. If a client has a certificate that chains back to that, it can embed an additional JWT in the auth JWT, this one containing the certificate and signed with the certificate’s private key. This binds the CA-issued identity to the Fastpass validation, and causes the device to start appearing as “Managed” in the Okta device management UI. At that point you can configure policy to restrict various apps to managed devices, ensuring that users are only able to get tokens if they’re using a device you’ve previously issued a certificate to.

I’ve managed to get Linux tooling working with this, though there’s still a few drawbacks. The main issue is that the API only allows you to register devices that declare themselves as Windows or MacOS, followed by the login system sniffing browser user agent and only offering Fastpass if you’re on one of the officially supported platforms. This can be worked around with an extension that spoofs user agent specifically on the login page, but that’s still going to result in devices being logged as a non-Linux OS which makes interpreting the logs more difficult. There’s also no ability to choose which bits of device state you log: there’s a couple of existing integrations, and otherwise a fixed set of parameters that are reported. It’d be lovely to be able to log arbitrary material and make policy decisions based on that.

This also doesn’t help with ChromeOS. There’s no real way to automatically launch something that’s bound to localhost (you could probably make this work using Crostini but there’s no way to launch a Crostini app at login), and access to hardware-backed keys is kind of a complicated topic in ChromeOS for privacy reasons. I haven’t tried this yet, but I think using an enterprise force-installed extension and the chrome.enterprise.platformKeys API to obtain a device identity cert and then intercepting requests to the appropriate port range on localhost ought to be enough to do that? But I’ve literally never written any Javascript so I don’t know. Okta supports falling back from the loopback protocol to calling a custom URI scheme, but once you allow that you’re also losing a bunch of the phishing protection, so I’d prefer not to take that approach.

Like I said, none of this prevents exfiltration of bearer tokens once they’ve been issued, and there’s still a lot of ecosystem work to do there. But ensuring that tokens can’t be issued to unmanaged machines in the first place is still a step forwards, and with luck we’ll be able to make use of this on Linux systems without relying on proprietary client-side tooling.

(Time taken to code this implementation: about two days, and under 1000 lines of new code. Time taken to figure out what the fuck to write: rather a lot longer)

[1] There’s also support for having Okta issue certificates, but then you’re kind of back to the “How do I know this is my device” situation

comment count unavailable comments

Run a popular benchmark on Amazon Redshift Serverless easily with AWS Data Exchange

Post Syndicated from Jon Roberts original https://aws.amazon.com/blogs/big-data/run-a-popular-benchmark-on-amazon-redshift-serverless-easily-with-aws-data-exchange/

Amazon Redshift is a fast, easy, secure, and economical cloud data warehousing service designed for analytics. AWS announced Amazon Redshift Serverless general availability in July 2022, providing an easier experience to operate Amazon Redshift. Amazon Redshift Serverless makes it simple to run and scale analytics without having to manage your data warehouse infrastructure. Amazon Redshift Serverless automatically provisions and intelligently scales data warehouse capacity to deliver fast performance for even the most demanding and unpredictable workloads, and you pay only for what you use.

Amazon Redshift Serverless measures data warehouse capacity in Redshift Processing Units (RPUs). You pay for the workloads you run in RPU-hours on a per-second basis (with a 60-second minimum charge), including queries that access external data in open file formats like CSV and Parquet stored in Amazon S3. For more information on RPU pricing, refer to Amazon Redshift pricing.

AWS Data Exchange makes it easy to find, subscribe to, and use third-party data in the cloud. With AWS Data Exchange for Amazon Redshift, customers can start querying, evaluating, analyzing, and joining third-party data with their own first-party data without requiring any extracting, transforming, and loading (ETL). Data providers can list and offer products containing Amazon Redshift datasets in the AWS Data Exchange catalog, granting subscribers direct, read-only access to the data stored in Amazon Redshift. This feature empowers customers to quickly query, analyze, and build applications with these third-party datasets.

TPC-DS is a commonly used benchmark for measuring the query performance of data warehouse solutions such as Amazon Redshift. The benchmark is useful in proving the query capabilities of executing simple to complex queries in a timely manner. It is also used to measure the performance of different database configurations, different concurrent workloads, and also against other database products.

This blog post walks you through the steps you’ll need to set up Amazon Redshift Serverless and run the SQL queries derived from the TPC-DS benchmark against data from the AWS Data Exchange.

Solution overview

We will get started by creating an Amazon Redshift Serverless workgroup and namespace. A namespace is a collection of database objects and users while a workgroup is a collection of compute resources. To simplify executing the benchmark queries, a Linux EC2 instance will also be deployed.

Next, a GitHub repo containing the TPC-DS derived queries will be used. The TPC-DS benchmark is frequently used for evaluating the performance and functionality of cloud data warehouses. The TPC-DS benchmark includes additional steps and requirements to be considered official, but for this blog post, we are focused on only executing the SQL SELECT queries from this benchmark.

The last component of the solution is data. The TPC-DS benchmark includes binaries for generating data, but this is time-consuming to run. We have avoided this problem by generating the data, and we have made this available freely in the AWS Data Exchange.

Automated setup: CloudFormation

BDB-2063-launch-cloudformation-stack

Click the Launch Stack link above to launch the CloudFormation stack, which will automate the deployment of resources needed for the demo. The template deploys the following resources in your default VPC:

  • Amazon Compute Cloud (Amazon EC2) instance with the latest version of Amazon Linux
  • Amazon Redshift Serverless workgroup and namespace
  • IAM role with redshift-serverless:GetWorkgroup action granted; this is attached to the EC2 instance so that a command line interface (CLI) command can run to complete the instance configuration
  • Security group with inbound port 22 (ssh) and connectivity between the EC2 instance and the Amazon Redshift Serverless workgroup
  • The GitHub repo is downloaded in the EC2 instance

Template parameters

  • Stack: CloudFormation term used to define all of the resources created by the template.
  • KeyName: This is the name of an existing key pair. If you don’t have one already, create a key pair that is used to connect by SSH to the EC2 instance. More information on key pairs.
  • SSHLocation: The CIDR mask for incoming connections to the EC2 instance. The default is 0.0.0.0/0, which means any IP address is allowed to connect by SSH to the EC2 instance, provided the client has the key pair private key. The best practice for security is to limit this to a smaller range of IP addresses. For example, you can use sites like www.whatismyip.com to get your IP address.
  • RedshiftCapacity: This is the number of RPUs for the Amazon Redshift Serverless workgroup. The default is 128 and is recommended for analyzing the larger TPC-DS datasets. You can update the RPU capacity after deployment if you like or redeploy it with a different capacity value.

Manual setup

If you choose not to use the CloudFormation template, deploy the EC2 instance and Amazon Redshift Serverless with the following instructions. The following steps are only needed if you are manually provisioning the resources rather than using the provided CloudFormation template.

Amazon Redshift setup

Here are the high-level steps to create an Amazon Redshift Serverless workgroup. You can get more detailed information from this News Blog post.

To create your workgroup, complete the following steps:

  1. On the Amazon Redshift console, navigate to the Amazon Redshift Serverless dashboard.
  2. Choose Create workgroup.
  3. For Workgroup name, enter a name.
  4. Choose Next.
  5. For Namespace, enter a unique name.
  6. Choose Next.
  7. Choose Create.

These steps create an Amazon Redshift Serverless workgroup with 128 RPUs. This is the default; you can easily adjust this up or down based on your workload and budget constraints.

Linux EC2 instance setup

  • Deploy a virtual machine in the same AWS Region as your Amazon Redshift database using the Amazon Linux 2 AMI.
  • The Amazon Linux 2 AMI (64-bit x86) with the t2.micro instance type is an inexpensive and tested configuration.
  • Add the security group configured for your Amazon Redshift database to your EC2 instance.
  • Install psql with sudo yum install postgresql.x86_64 -y
  • Download this GitHub repo.
    git clone --depth 1 https://github.com/aws-samples/redshift-benchmarks /home/ec2-user/redshift-benchmarks

  • Set the following environment variables for Amazon Redshift:
    • PGHOST: This is the endpoint for the Amazon Redshift database.
    • PGPORT: This is the port the database listens on. The Amazon Redshift default is 5439.
    • PGUSER: This is your Amazon Redshift database user.
    • PGDATABASE: This is the database name where your external schemas are created. This is NOT the database created for the data share. We suggest using the default “dev” database.

Example:

export PGUSER="awsuser" 
export PGHOST="default.01.us-east-1.redshift-serverless.amazonaws.com" 
export PGPORT="5439" 
export PGDATABASE="dev"

Configure the .pgpass file to store your database credentials. The format for the .pgpass file is: hostname:port:database:user:password

Example:

default.01.us-east-1.redshift-serverless.amazonaws.com:5439:*:user1:user1P@ss

AWS Data Exchange setup

AWS Data Exchange provides third-party data in multiple data formats, including Amazon Redshift. You can subscribe to catalog listings in multiple storage locations like Amazon S3 and Amazon Redshift data shares. We encourage you to explore the AWS Data Exchange catalog on your own because there are many datasets available that can be used to enhance your data in Amazon Redshift.

First, subscribe to the AWS Marketplace listing for TPC-DS Benchmark Data. Select the Continue to subscribe button from the AWS Data Exchange catalog listing. After you review the offer and Terms and Conditions of the data product, choose Subscribe. Note that you will need the appropriate IAM permissions to subscribe to AWS Data Exchange on Marketplace. More information can be found at AWS managed policies for AWS Data Exchange.

TPC-DS uses 24 tables in a dimensional model that simulates a decision support system. It has store, catalog, and web sales as well as store, catalog, and web returns fact tables. It also has the dimension tables to support these fact tables.

TPC-DS includes a utility to generate data for the benchmark at a given scale factor. The smallest scale factor is 1 GB (uncompressed). Most benchmark tests for cloud warehouses are run with 3–10 TB of data because the dataset is large enough to stress the system but also small enough to complete the entire test in a reasonable amount of time.

There are six database schemas provided in the TPC-DS Benchmark Data subscription with 1; 10; 100; 1,000; 3,000; and 10,000 scale factors. The scale factor refers to the uncompressed data size measured in GB. Each schema refers to a dataset with the corresponding scale factor.

Scale factor (GB) ADX schema Amazon Redshift Serverless external schema
1 tpcds1 ext_tpcds1
10 tpcds10 ext_tpcds10
100 tpcds100 ext_tpcds100
1,000 tpcds1000 ext_tpcds1000
3,000 tpcds3000 ext_tpcds3000
10,000 tpcds10000 ext_tpcds10000

The following steps will create external schemas in your Amazon Redshift Serverless database that maps to schemas found in the AWS Data Exchange.

  • Log in to the EC2 instance and create a database connection.
    psql

  • Run the following query:
    select share_name, producer_account, producer_namespace from svv_datashares;

  • Use the output of this query to run the next command:
    create database tpcds_db from datashare <share_name> of account '<producer_account>' namespace '<producer_namespace>';

  • Last, you create the external schemas in Amazon Redshift:
    create external schema ext_tpcds1 from redshift database tpcds_db schema tpcds1;
    create external schema ext_tpcds10 from redshift database tpcds_db schema tpcds10;
    create external schema ext_tpcds100 from redshift database tpcds_db schema tpcds100;
    create external schema ext_tpcds1000 from redshift database tpcds_db schema tpcds1000;
    create external schema ext_tpcds3000 from redshift database tpcds_db schema tpcds3000;
    create external schema ext_tpcds10000 from redshift database tpcds_db schema tpcds10000;

  • You can now exit psql with this command:
    \q

TPC-DS derived benchmark

The TPC-DS derived benchmark consists of 99 queries in four broad categories:

  • Reporting queries
  • Ad hoc queries
  • Iterative OLAP queries
  • Data mining queries

In addition to running the 99 queries, the benchmark tests concurrency. During the concurrency portion of the test, there are n sessions (default of 5) that run the queries. Each session runs the 99 queries with different parameters and in slightly different order. This concurrency test stresses the resources of the database and generally takes longer to complete than just a single session running the 99 queries.

Some data warehouse products are configured to optimize single-user performance, whereas others may not have the ability to manage the workload effectively. This is a great way to demonstrate the workload management and stability of Amazon Redshift.

Since the data for each scale factor is located in a different schema, running the benchmark against each scale factor requires changing the schema you are referencing. The search_path defines which schemas to search for tables when a query contains objects without a schema included. For example:

ALTER USER <username> SET search_path=ext_tpcds3000,public;

The benchmark scripts set the search_path automatically.

Note: The scripts create a schema called tpcds_reports which will store the detailed output of each step of the benchmark. Each time the scripts are run, this schema will be recreated, and the latest results will be stored. If you happen to already have a schema named tpcds_reports, these scripts will drop the schema.

Running the TPC-DS derived queries

  • Connect by SSH to the EC2 instance with your key pair.
  • Change directory:
    cd ~/redshift-benchmarks/adx-tpc-ds/

  • Optionally configure the variables for the scripts in tpcds_variables.sh

Here are the default values for the variables you can set:

  • EXT_SCHEMA="ext_tpcds3000": This is the name of the external schema created that has the TPC-DS dataset. The “3000” value means the scale factor is 3000 or 3 TB (uncompressed).
  • EXPLAIN="false": If set to false, queries will run. If set to true, queries will generate explain plans rather than actually running. Each query will be logged in the log directory. Default is false.
  • MULTI_USER_COUNT="5": 0 to 20 concurrent users will run the queries. The order of the queries was set with dsqgen. Setting to 0 will skip the multi-user test. Default is 5.
  • Run the benchmark:
    ./rollout.sh > rollout.log 2>&1 &

TPC-DS derived benchmark results

We performed a test with the 3 TB ADX TPC-DS dataset on an Amazon Redshift Serverless workgroup with 128 RPUs. Additionally, we disabled query caching so that query results aren’t cached. This allows us to measure the performance of the database as opposed to its ability to serve results from cache.

The test comprises two sections. The first will run the 99 queries serially using one user while the second section will start multiple sessions based on the configuration file you set earlier. Each session will run concurrently, and each will run all 99 queries but in a different order.

The total runtime for the single-user queries was 15 minutes and 11 seconds. As shown in the following graph, the longest-running query was query 67, with an elapsed time of only 101 seconds. The average runtime was only 9.2 seconds.

1 Session TPC-DS 3TB 128 RPUs

With five concurrent users, the runtime was 28 minutes and 35 seconds, which demonstrates how Amazon Redshift Serverless performs well for single-user and concurrent-user workloads.

5 Concurrent Sessions TPC-DS 3TB 128 RPUs

As you can see, it was pretty easy to deploy Amazon Redshift Serverless, subscribe to an AWS Data Exchange product listing, and run a fairly complex benchmark in a short amount of time.

Next steps

You can run the benchmark scripts again but with different dataset sizes or a different number of concurrent users by editing the tpcds_variables.sh file. You can also try resizing your Amazon Redshift Serverless workgroup to see the performance difference with more or fewer RPUs. You can also run individual queries to see the results firsthand.

Another thing to try is to subscribe to other AWS Data Exchange products and query this data from Amazon Redshift Serverless. Be curious and explore using Amazon Redshift Serverless and the AWS Data Exchange!

Clean up

If you deployed the resources with the automated solution, you just need to delete the stack created in CloudFormation. All resources created by the stack will be deleted automatically.

If you deployed the resources manually, you need to delete the following:

  • The Amazon Redshift database created earlier.
    • If you deployed Amazon Redshift Serverless, you will need to delete both the workgroup and the namespace.
  • The Amazon EC2 instance.

Optionally, you can unsubscribe from the TPC-DS data by going to your AWS Data Exchange Subscriptions and then turning Renewal to Off.

Conclusion

This blog post covered deploying Amazon Redshift Serverless, subscribing to an AWS Data Exchange product, and running a complex benchmark in a short amount of time. Amazon Redshift Serverless can handle high levels of concurrency with very little effort and excels in price-performance.

If you have any questions or feedback, please leave them in the comments section.


About the author

Jon RobertsJon Roberts is a Sr. Analytics Specialist based out of Nashville, specializing in Amazon Redshift. He has over 27 years of experience working in relational databases. In his spare time, he runs.

Code conversion from Greenplum to Amazon Redshift: Handling arrays, dates, and regular expressions

Post Syndicated from Jagrit Shrestha original https://aws.amazon.com/blogs/big-data/code-conversion-from-greenplum-to-amazon-redshift-handling-arrays-dates-and-regular-expressions/

Amazon Redshift is a fully managed service for data lakes, data analytics, and data warehouses for startups, medium enterprises, and large enterprises. Amazon Redshift is used by tens of thousands of businesses around the globe for modernizing their data analytics platform.

Greenplum is an open-source, massively parallel database used for analytics, mostly for on-premises infrastructure. Greenplum is based on the PostgreSQL database engine.

Many customers have found migration to Amazon Redshift from Greenplum an attractive option instead of managing on-premises Greenplum for the following reasons:

Even though both Greenplum and Amazon Redshift use the open-source PostgreSQL database engine, migration still requires a lot of planning and manual intervention. This post covers the key functions and considerations while performing code conversion from Greenplum to Amazon Redshift. It is focused on the migration of procedures, functions, and views.

Solution overview

AWS Database Migration Service (AWS DMS) and the AWS Schema Conversion Tool (AWS SCT) can migrate most of the objects in a heterogeneous database migration from Greenplum to Amazon Redshift. But there are some situations where code conversion teams encounter errors and warnings for views, procedures, and functions while creating them in Amazon Redshift. To address this type of situation, manual conversion of the code is required.

The posts focuses on how to handle the following while migrating from Greenplum to Amazon Redshift:

  • Arrays
  • Dates and timestamps
  • Regular expressions (regex)

Please note that for this post, we use Greenplum 4.3 and Amazon Redshift PostgreSQL 8.2.

Working with array functions

The AWS SCT doesn’t convert array functions while migrating from Greenplum or PostgreSQL to Amazon Redshift. Developers need to extensively convert those functions manually. This post outlines the most common array functions:

  • ARRAY_UPPER
  • JSON_EXTACT_ARRAY_ELEMENT_TEXT and JSON_ARRAY_LENGTH
  • UNNEST ()
  • STRING_AGG()
  • ANY ARRAY()

ARRAY_UPPER()

This function returns the upper bound of an array. It can be used to extract the nth element from an array in PostgreSQL or Greenplum.

The Greenplum code is as follows:

With temp1 as
(
Select 'John' as FirstName, 'Smith' as LastName ,
array['"111-222-3333"','"101-201-3001"','"XXX-YYY-ZZZZ"','NULL'] as PhoneNumbers
union all
Select 'Bob' as FirstName, 'Haris' as LastName ,
array['222-333-4444','201-301-4001','AAA-BBB-CCCC'] as PhoneNumbers
union all
Select 'Mary' as FirstName, 'Jane' as LastName ,
array['333-444-5555','301-401-3001','DDD-EEE-FFFF'] as PhoneNumbers
)
Select Firstname, PhoneNumbers[ARRAY_UPPER(PhoneNumbers,1)]

There is no function to extract an element from an array in Amazon Redshift; however, there are two JSON functions that can be used for this purpose:

  • JSON_EXTRACT_ARRAY_ELEMENT_TEXT() – Returns a JSON array element in the outermost array of a JSON string
  • JSON_ARRAY_LENGTH() – Returns the number of elements in the outer array of a JSON string

See the following code:

With temp1 as
(
Select 'John' as FirstName, 'Smith' as LastName ,
array['"111-222-3333"','"101-201-3001"','"XXX-YYY-ZZZZ"'] as PhoneNumbers
union all
Select 'Bob' as FirstName, 'Haris' as LastName ,
array['"222-333-4444"','"201-301-4001"','"AAA-BBB-CCCC"'] as PhoneNumbers
union all
Select 'Mary' as FirstName, 'Jane' as LastName ,
array['"333-444-5555"','"301-401-3001"','"DDD-EEE-FFFF"'] as PhoneNumbers
)

Select
FirstName
,('['+array_to_string(phoneNumbers,',')+']') as JSONConvertedField
,JSON_EXTRACT_ARRAY_ELEMENT_TEXT
(
'['+array_to_string(phoneNumbers,',')+']'
,JSON_ARRAY_LENGTH('['+array_to_string(phoneNumbers,',')+']')-1
) as LastElementFromArray
from temp1

UNNEST()

UNNEST() is PostgreSQL’s system function for semi-structured data, expanding an array, or a combination of arrays to a set of rows. It is introduced to improve the database performance of thousands or records for inserts, updates, and deletes.

You can use UNNEST() for basic array, multiple arrays, and multiple arrays with different lengths.

Some of Amazon Redshift functions used to unnest arrays are split_part, json_extract_path_text, json_array_length, and json_extract_array_element_text.

In Greenplum, the UNNEST function is used to expand an array to a set of rows:

Select ‘A’,unnest(array([1,2])

Output
A 1
A 2

with temp1 as
(
Select 'John' as FirstName, 'Smith' as LastName ,
'111-222-3333' as Mobilephone,'101-201-3001' as HomePhone
union all
Select 'Bob' as FirstName, 'Haris' as LastName ,
'222-333-4444' as Mobilephone,'201-301-4001' as HomePhone
union all
Select 'Mary' as FirstName, 'Jane' as LastName ,
'333-444-5555' as Mobilephone,'301-401-3001' as HomePhone
)

select
FirstName
,LastName
,unnest(array[‘Mobile’::text,’HomePhone’::text]) as PhoneType
,unnest(array[MobilePhone::text,HomePhone::text]) as PhoneNumber
from
temp1
order by 1,2,3

Amazon Redshift doesn’t support the UNNEST function; you can use the following workaround:

with temp1 as
(
Select 'John' as FirstName, 'Smith' as LastName ,
'111-222-3333' as Mobilephone,'101-201-3001' as HomePhone
union all
Select 'Bob' as FirstName, 'Haris' as LastName ,
'222-333-4444' as Mobilephone,'201-301-4001' as HomePhone
union all
Select 'Mary' as FirstName, 'Jane' as LastName ,
'333-444-5555' as Mobilephone,'301-401-3001' as HomePhone
),
ns as
(
Select row_number() over(order by 1) as n from pg_tables
)

Select
FirstName
,LastName
,split_part('Mobile,Home',',',ns.n::int) as PhoneType
,split_part(MobilePhone|| '&&' || HomePhone, '&&', ns.n::int) as PhoneNumber
from
temp1, ns
where
ns.n<=regexp_count('Mobile,Home',',')+1
order by 1,2,3

When the element of array is in the form of array itself, use the JSON_EXTRACT_ARRAY_ELEMENT_TEXT() function and JSON_ARRAY_LENGTH:

with ns as
(
Select row_number() over(order by 1) as n from pg_tables
)

Select JSON_EXTRACT_ARRAY_ELEMENT_TEXT('["arrayelement1","arrayelement2"]',ns.n-1)
from ns
where
ns.n<=JSON_ARRAY_LENGTH('["arrayelement1","arrayelement2"]')

STRING_AGG()

The STRING_AGG() function is an aggregate function that concatenates a list of strings and places a separator between them. The function doesn’t add the separator at the end of the string. See the following code:

STRING_AGG ( expression, separator [order_by_clause] )

The Greenplum code is as follows:

with temp1 as
(
Select 'Finance'::text as Dept, 'John'::text as FirstName, 'Smith'::text as LastName
union all
Select 'Finance'::text as Dept, 'John'::text as FirstName, 'Doe'::text as LastName
union all
Select 'Finance'::text as Dept, 'Mary'::text as FirstName, 'Jane'::text as LastName
union all
Select 'Marketing'::text as Dept, 'Bob'::text as FirstName, 'Smith'::text as LastName
union all
Select 'Marketing'::text as Dept, 'Steve'::text as FirstName, 'Smith'::text as LastName
union all
Select 'Account'::text as Dept, 'Phil'::text as FirstName, 'Adams'::text as LastName
union all
Select 'Account'::text as Dept, 'Jim'::text as FirstName, 'Smith'::text as LastName
)
Select dept,STRING_AGG(FirstName||' '||LastName,' ; ') as Employees from temp1 group by dept order by 1

The Amazon Redshift equivalent for the STRING_AGG() function is LISTAGG(). This aggregate function orders the rows for that group according to the ORDER BY expression, then concatenates the values into a single string:

LISTAGG(expression, separator [order_by_clause])

See the following code:

Create temporary Table temp1 as
(
Select 'Finance'::text as Dept, 'John'::text as FirstName, 'Smith'::text as LastName
union all
Select 'Finance'::text as Dept, 'John'::text as FirstName, 'Doe'::text as LastName
union all
Select 'Finance'::text as Dept, 'Mary'::text as FirstName, 'Jane'::text as LastName
union all
Select 'Marketing'::text as Dept, 'Bob'::text as FirstName, 'Smith'::text as LastName
union all
Select 'Marketing'::text as Dept, 'Steve'::text as FirstName, 'Smith'::text as LastName
union all
Select 'Account'::text as Dept, 'Phil'::text as FirstName, 'Adams'::text as LastName
union all
Select 'Account'::text as Dept, 'Jim'::text as FirstName, 'Smith'::text as LastName
)

Select dept,LISTAGG(FirstName||' '||LastName,' ; ') as Employees from temp1
group by dept
order by 1

ANY ARRAY()

The PostgreSQL ANY ARRAY() function evaluates and compare the left-hand expression to each element in array:

Select * from temp1 where DeptName = ANY ARRAY('10-F','20-F','30-F')

In Amazon Redshift, the evaluation can be achieved with an IN operator:

Select * from temp1 where DeptName IN ('10-F','20-F','30-F')

Working with date functions

In this section, we discuss calculating the difference between date_part for Greenplum and datediff for Amazon Redshift.

When the application needs to calculate the difference between the subfields of dates for Greenplum, it uses the function date_part, which allows you to retrieve subfields such as year, month, week, and day. In the following example queries, we calculate the number of completion_days by calculating the difference between originated_date and eco_date.

To calculate the difference between the subfields of the date, Amazon Redshift has the function datediff. The following queries show an example of how to calculate the completion_days as the difference between eco_date and orginated_date. DATEDIFF determines the number of date part boundaries that are crossed between the two expressions.

We compare the Greenplum and Amazon Redshift queries as follows:

  • Difference by year

The following Greenplum query returns 1 year between 2009-01-01 and 2009-12-31:

SELECT date_part(‘year’, TIMESTAMP ‘2009-01-01’) - date_part(‘year’, 2008-12-31’) as year;

The following Amazon Redshift query returns 1 year between 2009-01-01 and 2009-12-31:

SELECT datediff (year, ‘2008-12-31’ , ‘2009-01-01’ ) as year;
  • Difference by month

The following Greenplum query returns 1 month between 2009-01-01 and 2008-12-31:

SELECT (date_part(‘year’, ‘2009-01-01’ :: date) - date_part(‘year’, ‘2008-12-31’ :: date)) * 12 +<br />(date_part(‘month’, ‘2009-01-01’) - date_part(‘month’, ‘2008-12-31’ :: date)) as month;

The following Amazon Redshift query returns 1 month between 2009-01-01 and 2008-12-31:

SELECT datediff( month, ‘2008-12-31’ , ‘2009-01-01’ ) as month;
  • Difference by week

The following Greenplum query returns 0 weeks between 2009-01-01 and 2009-12-31:

SELECT date_part(‘week’, timestamp ‘2009-01-01’ ) - date_part(‘week’, timestamp ‘2008-12-31’) as week;

The following Amazon Redshift query returns 0 weeks between 2009-01-01 and 2009-12-31:

SELECT datediff( week, ‘2008-12-31’ , ‘2009-01-01’ ) as week;
  • Difference by day

The following Greenplum query returns 1 day:

SELECT date_part ('day', '2009-01-01 24:00:00' :: timestamp - '2008-12-31 24:00:00 :: timestamp) as day;

The following Amazon Redshift query returns 1 day:

SELECT datediff (day, ‘2008-12-31’, ‘2009-01-01’) as day;
  • Difference by hour

The following Greenplum query returns 1 hour:

SELECT date_part(‘hour’, ‘2009-01-01 22:56:10’ :: timestamp - ‘2008-12-31 21:54:55' :: timestamp)

The following Amazon Redshift query returns 1 hour:

SELECT datediff (hour, ‘2009-01-01 21:56:10’, ‘2009-01-01’ ) as hour;
  • Difference by minute

The following Greenplum query returns 3 minutes:

SELECT date_part(‘minute’, ‘2009-01-01 22:56:10’ :: timestamp - ‘2009-01-01 21:53:10’ :: timestamp) as minutes;

The following Amazon Redshift query returns 1 minute:

SELECT datediff(minute, ‘2009-01-01 21:56:10’, ‘2009-01-01 21:57:55’) as minute;
  • Difference by second

The following Greenplum query returns 40 seconds:

SELECT date_part(‘second’, ‘2009-01-01 22:56:50’ :: timestamp - ‘2009-01-01 21:53:10’ : : timestamp) as seconds;

The following Amazon Redshift query returns 45 seconds:

SELECT datediff(second, ‘2009-01-01 21:56:10’, ‘2009-01-01- 21:56:55’) as seconds;

Now let’s look at how we use Amazon Redshift to calculate days and weeks in seconds.

The following Amazon Redshift query displays 2 days:

SELECT datediff(second, ‘2008-12-30 21:56:10’, ‘2009-01-01- 21:56:55’)/(60*60*24) as days;

The following Amazon Redshift query displays 9 weeks:

SELECT datediff(second, ‘2008-10-30 21:56:10’, ‘2009-01-01- 21:56:55’)/(60*60*24*7) as weeks;

For Greenplum, the date subfields need to be in single quotes, whereas for Amazon Redshift, we can use date subfields such as year, month, week, day, minute, second without quotes. For Greenplum, we have to subtract the subfield from one part to another part, whereas for Amazon Redshift we can use commas to separate the two dates.

Extract ISOYEAR from date

ISOYEAR 8601 is a week-numbering year. It begins with the Monday of the week containing the 4th of January. So for the date of early January or late December, the ISO year may be different from the Gregorian year. ISO year has 52 or 53 full weeks (364 or 371 days). The extra week is called a leap week; a year with such a week is called a leap year.

The following Greenplum query displays the ISOYEAR 2020:

SELECT extract (ISOYEAR from ‘2019-12-30’ :: date) as ISOYEARS;

The following Amazon Redshift query displays the ISOYEAR 2020:

SELECT to_char(‘2019-12-30’ :: date, ‘IYYYY’) as ISOYEARS;

Function to generate_series()

Greenplum has adopted the PostgreSQL function generate_series(). But the generate_series function works differently with Amazon Redshift while retrieving records from the table because it’s a leader node-only function.

To display a series of numbers in Amazon Redshift, run the following query on the leader node. In this example, it displays 10 rows, numbered 1–10:

SELECT generate_series(1,10);

To display a series of days for a given date, use the following query. It extracts the day from the given date and subtracts 1, to display a series of numbers from 0–6:

SELECT generate_series(0, extract(day from date ‘2009-01-07’) :: int -1);

But for the queries fetching the record from the table, joining with another table’s row, and processing data at the compute node, it doesn’t work, and generates an error message with Invalid Operation. The following code is an example of a SQL statement that works for Greenplum but fails for Amazon Redshift:

SELECT column_1,
FROM table_1t1
JOIN table_2 t2
ON t2.code = t1.code
CROSS JOIN generate_series(1,12) gen(fiscal_month)
WHERE condition_1

For Amazon Redshift, the solution is to create a table to store the series data, and rewrite the code as follows:

SELECT column1,
FROM table_t1 t1
JOIN table_t2 t2
ON t2.code = t1.code
CROSS JOIN (select “number” as fiscal_month FROM table_t3 WHERE “number”<=12) gen
WHERE condition_1

Working with regular expressions (regex functions)

Amazon Redshift and Greenplum both support three conditions for pattern matching:

  • LIKE
  • SIMILAR TO
  • POSIX operators

In this post, we don’t discuss all of these pattern matching in detail. Instead, we discuss a few regex functions and regex escape characters that aren’t supported by Amazon Redshift.

Regexp_split_to_table function

The Regex_split_to_table function splits a string using a POSIX regular expression pattern as delimiter.

This function has the following syntax:

Regexp_split_to_table(string,pattern [,flags])

For Greenplum, we use the following query:

select regexp_split_to_table ('bat,cat,hat',’\,’) as regexp_split_table_GP

For Amazon Redshift, the regexp_split_to_table function has to be converted using the Amazon Redshift split_part function:

SELECT column1,
FROM table_t1 t1
JOIN table_t2 t2
ON t2.code = t1.code
CROSS JOIN (select “number” as fiscal_month FROM table_t3 WHERE “number”<=12) gen
WHERE condition_1

Another way to convert regexp_split_to_table is as follows:

SELECT column1,
FROM table_t1 t1
JOIN table_t2 t2
ON t2.code = t1.code
CROSS JOIN (select “number” as fiscal_month FROM table_t3 WHERE “number”<=12) gen
WHERE condition_1

Substring from regex expressions

Substring (the string from the regex pattern) extracts the substring or value matching the pattern that is passed on. If there is no match, null is returned. For more information, refer to Pattern Matching.

We use the following code in Greenplum:

create temp table data1 ( col1 varchar );
insert into data1 values ('hellohowareyou 12\687687abcd');
select substring( col1 from '[A-Za-z]+$') from data1;
from data1

We can use the regexp_substr function to convert this code to Amazon Redshift. It returns the characters extracted from a string by searching for a regular expression pattern. The syntax is as follows:

REGEXP_SUBSTR ( source_string, pattern [, position [, occurrence [, parameters ] ] ] )
select regexp_substr( col1, '[A-Za-z]+$') as substring_from_rs from data1

Key points while converting regular expression escapes

The Postgres escape character E doesn’t work in Amazon Redshift. Additionally, the following Greenplum regular expression constraints aren’t supported in Amazon Redshift:

  • \m – Matches only at the beginning of a word
  • \y – Matches only at the beginning or end of a word

For Amazon Redshift, use \\< and \\>, or [[:<:]] and [[:>:]] instead.

Use the following code for Greenplum:

select col1,
case
when (col1) ~ E '\\m[0-9]{2}[A-Z]{1}[0-9]{1}' then
regexp_replace(col1, E '([0-9]{2})([A-Z]{1})([0-9]{1})',E '\\2')
else 'nothing'
end as regex_test
from temp1123

Use the following code for Amazon Redshift:

select col1,
case
when (col1) ~ '\\<[0-9]{2}[A-Z]{1}[0-9]{1}>\\' then
regexp_replace(col1,'([0-9]{2})([A-Z]{1})([0-9]{1})','\\2')
else 'nothing'
end as regex_test
from temp1123

OR

select col1,
case
when (col1) ~ '[[:<:]][0-9]{2}[A-Z]{1}[0-9]{1}[[:>:]]' then
regexp_replace(col1,'([0-9]{2})([A-Z]{1})([0-9]{1}) (.*)','\\2')
else 'nothing'
end as regex_test
from temp1123

Conclusion

For heterogeneous database migration from Greenplum to the Amazon Redshift, you can use AWS DMS and the AWS SCT to migrate most of the database objects, such as tables, views, stored procedures, and functions.

There are some situations in which one function is used for the source environment, and the target environment doesn’t support the same function. In this case, manual conversion is required to produce the same results set and complete the database migration.

In some cases, use of a new window function supported by the target environment proves more efficient for analytical queries to process petabytes of data.

This post included several situations where manual code conversion is required, which also improves the code efficiency and make queries efficient.

If you have any questions or suggestions, please share your feedback.


About the Authors

Jagrit Shrestha is a Database consultant at Amazon Web Services (AWS). He works as a database specialist helping customers migrate their on-premises database workloads to AWS and provide technical guidance.

Ishwar Adhikary is a Database Consultant at Amazon Web Services (AWS). He works closely with customers to modernize their database and application infrastructures. His focus area is migration of relational databases from On-premise data center to AWS Cloud.

Shrenik Parekh works as a Database Consultants at Amazon Web Services (AWS). He is expertise in database migration assessment, database migration, modernizing database environment with purpose-built database using AWS cloud database services. He is also focused on AWS web services for data analytics. In his spare time, he loves hiking, yoga and other outdoor activities.

Santhosh Meenhallimath is a Data Architect at AWS. He works on building analytical solutions, building data lakes and migrate Database into AWS.

Investigation by Bivol Burgas refinery of greater value to Lukoil than the one in Ploiesti. Are the Russians leaving Romania?

Post Syndicated from Николай Марченко original https://bivol.bg/burgas-refinery-of-greater-value-to-lukoil-than-the-one-in-ploiesti-are-the-russians-leaving-romania.html

понеделник 9 януари 2023


Lukoil is looking for buyers for their businesses in Romania and Moldova, Capital wrote on Monday quoting Balkan Insight. Based on information from the RuAssets registries, to which we have…

Проверка на “Биволъ” „Нефтохим“ – по-ценен за „Лукойл“ от Плоещ? Напускат ли руснаците Румъния

Post Syndicated from Николай Марченко original https://bivol.bg/neftochim_more_valuable.html

понеделник 9 януари 2023


„Лукойл“ търси купувачи за бизнеса си в Румъния и Молдова, писа в понеделник в. „Капитал“, позовавайки се на Balkan Insight. Справката на „Биволъ“ в регистрите на руските активи по света…

Happy New Year! AWS Week in Review – January 9, 2023

Post Syndicated from Channy Yun original https://aws.amazon.com/blogs/aws/happy-new-year-aws-week-in-review-january-9-2023/

Happy New Year! As we kick off 2023, I wanted to take a moment to remind you of some 2023 predictions by AWS leaders for you to help prepare for the new year.

You can also read the nine best things Amazon announced and AWS for Automotive at the Consumer Electronics Show (CES) 2023 in the last week to see the latest offerings from Amazon and AWS that are helping innovate at speed and create new customer experiences at the forefront of technology.

Last Year-End Launches
We skipped two weeks since the last week in review on December 19, 2022. I want to pick some important launches from them.

Last Week’s Launches
As usual, let’s take a look at some launches from the last week that I want to remind you of:

  • Amazon S3 Encrypts New Objects by Default – Amazon S3 encrypts all new objects by default. Now, S3 automatically applies server-side encryption (SSE-S3) for each new object, unless you specify a different encryption option. There is no additional cost for default object-level encryption.
  • Amazon Aurora MySQL Version 3 Backtrack Support – Backtrack allows you to move your MySQL 8.0 compatible Aurora database to a prior point in time without needing to restore from a backup, and it completes within seconds, even for large databases.
  • Amazon EMR Serverless Custom Images – Amazon EMR Serverless now allows you to customize images for Apache Spark and Hive. This means that you can package application dependencies or custom code in the image, simplifying running Spark and Hive workloads.
  • The Graph Explorer, Open-Source Low-Code Visual Exploration Tool – Amazon Neptune announced the graph-explorer, a React-based web application that enables users to visualize both property graph and Resource Description Framework (RDF) data and explore connections between data without having to write graph queries. To learn more about open source updates at AWS, see Ricardo’s OSS newsletter.

For a full list of AWS announcements, be sure to keep an eye on the What’s New at AWS page.

Other AWS News
Here are some other news items that you may find interesting in the new year:

  • AWS Collective on Stack Overflow – Please join the AWS Collective on Stack Overflow, which provides builders a curated space to engage and learn from this large developer’s community.
  • AWS Fundamentals Book – This upcoming AWS online book is intended to focus on AWS usage in the real world, and goes deeper with amazing per-service infographics.
  • AWS Security Events Workshops – AWS Customer Incident Response Team (CIRT) release five real-world workshops that simulate security events, such as server-side request forgery, ransomware, and cryptominer-based security events, to help you learn the tools and procedures that AWS CIRT uses.

Upcoming AWS Events
Check your calendars and sign up for these AWS events in the new year:

  • AWS Builders Online Series on January 18 – This online conference is designed for you to learn core AWS concepts, and step-by-step architectural best practices, including demonstrations to help you get started and accelerate your success on AWS.
  • AWS Community Day Singapore on January 28 – Come and join AWS User Group Singapore’s first AWS Community Day, a community-led conference for AWS users. See Events for Developers to learn about developer events hosted by AWS and the AWS Community.
  • AWS Cloud Practitioner Essentials Day in January and February – This online workshop provides a detailed overview of cloud concepts, AWS services, security, architecture, pricing, and support. This course also helps you prepare for the AWS Certified Cloud Practitioner examination.

You can browse all upcoming in-person, and virtual events.

That’s all for this week. Check back next Monday for another Week in Review!

— Channy

This post is part of our Week in Review series. Check back each week for a quick roundup of interesting news and announcements from AWS!

Year in Review: Rapid7 Vulnerability Management

Post Syndicated from Tom Caiazza original https://blog.rapid7.com/2023/01/09/year-in-review-vulnerability-management/

Year in Review: Rapid7 Vulnerability Management

For Rapid7’s vulnerability management team, 2022 began with a lot of introspection on how we can add more value and keep meeting our customer needs in the best possible ways.

Over the course of 2022, we launched many new features and improvements — some highly anticipated, many customer-requested. Log4J was difficult, but we learned from it, particularly when it comes to Emergent Threat Response.

Additionally, we recently refreshed our coordinated vulnerability disclosure (CVD) policy and philosophy. We found that we couldn’t treat every vulnerability equally and there was a need to be more agile with our CVD approach. So, we came up with six classes of vulnerabilities (and a meta-classification of “more than one”) and some broad strokes of what we intend to accomplish with our CVD for each of them.

We reimagined many of our internal processes and teams to drive better customer outcomes. For instance, we are making a significant investment in re-architecting the InsightVM/Nexpose database to ensure VM programs scale with the customers evolving IT environment.

We will continue to prioritize what really matters, even if it means making some hard decisions, and further improve communication with our customers. Here’s a snapshot of 2022 in InsightVM.

Key Product Improvements

Agent-based policy assessment

A robust vulnerability management program should assess IT assets for misconfigurations along with vulnerabilities. That’s why we were thrilled to introduce Agent-Based Policy in InsightVM. Customers can now use Insight Agents to conduct configuration assessments of IT assets against widely used industry benchmarks from the Center for Internet Security (CIS) and the U.S. Defense Information Systems Agency (DISA) to help prevent breaches and ensure compliance.

Year in Review: Rapid7 Vulnerability Management

Remediation Project improvements

Remediation Projects help security teams collaborate and track progress of remediation work (often assigned to their IT ops counterparts). Here are our favorite updates:

  • Remediator Export – a new solution-based CSV export option, Remediator Export contains detailed information about the assets, vulnerabilities, proof data, and more for a given solution.
  • Better way to track project progress – The new metric that calculates progress for Remediation Projects will advance for each individual asset remediated within a “solution” group. This means customers no longer have to wait for all the affected assets to be remediated to see progress.
Year in Review: Rapid7 Vulnerability Management

Scan Assistant

Scan Assistant provides an innovative alternative to traditional credentialed scanning. Instead of account-based credentials, it uses digital certificates, which increases security and simplifies administration for authenticated scans.

  • Scan Assistant is now generally available for Linux
  • Automatic Scan Assistant credential generation – taking some more burden off the vulnerability management teams, customers can use the Shared Credentials management UI to automatically generate Scan Assistant credentials
  • Improved scalability – automated Scan Assistant software updates and digital certificate rotation for customers seeking to deploy and maintain a fleet of Scan Assistants.

Dashboards and reports

Customers like to use dashboards to visualize the impact of a specific vulnerability or vulnerabilities to their environment, and we made quite a few updates in that area:

  • New dashboard cards based on CVSS v3 severity – we expanded CVSS dashboard cards to include a version that sorts the vulnerabilities based on CVSS v3 scores (along with CVSS v2 scores).
  • Threat feed dashboard includes CISA’s KEV catalog – we extended the scope of vulnerabilities tracked to incorporate CISA’s KEV catalog in the InsightVM Threat Feed Dashboard to help customers prioritize faster.
  • 5 New Dashboard Cards – We launched a set of five new dashboard cards that utilize line charts to show trends in vulnerability severity and allow for easy comparison when reporting.
  • Distribute Reports via Email – Customers can now send InsightVM reports to their teammates through email.
Year in Review: Rapid7 Vulnerability Management

Agent improvements for virtual desktops

Pandemic fueled remote work and with it the use of virtual desktops. InsightVM can now identify agent-based assets that are Citrix VDI instances and correlate them to the user, enabling more accurate asset/instance tagging. This will create a smooth, streamlined experience for organizations that deploy and scan Citrix VDIs. Expect similar improvements for VMware Horizon VDIs in 2023.

Improved support

A new, opt-in feature eliminates the need for customers to attach logs to support cases and/or send logs manually, ensuring a faster, more intuitive support process.

Notable Emergent Threat Responses and Recurring Coverages

In 2022, we added support for enterprise systems like Windows Server 2022, AlmaLinux, VMware Horizon (server and client), and more to the recurring coverage list. Learn about the systems with recurring coverage.

Rapid7’s Emergent Threat Response (ETR) program is part of an ongoing process to deliver fast, expert analysis alongside first-rate security content for the highest-priority security threats. This year we flagged a number of critical vulnerabilities. To list a few:

That’s not all. We added over 21,000 new checks across close to 9000 CVEs to help customers understand their risk better and thus secure better.

Check out our past blogs – Q1, Q2, and Q3 – to get more information on product improvements and key vulnerability coverages.

Customer Stories and Resources

The past year, we had the privilege to share stories of how our customers are using Insight VM to secure their environment. Check out how your peers are leveraging InsightVM.Here’s what one customer had to say:

“That is one of the things we value most about InsightVM; it has the capacity to pinpoint actively-exploited vulnerabilities, so we can prioritize and direct our attention where it’s needed most.”

For customers looking to improve the utilization of the Vulnerability Management tool, check out this webcast series that covers the different phases of VM lifecycle – Discovery, Analyze, Communicate, and Remediate. Lastly, customers can always leverage Rapid7 Academy to participate in workshops and training to continue their learning journey.

Looking forward to 2023

We will maintain the customer-centricity in 2023 as we continue to deliver features and improvements in customers’ best interests. We will be holding a webinar on January 24 around configuration assessment in InsightVM agent-based policy. And, as always, be on the lookout for our annual vulnerability intelligence report coming soon to a Q1 near you (here’s last year’s)!

[$] Memory-management short topics: page-table sharing and working sets

Post Syndicated from original https://lwn.net/Articles/919143/

The kernel’s memory-management developers have been busy before and during
the holidays; the result is a number of patch sets making significant
changes to that subsystem. It is time for a quick look at three of those
projects. Two of them aim to increase the sharing of page tables between
processes, while the third takes advantage of the multi-generational LRU to create a better
picture of what a process’s working set actually is.

Security updates for Monday

Post Syndicated from original https://lwn.net/Articles/919422/

Security updates have been issued by Fedora (python2.7), SUSE (ca-certificates-mozilla, libksba, and ovmf), and Ubuntu (linux, linux-aws, linux-aws-5.4, linux-gcp, linux-gcp-5.4, linux-gke,
linux-gkeop, linux-hwe-5.4, linux-ibm, linux-ibm-5.4, linux-kvm,
linux-oracle, linux-oracle-5.4, linux-raspi, linux-raspi-5.4, linux, linux-aws, linux-aws-hwe, linux-azure, linux-azure-4.15,
linux-dell300x, linux-gcp, linux-gcp-4.15, linux-hwe, linux-kvm,
linux-oracle, linux-raspi2, linux-snapdragon, linux, linux-aws, linux-kvm, linux-lowlatency, linux-raspi, linux, linux-gcp, linux-gke, linux-gkeop, linux-hwe-5.15, linux-ibm,
linux-kvm, linux-lowlatency, linux-oracle, linux-raspi,, and linux-aws).

The collective thoughts of the interwebz