Tag Archives: Amazon QuickSight

Reference guide to build inventory management and forecasting solutions on AWS

Post Syndicated from Jason Dalba original https://aws.amazon.com/blogs/big-data/reference-guide-to-build-inventory-management-and-forecasting-solutions-on-aws/

Inventory management is a critical function for any business that deals with physical products. The primary challenge businesses face with inventory management is balancing the cost of holding inventory with the need to ensure that products are available when customers demand them.

The consequences of poor inventory management can be severe. Overstocking can lead to increased holding costs and waste, while understocking can result in lost sales, reduced customer satisfaction, and damage to the business’s reputation. Inefficient inventory management can also tie up valuable resources, including capital and warehouse space, and can impact profitability.

Forecasting is another critical component of effective inventory management. Accurately predicting demand for products allows businesses to optimize inventory levels, minimize stockouts, and reduce holding costs. However, forecasting can be a complex process, and inaccurate predictions can lead to missed opportunities and lost revenue.

To address these challenges, businesses need an inventory management and forecasting solution that can provide real-time insights into inventory levels, demand trends, and customer behavior. Such a solution should use the latest technologies, including Internet of Things (IoT) sensors, cloud computing, and machine learning (ML), to provide accurate, timely, and actionable data. By implementing such a solution, businesses can improve their inventory management processes, reduce holding costs, increase revenue, and enhance customer satisfaction.

In this post, we discuss how to streamline inventory management forecasting systems with AWS managed analytics, AI/ML, and database services.

Solution overview

In today’s highly competitive business landscape, it’s essential for retailers to optimize their inventory management processes to maximize profitability and improve customer satisfaction. With the proliferation of IoT devices and the abundance of data generated by them, it has become possible to collect real-time data on inventory levels, customer behavior, and other key metrics.

To take advantage of this data and build an effective inventory management and forecasting solution, retailers can use a range of AWS services. By collecting data from store sensors using AWS IoT Core, ingesting it using AWS Lambda to Amazon Aurora Serverless, and transforming it using AWS Glue from a database to an Amazon Simple Storage Service (Amazon S3) data lake, retailers can gain deep insights into their inventory and customer behavior.

With Amazon Athena, retailers can analyze this data to identify trends, patterns, and anomalies, and use Amazon ElastiCache for customer-facing applications with reduced latency. Additionally, by building a point of sales application on Amazon QuickSight, retailers can embed customer 360 views into the application to provide personalized shopping experiences and drive customer loyalty.

Finally, we can use Amazon SageMaker to build forecasting models that can predict inventory demand and optimize stock levels.

With these AWS services, retailers can build an end-to-end inventory management and forecasting solution that provides real-time insights into inventory levels and customer behavior, enabling them to make informed decisions that drive business growth and customer satisfaction.

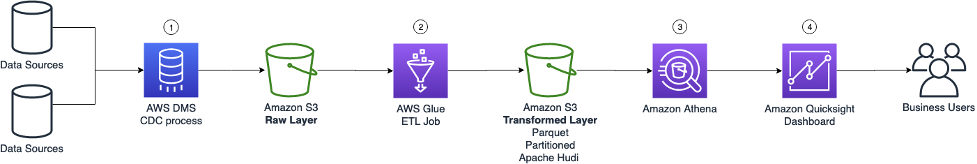
The following diagram illustrates a sample architecture.

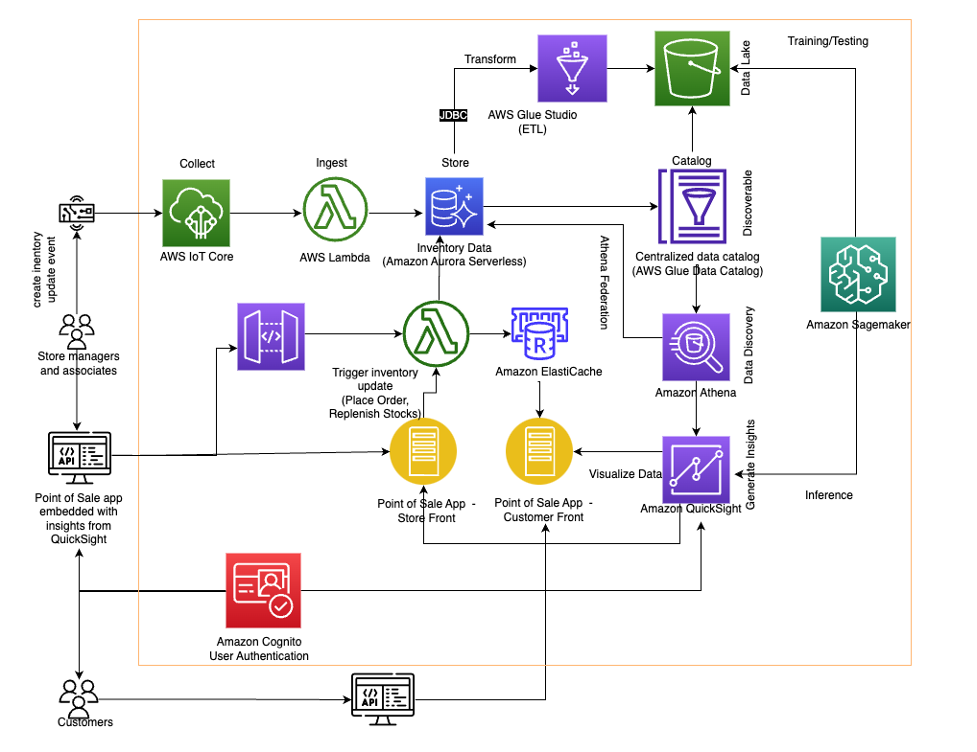
With the appropriate AWS services, your inventory management and forecasting system can have optimized collection, storage, processing, and analysis of data from multiple sources. The solution includes the following components.

Data ingestion and storage

Retail businesses have event-driven data that requires action from downstream processes. It’s critical for an inventory management application to handle the data ingestion and storage for changing demands.

The data ingestion process is typically triggered by an event such as an order being placed, kicking off the inventory management workflow, which requires actions from backend services. Developers are responsible for the operational overhead of trying to maintain the data ingestion load from an event driven-application.

The volume and velocity of data can change in the retail industry each day. Events like Black Friday or a new campaign can create volatile demand in what is required to process and store the inventory data. Serverless services designed to scale to businesses’ needs help reduce the architectural and operational challenges that are driven from high-demand retail applications.

Understanding the scaling challenges that occur when inventory demand spikes, we can deploy Lambda, a serverless, event-driven compute service, to trigger the data ingestion process. As inventory events occur like purchases or returns, Lambda automatically scales compute resources to meet the volume of incoming data.

After Lambda responds to the inventory action request, the updated data is stored in Aurora Serverless. Aurora Serverless is a serverless relational database that is designed to scale to the application’s needs. When peak loads hit during events like Black Friday, Aurora Serverless deploys only the database capacity necessary to meet the workload.

Inventory management applications have ever-changing demands. Deploying serverless services to handle the ingestion and storage of data will not only optimize cost but also reduce the operational overhead for developers, freeing up bandwidth for other critical business needs.

Data performance

Customer-facing applications require low latency to maintain positive user experiences with microsecond response times. ElastiCache, a fully managed, in-memory database, delivers high-performance data retrieval to users.

In-memory caching provided by ElastiCache is used to improve latency and throughput for read-heavy applications that online retailers experience. By storing critical pieces of data in-memory like commonly accessed product information, the application performance improves. Product information is an ideal candidate for a cached store due to data staying relatively the same.

Functionality is often added to retail applications to retrieve trending products. Trending products can be cycled through the cache dependent on customer access patterns. ElastiCache manages the real-time application data caching, allowing your customers to experience microsecond response times while supporting high-throughput handling of hundreds of millions of operations per second.

Data transformation

Data transformation is essential in inventory management and forecasting solutions for both data analysis around sales and inventory, as well as ML for forecasting. This is because raw data from various sources can contain inconsistencies, errors, and missing values that may distort the analysis and forecast results.

In the inventory management and forecasting solution, AWS Glue is recommended for data transformation. The tool addresses issues such as cleaning, restructuring, and consolidating data into a standard format that can be easily analyzed. As a result of the transformation, businesses can obtain a more precise understanding of inventory, sales trends, and customer behavior, influencing data-driven decisions to optimize inventory management and sales strategies. Furthermore, high-quality data is crucial for ML algorithms to make accurate forecasts.

By transforming data, organizations can enhance the accuracy and dependability of their forecasting models, ultimately leading to improved inventory management and cost savings.

Data analysis

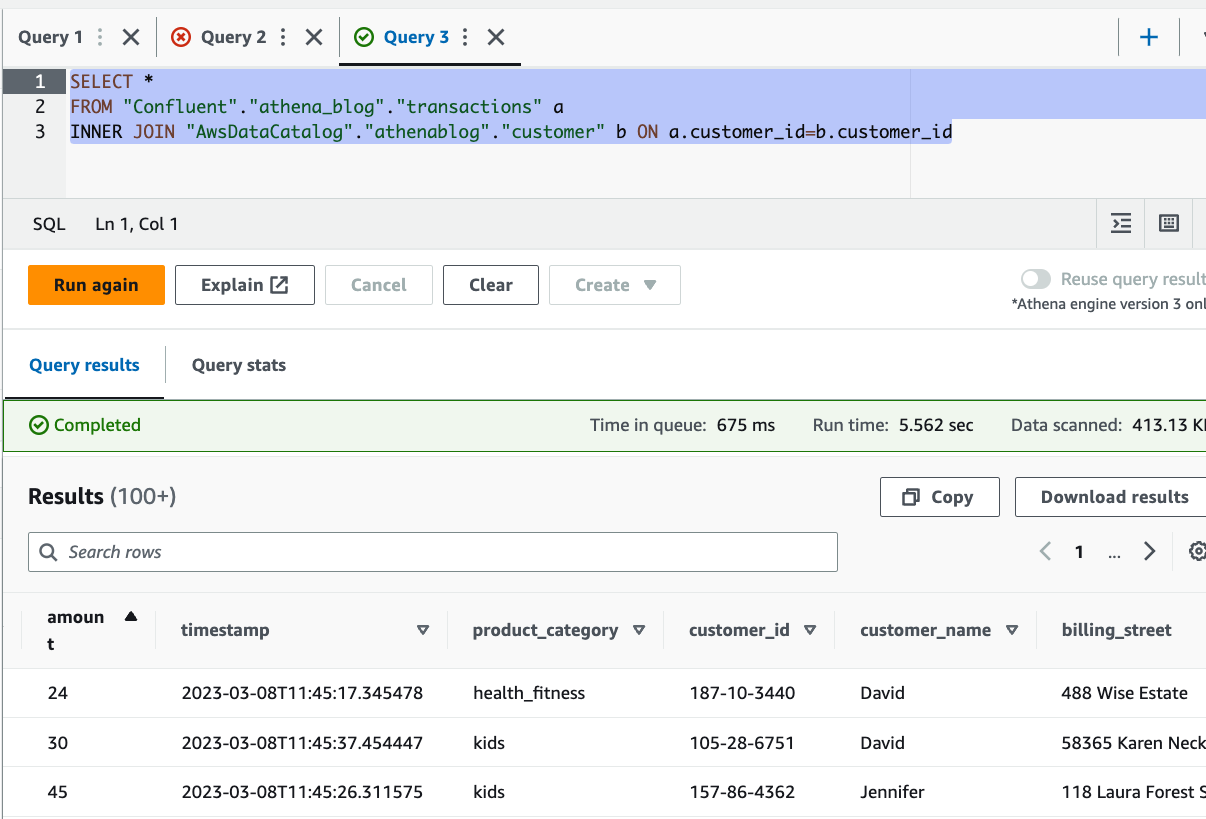
Data analysis has become increasingly important for businesses because it allows leaders to make informed operational decisions. However, analyzing large volumes of data can be a time-consuming and resource-intensive task. This is where Athena come in. With Athena, businesses can easily query historical sales and inventory data stored in S3 data lakes and combine it with real-time transactional data from Aurora Serverless databases.

The federated capabilities of Athena allow businesses to generate insights by combining datasets without the need to build ETL (extract, transform, and load) pipelines, saving time and resources. This enables businesses to quickly gain a comprehensive understanding of their inventory and sales trends, which can be used to optimize inventory management and forecasting, ultimately improving operations and increasing profitability.

With Athena’s ease of use and powerful capabilities, businesses can quickly analyze their data and gain valuable insights, driving growth and success without the need for complex ETL pipelines.

Forecasting

Inventory forecasting is an important aspect of inventory management for businesses that deal with physical products. Accurately predicting demand for products can help optimize inventory levels, reduce costs, and improve customer satisfaction. ML can help simplify and improve inventory forecasting by making more accurate predictions based on historical data.

SageMaker is a powerful ML platform that you can use to build, train, and deploy ML models for a wide range of applications, including inventory forecasting. In this solution, we use SageMaker to build and train an ML model for inventory forecasting, covering the basic concepts of ML, the data preparation process, model training and evaluation, and deploying the model for use in a production environment.

The solution also introduces the concept of hierarchical forecasting, which involves generating coherent forecasts that maintain the relationships within the hierarchy or reconciling incoherent forecasts. The workshop provides a step-by-step process for using the training capabilities of SageMaker to carry out hierarchical forecasting using synthetic retail data and the scikit-hts package. The FBProphet model was used along with bottom-up and top-down hierarchical aggregation and disaggregation methods. We used Amazon SageMaker Experiments to train multiple models, and the best model was picked out of the four trained models.

Although the approach was demonstrated on a synthetic retail dataset, you can use the provided code with any time series dataset that exhibits a similar hierarchical structure.

Security and authentication

The solution takes advantage of the scalability, reliability, and security of AWS services to provide a comprehensive inventory management and forecasting solution that can help businesses optimize their inventory levels, reduce holding costs, increase revenue, and enhance customer satisfaction. By incorporating user authentication with Amazon Cognito and Amazon API Gateway, the solution ensures that the system is secure and accessible only by authorized users.

Next steps

The next step to build an inventory management and forecasting solution on AWS would be to go through the Inventory Management workshop. In the workshop, you will get hands-on with AWS managed analytics, AI/ML, and database services to dive deep into an end-to-end inventory management solution. By the end of the workshop, you will have gone through the configuration and deployment of the critical pieces that make up an inventory management system.

Conclusion

In conclusion, building an inventory management and forecasting solution on AWS can help businesses optimize their inventory levels, reduce holding costs, increase revenue, and enhance customer satisfaction. With AWS services like IoT Core, Lambda, Aurora Serverless, AWS Glue, Athena, ElastiCache, QuickSight, SageMaker, and Amazon Cognito, businesses can use scalable, reliable, and secure technologies to collect, store, process, and analyze data from various sources.

The end-to-end solution is designed for individuals in various roles, such as business users, data engineers, data scientists, and data analysts, who are responsible for comprehending, creating, and overseeing processes related to retail inventory forecasting. Overall, an inventory management and forecasting solution on AWS can provide businesses with the insights and tools they need to make data-driven decisions and stay competitive in a constantly evolving retail landscape.


About the Authors

Jason D’Alba is an AWS Solutions Architect leader focused on databases and enterprise applications, helping customers architect highly available and scalable solutions.

Navnit Shukla is an AWS Specialist Solution Architect, Analytics, and is passionate about helping customers uncover insights from their data. He has been building solutions to help organizations make data-driven decisions.

Vetri Natarajan is a Specialist Solutions Architect for Amazon QuickSight. Vetri has 15 years of experience implementing enterprise business intelligence (BI) solutions and greenfield data products. Vetri specializes in integration of BI solutions with business applications and enable data-driven decisions.

Sindhura Palakodety is a Solutions Architect at AWS. She is passionate about helping customers build enterprise-scale Well-Architected solutions on the AWS platform and specializes in Data Analytics domain.

It’s the Amazon QuickSight Community’s 1st birthday!

Post Syndicated from Kristin Mandia original https://aws.amazon.com/blogs/big-data/its-the-amazon-quicksight-communitys-1st-birthday/

Happy birthday Amazon QuickSight Community! We are celebrating 1 year since the launch of our new Community. The Amazon QuickSight Community website is a one-stop-shop where business intelligence (BI) authors and developers from across the globe can ask and answer questions, stay up to date, network, and learn together about Amazon QuickSight. In this post, we celebrate the rapid growth of our first year of the QuickSight Community, discuss new Community features, and share voices from our Community. We also invite you to sign up for the QuickSight Community (it’s easy and free) and get started on your learning journey.

Happy 1st birthday Amazon QuickSight Community!

We’re growing strong

Since last year’s announcement of the new QuickSight Community, we are witnessing hundreds of thousands of visits to the QuickSight Community each month. Answers to thousands of searchable questions have been posted, and our online Learning Series is now running every week. An events calendar has been added, and hundreds of learning resources have been posted (how-to videos and articles, Getting Started resources, blog posts, and What’s New posts). Furthermore, a Community Manager has been brought on board. And Community Experts and QuickSight Solution Architects are posting robust answers in the Q&A, supported by AWS Professional Services, AWS Data Lab, and Amazon QuickSight Service Delivery Partners—led by West Loop Strategy. In addition, other QuickSight Partners and content creators are bringing new life to the Community.

QuickSgiht Community members at an Amazon conference

New QuickSight Community members at an internal Amazon conference

Why are we excited? Community members share their voices

As we celebrate year one, QuickSight Community members share their voices:

“The community has been an awesome space to exchange ideas, problems, and solutions, which has really helped every one of us in adopting QuickSight more effectively!” #thank you #community — Sagnik Mukherjee, Data and Analytics Architect, QuickSight Expert

“I am so excited for the QuickSight Learning Series! And I am happy to know that there is a supportive community…as I begin my QS journey!“ — Rachel Krentz, Configuration Analyst, Madaket

“The community has evolved so much in just one year!” — Darren Demicoli, BI Team Lead, The Mill Adventure, QuickSight Expert

“Happy Birthday QuickSight Community! I’m pretty new here but have found this to be a really great resource with answers to every question I have been able to come up with so far. Cheers!” — Brian Jager, Sales Operations Lead, Amazon Business

“I love being connected directly with other users and solutions architects…The QuickSight Community helps me out a ton not having to spend as much of my time on training when I can point new users to a resource where their questions have likely already been answered.” — Ryane Brady, Programmer Analyst, GROWMARK, Inc., QuickSight Expert

Hear more voices from our Community on our birthday post.

The QuickSight Community: Your one-stop-shop for BI learning

Here’s a quick tour of the QuickSight Community website as well as its new features.

The following figure shows the homepage view and everything that’s available.

A One-Stop-Shop for your Business Intelligence journey includes resource toolbar, searchable Q&A, learning resources, what’s new, blog, events and featured content

Learning Center: What’s new

In addition to growing a robust, searchable Q&A, in the last year, we’ve added tons of new learning resources to the QuickSight Community, including:

When you select Learning Center on the homepage, you can choose from these various resources.

Amazon QuickSight Learning Center – includes getting started resources, how to videos, webinar videos, articles, and other resources.

New: Learning events

In the last year, we’ve added an Events section to the QuickSight Community. We now offer weekly and monthly learning webinars as well as featured in-person and online events. Ongoing virtual events include:

New: Experts and user groups

We’ve been excited to see QuickSight user groups pop up over the past year, including one in the Twin Cities and one in Chicago—both hosted by QuickSight Service Delivery Partners (Charter Solutions and West Loop Strategy, respectively).

In addition, we’ve launched our QuickSight Experts program, honoring top question-answerers in the Community. These rock stars have relentlessly helped their peers take their learning to the next level.

QuickSight Community Expert

Ryane Brady, Programmer Analyst, GROWMARK, Inc., is a QuickSight Expert and top question-answerer in the Community. Here she is showing off her Expert swag. See the 2022 to Q1 2023 list of Experts at the bottom of this post.

First External Viz Challenge

In the last year, AWS hosted its very first external data visualization design competition to invited QuickSight Service Delivery Partners. This enabled QuickSight Partners to show off their visual analytics and storytelling skills. We were proud to feature the QuickSight Partner Viz Challenge winners of 2022 on the QuickSight Community.

Amazon QuickSight Service Delivery Partner Viz Challenge winners

Want to be a part of the QuickSight Community?

Sign up now to join the QuickSight Community (it’s free and easy) and take your QuickSight learning to the next level.

As part of the Community, you can:

  • Encourage your teams and colleagues to create QuickSight Community user profiles—signup up is easy
  • Click the bell icon in the top right corner of the page to get notifications and keep up to date with QuickSight news
  • Share your community ideas with the Community Manager

Come in on the ground floor and help us take the QuickSight Community to the next level:

  • Become an Expert and share your knowledge
  • Pioneer a user group online or in your area
  • Contribute a how-to article

If you’re interested in any of these opportunities, reach out to Kristin, the Sr. Online Community Manager for QuickSight, at [email protected].

We’re just getting started

Thank you to everyone who has helped the QuickSight Community grow over the last year! We can’t wait to see what this next year has in store!

Special thanks to our QuickSight Experts who make the QuickSight Community possible (listed alphabetically): Ryane Brady, Biswajit Dash, Darren Demicoli, Max Engelhard, Charles Greenacre, Naveed Hashimi, Todd Hoffman, Mike Khuns, Thomas Kotzurek, Sanjeeb Mohapatra, Sagnik Mukherjee and David Wong. Incredible gratitude to Lillie Atkins and Mia Heard, who launched the Community a year ago. Also, thanks to Jose Kunnackal John, Jill Florant, the QuickSight Solution Architects, Amazon QuickSight Service Delivery Partners—led by West Loop Strategy, AWS Service Acceleration team, AWS ProServe team, and AWS Data Lab team for your incredible investment in the QuickSight Community.


About the Authors

Kristin Mandia is Senior Online Community Manager for Amazon QuickSight, Amazon Web Service’s cloud-native, fully managed BI service.


Ian McNamara
is a Program Manager and writer on the Customer Success Team for Amazon QuickSight, Amazon Web Service’s cloud-native, fully managed BI service.

Showpad accelerates data maturity to unlock innovation using Amazon QuickSight

Post Syndicated from Shruthi Panicker original https://aws.amazon.com/blogs/big-data/showpad-accelerates-data-maturity-to-unlock-innovation-using-amazon-quicksight/

Showpad aligns sales and marketing teams around impactful content and powerful training, helping sellers engage with buyers and generate the insights needed to continuously improve conversion rates. In 2021, Showpad set forth the vision to use the power of data to unlock innovations and drive business decisions across its organization. Showpad’s legacy solution was fragmented and expensive, with different tools providing conflicting insights and lengthening time to insight. The company decided to use AWS to unify its business intelligence (BI) and reporting strategy for both internal organization-wide use cases and in-product embedded analytics targeted at its customers.

Showpad built new customer-facing embedded dashboards within Showpad eOSTM and migrated its legacy dashboards to Amazon QuickSight, a unified BI service providing modern interactive dashboards, natural language querying, paginated reports, machine learning (ML) insights, and embedded analytics at scale.

In this post, we share how Showpad used QuickSight to streamline data and insights access across teams and customers. Showpad migrated over 70 dashboards with over 1,000 visuals. They have rolled out the solution to all its 600 employees, increased dashboard development activity by three times, and reduced dashboard turnaround time from months to weeks. Showpad also launched dashboards and reports to over 1,300 customers worldwide, providing access to tens of thousands of users across all its customers.

Streamlining data-driven decisions by defragmenting the data and reporting architecture

Founded in 2011, dual headquartered in Belgium and Chicago and with offices around the world, Showpad provides a single destination for sales representatives to access all sales content and information, along with coaching and training tools to create informed, upskilled, and trusted buying teams. The platform also provides analytics and insights to support successful information sharing and fuel continuous improvement. In 2021, Showpad decided to take the next step in its data evolution and set forth the vision to power innovation, product decisions, and customer engagement using data-driven insights. This required Showpad to accelerate its data maturity as a company by mindfully using data and technology holistically to help its customers.

But the company’s legacy BI solution and data were fragmented across multiple tools, some with proprietary logic. “Each of these tools were getting data from a different place, and that’s where it gets difficult,” says Jeroen Minnaert, head of data at Showpad. “If each tool tells a different story because it has different data, we won’t have alignment within the business on what this data means.” Showpad also struggled with data quality issues in terms of consistency, ownership, and insufficient data access across its targeted user base due to a complex BI access process, licensing challenges, and insufficient education.

Showpad wanted to unify all the data into a single unified interface through a data lake, democratize that data through a BI solution such that autonomous teams across the company could effectively use data, and drive and unlock innovation in the company through advanced insights data, artificial intelligence, and ML. The company already used AWS in other aspects of its business and found that QuickSight would not only meet all its BI and reporting needs with seamless integrations into the AWS stack, but also bring with it several unique benefits unlike incumbents and other tools evaluated. “We chose QuickSight because of its embedded analytic capabilities, serverless architecture, and consumption-based pricing,” says Minnaert. “Using QuickSight to launch interactive dashboards and reporting for our customers, along with the ability for our customer success teams to create or alter dashboard prototypes on our internal-facing QuickSight instance and then promote those dashboards to customers through the product, was a very compelling use case.”

QuickSight would help local data stewards, who weren’t technical but knew the use cases intimately, to create their own dashboards and prototype them with their customers before promoting them through the product. “The serverless model was also compelling because we did not have to pay for server instances nor license fees per reader. With QuickSight, we pay for usage. This makes it easy for us to provide access to everyone by default. This is a key pillar in our ability to democratize data,” says Minnaert.

A screenshot of Showpad's Platform/Adoption dashboard

Architecting a portable data layer and migrating to QuickSight to accelerate time to value

After choosing QuickSight as its solution in November 2021, Showpad took on two streams of development: migrating internal organization-wide BI reporting and building in-product reporting using embedded analytics. Showpad worked closely alongside the QuickSight team to have a smooth rollout. The company involved members of the QuickSight team in its internal communications and set up meetings every 2 weeks to resolve difficult issues quickly.

On the internal reporting front, the data team took a “working backwards” approach to make sure it had the right approach before going all in with all existing dashboards. Showpad selected five difficult and complex dashboards and took 3 months to explore various possibilities using QuickSight. For example, the team determined that user log-in would be automated with single sign-on and Okta and built a plan for assets organization, asset promotion, and access controls. The company also used the opportunity to reimagine its data pipeline and architecture. A key architectural decision that Showpad took during this time was to create a portable data layer by decoupling the data transformation from visualization, ML, or ad hoc querying tools and centralizing its business logic. The portable data layer facilitated the creation of data products for varied use cases, made available within various tools based on the need of the consumer—be it a business analyst, data scientist, or business user.

After the solution approach was decided on and the foundation was built, the team wanted to scale. However, with 70 dashboards with over 1,000 visuals with varying levels of complexities, including proprietary logic unique to certain tools, and data from over 1,000 tables ingesting data from over 20 data sources, the team decided to take a measured approach to the migration. The entire data team of 20 people were “all on hands on deck” for the project.

First, Showpad created a landscape of all the dashboards, connecting data sources and dependencies before prioritizing the migration order. The company decided to start with dashboards with the fewest dependencies, like product and engineering dashboards that had a single data source, followed by revenue operations dashboards with a couple of data sources, and lastly with customer success and marketing dashboards that combined product and engineering and revenue operations data. After migration was complete, Showpad validated all the numbers and worked with business stakeholders for quality assurance. It launched the first set of dashboards in April 2022, followed by customer success and marketing dashboards in July 2022. As of January 2023, Showpad’s QuickSight instance includes over 2,433 datasets and 199 dashboards.

Showpad also achieves benefits for its customers by using QuickSight to deliver a wide variety of insights, including usage dashboards, industry comparisons, user comparison, group comparison, and revenue attribution. On the second workstream of in-product customer-facing reporting, Showpad released its first version of QuickSight reporting to customers in June 2022. “We went through user research, development, and beta tests in a span of 6 months, which was a fast turnaround and a big win for us,” says Minnaert. And Showpad aims to further accelerate the turnaround time to make a report and ship it to a customer.

With the foundational architecture now in place, shipping to a customer can happen in a few sprints, with most of the time spent on iterating and fine-tuning insights instead of engineering a scalable reporting solution. Showpad can also improve the insights it offers to customers. “Using QuickSight in our product makes it a powerful tool,” says Minnaert. “We can launch reporting for our customers so that they can look at and interpret data by themselves.” Showpad can then follow up with tailor-made reporting for each customer using the same data so that it tells a consistent story.

After a dashboard is agreed on, the dashboard can go through Showpad’s automated dashboard promotion process that can take an idea from development to production to a smile on a customer’s face in weeks, not months.

A screenshot of their Shared Space engagement dashboard

Unlocking innovation with self-service BI and rapid prototyping

By providing dashboard and report building to analysts and nontechnical users, Showpad drastically reduced overall turnaround time to build and deliver insights, down from months to weeks. Showpad also increased dashboard development activity by three times across the organization.

Showpad users can quickly prototype reports in a well-known environment—building reports using QuickSight, and then testing them with customers by helping customers understand how the reporting would look and function. “After we settle on reports or dashboards, it does not take much engineering effort to bring them to production,” says Minnaert. “We can make a lot of innovation happen by quickly prototyping and bringing validated prototypes to production.” Showpad’s users and customers also benefit from performance gains with 10 times increased speed when using SPICE (Super-fast, Parallel, In-memory Calculation Engine), which is the robust in-memory engine that QuickSight uses. It takes only seconds to load dashboards.

Because QuickSight is serverless and uses a session-based pricing model, Showpad expects to see cost savings. By paying per use, Showpad can easily provide access to all its users and customers without purchasing expensive per-reader licenses. Showpad also doesn’t need to pay for server instances or maintain infrastructure for BI. In addition, Showpad can deprecate custom reporting, infrastructure, and multiple tools with the new data architecture and QuickSight. “Much of our cost savings will come from being able to deprecate the custom reporting that we’ve made in the past,” says Minnaert. “The custom reporting used a lot of infrastructure that we no longer need to maintain.” Showpad expects to see a three times increase in projected return on investment in the upcoming year.

Showpad completed its internal BI migration to QuickSight by the end of 2022. Showpad also continues to expand the in-product reporting while continuing to optimize performance for the best customer experience. Showpad hopes to further reduce the time it takes to load a dashboard to under 1 second.

In conjunction with Showpad’s new portable data layer, QuickSight helps users of all types across its organization and customers self-serve data and insights rapidly. Everyone in Showpad gets access to data and insights the day they onboard with Showpad. To make self-service even easier, Showpad will soon launch embedded Amazon QuickSight Q so anyone can ask questions in natural language and receive accurate answers with relevant visualizations that help them gain insights from the data. By helping business users and experts rapidly prototype dashboards and reports in line with user and customer needs, Showpad uses the power of data to unlock innovation and drive growth across its organization. “QuickSight has become our go-to tool for any BI requirement at Showpad—both internal and external customer facing, especially when it comes to correlating data across departments and business units,” says Minnaert.

Get started with QuickSight

Migrating to QuickSight enabled Showpad to streamline data and insights access across teams and customers and reduced overall turnaround time to build and deliver insights from months to weeks.

Learn more about unleashing your organization’s ability to accelerate revenue growth with Showpad. To learn more about how QuickSight can help your business with dashboards, reports, and more, visit Amazon QuickSight.


About the Author

Shruthi Panicker is a Senior Product Marketing Manager with Amazon QuickSight at AWS. As an engineer turned product marketer, Shruthi has spent over 15 years in the technology industry in various roles from software engineering, to solution architecting to product marketing. She is passionate about working at the intersection of technology and business to tell great product stories that help drive customer value.

Create threshold alerts on tables and pivot tables in Amazon QuickSight

Post Syndicated from Lillie Atkins original https://aws.amazon.com/blogs/big-data/create-threshold-alerts-on-tables-and-pivot-tables-in-amazon-quicksight/

Amazon QuickSight previously launched threshold alerts on KPIs and gauge charts. Now, QuickSight supports creating threshold alerts on tables and pivot tables—our most popular visual types. This allows readers and authors to track goals or key performance indicators (KPIs) and be notified via email when they are met. These alerts allow readers and authors to relax and rely on notifications for when their attention is needed. In this post, we share how to create threshold alerts on tables or pivot tables to track important metrics.

Background information

Threshold alerts are a QuickSight Enterprise Edition feature and available for dashboards consumed on the QuickSight website. Threshold alerts aren’t yet available in embedded QuickSight dashboards or on the mobile app.

Alerts are created based on the visual at that point in time and are not affected by potential future changes to the visual’s design. This means the visual can be changed or deleted and the alert continues to work as long as the data in the dataset remains valid. In addition, you can create multiple alerts off of one visual, and rename them as appropriate.

Finally, alerts respect RLS and CLS rules.

Set up an alert on a table or pivot table

Threshold alerts are configured for dashboards. On a dashboard, there are three different ways to create an alert on a table or pivot table.

First, you can create directly from a pivot table or table. You click directly on the cell you would like to create an alert on (if there is another action enabled, you may have to right-click to get this option to show). This needs to be on a numeric value (no dates or strings allow for creation of alerts). Then choose Create Alert to start creating the alert.

Let’s assume you want to track the profit coming from online purchases for auto-related merchandise being shipped first class. Choose the appropriate cell and then choose Create Alert.

Create Alert

You’re presented with the creation pane for alerts. The only difference from KPIs or gauge visual alerts is that here you’ll find the other dimensions in the row that you’re creating the alert on. This will help you identify what value from the table you have selected, because there can be duplicates of the numeric values.

In the following screenshot, the value to track is profit, which currently is $437.39. This is the value that will be compared to the threshold you set. You will also see the dimensions being used to define this alert, which are taken from the row of the table. In this case, the Category is Auto, the Segement is Online, and the Ship Mode is First Class.

Now that you have checked that the value is correct, you can update the name of the alert that is automatically filled with the name of the visual it is created off of, set the condition (between Is above, Is below, and Is equal to), and pick the threshold value, notification frequency, and whether you want to be emailed when there is no data.

In the following example, the alert has been configured so that you will receive an email when the profit is above the threshold of $1,000. You’ve also left the notification frquency at Daily at most and haven’t requested to be emailed when there is no data.

If you have a date field, you also will see an option to control the date. This will automatically set the date field to be the most recent of whatever aggregation you’re looking at, such as hour, week, day, month. However, you could override to use the specific date applied to the value you have selected if you would prefer.

Below is an example where the data was aggregated based on the week and so Latest Week has been selected rather than the historical Week of Jan 4, 2015.

You can then choose Save if you’re happy with the alert and it will load the Manage alert pane.

The Create Alert button is also at the bottom of the pane. This is the second way you can start creating an alert off of a table or pivot table.

You can also get to this pane from the upper right alert button on the dashboard.

Create Alert through the icon on dashboard

If you have no alerts, this will automatically drop you into the creation pane. There you will be asked to select a visual that supports alerts to begin creating an alert. If you already have alerts (as previously demonstrated), then all you need to do is choose Create Alert.

Then select a visual and choose Next.

You’re prompted to select a cell if you have picked a table or pivot table visual.

Then you repeat the same steps as creating off a cell within a table or pivot table.

Finally, you can start creating an alert from the bell icon on the pivot table or table. This is the third way to create an alert.

bell icon

You’ll be prompted to select a cell from the table, and the creation pane appears.

After you choose the cell that you want to track, you start the creation process just like the first two examples.

Update and delete alerts

To update or delete an alert, you need to navigate back to the Manage alerts pane. You get there from the bell icon on the top right corner of the dashboard.

Create Alert through the icon on dashboard

You can then choose the options menu (three dots) on the alert you want to manage. Three options appear: Edit alert, View history (to view recent times the alert has breached and notified you), and Delete.

Notifications

You’ll receive an email when your alert breaches the rule you set. The following is an example of what that looks like (the alert has been adjusted to be alerted if profit is over $100 and to be notified as frequently as possible).

notification if alert is breached

The current profit breach is highlighted and the historical numbers are shown along with the date and time of the recorded breaches. You can also navigate to the dashboard by choosing View Dashboard.

Evaluate alerts

The evaluation schedule for threshold alerts is based on the dataset. For SPICE datasets, alert rules are checked against the data after a successful data refresh. With datasets querying your data sources directly, alerts are evaluated daily at a random time between 6:00 PM and 8:00 AM. This is based on the the timezone of the AWS Region your dataset was created in. Dataset owners can set up their own schedules for checking alerts and increase the frequency up to hourly (to learn more, refer to Working with threshold alerts in Amazon QuickSight).

Restrict alerts

The admin for the QuickSight account can restrict who has access to set threshold alerts through custom permissions. For more information, see the section Customizing user permissions in Embed multi-tenant analytics in applications with Amazon QuickSight.

Pricing

Threshold alerts are billed for each evaluation, and follow the familiar pricing used for anomaly detection, starting at $0.50 per 1,000 evaluations. For example, if you set up an alert on a SPICE dataset that refreshes daily, you have 30 evaluations of the alert rule in a month, which costs 30 * $0.5/1000 = $0.015 in a month. For more information, refer to Amazon QuickSight Pricing.

Conclusion

In this post, you learned how to create threshold alerts on tables and pivot tables within QuickSight dashboards so that you can track important metrics. For more information about how to create threshold alerts on KPIs or gauge charts, refer to Create threshold-based alerts in Amazon QuickSight. Additional information is available in the Amazon QuickSight User Guide.


About the Author

Lillie Atkins is a Product Manager for Amazon QuickSight, Amazon Web Service’s cloud-native, fully managed BI service.

Deep Pool boosts software quality control using Amazon QuickSight

Post Syndicated from Shruthi Panicker original https://aws.amazon.com/blogs/big-data/deep-pool-boosts-software-quality-control-using-amazon-quicksight/

Deep Pool Financial Solutions, an investor servicing and compliance solutions supplier, was looking to build key performance indicators to track its software tests, failures, and successful fixes to pinpoint the specific areas for improvement in its client software. Deep Pool was unable to access the large amounts of data that its project management software provided, so it used AWS to access, manage, and analyze that data more efficiently.

During a larger migration to the AWS Cloud, the company discovered Amazon QuickSight, a cloud-native, serverless business intelligence (BI) service that powers interactive dashboards that let companies make better data-driven decisions. With QuickSight, Deep Pool could democratize access to this unused data and pinpoint areas for improvement in its software development processes, thereby improving the overall quality of its software.

According to Brett Promisel, Chief Operating Officer for Deep Pool, the company wanted to manage the data that it was collecting from a BI point of view to help it make more informed decisions. Because word of mouth and high-quality software are critical in Deep Pool’s industry, the company wanted to add additional rigorous quality controls to its product development and testing so that it continues to provide top-notch, stable software that its clients can rely on.

In this post, we share how Deep Pool boosted its software quality control using QuickSight.

Enhancing software testing to with data-driven insights

Continuous improvement is a hallmark of leading organizations. Deep Pool wanted achieve greater software quality and decided to improve how it monitored and managed its software testing processes using data.

Typical development processes involve extensive testing. First, the original developer tests the code, and then the code is unit tested. Next, larger groups test the code. For all this testing to be successful and result in product improvement, it needs to be measured and tracked so that developers can learn from it and implement improvements during the development process.

Using QuickSight for data-driven insights, Deep Pool has implemented significant software testing and control. It can now count the number of bugs found or tests failed and time how long it took to create patches and repair issues. It can also better track its work backlog and the progress of functionality requests. Monitoring this information lets the company know that it has successfully implemented improvements, because a decreasing number of bugs over time is a strong indicator of quality control.

Monitoring development to increase efficiency

Better software test management benefits two groups: internal teams and external customers. Deep Pool can now log and communicate important information, such as when a request is made, how it’s being resolved or addressed, and how it’s being tested. In addition to helping internal teams streamline their processes, the company can also use this data to track communications with customers, which are also stored in its project management software. Such knowledge helps the company determine whether customer requests are being promptly addressed and identify common trends that require action on a larger scale.

Seven development teams at Deep Pool independently write the code for the components of the company’s software products, and they must integrate those components to create the final products. With the granularity of the data that is provided by QuickSight, Deep Pool can thoroughly analyze the development and testing of these products. The company now has the ability to trace software bugs down to their original coding, which makes it simple to quickly locate and address any issues that come up. Deep Pool can also measure the results of those mitigating actions and determine whether its repairs were successful.

Attention to detail helps Deep Pool improve software quality, leading to better products and customers who are more likely to give positive referrals.

“Amazon QuickSight is extremely valuable to us when performing quality control. We can now expose our whole development team to how we’re managing databases and servers and measuring performance in a more optimal way,” says Promisel.

Deep Pool has successfully proven that it can use QuickSight to measure its quality control to improve its software and, ultimately, better support its customers. Since the migration to AWS, the number of software issues discovered and logged has dropped by 57%.

The increased quality control that has come from the company’s focus on accessing all its data and optimizing its use has led to better efficiency, which results in the ability to expand its growth without increasing its costs.

“We should be able to increase our customer base without adding the equivalent costs. Making sure we are as efficient as possible lets me manage that way,” says Promisel.

Expanding into more data sources

Deep Pool is also exploring how to expand its use of QuickSight to extract and use data from even more of its databases. In the future, it hopes to analyze its internal metrics, such as sales data, and its external client-related information, such as assets and holdings, to guide how it builds its client software and provides even more custom products.

Deep Pool is also committed to helping its employees be innovative and successful by investing in their futures and skill sets. It understands that well-trained employees can optimize the use of their tools, which results in better products. As such, the company will continue to invest in the training offered by AWS. Using cutting-edge tools and promoting its intent to invest in its employees indicate to Deep Pool’s customers that the company plans to stay innovative and ahead of the technological curve.

To learn more about how QuickSight can help your business with dashboards, reports, and more, visit Amazon QuickSight.


About the Author

Shruthi Panicker is a Senior Product Marketing Manager with Amazon QuickSight at AWS. As an engineer turned product marketer, Shruthi has spent over 15 years in the technology industry in various roles from software engineering, to solution architecting to product marketing. She is passionate about working at the intersection of technology and business to tell great product stories that help drive customer value.

Visualize Confluent data in Amazon QuickSight using Amazon Athena

Post Syndicated from Ahmed Zamzam original https://aws.amazon.com/blogs/big-data/visualize-confluent-data-in-amazon-quicksight-using-amazon-athena/

This is a guest post written by Ahmed Saef Zamzam and Geetha Anne from Confluent.

Businesses are using real-time data streams to gain insights into their company’s performance and make informed, data-driven decisions faster. As real-time data has become essential for businesses, a growing number of companies are adapting their data strategy to focus on data in motion. Event streaming is the central nervous system of a data in motion strategy and, in many organizations, Apache Kafka is the tool that powers it.

Today, Kafka is well known and widely used for streaming data. However, managing and operating Kafka at scale can still be challenging. Confluent offers a solution through its fully managed, cloud-native service that simplifies running and operating data streams at scale. Confluent extends open-source Kafka through a suite of related services and features designed to enhance the data in motion experience for operators, developers, and architects in production.

In this post, we demonstrate how Amazon Athena, Amazon QuickSight, and Confluent work together to enable visualization of data streams in near-real time. We use the Kafka connector in Athena to do the following:

  • Join data inside Confluent with data stored in one of the many data sources supported by Athena, such as Amazon Simple Storage Service (Amazon S3)
  • Visualize Confluent data using QuickSight

Challenges

Purpose-built stream processing engines, like Confluent ksqlDB, often provide SQL-like semantics for real-time transformations, joins, aggregations, and filters on streaming data. With ksqlDB, you can create persistent queries, which continuously process streams of events according to specific logic, and materialize streaming data in views that can be queried at a point in time (pull queries) or subscribed to by clients (push queries).

ksqlDB is one solution that made stream processing accessible to a wider range of users. However, pull queries, like those supported by ksqlDB, may not be suitable for all stream processing use cases, and there may be complexities or unique requirements that pull queries are not designed for.

Data visualization for Confluent data

A frequent use case for enterprises is data visualization. To visualize data stored in Confluent, you can use one of over 120 pre-built connectors, provided by Confluent, to write streaming data to a destination data store of your choice. Next, you connect your business intelligence (BI) tool to the data store to begin visualizing the data.

The following diagram depicts a typical architecture utilized by many Confluent customers. In this workflow, data is written to Amazon S3 through the Confluent S3 sink connector and then analyzed with Athena, a serverless interactive analytics service that enables you to analyze and query data stored in Amazon S3 and various other data sources using standard SQL. You can then use Athena as an input data source to QuickSight, a highly scalable cloud native BI service, for further analysis.

typical architecture utilized by many Confluent customers.

Although this approach works well for many use cases, it requires data to be moved, and therefore duplicated, before it can be visualized. This duplication not only adds time and effort for data engineers who may need to develop and test new scripts, but also creates data redundancy, making it more challenging to manage and secure the data, and increases storage cost.

Enriching data with reference data in another data store

With ksqlDB queries, the source and destination are always Kafka topics. Therefore, if you have a data stream that you need to enrich with external reference data, you have two options. One option is to import the reference data into Confluent, model it as a table, and use ksqlDB’s stream-table join to enrich the stream. The other option is to ingest the data stream into a separate data store and perform join operations there. Both require data movement and result in duplicate data storage.

Solution overview

So far, we have discussed two challenges that are not addressed by conventional stream processing tools. Is there a solution that addresses both challenges simultaneously?

When you want to analyze data without separate pipelines and jobs, a popular choice is Athena. With Athena, you can run SQL queries on a wide range of data sources—in addition to Amazon S3—without learning a new language, developing scripts to extract (and duplicate) data, or managing infrastructure.

Recently, Athena announced a connector for Kafka. Like Athena’s other connectors, queries on Kafka are processed within Kafka and return results to Athena. The connector supports predicate pushdown, which means that adding filters to your queries can reduce the amount of data scanned, improve query performance, and reduce cost.

For example, when using this connector, the amount of data scanned by the query SELECT * FROM CONFLUENT_TABLE could be significantly higher than the amount of data scanned by the query SELECT * FROM CONFLUENT_TABLE WHERE COUNTRY = 'UK'. The reason is that the AWS Lambda function which provides the runtime environment for the Athena connector, filters data at the source before returning it to Athena.

Let’s assume we have a stream of online transactions flowing into Confluent and customer reference data stored in Amazon S3. We want to use Athena to join both data sources together and produce a new dataset for QuickSight. Instead of using the S3 sink connector to load data into Amazon S3, we use Athena to query Confluent and join it with S3 data—all without moving data. The following diagram illustrates this architecture.

Athena to join both data sources together and produce a new dataset for QuickSight

We perform the following steps:

  1. Register the schema of your Confluent data.
  2. Configure the Athena connector for Kafka.
  3. Optionally, interactively analyze Confluent data.
  4. Create a QuickSight dataset using Athena as the source.

Register the schema

To connect Athena to Confluent, the connector needs the schema of the topic to be registered in the AWS Glue Schema Registry, which Athena uses for query planning.

The following is a sample record in Confluent:

{
  "transaction_id": "23e5ed25-5818-4d4f-acb3-73ef04d51d21",
  "customer_id": "126-58-9758",
  "amount": 986,
  "timestamp": "2023-01-03T15:40:42",
  "product_category": "health_fitness"
}

The following is the schema of this record:

{
  "topicName": "transactions",
  "message": {
    "dataFormat": "json",
    "fields": [
      {
        "name": "transaction_id",
        "mapping": "transaction_id",
        "type": "VARCHAR"
      },
      {
        "name": "customer_id",
        "mapping": "customer_id",
        "type": "VARCHAR"
      },
      {
        "name": "amount",
        "mapping": "amount",
        "type": "INTEGER"
      },
      {
        "name": "timestamp",
        "mapping": "timestamp",
        "type": "timestamp",
        "formatHint": "yyyy-MM-dd\'T\'HH:mm:ss"
      },
      {
        "name": "product_category",
        "mapping": "product_category",
        "type": "VARCHAR"
      },
      {
        "name": "customer_id",
        "mapping": "customer_id",
        "type": "VARCHAR"
      }
    ]
  }
}

The data producer writing the data can register this schema with the AWS Glue Schema Registry. Alternatively, you can use the AWS Management Console or AWS Command Line Interface (AWS CLI) to create a schema manually.

We create the schema manually by running the following CLI command. Replace <registry_name> with your registry name and make sure that the text in the description field includes the required string {AthenaFederationKafka}:

aws glue create-registry –registry-name <registry_name> --description {AthenaFederationKafka}

Next, we run the following command to create a schema inside the newly created schema registry:

aws glue create-schema –registry-id RegistryName=<registry_name> --schema-name <schema_name> --compatibility <Compatibility_Mode> --data-format JSON –schema-definition <Schema>

Before running the command, be sure to provide the following details:

  • Replace <registry_name> with our AWS Glue Schema Registry name
  • Replace <schema_name> with the name of our Confluent Cloud topic, for example, transactions
  • Replace <Compatibility_Mode> with one of the supported compatibility modes, for example, ‘Backward’
  • Replace <Schema> with our schema

Configure and deploy the Athena Connector

With our schema created, we’re ready to deploy the Athena connector. Complete the following steps:

  1. On the Athena console, choose Data sources in the navigation pane.
  2. Choose Create data source.
  3. Search for and select Apache Kafka.
    Add Apache Kafka as data source
  4. For Data source name, enter the name for the data source.
    Enter name for data source

This data source name will be referenced in your queries. For example:

SELECT * 
FROM <data_source_name>.<registry_name>.<schema_name>
WHERE COL1='SOMETHING'

Applying this to our use case and previously defined schema, our query would be as follows:

SELECT * 
FROM "Confluent"."transactions_db"."transactions"
WHERE product_category='Kids'
  1. In the Connection details section, choose Create Lambda function.
    create lambda function

You’re redirected to the Applications page on the Lambda console. Some of the application settings are already filled.

The following are the important settings required for integrating with Confluent Cloud. For more information on these settings, refer to Parameters.

  1. For LambdaFunctionName, enter the name for the Lambda function the connector will use. For example, athena_confluent_connector.

We use this parameter in the next step.

  1. For KafkaEndpoint, enter the Confluent Cloud bootstrap URL.

You can find this on the Cluster settings page in the Confluent Cloud UI.

enter the Confluent Cloud bootstrap URL

Confluent Cloud supports two authentication mechanisms: OAuth and SASL/PLAIN (API keys). The connector doesn’t support OAuth; this leaves us with SASL/PLAIN. SASL/PLAIN uses SSL as a security protocol and PLAIN as SASL mechanism.

  1. For AuthType, enter SASL_SSL_PLAIN.

The API key and secret used by the connector to access Confluent need to be stored in AWS Secrets Manager.

  1. Get your Confluent API key or create a new one.
  2. Run the following AWS CLI command to create the secret in Secrets Manager:
    aws secretsmanager create-secret \
        --name <SecretNamePrefix>\
        --secret-string "{\"username\":\"<Confluent_API_KEY>\",\"password\":\"<Confluent_Secret>\"}"

The secret string should have two key-value pairs, one named username and the other password.

  1. For SecretNamePrefix, enter the secret name prefix created in the previous step.
  2. If the Confluent cloud cluster is reachable over the internet, leave SecurityGroupIds and SubnetIds blank. Otherwise, your Lambda function needs to run in a VPC that has connectivity to your Confluent Cloud network. Therefore, enter a security group ID and three private subnet IDs in this VPC.
  3. For SpillBucket, enter the name of an S3 bucket where the connector can spill data.

Athena connectors temporarily store (spill) data to Amazon S3 for further processing by Athena.

  1. Select I acknowledge that this app creates custom IAM roles and resource policies.
  2. Choose Deploy.
  3. Return to the Connection details section on the Athena console and for Lambda, enter the name of the Lambda function you created.
  4. Choose Next.
    Return to the Connection details section on the Athena console and for Lambda, enter the name of the Lambda function you created. And Choose Next.
  5. Choose Create data source.

Perform interactive analysis on Confluent data

With the Athena connector set up, our streaming data is now queryable from the same service we use to analyze S3 data lakes. Next, we use Athena to conduct point-in-time analysis of transactions flowing through Confluent Cloud.

Aggregation

We can use standard SQL functions to aggregate the data. For example, we can get the revenue by product category:

SELECT product_category, SUM(amount) AS Revenue
FROM "Confluent"."athena_blog"."transactions"
GROUP BY product_category
ORDER BY Revenue desc

SQL function to aggregate data

Enrich transaction data with customer data

The aggregation example is also available with ksqlDB pull queries. However, Athena’s connector allows us to join the data with other data sources like Amazon S3.

In our use case, the transactions streamed to Confluent Cloud lack detailed information about customers, apart from a customer_id. However, we have a reference dataset in Amazon S3 that has more information about the customers. With Athena, we can join both datasets together to gain insights about our customers. See the following code:

SELECT * 
FROM "Confluent"."athena_blog"."transactions" a
INNER JOIN "AwsDataCatalog"."athenablog"."customer" b 
ON a.customer_id=b.customer_id

join data

You can see from the results that we were able to enrich the streaming data with customer details, stored in Amazon S3, including name and address.

Visualize data using QuickSight

Another powerful feature this connector brings is the ability to visualize data stored in Confluent using any BI tool that supports Athena as a data source. In this post, we use QuickSight. QuickSight is a machine learning (ML)-powered BI service built for the cloud. You can use it to deliver easy-to-understand insights to the people you work with, wherever they are.

For more information about signing up for QuickSight, see Signing up for an Amazon QuickSight subscription.

Complete the following steps to visualize your streaming data with QuickSight:

  1. On the QuickSight console, choose Datasets in the navigation pane.
  2. Choose New dataset.
  3. Choose Athena as the data source.
  4. For Data source name, enter a name.
  5. Choose Create data source.
  6. In the Choose your table section, choose Use custom SQL.
    In the Choose your table section, choose Use custom SQL.
  7. Enter the join query like the one given previously, then choose Confirm query.
    Enter the join query like the one given previously, then choose Confirm query.
  8. Next, choose to import the data into SPICE (Super-fast, Parallel, In-memory Calculation Engine), a fully managed in-memory cache that boosts performance, or directly query the data.

Utilizing SPICE will enhance performance, but the data may need to be periodically updated. You can choose to incrementally refresh your dataset or schedule regular refreshes with SPICE. If you want near-real-time data reflected in your dashboards, select Directly query your data. Note that with the direct query option, user actions in QuickSight, such as applying a drill-down filter, may invoke a new Athena query.

  1. Choose Visualize.
    Choose Visualize

That’s it, we have successfully connected QuickSight to Confluent through Athena. With just a few clicks, you can create a few visuals displaying data from Confluent.

successfully connected QuickSight to Confluent through Athena.

Clean up

To avoid incurring ongoing charges, delete the resources you provisioned by completing the following steps:

  1. Delete the AWS Glue schema and registry.
  2. Delete the Athena Kafka connector.
  3. Delete the QuickSight dataset.

Conclusion

In this post, we discussed use cases for Athena and Confluent. We provided examples of how you can use both for near-real-time data visualization with QuickSight and interactive analysis involving joins between streaming data in Confluent and data stored in Amazon S3.

The Athena connector for Kafka simplifies the process of querying and analyzing streaming data from Confluent Cloud. It removes the need to first move streaming data to persistent storage before it can be used in downstream use cases like business intelligence. This complements the existing integration between Confluent and Athena, using the S3 sink connector, which enables loading streaming data into a data lake, and is an additional option for customers who want to enable interactive analysis on Confluent data.


About the authors

Ahmed Zamzam is a Senior Partner Solutions Architect at Confluent, with a focus on the AWS partnership. In his role, he works with customers in the EMEA region across various industries to assist them in building applications that leverage their data using Confluent and AWS. Prior to Confluent, Ahmed was a Specialist Solutions Architect for Analytics AWS specialized in data streaming and search. In his free time, Ahmed enjoys traveling, playing tennis, and cycling.

Geetha Anne is a Partner Solutions Engineer at Confluent with previous experience in implementing solutions for data-driven business problems on the cloud, involving data warehousing and real-time streaming analytics. She fell in love with distributed computing during her undergraduate days and has followed her interest ever since. Geetha provides technical guidance, design advice, and thought leadership to key Confluent customers and partners. She also enjoys teaching complex technical concepts to both tech-savvy and general audiences.

Manage users and group memberships on Amazon QuickSight using SCIM events generated in IAM Identity Center with Azure AD

Post Syndicated from Wakana Vilquin-Sakashita original https://aws.amazon.com/blogs/big-data/manage-users-and-group-memberships-on-amazon-quicksight-using-scim-events-generated-in-iam-identity-center-with-azure-ad/

Amazon QuickSight is cloud-native, scalable business intelligence (BI) service that supports identity federation. AWS Identity and Access Management (IAM) allows organizations to use the identities managed in their enterprise identity provider (IdP) and federate single sign-on (SSO) to QuickSight. As more organizations are building centralized user identity stores with all their applications, including on-premises apps, third-party apps, and applications on AWS, they need a solution to automate user provisioning into these applications and keep their attributes in sync with their centralized user identity store.

When architecting a user repository, some organizations decide to organize their users in groups or use attributes (such as department name), or a combination of both. If your organization uses Microsoft Azure Active Directory (Azure AD) for centralized authentication and utilizes its user attributes to organize the users, you can enable federation across all QuickSight accounts as well as manage users and their group membership in QuickSight using events generated in the AWS platform. This allows system administrators to centrally manage user permissions from Azure AD. Provisioning, updating, and de-provisioning users and groups in QuickSight no longer requires management in two places with this solution. This makes sure that users and groups in QuickSight stay consistent with information in Azure AD through automatic synchronization.

In this post, we walk you through the steps required to configure federated SSO between QuickSight and Azure AD via AWS IAM Identity Center (Successor to AWS Single Sign-On) where automatic provisioning is enabled for Azure AD. We also demonstrate automatic user and group membership update using a System for Cross-domain Identity Management (SCIM) event.

Solution overview

The following diagram illustrates the solution architecture and user flow.

solution architecture and user flow.

In this post, IAM Identity Center provides a central place to bring together administration of users and their access to AWS accounts and cloud applications. Azure AD is the user repository and configured as the external IdP in IAM Identity Center. In this solution, we demonstrate the use of two user attributes (department, jobTitle) specifically in Azure AD. IAM Identity Center supports automatic provisioning (synchronization) of user and group information from Azure AD into IAM Identity Center using the SCIM v2.0 protocol. With this protocol, the attributes from Azure AD are passed along to IAM Identity Center, which inherits the defined attribute for the user’s profile in IAM Identity Center. IAM Identity Center also supports identity federation with SAML (Security Assertion Markup Language) 2.0. This allows IAM Identity Center to authenticate identities using Azure AD. Users can then SSO into applications that support SAML, including QuickSight. The first half of this post focuses on how to configure this end to end (see Sign-In Flow in the diagram).

Next, user information starts to get synchronized between Azure AD and IAM Identity Center via SCIM protocol. You can automate creating a user in QuickSight using an AWS Lambda function triggered by the CreateUser SCIM event originated from IAM Identity Center, which was captured in Amazon EventBridge. In the same Lambda function, you can subsequently update the user’s membership by adding into the specified group (whose name is comprised of two user attributes: department-jobTitle, otherwise create the group if it doesn’t exist yet, prior to adding the membership.

In this post, this automation part is omitted because it would be redundant with the content discussed in the following sections.

This post explores and demonstrates an UpdateUser SCIM event triggered by the user profile update on Azure AD. The event is captured in EventBridge, which invokes a Lambda function to update the group membership in QuickSight (see Update Flow in the diagram). Because a given user is supposed to belong to only one group at a time in this example, the function will replace the user’s current group membership with the new one.

In Part I, you set up SSO to QuickSight from Azure AD via IAM Identity Center (the sign-in flow):

  1. Configure Azure AD as the external IdP in IAM Identity Center.
  2. Add and configure an IAM Identity Center application in Azure AD.
  3. Complete configuration of IAM Identity Center.
  4. Set up SCIM automatic provisioning on both Azure AD and IAM Identity Center, and confirm in IAM Identity Center.
  5. Add and configure a QuickSight application in IAM Identity Center.
  6. Configure a SAML IdP and SAML 2.0 federation IAM role.
  7. Configure attributes in the QuickSight application.
  8. Create a user, group, and group membership manually via the AWS Command Line Interface (AWS CLI) or API.
  9. Verify the configuration by logging in to QuickSight from the IAM Identity Center portal.

In Part II, you set up automation to change group membership upon an SCIM event (the update flow):

  1. Understand SCIM events and event patterns for EventBridge.
  2. Create attribute mapping for the group name.
  3. Create a Lambda function.
  4. Add an EventBridge rule to trigger the event.
  5. Verify the configuration by changing the user attribute value at Azure AD.

Prerequisites

For this walkthrough, you should have the following prerequisites:

  • IAM Identity Center. For instructions, refer to Steps 1–2 in the AWS IAM Identity Center Getting Started guide.
  • A QuickSight account subscription.
  • Basic understanding of IAM and privileges required to create an IAM IdP, roles, and policies.
  • An Azure AD subscription. You need at least one user with the following attributes to be registered in Azure AD:
    • userPrincipalName – Mandatory field for Azure AD user.
    • displayName – Mandatory field for Azure AD user.
    • Mail – Mandatory field for IAM Identity Center to work with QuickSight.
    • jobTitle – Used to allocate user to group
    • department – Used to allocate user to group.
    • givenName – Optional field.
    • surname – Optional field.

Part I: Set up SSO to QuickSight from Azure AD via IAM Identity Center

This section presents the steps to set up the sign-in flow.

Configure an external IdP as Azure AD in IAM Identity Center

To configure your external IdP, complete the following steps:

  1. On the IAM Identity Center console, choose Settings.
  2. Choose Actions on the Identity source tab, then choose Change identity source.
  3. Choose External identity provider, then choose Next.

The IdP metadata is displayed. Keep this browser tab open.

Add and configure an IAM Identity Center application in Azure AD

To set up your IAM Identity Center application, complete the following steps:

  1. Open a new browser tab.
  2. Log in to the Azure AD portal using your Azure administrator credentials.
  3. Under Azure services, choose Azure Active Directory.
  4. In the navigation pane, under Manage, choose Enterprise applications, then choose New application.
  5. In the Browse Azure AD Galley section, search for IAM Identity Center, then choose AWS IAM Identity Center (successor to AWS Single Sign-On).
  6. Enter a name for the application (in this post, we use IIC-QuickSight) and choose Create.
  7. In the Manage section, choose Single sign-on, then choose SAML.
  8. In the Assign users and groups section, choose Assign users and groups.
  9. Choose Add user/group and add at least one user.
  10. Select User as its role.
  11. In the Set up single sign on section, choose Get started.
  12. In the Basic SAML Configuration section, choose Edit, and fill out following parameters and values:
  13. Identifier – The value in the IAM Identity Center issuer URL field.
  14. Reply URL – The value in the IAM Identity Center Assertion Consumer Service (ACS) URL field.
  15. Sign on URL – Leave blank.
  16. Relay State – Leave blank.
  17. Logout URL – Leave blank.
  18. Choose Save.

The configuration should look like the following screenshot.

configuration

  1. In the SAML Certificates section, download the Federation Metadata XML file and the Certificate (Raw) file.
    Federation Metadata XML file and the Certificate (Raw) file

You’re all set with Azure AD SSO configuration at this moment. Later on, you’ll return to this page to configure automated provisioning, so keep this browser tab open.

Complete configuration of IAM Identity Center

Complete your IAM Identity Center configuration with the following steps:

  1. Go back to the browser tab for IAM Identity Center console which you have kept open in previous step.
  2. For IdP SAML metadata under the Identity provider metadata section, choose Choose file.
  3. Choose the previously downloaded metadata file (IIC-QuickSight.xml).
  4. For IdP certificate under the Identity provider metadata section, choose Choose file.
  5. Choose the previously downloaded certificate file (IIC-QuickSight.cer).
  6. Choose Next.
  7. Enter ACCEPT, then choose Change Identity provider source.

Set up SCIM automatic provisioning on both Azure AD and IAM Identity Center

Your provisioning method is still set as Manual (non-SCIM). In this step, we enable automatic provisioning so that IAM Identity Center becomes aware of the users, which allows identity federation to QuickSight.

  1. In the Automatic provisioning section, choose Enable.
    choose Enable
  2. Choose Access token to show your token.
    access token
  3. Go back to the browser tab (Azure AD), which you kept open in Step 1.
  4. In the Manage section, choose Enterprise applications.
  5. Choose IIC-QuickSight, then choose Provisioning.
  6. Choose Automatic in Provisioning Mode and enter the following values:
  7. Tenant URL – The value in the SCIM endpoint field.
  8. Secret Token – The value in the Access token field.
  9. Choose Test Connection.
  10. After the test connection is successfully complete, set Provisioning Status to On.
    set Provisioning Status to On
  11. Choose Save.
  12. Choose Start provisioning to start automatic provisioning using the SCIM protocol.

When provisioning is complete, it will result in propagating one or more users from Azure AD to IAM Identity Center. The following screenshot shows the users that were provisioned in IAM Identity Center.

the users that were provisioned in IAM Identity Center

Note that upon this SCIM provisioning, the users in QuickSight should be created using the Lambda function triggered by the event originated from IAM Identity Center. In this post, we create a user and group membership via the AWS CLI (Step 8).

Add and configure a QuickSight application in IAM Identity Center

In this step, we create a QuickSight application in IAM Identity Center. You also configure an IAM SAML provider, role, and policy for the application to work. Complete the following steps:

  1. On the IAM Identity Center console, on the Applications page, choose Add Application.
  2. For Pre-integrated application under Select an application, enter quicksight.
  3. Select Amazon QuickSight, then choose Next.
  4. Enter a name for Display name, such as Amazon QuickSight.
  5. Choose Download under IAM Identity Center SAML metadata file and save it in your computer.
  6. Leave all other fields as they are, and save the configuration.
  7. Open the application you’ve just created, then choose Assign Users.

The users provisioned via SCIM earlier will be listed.

  1. Choose all of the users to assign to the application.

Configure a SAML IdP and a SAML 2.0 federation IAM role

To set up your IAM SAML IdP for IAM Identity Center and IAM role, complete the following steps:

  1. On the IAM console, in the navigation pane, choose Identity providers, then choose Add provider.
  2. Choose SAML as Provider type, and enter Azure-IIC-QS as Provider name.
  3. Under Metadata document, choose Choose file and upload the metadata file you downloaded earlier.
  4. Choose Add provider to save the configuration.
  5. In the navigation pane, choose Roles, then choose Create role.
  6. For Trusted entity type, select SAML 2.0 federation.
  7. For Choose a SAML 2.0 provider, select the SAML provider that you created, then choose Allow programmatic and AWS Management Console access.
  8. Choose Next.
  9. On the Add Permission page, choose Next.

In this post, we create QuickSight users via an AWS CLI command, therefore we’re not creating any permission policy. However, if the self-provisioning feature in QuickSight is required, the permission policy for the CreateReader, CreateUser, and CreateAdmin actions (depending on the role of the QuickSight users) is required.

  1. On the Name, review, and create page, under Role details, enter qs-reader-azure for the role.
  2. Choose Create role.
  3. Note the ARN of the role.

You use the ARN to configure attributes in your IAM Identity Center application.

Configure attributes in the QuickSight application

To associate the IAM SAML IdP and IAM role to the QuickSight application in IAM Identity Center, complete the following steps:

  1. On the IAM Identity Center console, in the navigation pane, choose Applications.
  2. Select the Amazon QuickSight application, and on the Actions menu, choose Edit attribute mappings.
  3. Choose Add new attribute mapping.
  4. Configure the mappings in the following table.
User attribute in the application Maps to this string value or user attribute in IAM Identity Center
Subject ${user:email}
https://aws.amazon.com/SAML/Attributes/RoleSessionName ${user:email}
https://aws.amazon.com/SAML/Attributes/Role arn:aws:iam::<ACCOUNTID>:role/qs-reader-azure,arn:aws:iam::<ACCOUNTID>:saml-provider/Azure-IIC-QS
https://aws.amazon.com/SAML/Attributes/PrincipalTag:Email ${user:email}

Note the following values:

  • Replace <ACCOUNTID> with your AWS account ID.
  • PrincipalTag:Email is for the email syncing feature for self-provisioning users that need to be enabled on the QuickSight admin page. In this post, don’t enable this feature because we register the user with an AWS CLI command.
  1. Choose Save changes.

Create a user, group, and group membership with the AWS CLI

As described earlier, users and groups in QuickSight are being created manually in this solution. We create them via the following AWS CLI commands.

The first step is to create a user in QuickSight specifying the IAM role created earlier and email address registered in Azure AD. The second step is to create a group with the group name as combined attribute values from Azure AD for the user created in the first step. The third step is to add the user into the group created earlier; member-name indicates the user name created in QuickSight that is comprised of <IAM Role name>/<session name>. See the following code:

aws quicksight register-user \
--aws-account-id <ACCOUNTID> --namespace default \
--identity-type IAM --email <email registered in Azure AD> \
--user-role READER --iam-arn arn:aws:iam::<ACCOUNTID>:role/qs-reader-azure \
--session-name <email registered in Azure AD>

 aws quicksight create-group \
--aws-account-id <ACCOUNTID> --namespace default \
--group-name Marketing-Specialist

 aws quicksight create-group-membership \
--aws-account-id <ACCOUNTID> --namespace default \
--member-name qs-reader-azure/<email registered in Azure AD> \
–-group-name Marketing-Specialist

At this point, the end-to-end configuration of Azure AD, IAM Identity Center, IAM, and QuickSight is complete.

Verify the configuration by logging in to QuickSight from the IAM Identity Center portal

Now you’re ready to log in to QuickSight using the IdP-initiated SSO flow:

  1. Open a new private window in your browser.
  2. Log in to the IAM Identity Center portal (https://d-xxxxxxxxxx.awsapps.com/start).

You’re redirected to the Azure AD login prompt.

  1. Enter your Azure AD credentials.

You’re redirected back to the IAM Identity Center portal.

  1. In the IAM Identity Center portal, choose Amazon QuickSight.

IAM Identity Center portal, choose Amazon QuickSight

You’re automatically redirected to your QuickSight home.
automatically redirected to your QuickSight home

Part II: Automate group membership change upon SCIM events

In this section, we configure the update flow.

Understand the SCIM event and event pattern for EventBridge

When an Azure AD administrator makes any changes to the attributes on the particular user profile, the change will be synced with the user profile in IAM Identity Center via SCIM protocol, and the activity is recorded in an AWS CloudTrail event called UpdateUser by sso-directory.amazonaws.com (IAM Identity Center) as the event source. Similarly, the CreateUser event is recorded when a user is created on Azure AD, and the DisableUser event is for when a user is disabled.

The following screenshot on the  Event history page shows two CreateUser events: one is recorded by IAM Identity Center, and the other one is by QuickSight. In this post, we use the one from IAM Identity Center.

CloudTrail console

In order for EventBridge to be able to handle the flow properly, each event must specify the fields of an event that you want the event pattern to match. The following event pattern is an example of the UpdateUser event generated in IAM Identity Center upon SCIM synchronization:

{
  "source": ["aws.sso-directory"],
  "detail-type": ["AWS API Call via CloudTrail"],
  "detail": {
    "eventSource": ["sso-directory.amazonaws.com"],
    "eventName": ["UpdateUser"]
  }
}

In this post, we demonstrate an automatic update of group membership in QuickSight that is triggered by the UpdateUser SCIM event.

Create attribute mapping for the group name

In order for the Lambda function to manage group membership in QuickSight, it must obtain the two user attributes (department and jobTitle). To make the process simpler, we’re combining two attributes in Azure AD (department, jobTitle) into one attribute in IAM Identity Center (title), using the attribute mappings feature in Azure AD. IAM Identity Center then uses the title attribute as a designated group name for this user.

  1. Log in to the Azure AD console, navigate to Enterprise Applications, IIC-QuickSight, and Provisioning.
  2. Choose Edit attribute mappings.
  3. Under Mappings, choose Provision Azure Active Directory Users.
    Azure AD console, Under mappings
  4. Choose jobTitle from the list of Azure Active Directory Attributes.
  5. Change the following settings:
    1. Mapping TypeExpression
    2. ExpressionJoin("-", [department], [jobTitle])
    3. Target attribute title
      update settings
  6. Choose Save.
  7. You can leave the provisioning page.

The attribute is automatically updated in IAM Identity Center. The updated user profile looks like the following screenshots (Azure AD on the left, IAM Identity Center on the right).

updated user profile
Job related information

Create a Lambda function

Now we create a Lambda function to update QuickSight group membership upon the SCIM event. The core part of the function is to obtain the user’s title attribute value in IAM Identity Center based on the triggered event information, and then to ensure that the user exists in QuickSight. If the group name doesn’t exist yet, it creates the group in QuickSight and then adds the user into the group. Complete the following steps:

  1. On the Lambda console, choose Create function.
  2. For Name, enter UpdateQuickSightUserUponSCIMEvent.
  3. For Runtime, choose Python 3.9.
  4. For Time Out, set to 15 seconds.
  5. For Permissions, create and attach an IAM role that includes the following permissions (the trusted entity (principal) should be lambda.amazonaws.com):
    {
        "Version": "2012-10-17",
        "Statement": [
            {
                "Sid": "MinimalPrivForScimQsBlog",
                "Effect": "Allow",
                "Action": [
                    "identitystore:DescribeUser",
                    "quicksight:RegisterUser",
                    "quicksight:DescribeUser",
                    "quicksight:CreateGroup",
                    "quicksight:DeleteGroup",
                    "quicksight:DescribeGroup",
                    "quicksight:ListUserGroups",
                    "quicksight:CreateGroupMembership",
                    "quicksight:DeleteGroupMembership",
                    "quicksight:DescribeGroupMembership",
                    "logs:CreateLogGroup",
                    "logs:CreateLogStream",
                    "logs:PutLogEvents"
                ],
                "Resource": "*"
            }
        ]
    }

  6. Write Python code using the Boto3 SDK for IdentityStore and QuickSight. The following is the entire sample Python code:
import sys
import boto3
import json
import logging
from time import strftime
from datetime import datetime

# Set logging
logger = logging.getLogger()
logger.setLevel(logging.INFO)

def lambda_handler(event, context):
  '''
  Modify QuickSight group membership upon SCIM event from IAM Identity Center originated from Azure AD.
  It works in this way:
    Azure AD -> SCIM -> Identity Center -> CloudTrail -> EventBridge -> Lambda -> QuickSight
  Note that this is a straightforward sample to show how to update QuickSight group membership upon certain SCIM event.
  For example, it assumes that 1:1 user-to-group assigmnent, only one (combined) SAML attribute, etc. 
  For production, take customer requirements into account and develop your own code.
  '''

  # Setting variables (hard-coded. get dynamically for production code)
  qs_namespace_name = 'default'
  qs_iam_role = 'qs-reader-azure'

  # Obtain account ID and region
  account_id = boto3.client('sts').get_caller_identity()['Account']
  region = boto3.session.Session().region_name

  # Setup clients
  qs = boto3.client('quicksight')
  iic = boto3.client('identitystore')

  # Check boto3 version
  logger.debug(f"## Your boto3 version: {boto3.__version__}")

  # Get user info from event data
  event_json = json.dumps(event)
  logger.debug(f"## Event: {event_json}")
  iic_store_id = event['detail']['requestParameters']['identityStoreId']
  iic_user_id = event['detail']['requestParameters']['userId']  # For UpdateUser event, userId is provided through requestParameters
  logger.info("## Getting user info from Identity Store.")
  try:
    res_iic_describe_user = iic.describe_user(
      IdentityStoreId = iic_store_id,
      UserId = iic_user_id
    )
  except Exception as e:
    logger.error("## Operation failed due to unknown error. Exiting.")
    logger.error(e)
    sys.exit()
  else:
    logger.info(f"## User info retrieval succeeded.")
    azure_user_attribute_title = res_iic_describe_user['Title']
    azure_user_attribute_userprincipalname = res_iic_describe_user['UserName']
    qs_user_name = qs_iam_role + "/" + azure_user_attribute_userprincipalname
    logger.info(f"#### Identity Center user name: {azure_user_attribute_userprincipalname}")
    logger.info(f"#### QuickSight group name desired: {azure_user_attribute_title}")
    logger.debug(f"#### res_iic_describe_user: {json.dumps(res_iic_describe_user)}, which is {type(res_iic_describe_user)}")

  # Exit if user is not present since this function is supposed to be called by UpdateUser event
  try:
    # Get QuickSight user name
    res_qs_describe_user = qs.describe_user(
      UserName = qs_user_name,
      AwsAccountId = account_id,
      Namespace = qs_namespace_name
    )
  except qs.exceptions.ResourceNotFoundException as e:
    logger.error(f"## User {qs_user_name} is not found in QuickSight.")
    logger.error(f"## Make sure the QuickSight user has been created in advance. Exiting.")
    logger.error(e)
    sys.exit()
  except Exception as e:
    logger.error("## Operation failed due to unknown error. Exiting.")
    logger.error(e)
    sys.exit()
  else:
    logger.info(f"## User {qs_user_name} is found in QuickSight.")

  # Remove current membership unless it's the desired one
  qs_new_group = azure_user_attribute_title  # Set "Title" SAML attribute as the desired QuickSight group name
  in_desired_group = False  # Set this flag True when the user is already a member of the desired group
  logger.info(f"## Starting group membership removal.")
  try:
    res_qs_list_user_groups = qs.list_user_groups(
      UserName = qs_user_name,
      AwsAccountId = account_id,
      Namespace = qs_namespace_name
    )
  except Exception as e:
    logger.error("## Operation failed due to unknown error. Exiting.")
    logger.error(e)
    sys.exit()
  else:
    # Skip if the array is empty (user is not member of any groups)
    if not res_qs_list_user_groups['GroupList']:
      logger.info(f"## User {qs_user_name} is not a member of any QuickSight group. Skipping removal.")
    else:
      for grp in res_qs_list_user_groups['GroupList']:
        qs_current_group = grp['GroupName']
        # Retain membership if the new and existing group names match
        if qs_current_group == qs_new_group:
          logger.info(f"## The user {qs_user_name} already belong to the desired group. Skipping removal.")
          in_desired_group = True
        else:
          # Remove all unnecessary memberships
          logger.info(f"## Removing user {qs_user_name} from existing group {qs_current_group}.")
          try:
            res_qs_delete_group_membership = qs.delete_group_membership(
              MemberName = qs_user_name,
              GroupName = qs_current_group,
              AwsAccountId = account_id,
              Namespace = qs_namespace_name
            )
          except Exception as e:
            logger.error(f"## Operation failed due to unknown error. Exiting.")
            logger.error(e)
            sys.exit()
          else:
            logger.info(f"## The user {qs_user_name} has removed from {qs_current_group}.")

  # Create group membership based on IIC attribute "Title"
  logger.info(f"## Starting group membership assignment.")
  if in_desired_group is True:
      logger.info(f"## The user already belongs to the desired one. Skipping assignment.")
  else:
    try:
      logger.info(f"## Checking if the desired group exists.")
      res_qs_describe_group = qs.describe_group(
        GroupName = qs_new_group,
        AwsAccountId = account_id,
        Namespace = qs_namespace_name
      )
    except qs.exceptions.ResourceNotFoundException as e:
      # Create a QuickSight group if not present
      logger.info(f"## Group {qs_new_group} is not present. Creating.")
      today = datetime.now()
      res_qs_create_group = qs.create_group(
        GroupName = qs_new_group,
        Description = 'Automatically created at ' + today.strftime('%Y.%m.%d %H:%M:%S'),
        AwsAccountId = account_id,
        Namespace = qs_namespace_name
      )
    except Exception as e:
      logger.error(f"## Operation failed due to unknown error. Exiting.")
      logger.error(e)
      sys.exit()
    else:
      logger.info(f"## Group {qs_new_group} is found in QuickSight.")

    # Add the user to the desired group
    logger.info("## Modifying group membership based on its latest attributes.")
    logger.info(f"#### QuickSight user name: {qs_user_name}")
    logger.info(f"#### QuickSight group name: {qs_new_group}")
    try: 
      res_qs_create_group_membership = qs.create_group_membership(
        MemberName = qs_user_name,
        GroupName = qs_new_group,
        AwsAccountId = account_id,
        Namespace = qs_namespace_name
    )
    except Exception as e:
      logger.error("## Operation failed due to unknown error. Exiting.")
      logger.error(e)
    else:
      logger.info("## Group membership modification succeeded.")
      qs_group_member_name = res_qs_create_group_membership['GroupMember']['MemberName']
      qs_group_member_arn = res_qs_create_group_membership['GroupMember']['Arn']
      logger.debug("## QuickSight group info:")
      logger.debug(f"#### qs_user_name: {qs_user_name}")
      logger.debug(f"#### qs_group_name: {qs_new_group}")
      logger.debug(f"#### qs_group_member_name: {qs_group_member_name}")
      logger.debug(f"#### qs_group_member_arn: {qs_group_member_arn}")
      logger.debug("## IIC info:")
      logger.debug(f"#### IIC user name: {azure_user_attribute_userprincipalname}")
      logger.debug(f"#### IIC user id: {iic_user_id}")
      logger.debug(f"#### Title: {azure_user_attribute_title}")
      logger.info(f"## User {qs_user_name} has been successfully added to the group {qs_new_group} in {qs_namespace_name} namespace.")
  
  # return response
  return {
    "namespaceName": qs_namespace_name,
    "userName": qs_user_name,
    "groupName": qs_new_group
  }

Note that this Lambda function requires Boto3 1.24.64 or later. If the Boto3 included in the Lambda runtime is older than this, use a Lambda layer to use the latest version of Boto3. For more details, refer to How do I resolve “unknown service”, “parameter validation failed”, and “object has no attribute” errors from a Python (Boto 3) Lambda function.

Add an EventBridge rule to trigger the event

To create an EventBridge rule to invoke the previously created Lambda function, complete the following steps:

  1. On the EventBridge console, create a new rule.
  2. For Name, enter updateQuickSightUponSCIMEvent.
  3. For Event pattern, enter the following code:
    {
      "source": ["aws.sso-directory"],
      "detail-type": ["AWS API Call via CloudTrail"],
      "detail": {
        "eventSource": ["sso-directory.amazonaws.com"],
        "eventName": ["UpdateUser"]
      }
    }

  4. For Targets, choose the Lambda function you created (UpdateQuickSightUserUponSCIMEvent).
  5. Enable the rule.

Verify the configuration by changing a user attribute value at Azure AD

Let’s modify a user’s attribute at Azure AD, and then check if the new group is created and that the user is added into the new one.

  1. Go back to the Azure AD console.
  2. From Manage, click Users.
  3. Choose one of the users you previously used to log in to QuickSight from the IAM Identity Center portal.
  4. Choose Edit properties, then edit the values for Job title and Department.
    Edit Properties
  5. Save the configuration.
  6. From Manage, choose Enterprise application, your application name, and Provisioning.
  7. Choose Stop provisioning and then Start provisioning in sequence.

In Azure AD, the SCIM provisioning interval is fixed to 40 minutes. To get immediate results, we manually stop and start the provisioning.

Provisioning status

  1. Navigate to the QuickSight console.
  2. On the drop-down user name menu, choose Manage QuickSight.
  3. Choose Manage groups.

Now you should find that the new group is created and the user is assigned to this group.

new group is created and the user is assigned to this group

Clean up

When you’re finished with the solution, clean up your environment to minimize cost impact. You may want to delete the following resources:

  • Lambda function
  • Lambda layer
  • IAM role for the Lambda function
  • CloudWatch log group for the Lambda function
  • EventBridge rule
  • QuickSight account
    • Note : There can only be one QuickSight account per AWS account. So your QuickSight account might already be used by other users in your organization. Delete the QuickSight account only if you explicitly set it up to follow this blog and are absolutely sure that it is not being used by any other users.
  • IAM Identity Center instance
  • IAM ID Provider configuration for Azure AD
  • Azure AD instance

Summary

This post provided step-by-step instructions to configure IAM Identity Center SCIM provisioning and SAML 2.0 federation from Azure AD for centralized management of QuickSight users. We also demonstrated automated group membership updates in QuickSight based on user attributes in Azure AD, by using SCIM events generated in IAM Identity Center and setting up automation with EventBridge and Lambda.

With this event-driven approach to provision users and groups in QuickSight, system administrators can have full flexibility in where the various different ways of user management could be expected depending on the organization. It also ensures the consistency of users and groups between QuickSight and Azure AD whenever a user accesses QuickSight.

We are looking forward to hearing any questions or feedback.


About the authors

Takeshi Nakatani is a Principal Bigdata Consultant on Professional Services team in Tokyo. He has 25 years of experience in IT industry, expertised in architecting data infrastructure. On his days off, he can be a rock drummer or a motorcyclyst.

Wakana Vilquin-Sakashita is Specialist Solution Architect for Amazon QuickSight. She works closely with customers to help making sense of the data through visualization. Previously Wakana worked for S&P Global  assisting customers to access data, insights and researches relevant for their business.

Amazon QuickSight helps TalentReef empower its customers to make more informed hiring decisions

Post Syndicated from Alexander Plumb original https://aws.amazon.com/blogs/big-data/amazon-quicksight-helps-talentreef-empower-its-customers-to-make-more-informed-hiring-decisions/

This post is co-written with Alexander Plumb, Product Manager at Mitratech.

TalentReef, now part of Mitratech, is a talent management platform purpose-built for location-based, high-volume hiring. TalentReef was acquired by Mitratech in August 2022 with the goal to combine TalentReef’s best-in-class systems with Mitratech’s expertise, technology, and global platform to ensure their customers’ hiring needs are serviced better and faster than anyone else in the industry.

The TalentReef team are experts in hourly recruiting, onboarding, and hiring, with the mission to help its customers engage with great candidates utilizing an intelligent, easy-to-use single platform. TalentReef differentiates itself from its competitors by not just building features, but creating an entire talent management ecosystem on the idea of eliminating friction and making the hiring and onboarding process as smooth and easy as possible for their customers and applicants.

TalentReef used Amazon QuickSight with the intent of replacing their legacy business intelligence (BI) reporting. The team found QuickSight easy to use and developed two new dashboards that replaced dozens of legacy reports. The response has been overwhelmingly positive, leading to the development of two additional analytics dashboards, Job Postings and Onboarding, both set to be released in the first half of 2023.

The following screenshot shows the Applicant dashboard, which is used internally by TalentReef Customer Solution Managers as well as externally directly by customers embedded within the talent management application. This dashboard provides quick access to their customers’ important metrics. For example, it shows the total number of applicants for all the job postings. It also shows how many applicants are present in the system by position.
full TalentReef dashboard

Providing clarity to customers for hourly workforce hiring

The war for talent is top of mind for those hiring within the hourly workforce. Hiring managers are constantly looking for top talent and trying to understand where they came from, why they are applying, and more. They want to see how their job postings are performing, if there is a drop in any posting, and opportunities to optimize their process. TalentReef’s previous solution wasn’t designed to convey this information, and required manual intervention to extract these hidden insights from multiple reports.

With the new dashboards embedded directly into TalentReef’s customer view, the development team is able to streamline their data ingestion process to ensure up-to-date data is available to their customers within the TalentReef platform. QuickSight features such as forecasts, cross-sheet filtering, and the ability to drill into underlying data allows customers to quickly see the value through different lenses.

Whenever a new feature was rolled out in the previous solution, it wasn’t possible to gauge the impact it had on applicants and new hires because it required a lot of manual work. Development teams had to provide a raw data file to internal users, upon request, to show the value of the new feature, and even then it was limited in how they could show value. With QuickSight, not only are they able to show the value of new features quickly, but they can do so without development intervention.

Data visualization helps business analysts scale client support

The sheer volume of our datasets made gathering insights a slow process. Not only that, but datasets weren’t accessible to a wide audience outside our team, such as partners, program managers, product managers, and so on. As a result, Business Intelligence Engineers (BIEs) spent a lot of time writing ad hoc queries, which then took a long time to run. When the insights were ready, BIEs were tasked with answering questions via manual processes that didn’t scale.

On September 6, 2022, TalentReef launched two new analytics dashboards, Applicant and Hire, which are embedded into their customer application. Since the launch, TalentReef has seen usage increase over 20% and has saved manual internal resources hours of their time putting together insights for their customer base during QBR calls that now can be accessed directly from the dashboards. With TalentReef’s previous tool, reports were unstable and would time out, which required development teams to troubleshoot and repair. Since implementing QuickSight, TalentReef has found efficiencies for both internal resources as well as customer hiring managers, and are confident in the ability to meet the demand of these users.

The following image demonstrates UTM parameters (Urchin Tracking Modules—a tracking device that helps get really specific with the traffic source). This dashboard enables TalentReef’s customer base to understand where their applicants are coming from, so they know where to invest their recruitment dollars (whether the applicants came from indeed.com, or google.com, and so on). This embedded dashboard even allows users to drill further into their data, understanding the name, date, location, and more that the UTM source is tied to.

UTM Parameters

QuickSight has allowed TalentReef to unlock insights that were not previously attainable, or very manual to derive, from their previous reporting tool. An example of this in the following image is the average time to review an application. In the war for talent, minutes can make a difference between finding the individuals needed to fill a position or letting them slip through the cracks. This type of information gives leadership advantage to know where to focus their attention and help win the war for talent in the hourly workforce.

Applicants over time

Unlock the power of applicant and hire data to get insights you never had before!

Our customers have been extremely impressed with our QuickSight dashboards because they provide information that was previously unavailable, without manual effort by development teams. The interactive nature of the QuickSight dashboards allows TalentReef’s customer base to dive deeper into the applicants and hired candidates, for example to understand from where an applicant came from or how an applicant applied to a job posting.

With QuickSight, not only can we visualize applicant and hire data in multiple, meaningful ways for our customer base, but also we can help them see the ROI from additional products they’ve added on to the platform. In the following example, we have a variety of filters that allow clients to see if their sponsorship dollars are returning successful hiring applications, if their add-on of chat apply brings higher application volume, if the applicant came from text to apply, and more.

dashboard controls
Applicant report

Innovating faster with intuitive UI, increasing customer satisfaction

QuickSight enables TalentReef to innovate faster in response to customer feedback. With the intuitive UI and native data lake connections of QuickSight, TalentReef’s product team is able to quickly build visualizations based off the needs and wants of all their customers.

TalentReef’s previous reporting tool required manual efforts from development teams. Enhancements and bug fixes required prioritization against other initiatives and had a higher likelihood of error. With QuickSight, TalentReef was able to set up a data lake that allows dashboards to be built and innovated on by the product team, freeing up development resources to continue on the highest priority. Developers get the data into the data lake, and then the product team pulls in the data into QuickSight and deploys it as needed. This has lead to higher customer satisfaction both internally and externally with the quick turnaround time.

The right people with the right information

In any type of HR space, the right level of data access is key to make sure you aren’t leaving yourself open to compliance issues. Our development team developed a solution that is able to be applied across all QuickSight dashboards using row-level security on the dataset.

TalentReef’s partnership with QuickSight has enabled us to unlock insights that were previously difficult or impossible to attain. We’ve allowed our customer base to know what is happening and why it is happening, and visualize data that is most impactful and important to them.

To learn more about how you can embed customized data visuals, interactive dashboards, and natural language querying into any application, visit Amazon QuickSight Embedded.


About the Authors

Alexander Plumb is a Product Manager at Mitratech. Alexander has been a product leader with over 5 years of experience leading to highly successful product launches that meet customer needs.

Bani Sharma is a Sr Solutions Architect with Amazon Web Services (AWS), based out of Denver, Colorado. As a Solutions Architect, she works with a large number of Small and Medium businesses, and provides technical guidance and solutions on AWS. She has an area of depth in Containers and Modernization. Prior to AWS, Bani worked in various technical roles for a large Telecom provider Dish Networks and worked as a Senior Developer for HSBC Bank Software development.

Brian Klein is a Sr Technical Account Manager with Amazon Web Services (AWS), helping digital native businesses utilize AWS services to bring value to their organizations. Brian has worked with AWS technologies for 9 years, designing and operating production internet-facing workloads, with a focus on security, availability, and resilience while demonstrating operational efficiency.

Enhance your analytics embedding experience with the new Amazon QuickSight JavaScript SDK

Post Syndicated from Raj Jayaraman original https://aws.amazon.com/blogs/big-data/enhance-your-analytics-embedding-experience-with-the-new-amazon-quicksight-javascript-sdk/

Amazon QuickSight is a fully managed, cloud-native business intelligence (BI) service that makes it easy to connect to your data, create interactive dashboards and reports, and share these with tens of thousands of users, either within QuickSight or embedded in your application or website.

QuickSight recently launched a new major version of its Embedding SDK (v2.0) to improve developer experience when embedding QuickSight in your application or website. The QuickSight SDK v2.0 adds several customization improvements such as an optional preloader and new external hooks for managing undo, redo, print options, and parameters. Additionally, there are major rewrites to deliver developer-focused improvements, including static type checking, enhanced runtime validation, strong consistency in call patterns, and optimized event chaining.

The new SDK supports improved code completion when integrated with IDEs through its adoption of TypeScript and the newly introduced frameOptions and contentOptions, which segment embedding options into parameters unified for all embedding experiences and parameters unique for each embedding experience, respectively. Additionally, SDK v2.0 offers increased visibility by providing new experience-specific information and warnings within the SDK. This increases transparency, and developers can monitor and handle new content states.

The QuickSight SDK v2.0 is modernized by using promises for all actions, so developers can use async and await functions for better event management. Actions are further standardized to return a response for both data requesting and non-data requesting actions, so developers have full visibility to the end-to-end application handshake.

In addition to the new SDK, we are also introducing state persistence for user-based dashboard and console embedding. The GenerateEmbedUrlForRegisteredUser API is updated to support this feature and improves end-user experience and interactivity on embedded content.

SDK Feature overview

The QuickSight SDK v2.0 offers new functionalities along with elevating developers’ experience. The following functionalities have been added in this version:

  • Dashboard undo, redo, and reset actions can now be invoked from the application
  • A loading animation can be added to the dashboard container while the contents of the dashboard are loaded
  • Frame creation, mounting, and failure are communicated as change events that can be used by the application
  • Actions getParameter() values and setParameter() values are unified, eliminating additional data transformations

Using the new SDK

The embed URL obtained using the GenerateEmbedUrlForRegisteredUser or GenerateEmbedUrlForAnonymousUser APIs can be consumed in the application using the embedDashboard experience in SDK v2.0. This method takes two parameters:

  • frameOptions – This is a required parameter, and its properties determine the container options to embed a dashboard:
    • url – The embed URL generated using GenerateEmbedUrlForRegisteredUser or GenerateEmbedUrlForAnonymousUser APIs
    • container – The parent HTMLElement to embed the dashboard
  • contentOptions – This is an optional parameter that controls the dashboard locale and captures events from the SDK.

The following sample code uses the preceding parameters to embed a dashboard:

<html>
    <head>
        <!-- ... -->
        <script src=”https://unpkg.com/[email protected]/dist/quicksight-embedding-js-sdk.min.js"></script>
        <!-- ... -->
        <script>
            (async () => {
                const {
                    createEmbeddingContext,
                } = window.QuickSightEmbedding;
                
                const embeddingContext = await createEmbeddingContext();
                
                const frameOptions = {
                    url: '<YOUR_EMBED_URL>',
                    container: '#your-embed-container'
                };
                
                const contentOptions = {
                    toolbarOptions: {
                        reset: true,
                        undoRedo: true,
                    }
                };
                
                embeddedDashboard = await EmbeddingContext.embedDashboard(frameOptions, contentOptions);                
            })();
        </script>
    </head>
    <body>
        <div id="your-embed-container"></div>
    </body>
</html>

Render a loading animation while the dashboard loads

SDK v2.0 allows an option to render a loading animation in the iFrame container while the dashboard loads. This improves user experience by suggesting resource loading is in progress and where it will appear, and eliminates any perceived latency.

You can enable a loading animation by using the withIframePlaceholder option in the frameOption parameter:

const frameOptions = {
           url: '<YOUR_EMBED_URL>',
            container: '#your-embed-container',            
            withIframePlaceholder: true
}

This option is supported by all embedding experiences.

Monitor changes in SDK code status

SDK v2.0 supports a new callback onChange, which returns eventNames along with corresponding eventCodes to indicate errors, warnings, or information from the SDK.

You can use the events returned by the callback to monitor frame creation status and code status returned by the SDK. For example, if the SDK returns an error when an invalid embed URL is used, you can use a placeholder text or image in place of the embedded experience to notify the user.

The following eventNames and eventCodes are returned as part of the onChange callback when there is a change in the SDK code status.

eventName eventCode
ERROR FRAME_NOT_CREATED: Invoked when the creation of the iframe element failed
NO_BODY: Invoked when there is no body element in the hosting HTML
NO_CONTAINER: Invoked when the experience container is not found
NO_URL: Invoked when no URL is provided in the frameOptions
INVALID_URL: Invoked when the URL provided is not a valid URL for the experience
INFO FRAME_STARTED: Invoked just before the iframe is created
FRAME_MOUNTED: Invoked after the iframe is appended into the experience container
FRAME_LOADED: Invoked after the iframe element emitted the load event
WARN UNRECOGNIZED_CONTENT_OPTIONS: Invoked when the content options for the experience contain unrecognized properties
UNRECOGNIZED_EVENT_TARGET: Invoked when a message with an unrecognized event target is received

See the following code:

const frameOptions = {
            url: '<YOUR_EMBED_URL>',
            container: '#your-embed-container',            
            withIframePlaceholder: true
            onChange: (changeEvent, metadata) => {
                switch (changeEvent.eventName) {
                    case 'ERROR': {
                        document.getElementById("your-embed-container").append('Unable to load Dashboard at this time.');
                        break;
                    }
                }
            }
        }

Monitor interactions in embedded dashboards

Another callback supported by SDK v2.0 is onMessage, which returns information about specific events within an embedded experience. The eventName returned depends on the type of embedding experience used and allows application developers to invoke custom code for specific events.

For example, you can monitor if an embedded dashboard is fully loaded or invoke a custom function that logs the parameter values end-users set or change within the dashboard. Your application can now work seamlessly with SDK v2.0 to track and react to interactions within an embedded experience.

The eventNames returned are specific to the embedding experience used. The following eventNames are for the dashboard embedding experience. For additional eventNames, visit the GitHub repo.

  • CONTENT_LOADED
  • ERROR_OCCURRED
  • PARAMETERS_CHANGED
  • SELECTED_SHEET_CHANGED
  • SIZE_CHANGED
  • MODAL_OPENED

See the following code:

const contentOptions = {
                    onMessage: async (messageEvent, experienceMetadata) => {
                        switch (messageEvent.eventName) {
                            case 'PARAMETERS_CHANGED': {
                                ….. // Custom code
                                break;
                            }
…
}

Initiate dashboard print from the application

The new SDK version supports initiating undo, redo, reset, and print from the parent application, without having to add the native embedded QuickSight navbar. This allows developers flexibility to add custom buttons or application logic to control and invoke these options.

For example, you can add a standalone button in your application that allows end-users to print an embedded dashboard, without showing a print icon or navbar within the embedded frame. This can be done using the initiatePrint action:

embeddedDashboard.initiatePrint();

The following code sample shows a loading animation, SDK code status, and dashboard interaction monitoring, along with initiating dashboard print from the application:

<!DOCTYPE html>
<html lang="en">
  <head>
    <script src=" https://unpkg.com/[email protected]/dist/quicksight-embedding-js-sdk.min.js "></script>
    <title>Embedding demo</title>

    <script>
      $(document).ready(function() {

        var embeddedDashboard;

        document.getElementById("print_button").onclick = function printDashboard() {
            embeddedDashboard.initiatePrint();
        }

        function embedDashboard(embedUrl) {
          const {
            createEmbeddingContext
          } = window.QuickSightEmbedding;
          (async () => {
            const embeddingContext = await createEmbeddingContext();
            const messageHandler = (messageEvent) => {
              switch (messageEvent.eventName) {
                case 'CONTENT_LOADED': {
                  document.getElementById("print_button").style.display="block";
                  break;
                }
                case 'ERROR_OCCURRED': {
                  console.log('Error occurred', messageEvent.message);
                  break;
                }
                case 'PARAMETERS_CHANGED': {
                  // Custom code..
                  break;
                }
              }
            }
            const frameOptions = {
      url: '<YOUR_EMBED_URL>',
              container: document.getElementById("dashboardContainer"),
              width: "100%",
              height: "AutoFit",
              loadingHeight: "200px",
              withIframePlaceholder: true,
              onChange: (changeEvent, metadata) => {
                switch (changeEvent.eventName) {
                  case 'ERROR': {
                    document.getElementById("dashboardContainer").append('Unable to load Dashboard at this time.');
                    break;
                  }
                }
              }
            }
            const contentOptions = {
              locale: "en-US",
              onMessage: messageHandler
            }
            embeddedDashboard = await embeddingContext.embedDashboard(frameOptions, contentOptions);
          })();
        }
      });
    </Script>
  </head>
  <body>
    <div>
       <button type="button" id="print_button" style="display:none;">Print</button> 
    </div>
    <div id="dashboardContainer"></div>
  </body>
</html>

State persistence

In addition to the new SDK, QuickSight now supports state persistence for dashboard and console embedding. State Persistance means when readers slice and dice embedded dashboards with filters, QuickSight will persist filter selection until they return to the dashboard. Readers can pick up where they left off and don’t have to re-select filters.

State persistence is currently supported only for the user-based (not anonymous) dashboard and console embedding experience.

You can enable state persistence using the FeatureConfigurations parameter in the GenerateEmbedUrlForRegisteredUser API. FeatureConfigurations contains StatePersistence structure that can be customized by setting Enabled as true or false.

The API structure is below:

generate-embed-url-for-registered-user
	aws-account-id <value>
	[session-lifetime-in-minutes <value>]
	user-arn <value>
	[cli-input-json | cli-input-yaml]
	[allowed-domains <value>]
	[generate-cli-skeleton <value>]
	experience-configuration <value>
		Dashboard
			InitialDashboardId <value>
			[FeatureConfigurations]
				[StatePersistence]
					Enabled <value>
		QuickSightConsole
			InitialPath <value>
			[FeatureConfigurations]
				[StatePersistence]
					Enabled <value>

The following code disables state persistence for QuickSight console embedding:

aws quicksight generate-embed-url-for-registered-user \
--aws-account-id <AWS_Account_ID> \
--user-arn arn:aws:quicksight:us-east-1:<AWS_Account_ID>:user/<Namespace>/<QuickSight_User_Name>
--experience-configuration '{"QuickSightConsole": {
"InitialPath": "/start/analyses",
"FeatureConfigurations": {"StatePersistence": {"Enabled": false}}}}' \
--region <Region>

The following code enables state persistence for QuickSight dashboard embedding:

aws quicksight generate-embed-url-for-registered-user \
--aws-account-id <AWS_Account_ID> \
--user-arn arn:aws:quicksight:us-east-1:<AWS_Account_ID>:user/<Namespace>/<QuickSight_User_Name>
--experience-configuration '{"Dashboard": {
"InitialDashboardId": “<Dashboard_ID>",
"FeatureConfigurations": {"StatePersistence": {"Enabled": true}}}}' \
--region <Region>

Considerations

Note the following when using these features:

  • For dashboard embedding, state persistence is disabled by default. To enable this feature, set Enabled parameter in StatePersistence to true.
  • For console embedding, state persistence is enabled by default. To disable this feature, set Enabled parameter in StatePersistence to false.

Conclusion

With the latest iteration of the QuickSight Embedding SDK, you can indicate when an embedded experience is loading, monitor and respond to errors from the SDK, observe changes and interactivity, along with invoking undo, redo, reset, and print actions from application code.

Additionally, you can enable state persistence to persist filter selection for readers and allow them to pick up where they left off when revisiting an embedded dashboard.

For more detailed information about the SDK and experience-specific options, visit the GitHub repo.


About the authors

Raj Jayaraman is a Senior Specialist Solutions Architect for Amazon QuickSight. Raj focuses on helping customers develop sample dashboards, embed analytics and adopt BI design patterns and best practices.

Mayank Agarwal is a product manager for Amazon QuickSight, AWS’ cloud-native, fully managed BI service. He focuses on account administration, governance and developer experience. He started his career as an embedded software engineer developing handheld devices. Prior to QuickSight he was leading engineering teams at Credence ID, developing custom mobile embedded device and web solutions using AWS services that make biometric enrollment and identification fast, intuitive, and cost-effective for Government sector, healthcare and transaction security applications.

Rohit Pujari is the Head of Product for Embedded Analytics at QuickSight. He is passionate about shaping the future of infusing data-rich experiences into products and applications we use every day. Rohit brings a wealth of experience in analytics and machine learning from having worked with leading data companies, and their customers. During his free time, you can find him lining up at the local ice cream shop for his second scoop.

Configure ADFS Identity Federation with Amazon QuickSight

Post Syndicated from Adeleke Coker original https://aws.amazon.com/blogs/big-data/configure-adfs-identity-federation-with-amazon-quicksight/

Amazon QuickSight Enterprise edition can integrate with your existing Microsoft Active Directory (AD), providing federated access using Security Assertion Markup Language (SAML) to dashboards. Using existing identities from Active Directory eliminates the need to create and manage separate user identities in AWS Identity Access Management (IAM). Federated users assume an IAM role when access is requested through an identity provider (IdP) such as Active Directory Federation Service (AD FS) based on AD group membership. Although, you can connect AD to QuickSight using AWS Directory Service, this blog focuses on federated logon to QuickSight Dashboards.

With identity federation, your users get one-click access to Amazon QuickSight applications using their existing identity credentials. You also have the security benefit of identity authentication by your IdP. You can control which users have access to QuickSight using your existing IdP. Refer to Using identity federation and single sign-on (SSO) with Amazon QuickSight for more information.

In this post, we demonstrate how you can use a corporate email address as an authentication option for signing in to QuickSight. This post assumes you have an existing Microsoft Active Directory Federation Services (ADFS) configured in your environment.

Solution overview

While connecting to QuickSight from an IdP, your users initiate the sign-in process from the IdP portal. After the users are authenticated, they are automatically signed in to QuickSight. After QuickSight checks that they are authorized, your users can access QuickSight.

The following diagram shows an authentication flow between QuickSight and a third-party IdP. In this example, the administrator has set up a sign-in page to access QuickSight. When a user signs in, the sign-in page posts a request to a federation service that complies with SAML 2.0. The end-user initiates authentication from the sign-in page of the IdP. For more information about the authentication flow, see Initiating sign-on from the identity provider (IdP).

QuickSight IdP flow

The solution consists of the following high-level steps:

  1. Create an identity provider.
  2. Create IAM policies.
  3. Create IAM roles.
  4. Configure AD groups and users.
  5. Create a relying party trust.
  6. Configure claim rules.
  7. Configure QuickSight single sign-on (SSO).
  8. Configure the relay state URL for QuickStart.

Prerequisites

The following are the prerequisites to build the solution explained in this post:

  • An existing or newly deployed AD FS environment.
  • An AD user with permissions to manage AD FS and AD group membership.
  • An IAM user with permissions to create IAM policies and roles, and administer QuickSight.
  • The metadata document from your IdP. To download it, refer to Federation Metadata Explorer.

Create an identity provider

To add your IdP, complete the following steps:

  1. On the IAM console, choose Identity providers in the navigation pane.
  2. Choose Add provider.
  3. For Provider type¸ select SAML.
  4. For Provider name, enter a name (for example, QuickSight_Federation).
  5. For Metadata document, upload the metadata document you downloaded as a prerequisite.
  6. Choose Add provider.
  7. Copy the ARN of this provider to use in a later step.

Add IdP in IAM

Create IAM policies

In this step, you create IAM policies that allow users to access QuickSight only after federating their identities. To provide access to QuickSight and also the ability to create QuickSight admins, authors (standard users), and readers, use the following policy examples.

The following code is the author policy:

{
    "Statement": [
        {
            "Action": [
                "quicksight:CreateUser"
            ],
            "Effect": "Allow",
            "Resource": [
                "*"
            ]
        }
    ],
    "Version": "2012-10-17"
}

The following code is the reader policy:

{ 
"Version": "2012-10-17", 
"Statement": [ 
{ 
"Effect": "Allow",
"Action": "quicksight:CreateReader", 
"Resource": "*" 
} 
] 
}

The following code is the admin policy:

{
    "Statement": [
        {
            "Action": [
                "quicksight:CreateAdmin"
            ],
            "Effect": "Allow",
            "Resource": [
                "*"
            ]
        }
    ],
    "Version": "2012-10-17"
}

Create IAM roles

You can configure email addresses for your users to use when provisioning through your IdP to QuickSight. To do this, add the sts:TagSession action to the trust relationship for the IAM role that you use with AssumeRoleWithSAML. Make sure the IAM role names start with ADFS-.

  1. On the IAM console, choose Roles in the navigation pane.
  2. Choose Create new role.
  3. For Trusted entity type, select SAML 2.0 federation.
  4. Choose the SAML IdP you created earlier.
  5. Select Allow programmatic and AWS Management Console access.
  6. Choose Next.
    Create IAM Roles
  7. Choose the admin policy you created, then choose Next.
  8. For Name, enter ADFS-ACCOUNTID-QSAdmin.
  9. Choose Create.
  10. On the Trust relationships tab, edit the trust relationships as follows so you can pass principal tags when users assume the role (provide your account ID and IdP):
{
    "Version": "2012-10-17",
    "Statement": [
        {
            "Effect": "Allow",
            "Principal": {
                "Federated": "arn:aws:iam::ACCOUNTID:saml-provider/Identity_Provider"
            },
            "Action":[ "sts:AssumeRoleWithSAML",
	 "sts:TagSession"],
            "Condition": {
                "StringEquals": {
                    "SAML:aud": "https://signin.aws.amazon.com/saml"
                },
                "StringLike": {
                    "aws:RequestTag/Email": "*"
                }
            }
            }
    ]
}
  1. Repeat this process for the role ADFS-ACCOUNTID-QSAuthor and attach the author IAM policy.
  2. Repeat this process for the role ADFS-ACCOUNTID-QSReader and attach the reader IAM policy.

Configure AD groups and users

Now you need to create AD groups that determine the permissions to sign in to AWS. Create an AD security group for each of the three roles you created earlier. Note that the group name should follow same format as your IAM role names.

One approach for creating the AD groups that uniquely identify the IAM role mapping is by selecting a common group naming convention. For example, your AD groups would start with an identifier, for example AWS-, which will distinguish your AWS groups from others within the organization. Next, include the 12-digit AWS account number. Finally, add the matching role name within the AWS account. You should do this for each role and corresponding AWS account you wish to support with federated access. The following screenshot shows an example of the naming convention we use in this post.

AD Groups

Later in this post, we create a rule to pick up AD groups starting with AWS-, the rule will remove AWS-ACCOUNTID- from AD groups name to match the respective IAM role, which is why we use this naming convention here.

Users in Active Directory can subsequently be added to the groups, providing the ability to assume access to the corresponding roles in AWS. You can add AD users to the respective groups based on your business permissions model. Note that each user must have an email address configured in Active Directory.

Create a relying party trust

To add a relying party trust, complete the following steps:

  1. Open the AD FS Management Console.
  2. Choose (right-click) Relying Party Trusts, then choose Add Relying Party Trust.
    Add Relying Party Trust
  3. Choose Claims aware, then choose Start.
  4. Select Import data about the relying party published online or on a local network.
  5. For Federation metadata address, enter https://signin.aws.amazon.com/static/saml-metadata.xml.
  6. Choose Next.
    ADFS Wizard Data Source
  7. Enter a descriptive display name, for example Amazon QuickSight Federation, then choose Next.
  8. Choose your access control policy (for this post, Permit everyone), then choose Next.
    ADFS Access Control
  9. In the Ready to Add Trust section, choose Next.
    ADFS Ready to Add
  10. Leave the defaults, then choose Close.

Configure claim rules

In this section, you create claim rules that identify accounts, set LDAP attributes, get the AD groups, and match them to the roles created earlier. Complete the following steps to create the claim rules for NameId, RoleSessionName, Get AD Groups, Roles, and (optionally) Session Duration:

  1. Select the relying party trust you just created, then choose Edit Claim Issuance Policy.
  2. Add a rule called NameId with the following parameters:
    1. For Claim rule template, choose Transform an Incoming Claim.
    2. For Claim rule name, enter NameId
    3. For Incoming claim type, choose Windows account name.
    4. For Outgoing claim type, choose Name ID.
    5. For Outgoing name ID format, choose Persistent Identifier.
    6. Select Pass through all claim values.
    7. Choose Finish.
      NameId
  3. Add a rule called RoleSessionName with the following parameters:
    1. For Claim rule template, choose Send LDAP Attributes as Claims.
    2. For Claim rule name, enter RoleSessionName.
    3. For Attribute store, choose Active Directory.
    4. For LDAP Attribute, choose E-Mail-Addresses.
    5. For Outgoing claim type, enter https://aws.amazon.com/SAML/Attributes/RoleSessionName.
    6. Add another E-Mail-Addresses LDAP attribute and for Outgoing claim type, enter https://aws.amazon.com/SAML/Attributes/PrincipalTag:Email.
    7. Choose OK.
      RoleSessionName
  4. Add a rule called Get AD Groups with the following parameters:
    1. For Claim rule template, choose Send Claims Using a Custom Rule.
    2. For Claim rule name, enter Get AD Groups
    3. For Custom Rule, enter the following code:
      c:[Type == "http://schemas.microsoft.com/ws/2008/06/identity/claims/windowsaccountname", Issuer == "AD AUTHORITY"] => add(store = "Active Directory", types = ("http://temp/variable"), query = ";tokenGroups;{0}", param = c.Value);

    4. Choose OK.
      Get AD Groups
  1. Add a rule called Roles with the following parameters:
    1. For Claim rule template, choose Send Claims Using a Custom Rule.
    2. For Claim rule name, enter Roles
    3. For Custom Rule, enter the following code (provide your account ID and IdP):
      c:[Type == "http://temp/variable", Value =~ "(?i)^AWS-ACCOUNTID"]=&gt; issue(Type = "https://aws.amazon.com/SAML/Attributes/Role", Value = RegExReplace(c.Value, "AWS-ACCOUNTID-", "arn:aws:iam:: ACCOUNTID:saml-provider/your-identity-provider-name,arn:aws:iam:: ACCOUNTID:role/ADFS-ACCOUNTID-"));

    4. Choose Finish.Roles

Optionally, you can create a rule called Session Duration. This configuration determines how long a session is open and active before users are required to reauthenticate. The value is in seconds. For this post, we configure the rule for 8 hours.

  1. Add a rule called Session Duration with the following parameters:
    1. For Claim rule template, choose Send Claims Using a Custom Rule.
    2. For Claim rule name, enter Session Duration.
    3. For Custom Rule, enter the following code:
      => issue(Type = "https://aws.amazon.com/SAML/Attributes/SessionDuration", Value = "28800");

    4. Choose Finish.Session Duration

You should be able to see these five claim rules, as shown in the following screenshot.
All Claims Rules

  1. Choose OK.
  2. Run the following commands in PowerShell on your AD FS server:
Set-AdfsProperties -EnableIdPInitiatedSignonPage $true

Set-AdfsProperties -EnableRelayStateForIdpInitiatedSignOn $true
  1. Stop and start the AD FS service from PowerShell:
net stop adfssrv

net start adfssrv

Configure E-mail Syncing

With QuickSight Enterprise edition integrated with an IdP, you can restrict new users from using personal email addresses. This means users can only log in to QuickSight with their on-premises configured email addresses. This approach allows users to bypass manually entering an email address. It also ensures that users can’t use an email address that might differ from the email address configured in Active Directory.

QuickSight uses the preconfigured email addresses passed through the IdP when provisioning new users to your account. For example, you can make it so that only corporate-assigned email addresses are used when users are provisioned to your QuickSight account through your IdP. When you configure email syncing for federated users in QuickSight, users who log in to your QuickSight account for the first time have preassigned email addresses. These are used to register their accounts.

To configure E-mail syncing for federated users in QuickSight, complete the following steps:

  1. Log in to your QuickSight dashboard with a QuickSight administrator account.
  2. Choose the profile icon.
    QuickSight SSO
  3. On the drop-down menu, choose on Manage QuickSight.
  4. In the navigation pane, choose Single sign-on (SSO).
  5. For Email Syncing for Federated Users, select ON, then choose Enable in the pop-up window.
  6. Choose Save.SSO Configuration

Configure the relay state URL for QuickStart

To configure the relay state URL, complete the following steps (revise the input information as needed to match your environment’s configuration):

  1. Use the ADFS RelayState Generator to generate your URL.
  2. For IDP URL String, enter https://ADFSServerEndpoint/adfs/ls/idpinitiatedsignon.aspx.
  3. For Relying Party Identifier, enter urn:amazon:webservices or https://signin.aws.amazon.com/saml.
  4. For Relay State/Target App, enter your authenticated users to access. In this case, it’s https://quicksight.aws.amazon.com.
  5. Choose Generate URL.RelayState Generator
  6. Copy the URL and load it in your browser.

You should be presented with a login to your IdP landing page.

ADFS Logon Page

Make sure the user logging in has an email address attribute configured in Active Directory. A successful login should redirect you to the QuickSight dashboard after authentication. If you’re not redirected to the QuickSight dashboard page, make sure you ran the commands listed earlier after you configured your claim rules.

Summary

In this post, we demonstrated how to configure federated identities to a QuickSight dashboard and ensure that users can only sign in with preconfigured email address in your existing Active Directory.

We’d love to hear from you. Let us know what you think in the comments section.


About the Author

Adeleke Coker is a Global Solutions Architect with AWS. He helps customers globally accelerate workload deployments and migrations at scale to AWS. In his spare time, he enjoys learning, reading, gaming and watching sport events.

How Ruparupa gained updated insights with an Amazon S3 data lake, AWS Glue, Apache Hudi, and Amazon QuickSight

Post Syndicated from Adrianus Kurnadi original https://aws.amazon.com/blogs/big-data/how-ruparupa-gained-updated-insights-with-an-amazon-s3-data-lake-aws-glue-apache-hudi-and-amazon-quicksight/

This post is co-written with Olivia Michele and Dariswan Janweri P. at Ruparupa.

Ruparupa was built by PT. Omni Digitama Internusa with the vision to cultivate synergy and create a seamless digital ecosystem within Kawan Lama Group that touches and enhances the lives of many.

Ruparupa is the first digital platform built by Kawan Lama Group to give the best shopping experience for household, furniture, and lifestyle needs. Ruparupa’s goal is to help you live a better life, shown by the meaning of the word ruparupa, which means “everything.” We believe that everyone deserves the best, and home is where everything starts.

In this post, we show how Ruparupa implemented an incrementally updated data lake to get insights into their business using Amazon Simple Storage Service (Amazon S3), AWS Glue, Apache Hudi, and Amazon QuickSight. We also discuss the benefits Ruparupa gained after the implementation.

The data lake implemented by Ruparupa uses Amazon S3 as the storage platform, AWS Database Migration Service (AWS DMS) as the ingestion tool, AWS Glue as the ETL (extract, transform, and load) tool, and QuickSight for analytic dashboards.

Amazon S3 is an object storage service with very high scalability, durability, and security, which makes it an ideal storage layer for a data lake. AWS DMS is a database migration tool that supports many relational database management services, and also supports Amazon S3.

An AWS Glue ETL job, using the Apache Hudi connector, updates the S3 data lake hourly with incremental data. The AWS Glue job can transform the raw data in Amazon S3 to Parquet format, which is optimized for analytic queries. The AWS Glue Data Catalog stores the metadata, and Amazon Athena (a serverless query engine) is used to query data in Amazon S3.

AWS Secrets Manager is an AWS service that can be used to store sensitive data, enabling users to keep data such as database credentials out of source code. In this implementation, Secrets Manager is used to store the configuration of the Apache Hudi job for various tables.

Data analytic challenges

As an ecommerce company, Ruparupa produces a lot of data from their ecommerce website, their inventory systems, and distribution and finance applications. The data can be structured data from existing systems, and can also be unstructured or semi-structured data from their customer interactions. This data contains insights that, if unlocked, can help management make decisions to help increase sales and optimize cost.

Before implementing a data lake on AWS, Ruparupa had no infrastructure capable of processing the volume and variety of data formats in a short time. Data had to be manually processed by data analysts, and data mining took a long time. Because of the fast growth of data, it took 1–1.5 hours just to ingest data, which was hundreds of thousands of rows.

The manual process caused inconsistent data cleansing. After the data had been cleansed, some processes were often missing, and all the data had to go through another process of data cleansing.

This long processing time reduced the analytic team’s productivity. The analytic team could only produce weekly and monthly reports. This delay in report frequency impacted delivering important insights to management, and they couldn’t move fast enough to anticipate changes in their business.

The method used to create analytic dashboards was manual and could only produce a few routine reports. The audience of these few reports was limited—a maximum of 20 people from management. Other business units in Kawan Lama Group only consumed weekly reports that were prepared manually. Even the weekly reports couldn’t cover all important metrics, because some metrics were only available in monthly reports.

Initial solution for a real-time dashboard

The following diagram illustrates the initial solution Ruparupa implemented.

Initial solution architecture

Ruparupa started a data initiative within the organization to create a single source of truth within the company. Previously, business users could only get the sales data from the day before, and they didn’t have any visibility to current sales activities in their stores and websites.

To gain trust from business users, we wanted to provide the most updated data in an interactive QuickSight dashboard. We used an AWS DMS replication task to stream real-time change data capture (CDC) updates to an Amazon Aurora MySQL-Compatible Edition database, and built a QuickSight dashboard to replace the static presentation deck.

This pilot dashboard was accepted extremely well by the users, who now had visibility to their current data. However, the data source for the dashboard still resided in an Aurora MySQL database and only covered a single data domain.

The initial design had some additional challenges:

  • Diverse data source – The data source in an ecommerce platform consists of structured, semi-structured, and unstructured data, which requires flexible data storage. The initial data warehouse design in Ruparupa only stored transactional data, and data from other systems including user interaction data wasn’t consolidated yet.
  • Cost and scalability – Ruparupa wanted to build a future-proof data platform solution that could scale up to terabytes of data in the most cost-effective way.

The initial design also had some benefits:

  • Data updates – Data inside the initial data warehouse was delayed by 1 day. This was an improvement over the weekly report, but still not fast enough to make quicker decisions.

This solution only served as a temporary solution; we needed a more complete analytics solution that could serve more complex and larger data sources, faster, and cost-effectively.

Real-time data lake solution

To fulfill their requirements, Ruparupa introduced a mutable data lake, as shown in the following diagram.

Real time data lake solutions architecture

Let’s look at each main component in more detail.

AWS DMS CDC process

To get the real-time data from the source, we streamed the database CDC log using AWS DMS (component 1 in the architecture diagram). The CDC records consist of all inserts, updates, and deletes from the source database. This raw data is stored in the raw layer of the S3 data lake.

An S3 lifecycle policy is used to manage data retention, where the older data is moved to Amazon S3 Glacier.

AWS Glue ETL job

The second S3 data lake layer is the transformed layer, where the data is transformed to an optimized format that is ready for user query. The files are transformed to Parquet columnar format with snappy compression and table partitioning to optimize SQL queries from Athena.

In order to create a mutable data lake that can merge changes from the data source, we introduced an Apache Hudi data lake framework. With Apache Hudi, we can perform upserts and deletes on the transformed layer to keep the data consistent in a reliable manner. With a Hudi data lake, Ruparupa can create a single source of truth for all our data sources quickly and easily. The Hudi framework takes care of the underlying metadata of the updates, making it simple to implement across hundreds of tables in the data lake. We only need to configure the writer output to create a copy-on-write table depending on the access requirements. For the writer, we use an AWS Glue job writer combined with an AWS Glue Hudi connector frrom AWS Marketplace. The additional library from the connector helps AWS Glue understand how to write to Hudi.

An AWS Glue ETL job is used to get the changes from the raw layer and merge the changes in the transformed layer (component 2 in the architecture diagram). With AWS Glue, we are able to create a PySpark job to get the data, and we use the AWS Glue Connector for Apache Hudi to simplify the Hudi library import to the AWS Glue job. With AWS Glue, all the changes from AWS DMS can be merged easily to the Hudi data lake. The jobs are scheduled every hour using a built-in scheduler in AWS Glue.

Secrets Manager is used to store all the related parameters that are required to run the job. Instead of making one transformation job for each table, Ruparupa creates a single generic job that can transform multiple tables by using several parameters. The parameters that give details about the table structure are stored in Secrets Manager and can be retrieved using the name of the table as key. With these custom parameters, Ruparupa doesn’t need to create a job for every table—we can utilize a single job that can ingest the data for all different tables by passing the name of the table to the job.

All the metadata of the tables is stored in the AWS Glue Data Catalog, including the Hudi tables. This catalog is used by the AWS Glue ETL job, Athena query engine, and QuickSight dashboard.

Athena queries

Users can then query the latest data for their report using Athena (component 3 in the architecture diagram). Athena is serverless, so there is no infrastructure to provision or maintain. We can immediately use SQL to query the data lake to create a report or ingest the data to the dashboard.

QuickSight dashboard

Business users can use a QuickSight dashboard to query the data lake (component 4 in the architecture diagram). The existing dashboard is modified to get data from Athena, replacing the previous database. New dashboards were also created to fulfill continuously evolving needs for insights from multiple business units.

QuickSight is also used to notify certain parties when a value is reaching a certain threshold. An email alert is sent to an external notification and messaging platform so it can reach the end-user.

Business results

The data lake implementation in Ruparupa took around 3 months, with an additional month for data validation, before it was considered ready for production. With this solution, management can get the latest information view of their current state up to the last 1 hour. Previously, they could only generate weekly reports—now insights are available 168 times faster.

The QuickSight dashboard, which can be updated automatically, shortens the time required by the analytic team. The QuickSight dashboard now has more content—not only is transactional data reported, but also other metrics like new SKU, operation escalation for free services to customers, and monitoring SLA. Since April 2021 when Ruparupa started their QuickSight pilot, the number of dashboards has increased to around 70 based on requests from business users.

Ruparupa has hired new personnel to join the data analytic team to explore new possibilities and new use cases. The analytic team has grown from just one person to seven to handle new analytic use cases:

  • Merchandising
  • Operations
  • Store manager performance measurement
  • Insights of trending SKUs

Kawan Lama Group also has offline stores besides the ecommerce platform managed by Ruparupa. With the new dashboard, it’s easier to compare transaction data from online and offline stores because they now use the same platform.

The new dashboards also can be consumed by a broader audience, including other business units in Kawan Lama Group. The total users consuming the dashboard increased from just 20 users from management to around 180 users (9 times increase).

Since the implementation, other business units in Kawan Lama Group have increased their trust in the S3 data lake platform implemented by Ruparupa, because the data is more up to date and they can drill down to the SKU level to validate that the data is correct. Other business units can now act faster after an event like a marketing campaign. This data lake implementation has helped increase sales revenue in various business units in Kawan Lama Group.

Conclusion

Implementing a real-time data lake using Amazon S3, Apache Hudi, AWS Glue, Athena, and QuickSight gave Ruparupa the following benefits:

  • Yielded faster insights (hourly compared to weekly)
  • Unlocked new insights
  • Enabled more people in more business units to consume the dashboard
  • Helped business units in Kawan Lama Group act faster and increase sales revenue

If you’re interested in gaining similar benefits, check out Build a Data Lake Foundation with AWS Glue and Amazon S3.

You can also learn how to get started with QuickSight in the Getting Started guide.

Last but not least, you can learn about running Apache Hudi on AWS Glue in Writing to Apache Hudi tables using AWS Glue Custom Connector.


About the Authors

Olivia Michele is a Data Scientist Lead at Ruparupa, where she has worked in a variety of data roles over the past 5 years, including building and integrating Ruparupa data systems with AWS to improve user experience with data and reporting tools. She is passionate about turning raw information into valuable actionable insights and delivering value to the company.

Dariswan Janweri P. is a Data Engineer at Ruparupa. He considers challenges or problems as interesting riddles and finds satisfaction in solving them, and even more satisfaction by being able to help his colleagues and friends, “two birds one stone.” He is excited to be a major player in Indonesia’s technology transformation.

Adrianus Budiardjo Kurnadi is a Senior Solutions Architect at Amazon Web Services Indonesia. He has a strong passion for databases and machine learning, and works closely with the Indonesian machine learning community to introduce them to various AWS Machine Learning services. In his spare time, he enjoys singing in a choir, reading, and playing with his two children.

Nico Anandito is an Analytics Specialist Solutions Architect at Amazon Web Services Indonesia. He has years of experience working in data integration, data warehouses, and big data implementation in multiple industries. He is certified in AWS data analytics and holds a master’s degree in the data management field of computer science.

Automate deployment of an Amazon QuickSight analysis connecting to an Amazon Redshift data warehouse with an AWS CloudFormation template

Post Syndicated from Sandeep Bajwa original https://aws.amazon.com/blogs/big-data/automate-deployment-of-an-amazon-quicksight-analysis-connecting-to-an-amazon-redshift-data-warehouse-with-an-aws-cloudformation-template/

Amazon Redshift is the most widely used data warehouse in the cloud, best suited for analyzing exabytes of data and running complex analytical queries. Amazon QuickSight is a fast business analytics service to build visualizations, perform ad hoc analysis, and quickly get business insights from your data. QuickSight provides easy integration with Amazon Redshift, providing native access to all your data and enabling organizations to scale their business analytics capabilities to hundreds of thousands of users. QuickSight delivers fast and responsive query performance by using a robust in-memory engine (SPICE).

As a QuickSight administrator, you can use AWS CloudFormation templates to migrate assets between distinct environments from development, to test, to production. AWS CloudFormation helps you model and set up your AWS resources so you can spend less time managing those resources and more time focusing on your applications that run in AWS. You no longer need to create data sources or analyses manually. You create a template that describes all the AWS resources that you want, and AWS CloudFormation takes care of provisioning and configuring those resources for you. In addition, with versioning, you have your previous assets, which provides the flexibility to roll back deployments if the need arises. For more details, refer to Amazon QuickSight resource type reference.

In this post, we show how to automate the deployment of a QuickSight analysis connecting to an Amazon Redshift data warehouse with a CloudFormation template.

Solution overview

Our solution consists of the following steps:

  1. Create a QuickSight analysis using an Amazon Redshift data source.
  2. Create a QuickSight template for your analysis.
  3. Create a CloudFormation template for your analysis using the AWS Command Line Interface (AWS CLI).
  4. Use the generated CloudFormation template to deploy a QuickSight analysis to a target environment.

The following diagram shows the architecture of how you can have multiple AWS accounts, each with its own QuickSight environment connected to its own Amazon Redshift data source. In this post, we outline the steps involved in migrating QuickSight assets in the dev account to the prod account. For this post, we use Amazon Redshift as the data source and create a QuickSight visualization using the Amazon Redshift sample TICKIT database.

The following diagram illustrates flow of the high-level steps.

Prerequisites

Before setting up the CloudFormation stacks, you must have an AWS account and an AWS Identity and Access Management (IAM) user with sufficient permissions to interact with the AWS Management Console and the services listed in the architecture.

The migration requires the following prerequisites:

Create a QuickSight analysis in your dev environment

In this section, we walk through the steps to set up your QuickSight analysis using an Amazon Redshift data source.

Create an Amazon Redshift data source

To connect to your Amazon Redshift data warehouse, you need to create a data source in QuickSight. As shown in the following screenshot, you have two options:

  • Auto-discovered
  • Manual connect

QuickSight auto-discovers Amazon Redshift clusters that are associated with your AWS account. These resources must be located in the same Region as your QuickSight account.

For more details, refer to Authorizing connections from Amazon QuickSight to Amazon Redshift clusters.

You can also manually connect and create a data source.

Create an Amazon Redshift dataset

The next step is to create a QuickSight dataset, which identifies the specific data in a data source you want to use.

For this post, we use the TICKIT database created in an Amazon Redshift data warehouse, which consists of seven tables: two fact tables and five dimensions, as shown in the following figure.

This sample database application helps analysts track sales activity for the fictional TICKIT website, where users buy and sell tickets online for sporting events, shows, and concerts.

  1. On the Datasets page, choose New dataset.
  2. Choose the data source you created in the previous step.
  3. Choose Use custom SQL.
  4. Enter the custom SQL as shown in the following screenshot.

The following screenshot shows our completed data source.

Create a QuickSight analysis

The next step is to create an analysis that utilizes this dataset. In QuickSight, you analyze and visualize your data in analyses. When you’re finished, you can publish your analysis as a dashboard to share with others in your organization.

  1. On the All analyses tab of the QuickSight start page, choose New analysis.

The Datasets page opens.

  1. Choose a dataset, then choose Use in analysis.

  1. Create a visual. For more information about creating visuals, see Adding visuals to Amazon QuickSight analyses.

Create a QuickSight template from your analysis

A QuickSight template is a named object in your AWS account that contains the definition of your analysis and references to the datasets used. You can create a template using the QuickSight API by providing the details of the source analysis via a parameter file. You can use templates to easily create a new analysis.

You can use AWS Cloud9 from the console to run AWS CLI commands.

The following AWS CLI command demonstrates how to create a QuickSight template based on the sales analysis you created (provide your AWS account ID for your dev account):

aws quicksight create-template --aws-account-id  <DEVACCOUNT>--template-id QS-RS-SalesAnalysis-Template --cli-input-json file://parameters.json

The parameter.json file contains the following details (provide your source QuickSight user ARN, analysis ARN, and dataset ARN):

{
    "Name": "QS-RS-SalesAnalysis-Temp",
    "Permissions": [
        {"Principal": "<QS-USER-ARN>", 
          "Actions": [ "quicksight:CreateTemplate",
                       "quicksight:DescribeTemplate",                   
                       "quicksight:DescribeTemplatePermissions",
                       "quicksight:UpdateTemplate"         
            ] } ] ,
     "SourceEntity": {
       "SourceAnalysis": {
         "Arn": "<QS-ANALYSIS-ARN>",
         "DataSetReferences": [
           {
             "DataSetPlaceholder": "sales",
             "DataSetArn": "<QS-DATASET-ARN>"
           }
         ]
       }
     },
     "VersionDescription": "1"
    }

You can use the AWS CLI describe-user, describe_analysis, and describe_dataset commands to get the required ARNs.

To upload the updated parameter.json file to AWS Cloud9, choose File from the tool bar and choose Upload local file.

The QuickSight template is created in the background. QuickSight templates aren’t visible within the QuickSight UI; they’re a developer-managed or admin-managed asset that is only accessible via the AWS CLI or APIs.

To check the status of the template, run the describe-template command:

aws quicksight describe-template --aws-account-id <DEVACCOUNT> --template-id "QS-RS-SalesAnalysis-Temp"

The following code shows command output:

Copy the template ARN; we need it later to create a template in the production account.

The QuickSight template permissions in the dev account need to be updated to give access to the prod account. Run the following command to update the QuickSight template. This provides the describe privilege to the target account to extract details of the template from the source account:

aws quicksight update-template-permissions --aws-account-id <DEVACCOUNT> --template-id “QS-RS-SalesAnalysis-Temp” --grant-permissions file://TemplatePermission.json

The file TemplatePermission.json contains the following details (provide your target AWS account ID):

[
  {
    "Principal": "arn:aws:iam::<TARGET ACCOUNT>",
    "Actions": [
      "quicksight:UpdateTemplatePermissions",
      "quicksight:DescribeTemplate"
    ]
  }
]

To upload the updated TemplatePermission.json file to AWS Cloud9, choose the File menu from the tool bar and choose Upload local file.

Create a CloudFormation template

In this section, we create a CloudFormation template containing our QuickSight assets. In this example, we use a YAML formatted template saved on our local machine. We update the following different sections of the template:

  • AWS::QuickSight::DataSource
  • AWS::QuickSight::DataSet
  • AWS::QuickSight::Template
  • AWS::QuickSight::Analysis

Some of the information required to complete the CloudFormation template can be gathered from the source QuickSight account via the describe AWS CLI commands, and some information needs to be updated for the target account.

Create an Amazon Redshift data source in AWS CloudFormation

In this step, we add the AWS::QuickSight::DataSource section of the CloudFormation template.

Gather the following information on the Amazon Redshift cluster in the target AWS account (production environment):

  • VPC connection ARN
  • Host
  • Port
  • Database
  • User
  • Password
  • Cluster ID

You have the option to create a custom DataSourceID. This ID is unique per Region for each AWS account.

Add the following information to the template:

Resources:
  RedshiftBuildQSDataSource:
    Type: 'AWS::QuickSight::DataSource'
    Properties:  
      DataSourceId: "RS-Sales-DW"      
      AwsAccountId: !Sub ${AWS::ACCOUNT ID}
      VpcConnectionProperties:
        VpcConnectionArn: <VPC-CONNECTION-ARN>      
      Type: REDSHIFT   
      DataSourceParameters:
        RedshiftParameters:     
          Host: "<HOST>"
          Port: <PORT>
          Clusterid: "<CLUSTER ID>"
          Database: "<DATABASE>"    
      Name: "RS-Sales-DW"
      Credentials:
        CredentialPair:
          Username: <USER>
          Password: <PASSWORD>
      Permissions:

Create an Amazon Redshift dataset in AWS CloudFormation

In this step, we add the AWS::QuickSight::DataSet section in the CloudFormation template to match the dataset definition from the source account.

Gather the dataset details and run the list-data-sets command to get all datasets from the source account (provide your source dev account ID):

aws quicksight list-data-sets  --aws-account-id <DEVACCOUNT>

The following code is the output:

Run the describe-data-set command, specifying the dataset ID from the previous command’s response:

aws quicksight describe-data-set --aws-account-id <DEVACCOUNT> --data-set-id "<YOUR-DATASET-ID>"

The following code shows partial output:

Based on the dataset description, add the AWS::Quicksight::DataSet resource in the CloudFormation template, as shown in the following code. Note that you can also create a custom DataSetID. This ID is unique per Region for each AWS account.

QSRSBuildQSDataSet:
    Type: 'AWS::QuickSight::DataSet'
    Properties:
      DataSetId: "RS-Sales-DW" 
      Name: "sales" 
      AwsAccountId: !Sub ${AWS::ACCOUNT ID}
      PhysicalTableMap:
        PhysicalTable1:          
          CustomSql:
            SqlQuery: "select sellerid, username, (firstname ||' '|| lastname) as name,city, sum(qtysold) as sales
              from sales, date, users
              where sales.sellerid = users.userid and sales.dateid = date.dateid and year = 2008
              group by sellerid, username, name, city
              order by 5 desc
              limit 10"
            DataSourceArn: !GetAtt RedshiftBuildQSDataSource.Arn
            Name"RS-Sales-DW"
            Columns:
            - Type: INTEGER
              Name: sellerid
            - Type: STRING
              Name: username
            - Type: STRING
              Name: name
            - Type: STRING
              Name: city
            - Type: DECIMAL
              Name: sales                                     
      LogicalTableMap:
        LogicalTable1:
          Alias: sales
          Source:
            PhysicalTableId: PhysicalTable1
          DataTransforms:
          - CastColumnTypeOperation:
              ColumnName: sales
              NewColumnType: DECIMAL
      Permissions:
        - Principal: !Join 
            - ''
            - - 'arn:aws:quicksight:'
              - !Ref QuickSightIdentityRegion
              - ':'
              - !Ref 'AWS::AccountId'
              - ':user/default/'
              - !Ref QuickSightUser
          Actions:
            - 'quicksight:UpdateDataSetPermissions'
            - 'quicksight:DescribeDataSet'
            - 'quicksight:DescribeDataSetPermissions'
            - 'quicksight:PassDataSet'
            - 'quicksight:DescribeIngestion'
            - 'quicksight:ListIngestions'
            - 'quicksight:UpdateDataSet'
            - 'quicksight:DeleteDataSet'
            - 'quicksight:CreateIngestion'
            - 'quicksight:CancelIngestion'
      ImportMode: DIRECT_QUERY

You can specify ImportMode to choose between Direct_Query or Spice.

Create a QuickSight template in AWS CloudFormation

In this step, we add the AWS::QuickSight::Template section in the CloudFormation template, representing the analysis template.

Use the source template ARN you created earlier and add the AWS::Quicksight::Template resource in the CloudFormation template:

QSTCFBuildQSTemplate:
    Type: 'AWS::QuickSight::Template'
    Properties:
      TemplateId: "QS-RS-SalesAnalysis-Temp"
      Name: "QS-RS-SalesAnalysis-Temp"
      AwsAccountId:!Sub ${AWS::ACCOUNT ID}
      SourceEntity:
        SourceTemplate:
          Arn: '<SOURCE-TEMPLATE-ARN>'          
      Permissions:
        - Principal: !Join 
            - ''
            - - 'arn:aws:quicksight:'
              - !Ref QuickSightIdentityRegion
              - ':'
              - !Ref 'AWS::AccountId'
              - ':user/default/'
              - !Ref QuickSightUser
          Actions:
            - 'quicksight:DescribeTemplate'
      VersionDescription: Initial version - Copied over from AWS account.

Create a QuickSight analysis

In this last step, we add the AWS::QuickSight::Analysis section in the CloudFormation template. The analysis is linked to the template created in the target account.

Add the AWS::Quicksight::Analysis resource in the CloudFormation template as shown in the following code:

QSRSBuildQSAnalysis:
    Type: 'AWS::QuickSight::Analysis'
    Properties:
      AnalysisId: 'Sales-Analysis'
      Name: 'Sales-Analysis'
      AwsAccountId:!Sub ${AWS::ACCOUNT ID}
      SourceEntity:
        SourceTemplate:
          Arn: !GetAtt  QSTCFBuildQSTemplate.Arn
          DataSetReferences:
            - DataSetPlaceholder: 'sales'
              DataSetArn: !GetAtt QSRSBuildQSDataSet.Arn
      Permissions:
        - Principal: !Join 
            - ''
            - - 'arn:aws:quicksight:'
              - !Ref QuickSightIdentityRegion
              - ':'
              - !Ref 'AWS::AccountId'
              - ':user/default/'
              - !Ref QuickSightUser
          Actions:
            - 'quicksight:RestoreAnalysis'
            - 'quicksight:UpdateAnalysisPermissions'
            - 'quicksight:DeleteAnalysis'
            - 'quicksight:DescribeAnalysisPermissions'
            - 'quicksight:QueryAnalysis'
            - 'quicksight:DescribeAnalysis'
            - 'quicksight:UpdateAnalysis'      

Deploy the CloudFormation template in the production account

To create a new CloudFormation stack that uses the preceding template via the AWS CloudFormation console, complete the following steps:

  1. On the AWS CloudFormation console, choose Create Stack.
  2. On the drop-down menu, choose with new resources (standard).
  3. For Prepare template, select Template is ready.
  4. For Specify template, choose Upload a template file.
  5. Save the provided CloudFormation template in a .yaml file and upload it.
  6. Choose Next.
  7. Enter a name for the stack. For this post, we use QS-RS-CF-Stack.
  8. Choose Next.
  9. Choose Next again.
  10. Choose Create Stack.

The status of the stack changes to CREATE_IN_PROGRESS, then to CREATE_COMPLETE.

Verify the QuickSight objects in the following table have been created in the production environment.

QuickSight Object Type Object Name (Dev) Object Name ( Prod)
Data Source RS-Sales-DW RS-Sales-DW
Dataset Sales Sales
Template QS-RS-Sales-Temp QS-RS-SalesAnalysis-Temp
Analysis Sales Analysis Sales-Analysis

The following example shows that Sales Analysis was created in the target account.

Conclusion

This post demonstrated an approach to migrate a QuickSight analysis with an Amazon Redshift data source from one QuickSight account to another with a CloudFormation template.

For more information about automating dashboard deployment, customizing access to the QuickSight console, configuring for team collaboration, and implementing multi-tenancy and client user segregation, check out the videos Virtual Admin Workshop: Working with Amazon QuickSight APIs and Admin Level-Up Virtual Workshop, V2 on YouTube.


About the author

Sandeep Bajwa is a Sr. Analytics Specialist based out of Northern Virginia, specialized in the design and implementation of analytics and data lake solutions.

How Strategic Blue uses Amazon QuickSight and AWS Cost and Usage Reports to help their customers save millions

Post Syndicated from Frank Contrepois original https://aws.amazon.com/blogs/big-data/how-strategic-blue-uses-amazon-quicksight-and-aws-cost-and-usage-reports-to-help-their-customers-save-millions/

This is a guest post co-written with Frank Contrepois from Strategic Blue.

For over 10 years, Strategic Blue has helped organizations unlock the most value from the cloud by enabling their customers to purchase non-standard commitments. By taking a commodity trading approach to purchasing from AWS, Strategic Blue helps customers purchase commitments for varying lengths of time, such as a 9-month Reserved Instance or an 18-month Savings Plan. Over the years, they’ve been able to help customers save millions by maximizing commitments.

In this post, we share how Strategic Blue uses Amazon QuickSight and AWS Cost and Usage Reports to help their customers save costs.

The challenge

Buying and selling AWS differently means that the cost and usage data available to Strategic Blue on the AWS Management Console only matches what they purchased—not what their customers purchased. In order to accurately bill their customers, Strategic Blue has built a billing system that takes AWS Cost and Usage Reports (CUR) as input and outputs a pro forma CUR that matches what their customers would expect to see. Although the CUR remains a critical source of data, it can have hundreds of columns and millions of rows, making it very difficult for Strategic Blue’s customers to visualize and understand.

Initially, in order to give their customers a way to visualize and understand their spend, Strategic Blue started building a dashboard from scratch using QuickSight, AWS Glue, and Amazon Athena. The idea was to build a dashboard accessible to all of Strategic Blue’s customers (as soon as they were onboarded) that enabled them to see their true cost and usage. QuickSight provides modern interactive dashboards that enable fast time-to-insights and have features that allow for the easy embedding of dashboards into web applications linked to a customer’s single sign-on (SSO) solution. Combined with row-level-security, a dashboard can be pre-filtered to show an individual user’s cost and usage information for only the accounts they are responsible for.

However, figuring out how to accurately show cost and usage insights from the CUR from scratch was a challenge. The amount of work required to decode the raw content of the CUR to build something that matches what you would see in AWS Cost Explorer quickly became overwhelming.

The solution

To help you visualize the treasure trove of data available in a CUR file, AWS created the Cloud Intelligence Dashboards solution. The Cloud Intelligence Dashboards provide a full stack of capabilities, deployed via AWS CloudFormation or other methods, that include six different QuickSight dashboards geared towards helping you optimize your spend on AWS.

Strategic Blue deployed the CUDOS Dashboard (one of the six dashboards available as of this writing) to solve their business case for providing their customers with accurate, comprehensive insights into their cost and usage.

“The Cloud Intelligence Dashboards provided all of the accurate CUR calculations and maintenance we need. This saves us many hours of reverse engineering to keep pace with AWS innovation and changes as their product and billing mechanisms mature.”

– Frank Contrepois, Head of FinOps at Strategic Blue.

The following screenshot shows an example of the dashboard.

Embedding and scaling to all customers

Strategic Blue uses the embedding and row-level security features of QuickSight to scale the dashboards to every customer the moment they are onboarded. By integrating their SSO Amazon Cognito with QuickSight, Strategic Blue is able to provide customers instant access to an instance of CUDOS through a portal as soon as they are onboarded to Strategic Blue’s platform. The row-level security setup managed by administrators within Strategic Blue makes sure that their customers only ever see their own cost and usage data. This helps Strategic Blue offer the protection and security customers expect.

To see the Strategic Blue portal with embedded CUDOS in action, watch the following demo video, or to unlock your savings potential in the cloud, sign up with Strategic Blue now.

Now that CUDOS is embedded into Strategic Blue’s portal, they are able to offer additional value free of charge to their customers. Strategic Blue’s portal uses the customer’s CUDOS dashboard to find opportunities to save and optimize. After the engagement, Strategic Blue will continue to analyze the impact of their customer’s cost optimization measures, reporting back to them what they’ve saved and what additional opportunities there are to further optimize.

Strategic Blue is already seeing an impact. Since enabling an embedded version of CUDOS for every customer and for internal teams, Strategic Blue is seeing a 27% increase in positive feedback for regular meetings, 31% fewer support tickets related to questions about cost, and a move from tactical to strategic FinOps conversations.

The future

Strategic Blue plans to evaluate and embed the rest of the Cloud Intelligence Dashboards, such as the KPI Dashboard to help customers track goals and metrics around cost optimization, and the Trusted Advisor Organizational Dashboard, which helps customers stay on top of underutilized resources as well as operational information such as security and fault tolerance postures. With the foundation in place and QuickSight’s ease of use, Strategic Blue will continue working closely with customers to customize and refine the dashboards to meet specific customer needs, improving and expanding their offerings.

Conclusion

In this post, we covered how Strategic Blue used Cloud Intelligence Dashboards built on QuickSight to help customers get accurate insights into their cloud cost and usage. Strategic Blue’s customers can access stunning and interactive dashboards that can be customized with ease and without the need for technical skills. The comprehensive embedding capabilities, granular row-level-security, and SSO integrations of QuickSight ensure that Strategic Blue is able to provide customers secure and seamless access to their Cloud Intelligence Dashboards.

It’s easy to install Cloud Intelligence Dashboards in your account. Visit Cloud Intelligence Dashboards for details on how to deploy the dashboards today, and let us know how it goes.


About the Authors

Frank Contrepois is the Head of FinOps at Strategic Blue. Frank and his team support a wide range of customers to implement Cloud FinOps including small-and medium-sized organizations, private equity (PE) funds and investors, enterprises and global cloud resellers striking significant deals. He is an AWS APN Ambassador and has several AWS and GCP pro-level certifications. Outside of work, he is a husband, father of two wonderful boys, and co-host of the “What’s new with in Cloud FinOps” podcast.

Aaron Edell is Head of GTM for Customer Cloud Intelligence for Amazon Web Services. He is responsible for building and scaling businesses around Cloud Financial Management, FinOps, and the Well-Architected Cost Optimization pillar. He focuses his GTM efforts on the Cloud Intelligence Dashboards and remains obsessed with helping all customers get better visibility and access to their cost and usage data.

How to visualize IAM Access Analyzer policy validation findings with QuickSight

Post Syndicated from Mostefa Brougui original https://aws.amazon.com/blogs/security/how-to-visualize-iam-access-analyzer-policy-validation-findings-with-quicksight/

In this blog post, we show you how to create an Amazon QuickSight dashboard to visualize the policy validation findings from AWS Identity and Access Management (IAM) Access Analyzer. You can use this dashboard to better understand your policies and how to achieve least privilege by periodically validating your IAM roles against IAM best practices. This blog post walks you through the deployment for a multi-account environment using AWS Organizations.

Achieving least privilege is a continuous cycle to grant only the permissions that your users and systems require. To achieve least privilege, you start by setting fine-grained permissions. Then, you verify that the existing access meets your intent. Finally, you refine permissions by removing unused access. To learn more, see IAM Access Analyzer makes it easier to implement least privilege permissions by generating IAM policies based on access activity.

Policy validation is a feature of IAM Access Analyzer that guides you to author and validate secure and functional policies with more than 100 policy checks. You can use these checks when creating new policies or to validate existing policies. To learn how to use IAM Access Analyzer policy validation APIs when creating new policies, see Validate IAM policies in CloudFormation templates using IAM Access Analyzer. In this post, we focus on how to validate existing IAM policies.

Approach to visualize IAM Access Analyzer findings

As shown in Figure 1, there are four high-level steps to build the visualization.

Figure 1: Steps to visualize IAM Access Analyzer findings

Figure 1: Steps to visualize IAM Access Analyzer findings

  1. Collect IAM policies

    To validate your IAM policies with IAM Access Analyzer in your organization, start by periodically sending the content of your IAM policies (inline and customer-managed) to a central account, such as your Security Tooling account.

  2. Validate IAM policies

    After you collect the IAM policies in a central account, run an IAM Access Analyzer ValidatePolicy API call on each policy. The API calls return a list of findings. The findings can help you identify issues, provide actionable recommendations to resolve the issues, and enable you to author functional policies that can meet security best practices. The findings are stored in an Amazon Simple Storage Service (Amazon S3) bucket. To learn about different findings, see Access Analyzer policy check reference.

  3. Visualize findings

    IAM Access Analyzer policy validation findings are stored centrally in an S3 bucket. The S3 bucket is owned by the central (hub) account of your choosing. You can use Amazon Athena to query the findings from the S3 bucket, and then create a QuickSight analysis to visualize the findings.

  4. Publish dashboards

    Finally, you can publish a shareable QuickSight dashboard. Figure 2 shows an example of the dashboard.

    Figure 2: Dashboard overview

    Figure 2: Dashboard overview

Design overview

This implementation is a serverless job initiated by Amazon EventBridge rules. It collects IAM policies into a hub account (such as your Security Tooling account), validates the policies, stores the validation results in an S3 bucket, and uses Athena to query the findings and QuickSight to visualize them. Figure 3 gives a design overview of our implementation.

Figure 3: Design overview of the implementation

Figure 3: Design overview of the implementation

As shown in Figure 3, the implementation includes the following steps:

  1. A time-based rule is set to run daily. The rule triggers an AWS Lambda function that lists the IAM policies of the AWS account it is running in.
  2. For each IAM policy, the function sends a message to an Amazon Simple Queue Service (Amazon SQS) queue. The message contains the IAM policy Amazon Resource Name (ARN), and the policy document.
  3. When new messages are received, the Amazon SQS queue initiates the second Lambda function. For each message, the Lambda function extracts the policy document and validates it by using the IAM Access Analyzer ValidatePolicy API call.
  4. The Lambda function stores validation results in an S3 bucket.
  5. An AWS Glue table contains the schema for the IAM Access Analyzer findings. Athena natively uses the AWS Glue Data Catalog.
  6. Athena queries the findings stored in the S3 bucket.
  7. QuickSight uses Athena as a data source to visualize IAM Access Analyzer findings.

Benefits of the implementation

By implementing this solution, you can achieve the following benefits:

  • Store your IAM Access Analyzer policy validation results in a scalable and cost-effective manner with Amazon S3.
  • Add scalability and fault tolerance to your validation workflow with Amazon SQS.
  • Partition your evaluation results in Athena and restrict the amount of data scanned by each query, helping to improve performance and reduce cost.
  • Gain insights from IAM Access Analyzer policy validation findings with QuickSight dashboards. You can use the dashboard to identify IAM policies that don’t comply with AWS best practices and then take action to correct them.

Prerequisites

Before you implement the solution, make sure you’ve completed the following steps:

  1. Install a Git client, such as GitHub Desktop.
  2. Install the AWS Command Line Interface (AWS CLI). For instructions, see Installing or updating the latest version of the AWS CLI.
  3. If you plan to deploy the implementation in a multi-account environment using Organizations, enable all features and enable trusted access with Organizations to operate a service-managed stack set.
  4. Get a QuickSight subscription to the Enterprise edition. When you first subscribe to the Enterprise edition, you get a free trial for four users for 30 days. Trial authors are automatically converted to month-to-month subscription upon trial expiry. For more details, see Signing up for an Amazon QuickSight subscription, Amazon QuickSight Enterprise edition and the Amazon QuickSight Pricing Calculator.

Note: This implementation works in accounts that don’t have AWS Lake Formation enabled. If Lake Formation is enabled in your account, you might need to grant Lake Formation permissions in addition to the implementation IAM permissions. For details, see Lake Formation access control overview.

Walkthrough

In this section, we will show you how to deploy an AWS CloudFormation template to your central account (such as your Security Tooling account), which is the hub for IAM Access Analyzer findings. The central account collects, validates, and visualizes your findings.

To deploy the implementation to your multi-account environment

  1. Deploy the CloudFormation stack to your central account.

    Important: Do not deploy the template to the organization’s management account; see design principles for organizing your AWS accounts. You can choose the Security Tooling account as a hub account.

    In your central account, run the following commands in a terminal. These commands clone the GitHub repository and deploy the CloudFormation stack to your central account.

    # A) Clone the repository
    git clone https://github.com/aws-samples/visualize-iam-access-analyzer-policy-validation-findings.git
      # B) Switch to the repository's directory cd visualize-iam-access-analyzer-policy-validation-findings
      # C) Deploy the CloudFormation stack to your central security account (hub). For <AWSRegion> enter your AWS Region without quotes. make deploy-hub aws-region=<AWSRegion>

    If you want to send IAM policies from other member accounts to your central account, you will need to make note of the CloudFormation stack outputs for SQSQueueUrl and KMSKeyArn when the deployment is complete.

    make describe-hub-outputs aws-region=<AWSRegion>

  2. Switch to your organization’s management account and deploy the stack sets to the member accounts. For <SQSQueueUrl> and <KMSKeyArn>, use the values from the previous step.
    # Create a CloudFormation stack set to deploy the resources to the member accounts.
      make deploy-members SQSQueueUrl=<SQSQueueUrl> KMSKeyArn=<KMSKeyArn< aws-region=<AWSRegion>

To deploy the QuickSight dashboard to your central account

  1. Make sure that QuickSight is using the IAM role aws-quicksight-service-role.
    1. In QuickSight, in the navigation bar at the top right, choose your account (indicated by a person icon) and then choose Manage QuickSight.
    2. On the Manage QuickSight page, in the menu at the left, choose Security & Permissions.
    3. On the Security & Permissions page, under QuickSight access to AWS services, choose Manage.
    4. For IAM role, choose Use an existing role, and then do one of the following:
      • If you see a list of existing IAM roles, choose the role

        arn:aws:iam::<account-id>:role/service-role/aws-quicksight-service-role.

      • If you don’t see a list of existing IAM roles, enter the IAM ARN for the role in the following format:

        arn:aws:iam::<account-id>:role/service-role/aws-quicksight-service-role.

    5. Choose Save.
  2. Retrieve the QuickSight users.
    # <aws-region> your Quicksight main Region, for example eu-west-1
    # <account-id> The ID of your account, for example 123456789012
    # <namespace-name> Quicksight namespace, for example default.
    # You can list the namespaces by using aws quicksight list-namespaces --aws-account-id <account-id>
      aws quicksight list-users --region <aws-region> --aws-account-id <account-id> --namespace <namespace-name>

  3. Make a note of the user’s ARN that you want to grant permissions to list, describe, or update the QuickSight dashboard. This information is found in the arn element. For example, arn:aws:quicksight:us-east-1:111122223333:user/default/User1
  4. To launch the deployment stack for the QuickSight dashboard, run the following command. Replace <quicksight-user-arn> with the user’s ARN from the previous step.
    make deploy-dashboard-hub aws-region=<AWSRegion> quicksight-user-arn=<quicksight-user-arn>

Publish and share the QuickSight dashboard with the policy validation findings

You can publish your QuickSight dashboard and then share it with other QuickSight users for reporting purposes. The dashboard preserves the configuration of the analysis at the time that it’s published and reflects the current data in the datasets used by the analysis.

To publish the QuickSight dashboard

  1. In the QuickSight console, choose Analyses and then choose access-analyzer-validation-findings.
  2. (Optional) Modify the visuals of the analysis. For more information, see Tutorial: Modify Amazon QuickSight visuals.
  3. Share the QuickSight dashboard.
    1. In your analysis, in the application bar at the upper right, choose Share, and then choose Publish dashboard.
    2. On the Publish dashboard page, choose Publish new dashboard as and enter IAM Access Analyzer Policy Validation.
    3. Choose Publish dashboard. The dashboard is now published.
  4. On the QuickSight start page, choose Dashboards.
  5. Select the IAM Access Analyzer Policy Validation dashboard. IAM Access Analyzer policy validation findings will appear within the next 24 hours.

    Note: If you don’t want to wait until the Lambda function is initiated automatically, you can invoke the function that lists customer-managed policies and inline policies by using the aws lambda invoke AWS CLI command on the hub account and wait one to two minutes to see the policy validation findings:

    aws lambda invoke –function-name access-analyzer-list-iam-policy –invocation-type Event –cli-binary-format raw-in-base64-out –payload {} response.json

  6. (Optional) To export your dashboard as a PDF, see Exporting Amazon QuickSight analyses or dashboards as PDFs.

To share the QuickSight dashboard

  1. In the QuickSight console, choose Dashboards and then choose IAM Access Analyzer Policy Validation.
  2. In your dashboard, in the application bar at the upper right, choose Share, and then choose Share dashboard.
  3. On the Share dashboard page that opens, do the following:
    1. For Invite users and groups to dashboard on the left pane, enter a user email or group name in the search box. Users or groups that match your query appear in a list below the search box. Only active users and groups appear in the list.
    2. For the user or group that you want to grant access to the dashboard, choose Add. Then choose the level of permissions that you want them to have.
  4. After you grant users access to a dashboard, you can copy a link to it and send it to them.

For more details, see Sharing dashboards or Sharing your view of a dashboard.

Your teams can use this dashboard to better understand their IAM policies and how to move toward least-privilege permissions, as outlined in the section Validate your IAM roles of the blog post Top 10 security items to improve in your AWS account.

Clean up

To avoid incurring additional charges in your accounts, remove the resources that you created in this walkthrough.

Before deleting the CloudFormation stacks and stack sets in your accounts, make sure that the S3 buckets that you created are empty. To delete everything (including old versioned objects) in a versioned bucket, we recommend emptying the bucket through the console. Before deleting the CloudFormation stack from the central account, delete the Athena workgroup.

To delete remaining resources from your AWS accounts

  1. Delete the CloudFormation stack from your central account by running the following command. Make sure to replace <AWSRegion> with your own Region.
    make delete-hub aws-region=<AWSRegion>

  2. Delete the CloudFormation stack set instances and stack sets by running the following command using your organization’s management account credentials. Make sure to replace <AWSRegion> with your own Region.
    make delete-stackset-instances aws-region=<AWSRegion>
      # Wait for the operation to finish. You can check its progress on the CloudFormation console.
      make delete-stackset aws-region=<AWSRegion>

  3. Delete the QuickSight dashboard by running the following command using the central account credentials. Make sure to replace <AWSRegion> with your own Region.
    make delete-dashboard aws-region=<AWSRegion>

  4. To cancel your QuickSight subscription and close the account, see Canceling your Amazon QuickSight subscription and closing the account.

Conclusion

In this post, you learned how to validate your existing IAM policies by using the IAM Access Analyzer ValidatePolicy API and visualizing the results with AWS analytics tools. By using the implementation, you can better understand your IAM policies and work to reach least privilege in a scalable, fault-tolerant, and cost-effective way. This will help you identify opportunities to tighten your permissions and to grant the right fine-grained permissions to help enhance your overall security posture.

To learn more about IAM Access Analyzer, see previous blog posts on IAM Access Analyzer.

To download the CloudFormation templates, see the visualize-iam-access-analyzer-policy-validation-findings GitHub repository. For information about pricing, see Amazon SQS pricing, AWS Lambda pricing, Amazon Athena pricing and Amazon QuickSight pricing.

If you have feedback about this post, submit comments in the Comments section below. If you have questions about this post, start a new thread on the AWS Security, Identity, & Compliance re:Post.

Want more AWS Security news? Follow us on Twitter.

Mostefa Brougui

Mostefa Brougui

Mostefa is a Sr. Security Consultant in Professional Services at Amazon Web Services. He works with AWS enterprise customers to design, build, and optimize their security architecture to drive business outcomes.

Tobias Nickl

Tobias Nickl

Tobias works in Professional Services at Amazon Web Services as a Security Engineer. In addition to building custom AWS solutions, he advises AWS enterprise customers on how to reach their business objectives and accelerate their cloud transformation.

Chargeback Gurus empowers eCommerce merchants with advanced chargeback intelligence to recover millions using Amazon Quicksight

Post Syndicated from Suresh Dakshina original https://aws.amazon.com/blogs/big-data/chargeback-gurus-empowers-ecommerce-merchants-with-advanced-chargeback-intelligence-to-recover-millions-using-amazon-quicksight/

This is a guest post by Suresh Dakshina and Damodharan Sampathkumar from Chargeback Gurus.

Chargeback Gurus, a global financial technology company helps businesses fight, prevent, and win chargebacks. To date, we have helped businesses worldwide recover over $2 billion in lost revenue. As trusted advisors to card networks and Fortune 500 companies, we are known for our expertise in the areas of transaction risk management, chargeback mitigation, fraud prevention, and dispute intelligence. Our Veda and Ari product lines are an industry breakthrough helping merchants identify the risk in online transactions and take insightful actions to protect revenue.

Chargebacks are costing merchants up to 40% of their overall revenue if left unchecked. In addition, as per a Javelin study, fraud and chargeback management are consuming 13-20% of a merchant’s operational budget. As a result, it is of utmost importance for merchants to gain access to transaction intelligence that can help them minimize these costs. The vast majority of these chargebacks are preventable, which is why our advanced dispute intelligence platform – Veda, along with our ability to predict chargebacks accurately using Ari have helped us go a long way in effectively preventing and recovering chargebacks for the merchants.

When seeking the right balance of flexibility, confidentiality, big data, cost, and customization capabilities, Amazon QuickSight stood out as the clear winner. In this post, we go over what we needed in a business intelligence (BI) tool, and why QuickSight was the right choice for us.

Helping customers solve problems with data

Our customers face numerous challenges on a daily basis, including the need to adapt to changing payment methods and products, navigate complex payments ecosystems, and address resource shortages. They also frequently encounter difficulties in identifying the root causes of their chargebacks and fraud. As a result, they are constantly confronted with challenges to protect their revenue. It is our mission to utilize data intelligence to address their biggest pain point and make a significant impact on their bottom line.

Our industry-first Advanced Dispute Intelligence platform, Veda, provides merchants with a wealth of data analytics, which would help them minimize revenue leakages. Empowered with this data, our merchants can spot inefficiencies in their operations and proactively fix issues to prevent chargebacks and fraud. Veda’s dashboard can be customized to display the information that’s most relevant to each merchant, allowing them to get to the root causes of their underlying challenges with a high level of accuracy.

The following sample screenshot highlights Veda’s ability to accurately forecast chargeback performance and trends using AWS QuickSight.

To power Veda, we were looking for a balance of flexibility and customization. We needed a BI tool that would meet our data analytics needs, and also provide us with the agility to make periodic changes to align with business requirements. The main reasons we chose QuickSight were:

  • Fast setup – Speed and agility can make all the difference when it comes to gathering insights that can impact revenue lost from chargebacks.
  • Comprehensive out-of-the-box functionality – Having a tool that has all the business intelligence and embedded analytics capabilities that we needed from the start was very important.
  • SPICE engine – SPICE (Super-fast, Parallel, In-memory Calculation Engine) is the robust in-memory engine that QuickSight uses. As it’s engineered to rapidly perform advanced calculations and serve data, it was a big selling point for us.

QuickSight’s out-of-the-box features and functionality were the perfect fit, enabling us to get started with providing insights to our customers right away.

User-friendliness is a key differentiator

Our Gurus provide deep analytics and data-driven recommendations to help businesses identify the problems and inefficiencies that are leading to chargebacks. With this guidance, companies can permanently improve their business processes and increase customer retention. Though we have the expertise and acumen to assist with all aspects of chargeback mitigation, management, and forecasting, we needed that same level of expertise and acumen when it came to translating ideas to products in the BI space.

QuickSight has met all our needs to provide dashboards and reports, with insightful visualizations that help our customers run their businesses more efficiently. Better still, it has done so through an intuitive, user-friendly interface that enables people from all technical backgrounds to use it with very little time spent on training. Having a minimal training timeframe is a key factor when it comes to onboarding new clients.

Partners in customer obsession

One of the things that has been a delightful surprise in our experience with QuickSight is how invested the development team is in collecting our feedback and using it to help inform plans for future releases. We have agreed to be beta testers, and so we receive proactive updates on progress from the project team, providing us with informative visibility on upcoming changes. Being understanding of evolving customer and data needs, and being receptive to feedback has made this a fantastic partnership. We look forward to continuing to work with QuickSight to expand our BI capabilities, empowering our customers with the data they need to be efficient and successful.

To learn more about how QuickSight can help your business with dashboards, reports, and more, visit Amazon QuickSight.

To learn more about how Chargeback Gurus can help you solve your chargeback and fraud challenges, visit www.chargebackgurus.com or email [email protected].


About the authors

Suresh Dakshina is the Co-founder & President at Chargeback Gurus. A pioneer in data analytics and industry-specific risk management, he is a certified e-commerce fraud prevention specialist and Certified Payments Professional. He understands first-hand the challenges that business owners face, especially when it comes to chargebacks and fraud. He is a veteran speaker, and works closely with Card Networks like Visa and American Express on chargeback process optimization and compelling evidence policies. He loves spending time with his family and his Labradoodle, Joy, when not working.

Damodharan Sampathkumar is the Chief Product Officer & GM-India at Chargeback Gurus. He is responsible for product strategy, platform development, and leading innovation for the next generation in payments technology with a specific focus on Chargebacks and Risk mitigation at Chargeback Gurus. He specializes in cloud-native, mission-critical, real-time payment systems, group-up technology platform setup, and operations. He has successfully championed multiple new-age digital payment platforms across North America, Europe, India, and the Middle East for Central Banks, Acquirer processors, and Fintech innovators. He is an avid cyclist and regular endurance rider who loves to ride during his time off to bring the right balance between work and life.

Deep dive into the AWS ProServe Hadoop Migration Delivery Kit TCO tool

Post Syndicated from Jiseong Kim original https://aws.amazon.com/blogs/big-data/deep-dive-into-the-aws-proserve-hadoop-migration-delivery-kit-tco-tool/

In the post Introducing the AWS ProServe Hadoop Migration Delivery Kit TCO tool, we introduced the AWS ProServe Hadoop Migration Delivery Kit (HMDK) TCO tool and the benefits of migrating on-premises Hadoop workloads to Amazon EMR. In this post, we dive deep into the tool, walking through all steps from log ingestion, transformation, visualization, and architecture design to calculate TCO.

Solution overview

Let’s briefly visit the HMDK TCO tool’s key features. The tool provides a YARN log collector to connect Hadoop Resource Manager to collect YARN logs. A Python-based Hadoop workload analyzer, called the YARN log analyzer, scrutinizes Hadoop applications. Amazon QuickSight dashboards showcase the results from the analyzer. The same results also accelerate the design of future EMR instances. Additionally, a TCO calculator generates the TCO estimation of an optimized EMR cluster for facilitating the migration.

Now let’s look at how the tool works. The following diagram illustrates the end-to-end workflow.

In the next sections, we walk through the five main steps of the tool:

  1. Collect YARN job history logs.
  2. Transform the job history logs from JSON to CSV.
  3. Analyze the job history logs.
  4. Design an EMR cluster for migration.
  5. Calculate the TCO.

Prerequisites

Before getting started, make sure to complete the following prerequisites:

  1. Clone the hadoop-migration-assessment-tco repository.
  2. Install Python 3 on your local machine.
  3. Have an AWS account with permission on AWS Lambda, QuickSight (Enterprise edition), and AWS CloudFormation.

Collect YARN job history logs

First, you run a YARN log collector, start-collector.sh, on your local machine. This step collects Hadoop YARN logs and places the logs on your local machine. The script connects your local machine with the Hadoop primary node and communicates with Resource Manager. Then it retrieves the job history information (YARN logs from application managers) by calling the YARN ResourceManager application API.

Prior to running the YARN log collector, you need to configure and establish the connection (HTTP: 8088 or HTTPS: 8090; the latter is recommended) to verify the accessibility of YARN ResourceManager and enabled YARN Timeline Server (Timeline Server v1 or later are supported). You may need to define the YARN logs’ collection interval and retention policy. To ensure that you collect consecutive YARN logs, you can use a cron job to schedule the log collector in a proper time interval. For example, for a Hadoop cluster with 2,000 daily applications and the setting yarn.resourcemanager.max-completed-applications set to 1,000, theoretically, you have to run the log collector at least twice to get all the YARN logs. In addition, we recommend collecting at least 7 days of YARN logs for analyzing holistic workloads.

For more details on how to configure and schedule the log collector, refer to the yarn-log-collector GitHub repo.

Transform the YARN job history logs from JSON to CSV

After obtaining YARN logs, you run a YARN log organizer, yarn-log-organizer.py, which is a parser to transform JSON-based logs to CSV files. These output CSV files are the inputs for the YARN log analyzer. The parser also has other capabilities, including sorting events by time, removing dedicates, and merging multiple logs.

For more information on how to use the YARN log organizer, refer to the yarn-log-organizer GitHub repo.

Analyze the YARN job history logs

Next, you launch the YARN log analyzer to analyze the YARN logs in CSV format.

With QuickSight, you can visualize YARN log data and conduct analysis against the datasets generated by pre-built dashboard templates and a widget. The widget automatically creates QuickSight dashboards in the target AWS account, which configured in a CloudFormation template.

The following diagram illustrates the HMDK TCO architecture.

The YARN log analyzer provides four key functionalities:

  1. Upload transformed YARN job history logs in CSV format (for example, cluster_yarn_logs_*.csv) to Amazon Simple Storage Service (Amazon S3) buckets. These CSV files are the outputs from the YARN log organizer.
  2. Create a manifest JSON file (for example, yarn-log-manifest.json) for QuickSight and upload it to the S3 bucket:
    {
        "fileLocations": [ { 
            "URIPrefixes": [
                "s3://emr-tco-date-bucket/yarn-log/demo/logs/"] 
        } ], 
        "globalUploadSettings": { 
            "format": "CSV", 
            "delimiter": ",", 
            "textqualifier": "'", 
            "containsHeader": "true" 
        }
     }

  3. Deploy QuickSight dashboards using a CloudFormation template, which is in YAML format. After deploying, choose the refresh icon until you see the stack’s status as CREATE_COMPLETE. This step creates datasets on QuickSight dashboards in your AWS target account.
  4. On the QuickSight dashboard, you can find insights of the analyzed Hadoop workloads from various charts. These insights help you design future EMR instances for migration acceleration, as demonstrated in the next step.

Design an EMR cluster for migration

The results of the YARN log analyzer help you understand the actual Hadoop workloads on the existing system. This step accelerates designing future EMR instances for migration by using an Excel template. The template contains a checklist for conducting workload analysis and capacity planning:

  • Are the applications running on the cluster being used appropriately with their current capacity?
  • Is the cluster under load at a certain time or not? If so, when is the time?
  • What types of applications and engines (such as MR, TEZ, or Spark) are running on the cluster, and what is the resource usage for each type?
  • Are different jobs’ run cycles (real-time, batch, ad hoc) running in one cluster?
  • Are any jobs running in regular batches, and if so, what are these schedule intervals? (For example, every 10 minutes, 1 hour, 1 day.) Do you have jobs that use a lot of resources during a long time period?
  • Do any jobs need performance improvement?
  • Are any specific organizations or individuals monopolizing the cluster?
  • Are any mixed development and operation jobs operating in one cluster?

After you complete the checklist, you’ll have a better understanding of how to design the future architecture. For optimizing EMR cluster cost effectiveness, the following table provides general guidelines of choosing the proper type of EMR cluster and Amazon Elastic Compute Cloud (Amazon EC2) family.

To choose the proper cluster type and instance family, you need to perform several rounds of analysis against YARN logs based on various criteria. Let’s look at some key metrics.

Timeline

You can find workload patterns based on the number of Hadoop applications run in a time window. For example, the daily or hourly charts “Count of Records by Startedtime” provide the following insights:

  • In daily time series charts, you compare the number of application runs between working days and holidays, and among calendar days. If the numbers are similar, it means the daily utilizations of the cluster are comparable. On the other hand, if the deviation is large, the proportion of ad hoc jobs is significant. You also can figure out the possible weekly or monthly jobs on particular days. In the situation, you can easily see specific days in a week or a month with high workload concentration.
  • In hourly time series charts, you further understand how applications are run in hourly windows. You can find peak and off-peak hours in a day.

Users

The YARN logs contain the user ID of each application. This information helps you understand who submits an application to a queue. Based on the statistics of individual and aggregated application runs per queue and per user, you can determine the existing workload distribution by user. Usually, users at the same team have shared queues. Sometime, multiple teams have shared queues. When designing queues for users, you now have insights to help you design and distribute application workloads that are more balanced across queues than they previously were.

Application types

You can segment workloads based on various application types (such as Hive, Spark, Presto, or HBase) and run engines (such as MR, Spark, or Tez). For the compute-heavy workloads such as MapReduce or Hive-on-MR jobs, use CPU-optimized instances. For memory-intensive workloads such as Hive-on-TEZ, Presto, and Spark jobs, use memory-optimized instances.

ElapsedTime

You can categorize applications by runtime. The embedded CloudFormation template automatically creates an elapsedGroup field in a QuickSight dashboard. This enables a key feature to allow you to observe long-running jobs in one of four charts on QuickSight dashboards. Therefore, you can design tailored future architectures for these large jobs.

The corresponding QuickSight dashboards include four charts. You can drill down each chart, which is associated to one group.

Group
Number
Runtime/Elapsed Time of a Job
1 Less than 10 minutes
2 Between 10 minutes and 30 minutes
3 between 30 minutes and 1 hour
4 Greater than 1 hour

In the chart of Group 4, you can concentrate on scrutinizing large jobs based on various metrics, including user, queue, application type, timeline, resource usage, and so on. Based on this consideration, you may have dedicated queues on a cluster or a dedicated EMR cluster for large jobs. Meanwhile, you may submit small jobs to shared queues.

Resources

Based on resource (CPU, memory) consumption patterns, you choose the right size and family of EC2 instances for performance and cost effectiveness. For compute-intensive applications, we recommend instances of CPU-optimized families. For memory-intensive applications, the memory-optimized instance families are recommended.

In addition, based on the nature of the application workloads and resource utilization over the time, you may choose a persistent or transient EMR cluster, Amazon EMR on EKS, or Amazon EMR Serverless.

After analyzing YARN logs by various metrics, you’re ready to design future EMR architectures. The following table lists examples of proposed EMR clusters. You can find more details in the optimized-tco-calculator GitHub repo.

Calculate TCO

Finally, on your local machine, run tco-input-generator.py to aggregate YARN job history logs on an hourly basis prior to using an Excel template to calculate the optimized TCO. This step is crucial because the results simulate the Hadoop workloads in future EMR instances.

The prerequisite of TCO simulation is to run tco-input-generator.py, which generates hourly aggregated logs. Next, you open an Excel template file to enable macros and provide your inputs in green cells for calculating the TCO. Regarding the input data, you enter the actual data size without replication, and the hardware specifications (vCore, mem) of the Hadoop primary node and data nodes. You also need to select and upload previously generated hourly aggregated logs. After you set the TCO simulation variables, such as Region, EC2 type, Amazon EMR high availability, engine effect, Amazon EC2 and Amazon EBS discount (EDP), Amazon S3 volume discount, local currency rate, and EMR EC2 task/core pricing ratio and price/hour, the TCO simulator automatically calculates the optimum cost of future EMR instances on Amazon EC2. The following screenshots show an example of HMDK TCO results.

For additional information and instructions of HMDK TCO calculations, refer to the optimized-tco-calculator GitHub repo.

Clean up

After you complete all the steps and finish testing, complete the following steps to delete resources to avoid incurring costs:

  1. On the AWS CloudFormation console, choose the stack you created.
  2. Choose Delete.
  3. Choose Delete stack.
  4. Refresh the page until you see the status DELETE_COMPLETE.
  5. On the Amazon S3 console, delete S3 bucket you created.

Conclusion

The AWS ProServe HMDK TCO tool significantly reduces migration planning efforts, which are the time-consuming and challenging tasks of assessing your Hadoop workloads. With the HMDK TCO tool, the assessment usually takes 2–3 weeks. You can also determine the calculated TCO of future EMR architectures. With the HMDK TCO tool, you are able to quickly understand your workloads and resource usage patterns. With the insights generated by the tool, you are equipped to design optimal future EMR architectures. In many use cases, a 1-year TCO of the optimized refactored architecture provides significant cost savings (64–80% reduction) on compute and storage, compared to lift-and-shift Hadoop migrations.

To learn more about accelerating your Hadoop migrations to Amazon EMR and the HMDK CTO tool, refer to the Hadoop Migration Delivery Kit TCO GitHub repo, or reach out to [email protected].


About the authors

Sungyoul Park is a Senior Practice Manager at AWS ProServe. He helps customers innovate their business with AWS Analytics, IoT, and AI/ML services. He has a specialty in big data services and technologies and an interest in building customer business outcomes together.

Jiseong Kim is a Senior Data Architect at AWS ProServe. He mainly works with enterprise customers to help data lake migration and modernization, and provides guidance and technical assistance on big data projects such as Hadoop, Spark, data warehousing, real-time data processing, and large-scale machine learning. He also understands how to apply technologies to solve big data problems and build a well-designed data architecture.

George Zhao is a Senior Data Architect at AWS ProServe. He is an experienced analytics leader working with AWS customers to deliver modern data solutions. He is also a ProServe Amazon EMR domain specialist who enables ProServe consultants on best practices and delivery kits for Hadoop to Amazon EMR migrations. His area of interests are data lakes and cloud modern data architecture delivery.

Kalen Zhang was the Global Segment Tech Lead of Partner Data and Analytics at AWS. As a trusted advisor of data and analytics, she curated strategic initiatives for data transformation, led data and analytics workload migration and modernization programs, and accelerated customer migration journeys with partners at scale. She specializes in distributed systems, enterprise data management, advanced analytics, and large-scale strategic initiatives.

AWS Week in Review – February 6, 2023

Post Syndicated from Marcia Villalba original https://aws.amazon.com/blogs/aws/aws-week-in-review-february-6-2023/

This post is part of our Week in Review series. Check back each week for a quick roundup of interesting news and announcements from AWS!

If you are looking for a new year challenge, the Serverless Developer Advocate team launched the 30 days of Serverless. You can follow the hashtag #30DaysServerless on LinkedIn, Twitter, or Instagram or visit the challenge page and learn a new Serverless concept every day.

Last Week’s Launches
Here are some launches that got my attention during the previous week.

AWS SAM CLIv1.72 added the capability to list important information from your deployments.

  • List the URLs of the Amazon API Gateway or AWS Lambda function URL.
    $ sam list endpoints
  • List the outputs of the deployed stack.
    $ sam list outputs
  • List the resources in the local stack. If a stack name is provided, it also shows the corresponding deployed resources and the ids.
    $ sam list resources

Amazon RDSNow supports increasing the allocated storage size when creating read replicas or when restoring a database from snapshots. This is very useful when your primary instances are near their maximum allocated storage capacity.

Amazon QuickSight Allows you to create Radar charts. Radar charts are a way to visualize multivariable data that are used to plot one or more groups of values over multiple common variables.

AWS Systems Manager AutomationNow integrates with Systems Manager Change Calendar. Now you can reduce the risks associated with changes in your production environment by allowing Automation runbooks to run during an allowed time window configured in the Change Calendar.

AWS AppConfigIt announced its integration with AWS Secrets Manager and AWS Key Management Service (AWS KMS). All sensitive data retrieved from Secrets Manager via AWS AppConfig can be encrypted at deployment time using an AWS KMS customer managed key (CMK).

For a full list of AWS announcements, be sure to keep an eye on the What’s New at AWS page.

Other AWS News
Some other updates and news that you may have missed:

AWS Cloud Clubs – Cloud Clubs are peer-to-peer user groups for students and young people aged 18–28. In these clubs, you can network, attend career-building events, earn benefits like AWS credits, and more. Learn more about the clubs in your region in the AWS student portal.

Get AWS Certified: Profesional challenge – You can register now for the certification challenge. Prepare for your AWS Professional Certification exam and get a 50 percent discount for the certification exam. Learn more about the challenge on the official page.

Podcast Charlas Técnicas de AWS – If you understand Spanish, this podcast is for you. Podcast Charlas Técnicas is one of the official AWS podcasts in Spanish, and every other week, there is a new episode. The podcast is for builders, and it shares stories about how customers implemented and learned AWS services, how to architect applications, and how to use new services. You can listen to all the episodes directly from your favorite podcast app or at AWS Podcasts en Español.

AWS Open-Source News and Updates – This is a newsletter curated by my colleague Ricardo to bring you the latest open-source projects, posts, events, and more.

Upcoming AWS Events
Check your calendars and sign up for these AWS events:

AWS re:Invent recaps – We had a lot of announcements during re:Invent. If you want to learn them all in your language and in your area, check the re: Invent recaps. All the upcoming ones are posted on this site, so check it regularly to find an event nearby.

AWS Innovate Data and AI/ML edition – AWS Innovate is a free online event to learn the latest from AWS experts and get step-by-step guidance on using AI/ML to drive fast, efficient, and measurable results.

  • AWS Innovate Data and AI/ML edition for Asia Pacific and Japan is taking place on February 22, 2023. Register here.
  • Registrations for AWS Innovate EMEA (March 9, 2023) and the Americas (March 14, 2023) will open soon. Check the AWS Innovate page for updates.

You can find details on all upcoming events, in-person or virtual, here.

That’s all for this week. Check back next Monday for another Week in Review!

— Marcia

Visualize multivariate data using a radar chart in Amazon QuickSight

Post Syndicated from Bhupinder Chadha original https://aws.amazon.com/blogs/big-data/visualize-multivariate-data-using-a-radar-chart-in-amazon-quicksight/

At AWS re:Invent 2022, we announced the general availability of two new Amazon QuickSight visuals: small multiples and text boxes. We are excited to add another new visual to QuickSight: radar charts. With radar charts, you can compare two or more items across multiple variables in QuickSight.

In this post, we explore radar charts, its use cases, and how to configure one.

What is a radar chart?

Radar charts (also known as spider charts, polar charts, web charts, or star plots) are a way to visualize multivariate data similar to a parallel coordinates chart. They are used to plot one or more groups of values over multiple common variables. They do this by providing an axis for each variable, and these axes are arranged radially around a central point and spaced equally. The center of the chart represents the minimum value, and the edges represent the maximum value on the axis. The data from a single observation is plotted along each axis and connected to form a polygon. Multiple observations can be placed in a single chart by displaying multiple polygons.

For example, consider HR wanting to comparing the employee satisfaction score for different departments like sales, marketing, and finance against various metrics such as work/life balance, diversity, inclusiveness, growth opportunities, and wages. As shown in the following radar chart, each employee metric forms the axis with each department being represented by individual series.

Another effective way of comparing radar charts is to compare a given department against the average or baseline value. For instance, the sales department feels less compensated compared to the baseline, but ranks high on work/life balance.

When to use radar charts

Radar charts are a great option when space is a constraint and you want to compare multiple groups in a compact space. Radar charts are best used for the following:

  • Visualizing multivariate data, such as comparing cars across different stats like mileage, max speed, engine power, and driving pleasure
  • Comparative analysis (comparing two or more items across a list of common variables)
  • Spot outliers and commonality

Compared to parallel coordinates, radar charts are ideal when there are a few groups of items to be compared. You should also be mindful of not displaying too many variables, which can make the chart look cluttered and difficult to read.

Radar chart use cases

Radar charts have a wide variety of industry use cases, some of which are as follows:

  • Sports analytics – Compare athlete performance across different performance parameters for selection criteria
  • Strategy – Compare and measure different technology costs between various parameters, such as contact center, claims, massive claims, and others
  • Sales – Compare performance of sales reps across different parameters like deals closed, average deal size, net new customer wins, total revenue, and deals in the pipeline
  • Call centers – Compare call center staff performance against the staff average across different dimensions
  • HR – Compare company scores in terms of diversity, work/life balance, benefits, and more
  • User research and customer success – Compare customer satisfaction scores across different parts of the product

Different radar chart configurations

Let’s use an example of visualizing staff performance within a team, using the following sample data. The goal is to compare employee performance based on various qualities like communication, work quality, productivity, creativity, dependability, punctuality, and technical skills, ranging between a score of 0–10.

To add a radar chart to your analysis, choose the radar chart icon from the visual selector.

Depending on your use case and how the data is structured, you can configure radar charts in different ways.

Value as axis (UC1 and 2 tab from the dataset)

In this scenario, all qualities (communication, dependability, and so on) are defined as measures, and the employee is defined as a dimension in the dataset.

To visualize this data in a radar chart, drag all the variables to the Values field well and the Employee field to the Color field well.

Category as axis (UC1 and 2 tab from the dataset)

Another way to visualize the same data is to reverse the series and axis configuration, where each quality is displayed as a series and employees are displayed on the axis. For this, drag the Employee field to the Category field well and all the qualities to the Value field well.

Category as axis with color (UC3 tab from the dataset)

We can visualize the same use case with a different data structure, where all the qualities and employees are defined as a dimension and scores as values.

To achieve this use case, drag the field that you want to visualize as the axis to the Category field and individual series to the Color field. In our case, we chose Qualities as our axis, added Score to the Value field well, and visualized the values for each employee by adding Employee to the Color field well.

Styling radar charts

You can customize your radar charts with the following formatting options:

  • Series style – You can choose to display the chart as either a line (default) or area series

  • Start angle – By default, this is set to 90 degrees, but you can choose a different angle if you want to rotate the radar chart to better utilize the available real estate

  • Fill area – This option applies odd/even coloring for the plot area

  • Grid shape – Choose between circle or polygon for grid shape

Summary

In this post, we looked at how radar charts can help you visualize and compare items across different variables. We also learned about the different configurations supported by radar charts and styling options to help you customize its look and feel.

We encourage you to explore radar charts and leave a comment with your feedback.


About the author

Bhupinder Chadha is a senior product manager for Amazon QuickSight focused on visualization and front end experiences. He is passionate about BI, data visualization and low-code/no-code experiences. Prior to QuickSight he was the lead product manager for Inforiver, responsible for building a enterprise BI product from ground up. Bhupinder started his career in presales, followed by a small gig in consulting and then PM for xViz, an add on visualization product.

Advanced reporting and analytics for the Post Call Analytics (PCA) solution with Amazon QuickSight

Post Syndicated from Ankur Taunk original https://aws.amazon.com/blogs/big-data/advance-reporting-and-analytics-for-the-post-call-analytics-pca-solution-with-amazon-quicksight/

Organizations with contact centers benefit from advanced analytics on their call recordings to gain important product feedback, improve contact center efficiency, and identify coaching opportunities for their staff. The Post Call Analytics (PCA) solution uses AWS machine learning (ML) services like Amazon Transcribe and Amazon Comprehend to extract insights from contact center call audio recordings uploaded after the call, or from integration with our companion Live Call Analytics (LCA) solution. You can visualize the PCA insights in the business intelligence (BI) tool Amazon QuickSight for advanced analysis.

In this post, we show you how to use PCA’s data to build automated QuickSight dashboards for advanced analytics to assist in quality assurance (QA) and quality management (QM) processes. We provide an AWS CloudFormation template and step-by-step instructions, allowing you to get started with our sample dashboard in just a few simple steps.

Sample dashboard overview

The following screenshots illustrate the different components of our sample QuickSight dashboard:

  • Summary tab – This view aggregates call statistics across data points such as average customer sentiments and average agent talk duration, along with detailed call records. Graphs like “Who Talks More?” show customer sentiment distribution based on speaker talk time. You can apply data, agent, call duration, and language filters for targeted search. The graphical and tabular views help accurately analyze the data.
    quicksight dashboard summary tab
  • Sentiment tab – This view shows sentiment distribution across multiple parameters, such as the impact of agent sentiment on customer experience. In a graphical and tabular view, you see the customer and agent sentiment score correlation. The lowest sentiment score indicates coaching opportunity for agents. You can apply data and agent filters for targeted search.
    quicksight dashboard sentiment tab
  • Categories tab – This tab shows the aggregated sentiment, talk time, and non-talk time per speaker-turn in your call recordings. You can analyze the data based on category along with date and agent filter. You can get an insight into how agent speaking duration affects the customer sentiment score. The graphical and tabular views help accurately analyze the data.
    quicksight dashboard categories tab
  • Custom Entities tab – Similar to category, you can see the breakdown across custom entities. You can apply date, agent, and custom entity filters for targeted search.
    quicksight dashboard custom enteties tab
  • Issues, Actions, Outcome tab – This view shows aggregated sentiment, talk time, and non-talk time per speaker-turn in your call recordings. You can analyze the data based on issue, action, and outcome for a custom phrase along with date, category, and agent filters
    quicksight dashboard issue outcome actiontab

Solution overview

The solution uses the following AWS services and features:

The following architecture diagram shows how our solution uses PCA insights from a call recording in an S3 bucket to enable analytics in QuickSight.

Architecture diagram

As part of the solution workflow, EventBridge receives an event for each PCA solution analysis output file. Kinesis Data Firehose uses Lambda to perform data transformation and compression, storing the file in a compressed columnar format (Parquet) in the target S3 bucket. The AWS Glue Data Catalog has the table definitions for the data sources. Athena runs queries using a variety of SQL statements on the compressed Parquet files, and QuickSight is used for visualization. To optimize query performance, we use Athena partition projections. This feature automatically creates date-based partitions for query performance and cost optimization.

This is a loosely coupled architecture, with flexibility to ingest data from third-party data sources, enrich the data by adding more data points, and cross-reference data across data sources for your analytics use case. Lambda functions can integrate with third-party data sources to process and store the compressed output in Amazon S3 using Kinesis Data Firehose. Athena lets you create views by cross-referencing the data across multiple tables.

Prerequisites:

You should have the following prerequisites:

  • You need an active AWS account with the permission to create and modify IAM roles
  • The PCA solution must be already deployed in the same AWS account and Region that you will use for the dashboards
  • QuickSight and AWS CloudFormation need to be in the same Region.

Note that this solution uses QuickSight SPICE storage.

Deploy resources with AWS CloudFormation

To deploy the solution, complete the following steps:

  1. Sign in to the AWS Management Console in your preferred Region.
  2. Create a QuickSight account (skip this step if you already have a QuickSight account):
    1. Navigate to the QuickSight service from the console.
    2. Choose Sign up for QuickSight.
    3. Select the edition.
    4. Enter your account name and notification email address.
  3. Navigate to the PCA solution CloudFormation stack and on the Outputs tab, note the value for the key OutputBucket.
  4. Allow QuickSight access to auto-discover Athena and the S3 output bucket (ref. step 3) with Write permission for Athena Workgroup enabled, then choose Finish.
    quicksight permissions
  5. Enable EventBridge events for the PCA OutputBucket:
    1. Open the PCA OutputBucket (ref. step 3) on the Amazon S3 console.
    2. Choose Properties, scroll to Amazon EventBridge, and choose Enable
  6. Use the following Launch Stack button to deploy the PCA Analytics solution in your preferred Region:
    Launch Stack
  7. Enter a unique stack name if you want to change the default name (pca-quicksight-analytics).
  8. For PcaOutputBucket, enter the value of OutputBucket. (ref. step 3)
  9. For PcaWebAppHostAddress, enter the hostname part of the WebAppUrl output from your PCA stack.
  10. Use the default values for other parameters or update if required.
  11. Choose Next.
    Cloud Formation template screenshot
  12. Select the acknowledgement check box and choose Create stack.
  13. When the CloudFormation stack creation is complete, on the QuickSight console, choose the user icon (top right) to open the menu, and choose Manage QuickSight.
  14. On the admin page, choose Manage assets, then choose Dashboards.
  15. Select <Stack Name>-PCA-Dashboard and choose Share.
  16. Optionally, to customize the dashboard further, share <Stack Name>-PCA-Analysis under Asset type analyses and <Stack Name>-PCA-* under Datasets.
  17. Enter the QuickSight user or group and choose Share again.

Explore the dashboard with demo data

After you deploy the solution, you can explore the dashboards by loading demo data.

  1. Download the demo PCA files.
  2. Unzip and upload the demo PCA files in the OutputBucket bucket in the /parsedFiles/ folder.

Note that this step is optional. We recommend using a non-production environment or stack to keep production and demo data segregated.

Load historical PCA data

Once deployed, the solution processes new PCA data as it is added. To process older PCA data, complete the following steps:

  1. Open the PCA OutputBucket on the Amazon S3 console.
  2. Select all the content under the /parsedFiles/ folder.
  3. Choose Action and copy the files to the same location.

This triggers an EventBridge rule to process the historical PCA files and stream the data to the QuickSight dashboard.

Validate the data

After you generate the PCA output data (within a few minutes), a compressed Parquet PCA data file will appear in the PCA OutputBucket under pca-output-base.

  1. On the Athena console, open the query editor and choose the pca database. You should see the pca_output table under Tables and views.
  2. Choose the options menu next to the pca_output table and choose Preview Table.
    athena table screenshot
  3. Run your query and review the results.
    athena query result set

Navigating the dashboard controls

  • Sliders under the date-based visuals can adjust the date range.
  • You can choose the segments in the visuals to drill down further. QuickSight uses the selected segment as a criterion to filter the data on the current page. To cancel this filtering, choose the same segment again.
  • The bottom of each page shows grid visuals for detailed analysis.
  • Similar to other visuals, you can export grid visual data to CSV and Excel from the menu at the right-top corner of the pane.
  • In the grid visual, choose the ID value of each call record to go to the PCA portal to view details of this record.
  • You can use filters to specify your criteria. For example, adjust FromDate and ToDate to view older data or a custom time frame.

Clean up

To remove the resources created by this stack, perform the following steps:

  1. Delete the CloudFormation stack.
  2. If you uploaded demo PCA files into your non-production PCA deployment, remove them from the PCA OutputBucket bucket under /parsedFiles/.
  3. Delete the pca-output-base folder under the PCA output bucket.

Conclusion

In this post, you learned how to visualize PCA solution data, using a CloudFormation template to automate the QuickSight dashboard creation. You also learned to how to visualize historical PCA data in QuickSight.

The sample PCA QuickSight dashboard application is provided as open source—use it as a starting point for your own solution, and help us make it better by contributing back fixes and features via GitHub pull requests. For expert assistance, AWS Professional Services and other AWS Partners are here to help.


About the Authors

Mehmet Demir is a Senior Solutions Architect at Amazon Web Services (AWS) based in Toronto, Canada. He helps customers in building well-architected solutions that support business innovation.

Ankur Taunk is a Senior Specialist Solutions Architect at AWS. He helps customer achieve their desired business outcomes in the Contact Center space leveraging Amazon Connect.

Diligent enhances customer governance with automated data-driven insights using Amazon QuickSight

Post Syndicated from Vidya Kotamraju original https://aws.amazon.com/blogs/big-data/diligent-enhances-customer-governance-with-automated-data-driven-insights-using-amazon-quicksight/

This post is co-written with Vidya Kotamraju and Tallis Hobbs, from Diligent.

Diligent is the global leader in modern governance, providing software as a service (SaaS) services across governance, risk, compliance, and audit, helping companies meet their environmental, social, and governance (ESG) commitments. Serving more than 1 million users from over 25,000 customers around the world, we empower transformational leaders with software, insights, and confidence to drive greater impact and lead with purpose.

We provide the right governance technology that empowers our customers to act strategically while maintaining compliance, mitigating risk, and driving efficiency. With the Diligent Platform, organizations can bring their most critical data into one centralized place. By using powerful analytics, automation, and unparalleled industry data, our customers’ board and c-suite get relevant insights from across risk, compliance, audit, and ESG teams that help them make better decisions, faster and more securely.

One of the biggest obstacles that customers face is obtaining a holistic view of their data. To effectively manage risks and ensure compliance, organizations need to have a comprehensive understanding of their operations and processes. However, this can be difficult to achieve. Scenarios such as data being dispersed across multiple systems and departments, or if data is not consistently collected and updated, or if data is not in a format that can be easily analyzed can all present various challenges. To address them, we turned to Amazon QuickSight to enhance our customer-facing products with embedded insights and reports.

In this post, we cover what we were looking for in a business intelligence (BI) tool, and how QuickSight met our requirements.

Narrowing down the competition

To effectively serve our customers, we needed a platform-wide reporting solution that would enable our users to centralize their governance, risk, and compliance (GRC) programs, and collect information from disparate data sources, while allowing for integrated automation and analytics for data-driven insights, thereby providing a curated picture of GRC with confidence.

When we started our research into various BI tool offerings to embed into our platform, we narrowed the list down to a handful that had most of the capabilities we were looking for. After reviewing the options, QuickSight was our top option when it came to the ease of integration with our existing AWS-built ecosystem. QuickSight offered everything we needed, with the flexibility we wanted, at an affordable price.

Why we chose QuickSight

There are many data points that can be useful for making business decisions; the specific data points that are most critical will depend on the nature of the business and the decisions being made. However, there are some common types of data that are often important for making informed business decisions: financial data, marketing data, operational data, and customer data.

Translating those requirements into BI tool functionality, we were looking for:

  • A seamless way to obtain a holistic and unified view of data
  • The ability to handle substantial amounts (over 100 TB) of data
  • Enough flexibility to support the changing needs of our solution as we grow
  • Great value for the price

QuickSight checked all the boxes on our list. The most compelling reasons why we ultimately chose QuickSight were:

  • Visualization and reporting capabilities – QuickSight offers a wide range of visualization options and allows creation of custom reports and dashboards
  • Data sources – QuickSight supports a wide variety of data sources, making connection and analysis easy
  • Ease of integration – QuickSight fit seamlessly with our existing AWS technology stack with a price that fits our budget

Comprehensive, personalized, customer-facing reporting platform

Today, we’re using Quicksight to create a customer-facing reporting platform that allows our customers to report on their data within our ecosystem. QuickSight helps empower our customers by putting the reporting tools and capability in their hands, allowing them to get a comprehensive, personalized (via row-level security) view of data, unique to their workflow.

The following screenshot shows an example of our Issues & Actions dashboard, designed for risk managers and audit managers, showing various issues in need of attention.

QuickSight has provided a way to enable our customers to bring data and intelligence to the board or leadership teams in a simple, more streamlined way that saves time and effort—by automating standard reporting and surfacing it in a rich and interactive dashboard for directors. Boards and leaders will have access to curated insights, culled from both internal operations and external sources, integrated into the Diligent Boards platform—visualized in such a way that their data tells the story that accompanies the board materials.

For us, the most compelling benefit of using QuickSight is the ease of integration with Diligent’s existing tech stack and data stack. Quicksight integrates seamlessly with other AWS products in our technology stack, making it easy to incorporate data from various sources and systems into our dashboards and reports.

QuickSight was the perfect fit

Our customers love the flexibility with reporting. Quicksight provides a range of visualization options that allows users to customize their dashboards and reports to fit their specific needs and preferences. We love that the QuickSight team is open to taking prompt action on customer feedback. Their continuous and frequent feature release process is confidence-inspiring.

QuickSight helps us provide flexibility to our customers, enabling them to quickly put the right data in front of the right audience to make the right business decisions.

To learn more, visit Amazon QuickSight.


About the Authors

Vidya Kotamraju is a Product Management Leader at Diligent, with close to 2 decades of experience leading award-winning B2B, B2C product and team success across multiple industries and geographies. Currently, she is focused on Diligent Highbond’s Data Automation Solutions.

Tallis Hobbs is a Senior Software Engineer at Diligent. As a previous educator, he brings a unique skill set to the engineering space. He is passionate about the AWS serverless space and currently works on Diligent’s client facing Quicksight integration.

Samit Kumbhani is a Sr. Solutions Architect at AWS based out of New York City area. Has has 18+ years of experience in building applications and focuses on Analytics, Business Intelligence and Databases. He enjoys working with customers to understand their challenges and solve them by creating innovative solutions using AWS services. Outside of work, Samit loves playing cricket, traveling and spending time with his family and friends.