Tag Archives: AWS Glue

Create, train, and deploy Amazon Redshift ML model integrating features from Amazon SageMaker Feature Store

Post Syndicated from Anirban Sinha original https://aws.amazon.com/blogs/big-data/create-train-and-deploy-amazon-redshift-ml-model-integrating-features-from-amazon-sagemaker-feature-store/

Amazon Redshift is a fast, petabyte-scale, cloud data warehouse that tens of thousands of customers rely on to power their analytics workloads. Data analysts and database developers want to use this data to train machine learning (ML) models, which can then be used to generate insights on new data for use cases such as forecasting revenue, predicting customer churn, and detecting anomalies. Amazon Redshift ML makes it easy for SQL users to create, train, and deploy ML models using SQL commands familiar to many roles such as executives, business analysts, and data analysts. We covered in a previous post how you can use data in Amazon Redshift to train models in Amazon SageMaker, a fully managed ML service, and then make predictions within your Redshift data warehouse.

Redshift ML currently supports ML algorithms such as XGBoost, multilayer perceptron (MLP), KMEANS, and Linear Learner. Additionally, you can import existing SageMaker models into Amazon Redshift for in-database inference or remotely invoke a SageMaker endpoint.

Amazon SageMaker Feature Store is a fully managed, purpose-built repository to store, share, and manage features for ML models. However, one challenge in training a production-ready ML model using SageMaker Feature Store is access to a diverse set of features that aren’t always owned and maintained by the team that is building the model. For example, an ML model to identify fraudulent financial transactions needs access to both identifying (device type, browser) and transaction (amount, credit or debit, and so on) related features. As a data scientist building an ML model, you may have access to the identifying information but not the transaction information, and having access to a feature store solves this.

In this post, we discuss the combined feature store pattern, which allows teams to maintain their own local feature stores using a local Redshift table while still being able to access shared features from the centralized feature store. In a local feature store, you can store sensitive data that can’t be shared across the organization for regulatory and compliance reasons.

We also show you how to use familiar SQL statements to create and train ML models by combining shared features from the centralized store with local features and use these models to make in-database predictions on new data for use cases such as fraud risk scoring.

Overview of solution

For this post, we create an ML model to predict if a transaction is fraudulent or not, given the transaction record. To build this, we need to engineer features that describe an individual credit card’s spending pattern, such as the number of transactions or the average transaction amount, and also information about the merchant, the cardholder, the device used to make the payment, and any other data that may be relevant to detecting fraud.

To get started, we need an Amazon Redshift Serverless data warehouse with the Redshift ML feature enabled and an Amazon SageMaker Studio environment with access to SageMaker Feature Store. For an introduction to Redshift ML and instructions on setting it up, see Create, train, and deploy machine learning models in Amazon Redshift using SQL with Amazon Redshift ML.

We also need an offline feature store to store features in feature groups. The offline store uses an Amazon Simple Storage Service (Amazon S3) bucket for storage and can also fetch data using Amazon Athena queries. For an introduction to SageMaker Feature Store and instructions on setting it up, see Getting started with Amazon SageMaker Feature Store.

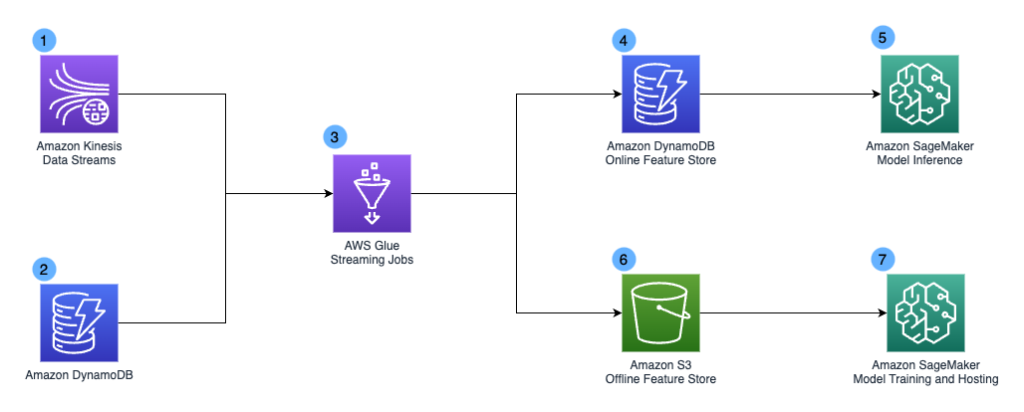
The following diagram illustrates solution architecture.

The workflow contains the following steps:

  1. Create the offline feature group in SageMaker Feature Store and ingest data into the feature group.
  2. Create a Redshift table and load local feature data into the table.
  3. Create an external schema for Amazon Redshift Spectrum to access the offline store data stored in Amazon S3 using the AWS Glue Data Catalog.
  4. Train and validate a fraud risk scoring ML model using local feature data and external offline feature store data.
  5. Use the offline feature store and local store for inference.

Dataset

To demonstrate this use case, we use a synthetic dataset with two tables: identity and transactions. They can both be joined by the TransactionID column. The transaction table contains information about a particular transaction, such as amount, credit or debit card, and so on, and the identity table contains information about the user, such as device type and browser. The transaction must exist in the transaction table, but might not always be available in the identity table.

The following is an example of the transactions dataset.

The following is an example of the identity dataset.

Let’s assume that across the organization, data science teams centrally manage the identity data and process it to extract features in a centralized offline feature store. The data warehouse team ingests and analyzes transaction data in a Redshift table, owned by them.

We work through this use case to understand how the data warehouse team can securely retrieve the latest features from the identity feature group and join it with transaction data in Amazon Redshift to create a feature set for training and inferencing a fraud detection model.

Create the offline feature group and ingest data

To start, we set up SageMaker Feature Store, create a feature group for the identity dataset, inspect and process the dataset, and ingest some sample data. We then prepare the transaction features from the transaction data and store it in Amazon S3 for further loading into the Redshift table.

Alternatively, you can author features using Amazon SageMaker Data Wrangler, create feature groups in SageMaker Feature Store, and ingest features in batches using an Amazon SageMaker Processing job with a notebook exported from SageMaker Data Wrangler. This mode allows for batch ingestion into the offline store.

Let’s explore some of the key steps in this section.

  1. Download the sample notebook.
  2. On the SageMaker console, under Notebook in the navigation pane, choose Notebook instances.
  3. Locate your notebook instance and choose Open Jupyter.
  4. Choose Upload and upload the notebook you just downloaded.
  5. Open the notebook sagemaker_featurestore_fraud_redshiftml_python_sdk.ipynb.
  6. Follow the instructions and run all the cells up to the Cleanup Resources section.

The following are key steps from the notebook:

  1. We create a Pandas DataFrame with the initial CSV data. We apply feature transformations for this dataset.
    identity_data = pd.read_csv(io.BytesIO(identity_data_object["Body"].read()))
    transaction_data = pd.read_csv(io.BytesIO(transaction_data_object["Body"].read()))
    
    identity_data = identity_data.round(5)
    transaction_data = transaction_data.round(5)
    
    identity_data = identity_data.fillna(0)
    transaction_data = transaction_data.fillna(0)
    
    # Feature transformations for this dataset are applied 
    # One hot encode card4, card6
    encoded_card_bank = pd.get_dummies(transaction_data["card4"], prefix="card_bank")
    encoded_card_type = pd.get_dummies(transaction_data["card6"], prefix="card_type")
    
    transformed_transaction_data = pd.concat(
        [transaction_data, encoded_card_type, encoded_card_bank], axis=1
    )

  2. We store the processed and transformed transaction dataset in an S3 bucket. This transaction data will be loaded later in the Redshift table for building the local feature store.
    transformed_transaction_data.to_csv("transformed_transaction_data.csv", header=False, index=False)
    s3_client.upload_file("transformed_transaction_data.csv", default_s3_bucket_name, prefix + "/training_input/transformed_transaction_data.csv")

  3. Next, we need a record identifier name and an event time feature name. In our fraud detection example, the column of interest is TransactionID.EventTime can be appended to your data when no timestamp is available. In the following code, you can see how these variables are set, and then EventTime is appended to both features’ data.
    # record identifier and event time feature names
    record_identifier_feature_name = "TransactionID"
    event_time_feature_name = "EventTime"
    
    # append EventTime feature
    identity_data[event_time_feature_name] = pd.Series(
        [current_time_sec] * len(identity_data), dtype="float64"
    )

  4. We then create and ingest the data into the feature group using the SageMaker SDK FeatureGroup.ingest API. This is a small dataset and therefore can be loaded into a Pandas DataFrame. When we work with large amounts of data and millions of rows, there are other scalable mechanisms to ingest data into SageMaker Feature Store, such as batch ingestion with Apache Spark.
    identity_feature_group.create(
        s3_uri=<S3_Path_Feature_Store>,
        record_identifier_name=record_identifier_feature_name,
        event_time_feature_name=event_time_feature_name,
        role_arn=<role_arn>,
        enable_online_store=False,
    )
    
    identity_feature_group_name = "identity-feature-group"
    
    # load feature definitions to the feature group. SageMaker FeatureStore Python SDK will auto-detect the data schema based on input data.
    identity_feature_group.load_feature_definitions(data_frame=identity_data)
    identity_feature_group.ingest(data_frame=identity_data, max_workers=3, wait=True)
    

  5. We can verify that data has been ingested into the feature group by running Athena queries in the notebook or running queries on the Athena console.

At this point, the identity feature group is created in an offline feature store with historical data persisted in Amazon S3. SageMaker Feature Store automatically creates an AWS Glue Data Catalog for the offline store, which enables us to run SQL queries against the offline data using Athena or Redshift Spectrum.

Create a Redshift table and load local feature data

To build a Redshift ML model, we build a training dataset joining the identity data and transaction data using SQL queries. The identity data is in a centralized feature store where the historical set of records are persisted in Amazon S3. The transaction data is a local feature for training data that needs to made available in the Redshift table.

Let’s explore how to create the schema and load the processed transaction data from Amazon S3 into a Redshift table.

  1. Create the customer_transaction table and load daily transaction data into the table, which you’ll use to train the ML model:
    DROP TABLE customer_transaction;
    CREATE TABLE customer_transaction (
      TransactionID INT,    
      isFraud INT,  
      TransactionDT INT,    
      TransactionAmt decimal(10,2), 
      card1 INT,    
      card2 decimal(10,2),card3 decimal(10,2),  
      card4 VARCHAR(20),card5 decimal(10,2),    
      card6 VARCHAR(20),    
      B1 INT,B2 INT,B3 INT,B4 INT,B5 INT,B6 INT,
      B7 INT,B8 INT,B9 INT,B10 INT,B11 INT,B12 INT,
      F1 INT,F2 INT,F3 INT,F4 INT,F5 INT,F6 INT,
      F7 INT,F8 INT,F9 INT,F10 INT,F11 INT,F12 INT,
      F13 INT,F14 INT,F15 INT,F16 INT,F17 INT,  
      N1 VARCHAR(20),N2 VARCHAR(20),N3 VARCHAR(20), 
      N4 VARCHAR(20),N5 VARCHAR(20),N6 VARCHAR(20), 
      N7 VARCHAR(20),N8 VARCHAR(20),N9 VARCHAR(20), 
      card_type_0  boolean,
      card_type_credit boolean,
      card_type_debit  boolean,
      card_bank_0  boolean,
      card_bank_american_express boolean,
      card_bank_discover  boolean,
      card_bank_mastercard  boolean,
      card_bank_visa boolean  
    );

  2. Load the sample data by using the following command. Replace your Region and S3 path as appropriate. You will find the S3 path in the S3 Bucket Setup For The OfflineStore section in the notebook or by checking the dataset_uri_prefix in the notebook.
    COPY customer_transaction
    FROM '<s3path>/transformed_transaction_data.csv' 
    IAM_ROLE default delimiter ',' 
    region 'your-region';

Now that we have created a local feature store for the transaction data, we focus on integrating a centralized feature store with Amazon Redshift to access the identity data.

Create an external schema for Redshift Spectrum to access the offline store data

We have created a centralized feature store for identity features, and we can access this offline feature store using services such as Redshift Spectrum. When the identity data is available through the Redshift Spectrum table, we can create a training dataset with feature values from the identity feature group and customer_transaction, joining on the TransactionId column.

This section provides an overview of how to enable Redshift Spectrum to query data directly from files on Amazon S3 through an external database in an AWS Glue Data Catalog.

  1. First, check that the identity-feature-group table is present in the Data Catalog under the sagemamker_featurestore database.
  2. Using Redshift Query Editor V2, create an external schema using the following command:
    CREATE EXTERNAL SCHEMA sagemaker_featurestore
    FROM DATA CATALOG
    DATABASE 'sagemaker_featurestore'
    IAM_ROLE default
    create external database if not exists;

All the tables, including identity-feature-group external tables, are visible under the sagemaker_featurestore external schema. In Redshift Query Editor v2, you can check the contents of the external schema.

  1. Run the following query to sample a few records—note that your table name may be different:
    Select * from sagemaker_featurestore.identity_feature_group_1680208535 limit 10;

  2. Create a view to join the latest data from identity-feature-group and customer_transaction on the TransactionId column. Be sure to change the external table name to match your external table name:
    create or replace view public.credit_fraud_detection_v
    AS select  "isfraud",
            "transactiondt",
            "transactionamt",
            "card1","card2","card3","card5",
             case when "card_type_credit" = 'False' then 0 else 1 end as card_type_credit,
             case when "card_type_debit" = 'False' then 0 else 1 end as card_type_debit,
             case when "card_bank_american_express" = 'False' then 0 else 1 end as card_bank_american_express,
             case when "card_bank_discover" = 'False' then 0 else 1 end as card_bank_discover,
             case when "card_bank_mastercard" = 'False' then 0 else 1 end as card_bank_mastercard,
             case when "card_bank_visa" = 'False' then 0 else 1 end as card_bank_visa,
            "id_01","id_02","id_03","id_04","id_05"
    from public.customer_transaction ct left join sagemaker_featurestore.identity_feature_group_1680208535 id
    on id.transactionid = ct.transactionid with no schema binding;

Train and validate the fraud risk scoring ML model

Redshift ML gives you the flexibility to specify your own algorithms and model types and also to provide your own advanced parameters, which can include preprocessors, problem type, and hyperparameters. In this post, we create a customer model by specifying AUTO OFF and the model type of XGBOOST. By turning AUTO OFF and using XGBoost, we are providing the necessary inputs for SageMaker to train the model. A benefit of this can be faster training times. XGBoost is as open-source version of the gradient boosted trees algorithm. For more details on XGBoost, refer to Build XGBoost models with Amazon Redshift ML.

We train the model using 80% of the dataset by filtering on transactiondt < 12517618. The other 20% will be used for inference. A centralized feature store is useful in providing the latest supplementing data for training requests. Note that you will need to provide an S3 bucket name in the create model statement. It will take approximately 10 minutes to create the model.

CREATE MODEL frauddetection_xgboost
FROM (select  "isfraud",
        "transactiondt",
        "transactionamt",
        "card1","card2","card3","card5",
        "card_type_credit",
        "card_type_debit",
        "card_bank_american_express",
        "card_bank_discover",
        "card_bank_mastercard",
        "card_bank_visa",
        "id_01","id_02","id_03","id_04","id_05"
from credit_fraud_detection_v where transactiondt < 12517618
)
TARGET isfraud
FUNCTION ml_fn_frauddetection_xgboost
IAM_ROLE default
AUTO OFF
MODEL_TYPE XGBOOST
OBJECTIVE 'binary:logistic'
PREPROCESSORS 'none'
HYPERPARAMETERS DEFAULT EXCEPT(NUM_ROUND '100')
SETTINGS (S3_BUCKET <s3_bucket>);

When you run the create model command, it will complete quickly in Amazon Redshift while the model training is happening in the background using SageMaker. You can check the status of the model by running a show model command:

show model frauddetection_xgboost;

The output of the show model command shows that the model state is TRAINING. It also shows other information such as the model type and the training job name that SageMaker assigned.
After a few minutes, we run the show model command again:

show model frauddetection_xgboost;

Now the output shows the model state is READY. We can also see the train:error score here, which at 0 tells us we have a good model. Now that the model is trained, we can use it for running inference queries.

Use the offline feature store and local store for inference

We can use the SQL function to apply the ML model to data in queries, reports, and dashboards. Let’s use the function ml_fn_frauddetection_xgboost created by our model against our test dataset by filtering where transactiondt >=12517618, to predict whether a transaction is fraudulent or not. SageMaker Feature Store can be useful in supplementing data for inference requests.

Run the following query to predict whether transactions are fraudulent or not:

select  "isfraud" as "Actual",
        ml_fn_frauddetection_xgboost(
        "transactiondt",
        "transactionamt",
        "card1","card2","card3","card5",
        "card_type_credit",
        "card_type_debit",
        "card_bank_american_express",
        "card_bank_discover",
        "card_bank_mastercard",
        "card_bank_visa",
        "id_01","id_02","id_03","id_04","id_05") as "Predicted"
from credit_fraud_detection_v where transactiondt >= 12517618;

For binary and multi-class classification problems, we compute the accuracy as the model metric. Accuracy can be calculated based on the following:

accuracy = (sum (actual == predicted)/total) *100

Let’s apply the preceding code to our use case to find the accuracy of the model. We use the test data (transactiondt >= 12517618) to test the accuracy, and use the newly created function ml_fn_frauddetection_xgboost to predict and take the columns other than the target and label as the input:

-- check accuracy 
WITH infer_data AS (
SELECT "isfraud" AS label,
ml_fn_frauddetection_xgboost(
        "transactiondt",
        "transactionamt",
        "card1","card2","card3","card5",
        "card_type_credit",
        "card_type_debit",
        "card_bank_american_express",
        "card_bank_discover",
        "card_bank_mastercard",
        "card_bank_visa",
        "id_01","id_02","id_03","id_04","id_05") AS predicted,
CASE 
   WHEN label IS NULL
       THEN 0
   ELSE label
   END AS actual,
CASE 
   WHEN actual = predicted
       THEN 1::INT
   ELSE 0::INT
   END AS correct
FROM credit_fraud_detection_v where transactiondt >= 12517618),
aggr_data AS (
SELECT SUM(correct) AS num_correct,
COUNT(*) AS total
FROM infer_data) 

SELECT (num_correct::FLOAT / total::FLOAT) AS accuracy FROM aggr_data;

Clean up

As a final step, clean up the resources:

  1. Delete the Redshift cluster.
  2. Run the Cleanup Resources section of your notebook.

Conclusion

Redshift ML enables you to bring machine learning to your data, powering fast and informed decision-making. SageMaker Feature Store provides a purpose-built feature management solution to help organizations scale ML development across business units and data science teams.

In this post, we showed how you can train an XGBoost model using Redshift ML with data spread across SageMaker Feature Store and a Redshift table. Additionally, we showed how you can make inferences on a trained model to detect fraud using Amazon Redshift SQL commands.


About the authors

Anirban Sinha is a Senior Technical Account Manager at AWS. He is passionate about building scalable data warehouses and big data solutions working closely with customers. He works with large ISVs customers, in helping them build and operate secure, resilient, scalable, and high-performance SaaS applications in the cloud.

Phil Bates is a Senior Analytics Specialist Solutions Architect at AWS. He has more than 25 years of experience implementing large-scale data warehouse solutions. He is passionate about helping customers through their cloud journey and using the power of ML within their data warehouse.

Gaurav Singh is a Senior Solutions Architect at AWS, specializing in AI/ML and Generative AI. Based in Pune, India, he focuses on helping customers build, deploy, and migrate ML production workloads to SageMaker at scale. In his spare time, Gaurav loves to explore nature, read, and run.

Unstructured data management and governance using AWS AI/ML and analytics services

Post Syndicated from Sakti Mishra original https://aws.amazon.com/blogs/big-data/unstructured-data-management-and-governance-using-aws-ai-ml-and-analytics-services/

Unstructured data is information that doesn’t conform to a predefined schema or isn’t organized according to a preset data model. Unstructured information may have a little or a lot of structure but in ways that are unexpected or inconsistent. Text, images, audio, and videos are common examples of unstructured data. Most companies produce and consume unstructured data such as documents, emails, web pages, engagement center phone calls, and social media. By some estimates, unstructured data can make up to 80–90% of all new enterprise data and is growing many times faster than structured data. After decades of digitizing everything in your enterprise, you may have an enormous amount of data, but with dormant value. However, with the help of AI and machine learning (ML), new software tools are now available to unearth the value of unstructured data.

In this post, we discuss how AWS can help you successfully address the challenges of extracting insights from unstructured data. We discuss various design patterns and architectures for extracting and cataloging valuable insights from unstructured data using AWS. Additionally, we show how to use AWS AI/ML services for analyzing unstructured data.

Why it’s challenging to process and manage unstructured data

Unstructured data makes up a large proportion of the data in the enterprise that can’t be stored in a traditional relational database management systems (RDBMS). Understanding the data, categorizing it, storing it, and extracting insights from it can be challenging. In addition, identifying incremental changes requires specialized patterns and detecting sensitive data and meeting compliance requirements calls for sophisticated functions. It can be difficult to integrate unstructured data with structured data from existing information systems. Some view structured and unstructured data as apples and oranges, instead of being complementary. But most important of all, the assumed dormant value in the unstructured data is a question mark, which can only be answered after these sophisticated techniques have been applied. Therefore, there is a need to being able to analyze and extract value from the data economically and flexibly.

Solution overview

Data and metadata discovery is one of the primary requirements in data analytics, where data consumers explore what data is available and in what format, and then consume or query it for analysis. If you can apply a schema on top of the dataset, then it’s straightforward to query because you can load the data into a database or impose a virtual table schema for querying. But in the case of unstructured data, metadata discovery is challenging because the raw data isn’t easily readable.

You can integrate different technologies or tools to build a solution. In this post, we explain how to integrate different AWS services to provide an end-to-end solution that includes data extraction, management, and governance.

The solution integrates data in three tiers. The first is the raw input data that gets ingested by source systems, the second is the output data that gets extracted from input data using AI, and the third is the metadata layer that maintains a relationship between them for data discovery.

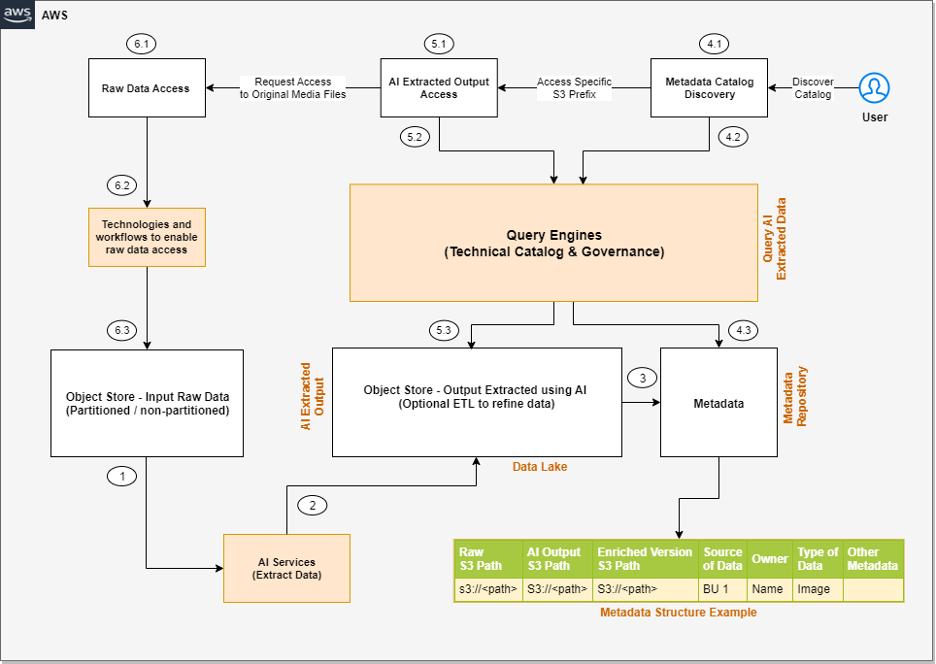
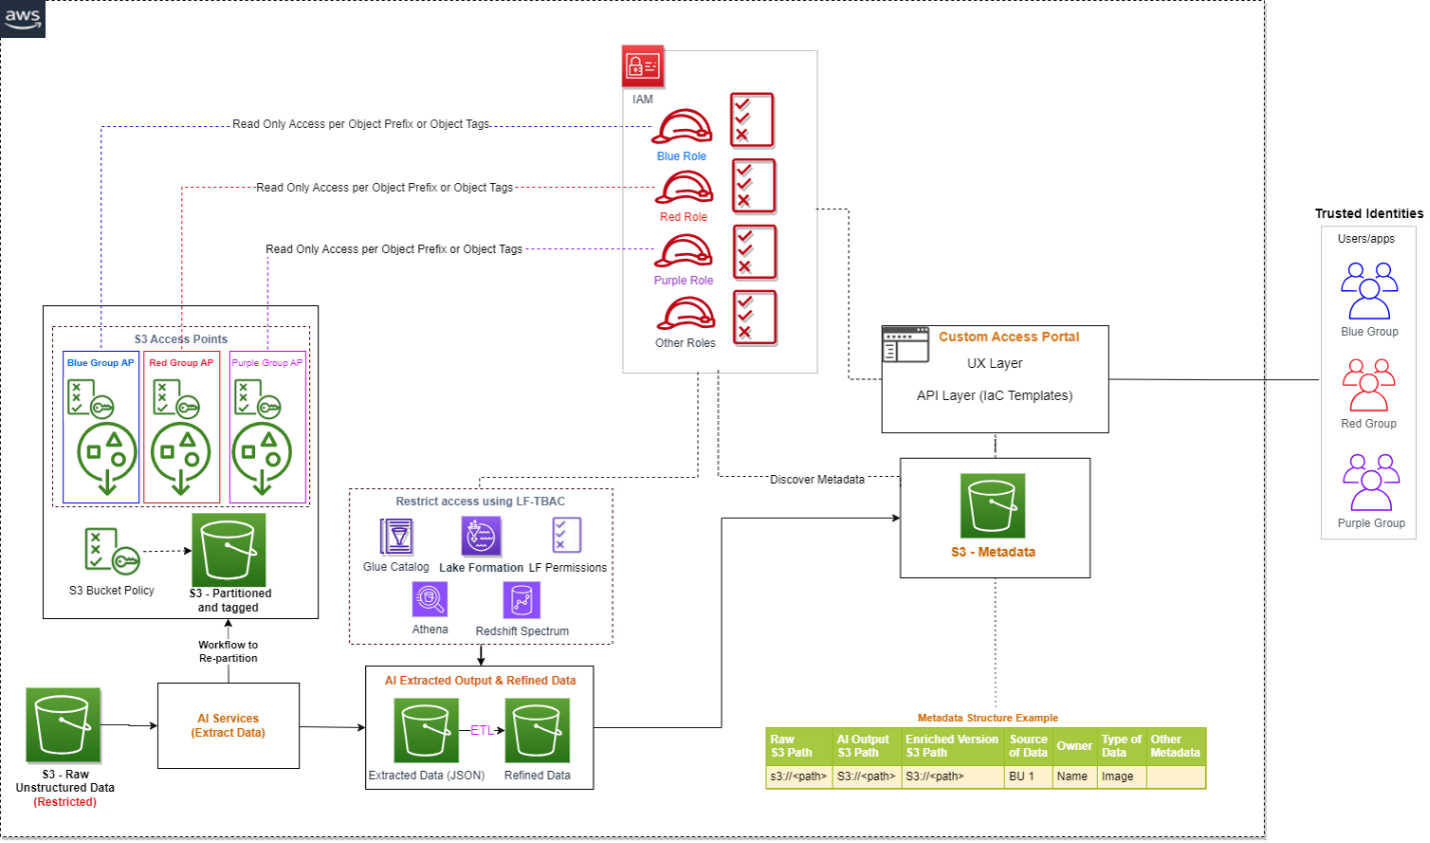
The following is a high-level architecture of the solution we can build to process the unstructured data, assuming the input data is being ingested to the raw input object store.

Unstructured Data Management - Block Level Architecture Diagram

The steps of the workflow are as follows:

  1. Integrated AI services extract data from the unstructured data.
  2. These services write the output to a data lake.
  3. A metadata layer helps build the relationship between the raw data and AI extracted output. When the data and metadata are available for end-users, we can break the user access pattern into additional steps.
  4. In the metadata catalog discovery step, we can use query engines to access the metadata for discovery and apply filters as per our analytics needs. Then we move to the next stage of accessing the actual data extracted from the raw unstructured data.
  5. The end-user accesses the output of the AI services and uses the query engines to query the structured data available in the data lake. We can optionally integrate additional tools that help control access and provide governance.
  6. There might be scenarios where, after accessing the AI extracted output, the end-user wants to access the original raw object (such as media files) for further analysis. Additionally, we need to make sure we have access control policies so the end-user has access only to the respective raw data they want to access.

Now that we understand the high-level architecture, let’s discuss what AWS services we can integrate in each step of the architecture to provide an end-to-end solution.

The following diagram is the enhanced version of our solution architecture, where we have integrated AWS services.

Unstructured Data Management - AWS Native Architecture

Let’s understand how these AWS services are integrated in detail. We have divided the steps into two broad user flows: data processing and metadata enrichment (Steps 1–3) and end-users accessing the data and metadata with fine-grained access control (Steps 4–6).

  1. Various AI services (which we discuss in the next section) extract data from the unstructured datasets.
  2. The output is written to an Amazon Simple Storage Service (Amazon S3) bucket (labeled Extracted JSON in the preceding diagram). Optionally, we can restructure the input raw objects for better partitioning, which can help while implementing fine-grained access control on the raw input data (labeled as the Partitioned bucket in the diagram).
  3. After the initial data extraction phase, we can apply additional transformations to enrich the datasets using AWS Glue. We also build an additional metadata layer, which maintains a relationship between the raw S3 object path, the AI extracted output path, the optional enriched version S3 path, and any other metadata that will help the end-user discover the data.
  4. In the metadata catalog discovery step, we use the AWS Glue Data Catalog as the technical catalog, Amazon Athena and Amazon Redshift Spectrum as query engines, AWS Lake Formation for fine-grained access control, and Amazon DataZone for additional governance.
  5. The AI extracted output is expected to be available as a delimited file or in JSON format. We can create an AWS Glue Data Catalog table for querying using Athena or Redshift Spectrum. Like the previous step, we can use Lake Formation policies for fine-grained access control.
  6. Lastly, the end-user accesses the raw unstructured data available in Amazon S3 for further analysis. We have proposed integrating Amazon S3 Access Points for access control at this layer. We explain this in detail later in this post.

Now let’s expand the following parts of the architecture to understand the implementation better:

  • Using AWS AI services to process unstructured data
  • Using S3 Access Points to integrate access control on raw S3 unstructured data

Process unstructured data with AWS AI services

As we discussed earlier, unstructured data can come in a variety of formats, such as text, audio, video, and images, and each type of data requires a different approach for extracting metadata. AWS AI services are designed to extract metadata from different types of unstructured data. The following are the most commonly used services for unstructured data processing:

  • Amazon Comprehend – This natural language processing (NLP) service uses ML to extract metadata from text data. It can analyze text in multiple languages, detect entities, extract key phrases, determine sentiment, and more. With Amazon Comprehend, you can easily gain insights from large volumes of text data such as extracting product entity, customer name, and sentiment from social media posts.
  • Amazon Transcribe – This speech-to-text service uses ML to convert speech to text and extract metadata from audio data. It can recognize multiple speakers, transcribe conversations, identify keywords, and more. With Amazon Transcribe, you can convert unstructured data such as customer support recordings into text and further derive insights from it.
  • Amazon Rekognition – This image and video analysis service uses ML to extract metadata from visual data. It can recognize objects, people, faces, and text, detect inappropriate content, and more. With Amazon Rekognition, you can easily analyze images and videos to gain insights such as identifying entity type (human or other) and identifying if the person is a known celebrity in an image.
  • Amazon Textract – You can use this ML service to extract metadata from scanned documents and images. It can extract text, tables, and forms from images, PDFs, and scanned documents. With Amazon Textract, you can digitize documents and extract data such as customer name, product name, product price, and date from an invoice.
  • Amazon SageMaker – This service enables you to build and deploy custom ML models for a wide range of use cases, including extracting metadata from unstructured data. With SageMaker, you can build custom models that are tailored to your specific needs, which can be particularly useful for extracting metadata from unstructured data that requires a high degree of accuracy or domain-specific knowledge.
  • Amazon Bedrock – This fully managed service offers a choice of high-performing foundation models (FMs) from leading AI companies like AI21 Labs, Anthropic, Cohere, Meta, Stability AI, and Amazon with a single API. It also offers a broad set of capabilities to build generative AI applications, simplifying development while maintaining privacy and security.

With these specialized AI services, you can efficiently extract metadata from unstructured data and use it for further analysis and insights. It’s important to note that each service has its own strengths and limitations, and choosing the right service for your specific use case is critical for achieving accurate and reliable results.

AWS AI services are available via various APIs, which enables you to integrate AI capabilities into your applications and workflows. AWS Step Functions is a serverless workflow service that allows you to coordinate and orchestrate multiple AWS services, including AI services, into a single workflow. This can be particularly useful when you need to process large amounts of unstructured data and perform multiple AI-related tasks, such as text analysis, image recognition, and NLP.

With Step Functions and AWS Lambda functions, you can create sophisticated workflows that include AI services and other AWS services. For instance, you can use Amazon S3 to store input data, invoke a Lambda function to trigger an Amazon Transcribe job to transcribe an audio file, and use the output to trigger an Amazon Comprehend analysis job to generate sentiment metadata for the transcribed text. This enables you to create complex, multi-step workflows that are straightforward to manage, scalable, and cost-effective.

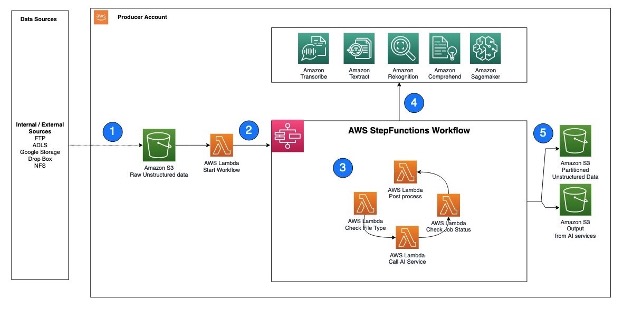
The following is an example architecture that shows how Step Functions can help invoke AWS AI services using Lambda functions.

AWS AI Services - Lambda Event Workflow -Unstructured Data

The workflow steps are as follows:

  1. Unstructured data, such as text files, audio files, and video files, are ingested into the S3 raw bucket.
  2. A Lambda function is triggered to read the data from the S3 bucket and call Step Functions to orchestrate the workflow required to extract the metadata.
  3. The Step Functions workflow checks the type of file, calls the corresponding AWS AI service APIs, checks the job status, and performs any postprocessing required on the output.
  4. AWS AI services can be accessed via APIs and invoked as batch jobs. To extract metadata from different types of unstructured data, you can use multiple AI services in sequence, with each service processing the corresponding file type.
  5. After the Step Functions workflow completes the metadata extraction process and performs any required postprocessing, the resulting output is stored in an S3 bucket for cataloging.

Next, let’s understand how can we implement security or access control on both the extracted output as well as the raw input objects.

Implement access control on raw and processed data in Amazon S3

We just consider access controls for three types of data when managing unstructured data: the AI-extracted semi-structured output, the metadata, and the raw unstructured original files. When it comes to AI extracted output, it’s in JSON format and can be restricted via Lake Formation and Amazon DataZone. We recommend keeping the metadata (information that captures which unstructured datasets are already processed by the pipeline and available for analysis) open to your organization, which will enable metadata discovery across the organization.

To control access of raw unstructured data, you can integrate S3 Access Points and explore additional support in the future as AWS services evolve. S3 Access Points simplify data access for any AWS service or customer application that stores data in Amazon S3. Access points are named network endpoints that are attached to buckets that you can use to perform S3 object operations. Each access point has distinct permissions and network controls that Amazon S3 applies for any request that is made through that access point. Each access point enforces a customized access point policy that works in conjunction with the bucket policy that is attached to the underlying bucket. With S3 Access Points, you can create unique access control policies for each access point to easily control access to specific datasets within an S3 bucket. This works well in multi-tenant or shared bucket scenarios where users or teams are assigned to unique prefixes within one S3 bucket.

An access point can support a single user or application, or groups of users or applications within and across accounts, allowing separate management of each access point. Every access point is associated with a single bucket and contains a network origin control and a Block Public Access control. For example, you can create an access point with a network origin control that only permits storage access from your virtual private cloud (VPC), a logically isolated section of the AWS Cloud. You can also create an access point with the access point policy configured to only allow access to objects with a defined prefix or to objects with specific tags. You can also configure custom Block Public Access settings for each access point.

The following architecture provides an overview of how an end-user can get access to specific S3 objects by assuming a specific AWS Identity and Access Management (IAM) role. If you have a large number of S3 objects to control access, consider grouping the S3 objects, assigning them tags, and then defining access control by tags.

S3 Access Points - Unstructured Data Management - Access Control

If you are implementing a solution that integrates S3 data available in multiple AWS accounts, you can take advantage of cross-account support for S3 Access Points.

Conclusion

This post explained how you can use AWS AI services to extract readable data from unstructured datasets, build a metadata layer on top of them to allow data discovery, and build an access control mechanism on top of the raw S3 objects and extracted data using Lake Formation, Amazon DataZone, and S3 Access Points.

In addition to AWS AI services, you can also integrate large language models with vector databases to enable semantic or similarity search on top of unstructured datasets. To learn more about how to enable semantic search on unstructured data by integrating Amazon OpenSearch Service as a vector database, refer to Try semantic search with the Amazon OpenSearch Service vector engine.

As of writing this post, S3 Access Points is one of the best solutions to implement access control on raw S3 objects using tagging, but as AWS service features evolve in the future, you can explore alternative options as well.


About the Authors

Sakti Mishra is a Principal Solutions Architect at AWS, where he helps customers modernize their data architecture and define their end-to-end data strategy, including data security, accessibility, governance, and more. He is also the author of the book Simplify Big Data Analytics with Amazon EMR. Outside of work, Sakti enjoys learning new technologies, watching movies, and visiting places with family.

Bhavana Chirumamilla is a Senior Resident Architect at AWS with a strong passion for data and machine learning operations. She brings a wealth of experience and enthusiasm to help enterprises build effective data and ML strategies. In her spare time, Bhavana enjoys spending time with her family and engaging in various activities such as traveling, hiking, gardening, and watching documentaries.

Sheela Sonone is a Senior Resident Architect at AWS. She helps AWS customers make informed choices and trade-offs about accelerating their data, analytics, and AI/ML workloads and implementations. In her spare time, she enjoys spending time with her family—usually on tennis courts.

Daniel Bruno is a Principal Resident Architect at AWS. He had been building analytics and machine learning solutions for over 20 years and splits his time helping customers build data science programs and designing impactful ML products.

Migrate data from Azure Blob Storage to Amazon S3 using AWS Glue

Post Syndicated from Qiushuang Feng original https://aws.amazon.com/blogs/big-data/migrate-data-from-azure-blob-storage-to-amazon-s3-using-aws-glue/

Today, we are pleased to announce new AWS Glue connectors for Azure Blob Storage and Azure Data Lake Storage that allow you to move data bi-directionally between Azure Blob Storage, Azure Data Lake Storage, and Amazon Simple Storage Service (Amazon S3).

We’ve seen a demand to design applications that enable data to be portable across cloud environments and give you the ability to derive insights from one or more data sources. One of the data sources you can now quickly integrate with is Azure Blob Storage, a managed service for storing both unstructured data and structured data, and Azure Data Lake Storage, a data lake for analytics workloads. With these connectors, you can bring the data from Azure Blob Storage and Azure Data Lake Storage separately to Amazon S3.

In this post, we use Azure Blob Storage as an example and demonstrate how the new connector works, introduce the connector’s functions, and provide you with key steps to set it up. We provide you with prerequisites, share how to subscribe to this connector in AWS Marketplace, and describe how to create and run AWS Glue for Apache Spark jobs with it. Regarding the Azure Data Lake Storage Gen2 Connector, we highlight any major differences in this post.

AWS Glue is a serverless data integration service that makes it simple to discover, prepare, and combine data for analytics, machine learning, and application development. AWS Glue natively integrates with various data stores such as MySQL, PostgreSQL, MongoDB, and Apache Kafka, along with AWS data stores such as Amazon S3, Amazon Redshift, Amazon Relational Database Service (Amazon RDS), and Amazon DynamoDB. AWS Glue Marketplace connectors allow you to discover and integrate additional data sources, such as software as a service (SaaS) applications and your custom data sources. With just a few clicks, you can search for and select connectors from AWS Marketplace and begin your data preparation workflow in minutes.

How the connectors work

In this section, we discuss how the new connectors work.

Azure Blob Storage connector

This connector relies on the Spark DataSource API and calls Hadoop’s FileSystem interface. The latter has implemented libraries for reading and writing various distributed or traditional storage. This connector also includes the hadoop-azure module, which lets you run Apache Hadoop or Apache Spark jobs directly with data in Azure Blob Storage. AWS Glue loads the library from the Amazon Elastic Container Registry (Amazon ECR) repository during initialization (as a connector), reads the connection credentials using AWS Secrets Manager, and reads data source configurations from input parameters. When AWS Glue has internet access, the Spark job in AWS Glue can read from and write to Azure Blob Storage.

We support the following two methods for authentication: the authentication key for Shared Key and shared access signature (SAS) tokens:

#Method 1:Shared Key, 
spark.conf.set("fs.azure.account.key.youraccountname.blob.core.windows.net", "*Your account key")

df = spark.read.format("csv").option("header","true").load("wasbs://[email protected]/loadingtest-input/100mb")

df.write.format("csv").option("compression","snappy").mode("overwrite").save("wasbs://<container_name>@<account_name>.blob.core.windows.net/output-CSV/20210831/")

#Method 2:Shared Access Signature (SAS) Tokens
spark.conf.set("fs.azure.sas.yourblob.youraccountname.blob.core.windows.net", "Your SAS token*")

df = spark.read.format("csv").option("header","true").load("wasbs://[email protected]/loadingtest-input/100mb")

df.write.format("csv").option("compression","snappy").mode("overwrite").save("wasbs://<container_name>@<account_name>.blob.core.windows.net/output-CSV/20210831/")

Azure Data Lake Storage Gen2 connector

The usage of Azure Data Lake Storage Gen2 is much the same as the Azure Blob Storage connector. The Azure Data Lake Storage Gen2 connector uses the same library as the Azure Blob Storage connector, and relies on the Spark DataSource API, Hadoop’s FileSystem interface, and the Azure Blob Storage connector for Hadoop.

As of this writing, we only support the Shared Key authentication method:

#Method: Shared Key 
spark.conf.set("fs.azure.account.key.youraccountname.dfs.core.windows.net", "*Your account key")

# Read file from ADLS example
df= spark.read.format("csv").option("header","true").load("abfss://<container_name>@<account_name>.dfs.core.windows.net/input-csv/covid/") 

# Write file to ADLS example
df.write.format("parquet").option("compression","snappy").partitionBy("state").mode("overwrite").save("abfss://<container_name>@<account_name>.dfs.core.windows.net/output-glue3/csv-partitioned/") 

Solution overview

The following architecture diagram shows how AWS Glue connects to Azure Blob Storage for data ingestion.

In the following sections, we show you how to create a new secret for Azure Blob Storage in Secrets Manager, subscribe to the AWS Glue connector, and move data from Azure Blob Storage to Amazon S3.

Prerequisites

You need the following prerequisites:

  • A storage account in Microsoft Azure and your data path in Azure Blob Storage. Prepare the storage account credentials in advance. For instructions, refer to Create a storage account shared key.
  • A Secrets Manager secret to store a Shared Key secret, using one of the supporting authentication methods.
  • An AWS Identity and Access Management (IAM) role for the AWS Glue job with the following policies:
    • AWSGlueServiceRole, which allows the AWS Glue service role access to related services.
    • AmazonEC2ContainerRegistryReadOnly, which provides read-only access to Amazon EC2 Container Registry repositories. This policy is for using AWS Marketplace’s connector libraries.
    • A Secrets Manager policy, which provides read access to the secret in Secrets Manager.
    • An S3 bucket policy for the S3 bucket that you need to load ETL (extract, transform, and load) data from Azure Blob Storage.

Create a new secret for Azure Blob Storage in Secrets Manager

Complete the following steps to create a secret in Secrets Manager to store the Azure Blob Storage connection strings using the Shared Key authentication method:

  1. On the Secrets Manager console, choose Secrets in the navigation pane.
  2. Choose Store a new secret.
  3. For Secret type, select Other type of secret.
  4. Replace the values for accountName, accountKey, and container with your own values.
  5. Leave the rest of the options at their default.
  6. Choose Next.
  7. Provide a name for the secret, such as azureblobstorage_credentials.
  8. Follow the rest of the steps to store the secret.

Subscribe to the AWS Glue connector for Azure Blob Storage

To subscribe to the connector, complete the following steps:

  1. Navigate to the Azure Blob Storage Connector for AWS Glue on AWS Marketplace.
  2. On the product page for the connector, use the tabs to view information about the connector, then choose Continue to Subscribe.
  3. Review the pricing terms and the seller’s End User License Agreement, then choose Accept Terms.
  4. Continue to the next step by choosing Continue to Configuration.
  5. On the Configure this software page, choose the fulfillment options and the version of the connector to use.

We have provided two options for the Azure Blob Storage Connector: AWS Glue 3.0 and AWS Glue 4.0. In this example, we focus on AWS Glue 4.0. Choose Continue to Launch.

  1. On the Launch this software page, choose Usage instructions to review the usage instructions provided by AWS.
  2. When you’re ready to continue, choose Activate the Glue connector from AWS Glue Studio.

The console will display the Create marketplace connection page in AWS Glue Studio.

Move data from Azure Blob Storage to Amazon S3

To move your data to Amazon S3, you must configure the custom connection and then set up an AWS Glue job.

Create a custom connection in AWS Glue

An AWS Glue connection stores connection information for a particular data store, including login credentials, URI strings, virtual private cloud (VPC) information, and more. Complete the following steps to create your connection:

  1. On the AWS Glue console, choose Connectors in the navigation pane.
  2. Choose Create connection.
  3. For Connector, choose Azure Blob Storage Connector for AWS Glue.
  4. For Name, enter a name for the connection (for example, AzureBlobStorageConnection).
  5. Enter an optional description.
  6. For AWS secret, enter the secret you created (azureblobstorage_credentials).
  7. Choose Create connection and activate connector.

The connector and connection information is now visible on the Connectors page.

Create an AWS Glue job and configure connection options

Complete the following steps:

  1. On the AWS Glue console, choose Connectors in the navigation pane.
  2. Choose the connection you created (AzureBlobStorageConnection).
  3. Choose Create job.
  4. For Name, enter Azure Blob Storage Connector for AWS Glue. This name should be unique among all the nodes for this job.
  5. For Connection, choose the connection you created (AzureBlobStorageConnection).
  6. For Key, enter path, and for Value, enter your Azure Blob Storage URI. For example, when we created our new secret, we already set a container value for the Azure Blob Storage. Here, we enter the file path /input_data/.
  7. Enter another key-value pair. For Key, enter fileFormat. For Value, enter csv, because our sample data is in this format.
  8. Optionally, if the CSV file contains a header line, enter another key-value pair. For Key, enter header. For Value, enter true.
  9. To preview your data, choose the Data preview tab, then choose Start data preview session and choose the IAM role defined in the prerequisites.
  10. Choose Confirm and wait for the results to display.
  11. Select S3 as Target Location.
  12. Choose Browse S3 to see the S3 buckets that you have access to and choose one as the target destination for the data output.
  13. For the other options, use the default values.
  14. On the Job details tab, for IAM Role, choose the IAM role defined in the prerequisites.
  15. For Glue version, choose your AWS Glue version.
  16. Continue to create your ETL job. For instructions, refer to Creating ETL jobs with AWS Glue Studio.
  17. Choose Run to run your job.

When the job is complete, you can navigate to the Run details page on the AWS Glue console and check the logs in Amazon CloudWatch.

The data is ingested into Amazon S3, as shown in the following screenshot. We are now able to import data from Azure Blob Storage to Amazon S3.

Scaling considerations

In this example, we use the default AWS Glue capacity, 10 DPU (Data Processing Units). A DPU is a standardized unit of processing capacity that consists of 4 vCPUs of compute capacity and 16 GB of memory. To scale your AWS Glue job, you can increase the number of DPU, and also take advantage of Auto Scaling. With Auto Scaling enabled, AWS Glue automatically adds and removes workers from the cluster depending on the workload. After you choose the maximum number of workers, AWS Glue will adapt the right size of resources for the workload.

Clean up

To clean up your resources, complete the following steps:

  1. Remove the AWS Glue job and secret in Secrets Manager with the following command:
    aws glue delete-job —job-name <your_job_name>
    
    aws glue delete-connection —connection-name <your_connection_name>
    
    aws secretsmanager delete-secret —secret-id <your_secretsmanager_id>

  2. If you are no longer going to use this connector, you can cancel the subscription to the Azure Blob Storage connector:
    1. On the AWS Marketplace console, go to the Manage subscriptions page.
    2. Select the subscription for the product that you want to cancel.
    3. On the Actions menu, choose Cancel subscription.
    4. Read the information provided and select the acknowledgement check box.
    5. Choose Yes, cancel subscription.
  3. Delete the data in the S3 bucket that you used in the previous steps.

Conclusion

In this post, we showed how to use AWS Glue and the new connector for ingesting data from Azure Blob Storage to Amazon S3. This connector provides access to Azure Blob Storage, facilitating cloud ETL processes for operational reporting, backup and disaster recovery, data governance, and more.

We welcome any feedback or questions in the comments section.

Appendix

When you need SAS token authentication for Azure Data Lake Storage Gen 2, you can use Azure SAS Token Provider for Hadoop. To do that, upload the JAR file to your S3 bucket and configure your AWS Glue job to set the S3 location in the job parameter --extra-jars (in AWS Glue Studio, Dependent JARs path). Then save the SAS token in Secrets Manager and set the value to spark.hadoop.fs.azure.sas.fixed.token.<azure storage account>.dfs.core.windows.net in SparkConf using script mode at runtime. Learn more in README.

from pyspark.sql import SparkSession
spark = SparkSession.builder \
.config("spark.hadoop.fs.azure.sas.fixed.token.<azure storage account>.dfs.core.windows.ne", sas_token) \
.getOrCreate()

References


About the authors

Qiushuang Feng is a Solutions Architect at AWS, responsible for Enterprise customers’ technical architecture design, consulting, and design optimization on AWS Cloud services. Before joining AWS, Qiushuang worked in IT companies such as IBM and Oracle, and accumulated rich practical experience in development and analytics.

Noritaka Sekiyama is a Principal Big Data Architect on the AWS Glue team. He is passionate about architecting fast-growing data environments, diving deep into distributed big data software like Apache Spark, building reusable software artifacts for data lakes, and sharing knowledge in AWS Big Data blog posts.

Shengjie Luo is a Big Data Architect on the Amazon Cloud Technology professional service team. They are responsible for solutions consulting, architecture, and delivery of AWS-based data warehouses and data lakes. They are skilled in serverless computing, data migration, cloud data integration, data warehouse planning, and data service architecture design and implementation.

Greg Huang is a Senior Solutions Architect at AWS with expertise in technical architecture design and consulting for the China G1000 team. He is dedicated to deploying and utilizing enterprise-level applications on AWS Cloud services. He possesses nearly 20 years of rich experience in large-scale enterprise application development and implementation, having worked in the cloud computing field for many years. He has extensive experience in helping various types of enterprises migrate to the cloud. Prior to joining AWS, he worked for well-known IT enterprises such as Baidu and Oracle.

Maciej Torbus is a Principal Customer Solutions Manager within Strategic Accounts at Amazon Web Services. With extensive experience in large-scale migrations, he focuses on helping customers move their applications and systems to highly reliable and scalable architectures in AWS. Outside of work, he enjoys sailing, traveling, and restoring vintage mechanical watches.

Load data incrementally from transactional data lakes to data warehouses

Post Syndicated from Noritaka Sekiyama original https://aws.amazon.com/blogs/big-data/load-data-incrementally-from-transactional-data-lakes-to-data-warehouses/

Data lakes and data warehouses are two of the most important data storage and management technologies in a modern data architecture. Data lakes store all of an organization’s data, regardless of its format or structure. An open table format such as Apache Hudi, Delta Lake, or Apache Iceberg is widely used to build data lakes on Amazon Simple Storage Service (Amazon S3) in a transactionally consistent manner for use cases including record-level upserts and deletes, change data capture (CDC), time travel queries, and more. Data warehouses, on the other hand, store data that has been cleaned, organized, and structured for analysis. Depending on your use case, it’s common to have a copy of the data between your data lake and data warehouse to support different access patterns.

When the data becomes very large and unwieldy, it can be difficult to keep the copy of the data between data lakes and data warehouses in sync and up to date in an efficient manner.

In this post, we discuss different architecture patterns to keep data in sync and up to date between data lakes built on open table formats and data warehouses such as Amazon Redshift. We also discuss the benefits of incremental loading and the techniques for implementing the architecture using AWS Glue, which is a serverless, scalable data integration service that helps you discover, prepare, move, and integrate data from multiple sources. Various data stores are supported in AWS Glue; for example, AWS Glue 4.0 supports an enhanced Amazon Redshift connector to read from and write to Amazon Redshift, and also supports a built-in Snowflake connector to read from and write to Snowflake. Moreover, Apache Hudi, Delta Lake, and Apache Iceberg are natively supported in AWS Glue.

Architecture patterns

Generally, there are three major architecture patterns to keep your copy of data between data lakes and data warehouses in sync and up to date:

  • Dual writes
  • Incremental queries
  • Change data capture

Let’s discuss each of the architecture patterns and the techniques to achieve them.

Dual writes

When initially ingesting data from its raw source into the data lake and data warehouse, a single batch process is configured to write to both. We call this pattern dual writes. Although this architecture pattern (see the following diagram) is straightforward and easy to implement, it can become error-prone because there are two separate transactions threads, and each can have its own errors, causing inconsistencies between the data lake and data warehouse when a write fails in one but not both.

Incremental queries

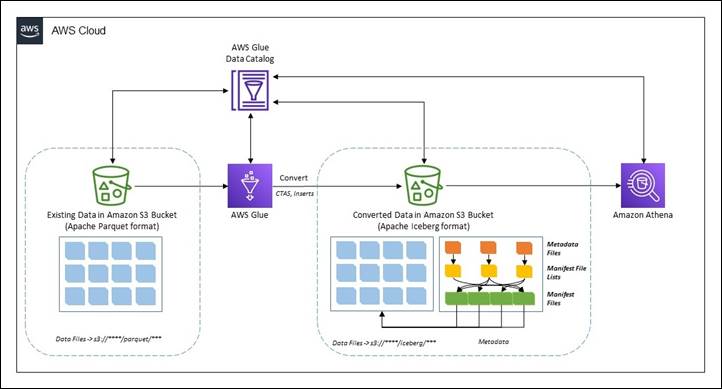
An incremental query architectural pattern is designed to ingest data first into the data lake with an open table format, and then load the newly written data from the data lake into the data warehouse. Open table formats such as Apache Hudi and Apache Iceberg support incremental queries based on their respective transaction logs. You can capture records inserted or updated with the incremental queries, and then merge the captured records into the destination data warehouses.

Apache Hudi supports incremental query, which allows you to retrieve all records written during specific time range.

Delta Lake doesn’t have a specific concept for incremental queries. It’s covered in a change data feed, which is explained in the next section.

Apache Iceberg supports incremental read, which allows you to read appended data incrementally. As of this writing, Iceberg gets incremental data only from the append operation; other operations such as replace, overwrite, and delete aren’t supported by incremental read.

For merging the records into Amazon Redshift, you can use the MERGE SQL command, which was released in April 2023. AWS Glue supports the Redshift MERGE SQL command within its data integration jobs. To learn more, refer to Exploring new ETL and ELT capabilities for Amazon Redshift from the AWS Glue Studio visual editor.

Incremental queries are useful to capture changed records; however, incremental queries can’t handle the deletes and just send the latest version of each record. If you need to handle delete operations in the source data lake, you will need to use a CDC-based approach.

The following diagram illustrates an incremental query architectural pattern.

Change data capture

Change data capture (CDC) is a well-known technique to capture all mutating operations in a source database system and relay those operations to another system. CDC keeps all the intermediate changes, including the deletes. With this architecture pattern, you capture not only inserts and updates, but also deletes committed to the data lake, and then merge those captured changes into the data warehouses.

Apache Hudi 0.13.0 or later supports change data capture as an experimental feature, which is only available for Copy-on-Write (CoW) tables. Merge-on-Read tables (MoR) do not support CDC as of this writing.

Delta Lake 2.0.0 or later supports a change data feed, which allows Delta tables to track record-level changes between table versions.

Apache Iceberg 1.2.1 or later supports change data capture through its create_changelog_view procedure. When you run this procedure, a new view that contains the changes from a given table is created.

The following diagram illustrates a CDC architecture.

Example scenario

To demonstrate the end-to-end experience, this post uses the Global Historical Climatology Network Daily (GHCN-D) dataset. The data is publicly accessible through an S3 bucket. For more information, see the Registry of Open Data on AWS. You can also learn more in Visualize over 200 years of global climate data using Amazon Athena and Amazon QuickSight.

The Amazon S3 location s3://noaa-ghcn-pds/csv/by_year/ has all of the observations from 1763 to the present organized in CSV files, one file for each year. The following block shows an example of what the records look like:

ID,DATE,ELEMENT,DATA_VALUE,M_FLAG,Q_FLAG,S_FLAG,OBS_TIME
AE000041196,20220101,TAVG,204,H,,S,
AEM00041194,20220101,TAVG,211,H,,S,
AEM00041217,20220101,TAVG,209,H,,S,
AEM00041218,20220101,TAVG,207,H,,S,
AE000041196,20220102,TAVG,226,H,,S,
...
AE000041196,20221231,TMAX,243,,,S,
AE000041196,20221231,PRCP,0,D,,S,
AE000041196,20221231,TAVG,202,H,,S,

The records have fields including ID, DATE, ELEMENT, and more. Each combination of ID, DATE, and ELEMENT represents a unique record in this dataset. For example, the record with ID as AE000041196, ELEMENT as TAVG, and DATE as 20220101 is unique. We use this dataset in the following examples and simulate record-level updates and deletes as sample operations.

Prerequisites

To continue with the examples in this post, you need to create (or already have) the following AWS resources:

For the first tutorial (loading from Apache Hudi to Amazon Redshift), you also need the following:

For the second tutorial (loading from Delta Lake to Snowflake), you need the following:

  • A Snowflake account.
  • An AWS Glue connection named snowflake for Snowflake access. For more information, refer to Configuring Snowflake connections.
  • An AWS Secrets Manager secret named snowflake_credentials with the following key pairs:
    • Key sfUser with value <Your Snowflake username>
    • Key sfPassword with value <Your Snowflake password>

These tutorials are inter-changeable, so you can easily apply the same pattern for any combination of source and destination, for example, Hudi to Snowflake, or Delta to Amazon Redshift.

Load data incrementally from Apache Hudi table to Amazon Redshift using a Hudi incremental query

This tutorial uses Hudi incremental queries to load data from a Hudi table and then merge the changes to Amazon Redshift.

Ingest initial data to a Hudi table

Complete the following steps:

  1. Open AWS Glue Studio.
  2. Choose ETL jobs.
  3. Choose Visual with a source and target.
  4. For Source and Target, choose Amazon S3, then choose Create.

A new visual job configuration appears. The next step is to configure the data source to read an example dataset.

  1. Name this new job hudi-data-ingestion.
  2. Under Visual, choose Data source – S3 bucket.
  3. Under Node properties, for S3 source type, select S3 location.
  4. For S3 URL, enter s3://noaa-ghcn-pds/csv/by_year/2022.csv.

The data source is configured. The next step is to configure the data target to ingest data in Apache Hudi on your S3 bucket.

  1. Choose Data target – S3 bucket.
  2. Under Data target properties – S3, for Format, choose Apache Hudi.
  3. For Hudi Table Name, enter ghcn_hudi.
  4. For Hudi Storage Type, choose Copy on write.
  5. For Hudi Write Operation, choose Upsert.
  6. For Hudi Record Key Fields, choose ID.
  7. For Hudi Precombine Key Field, choose DATE.
  8. For Compression Type, choose GZIP.
  9. For S3 Target location, enter s3://<Your S3 bucket name>/<Your S3 bucket prefix>/hudi_incremental/ghcn/. (Provide your S3 bucket name and prefix.)
  10. For Data Catalog update options, select Do not update the Data Catalog.

Now your data integration job is authored in the visual editor completely. Let’s add one remaining setting about the IAM role, then run the job.

  1. Under Job details, for IAM Role, choose your IAM role.
  2. Choose Save, then choose Run.

You can track the progress on the Runs tab. It finishes in several minutes.

Load data from the Hudi table to a Redshift table

In this step, we assume that the files are updated with new records every day, and want to store only the latest record per the primary key (ID and ELEMENT) to make the latest snapshot data queryable. One typical approach is to do an INSERT for all the historical data, and calculate the latest records in queries; however, this can introduce additional overhead in all the queries. When you want to analyze only the latest records, it’s better to do an UPSERT (update and insert) based on the primary key and DATE field rather than just an INSERT in order to avoid duplicates and maintain a single updated row of data.

Complete the following steps to load data from the Hudi table to a Redshift table:

  1. Download the file hudi2redshift-incremental-load.ipynb.
  2. In AWS Glue Studio, choose Jupyter Notebook, then choose Create.
  3. For Job name, enter hudi-ghcn-incremental-load-notebook.
  4. For IAM Role, choose your IAM role.
  5. Choose Start notebook.

Wait for the notebook to be ready.

  1. Run the first cell to set up an AWS Glue interactive session.
  2. Replace the parameters with yours and run the cell under Configure your resource.
  3. Run the cell under Initialize SparkSession and GlueContext.
  4. Run the cell under Determine target time range for incremental query.
  5. Run the cells under Run query to load data updated during a given timeframe.
  6. Run the cells under Merge changes into destination table.

You can see the exact query immediately run right after ingesting a temp table into the Redshift table.

  1. Run the cell under Update the last query end time.

Validate initial records in the Redshift table

Complete the following steps to validate the initial records in the Redshift table:

  1. On the Amazon Redshift console, open Query Editor v2.
  2. Run the following query:
    SELECT * FROM "dev"."public"."ghcn" WHERE ID = 'AE000041196'

The query returns the following result set.

The original source file 2022.csv has historical records for record ID='AE000041196' from 20220101 to 20221231; however, the query result shows only four records, one record per ELEMENT at the latest snapshot of the day 20221230 or 20221231. Because we used the UPSERT write option when writing data, we configured the ID field as a Hudi record key field, the DATE field as a Hudi precombine field, and the ELEMENT field as partition key field. When two records have the same key value, Hudi picks the one with the largest value for the precombine field. When the job ingested data, it compared all the values in the DATE field for each pair of ID and ELEMENT, and then picked the record with the largest value in the DATE field. We use the current state of this table as an initial state.

Ingest updates to a Hudi table

Complete the following steps to simulating ingesting more records to the Hudi table:

  1. On AWS Glue Studio, choose the job hudi-data-ingestion.
  2. On the Data target – S3 bucket node, change the S3 location from s3://noaa-ghcn-pds/csv/by_year/2022.csv to s3://noaa-ghcn-pds/csv/by_year/2023.csv.
  3. Run the job.

Because this job uses the DATE field as a Hudi precombine field, the records included in the new source file have been upserted into the Hudi table.

Load data incrementally from the Hudi table to the Redshift table

Complete the following steps to load the ingested records incrementally to the Redshift table:

  1. On AWS Glue Studio, choose the job hudi-ghcn-incremental-load-notebook.
  2. Run all the cells again.

In the cells under Run query, you will notice that the records shown this time have DATE in 2023. Only newly ingested records are shown here.

In the cells under Merge changes into destination table, the newly ingested records are merged into the Redshift table. The generated MERGE query statement in the notebook is as follows:

MERGE INTO public.ghcn USING public.ghcn_tmp ON 
    public.ghcn.ID = public.ghcn_tmp.ID AND 
    public.ghcn.ELEMENT = public.ghcn_tmp.ELEMENT
WHEN MATCHED THEN UPDATE SET 
    _hoodie_commit_time = public.ghcn_tmp._hoodie_commit_time,
    _hoodie_commit_seqno = public.ghcn_tmp._hoodie_commit_seqno,
    _hoodie_record_key = public.ghcn_tmp._hoodie_record_key,
    _hoodie_partition_path = public.ghcn_tmp._hoodie_partition_path,
    _hoodie_file_name = public.ghcn_tmp._hoodie_file_name, 
    ID = public.ghcn_tmp.ID, 
    DATE = public.ghcn_tmp.DATE, 
    ELEMENT = public.ghcn_tmp.ELEMENT, 
    DATA_VALUE = public.ghcn_tmp.DATA_VALUE, 
    M_FLAG = public.ghcn_tmp.M_FLAG, 
    Q_FLAG = public.ghcn_tmp.Q_FLAG, 
    S_FLAG = public.ghcn_tmp.S_FLAG, 
    OBS_TIME = public.ghcn_tmp.OBS_TIME 
WHEN NOT MATCHED THEN INSERT VALUES (
    public.ghcn_tmp._hoodie_commit_time, 
    public.ghcn_tmp._hoodie_commit_seqno, 
    public.ghcn_tmp._hoodie_record_key, 
    public.ghcn_tmp._hoodie_partition_path, 
    public.ghcn_tmp._hoodie_file_name, 
    public.ghcn_tmp.ID, 
    public.ghcn_tmp.DATE, 
    public.ghcn_tmp.ELEMENT, 
    public.ghcn_tmp.DATA_VALUE, 
    public.ghcn_tmp.M_FLAG, 
    public.ghcn_tmp.Q_FLAG, 
    public.ghcn_tmp.S_FLAG, 
    public.ghcn_tmp.OBS_TIME
);

The next step is to verify the result on the Redshift side.

Validate updated records in the Redshift table

Complete the following steps to validate the updated records in the Redshift table:

  1. On the Amazon Redshift console, open Query Editor v2.
  2. Run the following query:
    SELECT * FROM "dev"."public"."ghcn" WHERE ID = 'AE000041196'

The query returns the following result set.

Now you see that the four records have been updated with the new records in 2023. If you have further future records, this approach works well to upsert new records based on the primary keys.

Load data incrementally from a Delta Lake table to Snowflake using a Delta change data feed

This tutorial uses a Delta change data feed to load data from a Delta table, and then merge the changes to Snowflake.

Ingest initial data to a Delta table

Complete the following steps:

  1. Open AWS Glue Studio.
  2. Choose ETL jobs.
  3. Choose Visual with a source and target.
  4. For Source and Target, choose Amazon S3, then choose Create.

A new visual job configuration appears. The next step is to configure the data source to read an example dataset.

  1. Name this new job delta-data-ingestion.
  2. Under Visual, choose Data source – S3 bucket.
  3. Under Node properties, for S3 source type, select S3 location.
  4. For S3 URL, enter s3://noaa-ghcn-pds/csv/by_year/2022.csv.

The data source is configured. The next step is to configure the data target to ingest data in Apache Hudi on your S3 bucket.

  1. Choose Data target – S3 bucket.
  2. Under Data target properties – S3, for Format, choose Delta Lake.
  3. For Compression Type, choose Snappy.
  4. For S3 Target location, enter s3://<Your S3 bucket name>/<Your S3 bucket prefix>/delta_incremental/ghcn/. (Provide your S3 bucket name and prefix.)
  5. For Data Catalog update options, select Do not update the Data Catalog.

Now your data integration job is authored in the visual editor completely. Let’s add an additional detail about the IAM role and job parameters, and then run the job.

  1. Under Job details, for IAM Role, choose your IAM role.
  2. Under Job parameters, for Key, enter --conf and for Value, enter spark.databricks.delta.properties.defaults.enableChangeDataFeed=true.
  3. Choose Save, then choose Run.

Load data from the Delta table to a Snowflake table

Complete the following steps to load data from the Delta table to a Snowflake table:

  1. Download the file delta2snowflake-incremental-load.ipynb.
  2. On AWS Glue Studio, choose Jupyter Notebook, then choose Create.
  3. For Job name, enter delta-ghcn-incremental-load-notebook.
  4. For IAM Role, choose your IAM role.
  5. Choose Start notebook.

Wait for the notebook to be ready.

  1. Run the first cell to start an AWS Glue interactive session.
  2. Replace the parameters with yours and run the cell under Configure your resource.
  3. Run the cell under Initialize SparkSession and GlueContext.
  4. Run the cell under Determine target time range for CDC.
  5. Run the cells under Run query to load data updated during a given timeframe.
  6. Run the cells under Merge changes into destination table.

You can see the exact query immediately run right after ingesting a temp table in the Snowflake table.

  1. Run the cell under Update the last query end time.

Validate initial records in the Snowflake warehouse

Run the following query in Snowflake:

SELECT * FROM "dev"."public"."ghcn" WHERE ID = 'AE000041196'

The query should return the following result set:

There are three records returned in this query.

Update and delete a record on the Delta table

Complete the following steps to update and delete a record on the Delta table as sample operations:

  1. Return to the AWS Glue notebook job.
  2. Run the cells under Update the record and Delete the record.

Load data incrementally from the Delta table to the Snowflake table

Complete the following steps to load the ingested records incrementally to the Redshift table:

  1. On AWS Glue Studio, choose the job delta-ghcn-incremental-load-notebook.
  2. Run all the cells again.

When you run the cells under Run query, you will notice that there are only three records, which correspond to the update and delete operation performed in the previous step.

In the cells under Merge changes into destination table, the changes are merged into the Snowflake table. The generated MERGE query statement in the notebook is as follows:

MERGE INTO public.ghcn USING public.ghcn_tmp ON 
    public.ghcn.ID = public.ghcn_tmp.ID AND 
    public.ghcn.DATE = public.ghcn_tmp.DATE AND 
    public.ghcn.ELEMENT = public.ghcn_tmp.ELEMENT 
WHEN MATCHED AND public.ghcn_tmp._change_type = 'update_postimage' THEN UPDATE SET 
    ID = public.ghcn_tmp.ID, 
    DATE = public.ghcn_tmp.DATE, 
    ELEMENT = public.ghcn_tmp.ELEMENT, 
    DATA_VALUE = public.ghcn_tmp.DATA_VALUE, 
    M_FLAG = public.ghcn_tmp.M_FLAG, 
    Q_FLAG = public.ghcn_tmp.Q_FLAG, 
    S_FLAG = public.ghcn_tmp.S_FLAG, 
    OBS_TIME = public.ghcn_tmp.OBS_TIME, 
    _change_type = public.ghcn_tmp._change_type, 
    _commit_version = public.ghcn_tmp._commit_version, 
    _commit_timestamp = public.ghcn_tmp._commit_timestamp 
WHEN MATCHED AND public.ghcn_tmp._change_type = 'delete' THEN DELETE 
WHEN NOT MATCHED THEN INSERT VALUES (
    public.ghcn_tmp.ID, 
    public.ghcn_tmp.DATE, 
    public.ghcn_tmp.ELEMENT, 
    public.ghcn_tmp.DATA_VALUE, 
    public.ghcn_tmp.M_FLAG, 
    public.ghcn_tmp.Q_FLAG, 
    public.ghcn_tmp.S_FLAG, 
    public.ghcn_tmp.OBS_TIME, 
    public.ghcn_tmp._change_type, 
    public.ghcn_tmp._commit_version, 
    public.ghcn_tmp._commit_timestamp
);

The next step is to verify the result on the Snowflake side.

Validate updated records in the Snowflake table

Complete the following steps to validate the updated and deleted records in the Snowflake table:

  1. On Snowflake, run the following query:
    SELECT * FROM ghcn WHERE ID = 'AE000041196' AND DATE = '20221231'

The query returns the following result set:

You will notice that the query only returns two records. The value of DATA_VALUE of the record ELEMENT=PRCP has been updated from 0 to 12345. The record ELEMENT=TMAX has been deleted. This means that your update and delete operations on the source Delta table have been successfully replicated to the target Snowflake table.

Clean up

Complete the following steps to clean up your resources:

  1. Delete the following AWS Glue jobs:
    • hudi-data-ingestion
    • hudi-ghcn-incremental-load-notebook
    • delta-data-ingestion
    • delta-ghcn-incremental-load-notebook
  2. Clean up your S3 bucket.
  3. If needed, delete the Redshift cluster or the Redshift Serverless workgroup.

Conclusion

This post discussed architecture patterns to keep a copy of your data between data lakes using open table formats and data warehouses in sync and up to date. We also discussed the benefits of incremental loading and the techniques for achieving the use case using AWS Glue. We covered two use cases: incremental load from a Hudi table to Amazon Redshift, and from a Delta table to Snowflake.


About the author

Noritaka Sekiyama is a Principal Big Data Architect on the AWS Glue team. He works based in Tokyo, Japan. He is responsible for building software artifacts to help customers. In his spare time, he enjoys cycling with his road bike.

How healthcare organizations can analyze and create insights using price transparency data

Post Syndicated from Gokhul Srinivasan original https://aws.amazon.com/blogs/big-data/how-healthcare-organizations-can-analyze-and-create-insights-using-price-transparency-data/

In recent years, there has been a growing emphasis on price transparency in the healthcare industry. Under the Transparency in Coverage (TCR) rule, hospitals and payors to publish their pricing data in a machine-readable format. With this move, patients can compare prices between different hospitals and make informed healthcare decisions. For more information, refer to Delivering Consumer-friendly Healthcare Transparency in Coverage On AWS.

The data in the machine-readable files can provide valuable insights to understand the true cost of healthcare services and compare prices and quality across hospitals. The availability of machine-readable files opens up new possibilities for data analytics, allowing organizations to analyze large amounts of pricing data. Using machine learning (ML) and data visualization tools, these datasets can be transformed into actionable insights that can inform decision-making.

In this post, we explain how healthcare organizations can use AWS services to ingest, analyze, and generate insights from the price transparency data created by hospitals. We use sample data from three different hospitals, analyze the data, and create comparative trends and insights from the data.

Solution overview

As part of the Centers for Medicare and Medicaid Services (CMS) mandate, all hospitals now have their machine-readable file containing the pricing data. As hospitals generate this data, they can use their organization data or ingest data from other hospitals to derive analytics and competitive comparison. This comparison can help hospitals do the following:

  • Derive a price baseline for all medical services and perform gap analysis
  • Analyze pricing trends and identify services where competitors don’t participate
  • Evaluate and identify the services where cost difference is above a specific threshold

The size of the machine-readable files from hospitals is smaller than those generated by the payors. This is due to the complexity of the JSON structure, contracts, and the risk evaluation process on the payor side. Due to this low complexity, the solution uses AWS serverless services to ingest the data, transform it, and make it available for analytics. The analysis of the machine-readable files from payors requires advanced computational capabilities due to the complexity and the interrelationship in the JSON file.

Prerequisites

As a prerequisite, evaluate the hospitals for which the pricing analysis will be performed and identify the machine-readable files for analysis. Amazon Simple Storage Service (Amazon S3) is an object storage service offering industry-leading scalability, data availability, security, and performance. Create separate folders for each hospital inside the S3 bucket.

Architecture overview

The architecture uses AWS serverless technology for the implementation. The serverless architecture features auto scaling, high availability, and a pay-as-you-go billing model to increase agility and optimize costs. The architecture approach is split into a data intake layer, a data analysis layer, and a data visualization layer.

The architecture contains three independent stages:

  • File ingestion – Hospitals negotiate their contract and pricing with the payors one time a year with periodical revisions on a quarterly or monthly basis. The data ingestion process copies the machine-readable files from the hospitals, validates the data, and keeps the validated files available for analysis.
  • Data analysis – In this stage, the files are transformed using AWS Glue and stored in the AWS Glue Data Catalog. AWS Glue is a serverless data integration service that makes it easier to discover, prepare, move, and integrate data from multiple sources for analytics, ML, and application development. Then you can use Amazon Athena V3 to query the tables in the Data Catalog.
  • Data visualization – Amazon QuickSight is a cloud-powered business analytics service that makes it straightforward to build visualizations, perform ad hoc analysis, and quickly get business insights from the pricing data. This stage uses QuickSight to visually analyze the data in the machine-readable file using Athena queries.

File ingestion

The file ingestion process works as defined in the following figure. The architecture uses AWS Lambda, a serverless, event-driven compute service that lets you run code without provisioning or managing servers.

TCR Intake Architecture

The following flow defines the process to ingest and analyze the data:

  1. Copy the machine-readable files from the hospitals into the respective raw data S3 bucket.
  2. The file upload to the S3 bucket triggers an S3 event, which invokes a format Lambda function.
  3. The Lambda function triggers a notification when it identifies issues in the file.
  4. The Lambda function ingests the file, transforms the data, and stores the clean file in a new clean data S3 bucket.

Organizations can create new Lambda functions depending on the difference in the file formats.

Data analysis

The file intake and data analysis processes are independent of each other. Whereas the file intake happens on a scheduled or periodical basis, the data analysis happens regularly based on the business operation needs. The architecture for the data analysis is shown in the following figure.

TCR Data Analysis

This stage uses an AWS Glue crawler, the AWS Glue Data Catalog, and Athena v3 to analyze the data from the machine-readable files.

  1. An AWS Glue crawler scans the clean data in the S3 bucket and creates or updates the tables in the AWS Glue Data Catalog. The crawler can run on demand or on a schedule, and can crawl multiple machine-readable files in a single run.
  2. The Data Catalog now contains references to the machine-readable data. The Data Catalog contains the table definition, which contains metadata about the data in the machine-readable file. The tables are written to a database, which acts as a container.
  3. Use the Data Catalog and transform the hospital price transparency data.
  4. When the data is available in the Data Catalog, you can develop the analytics query using Athena. Athena is a serverless, interactive analytics service that provides a simplified, flexible way to analyze petabytes of data using SQL queries.
  5. Any failure during the process will be captured in the Amazon CloudWatch logs, which can be used for troubleshooting and analysis. The Data Catalog needs to be refreshed only when there is a change in the machine-readable file structure or a new machine-readable file is uploaded to the clean S3 bucket. When the crawler runs periodically, it automatically identifies the changes and updates the Data Catalog.

Data visualization

When the data analysis is complete and queries are developed using Athena, we can visually analyze the results and gain insights using QuickSight. As shown in the following figure, once the data ingestion and data analysis are complete, the queries are built using Athena.

TCR Visualization

In this stage, we use QuickSight to create datasets using the Athena queries, build visualizations, and deploy dashboards for visual analysis and insights.

Create a QuickSight dataset

Complete the following steps to create a QuickSight dataset:

  1. On the QuickSight console, choose Manage data.
  2. On the Datasets page, choose New data set.
  3. In the Create a Data Set page, choose the connection profile icon for the existing Athena data source that you want to use.
  4. Choose Create data set.
  5. On the Choose your table page, choose Use custom SQL and enter the Athena query.

After the dataset is created, you can add visualizations and analyze the data from the machine-readable file. With the QuickSight dashboard, organizations can easily perform price comparisons across different hospitals, identify high-cost services, and find other price outliers. In addition, you can use ML in QuickSight to gain ML-driven insights, detect pricing anomalies, and create forecasts based on historical files.

The following figure shows an illustrative QuickSight dashboard with insights comparing the machine-readable files from three different hospitals. With these visuals, you compare the pricing data across hospitals, create price benchmarks, determine cost-effective hospitals, and identify opportunities for competitive advantage.
Quicksight dashboard

Performance, operational, and cost considerations

The solution recommends QuickSight Enterprise for visualization and insights. For QuickSight dashboards, the Athena query results can be stored within the SPICE database for better performance.

The approach uses Athena V3, which offers performance improvements, reliability enhancements, and newer features. Using the Athena query result reuse feature enables caching and query result reuse. When multiple identical queries are run with the query result reuse option, repeat queries run up to five times faster, giving you increased productivity for interactive data analysis. Because you don’t scan the data, you get improved performance at a lower cost.

Cost

Hospitals create the machine-readable files on a monthly basis. This approach uses a serverless architecture that keeps the cost low and takes away the challenge of maintenance overhead. The analysis can begin with the machine-readable files for a few hospitals, and they can add new hospitals as they scale. The following example helps understand the cost for different hospital based on the data size:

  • A typical hospital with 100 GB storage/month, querying 20 GB data with 2 authors and 5 readers, costs around $2,500/year

AWS offers you a pay-as-you-go approach for pricing for the vast majority of our cloud services. With AWS you pay only for the individual services you need, for as long as you use them, and without requiring long-term contracts or complex licensing.

TCR Monthly cost

Conclusion

This post illustrated how to collect and analyze hospital-created price transparency data and generate insights using AWS services. This type of analysis and the visualizations provide the framework to analyze the machine-readable files. Hospitals, payors, brokers, underwriters, and other healthcare stakeholders can use this architecture to analyze and draw insights from pricing data published by hospitals of their choice. Our AWS teams can assist you to identify the correct strategy by offering thought leadership and prescriptive technical support for price transparency analysis.

Contact your AWS account team for more help on design and to explore private pricing. If you don’t have a contact with AWS yet, please reach out to be connected with an AWS representative.


About the Authors

Gokhul Srinivasan is a Senior Partner Solutions Architect leading AWS Healthcare and Life Sciences (HCLS) Global Startup Partners. Gokhul has over 19 years of Healthcare experience helping organizations with digital transformation, platform modernization, and deliver business outcomes.

Laks Sundararajan is a seasoned Enterprise Architect helping companies reset, transform and modernize their IT, digital, cloud, data and insight strategies. A proven leader with significant expertise around Generative AI, Digital, Cloud and Data/Analytics Transformation, Laks is a Sr. Solutions Architect with Healthcare and Life Sciences (HCLS).

Anil Chinnam Anil Chinnam is a Solutions Architect in the Digital Native Business Segment at Amazon Web Services(AWS). He enjoys working with customers to understand their challenges and solve them by creating innovative solutions using AWS services. Outside of work, Anil enjoys being a father, swimming and traveling.

Automated data governance with AWS Glue Data Quality, sensitive data detection, and AWS Lake Formation

Post Syndicated from Shoukat Ghouse original https://aws.amazon.com/blogs/big-data/automated-data-governance-with-aws-glue-data-quality-sensitive-data-detection-and-aws-lake-formation/

Data governance is the process of ensuring the integrity, availability, usability, and security of an organization’s data. Due to the volume, velocity, and variety of data being ingested in data lakes, it can get challenging to develop and maintain policies and procedures to ensure data governance at scale for your data lake. Data confidentiality and data quality are the two essential themes for data governance. Data confidentiality refers to the protection and control of sensitive and private information to prevent unauthorized access, especially when dealing with personally identifiable information (PII). Data quality focuses on maintaining accurate, reliable, and consistent data across the organization. Poor data quality can lead to erroneous decisions, inefficient operations, and compromised business performance.

Companies need to ensure data confidentiality is maintained throughout the data pipeline and that high-quality data is available to consumers in a timely manner. A lot of this effort is manual, where data owners and data stewards define and apply the policies statically up front for each dataset in the lake. This gets tedious and delays the data adoption across the enterprise.

In this post, we showcase how to use AWS Glue with AWS Glue Data Quality, sensitive data detection transforms, and AWS Lake Formation tag-based access control to automate data governance.

Solution overview

Let’s consider a fictional company, OkTank. OkTank has multiple ingestion pipelines that populate multiple tables in the data lake. OkTank wants to ensure the data lake is governed with data quality rules and access policies in place at all times.

Multiple personas consume data from the data lake, such as business leaders, data scientists, data analysts, and data engineers. For each set of users, a different level of governance is needed. For example, business leaders need top-quality and highly accurate data, data scientists cannot see PII data and need data within an acceptable quality range for their model training, and data engineers can see all data except PII.

Currently, these requirements are hard-coded and managed manually for each set of users. OkTank wants to scale this and is looking for ways to control governance in an automated way. Primarily, they are looking for the following features:

  • When new data and tables get added to the data lake, the governance policies (data quality checks and access controls) get automatically applied for them. Unless the data is certified to be consumed, it shouldn’t be accessible to the end-users. For example, they want to ensure basic data quality checks are applied on all new tables and provide access to the data based on the data quality score.
  • Due to changes in source data, the existing data profile of data lake tables may drift. It’s required to ensure the governance is met as defined. For example, the system should automatically mark columns as sensitive if sensitive data is detected in a column that was earlier marked as public and was available publicly for users. The system should hide the column from unauthorized users accordingly.

For the purpose of this post, the following governance policies are defined:

  • No PII data should exist in tables or columns tagged as public.
  • If  a column has any PII data, the column should be marked as sensitive. The table should then also be marked sensitive.
  • The following data quality rules should be applied on all tables:
    • All tables should have a minimum set of columns: data_key, data_load_date, and data_location.
    • data_key is a key column and should meet key requirements of being unique and complete.
    • data_location should match with locations defined in a separate reference (base) table.
    • The data_load_date column should be complete.
  • User access to tables is controlled as per the following table.
User Description Can Access Sensitive Tables Can Access Sensitive Columns Min Data Quality Threshold Needed to consume Data
Category 1 Yes Yes 100%
Category 2 Yes No 50%
Category 3 No No 0%

In this post, we use AWS Glue Data Quality and sensitive data detection features. We also use Lake Formation tag-based access control to manage access at scale.

The following diagram illustrates the solution architecture.

The governance requirements highlighted in the previous table are translated to the following Lake Formation LF-Tags.

IAM User LF-Tag: tbl_class LF-Tag: col_class LF-Tag: dq_tag
Category 1 sensitive, public sensitive, public DQ100
Category 2 sensitive, public public DQ100,DQ90,DQ50_80,DQ80_90
Category 3 public public DQ90, DQ100, DQ_LT_50, DQ50_80, DQ80_90

This post uses AWS Step Functions to orchestrate the governance jobs, but you can use any other orchestration tool of choice. To simulate data ingestion, we manually place the files in an Amazon Simple Storage Service (Amazon S3) bucket. In this post, we trigger the Step Functions state machine manually for ease of understanding. In practice, you can integrate or invoke the jobs as part of a data ingestion pipeline, via event triggers like AWS Glue crawler or Amazon S3 events, or schedule them as needed.

In this post, we use an AWS Glue database named oktank_autogov_temp and a target table named customer on which we apply the governance rules. We use AWS CloudFormation to provision the resources. AWS CloudFormation lets you model, provision, and manage AWS and third-party resources by treating infrastructure as code.

Prerequisites

Complete the following prerequisite steps:

  1. Identify an AWS Region in which you want to create the resources and ensure you use the same Region throughout the setup and verifications.
  2. Have a Lake Formation administrator role to run the CloudFormation template and grant permissions.

Sign in to the Lake Formation console and add yourself as a Lake Formation data lake administrator if you aren’t already an admin. If you are setting up Lake Formation for the first time in your Region, then you can do this in the following pop-up window that appears up when you connect to the Lake Formation console and select the desired Region.

Otherwise, you can add data lake administrators by choosing Administrative roles and tasks in the navigation pane on the Lake Formation console and choosing Add administrators. Then select Data lake administrator, identity your users and roles, and choose Confirm.

Deploy the CloudFormation stack

Run the provided CloudFormation stack to create the solution resources.

You need to provide a unique bucket name and specify passwords for the three users reflecting three different user personas (Category 1, Category 2, and Category 3) that we use for this post.

The stack provisions an S3 bucket to store the dummy data, AWS Glue scripts, results of sensitive data detection, and Amazon Athena query results in their respective folders.

The stack copies the AWS Glue scripts into the scripts folder and creates two AWS Glue jobs Data-Quality-PII-Checker_Job and LF-Tag-Handler_Job pointing to the corresponding scripts.

The AWS Glue job Data-Quality-PII-Checker_Job applies the data quality rules and publishes the results. It also checks for sensitive data in the columns. In this post, we check for the PERSON_NAME and EMAIL data types. If any columns with sensitive data are detected, it persists the sensitive data detection results to the S3 bucket.

AWS Glue Data Quality uses Data Quality Definition Language (DQDL) to author the data quality rules.

The data quality requirements as defined earlier in this post are written as the following DQDL in the script:

Rules = [
ReferentialIntegrity "data_location" "reference.data_location" = 1.0,
IsPrimaryKey "data_key",
ColumnExists "data_load_date",
IsComplete "data_load_date
]

The following screenshot shows a sample result from the job after it runs. You can see this after you trigger the Step Functions workflow in subsequent steps. To check the results, on the AWS Glue console, choose ETL jobs and choose the job called Data-Quality-PII-Checker_Job. Then navigate to the Data quality tab to view the results.

The AWS Glue jobLF-Tag-Handler_Job fetches the data quality metrics published by Data-Quality-PII-Checker_Job. It checks the status of the DataQuality_PIIColumns result. It gets the list of sensitive column names from the sensitive data detection file created in the Data-Quality-PII-Checker_Job and tags the columns as sensitive. The rest of the columns are tagged as public. It also tags the table assensitive if sensitive columns are detected. The table is marked as public if no sensitive columns are detected.

The job also checks the data quality score for the DataQuality_BasicChecks result set. It maps the data quality score into tags as shown in the following table and applies the corresponding tag on the table.

Data Quality Score Data Quality Tag
100% DQ100
90-100% DQ90
80-90% DQ80_90
50-80% DQ50_80
Less than 50% DQ_LT_50

The CloudFormation stack copies some mock data to the data folder and registers this location under AWS Lake Formation Data lake locations so Lake Formation can govern access on the location using service-linked role for Lake Formation.

The customer subfolder contains the initial customer dataset for the table customer. The base subfolder contains the base dataset, which we use to check referential integrity as part of the data quality checks. The column data_location in the customer table should match with locations defined in this base table.

The stack also copies some additional mock data to the bucket under the data-v1 folder. We use this data to simulate data quality issues.

It also creates the following resources:

  • An AWS Glue database called oktank_autogov_temp and two tables under the database:
    • customer – This is our target table on which we will be governing the access based on data quality rules and PII checks.
    • base – This is the base table that has the reference data. One of the data quality rules checks that the customer data always adheres to locations present in the base table.
  • AWS Identity and Access Management (IAM) users and roles:
    • DataLakeUser_Category1 – The data lake user corresponding to the Category 1 user. This user should be able to access sensitive data but needs 100% accurate data.
    • DataLakeUser_Category2 – The data lake user corresponding to the Category 2 user. This user should not be able to access sensitive columns in the table. It needs more than 50% accurate data.
    • DataLakeUser_Category3 – The data lake user corresponding to the Category 3 user. This user should not be able to access tables containing sensitive data. Data quality can be 0%.
    • GlueServiceDQRole – The role for the data quality and sensitive data detection job.
    • GlueServiceLFTaggerRole – The role for the LF-Tags handler job for applying the tags to the table.
    • StepFunctionRole – The Step Functions role for triggering the AWS Glue jobs.
  • Lake Formation LF-Tags keys and values:
    • tbl_class – sensitive, public
    • dq_class – DQ100, DQ90, DQ80_90, DQ50_80, DQ_LT_50
    • col_class – sensitive, public
  • A Step Functions state machine named AutoGovMachine that you use to trigger the runs for the AWS Glue jobs to check data quality and update the LF-Tags.
  • Athena workgroups named auto_gov_blog_workgroup_temporary_user1, auto_gov_blog_workgroup_temporary_user2, and auto_gov_blog_workgroup_temporary_user3. These workgroups point to different Athena query result locations for each user. Each user is granted access to the corresponding query result location only. This ensures a specific user doesn’t access the query results of other users. You should switch to a specific workgroup to run queries in Athena as part of the test for the specific user.

The CloudFormation stack generates the following outputs. Take note of the values of the IAM users to use in subsequent steps.

Grant permissions

After you launch the CloudFormation stack, complete the following steps:

  1. On the Lake Formation console, under Permissions choose Data lake permissions in the navigation pane.
  2. Search for the database oktank_autogov_temp and table customer.
  3. If IAMAllowedPrincipals access if present, select it choose Revoke.

  1. Choose Revoke again to revoke the permissions.

Category 1 users can access all data except if the data quality score of the table is below 100%. Therefore, we grant the user the necessary permissions.

  1. Under Permissions in the navigation pane, choose Data lake permissions.
  2. Search for database oktank_autogov_temp and table customer.
  3. Choose Grant
  4. Select IAM users and roles and choose the value for UserCategory1 from your CloudFormation stack output.
  5. Under LF-Tags or catalog resources, choose Add LF-Tag key-value pair.
  6. Add the following key-value pairs:
    1. For the col_class key, add the values public and sensitive.
    2. For the tbl_class key, add the values public and sensitive.
    3. For the dq_tag key, add the value DQ100.

  1. For Table permissions, select Select.
  2. Choose Grant.

Category 2 users can’t access sensitive columns. They can access tables with a data quality score above 50%.

  1. Repeat the preceding steps to grant the appropriate permissions in Lake Formation to UserCategory2:
    1. For the col_class key, add the value public.
    2. For the tbl_class key, add the values public and sensitive.
    3. For the dq_tag key, add the values DQ50_80, DQ80_90, DQ90, and DQ100.

  1. For Table permissions, select Select.
  2. Choose Grant.

Category 3 users can’t access tables that contain any sensitive columns. Such tables are marked as sensitive by the system. They can access tables with any data quality score.

  1. Repeat the preceding steps to grant the appropriate permissions in Lake Formation to UserCategory3:
    1. For the col_class key, add the value public.
    2. For the tbl_class key, add the value public.
    3. For the dq_tag key, add the values DQ_LT_50, DQ50_80, DQ80_90, DQ90, and DQ100.

  1. For Table permissions, select Select.
  2. Choose Grant.

You can verify the LF-Tag permissions assigned in Lake Formation by navigating to the Data lake permissions page and searching for the Resource type LF-Tag expression.

Test the solution

Now we can test the workflow. We test three different use cases in this post. You will notice how the permissions to the tables change based on the values of LF-Tags applied to the customer table and the columns of the table. We use Athena to query the tables.

Use case 1

In this first use case, a new table was created on the lake and new data was ingested to the table. The data file cust_feedback_v0.csv was copied to the data/customer location in the S3 bucket. This simulates new data ingestion on a new table called customer.

Lake Formation doesn’t allow any users to access this table currently. To test this scenario, complete the following steps:

  1. Sign in to the Athena console with the UserCategory1 user.
  2. Switch the workgroup to auto_gov_blog_workgroup_temporary_user1 in the Athena query editor.
  3. Choose Acknowledge to accept the workgroup settings.

  1. Run the following query in the query editor:
select * from "oktank_autogov_temp"."customer" limit 10

  1. On the Step Functions console, run the AutoGovMachine state machine.
  2. In the Input – optional section, use the following JSON and replace the BucketName value with the bucket name you used for the CloudFormation stack earlier (for this post, we use auto-gov-blog):
{
  "Comment": "Auto Governance with AWS Glue and AWS LakeFormation",
  "BucketName": "<Replace with your bucket name>"
}

The state machine triggers the AWS Glue jobs to check data quality on the table and apply the corresponding LF-Tags.

  1. You can check the LF-Tags applied on the table and the columns. To do so, when the state machine is complete, sign in to Lake Formation with the admin role used earlier to grant permissions.
  2. Navigate to the table customer under the oktank_autogov_temp database and choose Edit LF-Tags to validate the tags applied on the table.

You can also validate that columns customer_email and customer_name are tagged as sensitive for the col_class LF-Tag.

  1. To check this, choose Edit Schema for the customer table.
  2. Select the two columns and choose Edit LF-Tags.

You can check the tags on these columns.

The rest of the columns are tagged as public.

  1. Sign in to the Athena console with UserCategory1 and run the same query again:
select * from "oktank_autogov_temp"."customer" limit 10

This time, the user is able to see the data. This is because the LF-Tag permissions we applied earlier are in effect.

  1. Sign in as UserCategory2 user to verify permissions.
  2. Switch to workgroup auto_gov_blog_workgroup_temporary_user2 in Athena.

This user can access the table but can only see public columns. Therefore, the user shouldn’t be able to see the customer_email and customer_phone columns because these columns contain sensitive data as identified by the system.

  1. Run the same query again:
select * from "oktank_autogov_temp"."customer" limit 10

  1. Sign in to Athena and verify the permissions for DataLakeUser_Category3.
  2. Switch to workgroup auto_gov_blog_workgroup_temporary_user3 in Athena.

This user can’t access the table because the table is marked as sensitive due to the presence of sensitive data columns in the table.

  1. Run the same query again:
select * from "oktank_autogov_temp"."customer" limit 10

Use case 2

Let’s ingest some new data on the table.

  1. Sign in to the Amazon S3 console with the admin role used earlier to grant permissions.
  2. Copy the file cust_feedback_v1.csv from the data-v1 folder in the S3 bucket to the data/customer folder in the S3 bucket using the default options.

This new data file has data quality issues because the column data_location breaks referential integrity with the base table. This data also introduces some sensitive data in column comment1. This column was earlier marked as public because it didn’t have any sensitive data.

The following screenshot shows what the customer folder should look like now.

  1. Run the AutoGovMachine state machine again and use the same JSON as the StartExecution input you used earlier:
{
  "Comment": "Auto Governance with AWS Glue and AWS LakeFormation",
  "BucketName": "<Replace with your bucket name>"
}

The job classifies column comment1 as sensitive on the customer table. It also updates the dq_tag value on the table because the data quality has changed due to the breaking referential integrity check.

You can verify the new tag values via the Lake Formation console as described earlier. The dq_tag value was DQ100. The value is changed to DQ50_80, reflecting the data quality score for the table.

Also, earlier the value for the col_class tag for the comment1 column was public. The value is now changed to sensitive because sensitive data is detected in this column.

Category 2 users shouldn’t be able to access sensitive columns in the table.

  1. Sign in with UserCategory2 to Athena and rerun the earlier query:
select * from "oktank_autogov_temp"."customer" limit 10

The column comment1 is now not available for UserCategory2 as expected. The access permissions are handled automatically.

Also, because the data quality score goes down below 100%, this new dataset is now not available for the Category1 user. This user should have access to data only when the score is 100% as per our defined rules.

  1. Sign in with UserCategory1 to Athena and rerun the earlier query:
select * from "oktank_autogov_temp"."customer" limit 10

You will see the user is not able to access the table now. The access permissions are handled automatically.

Use case 3

Let’s fix the invalid data and remove the data quality issue.

  1. Delete the cust_feedback_v1.csv file from the data/customer Amazon S3 location.
  2. Copy the file cust_feedback_v1_fixed.csv from the data-v1 folder in the S3 bucket to the data/customer S3 location. This data file fixes the data quality issues.
  3. Rerun the AutoGovMachine state machine.

When the state machine is complete, the data quality score goes up to 100% again and the tag on the table gets updated accordingly. You can verify the new tag as shown earlier via the Lake Formation console.

The Category1 user can access the table again.

Clean up

To avoid incurring further charges, delete the CloudFormation stack to delete the resources provisioned as part of this post.

Conclusion

This post covered AWS Glue Data Quality and sensitive detection features and Lake Formation LF-Tag based access control. We explored how you can combine these features and use them to build a scalable automated data governance capability on your data lake. We explored how user permissions changed when data was initially ingested to the table and when data drift was observed as part of subsequent ingestions.

For further reading, refer to the following resources:


About the Author

Shoukat Ghouse is a Senior Big Data Specialist Solutions Architect at AWS. He helps customers around the world build robust, efficient and scalable data platforms on AWS leveraging AWS analytics services like AWS Glue, AWS Lake Formation, Amazon Athena and Amazon EMR.

Simplify data transfer: Google BigQuery to Amazon S3 using Amazon AppFlow

Post Syndicated from Kartikay Khator original https://aws.amazon.com/blogs/big-data/simplify-data-transfer-google-bigquery-to-amazon-s3-using-amazon-appflow/

In today’s data-driven world, the ability to effortlessly move and analyze data across diverse platforms is essential. Amazon AppFlow, a fully managed data integration service, has been at the forefront of streamlining data transfer between AWS services, software as a service (SaaS) applications, and now Google BigQuery. In this blog post, you explore the new Google BigQuery connector in Amazon AppFlow and discover how it simplifies the process of transferring data from Google’s data warehouse to Amazon Simple Storage Service (Amazon S3), providing significant benefits for data professionals and organizations, including the democratization of multi-cloud data access.

Overview of Amazon AppFlow

Amazon AppFlow is a fully managed integration service that you can use to securely transfer data between SaaS applications such as Google BigQuery, Salesforce, SAP, Hubspot, and ServiceNow, and AWS services such as Amazon S3 and Amazon Redshift, in just a few clicks. With Amazon AppFlow, you can run data flows at nearly any scale at the frequency you choose—on a schedule, in response to a business event, or on demand. You can configure data transformation capabilities such as filtering and validation to generate rich, ready-to-use data as part of the flow itself, without additional steps. Amazon AppFlow automatically encrypts data in motion, and allows you to restrict data from flowing over the public internet for SaaS applications that are integrated with AWS PrivateLink, reducing exposure to security threats.

Introducing the Google BigQuery connector

The new Google BigQuery connector in Amazon AppFlow unveils possibilities for organizations seeking to use the analytical capability of Google’s data warehouse, and to effortlessly integrate, analyze, store, or further process data from BigQuery, transforming it into actionable insights.

Architecture

Let’s review the architecture to transfer data from Google BigQuery to Amazon S3 using Amazon AppFlow.

architecture

  1. Select a data source: In Amazon AppFlow, select Google BigQuery as your data source. Specify the tables or datasets you want to extract data from.
  2. Field mapping and transformation: Configure the data transfer using the intuitive visual interface of Amazon AppFlow. You can map data fields and apply transformations as needed to align the data with your requirements.
  3. Transfer frequency: Decide how frequently you want to transfer data—such as daily, weekly, or monthly—supporting flexibility and automation.
  4. Destination: Specify an S3 bucket as the destination for your data. Amazon AppFlow will efficiently move the data, making it accessible in your Amazon S3 storage.
  5. Consumption: Use Amazon Athena to analyze the data in Amazon S3.

Prerequisites

The dataset used in this solution is generated by Synthea, a synthetic patient population simulator and opensource project under the Apache License 2.0. Load this data into Google BigQuery or use your existing dataset.

Connect Amazon AppFlow to your Google BigQuery account

For this post, you use a Google account, OAuth client with appropriate permissions, and Google BigQuery data. To enable Google BigQuery access from Amazon AppFlow, you must set up a new OAuth client in advance. For instructions, see Google BigQuery connector for Amazon AppFlow.

Set up Amazon S3

Every object in Amazon S3 is stored in a bucket. Before you can store data in Amazon S3, you must create an S3 bucket to store the results.

Create a new S3 bucket for Amazon AppFlow results

To create an S3 bucket, complete the following steps:

  1. On the AWS Management console for Amazon S3, choose Create bucket.
  2. Enter a globally unique name for your bucket; for example, appflow-bq-sample.
  3. Choose Create bucket.

Create a new S3 bucket for Amazon Athena results

To create an S3 bucket, complete the following steps:

  1. On the AWS Management console for Amazon S3, choose Create bucket.
  2. Enter a globally unique name for your bucket; for example, athena-results.
  3. Choose Create bucket.

User role (IAM role) for AWS Glue Data Catalog

To catalog the data that you transfer with your flow, you must have the appropriate user role in AWS Identity and Access Management (IAM). You provide this role to Amazon AppFlow to grant the permissions it needs to create an AWS Glue Data Catalog, tables, databases, and partitions.

For an example IAM policy that has the required permissions, see Identity-based policy examples for Amazon AppFlow.

Walkthrough of the design

Now, let’s walk through a practical use case to see how the Amazon AppFlow Google BigQuery to Amazon S3 connector works. For the use case, you will use Amazon AppFlow to archive historical data from Google BigQuery to Amazon S3 for long-term storage an analysis.

Set up Amazon AppFlow

Create a new Amazon AppFlow flow to transfer data from Google Analytics to Amazon S3.

  1. On the Amazon AppFlow console, choose Create flow.
  2. Enter a name for your flow; for example, my-bq-flow.
  3. Add necessary Tags; for example, for Key enter env and for Value enter dev.

appflow-flow-setup­­­­

  1. Choose Next.
  2. For Source name, choose Google BigQuery.
  3. Choose Create new connection.
  4. Enter your OAuth Client ID and Client Secret, then name your connection; for example, bq-connection.

­bq-connection

  1. In the pop-up window, choose to allow amazon.com access to the Google BigQuery API.

bq-authentication

  1. For Choose Google BigQuery object, choose Table.
  2. For Choose Google BigQuery subobject, choose BigQueryProjectName.
  3. For Choose Google BigQuery subobject, choose DatabaseName.
  4. For Choose Google BigQuery subobject, choose TableName.
  5. For Destination name, choose Amazon S3.
  6. For Bucket details, choose the Amazon S3 bucket you created for storing Amazon AppFlow results in the prerequisites.
  7. Enter raw as a prefix.

appflow-source-destination

  1. Next, provide AWS Glue Data Catalog settings to create a table for further analysis.
    1. Select the User role (IAM role) created in the prerequisites.
    2. Create new database for example, healthcare.
    3. Provide a table prefix setting for example, bq.

glue-crawler-config

  1. Select Run on demand.

appflow-trigger-setup

  1. Choose Next.
  2. Select Manually map fields.
  3. Select the following six fields for Source field name from the table Allergies:
    1. Start
    2. Patient
    3. Code
    4. Description
    5. Type
    6. Category
  4. Choose Map fields directly.

appflow-field-mapping

  1. Choose Next.
  2. In the Add filters section, choose Next.
  3. Choose Create flow.

Run the flow

After creating your new flow, you can run it on demand.

  1. On the Amazon AppFlow console, choose my-bq-flow.
  2. Choose Run flow.

sppflow-run--status

For this walkthrough, choose run the job on-demand for ease of understanding. In practice, you can choose a scheduled job and periodically extract only newly added data.

Query through Amazon Athena

When you select the optional AWS Glue Data Catalog settings, Data Catalog creates the catalog for the data, allowing Amazon Athena to perform queries.

If you’re prompted to configure a query results location, navigate to the Settings tab and choose Manage. Under Manage settings, choose the Athena results bucket created in prerequisites and choose Save.

  1. On the Amazon Athena console, select the Data Source as AWSDataCatalog.
  2. Next, select Database as healthcare.
  3. Now you can select the table created by the AWS Glue crawler and preview it.

athena-results

  1. You can also run a custom query to find the top 10 allergies as shown in the following query.

Note: In the below query, replace the table name, in this case bq_appflow_mybqflow_1693588670_latest, with the name of the table generated in your AWS account.

SELECT type,
category,
"description",
count(*) as number_of_cases
FROM "healthcare"."bq_appflow_mybqflow_1693588670_latest"
GROUP BY type,
category,
"description"
ORDER BY number_of_cases DESC
LIMIT 10;

  1. Choose Run query.

athena-custom-query-results

This result shows the top 10 allergies by number of cases.

Clean up

To avoid incurring charges, clean up the resources in your AWS account by completing the following steps:

  1. On the Amazon AppFlow console, choose Flows in the navigation pane.
  2. From the list of flows, select the flow my-bq-flow, and delete it.
  3. Enter delete to delete the flow.
  4. Choose Connections in the navigation pane.
  5. Choose Google BigQuery from the list of connectors, select bq-connector, and delete it.
  6. Enter delete to delete the connector.
  7. On the IAM console, choose Roles in the navigation page, then select the role you created for AWS Glue crawler and delete it.
  8. On the Amazon Athena console:
    1. Delete the tables created under the database healthcare using AWS Glue crawler.
    2. Drop the database healthcare
  9. On the Amazon S3 console, search for the Amazon AppFlow results bucket you created, choose Empty to delete the objects, then delete the bucket.
  10. On the Amazon S3 console, search for the Amazon Athena results bucket you created, choose Empty to delete the objects, then delete the bucket.
  11. Clean up resources in your Google account by deleting the project that contains the Google BigQuery resources. Follow the documentation to clean up the Google resources.

Conclusion

The Google BigQuery connector in Amazon AppFlow streamlines the process of transferring data from Google’s data warehouse to Amazon S3. This integration simplifies analytics and machine learning, archiving, and long-term storage, providing significant benefits for data professionals and organizations seeking to harness the analytical capabilities of both platforms.

With Amazon AppFlow, the complexities of data integration are eliminated, enabling you to focus on deriving actionable insights from your data. Whether you’re archiving historical data, performing complex analytics, or preparing data for machine learning, this connector simplifies the process, making it accessible to a broader range of data professionals.

If you’re interested to see how the data transfer from Google BigQuery to Amazon S3 using Amazon AppFlow, take a look at step-by-step video tutorial. In this tutorial, we walk through the entire process, from setting up the connection to running the data transfer flow. For more information on Amazon AppFlow, visit Amazon AppFlow.


About the authors

Kartikay Khator is a Solutions Architect on the Global Life Science at Amazon Web Services. He is passionate about helping customers on their cloud journey with focus on AWS analytics services. He is an avid runner and enjoys hiking.

Kamen SharlandjievKamen Sharlandjiev is a Sr. Big Data and ETL Solutions Architect and Amazon AppFlow expert. He’s on a mission to make life easier for customers who are facing complex data integration challenges. His secret weapon? Fully managed, low-code AWS services that can get the job done with minimal effort and no coding.

Automate legacy ETL conversion to AWS Glue using Cognizant Data and Intelligence Toolkit (CDIT) – ETL Conversion Tool

Post Syndicated from Deepak Singh original https://aws.amazon.com/blogs/big-data/automate-legacy-etl-conversion-to-aws-glue-using-cognizant-data-and-intelligence-toolkit-cdit-etl-conversion-tool/

This blog post is co-written with Govind Mohan and Kausik Dhar from Cognizant. 

Migrating on-premises data warehouses to the cloud is no longer viewed as an option but a necessity for companies to save cost and take advantage of what the latest technology has to offer. Although we have seen a lot of focus toward migrating data from legacy data warehouses to the cloud and multiple tools to support this initiative, data is only part of the journey. Successful migration of legacy extract, transform, and load (ETL) processes that acquire, enrich, and transform the data plays a key role in the success of any end-to-end data warehouse migration to the cloud.

The traditional approach of manually rewriting a large number of ETL processes to cloud-native technologies like AWS Glue is time consuming and can be prone to human error. Cognizant Data & Intelligence Toolkit (CDIT) – ETL Conversion Tool automates this process, bringing in more predictability and accuracy, eliminating the risk associated with manual conversion, and providing faster time to market for customers.

Cognizant is an AWS Premier Tier Services Partner with several AWS Competencies. With its industry-based, consultative approach, Cognizant helps clients envision, build, and run more innovative and efficient businesses.

In this post, we describe how Cognizant’s Data & Intelligence Toolkit (CDIT)- ETL Conversion Tool can help you automatically convert legacy ETL code to AWS Glue quickly and effectively. We also describe the main steps involved, the supported features, and their benefits.

Solution overview

Cognizant Data & Intelligence Toolkit (CDIT): ETL Conversion Tool automates conversion of ETL pipelines and orchestration code from legacy tools to AWS Glue and AWS Step Functions and eliminates the manual processes involved in a customer’s ETL cloud migration journey.

It comes with an intuitive user interface (UI). You can use these accelerators by selecting the source and target ETL tool for conversion and then uploading an XML file of the ETL mapping to be converted as input.

The tool also supports continuous monitoring of the overall progress, and alerting mechanisms are in place in the event of any failures, errors, or operational issues.

Cognizant Data & Intelligence Toolkit (CDIT): ETL Conversion Tool internally uses many native AWS services, such as Amazon Simple Storage Service (Amazon S3) and Amazon Relational Database Service (Amazon RDS) for storage and metadata management; Amazon Elastic Compute Cloud (Amazon EC2) and AWS Lambda for processing; Amazon CloudWatch, AWS Key Management Service (AWS KMS), and AWS IAM Identity Center (successor to AWS Single Sign-On) for monitoring and security; and AWS CloudFormation for infrastructure management. The following diagram illustrates this architecture.

How to use CDIT: ETL Conversion Tool for ETL migration.

Cognizant Data & Intelligence Toolkit (CDIT): ETL Conversion Tool supports the following legacy ETL tools as source and supports generating corresponding AWS Glue ETL scripts in both Python and Scala:

  • Informatica
  • DataStage
  • SSIS
  • Talend

Let’s look at the migration steps in more detail.

Assess the legacy ETL process

Cognizant Data & Intelligence Toolkit (CDIT): ETL Conversion Tool enables you to assess in bulk the potential automation percentage and complexity of a set of ETL jobs and workflows that are in scope for migration to AWS Glue. The assessment option helps you understand what kind of saving can be achieved using Cognizant Data & Intelligence Toolkit (CDIT): ETL Conversion Tool, the complexity of the ETL mappings, and the extent of manual conversion needed, if any. You can upload a single ETL mapping or a folder containing multiple ETL mappings as input for assessment and generate an assessment report, as shown in the following figure.

Convert the ETL code to AWS Glue

To convert legacy ETL code, you upload the XML file of the ETL mapping as input to the tool. User inputs are stored in the internal metadata repository of the tool and Cognizant Data & Intelligence Toolkit (CDIT): ETL Conversion Tool parses these XML input files and breaks them down to a patented canonical model, which is then forward engineered into the target AWS Glue scripts in Python or Scala. The following screenshot shows an example of the Cognizant Data & Intelligence Toolkit (CDIT): ETL Conversion Tool GUI and Output Console pane.

If any part of the input ETL job couldn’t be converted completely to the equivalent AWS Glue script, it’s tagged between comment lines in the output so that it can be manually fixed.

Convert the workflow to Step Functions

The next logical step after converting the legacy ETL jobs is to orchestrate the run of these jobs in the logical order. Cognizant Data & Intelligence Toolkit (CDIT): ETL Conversion Tool lets you automate the conversion of on-premises ETL workflows by converting them to corresponding Step Functions workflows. The following figure illustrates a sample input Informatica workflow.

Workflow conversion follows the similar pattern as that of the ETL mapping. XML files for ETL workflows are uploaded as input and Cognizant Data & Intelligence Toolkit (CDIT): ETL Conversion Tool it generates the equivalent Step Functions JSON file based on the input XML file data.

Benefits of using Cognizant Data & Intelligence Toolkit (CDIT): ETL Conversion Tool

The following are the key benefits of using Cognizant Data & Intelligence Toolkit (CDIT): ETL Conversion Tool to automate legacy ETL conversion:

  • Cost reduction – You can reduce the overall migration effort by as much as 80% by automating the conversion of ETL and workflows to AWS Glue and Step Functions
  • Better planning and implementation – You can assess the ETL scope and determine automation percentage, complexity, and unsupported patterns before the start of the project, resulting in accurate estimation and timelines
  • Completeness – Cognizant Data & Intelligence Toolkit (CDIT): ETL Conversion Tool offers one solution with support for multiple legacy ETL tools like Informatica, DataStage, Talend, and more.
  • Improved customer experience – You can achieve migration goals seamlessly without errors caused by manual conversion and with high automation percentage

Case study: Cognizant Data & Intelligence Toolkit (CDIT): ETL Conversion Tool proposed implementation

A large US-based insurance and annuities company wanted to migrate their legacy ETL process in Informatica to AWS Glue as part of their cloud migration strategy.

As part of this engagement, Cognizant helped the customer successfully migrate their Informatica based data acquisition and integration ETL jobs and workflows to AWS. A proof of concept (PoC) using Cognizant Data & Intelligence Toolkit (CDIT): ETL Conversion Tool was completed first to showcase and validate automation capabilities.

Cognizant Data & Intelligence Toolkit (CDIT): ETL Conversion Tool was used to automate the conversion of over 300 Informatica mappings and workflows to equivalent AWS Glue jobs and Step Functions workflows, respectively. As a result, the customer was able to migrate all legacy ETL code to AWS as planned and retire the legacy application.

The following are key highlights from this engagement:

  • Migration of over 300 legacy Informatica ETL jobs to AWS Glue
  • Automated conversion of over 6,000 transformations from legacy ETL to AWS Glue
  • 85% automation achieved using CDIT: ETL Conversion Tool
  • The customer saved licensing fees and retired their legacy application as planned

Conclusion

In this post, we discussed how migrating legacy ETL processes to the cloud is critical to the success of a cloud migration journey. Cognizant Data & Intelligence Toolkit (CDIT): ETL Conversion Tool enables you to perform an assessment of the existing ETL process to derive complexity and automation percentage for better estimation and planning. We also discussed the ETL technologies supported by Cognizant Data & Intelligence Toolkit (CDIT): ETL Conversion Tool and how ETL jobs can be converted to corresponding AWS Glue scripts. Lastly, we demonstrated how to use existing ETL workflows to automatically generate corresponding Step Functions orchestration jobs.

To learn more, please reach out to Cognizant.


About the Authors

Deepak Singh is a Senior Solutions Architect at Amazon Web Services with 20+ years of experience in Data & AIA. He enjoys working with AWS partners and customers on building scalable analytical solutions for their business outcomes. When not at work, he loves spending time with family or exploring new technologies in analytics and AI space.

Piyush Patra is a Partner Solutions Architect at Amazon Web Services where he supports partners with their Analytics journeys and is the global lead for strategic Data Estate Modernization and Migration partner programs.

Govind Mohan is an Associate Director with Cognizant with over 18 year of experience in data and analytics space, he has helped design and implement multiple large-scale data migration, application lift & shift and legacy modernization projects and works closely with customers in accelerating the cloud modernization journey leveraging Cognizant Data and Intelligence Toolkit (CDIT) platform.

Kausik Dhar is a technology leader having more than 23 years of IT experience – primarily focused on Data & Analytics, Data Modernization, Application Development, Delivery Management, and Solution Architecture. He has played a pivotal role in guiding clients through the designing and executing large-scale data and process migrations, in addition to spearheading successful cloud implementations. Kausik possesses expertise in formulating migration strategies for complex programs and adeptly constructing data lake/Lakehouse architecture employing a wide array of tools and technologies.

Migrate an existing data lake to a transactional data lake using Apache Iceberg

Post Syndicated from Rajdip Chaudhuri original https://aws.amazon.com/blogs/big-data/migrate-an-existing-data-lake-to-a-transactional-data-lake-using-apache-iceberg/

A data lake is a centralized repository that you can use to store all your structured and unstructured data at any scale. You can store your data as-is, without having to first structure the data and then run different types of analytics for better business insights. Over the years, data lakes on Amazon Simple Storage Service (Amazon S3) have become the default repository for enterprise data and are a common choice for a large set of users who query data for a variety of analytics and machine leaning use cases. Amazon S3 allows you to access diverse data sets, build business intelligence dashboards, and accelerate the consumption of data by adopting a modern data architecture or data mesh pattern on Amazon Web Services (AWS).

Analytics use cases on data lakes are always evolving. Oftentimes, you want to continuously ingest data from various sources into a data lake and query the data concurrently through multiple analytics tools with transactional capabilities. But traditionally, data lakes built on Amazon S3 are immutable and don’t provide the transactional capabilities needed to support changing use cases. With changing use cases, customers are looking for ways to not only move new or incremental data to data lakes as transactions, but also to convert existing data based on Apache Parquet to a transactional format. Open table formats, such as Apache Iceberg, provide a solution to this issue. Apache Iceberg enables transactions on data lakes and can simplify data storage, management, ingestion, and processing.

In this post, we show you how you can convert existing data in an Amazon S3 data lake in Apache Parquet format to Apache Iceberg format to support transactions on the data using Jupyter Notebook based interactive sessions over AWS Glue 4.0.

Existing Parquet to Iceberg migration

There are two broad methods to migrate the existing data in a data lake in Apache Parquet format to Apache Iceberg format to convert the data lake to a transactional table format.

In-place data upgrade

In an in-place data migration strategy, existing datasets are upgraded to Apache Iceberg format without first reprocessing or restating existing data. This means the data files in the data lake aren’t modified during the migration and all Apache Iceberg metadata files (manifests, manifest files, and table metadata files) are generated outside the purview of the data. In this method, the metadata are recreated in an isolated environment and colocated with the existing data files. This can be a much less expensive operation compared to rewriting all the data files. The existing data file format must be Apache Parquet, Apache ORC, or Apache Avro. An in-place migration can be performed in either of two ways:

  1. Using add_files: This procedure adds existing data files to an existing Iceberg table with a new snapshot that includes the files. Unlike migrate or snapshot, add_files can import files from a specific partition or partitions and doesn’t create a new Iceberg table. This procedure doesn’t analyze the schema of the files to determine if they match the schema of the Iceberg table. Upon completion, the Iceberg table treats these files as if they are part of the set of files owned by Apache Iceberg.
  2. Using migrate: This procedure replaces a table with an Apache Iceberg table loaded with the source’s data files. The table’s schema, partitioning, properties, and location are copied from the source table. Supported formats are Avro, Parquet, and ORC. By default, the original table is retained with the name table_BACKUP_. However, to leave the original table intact during the process, you must use snapshot to create a new temporary table that has the same source data files and schema.

In this post, we show you how you can use the Iceberg add_files procedure for an in-place data upgrade. Note that the migrate procedure isn’t supported in AWS Glue Data Catalog.

The following diagram shows a high-level representation.

CTAS migration of data

The create table as select (CTAS) migration approach is a technique where all the metadata information for Iceberg is generated along with restating all the data files. This method shadows the source dataset in batches. When the shadow is caught up, you can swap the shadowed dataset with the source.

The following diagram showcases the high-level flow.

Prerequisites

To follow along with the walkthrough, you must have the following:

You can check the data size using the following code in the AWS CLI or AWS CloudShell:

//Run this command to check the data size

aws s3 ls --summarize --human-readable --recursive s3://noaa-ghcn-pds/parquet/by_year/YEAR=2023

As of writing this post, there are 107 objects with total size of 70 MB for year 2023 in the Amazon S3 path.

Note that to implement the solution, you must complete a few preparatory steps.

Deploy resources using AWS CloudFormation

Complete the following steps to create the S3 bucket and the AWS IAM role and policy for the solution:

  1. Sign in to your AWS account and then choose Launch Stack to launch the CloudFormation template.

  1. For Stack name, enter a name.
  2. Leave the parameters at the default values. Note that if the default values are changed, then you must make corresponding changes throughout the following steps.
  3. Choose Next to create your stack.

This AWS CloudFormation template deploys the following resources:

  • An S3 bucket named demo-blog-post-XXXXXXXX (XXXXXXXX represents the AWS account ID used).
  • Two folders named parquet and iceberg under the bucket.
  • An IAM role and a policy named demoblogpostrole and demoblogpostscoped respectively.
  • An AWS Glue database named ghcn_db.
  • An AWS Glue Crawler named demopostcrawlerparquet.

After the the AWS CloudFormation template is successfully deployed:

  1. Copy the data in the created S3 bucket using following command in AWS CLI or AWS CloudShell. Replace XXXXXXXX appropriately in the target S3 bucket name.
    Note: In the example, we copy data only for the year 2023. However, you can work with the entire dataset, following the same instructions.

    aws s3 sync s3://noaa-ghcn-pds/parquet/by_year/YEAR=2023/ s3://demo-blog-post-XXXXXXXX/parquet/year=2023

  2. Open the AWS Management Console and go to the AWS Glue console.
  3. On the navigation pane, select Crawlers.
  4. Run the crawler named demopostcrawlerparquet.
  5. After the AWS Glue crawler demopostcrawlerparquet is successfully run, the metadata information of the Apache Parquet data will be cataloged under the ghcn_db AWS Glue database with the table name source_parquet. Notice that the table is partitioned over year and element columns (as in the S3 bucket).

  1. Use the following query to verify the data from the Amazon Athena console. If you’re using Amazon Athena for the first time in your AWS Account, set up a query result location in Amazon S3.
    SELECT * FROM ghcn_db.source_parquet limit 10;

Launch an AWS Glue Studio notebook for processing

For this post, we use an AWS Glue Studio notebook. Follow the steps in Getting started with notebooks in AWS Glue Studio to set up the notebook environment. Launch the notebooks hosted under this link and unzip them on a local workstation.

  1. Open AWS Glue Studio.
  2. Choose ETL Jobs.
  3. Choose Jupyter notebook and then choose Upload and edit an existing notebook. From Choose file, select required ipynb file and choose Open, then choose Create.
  4. On the Notebook setup page, for Job name, enter a logical name.
  5. For IAM role, select demoblogpostrole. Choose Create job. After a minute, the Jupyter notebook editor appears. Clear all the default cells.

The preceding steps launch an AWS Glue Studio notebook environment. Make sure you Save the notebook every time it’s used.

In-place data upgrade

In this section we show you how you can use the add_files procedure to achieve an in-place data upgrade. This section uses the ipynb file named demo-in-place-upgrade-addfiles.ipynb. To use with the add_files procedure, complete the following:

  1. On the Notebook setup page, for Job name, enter demo-in-place-upgrade for the notebook session as explained in Launch Glue notebook for processing.
  2. Run the cells under the section Glue session configurations. Provide the S3 bucket name from the prerequisites for the bucket_name variable by replacing XXXXXXXX.
  3. Run the subsequent cells in the notebook.

Notice that the cell under Execute add_files procedure section performs the metadata creation in the mentioned path.

Review the data file paths for the new Iceberg table. To show an Iceberg table’s current data files, .files can be used to get details such as file_path, partition, and others. Recreated files are pointing to the source path under Amazon S3.

Note the metadata file location after transformation. It’s pointing to the new folder named iceberg under Amazon S3. This can be checked using .snapshots to check Iceberg tables’ snapshot file location. Also, check the same in the Amazon S3 URI s3://demo-blog-post-XXXXXXXX/iceberg/ghcn_db.db/target_iceberg_add_files/metadata/. Also notice that there are two versions of the manifest list created after the add_files procedure has been run. The first is an empty table with the data schema and the second is adding the files.

The table is cataloged in AWS Glue under the database ghcn_db with the table type as ICEBERG.

Compare the count of records using Amazon Athena between the source and target table. They are the same.

In summary, you can use the add_files procedure to convert existing data files in Apache Parquet format in a data lake to Apache Iceberg format by adding the metadata files and without recreating the table from scratch. Following are some pros and cons of this method.

Pros

  • Avoids full table scans to read the data as there is no restatement. This can save time.
  • If there are any errors during while writing the metadata, only a metadata re-write is required and not the entire data.
  • Lineage of the existing jobs is maintained because the existing catalog still exists.

Cons

  • If data is processed (inserts, updates, and deletes) in the dataset during the metadata writing process, the process must be run again to include the new data.
  • There must be write downtime to avoid having to run the process a second time.
  • If a data restatement is required, this workflow will not work as source data files aren’t modified.

CTAS migration of data

This section uses the ipynb file named demo-ctas-upgrade.ipynb. Complete the following:

  1. On the Notebook setup page, for Job name, enter demo-ctas-upgrade for the notebook session as explained under Launch Glue notebook for processing.
  2. Run the cells under the section Glue session configurations. Provide the S3 bucket name from the prerequisites for the bucket_name variable by replacing XXXXXXXX.
  3. Run the subsequent cells in the notebook.

Notice that the cell under Create Iceberg table from Parquet section performs the shadow upgrade to Iceberg format. Note that Iceberg requires sorting the data according to table partitions before writing to the Iceberg table. Further details can be found in Writing Distribution Modes.

Notice the data and metadata file paths for the new Iceberg table. It’s pointing to the new path under Amazon S3. Also, check under the Amazon S3 URI s3://demo-blog-post-XXXXXXXX/iceberg/ghcn_db.db/target_iceberg_ctas/ used for this post.

The table is cataloged under AWS Glue under the database ghcn_db with the table type as ICEBERG.

Compare the count of records using Amazon Athena between the source and target table. They are same.

In summary, the CTAS method creates a new table by generating all the metadata files along with restating the actual data. Following are some pros and cons of this method:

Pros

  • It allows you to audit and validate the data during the process because data is restated.
  • If there are any runtime issues during the migration process, rollback and recovery can be easily performed by deleting the Apache Iceberg table.
  • You can test different configurations when migrating a source. You can create a new table for each configuration and evaluate the impact.
  • Shadow data is renamed to a different directory in the source (so it doesn’t collide with old Apache Parquet data).

Cons

  • Storage of the dataset is doubled during the process as both the original Apache Parquet and new Apache Iceberg tables are present during the migration and testing phase. This needs to be considered during cost estimation.
  • The migration can take much longer (depending on the volume of the data) because both data and metadata are written.
  • It’s difficult to keep tables in sync if there changes to the source table during the process.

Clean up

To avoid incurring future charges, and to clean up unused roles and policies, delete the resources you created: the datasets, CloudFormation stack, S3 bucket, AWS Glue job, AWS Glue database, and AWS Glue table.

Conclusion

In this post, you learned strategies for migrating existing Apache Parquet formatted data to Apache Iceberg in Amazon S3 to convert to a transactional data lake using interactive sessions in AWS Glue 4.0 to complete the processes. If you have an evolving use case where an existing data lake needs to be converted to a transactional data lake based on Apache Iceberg table format, follow the guidance in this post.

The path you choose for this upgrade, an in-place upgrade or CTAS migration, or a combination of both, will depend on careful analysis of the data architecture and data integration pipeline. Both pathways have pros and cons, as discussed. At a high level, this upgrade process should go through multiple well-defined phases to identify the patterns of data integration and use cases. Choosing the correct strategy will depend on your requirements—such as performance, cost, data freshness, acceptable downtime during migration, and so on.


About the author

Rajdip Chaudhuri is a Senior Solutions Architect with Amazon Web Services specializing in data and analytics. He enjoys working with AWS customers and partners on data and analytics requirements. In his spare time, he enjoys soccer and movies.

Non-JSON ingestion using Amazon Kinesis Data Streams, Amazon MSK, and Amazon Redshift Streaming Ingestion

Post Syndicated from M Mehrtens original https://aws.amazon.com/blogs/big-data/non-json-ingestion-using-amazon-kinesis-data-streams-amazon-msk-and-amazon-redshift-streaming-ingestion/

Organizations are grappling with the ever-expanding spectrum of data formats in today’s data-driven landscape. From Avro’s binary serialization to the efficient and compact structure of Protobuf, the landscape of data formats has expanded far beyond the traditional realms of CSV and JSON. As organizations strive to derive insights from these diverse data streams, the challenge lies in seamlessly integrating them into a scalable solution.

In this post, we dive into Amazon Redshift Streaming Ingestion to ingest, process, and analyze non-JSON data formats. Amazon Redshift Streaming Ingestion allows you to connect to Amazon Kinesis Data Streams and Amazon Managed Streaming for Apache Kafka (Amazon MSK) directly through materialized views, in real time and without the complexity associated with staging the data in Amazon Simple Storage Service (Amazon S3) and loading it into the cluster. These materialized views not only provide a landing zone for streaming data, but also offer the flexibility of incorporating SQL transforms and blending into your extract, load, and transform (ELT) pipeline for enhanced processing. For a deeper exploration on configuring and using streaming ingestion in Amazon Redshift, refer to Real-time analytics with Amazon Redshift streaming ingestion.

JSON data in Amazon Redshift

Amazon Redshift enables storage, processing, and analytics on JSON data through the SUPER data type, PartiQL language, materialized views, and data lake queries. The base construct to access streaming data in Amazon Redshift provides metadata from the source stream (attributes like stream timestamp, sequence numbers, refresh timestamp, and more) and the raw binary data from the stream itself. For streams that contain the raw binary data encoded in JSON format, Amazon Redshift provides a variety of tools for parsing and managing the data. For more information about the metadata of each stream format, refer to Getting started with streaming ingestion from Amazon Kinesis Data Streams and Getting started with streaming ingestion from Amazon Managed Streaming for Apache Kafka.

At the most basic level, Amazon Redshift allows parsing the raw data into distinct columns. The JSON_EXTRACT_PATH_TEXT and JSON_EXTRACT_ARRAY_ELEMENT_TEXT functions enable the extraction of specific details from JSON objects and arrays, transforming them into separate columns for analysis. When the structure of the JSON documents and specific reporting requirements are defined, these methods allow for pre-computing a materialized view with the exact structure needed for reporting, with improved compression and sorting for analytics.

In addition to this approach, the Amazon Redshift JSON functions allow storing and analyzing the JSON data in its original state using the adaptable SUPER data type. The function JSON_PARSE allows you to extract the binary data in the stream and convert it into the SUPER data type. With the SUPER data type and PartiQL language, Amazon Redshift extends its capabilities for semi-structured data analysis. It uses the SUPER data type for JSON data storage, offering schema flexibility within a column. For more information on using the SUPER data type, refer to Ingesting and querying semistructured data in Amazon Redshift. This dynamic capability simplifies data ingestion, storage, transformation, and analysis of semi-structured data, enriching insights from diverse sources within the Redshift environment.

Streaming data formats

Organizations using alternative serialization formats must explore different deserialization methods. In the next section, we dive into the optimal approach for deserialization. In this section, we take a closer look at the diverse formats and strategies organizations use to effectively manage their data. This understanding is key in determining the data parsing approach in Amazon Redshift.

Many organizations use a format other than JSON for their streaming use cases. JSON is a self-describing serialization format, where the schema of the data is stored alongside the actual data itself. This makes JSON flexible for applications, but this approach can lead to increased data transmission between applications due to the additional data contained in the JSON keys and syntax. Organizations seeking to optimize their serialization and deserialization performance, and their network communication between applications, may opt to use a format like Avro, Protobuf, or even a custom proprietary format to serialize application data into binary format in an optimized way. This provides the advantage of an efficient serialization where only the message values are packed into a binary message. However, this requires the consumer of the data to know what schema and protocol was used to serialize the data to deserialize the message. There are several ways that organizations can solve this problem, as illustrated in the following figure.

Visualization of different binary message serialization approaches

Embedded schema

In an embedded schema approach, the data format itself contains the schema information alongside the actual data. This means that when a message is serialized, it includes both the schema definition and the data values. This allows anyone receiving the message to directly interpret and understand its structure without needing to refer to an external source for schema information. Formats like JSON, MessagePack, and YAML are examples of embedded schema formats. When you receive a message in this format, you can immediately parse it and access the data with no additional steps.

Assumed schema

In an assumed schema approach, the message serialization contains only the data values, and there is no schema information included. To interpret the data correctly, the receiving application needs to have prior knowledge of the schema that was used to serialize the message. This is typically achieved by associating the schema with some identifier or context, like a stream name. When the receiving application reads a message, it uses this context to retrieve the corresponding schema and then decodes the binary data accordingly. This approach requires an additional step of schema retrieval and decoding based on context. This generally requires setting up a mapping in-code or in an external database so that consumers can dynamically retrieve the schemas based on stream metadata (such as the AWS Glue Schema Registry).

One drawback of this approach is in tracking schema versions. Although consumers can identify the relevant schema from the stream name, they can’t identify the particular version of the schema that was used. Producers need to ensure that they are making backward-compatible changes to schemas to ensure consumers aren’t disrupted when using a different schema version.

Embedded schema ID

In this case, the producer continues to serialize the data in binary format (like Avro or Protobuf), similar to the assumed schema approach. However, an additional step is involved: the producer adds a schema ID at the beginning of the message header. When a consumer processes the message, it starts by extracting the schema ID from the header. With this schema ID, the consumer then fetches the corresponding schema from a registry. Using the retrieved schema, the consumer can effectively parse the rest of the message. For example, the AWS Glue Schema Registry provides Java SDK SerDe libraries, which can natively serialize and deserialize messages in a stream using embedded schema IDs. Refer to How the schema registry works for more information about using the registry.

The usage of an external schema registry is common in streaming applications because it provides a number of benefits to consumers and developers. This registry contains all the message schemas for the applications and associates them with a unique identifier to facilitate schema retrieval. In addition, the registry may provide other functionalities like schema version change handling and documentation to facilitate application development.

The embedded schema ID in the message payload can contain version information, ensuring publishers and consumers are always using the same schema version to manage data. When schema version information isn’t available, schema registries can help enforce producers making backward-compatible changes to avoid causing issues in consumers. This helps decouple producers and consumers, provides schema validation at both the publisher and consumer stage, and allows for more flexibility in stream usage to allow for a variety of application requirements. Messages can be published with one schema per stream, or with multiple schemas inside a single stream, allowing consumers to dynamically interpret messages as they arrive.

For a deeper dive into the benefits of a schema registry, refer to Validate streaming data over Amazon MSK using schemas in cross-account AWS Glue Schema Registry.

Schema in file

For batch processing use cases, applications may embed the schema used to serialize the data into the data file itself to facilitate data consumption. This is an extension of the embedded schema approach but is less costly because the data file is generally larger, so the schema accounts for a proportionally smaller amount of the overall data. In this case, the consumers can process the data directly without additional logic. Amazon Redshift supports loading Avro data that has been serialized in this manner using the COPY command.

Convert non-JSON data to JSON

Organizations aiming to use non-JSON serialization formats need to develop an external method for parsing their messages outside of Amazon Redshift. We recommend using an AWS Lambda-based external user-defined function (UDF) for this process. Using an external Lambda UDF allows organizations to define arbitrary deserialization logic to support any message format, including embedded schema, assumed schema, and embedded schema ID approaches. Although Amazon Redshift supports defining Python UDFs natively, which may be a viable alternative for some use cases, we demonstrate the Lambda UDF approach in this post to cover more complex scenarios. For examples of Amazon Redshift UDFs, refer to AWS Samples on GitHub.

The basic architecture for this solution is as follows.

See the following code:

-- Step 1
CREATE OR REPLACE EXTERNAL FUNCTION fn_lambda_decode_avro_binary(varchar)
RETURNS varchar IMMUTABLE LAMBDA 'redshift-avro-udf';

-- Step 2
CREATE EXTERNAL SCHEMA kds FROM KINESIS

-- Step 3
CREATE MATERIALIZED VIEW {name} AUTO REFRESH YES AS
SELECT
    -- Step 4
   t.kinesis_data AS binary_avro,
   to_hex(binary_avro) AS hex_avro,
   -- Step 5
   fn_lambda_decode_avro_binary('{stream-name}', hex_avro) AS json_string,
   -- Step 6
   JSON_PARSE(json_string) AS super_data,
   t.sequence_number,
   t.refresh_time,
   t.approximate_arrival_timestamp,
   t.shard_id
FROM kds.{stream_name} AS t

Let’s explore each step in more detail.

Create the Lambda UDF

The overall goal is to develop a method that can accept the raw data as input and produce JSON-encoded data as an output. This aligns with the Amazon Redshift ability to natively process JSON into the SUPER data type. The specifics of the function depend on the serialization and streaming approach. For example, using the assumed schema approach with Avro format, your Lambda function may complete the following steps:

  1. Take in the stream name and hexadecimal-encoded data as inputs.
  2. Use the stream name to perform a lookup to identify the schema for the given stream name.
  3. Decode the hexadecimal data into binary format.
  4. Use the schema to deserialize the binary data into readable format.
  5. Re-serialize the data into JSON format.

The f_glue_schema_registry_avro_to_json AWS samples example illustrates the process of decoding Avro using the assumed schema approach using the AWS Glue Schema Registry in a Lambda UDF to retrieve and use Avro schemas by stream name. For other approaches (such as embedded schema ID), you should author your Lambda function to handle deserialization as defined by your serialization process and schema registry implementation. If your application depends on an external schema registry or table lookup to process the message schema, we recommend that you implement caching for schema lookups to help reduce the load on the external systems and reduce the average Lambda function invocation duration.

When creating the Lambda function, make sure you accommodate the Amazon Redshift input event format and ensure compliance with the expected Amazon Redshift event output format. For details, refer to Creating a scalar Lambda UDF.

After you create and test the Lambda function, you can define it as a UDF in Amazon Redshift. For effective integration within Amazon Redshift, designate this Lambda function UDF as IMMUTABLE. This classification supports incremental materialized view updates. This treats the Lambda function as idempotent and minimizes the Lambda function costs for the solution, because a message doesn’t need to be processed if it has been processed before.

Configure the baseline Kinesis data stream

Regardless of your messaging format or approach (embedded schema, assumed schema, and embedded schema ID), you begin with setting up the external schema for streaming ingestion from your messaging source into Amazon Redshift. For more information, refer to Streaming ingestion.

CREATE EXTERNAL SCHEMA kds FROM KINESIS

IAM_ROLE 'arn:aws:iam::0123456789:role/redshift-streaming-role';

Create the raw materialized view

Next, you define your raw materialized view. This view contains the raw message data from the streaming source in Amazon Redshift VARBYTE format.

Convert the VARBYTE data to VARCHAR format

External Lambda function UDFs don’t support VARBYTE as an input data type. Therefore, you must convert the raw VARBYTE data from the stream into VARCHAR format to pass to the Lambda function. The best way to do this in Amazon Redshift is using the TO_HEX built-in method. This converts the binary data into hexadecimal-encoded character data, which can be sent to the Lambda UDF.

Invoke the Lambda function to retrieve JSON data

After the UDF has been defined, we can invoke the UDF to convert our hexadecimal-encoded data into JSON-encoded VARCHAR data.

Use the JSON_PARSE method to convert the JSON data to SUPER data type

Finally, we can use the Amazon Redshift native JSON parsing methods like JSON_PARSE, JSON_EXTRACT_PATH_TEXT, and more to parse the JSON data into a format that we can use for analytics.

Considerations

Consider the following when using this strategy:

  • Cost – Amazon Redshift invokes the Lambda function in batches to improve scalability and reduce the overall number of Lambda invocations. The cost of this solution depends on the number of messages in your stream, the frequency of the refresh, and the invocation time required to process the messages in a batch from Amazon Redshift. Using the IMMUTABLE UDF type in Amazon Redshift can also help minimize costs by utilizing the incremental refresh strategy for the materialized view.
  • Permissions and network access – The AWS Identity and Access Management (IAM) role used for the Amazon Redshift UDF must have permissions to invoke the Lambda function, and you must deploy the Lambda function such that it has access to invoke its external dependencies (for example, you may need to deploy it in a VPC to access private resources like a schema registry).
  • Monitoring – Use Lambda function logging and metrics to identify errors in deserialization, connection to the schema registry, and data processing. For details on monitoring the UDF Lambda function, refer to Embedding metrics within logs and Monitoring and troubleshooting Lambda functions.

Conclusion

In this post, we dove into different data formats and ingestion methods for a streaming use case. By exploring strategies for handling non-JSON data formats, we examined the use of Amazon Redshift streaming to seamlessly ingest, process, and analyze these formats in near-real time using materialized views.

Furthermore, we navigated through schema-per-stream, embedded schema, assumed schema, and embedded schema ID approaches, highlighting their merits and considerations. To bridge the gap between non-JSON formats and Amazon Redshift, we explored the creation of Lambda UDFs for data parsing and conversion. This approach offers a comprehensive means to integrate diverse data streams into Amazon Redshift for subsequent analysis.

As you navigate the ever-evolving landscape of data formats and analytics, we hope this exploration provides valuable guidance to derive meaningful insights from your data streams. We welcome any thoughts or questions in the comments section.


About the Authors

M Mehrtens has been working in distributed systems engineering throughout their career, working as a Software Engineer, Architect, and Data Engineer. In the past, M has supported and built systems to process terrabytes of streaming data at low latency, run enterprise Machine Learning pipelines, and created systems to share data across teams seamlessly with varying data toolsets and software stacks. At AWS, they are a Sr. Solutions Architect supporting US Federal Financial customers.

Sindhu Achuthan is a Sr. Solutions Architect with Federal Financials at AWS. She works with customers to provide architectural guidance on analytics solutions using AWS Glue, Amazon EMR, Amazon Kinesis, and other services. Outside of work, she loves DIYs, to go on long trails, and yoga.

Process and analyze highly nested and large XML files using AWS Glue and Amazon Athena

Post Syndicated from Navnit Shukla original https://aws.amazon.com/blogs/big-data/process-and-analyze-highly-nested-and-large-xml-files-using-aws-glue-and-amazon-athena/

In today’s digital age, data is at the heart of every organization’s success. One of the most commonly used formats for exchanging data is XML. Analyzing XML files is crucial for several reasons. Firstly, XML files are used in many industries, including finance, healthcare, and government. Analyzing XML files can help organizations gain insights into their data, allowing them to make better decisions and improve their operations. Analyzing XML files can also help in data integration, because many applications and systems use XML as a standard data format. By analyzing XML files, organizations can easily integrate data from different sources and ensure consistency across their systems, However, XML files contain semi-structured, highly nested data, making it difficult to access and analyze information, especially if the file is large and has complex, highly nested schema.

XML files are well-suited for applications, but they may not be optimal for analytics engines. In order to enhance query performance and enable easy access in downstream analytics engines such as Amazon Athena, it’s crucial to preprocess XML files into a columnar format like Parquet. This transformation allows for improved efficiency and usability in analytics workflows. In this post, we show how to process XML data using AWS Glue and Athena.

Solution overview

We explore two distinct techniques that can streamline your XML file processing workflow:

  • Technique 1: Use an AWS Glue crawler and the AWS Glue visual editor – You can use the AWS Glue user interface in conjunction with a crawler to define the table structure for your XML files. This approach provides a user-friendly interface and is particularly suitable for individuals who prefer a graphical approach to managing their data.
  • Technique 2: Use AWS Glue DynamicFrames with inferred and fixed schemas – The crawler has a limitation when it comes to processing a single row in XML files larger than 1 MB. To overcome this restriction, we use an AWS Glue notebook to construct AWS Glue DynamicFrames, utilizing both inferred and fixed schemas. This method ensures efficient handling of XML files with rows exceeding 1 MB in size.

In both approaches, our ultimate goal is to convert XML files into Apache Parquet format, making them readily available for querying using Athena. With these techniques, you can enhance the processing speed and accessibility of your XML data, enabling you to derive valuable insights with ease.

Prerequisites

Before you begin this tutorial, complete the following prerequisites (these apply to both techniques):

  1. Download the XML files technique1.xml and technique2.xml.
  2. Upload the files to an Amazon Simple Storage Service (Amazon S3) bucket. You can upload them to the same S3 bucket in different folders or to different S3 buckets.
  3. Create an AWS Identity and Access Management (IAM) role for your ETL job or notebook as instructed in Set up IAM permissions for AWS Glue Studio.
  4. Add an inline policy to your role with the iam:PassRole action:
  "Version": "2012-10-17",
  "Statement": [
    {
      "Action": ["iam:PassRole"],
      "Effect": "Allow",
      "Resource": "arn:aws:iam::*:role/AWSGlueServiceRole*",
      "Condition": {
        "StringLike": {
          "iam:PassedToService": ["glue.amazonaws.com"]
        }
      }
    }
}
  1. Add a permissions policy to the role with access to your S3 bucket.

Now that we’re done with the prerequisites, let’s move on to implementing the first technique.

Technique 1: Use an AWS Glue crawler and the visual editor

The following diagram illustrates the simple architecture that you can use to implement the solution.

Processing and Analyzing XML file using AWS Glue and Amazon Athena

To analyze XML files stored in Amazon S3 using AWS Glue and Athena, we complete the following high-level steps:

  1. Create an AWS Glue crawler to extract XML metadata and create a table in the AWS Glue Data Catalog.
  2. Process and transform XML data into a format (like Parquet) suitable for Athena using an AWS Glue extract, transform, and load (ETL) job.
  3. Set up and run an AWS Glue job via the AWS Glue console or the AWS Command Line Interface (AWS CLI).
  4. Use the processed data (in Parquet format) with Athena tables, enabling SQL queries.
  5. Use the user-friendly interface in Athena to analyze the XML data with SQL queries on your data stored in Amazon S3.

This architecture is a scalable, cost-effective solution for analyzing XML data on Amazon S3 using AWS Glue and Athena. You can analyze large datasets without complex infrastructure management.

We use the AWS Glue crawler to extract XML file metadata. You can choose the default AWS Glue classifier for general-purpose XML classification. It automatically detects XML data structure and schema, which is useful for common formats.

We also use a custom XML classifier in this solution. It’s designed for specific XML schemas or formats, allowing precise metadata extraction. This is ideal for non-standard XML formats or when you need detailed control over classification. A custom classifier ensures only necessary metadata is extracted, simplifying downstream processing and analysis tasks. This approach optimizes the use of your XML files.

The following screenshot shows an example of an XML file with tags.

Create a custom classifier

In this step, you create a custom AWS Glue classifier to extract metadata from an XML file. Complete the following steps:

  1. On the AWS Glue console, under Crawlers in the navigation pane, choose Classifiers.
  2. Choose Add classifier.
  3. Select XML as the classifier type.
  4. Enter a name for the classifier, such as blog-glue-xml-contact.
  5. For Row tag, enter the name of the root tag that contains the metadata (for example, metadata).
  6. Choose Create.

Create an AWS Glue Crawler to crawl xml file

In this section, we are creating a Glue Crawler to extract the metadata from XML file using the customer classifier created in previous step.

Create a database

  1. Go to the AWS Glue console, choose Databases in the navigation pane.
  2. Click on Add database.
  3. Provide a name such as blog_glue_xml
  4. Choose Create Database

Create a Crawler

Complete the following steps to create your first crawler:

  1. On the AWS Glue console, choose Crawlers in the navigation pane.
  2. Choose Create crawler.
  3. On the Set crawler properties page, provide a name for the new crawler (such as blog-glue-parquet), then choose Next.
  4. On the Choose data sources and classifiers page, select Not Yet under Data source configuration.
  5. Choose Add a data store.
  6. For S3 path, browse to s3://${BUCKET_NAME}/input/geologicalsurvey/.

Make sure you pick the XML folder rather than the file inside the folder.

  1. Leave the rest of the options as default and choose Add an S3 data source.
  2. Expand Custom classifiers – optional, choose blog-glue-xml-contact, then choose Next and keep the rest of the options as default.
  3. Choose your IAM role or choose Create new IAM role, add the suffix glue-xml-contact (for example, AWSGlueServiceNotebookRoleBlog), and choose Next.
  4. On the Set output and scheduling page, under Output configuration, choose blog_glue_xml for Target database.
  5. Enter console_ as the prefix added to tables (optional) and under Crawler schedule, keep the frequency set to On demand.
  6. Choose Next.
  7. Review all the parameters and choose Create crawler.

Run the Crawler

After you create the crawler, complete the following steps to run it:

  1. On the AWS Glue console, choose Crawlers in the navigation pane.
  2. Open the crawler you created and choose Run.

The crawler will take 1–2 minutes to complete.

  1. When the crawler is complete, choose Databases in the navigation pane.
  2. Choose the database you crated and choose the table name to see the schema extracted by the crawler.

Create an AWS Glue job to convert the XML to Parquet format

In this step, you create an AWS Glue Studio job to convert the XML file into a Parquet file. Complete the following steps:

  1. On the AWS Glue console, choose Jobs in the navigation pane.
  2. Under Create job, select Visual with a blank canvas.
  3. Choose Create.
  4. Rename the job to blog_glue_xml_job.

Now you have a blank AWS Glue Studio visual job editor. On the top of the editor are the tabs for different views.

  1. Choose the Script tab to see an empty shell of the AWS Glue ETL script.

As we add new steps in the visual editor, the script will be updated automatically.

  1. Choose the Job details tab to see all the job configurations.
  2. For IAM role, choose AWSGlueServiceNotebookRoleBlog.
  3. For Glue version, choose Glue 4.0 – Support Spark 3.3, Scala 2, Python 3.
  4. Set Requested number of workers to 2.
  5. Set Number of retries to 0.
  6. Choose the Visual tab to go back to the visual editor.
  7. On the Source drop-down menu, choose AWS Glue Data Catalog.
  8. On the Data source properties – Data Catalog tab, provide the following information:
    1. For Database, choose blog_glue_xml.
    2. For Table, choose the table that starts with the name console_ that the crawler created (for example, console_geologicalsurvey).
  9. On the Node properties tab, provide the following information:
    1. Change Name to geologicalsurvey dataset.
    2. Choose Action and the transformation Change Schema (Apply Mapping).
    3. Choose Node properties and change the name of the transform from Change Schema (Apply Mapping) to ApplyMapping.
    4. On the Target menu, choose S3.
  10. On the Data source properties – S3 tab, provide the following information:
    1. For Format, select Parquet.
    2. For Compression Type, select Uncompressed.
    3. For S3 source type, select S3 location.
    4. For S3 URL, enter s3://${BUCKET_NAME}/output/parquet/.
    5. Choose Node Properties and change the name to Output.
  11. Choose Save to save the job.
  12. Choose Run to run the job.

The following screenshot shows the job in the visual editor.

Create an AWS Gue Crawler to crawl the Parquet file

In this step, you create an AWS Glue crawler to extract metadata from the Parquet file you created using an AWS Glue Studio job. This time, you use the default classifier. Complete the following steps:

  1. On the AWS Glue console, choose Crawlers in the navigation pane.
  2. Choose Create crawler.
  3. On the Set crawler properties page, provide a name for the new crawler, such as blog-glue-parquet-contact, then choose Next.
  4. On the Choose data sources and classifiers page, select Not Yet for Data source configuration.
  5. Choose Add a data store.
  6. For S3 path, browse to s3://${BUCKET_NAME}/output/parquet/.

Make sure you pick the parquet folder rather than the file inside the folder.

  1. Choose your IAM role created during the prerequisite section or choose Create new IAM role (for example, AWSGlueServiceNotebookRoleBlog), and choose Next.
  2. On the Set output and scheduling page, under Output configuration, choose blog_glue_xml for Database.
  3. Enter parquet_ as the prefix added to tables (optional) and under Crawler schedule, keep the frequency set to On demand.
  4. Choose Next.
  5. Review all the parameters and choose Create crawler.

Now you can run the crawler, which takes 1–2 minutes to complete.

You can preview the newly created schema for the Parquet file in the AWS Glue Data Catalog, which is similar to the schema of the XML file.

We now possess data that is suitable for use with Athena. In the next section, we perform data queries using Athena.

Query the Parquet file using Athena

Athena doesn’t support querying the XML file format, which is why you converted the XML file into Parquet for more efficient data querying and use dot notation to query complex types and nested structures.

The following example code uses dot notation to query nested data:

SELECT 
    idinfo.citation.citeinfo.origin,
    idinfo.citation.citeinfo.pubdate,
    idinfo.citation.citeinfo.title,
    idinfo.citation.citeinfo.geoform,
    idinfo.citation.citeinfo.pubinfo.pubplace,
    idinfo.citation.citeinfo.pubinfo.publish,
    idinfo.citation.citeinfo.onlink,
    idinfo.descript.abstract,
    idinfo.descript.purpose,
    idinfo.descript.supplinf,
    dataqual.attracc.attraccr, 
    dataqual.logic,
    dataqual.complete,
    dataqual.posacc.horizpa.horizpar,
    dataqual.posacc.vertacc.vertaccr,
    dataqual.lineage.procstep.procdate,
    dataqual.lineage.procstep.procdesc
FROM "blog_glue_xml"."parquet_parquet" limit 10;

Now that we’ve completed technique 1, let’s move on to learn about technique 2.

Technique 2: Use AWS Glue DynamicFrames with inferred and fixed schemas

In the previous section, we covered the process of handling a small XML file using an AWS Glue crawler to generate a table, an AWS Glue job to convert the file into Parquet format, and Athena to access the Parquet data. However, the crawler encounters limitations when it comes to processing XML files that exceed 1 MB in size. In this section, we delve into the topic of batch processing larger XML files, necessitating additional parsing to extract individual events and conduct analysis using Athena.

Our approach involves reading the XML files through AWS Glue DynamicFrames, employing both inferred and fixed schemas. Then we extract the individual events in Parquet format using the relationalize transformation, enabling us to query and analyze them seamlessly using Athena.

To implement this solution, you complete the following high-level steps:

  1. Create an AWS Glue notebook to read and analyze the XML file.
  2. Use DynamicFrames with InferSchema to read the XML file.
  3. Use the relationalize function to unnest any arrays.
  4. Convert the data to Parquet format.
  5. Query the Parquet data using Athena.
  6. Repeat the previous steps, but this time pass a schema to DynamicFrames instead of using InferSchema.

The electric vehicle population data XML file has a response tag at its root level. This tag contains an array of row tags, which are nested within it. The row tag is an array that contains a set of another row tags, which provide information about a vehicle, including its make, model, and other relevant details. The following screenshot shows an example.

Create an AWS Glue Notebook

To create an AWS Glue notebook, complete the following steps:

  1. Open the AWS Glue Studio console, choose Jobs in the navigation pane.
  2. Select Jupyter Notebook and choose Create.

  1. Enter a name for your AWS Glue job, such as blog_glue_xml_job_Jupyter.
  2. Choose the role that you created in the prerequisites (AWSGlueServiceNotebookRoleBlog).

The AWS Glue notebook comes with a preexisting example that demonstrates how to query a database and write the output to Amazon S3.

  1. Adjust the timeout (in minutes) as shown in the following screenshot and run the cell to create the AWS Glue interactive session.

Create basic Variables

After you create the interactive session, at the end of the notebook, create a new cell with the following variables (provide your own bucket name):

BUCKET_NAME='YOUR_BUCKET_NAME'
S3_SOURCE_XML_FILE = f's3://{BUCKET_NAME}/xml_dataset/'
S3_TEMP_FOLDER = f's3://{BUCKET_NAME}/temp/'
S3_OUTPUT_INFER_SCHEMA = f's3://{BUCKET_NAME}/infer_schema/'
INFER_SCHEMA_TABLE_NAME = 'infer_schema'
S3_OUTPUT_NO_INFER_SCHEMA = f's3://{BUCKET_NAME}/no_infer_schema/'
NO_INFER_SCHEMA_TABLE_NAME = 'no_infer_schema'
DATABASE_NAME = 'blog_xml'

Read the XML file inferring the schema

If you don’t pass a schema to the DynamicFrame, it will infer the schema of the files. To read the data using a dynamic frame, you can use the following command:

df = glueContext.create_dynamic_frame.from_options(
    connection_type="s3",
    connection_options={"paths": [S3_SOURCE_XML_FILE]},
    format="xml",
    format_options={"rowTag": "response"},
)

Print the DynamicFrame Schema

Print the schema with the following code:

df.printSchema()

The schema shows a nested structure with a row array containing multiple elements. To unnest this structure into lines, you can use the AWS Glue relationalize transformation:

df_relationalized = df.relationalize(
    "root", S3_TEMP_FOLDER
)

We are only interested in the information contained within the row array, and we can view the schema by using the following command:

df_relationalized.select("root_row.row").printSchema()

The column names contain row.row, which correspond to the array structure and array column in the dataset. We don’t rename the columns in this post; for instructions to do so, refer to Automate dynamic mapping and renaming of column names in data files using AWS Glue: Part 1. Then you can convert the data to Parquet format and create the AWS Glue table using the following command:


s3output = glueContext.getSink(
  path= S3_OUTPUT_INFER_SCHEMA,
  connection_type="s3",
  updateBehavior="UPDATE_IN_DATABASE",
  partitionKeys=[],
  compression="snappy",
  enableUpdateCatalog=True,
  transformation_ctx="s3output",
)
s3output.setCatalogInfo(
  catalogDatabase="blog_xml", catalogTableName="jupyter_notebook_with_infer_schema"
)
s3output.setFormat("glueparquet")
s3output.writeFrame(df_relationalized.select("root_row.row"))

AWS Glue DynamicFrame provides features that you can use in your ETL script to create and update a schema in the Data Catalog. We use the updateBehavior parameter to create the table directly in the Data Catalog. With this approach, we don’t need to run an AWS Glue crawler after the AWS Glue job is complete.

Read the XML file by setting a schema

An alternative way to read the file is by predefining a schema. To do this, complete the following steps:

  1. Import the AWS Glue data types:
    from awsglue.gluetypes import *

  2. Create a schema for the XML file:
    schema = StructType([ 
      Field("row", StructType([
        Field("row", ArrayType(StructType([
                Field("_2020_census_tract", LongType()),
                Field("__address", StringType()),
                Field("__id", StringType()),
                Field("__position", IntegerType()),
                Field("__uuid", StringType()),
                Field("base_msrp", IntegerType()),
                Field("cafv_type", StringType()),
                Field("city", StringType()),
                Field("county", StringType()),
                Field("dol_vehicle_id", IntegerType()),
                Field("electric_range", IntegerType()),
                Field("electric_utility", StringType()),
                Field("ev_type", StringType()),
                Field("geocoded_column", StringType()),
                Field("legislative_district", IntegerType()),
                Field("make", StringType()),
                Field("model", StringType()),
                Field("model_year", IntegerType()),
                Field("state", StringType()),
                Field("vin_1_10", StringType()),
                Field("zip_code", IntegerType())
        ])))
      ]))
    ])

  3. Pass the schema when reading the XML file:
    df = glueContext.create_dynamic_frame.from_options(
        connection_type="s3",
        connection_options={"paths": [S3_SOURCE_XML_FILE]},
        format="xml",
        format_options={"rowTag": "response", "withSchema": json.dumps(schema.jsonValue())},
    )

  4. Unnest the dataset like before:
    df_relationalized = df.relationalize(
        "root", S3_TEMP_FOLDER
    )

  5. Convert the dataset to Parquet and create the AWS Glue table:
    s3output = glueContext.getSink(
      path=S3_OUTPUT_NO_INFER_SCHEMA,
      connection_type="s3",
      updateBehavior="UPDATE_IN_DATABASE",
      partitionKeys=[],
      compression="snappy",
      enableUpdateCatalog=True,
      transformation_ctx="s3output",
    )
    s3output.setCatalogInfo(
      catalogDatabase="blog_xml", catalogTableName="jupyter_notebook_no_infer_schema"
    )
    s3output.setFormat("glueparquet")
    s3output.writeFrame(df_relationalized.select("root_row.row"))

Query the tables using Athena

Now that we have created both tables, we can query the tables using Athena. For example, we can use the following query:

SELECT * FROM "blog_xml"."jupyter_notebook_no_infer_schema " limit 10;

The following screenshot shows the results.

Clean Up

In this post, we created an IAM role, an AWS Glue Jupyter notebook, and two tables in the AWS Glue Data Catalog. We also uploaded some files to an S3 bucket. To clean up these objects, complete the following steps:

  1. On the IAM console, delete the role you created.
  2. On the AWS Glue Studio console, delete the custom classifier, crawler, ETL jobs, and Jupyter notebook.
  3. Navigate to the AWS Glue Data Catalog and delete the tables you created.
  4. On the Amazon S3 console, navigate to the bucket you created and delete the folders named temp, infer_schema, and no_infer_schema.

Key Takeaways

In AWS Glue, there’s a feature called InferSchema in AWS Glue DynamicFrames. It automatically figures out the structure of a data frame based on the data it contains. In contrast, defining a schema means explicitly stating how the data frame’s structure should be before loading the data.

XML, being a text-based format, doesn’t restrict the data types of its columns. This can cause issues with the InferSchema function. For example, in the first run, a file with column A having a value of 2 results in a Parquet file with column A as an integer. In the second run, a new file has column A with the value C, leading to a Parquet file with column A as a string. Now there are two files on S3, each with a column A of different data types, which can create problems downstream.

The same happens with complex data types like nested structures or arrays. For example, if a file has one tag entry called transaction, it’s inferred as a struct. But if another file has the same tag, it’s inferred as an array

Despite these data type issues, InferSchema is useful when you don’t know the schema or defining one manually is impractical. However, it’s not ideal for large or constantly changing datasets. Defining a schema is more precise, especially with complex data types, but has its own issues, like requiring manual effort and being inflexible to data changes.

InferSchema has limitations, like incorrect data type inference and issues with handling null values. Defining a schema also has limitations, like manual effort and potential errors.

Choosing between inferring and defining a schema depends on the project’s needs. InferSchema is great for quick exploration of small datasets, whereas defining a schema is better for larger, complex datasets requiring accuracy and consistency. Consider the trade-offs and constraints of each method to pick what suits your project best.

Conclusion

In this post, we explored two techniques for managing XML data using AWS Glue, each tailored to address specific needs and challenges you may encounter.

Technique 1 offers a user-friendly path for those who prefer a graphical interface. You can use an AWS Glue crawler and the visual editor to effortlessly define the table structure for your XML files. This approach simplifies the data management process and is particularly appealing to those looking for a straightforward way to handle their data.

However, we recognize that the crawler has its limitations, specifically when dealing with XML files having rows larger than 1 MB. This is where technique 2 comes to the rescue. By harnessing AWS Glue DynamicFrames with both inferred and fixed schemas, and employing an AWS Glue notebook, you can efficiently handle XML files of any size. This method provides a robust solution that ensures seamless processing even for XML files with rows exceeding the 1 MB constraint.

As you navigate the world of data management, having these techniques in your toolkit empowers you to make informed decisions based on the specific requirements of your project. Whether you prefer the simplicity of technique 1 or the scalability of technique 2, AWS Glue provides the flexibility you need to handle XML data effectively.


About the Authors

Navnit Shuklaserves as an AWS Specialist Solution Architect with a focus on Analytics. He possesses a strong enthusiasm for assisting clients in discovering valuable insights from their data. Through his expertise, he constructs innovative solutions that empower businesses to arrive at informed, data-driven choices. Notably, Navnit Shukla is the accomplished author of the book titled “Data Wrangling on AWS.

Patrick Muller works as a Senior Data Lab Architect at AWS. His main responsibility is to assist customers in turning their ideas into a production-ready data product. In his free time, Patrick enjoys playing soccer, watching movies, and traveling.

Amogh Gaikwad is a Senior Solutions Developer at Amazon Web Services. He helps global customers build and deploy AI/ML solutions on AWS. His work is mainly focused on computer vision, and natural language processing and helping customers optimize their AI/ML workloads for sustainability. Amogh has received his master’s in Computer Science specializing in Machine Learning.

Sheela Sonone is a Senior Resident Architect at AWS. She helps AWS customers make informed choices and tradeoffs about accelerating their data, analytics, and AI/ML workloads and implementations. In her spare time, she enjoys spending time with her family – usually on tennis courts.

Introducing hybrid access mode for AWS Glue Data Catalog to secure access using AWS Lake Formation and IAM and Amazon S3 policies

Post Syndicated from Aarthi Srinivasan original https://aws.amazon.com/blogs/big-data/introducing-hybrid-access-mode-for-aws-glue-data-catalog-to-secure-access-using-aws-lake-formation-and-iam-and-amazon-s3-policies/

AWS Lake Formation helps you centrally govern, secure, and globally share data for analytics and machine learning. With Lake Formation, you can manage access control for your data lake data in Amazon Simple Storage Service (Amazon S3) and its metadata in AWS Glue Data Catalog in one place with familiar database-style features. You can use fine-grained data access control to verify that the right users have access to the right data down to the cell level of tables. Lake Formation also makes it simpler to share data internally across your organization and externally. Further, Lake Formation integrates with AWS analytics services such as Amazon Athena, Amazon Redshift Spectrum, Amazon EMR, and AWS Glue ETL for Apache Spark. These services allow querying Lake Formation managed tables, thus helping you extract business insights from the data quickly and securely.

Before the introduction of Lake Formation and its database-style permissions for data lakes, you had to manage access to your data in the data lake and its metadata separately through AWS Identity and Access Management (IAM) policies and S3 bucket policies. With an IAM and Amazon S3 access control mechanism, which is more complex and less granular compared to Lake Formation, you need more time to migrate to Lake Formation because a given database or table in the data lake could have its access controlled by either IAM and S3 policies or Lake Formation policies, but not both. Also, various use cases operate on the data lakes. Migrating all use cases from one permissions model to another in a single step without disruption was challenging for operations teams.

To ease the transition of data lake permissions from an IAM and S3 model to Lake Formation, we’re introducing a hybrid access mode for AWS Glue Data Catalog. Please refer to the What’s New and documentation. This feature lets you secure and access the cataloged data using both Lake Formation permissions and IAM and S3 permissions. Hybrid access mode allows data administrators to onboard Lake Formation permissions selectively and incrementally, focusing on one data lake use case at a time. For example, say you have an existing extract, transform and load (ETL) data pipeline that uses the IAM and S3 policies to manage data access. Now you want to allow your data analysts to explore or query the same data using Amazon Athena. You can grant access to the data analysts using Lake Formation permissions, to include fine-grained controls as needed, without changing access for your ETL data pipelines.

Hybrid access mode allows both permission models to exist for the same database and tables, providing greater flexibility in how you manage user access. While this feature opens two doors for a Data Catalog resource, an IAM user or role can access the resource using only one of the two permissions. After Lake Formation permission is enabled for an IAM principal, authorization is completely managed by Lake Formation and existing IAM and S3 policies are ignored. AWS CloudTrail logs provide the complete details of the Data Catalog resource access in Lake Formation logs and S3 access logs.

In this blog post, we walk you through the instructions to onboard Lake Formation permissions in hybrid access mode for selected users while the database is already accessible to other users through IAM and S3 permissions. We will review the instructions to set-up hybrid access mode within an AWS account and between two accounts.

Scenario 1 – Hybrid access mode within an AWS account

In this scenario, we walk you through the steps to start adding users with Lake Formation permissions for a database in Data Catalog that’s accessed using IAM and S3 policy permissions. For our illustration, we use two personas:  Data-Engineer, who has coarse grained permissions using an IAM policy and an S3 bucket policy to run an AWS Glue ETL job and Data-Analyst, whom we will onboard with fine grained Lake Formation permissions to query the database using Amazon Athena.

Scenario 1 is depicted in the diagram shown below, where the Data-Engineer role accesses the database hybridsalesdb using IAM and S3 permissions while Data-Analyst role will access the database using Lake Formation permissions.

Prerequisites

To set up Lake Formation and IAM and S3 permissions for a Data Catalog database with Hybrid access mode, you must have the following prerequisites:

  • An AWS account that isn’t used for production applications.
  • Lake Formation already set up in the account and a Lake Formation administrator role or a similar role to follow along with the instructions in this post. For example, we’re using a data lake administrator role called LF-Admin. To learn more about setting up permissions for a data lake administrator role, see Create a data lake administrator.
  • A sample database in the Data Catalog with a few tables. For example, our sample database is called hybridsalesdb and has a set of eight tables, as shown in the following screenshot. You can use any of your datasets to follow along.

Personas and their IAM policy setup

There are two personas that are IAM roles in the account: Data-Engineer and Data-Analyst. Their IAM policies and access are described as follows.

The following IAM policy on the Data-Engineer role allows access to the database and table metadata in the Data Catalog.

{
    "Version": "2012-10-17",
    "Statement": [
        {
            "Effect": "Allow",
            "Action": [
                "glue: Get*"
            ],
            "Resource": [
                "arn:aws:glue:<Region>:<account-id>:catalog",
                "arn:aws:glue:<Region>:<account-id>:database/hybridsalesdb",
                "arn:aws:glue:<Region>:<account-id>:table/hybridsalesdb/*"
            ]
        }
    ]
}

The following IAM policy on the Data-Engineer role grants data access to the underlying Amazon S3 location of the database and tables.

{
    "Version": "2012-10-17",
    "Statement": [
        {
            "Sid": "AllowDataLakeBucket",
            "Effect": "Allow",
            "Action": [
                "s3:ListBucket",
                "s3:GetBucketLocation",
                "s3:Put*",
                "s3:Get*",
                "s3:Delete*"
            ],
            "Resource": [
                "arn:aws:s3:::<bucket-name>",
                "arn:aws:s3:::<bucket-name>/<prefix>/"
            ]
        }
    ]
}

The Data-Engineer also has access to the AWS Glue console using the AWS managed policy arn:aws:iam::aws:policy/AWSGlueConsoleFullAccess and regressive iam:Passrole to run an AWS Glue ETL script as below.

{
    "Version": "2012-10-17",
    "Statement": [
       {
           "Sid": "PassRolePermissions",
           "Effect": "Allow",
           "Action": [
               " iam:PassRole" ],
           "Resource": [  
		   "arn:aws:iam::<account-id>:role/Data-Engineer"
            ]
        }
    ]
}

The following policy is also added to the trust policy of the Data-Engineer role to allow AWS Glue to assume the role to run the ETL script on behalf of the role.

{
    "Version": "2012-10-17",
    "Statement": [
        {
            "Effect": "Allow",
            "Principal": {
                "Service": "glue.amazonaws.com"
            },
            "Action": "sts:AssumeRole"
        }
    ]
}

See AWS Glue studio set up for additional permissions required to run an AWS Glue ETL script.

The Data-Analyst role has the data lake basic user permissions as described in Assign permissions to Lake Formation users.

{
"Version": "2012-10-17",
"Statement": [
    {
        "Effect": "Allow",
        "Action": [
            "glue:GetTable",
            "glue:GetTables",
            "glue:GetTableVersions",
            "glue:SearchTables",
            "glue:GetDatabase",
            "glue:GetDatabases",
            "glue:GetPartitions",
            "lakeformation:GetDataAccess",
            "lakeformation:GetResourceLFTags",
            "lakeformation:ListLFTags",
            "lakeformation:GetLFTag",
            "lakeformation:SearchTablesByLFTags",
            "lakeformation:SearchDatabasesByLFTags"
        ],
        "Resource": "*"
    }
    ]
}

Additionally, the Data-Analyst has permissions to write Athena query results to an S3 bucket that isn’t managed by Lake Formation and Athena console full access using the AWS managed policy arn:aws:iam::aws:policy/AmazonAthenaFullAccess.

{
    "Version": "2012-10-17",
    "Statement": [
        {
            "Effect": "Allow",
            "Action": "s3:ListAllMyBuckets",
            "Resource": "*"
        },
        {
            "Effect": "Allow",
            "Action": [
                "s3:ListBucket",
                "s3:GetBucketLocation"
            ],
            "Resource": [
                "arn:aws:s3:::<athena-results-bucket>"
            ]
        },
        {
            "Effect": "Allow",
            "Action": [
                "s3:Put*",
                "s3:Get*",
                "s3:Delete*"
            ],
            "Resource": [
                "arn:aws:s3:::<athena-results-bucket>/*"
            ]
        }
    ]
}

Set up Lake Formation permissions for Data-Analyst

Complete the following steps to configure your data location in Amazon S3 with Lake Formation in hybrid access mode and grant access to the Data-Analyst role.

  1. Sign in to the AWS Management Console as a Lake Formation administrator role.
  2. Go to Lake Formation.
  3. Select Data lake locations from the left navigation bar under Administration.
  4. Select Register location and provide the Amazon S3 location of your database and tables. Provide an IAM role that has access to the data in the S3 location. For more details see Requirements for roles used to register locations.
  5. Select the Hybrid access mode under Permission mode and choose Register location.
  6. Select Data lake locations under Administration from the left navigation bar. Review that the registered location shows as Hybrid access mode for Permission mode.
  7. Select Databases from Catalog on the left navigation bar. Choose hybridsalesdb. You will select the database that has the data in the S3 location that you registered in the preceding step. From the Actions drop down menu, select Grant.
  8. Select Data-Analyst for IAM users and roles. Under LF-Tags or catalog resources, select Named Data Catalog resources and select hybridsalesdb for Databases.
  9. Under Database permissions, select Describe. Under Hybrid access mode, select the checkbox Make Lake Formation permissions effective immediately. Choose Grant.
  10. Again, select Databases from Catalog on the left navigation bar. Choose hybridsalesdb. Select Grant from the Actions drop down menu.
  11. On the Grant window, select Data-Analyst for IAM users and roles. Under LF-Tags or catalog resources, choose Named Data Catalog resources and select hybridsalesdb for Databases.
  12. Under Tables, select the three tables named hybridcustomer, hybridproduct, and hybridsales_order from the drop down.
  13. Under Table permissions, select Select and Describe permissions for the tables.
  14. Select the checkbox under Hybrid access mode to make the Lake Formation permissions effective immediately.
  15. Choose Grant.
  16. Review the granted permissions by selecting the Data lake permissions under Permissions on the left navigation bar. Filter Data permissions by Principal = Data-Analyst.
  17. On the left navigation bar, select Hybrid access mode. Verify that the opted in Data-Analyst shows up for the hybridsalesdb database and the three tables.
  18. Sign out from the console as the Lake Formation administrator role.

Validating Lake Formation permissions for Data-Analyst

  1. Sign in to the console as Data-Analyst.
  2. Go to the Athena console. If you’re using Athena for the first time, set up the query results location to your S3 bucket as described in Specifying a query result location.
  3. Run preview queries on the table from the Athena query editor.

Validating IAM and S3 permissions for Data-Engineer

  1. Sign out as Data-Analyst and sign back in to the console as Data-Engineer.
  2. Open the AWS Glue console and select ETL jobs from the left navigation bar.
  3. Under Create job, select Spark script editor. Choose Create.
  4. Download and open the sample script provided here.
  5. Copy and paste the script into your studio script editor as a new job.
  6. Edit the catalog_id, database, and table_name to suit your sample.
  7. Save and Run your AWS Glue ETL script by providing the IAM role of Data-Engineer to run the job.
  8. After the ETL script succeeds, you can select the output logs link from the Runs tab of the ETL script.
  9. Review the table’s schema, top 20 rows, and the total number of rows and columns from the AWS CloudWatch logs.

Thus, you can add Lake Formation permissions to a new role to access a Data Catalog database without interfering with another role that is accessing the same database through IAM and S3 permissions.

Scenario 2 – Hybrid access mode set up between two AWS accounts

This is a cross-account sharing scenario where a data producer shares a database and its tables to a consumer account. The producer provides full database access for an AWS Glue ETL workload on the consumer account. At the same time, the producer shares a few tables of the same database to the consumer account using Lake Formation. We walk you through how you can use hybrid access mode to support both access methods.

Prerequisites

  • Cross-account sharing of a database or table location that’s registered in hybrid access mode requires the producer or the grantor account to be in version 4 of cross-account sharing in the catalog setting to grant permissions on the hybrid access mode resource. When moving from version 3 to version 4 of cross-account sharing, existing Lake Formation permissions aren’t affected for database and table locations that are already registered with Lake Formation (Lake Formation mode). For new data set location registration in hybrid access mode and new Lake Formation permissions on this catalog resource, you will need version 4 of cross-account sharing.
  • The consumer or recipient account can use other versions of cross-account sharing. If your accounts are using version 1 or version 2 of cross-account sharing and if you want to upgrade, follow Updating cross-account data sharing version settings to first upgrade the catalog setting of cross-account sharing to version 3, before upgrading to version 4.

The producer account set up is similar to that of scenario 1 and we discuss the extra steps for scenario 2 in the following section.

Set up in producer account A

The consumer Data-Engineer role is granted Amazon S3 data access using the producer’s S3 bucket policy and Data Catalog access using the producer’s Data Catalog resource policy.

The S3 bucket policy in the producer account follows:

{
    "Version": "2012-10-17",
    "Statement": [
        {
        "Sid": "data engineer role permissions",
        "Effect": "Allow",
        "Principal": {
            "AWS": "arn:aws:iam::<consumer-account-id>:role/Data-Engineer"
        },
        "Action": [
            "s3:GetLifecycleConfiguration",
            "s3:ListBucket",
            "s3:PutObject",
            "s3:GetObject",
            "s3:DeleteObject"
        ],
        "Resource": [
            "arn:aws:s3:::<producer-account-databucket>",
            "arn:aws:s3:::<producer-account-databucket>/*"
        ]
        }
    ]
}

The Data Catalog resource policy in the producer account is shown below. You also need the glue:ShareResource IAM permission for AWS Resource Access Manager (AWS RAM) to enable cross-account sharing.

{
"Version" : "2012-10-17",
"Statement" : [
    {
    "Effect" : "Allow",
    "Principal" : {
        "AWS" : "arn:aws:iam::<consumer-account-id>:role/Data-Engineer"
    },
    "Action" : "glue:Get*",
    "Resource" : [
        "arn:aws:glue:<Region>:<producer-account-id>:catalog", 
        "arn:aws:glue:<Region>:<producer-account-id>:database/hybridsalesdb", 
        "arn:aws:glue:<Region>:<producer-account-id>:table/hybridsalesdb/*"
    ]
    },
    {
        "Effect" : "Allow",
        "Principal" : {
        "Service" : "ram.amazonaws.com"
        },
        "Action" : "glue:ShareResource",
        "Resource" : [
            "arn:aws:glue:<Region>:<producer-account-id>:table/*/*", 
            "arn:aws:glue:<Region>:<producer-account-id>:database/*", 
            "arn:aws:glue:<Region>:<producer-account-id>:catalog"
        ]
        }
    ]
}

Setting the cross-account version and registering the S3 bucket

  1. Sign in to the Lake Formation console as an IAM administrator role or a role with IAM permissions to the PutDataLakeSettings() API. Choose the AWS Region where you have your sample data set in an S3 bucket and its corresponding database and tables in the Data Catalog.
  2. Select Data catalog settings from the left navigation bar under Administration. Select Version 4 from the dropdown menu for Cross account version settings. Choose Save.
    Note: If there are any other accounts in your environment that share catalog resources to your producer account through Lake Formation, upgrading the sharing version might impact them. See <title of documentation page> for more information.
  3. Sign out as IAM administrator and sign back in to the Lake Formation console as a Lake Formation administrator role.
  4. Select Data lake locations from the left navigation bar under Administration.
  5. Select Register location and provide the S3 location of your database and tables.
  6. Provide an IAM role that has access to the data in the S3 location. For more details about this role requirement, see Requirements for roles used to register locations.
  7. Choose the Hybrid access mode under Permission mode, and then choose Register location.
  8. Select Data lake locations under Administration from the left navigation bar. Confirm that the registered location shows as Hybrid access mode for Permission mode.

Granting cross-account permissions

The steps to share the database hybridsalesdb to the consumer account are similar to the steps to set up scenario 1.

  1. In the Lake Formation console, select Databases from Catalog on the left navigation bar. Choose hybridsalesdb. Select your database that has the data in the S3 location that you registered previously. From the Actions drop down menu, select Grant.
  2. Select External accounts under Principals and provide the consumer account ID. Select Named catalog resources under LF-Tags or catalog resources. Choose hybridsalesdb for Databases.
  3. Select Describe for Database permissions and for Grantable permissions.
  4. Under Hybrid access mode, select the checkbox for Make Lake Formation permissions effective immediately. Choose Grant.

Note: Selecting the checkbox opts-in the consumer account Lake Formation administrator roles to use Lake Formation permissions without interrupting access to the consumer account’s IAM and S3 access for the same database.

  1. Repeat step 2 up to database selection to grant permission to the consumer account ID for table level permission. Select any three tables from the drop-down menu for table level permission under Tables.
  2. Select Select under Table permissions and Grantable permissions. Select the checkbox for Make Lake Formation permissions effective immediately under Hybrid access mode. Choose Grant.
  3. Select the Data lake permissions  on the left navigation bar. Verify the granted permissions to the consumer account.
  4. Select the Hybrid access mode on the left navigation bar. Verify the opted-in resources and principal.

You have now enabled cross-account sharing using Lake Formation permissions without revoking access to the IAMAllowedPrincipal virtual group.

Set up in consumer account B

In scenario 2, the Data-Analyst and Data-Engineer roles are created in the consumer account similar to scenario 1, but these roles access the database and tables shared from the producer account.

In addition to arn:aws:iam::aws:policy/AWSGlueConsoleFullAccess and arn:aws:iam::aws:policy/CloudWatchFullAccess, the  Data-Engineer role also has permissions to create and run an Apache Spark job in AWS Glue Studio.

Data-Engineer has the following IAM policy that grants access to the producer account’s S3 bucket, which is registered with Lake Formation in hybrid access mode.

{
    "Version": "2012-10-17",
    "Statement": [
        {
            "Sid": "AllowDataLakeBucket",
            "Effect": "Allow",
            "Action": [
                "s3:ListBucket",
                "s3:GetBucketLocation",
                "s3:GetLifecycleConfiguration",
                "s3:Put*",
                "s3:Get*",
                "s3:Delete*"
            ],
            "Resource": [
                "arn:aws:s3:::<producer-account-databucket>/*",
                "arn:aws:s3:::<producer-account-databucket>"
            ]
        }
    ]
}

Data-Engineer has the following IAM policy that grants access to the consumer account’s entire Data Catalog and producer account’s database hybridsalesdb and its tables.

{
    "Version": "2012-10-17",
    "Statement": [
        {
            "Effect": "Allow",
            "Action": [
                "glue:*"
            ],
            "Resource": [
                "arn:aws:glue:<Region>:<consumer-account-id>:catalog",
                "arn:aws:glue:<Region>:<consumer-account-id>:database/*",
                "arn:aws:glue:<Region>:<consumer-account-id>:table/*/*",

            ]
        },
        {
            "Effect": "Allow",
            "Action": [
                "glue:Get*"
            ],
            "Resource": [
                "arn:aws:glue:<Region>:<producer-account-id>:catalog",
                "arn:aws:glue:<Region>:<producer-account-id>:database/hybridsalesdb",
                "arn:aws:glue:<Region>:<producer-account-id>:table/hybridsalesdb/*"
            ]
        }
    ]
}

The Data-Analyst has the same IAM policies similar to scenario 1, granting basic data lake user permissions. For additional details, see Assign permissions to Lake Formation users.

Accepting AWS RAM invites

  1. Sign in to the Lake Formation console as a Lake Formation administrator role.
  2. Open the AWS RAM console. Select Resource shares from Shared with me on the left navigation bar. You should see two invites from the producer account, one for database level share and one for table level share.
  3. Select each invite, review the producer account ID, and choose Accept resource share.

Granting Lake Formation permissions to Data-Analyst

  1. Open the Lake Formation console. As a Lake Formation administrator, you should see the shared database and tables from the consumer account.
  2. Select Databases from the Data catalog on the left navigation bar. Select the radio button on the database hybridsalesdb and select Create resource link from the Actions drop down menu.
  3. Enter rl_hybridsalesdb as the name for the resource link and leave the rest of the selections as they are. Choose Create.
  4. Select the radio button for rl_hybridsalesdb. Select Grant from the Actions drop down menu.
  5. Grant Describe permissions on the resource link to Data-Analyst.
  6. Again, select the radio button on rl_hybridsalesdb from the Databases under Catalog in the left navigation bar. Select Grant on target from the Actions drop down menu.
  7. Select Data-Analyst for IAM users and roles, keep the already selected database hybridsalesdb.
  8. Select Describe under Database permissions. Select the checkbox for Make Lake Formation permissions effective immediately under Hybrid access mode. Choose Grant.
  9. Select the radio button on rl_hybridsalesdb from Databases under Catalog in the left navigation bar. Select Grant on target from the Actions drop down menu.
  10. Select Data-Analyst for IAM users and roles. Select All tables of the database hybridsalesdb. Select Select under Table permissions.
  11. Select the checkbox for Make Lake Formation permissions effective immediately under Hybrid access mode.
  12. View and verify the permissions granted to Data-Analyst from the Data lake permissions tab on the left navigation bar.
  13. Sign out as Lake Formation administrator role.

Validate Lake Formation permissions as Data-Analyst

  1. Sign back in to the console as Data-Analyst.
  2. Open the Athena console. If you’re using Athena for the first time, set up the query results location to your S3 bucket as described in Specifying a query result location.
    • In the Query Editor page, under Data, select AWSDataDatalog for Data source.  For Tables, select the three dots next to any of the table names. Select Preview Table to run the query.
  3. Sign out as Data-Analyst.

Validate IAM and S3 permissions for Data-Engineer

  1. Sign back in to the console as Data-Engineer.
  2. Using the same steps as scenario 1, verify IAM and S3 access by running the AWS Glue ETL script in AWS Glue Studio.

You’ve added Lake Formation permissions to a new role Data-Analyst, without interrupting existing IAM and S3 access to Data-Engineer for a cross-account sharing use-case.

Clean up

If you’ve used sample datasets from your S3 for this blog post, we recommend removing relevant Lake Formation permissions on your database for the Data-Analyst role and cross-account grants. You can also remove the hybrid access mode opt-in and remove the S3 bucket registration from Lake Formation. After removing all Lake Formation permissions from both the producer and consumer accounts, you can delete the Data-Analyst and Data-Engineer IAM roles.

Considerations

Currently, only a Lake Formation administrator role can opt in other users to use Lake Formation permissions for a resource, since opting in user access using either Lake Formation or IAM and S3 permissions is an administrative task requiring full knowledge of your organizational data access setup. Further, you can grant permissions and opt in at the same time using only the named-resource method and not LF-Tags. If you’re using LF-Tags to grant permissions, we recommend you use the Hybrid access mode option on the left navigation bar to opt in (or the equivalent CreateLakeFormationOptin() API using the AWS SDK or AWS CLI) as a subsequent step after granting permissions.

Conclusion

In this blog post, we went through the steps to set up hybrid access mode for Data Catalog. You learned how to onboard users selectively to the Lake Formation permissions model. The users who had access through IAM and S3 permissions continued to have their access without interruptions. You can use Lake Formation to add fine-grained access to Data Catalog tables to enable your business analysts to query using Amazon Athena and Amazon Redshift Spectrum, while your data scientists can explore the same data using Amazon Sagemaker. Data engineers can continue to use their IAM and S3 permissions on the same data to run workloads using Amazon EMR and AWS Glue. Hybrid access mode for the Data Catalog enables a variety of analytical use-cases for your data without data duplication.

To get started, see the documentation for hybrid access mode. We encourage you to check out the feature and share your feedback in the comments section. We look forward to hearing from you.


About the authors

Aarthi Srinivasan is a Senior Big Data Architect with AWS Lake Formation. She likes building data lake solutions for AWS customers and partners. When not on the keyboard, she explores the latest science and technology trends and spends time with her family.

Explore visualizations with AWS Glue interactive sessions

Post Syndicated from Annie Nelson original https://aws.amazon.com/blogs/big-data/explore-visualizations-with-aws-glue-interactive-sessions/

AWS Glue interactive sessions offer a powerful way to iteratively explore datasets and fine-tune transformations using Jupyter-compatible notebooks. Interactive sessions enable you to work with a choice of popular integrated development environments (IDEs) in your local environment or with AWS Glue or Amazon SageMaker Studio notebooks on the AWS Management Console, all while seamlessly harnessing the power of a scalable, on-demand Apache Spark backend. This post is part of a series exploring the features of AWS Glue interactive sessions.

AWS Glue interactive sessions now include native support for the matplotlib visualization library (AWS Glue version 3.0 and later). In this post, we look at how we can use matplotlib and Seaborn to explore and visualize data using AWS Glue interactive sessions, facilitating rapid insights without complex infrastructure setup.

Solution overview

You can quickly provision new interactive sessions directly from your notebook without needing to interact with the AWS Command Line Interface (AWS CLI) or the console. You can use magic commands to provide configuration options for your session and install any additional Python modules that are needed.

In this post, we use the classic Iris and MNIST datasets to navigate through a few commonly used visualization techniques using matplotlib on AWS Glue interactive sessions.

Create visualizations using AWS Glue interactive sessions

We start by installing the Sklearn and Seaborn libraries using the additional_python_modules Jupyter magic command:

%additional_python_modules scikit-learn, seaborn

You can also upload Python wheel modules to Amazon Simple Storage Service (Amazon S3) and specify the full path as a parameter value to the additional_python_modules magic command.

Now, let’s run a few visualizations on the Iris and MNIST datasets.

  1. Create a pair plot using Seaborn to uncover patterns within sepal and petal measurements across the iris species:
    import seaborn as sns
    import matplotlib.pyplot as plt
    
    # Load the Iris dataset
    iris = sns.load_dataset("iris")
    
    # Create a pair plot
    sns.pairplot(iris, hue="species")
    %matplot plt

  2. Create a violin plot to reveal the distribution of the sepal width measure across the three species of iris flowers:
    # Create a violin plot of the Sepal Width measure
    plt.figure(figsize=(10, 6))
    sns.violinplot(x="species", y="sepal_width", data=iris)
    plt.title("Violin Plot of Sepal Width by Species")
    plt.show()
    %matplot plt

  3. Create a heat map to display correlations across the iris dataset variables:
    # Calculate the correlation matrix
    correlation_matrix = iris.corr()
    
    # Create a heatmap using Seaborn
    plt.figure(figsize=(8, 6))
    sns.heatmap(correlation_matrix, annot=True, cmap="coolwarm")
    plt.title("Correlation Heatmap")
    %matplot plt

  4. Create a scatter plot on the MNIST dataset using PCA to visualize distributions among the handwritten digits:
    import matplotlib.pyplot as plt
    from sklearn.datasets import fetch_openml
    from sklearn.decomposition import PCA
    
    # Load the MNIST dataset
    mnist = fetch_openml('mnist_784', version=1)
    X, y = mnist['data'], mnist['target']
    
    # Apply PCA to reduce dimensions to 2 for visualization
    pca = PCA(n_components=2)
    X_pca = pca.fit_transform(X)
    
    # Scatter plot of the reduced data
    plt.scatter(X_pca[:, 0], X_pca[:, 1], c=y.astype(int), cmap='viridis', s=5)
    plt.xlabel("Principal Component 1")
    plt.ylabel("Principal Component 2")
    plt.title("PCA - MNIST Dataset")
    plt.colorbar(label="Digit Class")
    
    %matplot plt

  5. Create another visualization using matplotlib and the mplot3d toolkit:
    import numpy as np
    import matplotlib.pyplot as plt
    from mpl_toolkits.mplot3d import Axes3D
    
    # Generate mock data
    x = np.linspace(-5, 5, 100)
    y = np.linspace(-5, 5, 100)
    x, y = np.meshgrid(x, y)
    z = np.sin(np.sqrt(x**2 + y**2))
    
    # Create a 3D plot
    fig = plt.figure(figsize=(10, 8))
    ax = fig.add_subplot(111, projection='3d')
    
    # Plot the surface
    surface = ax.plot_surface(x, y, z, cmap='viridis')
    
    # Add color bar to map values to colors
    fig.colorbar(surface, ax=ax, shrink=0.5, aspect=10)
    
    # Set labels and title
    ax.set_xlabel('X')
    ax.set_ylabel('Y')
    ax.set_zlabel('Z')
    ax.set_title('3D Surface Plot Example')
    
    %matplot plt

As illustrated by the preceding examples, you can use any compatible visualization library by installing the required modules and then using the %matplot magic command.

Conclusion

In this post, we discussed how extract, transform, and load (ETL) developers and data scientists can efficiently visualize patterns in their data using familiar libraries through AWS Glue interactive sessions. With this functionality, you’re empowered to focus on extracting valuable insights from their data, while AWS Glue handles the infrastructure heavy lifting using a serverless compute model. To get started today, refer to Developing AWS Glue jobs with Notebooks and Interactive sessions.


About the authors

Annie Nelson is a Senior Solutions Architect at AWS. She is a data enthusiast who enjoys problem solving and tackling complex architectural challenges with customers.

Keerthi Chadalavada is a Senior Software Development Engineer at AWS Glue. She is passionate about designing and building end-to-end solutions to address customer data integration and analytic needs.

Zach Mitchell is a Sr. Big Data Architect. He works within the product team to enhance understanding between product engineers and their customers while guiding customers through their journey to develop their enterprise data architecture on AWS.

Gal blog picGal Heyne is a Product Manager for AWS Glue with a strong focus on AI/ML, data engineering and BI. She is passionate about developing a deep understanding of customer’s business needs and collaborating with engineers to design easy to use data products.

Introducing enhanced support for tagging, cross-account access, and network security in AWS Glue interactive sessions

Post Syndicated from Gonzalo Herreros original https://aws.amazon.com/blogs/big-data/introducing-enhanced-support-for-tagging-cross-account-access-and-network-security-in-aws-glue-interactive-sessions/

AWS Glue interactive sessions allow you to run interactive AWS Glue workloads on demand, which enables rapid development by issuing blocks of code on a cluster and getting prompt results. This technology is enabled by the use of notebook IDEs, such as the AWS Glue Studio notebook, Amazon SageMaker Studio, or your own Jupyter notebooks.

In this post, we discuss the following new management features recently added and how can they give you more control over the configurations and security of your AWS Glue interactive sessions:

  • Tags magic – You can use this new cell magic to tag the session for administration or billing purposes. For example, you can tag each session with the name of the billable department and later run a search to find all spending associated with this department on the AWS Billing console.
  • Assume role magic – Now you can create a session in an account different than the one you’re connected with by assuming an AWS Identity and Access Management (IAM) role owned by the other account. You can designate a dedicated role with permissions to create sessions and have other users assume it when they use sessions.
  • IAM VPC rules – You can require your users to use (or restrict them from using) certain VPCs or subnets for the sessions, to comply with your corporate policies and have control over how your data travels in the network. This feature existed for AWS Glue jobs and is now available for interactive sessions.

Solution overview

For our use case, we’re building a highly secured app and want to have users (developers, analysts, data scientists) running AWS Glue interactive sessions on specific VPCs to control how the data travels through the network.

In addition, users are not allowed to log in directly to the production account, which has the data and the connections they need; instead, users will run their own notebooks via their individual accounts and get permission to assume a specific role enabled on the production account to run their sessions. Users can run AWS Glue interactive sessions by using both AWS Glue Studio notebooks via the AWS Glue console, as well as Jupyter notebooks that run on their local machine.

Lastly, all new resources be tagged with the name of the department for proper billing allocation and cost control.

The following architecture diagram highlights the different roles and accounts involved:

  • Account A – The individual user account. The user ISBlogUser has permissions to create AWS Glue notebook servers via the AWSGlueServiceRole-notebooks role and assume a role in account B (directly or indirectly).
  • Account B – The production account that owns the GlueSessionsCreationRole role, which users assume to create AWS Glue interactive sessions in this account.

architecture

Prerequisites

In this section, we walk through the steps to set up the prerequisite resources and security configurations.

Install AWS CLI and Python library

Install and configure the AWS Command Line Interface (AWS CLI) if you don’t have it already set up. For instructions, refer to Install or update the latest version of the AWS CLI.

Optionally, if you want to use run a local notebook from your computer, install Python 3.7 or later and then install Jupyter and the AWS Glue interactive sessions kernels. For instructions, refer to Getting started with AWS Glue interactive sessions. You can then run Jupyter directly from the command line using jupyter notebook, or via an IDE like VSCode or PyCharm.

Get access to two AWS accounts

If you have access to two accounts, you can reproduce the use case described in this post. The instructions refer to account A as the user account that runs the notebook and account B as the account that runs the sessions (the production account in the use case). This post assumes you have enough administration permissions to create the different components and manage the account security roles.

If you have access to only one account, you can still follow this post and perform all the steps on that single account.

Create a VPC and subnet

We want to limit users to use AWS Glue interactive session only via a specific VPC network. First, let’s create a new VPC in account B using Amazon Virtual Private Cloud (Amazon VPC). We use this VPC connection later to enforce the network restrictions.

  1. Sign in to the AWS Management Console with account B.
  2. On the Amazon VPC console, choose Your VPCs in the navigation pane.
  3. Choose Create VPC.
  4. Enter 10.0.0.0/24 as the IP CIDR.
  5. Leave the remaining parameters as default and create your VPC.
  6. Make a note of the VPC ID (starting with vpc-) to use later.

For more information about creating VPCs, refer to Create a VPC.

  1. In the navigation pane, choose Subnets.
  2. Choose Create subnet.
  3. Select the VPC you created, enter the same CIDR (10.0.0.0/24), and create your subnet.
  4. In the navigation pane, choose Endpoints.
  5. Choose Create endpoint.
  6. For Service category, select AWS services.
  7. Search for the option that ends in s3, such as com.amazonaws.{region}.s3.
  8. In the search results, select the Gateway type option.

add gateway endpoint

  1. Choose your VPC on the drop-down menu.
  2. For Route tables, select the subnet you created.
  3. Complete the endpoint creation.

Create an AWS Glue network connection

You now need to create an AWS Glue connection that uses the VPC, so sessions created with it can meet the VPC requirement.

  1. Sign in to the console with account B.
  2. On the AWS Glue console, choose Data connections in the navigation pane.
  3. Choose Create connection.
  4. For Name, enter session_vpc.
  5. For Connection type, choose Network.
  6. In the Network options section, choose the VPC you created, a subnet, and a security group.
  7. Choose Create connection.

create connection

Account A security setup

Account A is the development account for your users (developers, analysts, data scientists, and so on). They are provided IAM users to access this account programmatically or via the console.

Create the assume role policy

The assume role policy allows users and roles in account A to assume roles in account B (the role in account B also has to allow it). Complete the following steps to create the policy:

  1. On the IAM console, choose Policies in the navigation pane.
  2. Choose Create policy.
  3. Switch to the JSON tab in the policy editor and enter the following policy (provide the account B number):{
{
    "Version": "2012-10-17",
    "Statement": [
        {
            "Effect": "Allow",
            "Action": "sts:AssumeRole",
            "Resource": "arn:aws:iam::{account B number}:role/*"
        }
    ]
}
  1. Name the role AssumeRoleAccountBPolicy and complete the creation.

Create an IAM user

Now you create an IAM user for account A that you can use to run AWS Glue interactive sessions locally or on the console.

  1. On the IAM console, choose Users in the navigation pane.
  2. Choose Create user.
  3. Name the user ISBlogUser.
  4. Select Provide user access to the AWS Management Console.
  5. Select I want to create an IAM user and choose a password.
  6. Attach the policies AWSGlueConsoleFullAccess and AssumeRoleAccountBPolicy.
  7. Review the settings and complete the user creation.

Create an AWS Glue Studio notebook role

To start an AWS Glue Studio notebook, a role is required. Usually, the same role is used both to start a notebook and run a session. In this use case, users of account A only need permissions to run a notebook, because they will create sessions via the assumed role in account B.

  1. On the IAM console, choose Roles in the navigation pane.
  2. Choose Create role.
  3. Select Glue as the use case.
  4. Attach the policies AWSGlueServiceNotebookRole and AssumeRoleAccountBPolicy.
  5. Name the role AWSGlueServiceRole-notebooks (because the name starts with AWSGlueServiceRole, the user doesn’t need explicit PassRole permission), then complete the creation.

Optionally, you can allow Amazon CodeWhisperer to provide code suggestions on the notebook by adding the permission to the role. To do so, navigate to the role AWSGlueServiceRole-notebooks on the IAM console. On the Add permissions menu, choose Create inline policy. Use the following JSON policy and name it CodeWhispererPolicy:

{
    "Version": "2012-10-17",
    "Statement": [
        {
            "Effect": "Allow",
            "Action": "codewhisperer:GenerateRecommendations",
            "Resource": "*"
        }
    ]
}

Account B security setup

Account B is considered the production account that contains the data and connections, and runs the AWS Glue data integration pipelines (using either AWS Glue sessions or jobs). Users don’t have direct access to it; they use it assuming the role created for this purpose.

To follow this post, you need two roles: one the AWS Glue service will assume to run and another that creates sessions, enforcing the VPC restriction.

Create an AWS Glue service role

To create an AWS Glue service role, complete the following steps:

  1. On the IAM console, choose Roles in the navigation pane.
  2. Choose Create role.
  3. Choose Glue for the use case.
  4. Attach the policy AWSGlueServiceRole.
  5. Name the role AWSGlueServiceRole-blog and complete the creation.

Create an AWS Glue interactive session role

This role will be used to create sessions following the VPC requirements. Complete the following steps to create the role:

  1. On the IAM console, choose Policies in the navigation pane.
  2. Choose Create policy.
  3. Switch to the JSON tab in the policy editor and enter the following code (provide your VPC ID). You can also replace the * in the policy with the full ARN of the role AWSGlueServiceRole-blog you just created, to force the notebook to only use that role when creating sessions.
{
    "Version": "2012-10-17",
    "Statement": [
        {
            "Effect": "Deny",
            "Action": [
                "glue:CreateSession"
            ],
            "Resource": [
                "*"
            ],
            "Condition": {
                "ForAnyValue:StringNotEquals": {
                    "glue:VpcIds": [
                        "{enter your vpc id here}"
                    ]
                }
            }
        },
        {
            "Effect": "Deny",
            "Action": [
                "glue:CreateSession"
            ],
            "Resource": [
                "*"
            ],
            "Condition": {
                "Null": {
                    "glue:VpcIds": true
                }
            }
        },
        {
            "Effect": "Allow",
            "Action": [
                "glue:GetTags"
            ],
            "Resource": [
                "*"
            ]
        },
        {
            "Effect": "Allow",
            "Action": "iam:PassRole",
            "Resource": "*"
        }        
    ]
}

This policy complements the AWSGlueServiceRole you attached before and restricts the session creation based on the VPC. You could also restrict the subnet and security group in a similar way using conditions for the resources glue:SubnetIds and glue:SecurityGroupIds respectively.

In this case, the sessions creation requires a VPC, which has to be in the list of IDs listed. If you need to just require any valid VPC to be used, you can remove the first statement and leave the one that denies the creation when the VPC is null.

  1. Name the policy CustomCreateSessionPolicy and complete the creation.
  2. Choose Roles in the navigation pane.
  3. Choose Create role.
  4. Select Custom trust policy.
  5. Replace the trust policy template with the following code (provide your account A number):
{
    "Version": "2012-10-17",
    "Statement": [
        {
            "Effect": "Allow",
            "Principal": {
                "AWS": [
                      "arn:aws:iam::{account A}:role/AWSGlueServiceRole-notebooks", 
                      "arn:aws:iam::{account A}:user/ISBlogUser"
                    ]
            },
            "Action": "sts:AssumeRole"
        }
    ]
}

This allows the role to be assumed directly by the user when using a local notebook and also when using an AWS Glue Studio notebook with a role.

  1. Attach the policies AWSGlueServiceRole and CustomCreateSessionPolicy (which you created on the previous step, so you might need to refresh for them to be listed).
  2. Name the role GlueSessionCreationRole and complete the role creation.

Create the Glue interactive session in the VPC, with assumed role and tags

Now that you have the accounts, roles, VPC, and connection ready, you use them to meet the requirements. You start a new notebook using account A, which assumes the role of account B to create a session in the VPC, and tag it with the department and billing area.

Start a new notebook

Using account A, start a new notebook. You may use either of the following options.

Option 1: Create an AWS Glue Studio notebook

The first option is to create an AWS Glue Studio notebook:

  1. Sign in to the console with account A and the ISBlogUser user.
  2. On the AWS Glue console, choose Notebooks in the navigation pane under ETL jobs.
  3. Select Jupyter Notebook and choose Create.
  4. Enter a name for your notebook.
  5. Specify the role AWSGlueServiceRole-notebooks.
  6. Choose Start notebook.

Option 2: Create a local notebook

Alternatively, you can create a local notebook. Before you start the process that runs Jupyter (or if you run it indirectly, then the IDE that runs it), you need to set the IAM ID and key for the user ISBlogUser, either using aws configure on the command line or setting the values as environment variables AWS_ACCESS_KEY_ID and AWS_SECRET_ACCESS_KEY for the user ID and secret key, respectively. Then create a new Jupyter notebook and select the kernel Glue PySpark.

Start a session from the notebook

After you start the notebook, select the first cell and add four new empty code cells. If you are using an AWS Glue Studio notebook, the notebook already contains some prepopulated cells as examples; we don’t use those sample cells in this post.

  1. In the first cell, enter the following magic configuration with the session creation role ARN, using the ID of account B:
# Configure the role we assume for creating the sessions
# Tip: assume_role is a cell magic (meaning it needs its own cell)
%%assume_role
"arn:aws:iam::{account B}:role/GlueSessionCreationRole"
  1. Run the cell to set up that configuration, either by choosing the button on the toolbar or pressing Shift + Enter.

It should confirm the role was assumed correctly. Now when the session is launched, it will be done by this role. This allowed you to use a role from a different account to run a session on that account.

  1. In the second cell, enter sample tags like the following and run the cell in the same way:
# Set a tag to associate the session with billable department
# Tip: tags is a cell magic (meaning it needs its own cell)
%%tags
{'team':'analytics', 'billing':'Data-Platform'}
  1. In the third cell, enter the following sample configuration (provide the role ARN with account B) and run the cell to set up the configuration:
# Set the configuration of your sessions using magics 
# Tip: non-cell magics can share the same cell 
%idle_timeout 2880
%glue_version 4.0
%worker_type G.1X
%number_of_workers 5
%iam_role arn:aws:iam::{account B}:role/AWSGlueServiceRole-blog

Now the session is configured but hasn’t started yet because you didn’t run any Python code.

  1. In the fourth empty cell, enter the following code to set up the objects required to work with AWS Glue and run the cell:
import sys
from awsglue.transforms import *
from awsglue.utils import getResolvedOptions
from pyspark.context import SparkContext
from awsglue.context import GlueContext
from awsglue.job import Job

sc = SparkContext.getOrCreate()
glueContext = GlueContext(sc)
spark = glueContext.spark_session
job = Job(glueContext)

It should fail with a permission error saying that there is an explicit deny policy activated. This is the VPC condition you set before. By default, the session doesn’t use a VPC, so this is why it’s failing.

notebook error

You can solve the error by assigning the connection you created before, so the session runs inside the VPC authorized.

  1. In the third cell, add the %connections magic with the value session_vpc.

The session needs to run in the same Region in which the connection is defined. If that’s not the same as the notebook Region, you can explicitly configure the session Region using the %region magic.

notebook cells

  1. After you have added the new config settings, run the cell again so the magics take effect.
  2. Run the fourth cell again (the one with the code).

This time, it should start the session and after a brief period confirm it has been created correctly.

  1. Add a new cell with the following content and run it: %status

This will display the configuration and other information about the session that the notebook is using, including the tags set before.

status result

You started a notebook in account A and used a role from account B to create a session, which uses the network connection so it runs in the required VPC. You also tagged the session to be able to easily identify it later.

In the next section, we discuss more ways to monitor sessions using tags.

Interactive session tags

Before tags were supported, if you wanted to identify the purpose of sessions running the account, you had to use the magic %session_id_prefix to name your session with something meaningful.

Now, with the new tags magic, you can use more sophisticated ways to categorize your sessions.

In the previous section, you tagged the session with a team and billing department. Let’s imagine now you are an administrator checking the sessions that different teams run in an account and Region.

Explore tags via the AWS CLI

On the command line where you have the AWS CLI installed, run the following command to list the sessions running in the account and Regions configured (use the Region and max results parameters if needed):

aws glue list-sessions

You also have the option to just list sessions that have a specific tag:

aws glue list-sessions --tags team=analytics

You can also list all the tags associated with a specific session with the following command. Provide the Region, account, and session ID (you can get it from the list-sessions command):

aws glue get-tags --resource-arn arn:aws:glue:{region}:{account}:session/{session Id}

Explore tags via the AWS Billing console

You can also use tags to keep track of cost and do more accurate cost assignment in your company. After you have used a tag in your session, the tag will become available for billing purposes (it can take up to 24 hours to be detected).

  1. On the AWS Billing console, choose Cost allocation tags under Billing in the navigation pane.
  2. Search for and select the tags you used in the session: “team” and “billing”.
  3. Choose Activate.

This activation can take up to 24 hours additional hours until the tag is applied for billing purposes. You only have to do this one time when you start using a new tag on an account.

cost allocation tags

  1. After the tags have been correctly activated and applied, choose Cost explorer under Cost Management in the navigation pane.
  2. In the Report parameters pane, for Tag, choose one of the tags you activated.

This adds a drop-down menu for this tag, where you can choose some or all of the tag values to use.

  1. Make your selection and choose Apply to use the filter on the report.

bill barchart

Clean up

Run the %stop_session magic in a cell to stop the session and avoid further charges. If you no longer need the notebook, VPC, or roles you created, you can delete them as well.

Conclusion

In this post, we showed how to use these new features in AWS Glue to have more control over your interactive sessions for management and security. You can enforce network restrictions, allow users from other accounts to use your session, and use tags to help you keep track of the session usage and cost reports. These new features are already available, so you can start using them now.


About the authors

Gonzalo Herreros
Gonzalo Herreros is a Senior Big Data Architect on the AWS Glue team.
Gal Heyne
Gal Heyne is a Technical Product Manager on the AWS Glue team.

How Chime Financial uses AWS to build a serverless stream analytics platform and defeat fraudsters

Post Syndicated from Khandu Shinde original https://aws.amazon.com/blogs/big-data/how-chime-financial-uses-aws-to-build-a-serverless-stream-analytics-platform-and-defeat-fraudsters/

This is a guest post by Khandu Shinde, Staff Software Engineer and Edward Paget, Senior Software Engineering at Chime Financial.

Chime is a financial technology company founded on the premise that basic banking services should be helpful, easy, and free. Chime partners with national banks to design member first financial products. This creates a more competitive market with better, lower-cost options for everyday Americans who aren’t being served well by traditional banks. We help drive innovation, inclusion, and access across the industry.

Chime has a responsibility to protect our members against unauthorized transactions on their accounts. Chime’s Risk Analysis team constantly monitors trends in our data to find patterns that indicate fraudulent transactions.

This post discusses how Chime utilizes AWS Glue, Amazon Kinesis, Amazon DynamoDB, and Amazon SageMaker to build an online, serverless fraud detection solution — the Chime Streaming 2.0 system.

Problem statement

In order to keep up with the rapid movement of fraudsters, our decision platform must continuously monitor user events and respond in real-time. However, our legacy data warehouse-based solution was not equipped for this challenge. It was designed to manage complex queries and business intelligence (BI) use cases on a large scale. However, with a minimum data freshness of 10 minutes, this architecture inherently didn’t align with the near real-time fraud detection use case.

To make high-quality decisions, we need to collect user event data from various sources and update risk profiles in real time. We also need to be able to add new fields and metrics to the risk profiles as our team identifies new attacks, without needing engineering intervention or complex deployments.

We decided to explore streaming analytics solutions where we can capture, transform, and store event streams at scale, and serve rule-based fraud detection models and machine learning (ML) models with milliseconds latency.

Solution overview

The following diagram illustrates the design of the Chime Streaming 2.0 system.

The design included the following key components:

  1. We have Amazon Kinesis Data Streams as our streaming data service to capture and store event streams at scale. Our stream pipelines capture various event types, including user enrollment events, user login events, card swipe events, peer-to-peer payments, and application screen actions.
  2. Amazon DynamoDB is another data source for our Streaming 2.0 system. It acts as the application backend and stores data such as blocked devices list and device-user mapping. We mainly use it as lookup tables in our pipeline.
  3. AWS Glue jobs form the backbone of our Streaming 2.0 system. The simple AWS Glue icon in the diagram represents thousands of AWS Glue jobs performing different transformations. To achieve the 5-15 seconds end-to-end data freshness service level agreement (SLA) for the Steaming 2.0 pipeline, we use streaming ETL jobs in AWS Glue to consume data from Kinesis Data Streams and apply near-real-time transformation. We choose AWS Glue mainly due to its serverless nature, which simplifies infrastructure management with automatic provisioning and worker management, and the ability to perform complex data transformations at scale.
  4. The AWS Glue streaming jobs generate derived fields and risk profiles that get stored in Amazon DynamoDB. We use Amazon DynamoDB as our online feature store due to its millisecond performance and scalability.
  5. Our applications call Amazon SageMaker Inference endpoints for fraud detections. The Amazon DynamoDB online feature store supports real-time inference with single digit millisecond query latency.
  6. We use Amazon Simple Storage Service (Amazon S3) as our offline feature store. It contains historical user activities and other derived ML features.
  7. Our data scientist team can access the dataset and perform ML model training and batch inferencing using Amazon SageMaker.

AWS Glue pipeline implementation deep dive

There are several key design principles for our AWS Glue Pipeline and the Streaming 2.0 project.

  • We want to democratize our data platform and make the data pipeline accessible to all Chime developers.
  • We want to implement cloud financial backend services and achieve cost efficiency.

To achieve data democratization, we needed to enable different personas in the organization to use the platform and define transformation jobs quickly, without worrying about the actual implementation details of the pipelines. The data infrastructure team built an abstraction layer on top of Spark and integrated services. This layer contained API wrappers over integrated services, job tags, scheduling configurations and debug tooling, hiding Spark and other lower-level complexities from end users. As a result, end users were able to define jobs with declarative YAML configurations and define transformation logic with SQL. This simplified the onboarding process and accelerated the implementation phase.

To achieve cost efficiency, our team built a cost attribution dashboard based on AWS cost allocation tags. We enforced tagging with the above abstraction layer and had clear cost attribution for all AWS Glue jobs down to the team level. This enabled us to track down less optimized jobs and work with job owners to implement best practices with impact-based priority. One common misconfiguration we found was sizing of AWS Glue jobs. With data democratization, many users lacked the knowledge to right-size their AWS Glue jobs. The AWS team introduced AWS Glue auto scaling to us as a solution. With AWS Glue Auto Scaling, we no longer needed to plan AWS Glue Spark cluster capacity in advance. We could just set the maximum number of workers and run the jobs. AWS Glue monitors the Spark application execution, and allocates more worker nodes to the cluster in near-real time after Spark requests more executors based on our workload requirements. We noticed a 30–45% cost saving across our AWS Glue Jobs once we turned on Auto Scaling.

Conclusion

In this post, we showed you how Chime’s Streaming 2.0 system allows us to ingest events and make them available to the decision platform just seconds after they are emitted from other services. This enables us to write better risk policies, provide fresher data for our machine learning models, and protect our members from unauthorized transactions on their accounts.

Over 500 developers in Chime are using this streaming pipeline and we ingest more than 1 million events per second. We follow the sizing and scaling process from the AWS Glue streaming ETL jobs best practices blog and land on a 1:1 mapping between Kinesis Shard and vCPU core. The end-to-end latency is less than 15 seconds, and it improves the model score calculation speed by 1200% compared to legacy implementation. This system has proven to be reliable, performant, and cost-effective at scale.

We hope this post will inspire your organization to build a real-time analytics platform using serverless technologies to accelerate your business goals.


About the Authors

Khandu Shinde Khandu Shinde is a Staff Engineer focused on Big Data Platforms and Solutions for Chime. He helps to make the platform scalable for Chime’s business needs with architectural direction and vision. He’s based in San Francisco where he plays cricket and watches movies.

Edward Paget Edward Paget is a Software Engineer working on building Chime’s capabilities to mitigate risk to ensure our members’ financial peace of mind. He enjoys being at the intersection of big data and programming language theory. He’s based in Chicago where he spends his time running along the lake shore.

Dylan Qu is a Specialist Solutions Architect focused on Big Data & Analytics with Amazon Web Services. He helps customers architect and build highly scalable, performant, and secure cloud-based solutions on AWS.

Explore real-world use cases for Amazon CodeWhisperer powered by AWS Glue Studio notebooks

Post Syndicated from Ishan Gaur original https://aws.amazon.com/blogs/big-data/explore-real-world-use-cases-for-amazon-codewhisperer-powered-by-aws-glue-studio-notebooks/

Many customers are interested in boosting productivity in their software development lifecycle by using generative AI. Recently, AWS announced the general availability of Amazon CodeWhisperer, an AI coding companion that uses foundational models under the hood to improve software developer productivity. With Amazon CodeWhisperer, you can quickly accept the top suggestion, view more suggestions, or continue writing your own code. This integration reduces the overall time spent in writing data integration and extract, transform, and load (ETL) logic. It also helps beginner-level programmers write their first lines of code. AWS Glue Studio notebooks allows you to author data integration jobs with a web-based serverless notebook interface.

In this post, we discuss real-world use cases for CodeWhisperer powered by AWS Glue Studio notebooks.

Solution overview

For this post, you use the CSV eSports Earnings dataset, available to download via Kaggle. The data is scraped from eSportsEarnings.com, which provides information on earnings of eSports players and teams. The objective is to perform transformations using an AWS Glue Studio notebook with CodeWhisperer recommendations and then write the data back to Amazon Simple Storage Service (Amazon S3) in Parquet file format as well as to Amazon Redshift.

Prerequisites

Our solution has the following prerequisites:

  1. Set up AWS Glue Studio.
  2. Configure an AWS Identity and Access Management (IAM) role to interact with CodeWhisperer. Attach the following policy to your IAM role that is attached to the AWS Glue Studio notebook:
    {
        "Version": "2012-10-17",
        "Statement": [{
            "Sid": "CodeWhispererPermissions",
            "Effect": "Allow",
            "Action": [
                "codewhisperer:GenerateRecommendations"
            ],
            "Resource": "*"
        }]
    }

  3. Download the CSV eSports Earnings dataset and upload the CSV file highest_earning_players.csv to the S3 folder you will be using in this use case.

Create an AWS Glue Studio notebook

Let’s get started. Create a new AWS Glue Studio notebook job by completing the following steps:

  1. On the AWS Glue console, choose Notebooks under ETL jobs in the navigation pane.
  2. Select Jupyter Notebook and choose Create.
  3. For Job name, enter CodeWhisperer-s3toJDBC.

A new notebook will be created with the sample cells as shown in the following screenshot.

We use the second cell for now, so you can remove all the other cells.

  1. In the second cell, update the interactive session configuration by setting the following:
    1. Worker type to G.1X
    2. Number of workers to 3
    3. AWS Glue version to 4.0
  2. Moreover, import the DynamicFrame module and current_timestamp function as follows:
    from pyspark.sql.functions import current_timestamp
    from awsglue.dynamicframe import DynamicFrame

After you make these changes, the notebook should be looking like the following screenshot.

Now, let’s ensure CodeWhisperer is working as intended. At the bottom right, you will find the CodeWhisperer option beside the Glue PySpark status, as shown in the following screenshot.

You can choose CodeWhisperer to view the options to use Auto-Suggestions.

Develop your code using CodeWhisperer in an AWS Glue Studio notebook

In this section, we show how to develop an AWS Glue notebook job for Amazon S3 as a data source and JDBC data sources as a target. For our use case, we need to ensure Auto-Suggestions are enabled. Write your recommendation using CodeWhisperer using the following steps:

  1. Write a comment in natural language (in English) to read Parquet files from your S3 bucket:
    # Read CSV files from S3

After you enter the preceding comment and press Enter, the CodeWhisperer button at the end of the page will show that it is running to write the recommendation. The output of the CodeWhisperer recommendation will appear in the next line and the code is chosen after you press Tab. You can learn more in User actions.

After you enter the preceding comment, CodeWhisperer will generate a code snippet that is similar to the following:

df = (spark.read.format("csv")
      .option("header", "true")
      .option("inferSchema", "true")
      .load("s3://<bucket>/<path>/highest_earning_players.csv"))

Note that you need to update the paths to match the S3 bucket you’re using instead of the CodeWhisperer-generated bucket.

From the preceding code snippet, CodeWhisperer used Spark DataFrames to read the CSV files.

  1. You can now try some rephrasing to get a suggestion with DynamicFrame functions:
# Read CSV file from S3 with the header format option using DynamicFrame"

Now CodeWhisperer will generate a code snippet that is close to the following:

dyF = glueContext.create_dynamic_frame.from_options(
    connection_type="s3",
    connection_options={
        "paths": ["s3://<bucket>/<path>/highest_earning_players.csv"],
        "recurse": True,
    },
    format="csv",
    format_options={
        "withHeader": True,
    },
    transformation_ctx="dyF")

Rephrasing the sentences written now has proved that after some modifications to the comments we wrote, we got the correct recommendation from CodeWhisperer.

  1. Next, use CodeWhisperer to print the schema of the preceding AWS Glue DynamicFrame by using the following comment:
    # Print the schema of the above DynamicFrame

CodeWhisperer will generate a code snippet that is close to the following:

dyF.printSchema()

We get the following output.

Now we use CodeWhisperer to create some transformation functions that can manipulate the AWS Glue DynamicFrame read earlier. We start by entering code in a new cell.

  1. First, test if CodeWhisperer can use the correct AWS Glue context functions like ResolveChoice:
    # Convert the "PlayerId" type from string to integer

CodeWhisperer has recommended a code snippet similar to the following:

dyF = dyF.resolveChoice(specs=[('PlayerId', 'cast:long')])
dyF.printSchema()

The preceding code snippet doesn’t accurately represent the comment that we entered.

  1. You can apply sentence paraphrasing and simplifying by providing the following three comments. Each one has different ask and we use the withColumn Spark Frame method, which is used in casting columns types:
    # Convert the DynamicFrame to spark data frame
    # Cast the 'PlayerId' column from string to Integer using WithColumn function
     # Convert the spark frame back to DynamicFrame and print the schema

CodeWhisperer will pick up the preceding commands and recommend the following code snippet in sequence:

df = dyF.toDF()
df = df.withColumn("PlayerId", df["PlayerId"].cast("integer"))
dyF = DynamicFrame.fromDF(df, glueContext, "dyF")
dyF.printSchema()

The following output confirms the PlayerId column is changed from string to integer.

  1. Apply the same process to the resultant AWS Glue DynamicFrame for the TotalUSDPrize column by casting it from string to long using the withColumn Spark Frame functions by entering the following comments:
    # Convert the dynamicFrame to Spark Frame
    # Cast the "TotalUSDPrize" column from String to long
    # Convert the spark frame back to dynamic frame and print the schema

The recommended code snippet is similar to the following:

df = dyF.toDF()
df = df.withColumn("TotalUSDPrize", df["TotalUSDPrize"].cast("long"))
dyF = DynamicFrame.fromDF(df, glueContext, "dyF")
dyF.printSchema()

The output schema of the preceding code snippet is as follows.

Now we will try to recommend a code snippet that reflects the average prize for each player according to their country code.

  1. To do so, start by getting the count of the player per each country:
    # Get the count of each country code

The recommended code snippet is similar to the following:

country_code_count = df.groupBy("CountryCode").count()
country_code_count.show()

We get the following output.

  1. Join the main DataFrame with the country code count DataFrame and then add a new column calculating the average highest prize for each player according to their country code:
    # Convert the DynamicFrame (dyF) to dataframe (df)
    # Join the dataframe (df) with country_code_count dataframe with respect to CountryCode column
    # Convert the spark frame back to DynamicFrame and print the schema

The recommended code snippet is similar to the following:

df = dyF.toDF()
df = df.join(country_code_count, "CountryCode")
dyF = DynamicFrame.fromDF(df, glueContext, "dyF")
dyF.printSchema()

The output of the schema now confirms the both DataFrames where correctly joined and the Count column is added to the main DataFrame.

  1. Get the code recommendation on the code snippet to calculate the average TotalUSDPrize for each country code and add it to a new column:
    # Get the sum of all the TotalUSDPrize column per countrycode
    # Rename the sum column to be "SumPrizePerCountry" in the newly generated dataframe

The recommended code snippet is similar to the following:

country_code_sum = df.groupBy("CountryCode").sum("TotalUSDPrize")
country_code_sum = country_code_sum.withColumnRenamed("sum(TotalUSDPrize)", "SumPrizePerCountry")
country_code_sum.show()

The output of the preceding code should look like the following.

  1. Join the country_code_sum DataFrame with the main DataFrame from earlier and get the average of the prizes per player per country:
    # Join the above dataframe with the main dataframe with respect to CountryCode
    # Get the average Total prize in USD per player per country and add it to a new column called "AveragePrizePerPlayerPerCountry"

The recommended code snippet is similar to the following:

df = df.join(country_code_sum, "CountryCode")
df = df.withColumn("AveragePrizePerPlayerPerCountry", df["SumPrizePerCountry"] / df["count"])
  1. The last part in the transformation phase is to sort the data by the highest average prize per player per country:
    # sort the above dataframe descendingly according to the highest Average Prize per player country
    # Show the top 5 rows

The recommended code snippet is similar to the following:

df = df.sort(df["AveragePrizePerPlayerPerCountry"].desc())
df.show(5)

The first five rows will be similar to the following.

For the last step, we write the DynamicFrame to Amazon S3 and to Amazon Redshift.

  1. Write the DynamicFrame to Amazon S3 with the following code:
    # Convert the data frame to DynamicFrame
    # Write the DynamicFrame to S3 in glueparquet format

The CodeWhisperer recommendation is similar to the following code snippet:

dyF = DynamicFrame.fromDF(df, glueContext, "dyF")

glueContext.write_dynamic_frame.from_options(
frame=dyF,
connection_type="s3",
connection_options={
"path": "s3://<enter your own>/",
"partitionKeys": [],
},
format = "glueparquet",
)

We need to correct the code snippet generated after the recommendation because it doesn’t contain partition keys. As we pointed out, partitionkeys is empty, so we can have another code block suggestion to set partitionkey and then write it to the target Amazon S3 location. Also, according to the newest updates related to writing DynamicFrames to Amazon S3 using glueparquet, format = "glueparquet" is no longer used. Instead, you need to use the parquet type with useGlueParquetWriter enabled.

After the updates, our code looks similar to the following:

dyF = DynamicFrame.fromDF(df, glueContext, "dyF")

glueContext.write_dynamic_frame.from_options(
frame=dyF,
connection_type="s3",
connection_options={
"path": "s3://<enter your own>/",
},
format = "parquet",
 format_options={
 "useGlueParquetWriter": True,
    },
)

Another option here would be to write the files to Amazon Redshift using a JDBC connection.

  1. First, enter the following command to check whether CodeWhisperer will understand the comment in one sentence and use the correct functions or not:
    # Write the DynamicFrame to Redshift
    # Select only the following 3 columns in the DynamicFrame to write to redshift: CountryCode, TotalUSDPrize, NameFirst, NameLast, AveragePrizePerPlayerPerCountr

The output of the comment is similar to the following code snippet:

dyF = dyF.select_fields(["CountryCode", "TotalUSDPrize", "NameFirst","NameLast","AveragePrizePerPlayerPerCountry"])
glueContext.write_dynamic_frame.from_options(
    frame=dyF,
    connection_type="redshift",
    connection_options={
        "url": "jdbc:redshift://omarglueblog.cjzxbkzmhwqm.us-east-1.redshift.amazonaws.com:5439/omarglueblog",
        "user": "omarglueblog",
        "password": "omarglueblog",
        "dbtable": "highest_earning_players_redshift",
        "driver": "com.amazon.redshift.jdbc42.Driver",
        "preactions": "truncate table highest_earning_players_redshift",
        "redshiftTmpDir": "s3://awsgluetest/tmp/",
        "aws_iam_role": "0000000000000000000000000:role/glue-role",
    },
     format = "redshift",
     transformation_ctx="dyF"
    
)

As we can see, CodeWhisperer correctly interpreted the comment by selecting only the specified columns to write to Amazon Redshift.

  1. Now, use CodeWhisperer to write the DynamicFrame to Amazon Redshift. We use the Preaction parameter to run a SQL query to select only certain columns to be written to Amazon Redshift:
    # Write the resultant DynamicFrame to Redshift 
    # using preaction that selects only the following columns: CountryCode, TotalUSDPrize, NameFirst, NameLast, AveragePrizePerPlayerPerCountry

The CodeWhisperer recommendation is similar to the following code snippet:

glueContext.write_dynamic_frame.from_options(
    frame = dyf,
    connection_type = "redshift",
    connection_options = {
        "url": "jdbc:redshift://awsgluetest.cjw8y5zdqmhz.us-east-1.redshift.amazonaws.com:5439/dev",
        "user": "awsuser",
        "password": "awsuser",
        "dbtable": "players",
        "preactions": "SELECT CountryCode, TotalUSDPrize, NameFirst, NameLast, AveragePrizePerPlayerPerCountry FROM highest_earning_player",
        "redshiftTmpDir": "s3://awsgluetest/tmp/"
        },
    format = "glueparquet",
    transformation_ctx = "write_dynamic_frame")

After checking the preceding code snippet, you can observe that there is a misplaced format, which you can remove. You can also add the iam_role as an input in connection_options. You can also notice that CodeWhisperer has automatically assumed the Redshift URL to have the same name as the S3 folder that we used. Therefore, you need to change the URL and the S3 temp directory bucket to reflect your own parameters and remove the password parameter. The final code snippet should be similar to the following:

glueContext.write_dynamic_frame.from_options(
frame=dyF,
connection_type="redshift",
connection_options={
"url": "jdbc:redshift://<enter your own>.cjwjn5pzxbhx.us-east-1.redshift.amazonaws.com:5439/<enter your own>",
"user": "<enter your own>",
"dbtable": "<enter your own>",
"driver": "com.amazon.redshift.jdbc42.Driver",
"preactions": "SELECT CountryCode, TotalUSDPrize, NameFirst, NameLast, AveragePrizePerPlayerPerCountry FROM <enter your table>",
"redshiftTmpDir": "<enter your own>",
"aws_iam_role": "<enter your own>",
}
)

The following is the whole code and comment snippets:

%idle_timeout 2880
%glue_version 4.0
%worker_type G.1X
%number_of_workers 3

import sys
from awsglue.transforms import *
from awsglue.utils import getResolvedOptions
from pyspark.context import SparkContext
from awsglue.context import GlueContext
from awsglue.job import Job
from pyspark.sql.functions import current_timestamp
from awsglue.DynamicFrame import DynamicFrame


sc = SparkContext.getOrCreate()
glueContext = GlueContext(sc)
spark = glueContext.spark_session
job = Job(glueContext)


# Read CSV files from S3
dyF = glueContext.create_dynamic_frame.from_options(
    connection_type="s3",
    connection_options={
        "paths": ["s3://<bucket>/<path>/highest_earning_players.csv"],
        "recurse": True,
    },
    format="csv",
    format_options={
        "withHeader": True,
    },
    transformation_ctx="dyF")
    
# Print the schema of the above DynamicFrame
dyF.printSchema()


# Convert the DynamicFrame to spark data frame
# Cast the 'PlayerId' column from string to Integer using WithColumn function
# Convert the spark frame back to DynamicFrame and print the schema
df = dyF.toDF()
df = df.withColumn("PlayerId", df["PlayerId"].cast("integer"))
dyF = DynamicFrame.fromDF(df, glueContext, "dyF")
dyF.printSchema()


# Convert the dynamicFrame to Spark Frame
# Cast the "TotalUSDPrize" column from String to long
# Convert the spark frame back to dynamic frame and print the schema
df = dyF.toDF()
df = df.withColumn("TotalUSDPrize", df["TotalUSDPrize"].cast("long"))
dyF = DynamicFrame.fromDF(df, glueContext, "dyF")
dyF.printSchema()

# Get the count of each country code
country_code_count = df.groupBy("CountryCode").count()
country_code_count.show()

# Convert the DynamicFrame (dyF) to dataframe (df)
# Join the dataframe (df) with country_code_count dataframe with respect to CountryCode column
# Convert the spark frame back to DynamicFrame and print the schema
df = dyF.toDF()
df = df.join(country_code_count, "CountryCode")
df.printSchema()

# Get the sum of all the TotalUSDPrize column per countrycode
# Rename the sum column to be "SumPrizePerCountry"
country_code_sum = df.groupBy("CountryCode").sum("TotalUSDPrize")
country_code_sum = country_code_sum.withColumnRenamed("sum(TotalUSDPrize)", "SumPrizePerCountry")
country_code_sum.show()

# Join the above dataframe with the main dataframe with respect to CountryCode
# Get the average Total prize in USD per player per country and add it to a new column called "AveragePrizePerPlayerPerCountry"
df.join(country_code_sum, "CountryCode")
df = df.withColumn("AveragePrizePerPlayerPerCountry", df["SumPrizePerCountry"] / df["count"])

# sort the above dataframe descendingly according to the highest Average Prize per player country
# Show the top 5 rows
df = df.sort(df["AveragePrizePerPlayerPerCountry"].desc())
df.show(5)

# Convert the data frame to DynamicFrame
# Write the DynamicFrame to S3 in glueparquet format
dyF = DynamicFrame.fromDF(df, glueContext, "dyF")

glueContext.write_dynamic_frame.from_options(
frame=dyF,
connection_type="s3",
connection_options={
"path": "s3://<enter your own>/",
},
format = "parquet",
 format_options={
 "useGlueParquetWriter": True,
    },
)

# Write the resultant DynamicFrame to Redshift 
# using preaction that selects only the following columns: CountryCode, TotalUSDPrize, NameFirst, NameLast, AveragePrizePerPlayerPerCountry
glueContext.write_dynamic_frame.from_options(
frame=dyF,
connection_type="redshift",
connection_options={
"url": "jdbc:redshift://<enter your own>.cjwjn5pzxbhx.us-east-1.redshift.amazonaws.com:5439/<enter your own>",
"user": "<enter your own>",
"dbtable": "<enter your own>",
"driver": "com.amazon.redshift.jdbc42.Driver",
"preactions": "SELECT CountryCode, TotalUSDPrize, NameFirst, NameLast, AveragePrizePerPlayerPerCountry FROM <enter your table>",
"redshiftTmpDir": "<enter your own>",
"aws_iam_role": "<enter your own>",
}
)

Conclusion

In this post, we demonstrated a real-world use case on how AWS Glue Studio notebook integration with CodeWhisperer helps you build data integration jobs faster. You can start using the AWS Glue Studio notebook with CodeWhisperer to accelerate building your data integration jobs.

To learn more about using AWS Glue Studio notebooks and CodeWhisperer, check out the following video.


About the authors

Ishan Gaur works as Sr. Big Data Cloud Engineer ( ETL ) specialized in AWS Glue. He’s passionate about helping customers building out scalable distributed ETL workloads and analytics pipelines on AWS.

Omar Elkharbotly is a Glue SME who works as Big Data Cloud Support Engineer 2 (DIST). He is dedicated to assisting customers in resolving issues related to their ETL workloads and creating scalable data processing and analytics pipelines on AWS.

Simplify operational data processing in data lakes using AWS Glue and Apache Hudi

Post Syndicated from Ravi Itha original https://aws.amazon.com/blogs/big-data/simplify-operational-data-processing-in-data-lakes-using-aws-glue-and-apache-hudi/

The Analytics specialty practice of AWS Professional Services (AWS ProServe) helps customers across the globe with modern data architecture implementations on the AWS Cloud. A modern data architecture is an evolutionary architecture pattern designed to integrate a data lake, data warehouse, and purpose-built stores with a unified governance model. It focuses on defining standards and patterns to integrate data producers and consumers and move data between data lakes and purpose-built data stores securely and efficiently. Out of the many data producer systems that feed data to a data lake, operational databases are most prevalent, where operational data is stored, transformed, analyzed, and finally used to enhance business operations of an organization. With the emergence of open storage formats such as Apache Hudi and its native support from AWS Glue for Apache Spark, many AWS customers have started adding transactional and incremental data processing capabilities to their data lakes.

AWS has invested in native service integration with Apache Hudi and published technical contents to enable you to use Apache Hudi with AWS Glue (for example, refer to Introducing native support for Apache Hudi, Delta Lake, and Apache Iceberg on AWS Glue for Apache Spark, Part 1: Getting Started). In AWS ProServe-led customer engagements, the use cases we work on usually come with technical complexity and scalability requirements. In this post, we discuss a common use case in relation to operational data processing and the solution we built using Apache Hudi and AWS Glue.

Use case overview

AnyCompany Travel and Hospitality wanted to build a data processing framework to seamlessly ingest and process data coming from operational databases (used by reservation and booking systems) in a data lake before applying machine learning (ML) techniques to provide a personalized experience to its users. Due to the sheer volume of direct and indirect sales channels the company has, its booking and promotions data are organized in hundreds of operational databases with thousands of tables. Of those tables, some are larger (such as in terms of record volume) than others, and some are updated more frequently than others. In the data lake, the data to be organized in the following storage zones:

  1. Source-aligned datasets – These have an identical structure to their counterparts at the source
  2. Aggregated datasets – These datasets are created based on one or more source-aligned datasets
  3. Consumer-aligned datasets – These are derived from a combination of source-aligned, aggregated, and reference datasets enriched with relevant business and transformation logics, usually fed as inputs to ML pipelines or any consumer applications

The following are the data ingestion and processing requirements:

  1. Replicate data from operational databases to the data lake, including insert, update, and delete operations.
  2. Keep the source-aligned datasets up to date (typically within the range of 10 minutes to a day) in relation to their counterparts in the operational databases, ensuring analytics pipelines refresh consumer-aligned datasets for downstream ML pipelines in a timely fashion. Moreover, the framework should consume compute resources as optimally as possible per the size of the operational tables.
  3. To minimize DevOps and operational overhead, the company wanted to templatize the source code wherever possible. For example, to create source-aligned datasets in the data lake for 3,000 operational tables, the company didn’t want to deploy 3,000 separate data processing jobs. The smaller the number of jobs and scripts, the better.
  4. The company wanted the ability to continue processing operational data in the secondary Region in the rare event of primary Region failure.

As you can guess, the Apache Hudi framework can solve the first requirement. Therefore, we will put our emphasis on the other requirements. We begin with a Data lake reference architecture followed by an overview of operational data processing framework. By showing you our open-source solution on GitHub, we delve into framework components and walk through their design and implementation aspects. Finally, by testing the framework, we summarize how it meets the aforementioned requirements.

Data lake reference architecture

Let’s begin with a big picture: a data lake solves a variety of analytics and ML use cases dealing with internal and external data producers and consumers. The following diagram represents a generic data lake architecture. To ingest data from operational databases to an Amazon Simple Storage Service (Amazon S3) staging bucket of the data lake, either AWS Database Migration Service (AWS DMS) or any AWS partner solution from AWS Marketplace that has support for change data capture (CDC) can fulfill the requirement. AWS Glue is used to create source-aligned and consumer-aligned datasets and separate AWS Glue jobs to do feature engineering part of ML engineering and operations. Amazon Athena is used for interactive querying and AWS Lake Formation is used for access controls.

Data Lake Reference Architecture

Operational data processing framework

The operational data processing (ODP) framework contains three components: File Manager, File Processor, and Configuration Manager. Each component runs independently to solve a portion of the operational data processing use case. We have open-sourced this framework on GitHub—you can clone the code repo and inspect it while we walk you through the design and implementation of the framework components. The source code is organized in three folders, one for each component, and if you customize and adopt this framework for your use case, we recommend promoting these folders as separate code repositories in your version control system. Consider using the following repository names:

  1. aws-glue-hudi-odp-framework-file-manager
  2. aws-glue-hudi-odp-framework-file-processor
  3. aws-glue-hudi-odp-framework-config-manager

With this modular approach, you can independently deploy the components to your data lake environment by following your preferred CI/CD processes. As illustrated in the preceding diagram, these components are deployed in conjunction with a CDC solution.

Component 1: File Manager

File Manager detects files emitted by a CDC process such as AWS DMS and tracks them in an Amazon DynamoDB table. As shown in the following diagram, it consists of an Amazon EventBridge event rule, an Amazon Simple Queue Service (Amazon SQS) queue, an AWS Lambda function, and a DynamoDB table. The EventBridge rule uses Amazon S3 Event Notifications to detect the arrival of CDC files in the S3 bucket. The event rule forwards the object event notifications to the SQS queue as messages. The File Manager Lambda function consumes those messages, parses the metadata, and inserts the metadata to the DynamoDB table odpf_file_tracker. These records will then be processed by File Processor, which we discuss in the next section.

ODPF Component: File Manager

Component 2: File Processor

File Processor is the workhorse of the ODP framework. It processes files from the S3 staging bucket, creates source-aligned datasets in the raw S3 bucket, and adds or updates metadata for the datasets (AWS Glue tables) in the AWS Glue Data Catalog.

We use the following terminology when discussing File Processor:

  1. Refresh cadence – This represents the data ingestion frequency (for example, 10 minutes). It usually goes with AWS Glue worker type (one of G.1X, G.2X, G.4X, G.8X, G.025X, and so on) and batch size.
  2. Table configuration – This includes the Hudi configuration (primary key, partition key, pre-combined key, and table type (Copy on Write or Merge on Read)), table data storage mode (historical or current snapshot), S3 bucket used to store source-aligned datasets, AWS Glue database name, AWS Glue table name, and refresh cadence.
  3. Batch size – This numeric value is used to split tables into smaller batches and process their respective CDC files in parallel. For example, a configuration of 50 tables with a 10-minute refresh cadence and a batch size of 5 results in a total of 10 AWS Glue job runs, each processing CDC files for 5 tables.
  4. Table data storage mode – There are two options:
    • Historical – This table in the data lake stores historical updates to records (always append).
    • Current snapshot – This table in the data lake stores latest versioned records (upserts) with the ability to use Hudi time travel for historical updates.
  5. File processing state machine – It processes CDC files that belong to tables that share a common refresh cadence.
  6. EventBridge rule association with the file processing state machine – We use a dedicated EventBridge rule for each refresh cadence with the file processing state machine as target.
  7. File processing AWS Glue job – This is a configuration-driven AWS Glue extract, transform, and load (ETL) job that processes CDC files for one or more tables.

File Processor is implemented as a state machine using AWS Step Functions. Let’s use an example to understand this. The following diagram illustrates running File Processor state machine with a configuration that includes 18 operational tables, a refresh cadence of 10 minutes, a batch size of 5, and an AWS Glue worker type of G.1X.

ODP framework component: File Processor

The workflow includes the following steps:

  1. The EventBridge rule triggers the File Processor state machine every 10 minutes.
  2. Being the first state in the state machine, the Batch Manager Lambda function reads configurations from DynamoDB tables.
  3. The Lambda function creates four batches: three of them will be mapped to five operational tables each, and the fourth one is mapped to three operational tables. Then it feeds the batches to the Step Functions Map state.
  4. For each item in the Map state, the File Processor Trigger Lambda function will be invoked, which in turn runs the File Processor AWS Glue job.
  5. Each AWS Glue job performs the following actions:
    • Checks the status of an operational table and acquires a lock when it is not processed by any other job. The odpf_file_processing_tracker DynamoDB table is used for this purpose. When a lock is acquired, it inserts a record in the DynamoDB table with the status updating_table for the first time; otherwise, it updates the record.
    • Processes the CDC files for the given operational table from the S3 staging bucket and creates a source-aligned dataset in the S3 raw bucket. It also updates technical metadata in the AWS Glue Data Catalog.
    • Updates the status of the operational table to completed in the odpf_file_processing_tracker table. In case of processing errors, it updates the status to refresh_error and logs the stack trace.
    • It also inserts this record into the odpf_file_processing_tracker_history DynamoDB table along with additional details such as insert, update, and delete row counts.
    • Moves the records that belong to successfully processed CDC files from odpf_file_tracker to the odpf_file_tracker_history table with file_ingestion_status set to raw_file_processed.
    • Moves to the next operational table in the given batch.
    • Note: a failure to process CDC files for one of the operational tables of a given batch does not impact the processing of other operational tables.

Component 3: Configuration Manager

Configuration Manager is used to insert configuration details to the odpf_batch_config and odpf_raw_table_config tables. To keep this post concise, we provide two architecture patterns in the code repo and leave the implementation details to you.

Solution overview

Let’s test the ODP framework by replicating data from 18 operational tables to a data lake and creating source-aligned datasets with 10-minute refresh cadence. We use Amazon Relational Database Service (Amazon RDS) for MySQL to set up an operational database with 18 tables, upload the New York City Taxi – Yellow Trip Data dataset, set up AWS DMS to replicate data to Amazon S3, process the files using the framework, and finally validate the data using Amazon Athena.

Create S3 buckets

For instructions on creating an S3 bucket, refer to Creating a bucket. For this post, we create the following buckets:

  1. odpf-demo-staging-EXAMPLE-BUCKET – You will use this to migrate operational data using AWS DMS
  2. odpf-demo-raw-EXAMPLE-BUCKET – You will use this to store source-aligned datasets
  3. odpf-demo-code-artifacts-EXAMPLE-BUCKET – You will use this to store code artifacts

Deploy File Manager and File Processor

Deploy File Manager and File Processor by following instructions from this README and this README, respectively.

Set up Amazon RDS for MySQL

Complete the following steps to set up Amazon RDS for MySQL as the operational data source:

  1. Provision Amazon RDS for MySQL. For instructions, refer to Create and Connect to a MySQL Database with Amazon RDS.
  2. Connect to the database instance using MySQL Workbench or DBeaver.
  3. Create a database (schema) by running the SQL command CREATE DATABASE taxi_trips;.
  4. Create 18 tables by running the SQL commands in the ops_table_sample_ddl.sql script.

Populate data to the operational data source

Complete the following steps to populate data to the operational data source:

  1. To download the New York City Taxi – Yellow Trip Data dataset for January 2021 (Parquet file), navigate to NYC TLC Trip Record Data, expand 2021, and choose Yellow Taxi Trip records. A file called yellow_tripdata_2021-01.parquet will be downloaded to your computer.
  2. On the Amazon S3 console, open the bucket odpf-demo-staging-EXAMPLE-BUCKET and create a folder called nyc_yellow_trip_data.
  3. Upload the yellow_tripdata_2021-01.parquet file to the folder.
  4. Navigate to the bucket odpf-demo-code-artifacts-EXAMPLE-BUCKET and create a folder called glue_scripts.
  5. Download the file load_nyc_taxi_data_to_rds_mysql.py from the GitHub repo and upload it to the folder.
  6. Create an AWS Identity and Access Management (IAM) policy called load_nyc_taxi_data_to_rds_mysql_s3_policy. For instructions, refer to Creating policies using the JSON editor. Use the odpf_setup_test_data_glue_job_s3_policy.json policy definition.
  7. Create an IAM role called load_nyc_taxi_data_to_rds_mysql_glue_role. Attach the policy created in the previous step.
  8. On the AWS Glue console, create a connection for Amazon RDS for MySQL. For instructions, refer to Adding a JDBC connection using your own JDBC drivers and Setting up a VPC to connect to Amazon RDS data stores over JDBC for AWS Glue. Name the connection as odpf_demo_rds_connection.
  9. In the navigation pane of the AWS Glue console, choose Glue ETL jobs, Python Shell script editor, and Upload and edit an existing script under Options.
  10. Choose the file load_nyc_taxi_data_to_rds_mysql.py and choose Create.
  11. Complete the following steps to create your job:
    • Provide a name for the job, such as load_nyc_taxi_data_to_rds_mysql.
    • For IAM role, choose load_nyc_taxi_data_to_rds_mysql_glue_role.
    • Set Data processing units to 1/16 DPU.
    • Under Advanced properties, Connections, select the connection you created earlier.
    • Under Job parameters, add the following parameters:
      • input_sample_data_path = s3://odpf-demo-staging-EXAMPLE-BUCKET/nyc_yellow_trip_data/yellow_tripdata_2021-01.parquet
      • schema_name = taxi_trips
      • table_name = table_1
      • rds_connection_name = odpf_demo_rds_connection
    • Choose Save.
  12. On the Actions menu, run the job.
  13. Go back to your MySQL Workbench or DBeaver and validate the record count by running the SQL command select count(1) row_count from taxi_trips.table_1. You will get an output of 1369769.
  14. Populate the remaining 17 tables by running the SQL commands from the populate_17_ops_tables_rds_mysql.sql script.
  15. Get the row count from the 18 tables by running the SQL commands from the ops_data_validation_query_rds_mysql.sql script. The following screenshot shows the output.
    Record volumes (for 18 Tables) in Operational Database

Configure DynamoDB tables

Complete the following steps to configure the DynamoDB tables:

  1. Download file load_ops_table_configs_to_ddb.py from the GitHub repo and upload it to the folder glue_scripts in the S3 bucket odpf-demo-code-artifacts-EXAMPLE-BUCKET.
  2. Create an IAM policy called load_ops_table_configs_to_ddb_ddb_policy. Use the odpf_setup_test_data_glue_job_ddb_policy.json policy definition.
  3. Create an IAM role called load_ops_table_configs_to_ddb_glue_role. Attach the policy created in the previous step.
  4. On the AWS Glue console, choose Glue ETL jobs, Python Shell script editor, and Upload and edit an existing script under Options.
  5. Choose the file load_ops_table_configs_to_ddb.py and choose Create.
  6. Complete the following steps to create a job:
    • Provide a name, such as load_ops_table_configs_to_ddb.
    • For IAM role, choose load_ops_table_configs_to_ddb_glue_role.
    • Set Data processing units to 1/16 DPU.
    • Under Job parameters, add the following parameters
      • batch_config_ddb_table_name = odpf_batch_config
      • raw_table_config_ddb_table_name = odpf_demo_taxi_trips_raw
      • aws_region = e.g., us-west-1
    • Choose Save.
  7. On the Actions menu, run the job.
  8. On the DynamoDB console, get the item count from the tables. You will find 1 item in the odpf_batch_config table and 18 items in the odpf_demo_taxi_trips_raw table.

Set up a database in AWS Glue

Complete the following steps to create a database:

  1. On the AWS Glue console, under Data catalog in the navigation pane, choose Databases.
  2. Create a database called odpf_demo_taxi_trips_raw.

Set up AWS DMS for CDC

Complete the following steps to set up AWS DMS for CDC:

  1. Create an AWS DMS replication instance. For Instance class, choose dms.t3.medium.
  2. Create a source endpoint for Amazon RDS for MySQL.
  3. Create target endpoint for Amazon S3. To configure the S3 endpoint settings, use the JSON definition from dms_s3_endpoint_setting.json.
  4. Create an AWS DMS task.
    • Use the source and target endpoints created in the previous steps.
    • To create AWS DMS task mapping rules, use the JSON definition from dms_task_mapping_rules.json.
    • Under Migration task startup configuration, select Automatically on create.
  5. When the AWS DMS task starts running, you will see a task summary similar to the following screenshot.
    DMS Task Summary
  6. In the Table statistics section, you will see an output similar to the following screenshot. Here, the Full load rows and Total rows columns are important metrics whose counts should match with the record volumes of the 18 tables in the operational data source.
    DMS Task Statistics
  7. As a result of successful full load completion, you will find Parquet files in the S3 staging bucket—one Parquet file per table in a dedicated folder, similar to the following screenshot. Similarly, you will find 17 such folders in the bucket.
    DMS Output in S3 Staging Bucket for Table 1

File Manager output

The File Manager Lambda function consumes messages from the SQS queue, extracts metadata for the CDC files, and inserts one item per file to the odpf_file_tracker DynamoDB table. When you check the items, you will find 18 items with file_ingestion_status set to raw_file_landed, as shown in the following screenshot.

CDC Files in File Tracker DynamoDB Table

File Processor output

  1. On the subsequent tenth minute (since the activation of the EventBridge rule), the event rule triggers the File Processor state machine. On the Step Functions console, you will notice that the state machine is invoked, as shown in the following screenshot.
    File Processor State Machine Run Summary
  2. As shown in the following screenshot, the Batch Generator Lambda function creates four batches and constructs a Map state for parallel running of the File Processor Trigger Lambda function.
    File Processor State Machine Run Details
  3. Then, the File Processor Trigger Lambda function runs the File Processor Glue Job, as shown in the following screenshot.
    File Processor Glue Job Parallel Runs
  4. Then, you will notice that the File Processor Glue Job runs create source-aligned datasets in Hudi format in the S3 raw bucket. For Table 1, you will see an output similar to the following screenshot. There will be 17 such folders in the S3 raw bucket.
    Data in S3 raw bucket
  5. Finally, in AWS Glue Data Catalog, you will notice 18 tables created in the odpf_demo_taxi_trips_raw database, similar to the following screenshot.
    Tables in Glue Database

Data validation

Complete the following steps to validate the data:

  1. On the Amazon Athena console, open the query editor, and select a workgroup or create a new workgroup.
  2. Choose AwsDataCatalog for Data source and odpf_demo_taxi_trips_raw for Database.
  3. Run the raw_data_validation_query_athena.sql SQL query. You will get an output similar to the following screenshot.
    Raw Data Validation via Amazon Athena

Validation summary: The counts in Amazon Athena match with the counts of the operational tables and it proves that the ODP framework has processed all the files and records successfully. This concludes the demo. To test additional scenarios, refer to Extended Testing in the code repo.

Outcomes

Let’s review how the ODP framework addressed the aforementioned requirements.

  1. As discussed earlier in this post, by logically grouping tables by refresh cadence and associating them to EventBridge rules, we ensured that the source-aligned tables are refreshed by the File Processor AWS Glue jobs. With the AWS Glue worker type configuration setting, we selected the appropriate compute resources while running the AWS Glue jobs (the instances of the AWS Glue job).
  2. By applying table-specific configurations (from odpf_batch_config and odpf_raw_table_config) dynamically, we were able to use one AWS Glue job to process CDC files for 18 tables.
  3. You can use this framework to support a variety of data migration use cases that require quicker data migration from on-premises storage systems to data lakes or analytics platforms on AWS. You can reuse File Manager as is and customize File Processor to work with other storage frameworks such as Apache Iceberg, Delta Lake, and purpose-built data stores such as Amazon Aurora and Amazon Redshift.
  4. To understand how the ODP framework met the company’s disaster recovery (DR) design criterion, we first need to understand the DR architecture strategy at a high level. The DR architecture strategy has the following aspects:
    • One AWS account and two AWS Regions are used for primary and secondary environments.
    • The data lake infrastructure in the secondary Region is kept in sync with the one in the primary Region.
    • Data is stored in S3 buckets, metadata data is stored in the AWS Glue Data Catalog, and access controls in Lake Formation are replicated from the primary to secondary Region.
    • The data lake source and target systems have their respective DR environments.
    • CI/CD tooling (version control, CI server, and so on) are to be made highly available.
    • The DevOps team needs to be able to deploy CI/CD pipelines of analytics frameworks (such as this ODP framework) to either the primary or secondary Region.
    • As you can imagine, disaster recovery on AWS is a vast subject, so we keep our discussion to the last design aspect.

By designing the ODP framework with three components and externalizing operational table configurations to DynamoDB global tables, the company was able to deploy the framework components to the secondary Region (in the rare event of a single-Region failure) and continue to process CDC files from the point it last processed in the primary Region. Because the CDC file tracking and processing audit data is replicated to the DynamoDB replica tables in the secondary Region, the File Manager microservice and File Processor can seamlessly run.

Clean up

When you’re finished testing this framework, you can delete the provisioned AWS resources to avoid any further charges.

Conclusion

In this post, we took a real-world operational data processing use case and presented you the framework we developed at AWS ProServe. We hope this post and the operational data processing framework using AWS Glue and Apache Hudi will expedite your journey in integrating operational databases into your modern data platforms built on AWS.


About the authors

Ravi-IthaRavi Itha is a Principal Consultant at AWS Professional Services with specialization in data and analytics and generalist background in application development. Ravi helps customers with enterprise data strategy initiatives across insurance, airlines, pharmaceutical, and financial services industries. In his 6-year tenure at Amazon, Ravi has helped the AWS builder community by publishing approximately 15 open-source solutions (accessible via GitHub handle), four blogs, and reference architectures. Outside of work, he is passionate about reading India Knowledge Systems and practicing Yoga Asanas.

srinivas-kandiSrinivas Kandi is a Data Architect at AWS Professional Services. He leads customer engagements related to data lakes, analytics, and data warehouse modernizations. He enjoys reading history and civilizations.

Securely process near-real-time data from Amazon MSK Serverless using an AWS Glue streaming ETL job with IAM authentication

Post Syndicated from Shubham Purwar original https://aws.amazon.com/blogs/big-data/securely-process-near-real-time-data-from-amazon-msk-serverless-using-an-aws-glue-streaming-etl-job-with-iam-authentication/

Streaming data has become an indispensable resource for organizations worldwide because it offers real-time insights that are crucial for data analytics. The escalating velocity and magnitude of collected data has created a demand for real-time analytics. This data originates from diverse sources, including social media, sensors, logs, and clickstreams, among others. With streaming data, organizations gain a competitive edge by promptly responding to real-time events and making well-informed decisions.

In streaming applications, a prevalent approach involves ingesting data through Apache Kafka and processing it with Apache Spark Structured Streaming. However, managing, integrating, and authenticating the processing framework (Apache Spark Structured Streaming) with the ingesting framework (Kafka) poses significant challenges, necessitating a managed and serverless framework. For example, integrating and authenticating a client like Spark streaming with Kafka brokers and zookeepers using a manual TLS method requires certificate and keystore management, which is not an easy task and requires a good knowledge of TLS setup.

To address these issues effectively, we propose using Amazon Managed Streaming for Apache Kafka (Amazon MSK), a fully managed Apache Kafka service that offers a seamless way to ingest and process streaming data. In this post, we use Amazon MSK Serverless, a cluster type for Amazon MSK that makes it possible for you to run Apache Kafka without having to manage and scale cluster capacity. To further enhance security and streamline authentication and authorization processes, MSK Serverless enables you to handle both authentication and authorization using AWS Identity and Access Management (IAM) in your cluster. This integration eliminates the need for separate mechanisms for authentication and authorization, simplifying and strengthening data protection. For example, when a client tries to write to your cluster, MSK Serverless uses IAM to check whether that client is an authenticated identity and also whether it is authorized to produce to your cluster.

To process data effectively, we use AWS Glue, a serverless data integration service that uses the Spark Structured Streaming framework and enables near-real-time data processing. An AWS Glue streaming job can handle large volumes of incoming data from MSK Serverless with IAM authentication. This powerful combination ensures that data is processed securely and swiftly.

The post demonstrates how to build an end-to-end implementation to process data from MSK Serverless using an AWS Glue streaming extract, transform, and load (ETL) job with IAM authentication to connect MSK Serverless from the AWS Glue job and query the data using Amazon Athena.

Solution overview

The following diagram illustrates the architecture that you implement in this post.

The workflow consists of the following steps:

  1. Create an MSK Serverless cluster with IAM authentication and an EC2 Kafka client as the producer to ingest sample data into a Kafka topic. For this post, we use the kafka-console-producer.sh Kafka console producer client.
  2. Set up an AWS Glue streaming ETL job to process the incoming data. This job extracts data from the Kafka topic, loads it into Amazon Simple Storage Service (Amazon S3), and creates a table in the AWS Glue Data Catalog. By continuously consuming data from the Kafka topic, the ETL job ensures it remains synchronized with the latest streaming data. Moreover, the job incorporates the checkpointing functionality, which tracks the processed records, enabling it to resume processing seamlessly from the point of interruption in the event of a job run failure.
  3. Following the data processing, the streaming job stores data in Amazon S3 and generates a Data Catalog table. This table acts as a metadata layer for the data. To interact with the data stored in Amazon S3, you can use Athena, a serverless and interactive query service. Athena enables the run of SQL-like queries on the data, facilitating seamless exploration and analysis.

For this post, we create the solution resources in the us-east-1 Region using AWS CloudFormation templates. In the following sections, we show you how to configure your resources and implement the solution.

Configure resources with AWS CloudFormation

In this post, you use the following two CloudFormation templates. The advantage of using two different templates is that you can decouple the resource creation of ingestion and processing part according to your use case and if you have requirements to create specific process resources only.

  • vpc-mskserverless-client.yaml – This template sets up data the ingestion service resources such as a VPC, MSK Serverless cluster, and S3 bucket
  • gluejob-setup.yaml – This template sets up the data processing resources such as the AWS Glue table, database, connection, and streaming job

Create data ingestion resources

The vpc-mskserverless-client.yaml stack creates a VPC, private and public subnets, security groups, S3 VPC Endpoint, MSK Serverless cluster, EC2 instance with Kafka client, and S3 bucket. To create the solution resources for data ingestion, complete the following steps:

  1. Launch the stack vpc-mskserverless-client using the CloudFormation template:
  2. Provide the parameter values as listed in the following table.
Parameters Description Sample Value
EnvironmentName Environment name that is prefixed to resource names .
PrivateSubnet1CIDR IP range (CIDR notation) for the private subnet in the first Availability Zone .
PrivateSubnet2CIDR IP range (CIDR notation) for the private subnet in the second Availability Zone .
PublicSubnet1CIDR IP range (CIDR notation) for the public subnet in the first Availability Zone .
PublicSubnet2CIDR IP range (CIDR notation) for the public subnet in the second Availability Zone .
VpcCIDR IP range (CIDR notation) for this VPC .
InstanceType Instance type for the EC2 instance t2.micro
LatestAmiId AMI used for the EC2 instance /aws/service/ami-amazon-linux- latest/amzn2-ami-hvm-x86_64-gp2
  1. When the stack creation is complete, retrieve the EC2 instance PublicDNS from the vpc-mskserverless-client stack’s Outputs tab.

The stack creation process can take around 15 minutes to complete.

  1. On the Amazon EC2 console, access the EC2 instance that you created using the CloudFormation template.
  2. Choose the EC2 instance whose InstanceId is shown on the stack’s Outputs tab.

Next, you log in to the EC2 instance using Session Manager, a capability of AWS Systems Manager.

  1. On the Amazon EC2 console, select the instanceid and on the Session Manager tab, choose Connect.


After you log in to the EC2 instance, you create a Kafka topic in the MSK Serverless cluster from the EC2 instance.

  1. In the following export command, provide the MSKBootstrapServers value from the vpc-mskserverless- client stack output for your endpoint:
    $ sudo su – ec2-user
    $ BS=<your-msk-serverless-endpoint (e.g.) boot-xxxxxx.yy.kafka-serverless.us-east-1.a>

  2. Run the following command on the EC2 instance to create a topic called msk-serverless-blog. The Kafka client is already installed in the ec2-user home directory (/home/ec2-user).
    $ /home/ec2-user/kafka_2.12-2.8.1/bin/kafka-topics.sh \
    --bootstrap-server $BS \
    --command-config /home/ec2-user/kafka_2.12-2.8.1/bin/client.properties \
    --create –topic msk-serverless-blog \
    --partitions 1
    
    Created topic msk-serverless-blog

After you confirm the topic creation, you can push the data to the MSK Serverless.

  1. Run the following command on the EC2 instance to create a console producer to produce records to the Kafka topic. (For source data, we use nycflights.csv downloaded at the ec2-user home directory /home/ec2-user.)
$ /home/ec2-user/kafka_2.12-2.8.1/bin/kafka-console-producer.sh \
--broker-list $BS \
--producer.config /home/ec2-user/kafka_2.12-2.8.1/bin/client.properties \
--topic msk-serverless-blog < nycflights.csv

Next, you set up the data processing service resources, specifically AWS Glue components like the database, table, and streaming job to process the data.

Create data processing resources

The gluejob-setup.yaml CloudFormation template creates a database, table, AWS Glue connection, and AWS Glue streaming job. Retrieve the values for VpcId, GluePrivateSubnet, GlueconnectionSubnetAZ, SecurityGroup, S3BucketForOutput, and S3BucketForGlueScript from the vpc-mskserverless-client stack’s Outputs tab to use in this template. Complete the following steps:

  1. Launch the stack gluejob-setup:

  1. Provide parameter values as listed in the following table.
Parameters Description Sample value
EnvironmentName Environment name that is prefixed to resource names. Gluejob-setup
VpcId ID of the VPC for security group. Use the VPC ID created with the first stack. Refer to the first stack’s output.
GluePrivateSubnet Private subnet used for creating the AWS Glue connection. Refer to the first stack’s output.
SecurityGroupForGlueConnection Security group used by the AWS Glue connection. Refer to the first stack’s output.
GlueconnectionSubnetAZ Availability Zone for the first private subnet used for the AWS Glue connection. .
GlueDataBaseName Name of the AWS Glue Data Catalog database. glue_kafka_blog_db
GlueTableName Name of the AWS Glue Data Catalog table. blog_kafka_tbl
S3BucketNameForScript Bucket Name for Glue ETL script. Use the S3 bucket name from the previous stack. For example, aws-gluescript-${AWS::AccountId}-${AWS::Region}-${EnvironmentName}
GlueWorkerType Worker type for AWS Glue job. For example, G.1X. G.1X
NumberOfWorkers Number of workers in the AWS Glue job. 3
S3BucketNameForOutput Bucket name for writing data from the AWS Glue job. aws-glueoutput-${AWS::AccountId}-${AWS::Region}-${EnvironmentName}
TopicName MSK topic name that needs to be processed. msk-serverless-blog
MSKBootstrapServers Kafka bootstrap server. boot-30vvr5lg.c1.kafka-serverless.us- east-1.amazonaws.com:9098

The stack creation process can take around 1–2 minutes to complete. You can check the Outputs tab for the stack after the stack is created.

In the gluejob-setup stack, we created a Kafka type AWS Glue connection, which consists of broker information like the MSK bootstrap server, topic name, and VPC in which the MSK Serverless cluster is created. Most importantly, it specifies the IAM authentication option, which helps AWS Glue authenticate and authorize using IAM authentication while consuming the data from the MSK topic. For further clarity, you can examine the AWS Glue connection and the associated AWS Glue table generated through AWS CloudFormation.

After successfully creating the CloudFormation stack, you can now proceed with processing data using the AWS Glue streaming job with IAM authentication.

Run the AWS Glue streaming job

To process the data from the MSK topic using the AWS Glue streaming job that you set up in the previous section, complete the following steps:

  1. On the CloudFormation console, choose the stack gluejob-setup.
  2. On the Outputs tab, retrieve the name of the AWS Glue streaming job from the GlueJobName row. In the following screenshot, the name is GlueStreamingJob-glue-streaming-job.

  1. On the AWS Glue console, choose ETL jobs in the navigation pane.
  2. Search for the AWS Glue streaming job named GlueStreamingJob-glue-streaming-job.
  3. Choose the job name to open its details page.
  4. Choose Run to start the job.
  5. On the Runs tab, confirm if the job ran without failure.

  1. Retrieve the OutputBucketName from the gluejob-setup template outputs.
  2. On the Amazon S3 console, navigate to the S3 bucket to verify the data.

  1. On the AWS Glue console, choose the AWS Glue streaming job you ran, then choose Stop job run.

Because this is a streaming job, it will continue to run indefinitely until manually stopped. After you verify the data is present in the S3 output bucket, you can stop the job to save cost.

Validate the data in Athena

After the AWS Glue streaming job has successfully created the table for the processed data in the Data Catalog, follow these steps to validate the data using Athena:

  1. On the Athena console, navigate to the query editor.
  2. Choose the Data Catalog as the data source.
  3. Choose the database and table that the AWS Glue streaming job created.
  4. To validate the data, run the following query to find the flight number, origin, and destination that covered the highest distance in a year:
SELECT distinct(flight),distance,origin,dest,year from "glue_kafka_blog_db"."output" where distance= (select MAX(distance) from "glue_kafka_blog_db"."output")

The following screenshot shows the output of our example query.

Clean up

To clean up your resources, complete the following steps:

  1. Delete the CloudFormation stack gluejob-setup.
  2. Delete the CloudFormation stack vpc-mskserverless-client.

Conclusion

In this post, we demonstrated a use case for building a serverless ETL pipeline for streaming with IAM authentication, which allows you to focus on the outcomes of your analytics. You can also modify the AWS Glue streaming ETL code in this post with transformations and mappings to ensure that only valid data gets loaded to Amazon S3. This solution enables you to harness the prowess of AWS Glue streaming, seamlessly integrated with MSK Serverless through the IAM authentication method. It’s time to act and revolutionize your streaming processes.

Appendix

This section provides more information about how to create the AWS Glue connection on the AWS Glue console, which helps establish the connection to the MSK Serverless cluster and allow the AWS Glue streaming job to authenticate and authorize using IAM authentication while consuming the data from the MSK topic.

  1. On the AWS Glue console, in the navigation pane, under Data catalog, choose Connections.
  2. Choose Create connection.
  3. For Connection name, enter a unique name for your connection.
  4. For Connection type, choose Kafka.
  5. For Connection access, select Amazon managed streaming for Apache Kafka (MSK).
  6. For Kafka bootstrap server URLs, enter a comma-separated list of bootstrap server URLs. Include the port number. For example, boot-xxxxxxxx.c2.kafka-serverless.us-east- 1.amazonaws.com:9098.

  1. For Authentication, choose IAM Authentication.
  2. Select Require SSL connection.
  3. For VPC, choose the VPC that contains your data source.
  4. For Subnet, choose the private subnet within your VPC.
  5. For Security groups, choose a security group to allow access to the data store in your VPC subnet.

Security groups are associated to the ENI attached to your subnet. You must choose at least one security group with a self-referencing inbound rule for all TCP ports.

  1. Choose Save changes.

After you create the AWS Glue connection, you can use the AWS Glue streaming job to consume data from the MSK topic using IAM authentication.


About the authors

Shubham Purwar is a Cloud Engineer (ETL) at AWS Bengaluru specialized in AWS Glue and Amazon Athena. He is passionate about helping customers solve issues related to their ETL workload and implement scalable data processing and analytics pipelines on AWS. In his free time, Shubham loves to spend time with his family and travel around the world.

Nitin Kumar is a Cloud Engineer (ETL) at AWS with a specialization in AWS Glue. He is dedicated to assisting customers in resolving issues related to their ETL workloads and creating scalable data processing and analytics pipelines on AWS.

Extracting key insights from Amazon S3 access logs with AWS Glue for Ray

Post Syndicated from Cristiane de Melo original https://aws.amazon.com/blogs/big-data/extracting-key-insights-from-amazon-s3-access-logs-with-aws-glue-for-ray/

Customers of all sizes and industries use Amazon Simple Storage Service (Amazon S3) to store data globally for a variety of use cases. Customers want to know how their data is being accessed, when it is being accessed, and who is accessing it. With exponential growth in data volume, centralized monitoring becomes challenging. It is also crucial to audit granular data access for security and compliance needs.

This blog post presents an architecture solution that allows customers to extract key insights from Amazon S3 access logs at scale. We will partition and format the server access logs with Amazon Web Services (AWS) Glue, a serverless data integration service, to generate a catalog for access logs and create dashboards for insights.

Amazon S3 access logs

Amazon S3 access logs monitor and log Amazon S3 API requests made to your buckets. These logs can track activity, such as data access patterns, lifecycle and management activity, and security events. For example, server access logs could answer a financial organization’s question about how many requests are made and who is making what type of requests. Amazon S3 access logs provide object-level visibility and incur no additional cost besides storage of logs. They store attributes such as object size, total time, turn-around time, and HTTP referer for log records. For more details on the server access log file format, delivery, and schema, see Logging requests using server access logging and Amazon S3 server access log format.

Key considerations when using Amazon S3 access logs:

  1. Amazon S3 delivers server access log records on a best-effort basis. Amazon S3 does not guarantee the completeness and timeliness of them, although delivery of most log records is within a few hours of the recorded time.
  2. A log file delivered at a specific time can contain records written at any point before that time. A log file may not capture all log records for requests made up to that point.
  3. Amazon S3 access logs provide small unpartitioned files stored as space-separated, newline-delimited records. They can be queried using Amazon Athena, but this solution poses high latency and increased query cost for customers generating logs in petabyte scale. Top 10 Performance Tuning Tips for Amazon Athena include converting the data to a columnar format like Apache Parquet and partitioning the data in Amazon S3.
  4. Amazon S3 listing can become a bottleneck even if you use a prefix, particularly with billions of objects. Amazon S3 uses the following object key format for log files:
    TargetPrefixYYYY-mm-DD-HH-MM-SS-UniqueString/

TargetPrefix is optional and makes it simpler for you to locate the log objects. We use the YYYY-mm-DD-HH format to generate a manifest of logs matching a specific prefix.

Architecture overview

The following diagram illustrates the solution architecture. The solution uses AWS Serverless Analytics services such as AWS Glue to optimize data layout by partitioning and formatting the server access logs to be consumed by other services. We catalog the partitioned server access logs from multiple Regions. Using Amazon Athena and Amazon QuickSight, we query and create dashboards for insights.

Architecture Diagram

As a first step, enable server access logging on S3 buckets. Amazon S3 recommends delivering logs to a separate bucket to avoid an infinite loop of logs. Both the user data and logs buckets must be in the same AWS Region and owned by the same account.

AWS Glue for Ray, a data integration engine option on AWS Glue, is now generally available. It combines AWS Glue’s serverless data integration with Ray (ray.io), a popular new open-source compute framework that helps you scale Python workloads. The Glue for Ray job will partition and store the logs in parquet format. The Ray script also contains checkpointing logic to avoid re-listing, duplicate processing, and missing logs. The job stores the partitioned logs in a separate bucket for simplicity and scalability.

The AWS Glue Data Catalog is a metastore of the location, schema, and runtime metrics of your data. AWS Glue Data Catalog stores information as metadata tables, where each table specifies a single data store. The AWS Glue crawler writes metadata to the Data Catalog by classifying the data to determine the format, schema, and associated properties of the data. Running the crawler on a schedule updates AWS Glue Data Catalog with new partitions and metadata.

Amazon Athena provides a simplified, flexible way to analyze petabytes of data where it lives. We can query partitioned logs directly in Amazon S3 using standard SQL. Athena uses AWS Glue Data Catalog metadata like databases, tables, partitions, and columns under the hood. AWS Glue Data Catalog is a cross-Region metadata store that helps Athena query logs across multiple Regions and provide consolidated results.

Amazon QuickSight enables organizations to build visualizations, perform case-by-case analysis, and quickly get business insights from their data anytime, on any device. You can use other business intelligence (BI) tools that integrate with Athena to build dashboards and share or publish them to provide timely insights.

Technical architecture implementation

This section explains how to process Amazon S3 access logs and visualize Amazon S3 metrics with QuickSight.

Before you begin

There are a few prerequisites before you get started:

  1. Create an IAM role to use with AWS Glue. For more information, see Create an IAM Role for AWS Glue in the AWS Glue documentation.
  2. Ensure that you have access to Athena from your account.
  3. Enable access logging on an S3 bucket. For more information, see How to Enable Server Access Logging in the Amazon S3 documentation.

Run AWS Glue for Ray job

The following screenshots guide you through creating a Ray job on Glue console. Create an ETL job with Ray engine with the sample Ray script provided. In the Job details tab, select an IAM role.

Create AWS Glue job

AWS Glue job details

Pass required arguments and any optional arguments with `--{arg}` in the job parameters.

AWS Glue job parameters

Save and run the job. In the Runs tab, you can select the current execution and view the logs using the Log group name and Id (Job Run Id). You can also graph job run metrics from the CloudWatch metrics console.

CloudWatch metrics console

Alternatively, you can select a frequency to schedule the job run.

AWS Glue job run schedule

Note: Schedule frequency depends on your data latency requirement.

On a successful run, the Ray job writes partitioned log files to the output Amazon S3 location. Now we run an AWS Glue crawler to catalog the partitioned files.

Create an AWS Glue crawler with the partitioned logs bucket as the data source and schedule it to capture the new partitions. Alternatively, you can configure the crawler to run based on Amazon S3 events. Using Amazon S3 events improves the re-crawl time to identify the changes between two crawls by listing all the files from a partition instead of listing the full S3 bucket.

AWS Glue Crawler

You can view the AWS Glue Data Catalog table via the Athena console and run queries using standard SQL. The Athena console displays the Run time and Data scanned metrics. In the following screenshots below, you will see how partitioning improves performance by reducing the amount of data scanned.

There are significant wins when we partition and format server access logs as parquet. Compared to the unpartitioned raw logs, the Athena queries 1/scanned 99.9 percent less data, and 2/ran 92 percent faster. This is evident from the following Athena SQL queries, which are similar but on unpartitioned and partitioned server access logs respectively.

SELECT “operation”, “requestdatetime”
FROM “s3_access_logs_db”.”unpartitioned_sal”
GROUP BY “requestdatetime”, “operation”

Amazon Athena query

Note: You can create a table schema on raw server access logs by following the directions at How do I analyze my Amazon S3 server access logs using Athena?

SELECT “operation”, “requestdate”, “requesthour” 
FROM “s3_access_logs_db”.”partitioned_sal” 
GROUP BY “requestdate”, “requesthour”, “operation”

Amazon Athena query

You can run queries on Athena or build dashboards with a BI tool that integrates with Athena. We built the following sample dashboard in Amazon QuickSight to provide insights from the Amazon S3 access logs. For additional information, see Visualize with QuickSight using Athena.

Amazon QuickSight dashboard

Clean up

Delete all the resources to avoid any unintended costs.

  1. Disable the access log on the source bucket.
  2. Disable the scheduled AWS Glue job run.
  3. Delete the AWS Glue Data Catalog tables and QuickSight dashboards.

Why we considered AWS Glue for Ray

AWS Glue for Ray offers scalable Python-native distributed compute framework combined with AWS Glue’s serverless data integration. The primary reason for using the Ray engine in this solution is its flexibility with task distribution. With the Amazon S3 access logs, the largest challenge in processing them at scale is the object count rather than the data volume. This is because they are stored in a single, flat prefix that can contain hundreds of millions of objects for larger customers. In this unusual edge case, the Amazon S3 listing in Spark takes most of the job’s runtime. The object count is also large enough that most Spark drivers will run out of memory during listing.

In our test bed with 470 GB (1,544,692 objects) of access logs, large Spark drivers using AWS Glue’s G.8X worker type (32 vCPU, 128 GB memory, and 512 GB disk) ran out of memory. Using Ray tasks to distribute Amazon S3 listing dramatically reduced the time to list the objects. It also kept the list in Ray’s distributed object store preventing out-of-memory failures when scaling. The distributed lister combined with Ray data and map_batches to apply a pandas function against each block of data resulted in a highly parallel and performant execution across all stages of the process. With Ray engine, we successfully processed the logs in ~9 minutes. Using Ray reduces the server access logs processing cost, adding to the reduced Athena query cost.

Ray job run details:

Ray job logs

Ray job run details

Please feel free to download the script and test this solution in your development environment. You can add additional transformations in Ray to better prepare your data for analysis.

Conclusion

In this blog post, we detailed a solution to visualize and monitor Amazon S3 access logs at scale using Athena and QuickSight. It highlights a way to scale the solution by partitioning and formatting the logs using AWS Glue for Ray. To learn how to work with Ray jobs in AWS Glue, see Working with Ray jobs in AWS Glue. To learn how to accelerate your Athena queries, see Reusing query results.


About the Authors

Cristiane de Melo is a Solutions Architect Manager at AWS based in Bay Area, CA. She brings 25+ years of experience driving technical pre-sales engagements and is responsible for delivering results to customers. Cris is passionate about working with customers, solving technical and business challenges, thriving on building and establishing long-term, strategic relationships with customers and partners.

Archana Inapudi is a Senior Solutions Architect at AWS supporting Strategic Customers. She has over a decade of experience helping customers design and build data analytics, and database solutions. She is passionate about using technology to provide value to customers and achieve business outcomes.

Nikita Sur is a Solutions Architect at AWS supporting a Strategic Customer. She is curious to learn new technologies to solve customer problems. She has a Master’s degree in Information Systems – Big Data Analytics and her passion is databases and analytics.

Zach Mitchell is a Sr. Big Data Architect. He works within the product team to enhance understanding between product engineers and their customers while guiding customers through their journey to develop their enterprise data architecture on AWS.

Query your Iceberg tables in data lake using Amazon Redshift (Preview)

Post Syndicated from Rohit Bansal original https://aws.amazon.com/blogs/big-data/query-your-iceberg-tables-in-data-lake-using-amazon-redshift-preview/

Amazon Redshift is a fast, fully managed petabyte-scale cloud data warehouse that makes it simple and cost-effective to analyze all your data using standard SQL and your existing business intelligence (BI) tools. Tens of thousands of customers today use Amazon Redshift to analyze exabytes of data and run analytical queries, making it the most widely used cloud data warehouse. Amazon Redshift is available in both serverless and provisioned configurations.

Amazon Redshift enables you to directly access data stored in Amazon Simple Storage Service (Amazon S3) using SQL queries and join data across your data warehouse and data lake. With Amazon Redshift, you can query the data in your S3 data lake using a central AWS Glue metastore from your Redshift data warehouse.

Amazon Redshift supports querying a wide variety of data formats, such as CSV, JSON, Parquet, and ORC, and table formats like Apache Hudi and Delta. Amazon Redshift also supports querying nested data with complex data types such as struct, array, and map.

With this capability, Amazon Redshift extends your petabyte-scale data warehouse to an exabyte-scale data lake on Amazon S3 in a cost-effective manner.

Apache Iceberg is the latest table format that is supported now in preview by Amazon Redshift. In this post, we show you how to query Iceberg tables using Amazon Redshift, and explore Iceberg support and options.

Solution overview

Apache Iceberg is an open table format for very large petabyte-scale analytic datasets. Iceberg manages large collections of files as tables, and it supports modern analytical data lake operations such as record-level insert, update, delete, and time travel queries. The Iceberg specification allows seamless table evolution such as schema and partition evolution, and its design is optimized for usage on Amazon S3.

Iceberg stores the metadata pointer for all the metadata files. When a SELECT query is reading an Iceberg table, the query engine first goes to the Iceberg catalog, then retrieves the entry of the location of the latest metadata file, as shown in the following diagram.

Amazon Redshift now provides support for Apache Iceberg tables, which allows data lake customers to run read-only analytics queries in a transactionally consistent way. This enables you to easily manage and maintain your tables on transactional data lakes.

Amazon Redshift supports Apache Iceberg’s native schema and partition evolution capabilities using the AWS Glue Data Catalog, eliminating the need to alter table definitions to add new partitions or to move and process large amounts of data to change the schema of an existing data lake table. Amazon Redshift uses the column statistics stored in the Apache Iceberg table metadata to optimize its query plans and reduce the file scans required to run queries.

In this post, we use the Yellow taxi public dataset from NYC Taxi & Limousine Commission as our source data. The dataset contains data files in Apache Parquet format on Amazon S3. We use Amazon Athena to convert this Parquet dataset and then use Amazon Redshift Spectrum to query and join with a Redshift local table, perform row-level deletes and updates and partition evolution, all coordinated through the AWS Glue Data Catalog in an S3 data lake.

Prerequisites

You should have the following prerequisites:

Convert Parquet data to an Iceberg table

For this post, you need the Yellow taxi public dataset from the NYC Taxi & Limousine Commission available in Iceberg format. You can download the files and then use Athena to convert the Parquet dataset into an Iceberg table, or refer to Build an Apache Iceberg data lake using Amazon Athena, Amazon EMR, and AWS Glue blog post to create the Iceberg table.

In this post, we use Athena to convert the data. Complete the following steps:

  1. Download the files using the previous link or use the AWS Command Line Interface (AWS CLI) to copy the files from the public S3 bucket for year 2020 and 2021 to your S3 bucket using the following command:
    aws s3 cp "s3://nyc-tlc/trip data/" s3://<Your S3 bucket name>/Parquet/  --exclude "*"  --include  "yellow_tripdata_2020*" –recursive
    aws s3 cp "s3://nyc-tlc/trip data/" s3://<Your S3 bucket name>/Parquet/  --exclude "*"  --include  "yellow_tripdata_2021*" –recursive

For more information, refer to Setting up the Amazon Redshift CLI.

  1. Create a database Icebergdb and create a table using Athena pointing to the Parquet format files using the following statement:
    CREATE DATABASE Icebergdb; 
    CREATE EXTERNAL TABLE icebergdb.nyc_taxi_yellow_parquet(
    	vendorid int,
    	tpep_pickup_datetime timestamp,
    	tpep_dropoff_datetime timestamp,
    	passenger_count bigint,
    	trip_distance double,
    	ratecodeid bigint,
    	store_and_fwd_flag string,
    	pulocationid int,
    	dolocationid int,
    	payment_type integer,
    	fare_amount double,
    	extra double,
    	mta_tax double,
    	tip_amount double,
    	tolls_amount double,
    	improvement_surcharge double,
    	total_amount double,
    	congestion_surcharge double,
    	airport_fee double
    )
    STORED AS PARQUET
    LOCATION 's3://<Your S3 Bucket>/Parquet/’

  2. Validate the data in the Parquet table using the following SQL:
    SELECT vendorid,
    	tpep_pickup_datetime,
    	tpep_dropoff_datetime,
    	trip_distance,
    	fare_amount,
    	tip_amount,
    	tolls_amount,
    	total_amount,
    	congestion_surcharge,
    	airport_fee
    FROM icebergdb.nyc_taxi_yellow_parquet
    limit 5;

  3. Create an Iceberg table in Athena with the following code. You can see the table type properties as an Iceberg table with Parquet format and snappy compression in the following create table statement. You need to update the S3 location before running the SQL. Also note that the Iceberg table is partitioned with the Year key.
    CREATE  TABLE nyc_taxi_yellow_iceberg(
      vendorid int, 
      tpep_pickup_datetime timestamp, 
      tpep_dropoff_datetime timestamp, 
      passenger_count bigint, 
      trip_distance double, 
      ratecodeid bigint, 
      store_and_fwd_flag string, 
      pulocationid int, 
      dolocationid int, 
      payment_type bigint, 
      fare_amount double, 
      extra double, 
      mta_tax double, 
      tip_amount double, 
      tolls_amount double, 
      improvement_surcharge double, 
      total_amount double, 
      congestion_surcharge double, 
      airport_fee double)
    PARTITIONED BY (year(tpep_pickup_datetime))
    LOCATION ‘s3://<Your S3 bucket name>/iceberg/iceberg'
    TBLPROPERTIES (
      'table_type'='iceberg',
      'write_compression'='snappy',
      'format'='parquet');

  4. After you create the table, load the data into the Iceberg table using the previously loaded Parquet table nyc_taxi_yellow_parquet with the following SQL:
    insert into nyc_taxi_yellow_iceberg (
    	vendorid,tpep_pickup_datetime,
    	tpep_dropoff_datetime,
    	passenger_count,trip_distance,
    	ratecodeid,store_and_fwd_flag,
    	pulocationid,dolocationid,
    	payment_type,fare_amount,
    	extra,mta_tax,tip_amount,
    	tolls_amount,total_amount,
    	congestion_surcharge,airport_fee
    	)
    select vendorid,tpep_pickup_datetime,
    	tpep_dropoff_datetime,
    	passenger_count,trip_distance,
    	ratecodeid,store_and_fwd_flag,
    	pulocationid,dolocationid,
    	payment_type,fare_amount,
    	extra,mta_tax,tip_amount,
    	tolls_amount,total_amount,
    	congestion_surcharge,airport_fee
    from nyc_taxi_yellow_parquet;

  5. When the SQL statement is complete, validate the data in the Iceberg table nyc_taxi_yellow_iceberg. This step is required before moving to the next step.
    SELECT * FROM nyc_taxi_yellow_iceberg LIMIT 5;

  6. You can validate that the nyc_taxi_yellow_iceberg table is in Iceberg format table and partitioned on the Year column using the following command:
    SHOW CREATE TABLE nyc_taxi_yellow_iceberg;

Create an external schema in Amazon Redshift

In this section, we demonstrate how to create an external schema in Amazon Redshift pointing to the AWS Glue database icebergdb to query the Iceberg table nyc_taxi_yellow_iceberg that we saw in the previous section using Athena.

Log in to the Redshift via Query Editor v2 or a SQL client and run the following command (note that the AWS Glue database icebergdb and Region information is being used):

CREATE external schema spectrum_iceberg_schema
from data catalog
database 'icebergdb'
region 'us-east-1'
iam_role default;

To learn about creating external schemas in Amazon Redshift, refer to create external schema

After you create the external schema spectrum_iceberg_schema, you can query the Iceberg table in Amazon Redshift.

Query the Iceberg table in Amazon Redshift

Run the following query in Query Editor v2. Note that spectrum_iceberg_schema is the name of the external schema created in Amazon Redshift and nyc_taxi_yellow_iceberg is the table in the AWS Glue database used in the query:

SELECT * FROM"dev"."spectrum_iceberg_schema"."nyc_taxi_yellow_iceberg";

The query data output in the following screenshot shows that the AWS Glue table with Iceberg format is queryable using Redshift Spectrum.

Check the explain plan of querying the Iceberg table

You can use the following query to get the explain plan output, which shows the format is ICEBERG:

EXPLAIN 
SELECT vendorid,count(*) 
FROM "dev"."spectrum_iceberg_schema"."nyc_taxi_yellow_iceberg"
GROUP BY vendorid; 

Validate updates for data consistency

After the update is complete on the Iceberg table, you can query Amazon Redshift to see the transactionally consistent view of the data. Let’s run a query by picking a vendorid and for a certain pick-up and drop-off:

SELECT * FROM nyc_taxi_yellow_iceberg
WHERE vendorid=1
AND tpep_pickup_datetime=cast('2021-06-24 21:53:26' AS timestamp)
AND tpep_dropoff_datetime=cast('2021-06-24 22:02:46'AS timestamp)
LIMIT 5;

Next, update the value of passenger_count to 4 and trip_distance to 9.4 for a vendorid and certain pick-up and drop-off dates in Athena:

UPDATE nyc_taxi_yellow_iceberg
SET passenger_count=4,trip_distance=9.4
WHERE vendorid=1
AND tpep_pickup_datetime=cast('2021-06-24 21:53:26' AS timestamp)
AND tpep_dropoff_datetime=cast('2021-06-24 22:02:46'AS timestamp);

Finally, run the following query in Query Editor v2 to see the updated value of passenger_count and trip_distance:

SELECT * 
FROM "dev"."spectrum_iceberg_schema"."nyc_taxi_yellow_iceberg"
WHERE vendorid=1
AND tpep_pickup_datetime=cast('2021-06-24 21:53:26' AS timestamp)
AND tpep_dropoff_datetime=cast('2021-06-24 22:02:46' AS timestamp)
LIMIT 5;

As shown in the following screenshot, the update operations on the Iceberg table are available in Amazon Redshift.

Create a unified view of the local table and historical data in Amazon Redshift

As a modern data architecture strategy, you can organize historical data or less frequently accessed data in the data lake and keep frequently accessed data in the Redshift data warehouse. This provides the flexibility to manage analytics at scale and find the most cost-effective architecture solution.

In this example, we load 2 years of data in a Redshift table; the rest of the data stays on the S3 data lake because that dataset is less frequently queried.

  1. Use the following code to load 2 years of data in the nyc_taxi_yellow_recent table in Amazon Redshift, sourcing from the Iceberg table:
    CREATE TABLE nyc_taxi_yellow_recent
    AS
    SELECT *
    FROM "dev"."spectrum_iceberg_schema"."nyc_taxi_yellow_iceberg"
    WHERE extract(year from tpep_pickup_datetime)>2020;

  2. Next, you can remove the last 2 years of data from the Iceberg table using the following command in Athena because you loaded the data into a Redshift table in the previous step:
    DELETE FROM nyc_taxi_yellow_iceberg 
    WHERE EXTRACT(year from tpep_pickup_datetime)>2020;

After you complete these steps, the Redshift table has 2 years of the data and the rest of the data is in the Iceberg table in Amazon S3.

  1. Create a view using the nyc_taxi_yellow_iceberg Iceberg table and nyc_taxi_yellow_recent table in Amazon Redshift:
    create or replace view nyc_taxi_yellow as
    select 'nyc_taxi_yellow_iceberg' as source,vendorid,tpep_pickup_datetime,
        tpep_dropoff_datetime,
        passenger_count,trip_distance,
        ratecodeid,store_and_fwd_flag,
        pulocationid,dolocationid,
        payment_type,fare_amount,
        extra,mta_tax,tip_amount,
        tolls_amount,total_amount,
        congestion_surcharge,airport_fee
    from "dev"."spectrum_iceberg_schema"."nyc_taxi_yellow_iceberg"
    union all
    select 'nyc_taxi_yellow_recent' as source,vendorid,tpep_pickup_datetime,
        tpep_dropoff_datetime,
        passenger_count,trip_distance,
        ratecodeid,store_and_fwd_flag,
        pulocationid,dolocationid,
        payment_type,fare_amount,
        extra,mta_tax,tip_amount,
        tolls_amount,total_amount,
        congestion_surcharge,airport_fee
    from  public.nyc_taxi_yellow_recent
    with no schema binding;

  2. Now query the view, depending on the filter conditions, Redshift Spectrum will scan either the Iceberg data, the Redshift table, or both. The following example query returns a number of records from each of the source tables by scanning both tables:
    SELECT source,count(1)
    FROM  nyc_taxi_yellow
    GROUP BY source;

Partition evolution

Iceberg uses hidden partitioning, which means you don’t need to manually add partitions for your Apache Iceberg tables. New partition values or new partition specs (add or remove partition columns) in Apache Iceberg tables are automatically detected by Amazon Redshift and no manual operation is needed to update partitions in the table definition. The following example demonstrates this.

In our example, if the Iceberg table nyc_taxi_yellow_iceberg was originally partitioned by year and later the column vendorid was added as an additional partition column, then Amazon Redshift can seamlessly query the Iceberg table nyc_taxi_yellow_iceberg with two different partition schemes over a period of time.

Considerations when querying Iceberg tables using Amazon Redshift

During the preview period, consider the following when using Amazon Redshift with Iceberg tables:

  • Only Iceberg tables defined in the AWS Glue Data Catalog are supported.
  • CREATE or ALTER external table commands are not supported, which means the Iceberg table should already exist in an AWS Glue database.
  • Time travel queries are not supported.
  • Iceberg versions 1 and 2 are supported. For more details on Iceberg format versions, refer to Format Versioning.
  • For a list of supported data types with Iceberg tables, refer to Supported data types with Apache Iceberg tables (preview).
  • Pricing for querying an Iceberg table is the same as accessing any other data formats using Amazon Redshift.

For additional details on considerations for Iceberg format tables preview, refer to Using Apache Iceberg tables with Amazon Redshift (preview).

Customer feedback

“Tinuiti, the largest independent performance marketing firm, handles large volumes of data on a daily basis and must have a robust data lake and data warehouse strategy for our market intelligence teams to store and analyze all our customer data in an easy, affordable, secure, and robust way,” says Justin Manus, Chief Technology Officer at Tinuiti. “Amazon Redshift’s support for Apache Iceberg tables in our data lake, which is the single source of truth, addresses a critical challenge in optimizing performance and accessibility and further simplifies our data integration pipelines to access all the data ingested from different sources and to power our customers’ brand potential.”

Conclusion

In this post, we showed you an example of querying an Iceberg table in Redshift using files stored in Amazon S3, cataloged as a table in the AWS Glue Data Catalog, and demonstrated some of the key features like efficient row-level update and delete, and the schema evolution experience for users to unlock the power of big data using Athena.

You can use Amazon Redshift to run queries on data lake tables in various files and table formats, such as Apache Hudi and Delta Lake, and now with Apache Iceberg (preview), which provides additional options for your modern data architectures needs.

We hope this gives you a great starting point for querying Iceberg tables in Amazon Redshift.


About the Authors

Rohit Bansal is an Analytics Specialist Solutions Architect at AWS. He specializes in Amazon Redshift and works with customers to build next-generation analytics solutions using other AWS Analytics services.

Satish Sathiya is a Senior Product Engineer at Amazon Redshift. He is an avid big data enthusiast who collaborates with customers around the globe to achieve success and meet their data warehousing and data lake architecture needs.

Ranjan Burman is an Analytics Specialist Solutions Architect at AWS. He specializes in Amazon Redshift and helps customers build scalable analytical solutions. He has more than 16 years of experience in different database and data warehousing technologies. He is passionate about automating and solving customer problems with cloud solutions.