Tag Archives: community

Open Source: The Option for a Connected and Collaborative World

Post Syndicated from Luciano Alves original https://blog.zabbix.com/open-source-the-option-for-a-connected-and-collaborative-world/29237/

In my previous article, where we explored the TCO and ROI of open-source software, I raised topics that sparked substantive discussions, new research, and renewed insights. It is undeniable that we live in an era where collaboration and connectivity go beyond trends. They represent the foundation of current technology, especially in a world based on APIs.

In this context, open-source software stands out and positions itself as a logical and natural choice for companies and organizations (both public and private) that seek innovation, flexibility, security, and agility. Over the last two decades, the technology sector has validated this direction. Recently, the Open Source Program Office (OSPO) appeared in Gartner’s Hype Cycle for Emerging Technologies report, reinforcing its relevance and emerging as a maturing trend within 2 to 5 years.

Open Source in Gartner’s Hype Cycle

Gartner’s Hype Cycle for Emerging Technologies is a well-known tool for illustrating the phases of maturity, adoption, and impact of new technologies. In the current cycle, the Open Source Program Office (OSPO) appears as an emerging technology with the potential for corporate transformation in the coming years.

This highlights that it is not only a viable alternative to proprietary software, but an engine of innovation within organizations. The OSPO is, essentially, an internal structure in companies dedicated to promoting and managing the use of open-source software, ensuring compliance and governance.

With the strengthening of these structures, organizations not only maximize the benefits of open source but also foster a culture of continuous innovation and active collaboration with communities, whether through service contracts, participation in working groups, or even funding new functionalities.

A Natural Strategic Choice

Experience shows that open source is a strategic path for organizations aiming to thrive in an increasingly interconnected and competitive market. The transparency, flexibility, and scalability offered by such solutions surpass the limitations of proprietary solutions, facilitating a more adaptable and agile adoption.

Additionally, the collaborative approach of this model aligns with today’s reality, where knowledge sharing and co-creation are essential for technological development within organizations. Companies like Google, Microsoft, and Red Hat have already recognized this reality and invest in their own Open Source Program Offices. These initiatives not only underline the commitment to open innovation but also highlight tangible benefits in terms of efficiency, cost reduction, and speed in the development of innovations.

The Future is Open Source

The inclusion of OSPO in Gartner’s Hype Cycle indicates that companies that have not yet embarked on this journey need to reconsider their strategies. In an environment where constant adaptation and innovation are essential for growth and efficiency, open source has ceased to be optional and has become a necessity. As adoption expands across various sectors and applications, companies that build a solid framework for evaluating and maximizing the benefits of these technologies will be in a privileged position to lead their markets.

At Zabbix, we understand the importance of open source not just as a technological solution, but as a philosophy aimed at democratizing technology, fostering continuous innovation, and cultivating a culture of collaboration—a vision that OSPOs have been solidifying in companies across multiple industries. The discussion about the Total Cost of Ownership (TCO) and Return on Investment (ROI) in open-source solutions is just the starting point.

Tools like Zabbix prove that this is an effective strategy for monitoring and maintaining critical environments. Open source is, and will continue to be, the driving force behind the innovations that will transform the way companies sustain their businesses and interact with customers and users. The future is already open source, and the time to embrace this transformation is now.

The post Open Source: The Option for a Connected and Collaborative World appeared first on Zabbix Blog.

Celebrating the community: Prabhath

Post Syndicated from Sophie Ashford original https://www.raspberrypi.org/blog/celebrating-the-community-prabhath/

We love hearing from members of the community and sharing the stories of amazing young people, volunteers, and educators who are using their passion for technology to create positive change in the world around them.

An educator sits in a library.

Prabhath, the founder of the STEMUP Educational Foundation, began his journey into technology at an early age, influenced by his cousin, Harindra.

“He’s the one who opened up my eyes. Even though I didn’t have a laptop, he had a computer, and I used to go to their house and practise with it. That was the turning point in my life.”

This early exposure to technology, combined with support from his parents to leave his rural home in search of further education, set Prabhath on a path to address a crucial issue in Sri Lanka’s education system: the gap in opportunities for students, especially in STEM education. 

“There was a gap between the kids who are studying in Sri Lanka versus the kids in other developed markets. We tried our best to see how we can bridge this gap with our own capacity, with our own strengths.” 

Closing the gap through STEMUP

Recognising the need to close this gap in opportunities, Prabhath, along with four friends who worked with him in his day job as a Partner Technology Strategist, founded the STEMUP Educational Foundation in 2016.  STEMUP’s mission is straightforward but ambitious — it seeks to provide Sri Lankan students with equal access to STEM education, with a particular focus on those from underserved communities.

A group of people stands together, engaged in a lively discussion.

To help close the gap, Prabhath and his team sought to establish coding clubs for students across the country. Noting the lack of infrastructure and access to resources in many parts of Sri Lanka, they partnered with Code Club at the Raspberry Pi Foundation to get things moving. 

Their initiative started small with a Code Club in the Colombo Public Library, but things quickly gained traction. 

What began with just a handful of friends has now grown into a movement involving over 1,500 volunteers who are all working to provide free education in coding and emerging technologies to students who otherwise wouldn’t have access.

An educator helps a young person at a Code Club.

A key reason for STEMUP’s reach has been the mobilisation of university students to serve as mentors at the Code Clubs. Prabhath believes this partnership has not only helped the success of Code Club Sri Lanka, but also given the university students themselves a chance to grow, granting them opportunities to develop the life skills needed to thrive in the workforce. 

“The main challenge we see here today, when it comes to graduate students, is that they have the technology skills, but they don’t have soft skills. They don’t know how to do a presentation, how to manage a project from A to Z, right? By being a volunteer, that particular student can gain 360-degree knowledge.” 

Helping rural communities

STEMUP’s impact stretches beyond cities and into rural areas, where young people often have even fewer opportunities to engage with technology. The wish to address this imbalance  is a big motivator for the student mentors.

“When we go to rural areas, the kids don’t have much exposure to tech. They don’t know about the latest technologies. What are the new technologies for that development? And what subjects can they  study for the future job market? So I think I can help them. So I actually want to teach someone what I know.” – Kasun, Student and Code Club mentor

This lack of access to opportunities is precisely what STEMUP aims to change, giving students a platform to explore, innovate, and connect with the wider world.

Coolest Projects Sri Lanka

STEMUP recently held the first Coolest Projects Sri Lanka, a showcase for the creations of young learners. Prabhath first encountered Coolest Projects while attending the Raspberry Pi Foundation Asia Partner summit in Malaysia. 

“That was my first experience with the Coolest Projects,” says Prabhath, “and when I came back, I shared the idea with our board and fellow volunteers. They were all keen to bring it to Sri Lanka.” 

For Prabhath, the hope is that events like these will open students’ eyes to new possibilities. The first event certainly lived up to his hope. There was a lot of excitement, especially in rural areas, with multiple schools banding together and hiring buses to attend the event. 

“That kind of energy… because they do not have these opportunities to showcase what they have built, connect with like minded people, and connect with the industry.”

Building a better future

Looking ahead, Prabhath sees STEMUP’s work as a vital part of shaping the future of education in Sri Lanka. By bringing technology to public libraries, engaging university students as mentors, and giving kids hands-on experience with coding and emerging technologies, STEMUP is empowering the next generation to thrive in a digital world. 

“These programmes are really helpful for kids to win the future, be better citizens, and bring this country forward.”

Young people showcase their tech creations at Coolest Projects.

STEMUP is not just bridging a gap — it’s building a brighter, more equitable future for all students in Sri Lanka. We can’t wait to see what they achieve next!

Inspire the next generation of young coders

To find out how you and young creators you know can get involved in Coolest Projects, visit coolestprojects.org. If the young people in your community are just starting out on their computing journey, visit our projects site for free, fun beginner coding projects.

For more information to help you set up a Code Club in your community, visit codeclub.org.

Help us celebrate Prabhath and his inspiring journey with STEMUP by sharing this story on X, LinkedIn, and Facebook.

The post Celebrating the community: Prabhath appeared first on Raspberry Pi Foundation.

Maximizing TCO and ROI with Open-Source Solutions

Post Syndicated from Luciano Alves original https://blog.zabbix.com/maximizing-tco-and-roi-with-open-source-solutions/29019/

In recent years, the debate around total cost of ownership (TCO) and return on investment (ROI) for open-source solutions has intensified, particularly within the scope of technology operations. With increasingly complex IT infrastructures and pressure to optimize costs, the choice between open-source and proprietary solutions has become a crucial strategic decision. By using a platform like Zabbix, which is both open-source and low-maintenance, multiple operational needs can be met, increasing returns.

The use of open-source tools by area of operation

Let’s explore how different areas (disciplines or approaches) related to information technology can benefit from adopting Zabbix.

IT Operations (ITOps)

ITOps is the foundation of daily IT operations, responsible for maintaining and monitoring an organization’s technological infrastructure. Using a platform like Zabbix allows ITOps teams to continuously monitor the entire IT infrastructure, identifying and solving problems before they impact the business. Zabbix stands out as a cost-effective alternative by eliminating the need for expensive licenses while supporting the fulfillment of SLAs and improving operational efficiency.

Operational Technology (OT)

In the context of Operational Technology, which encompasses the supervision and control of industrial processes, Zabbix excels in its ability to monitor critical equipment and systems in real-time. Zabbix’s ability to integrate with a wide variety of devices and protocols makes it ideal for complex industrial environments where reliability and operational continuity are crucial. Moreover, Zabbix can be configured to send personalized alerts and reports, ensuring that all stakeholders are informed about the monitored environment.

IT Infrastructure Management

Managing physical or virtual IT infrastructure involves overseeing all components that keep the IT environment running, from servers and network equipment to cloud applications and services. Zabbix, with its ability to monitor both on-premise and cloud environments, offers a unified solution for managing and optimizing the entire technology infrastructure. Zabbix’s scalability also ensures that it can grow along with the company’s needs, but without the additional costs that often come with proprietary solutions.

IT Service Management (ITSM)

In ITSM disciplines, the focus is on efficiently delivering IT services that meet business needs. Zabbix integrates well with ITSM frameworks and tools, offering valuable data and insights that can be used to improve incident, problem, and change management. Zabbix’s ability to provide real-time monitoring and trend analysis can also directly contribute to the continuous improvement of IT services, resulting in a higher ROI.

Technology Operations

A broader term that encompasses both ITOps and OT, technology operations benefit from Zabbix through its versatility in monitoring a wide range of systems and devices. Whether supporting infrastructure evolution or managing critical configurations, Zabbix offers integrations with tools used to ensure that technology aligns with business goals, minimizing risks and maximizing operational efficiency.

Why going open-source is a winning strategy

Going open-source is a winning strategy for monitoring and operating critical environments because it offers transparency, security, flexibility, and rapid innovation through collaboration with a wide developer community. Let’s explore the details of each benefit.

Licensing Costs

One of the greatest advantages of open source solutions is the absence of licensing costs. Unlike proprietary solutions, which require significant initial and recurring investments, open source platforms allow companies to redirect those resources to other critical areas, such as infrastructure improvement and internal skills development.

Flexibility and Customization

In today’s dynamic environments, the ability to customize and adapt tools to specific business needs is a competitive differentiator. Open source solutions like Zabbix, for example, offer flexibility that is often lacking in proprietary alternatives.This customization not only meets operational demands but also avoids vendor lock-in, a common concern with closed solutions.

Support and Documentation

While both proprietary and open source solutions, like Zabbix, offer professional support and services to clients, open source communities have proven increasingly effective in creating content that shares knowledge and use cases for tools. IDC studies confirm that organizations adopting open source can achieve a positive ROI in less time, especially when they have or develop the necessary skills to manage these solutions internally. In the case of Zabbix, there is a career path with courses and certifications for interested professionals.

Integration and Scalability

Integrating open source tools into mission-critical environments can be more seamless and less costly in terms of both time and money, especially when organizations possess the necessary internal technical skills. Zabbix is also scalable, allowing growth without significant additional costs, in contrast to proprietary solutions that often require paid upgrades.

TCO and ROI: The Zabbix case

A recent comparative study by Gartner highlighted that open source solutions (such as Zabbix) often outperform proprietary alternatives in terms of TCO, particularly in long-term implementations. Furthermore, IDC reinforces that the ROI of open source solutions can be maximized when companies invest in training teams to effectively use and explore these tools.

Internal data shows that 80% of Zabbix users (non-clients) do not use more than 15% of the platform’s existing features. This same data also demonstrates that team training and the hiring of official services increase operational efficiency by over 35%. The discussion about TCO and ROI of open source solutions in technology operations is not just a trend but a reality that more and more organizations are exploring to maximize resources and increase competitiveness.

The post Maximizing TCO and ROI with Open-Source Solutions appeared first on Zabbix Blog.

Monitoring a Complex Infrastructure Environment with Zabbix

Post Syndicated from Nyein Chan Zaw original https://blog.zabbix.com/monitoring-a-complex-infrastructure-environment-with-zabbix/28954/

Inviting the members of our global community to share their Zabbix dashboards with us prompted a flood of fascinating responses, and we’re highlighting a few of the most interesting submissions here on our blog. This week’s entry comes to us from Nyein Chan Zaw, who is based in Bangkok, Thailand and works as an Infrastructure Specialist for Green Will Solution. Read on to see how he uses his Zabbix dashboard to monitor a highly intricate infrastructure in real time. 

I appreciate the chance to share my dashboard, and I would also like to share a use case that demonstrates the practical implementation of Zabbix for real-time infrastructure monitoring.

This Zabbix dashboard provides a comprehensive view of the network’s real-time health, server availability, traffic patterns, and key performance metrics of essential infrastructure components. It is designed for monitoring production, office, and virtual server zones, including network devices, physical servers, and virtual machines. The current view is the first page of a two-page dashboard, which focuses on general network monitoring:

The second page is dedicated solely to monitoring infrastructure nodes:

Key features monitored

Traffic Monitoring: The dashboard tracks real-time traffic from critical network uplinks, including AIS and TRUE, offering visibility into bandwidth usage (e.g., 64.50 Kbps and 13.05 Kbps). It also monitors internal traffic and key devices like the FortiGate firewall, helping ensure optimal network performance and security.

Host Health Monitoring: CPU and memory utilization for top hosts (e.g., GW-WINDOW11, GW-AD-DOMAIN) are displayed, enabling efficient resource management. Alerts are triggered for high resource usage, allowing for a proactive response to performance issues.

Disk Usage: Disk space on key hosts, such as the Zabbix virtual machine and other core servers, is monitored to avoid file system over-utilization, which can lead to potential service interruptions.

Availability Overview: The dashboard provides a summary of host availability, including how many are available, unavailable, or have unknown statuses. Monitoring methods like active agent and SNMP are also shown, giving an overall view of network health.

Visual Topology Map: A detailed network map shows the production, office, virtual, and test zones, along with devices and connections. This visualization aids in quickly identifying problem areas and understanding how systems are interlinked.

Severity and Problem Monitoring: The dashboard classifies issues by severity, from critical problems to warnings. Real-time issues (such as VM downtime or system failures) are highlighted, enabling the team to resolve issues quickly.

Performance Metrics: Graphs display performance metrics, such as bandwidth usage and CPU load, offering insights into system bottlenecks or overuse, particularly in critical devices like firewalls.

Impact

This Zabbix dashboard enables an infrastructure team to efficiently monitor network performance, manage resource usage, and ensure device availability. The clear visual interface helps quickly identify issues, reducing downtime and ensuring higher reliability of critical services.

Conclusion

The first page of the dashboard demonstrates Zabbix’s capabilities for centralized monitoring across large infrastructures. By integrating data from network devices, servers, and virtual machines, it empowers IT teams to make informed decisions and address issues before they escalate. The second page provides a detailed focus on the infrastructure nodes, ensuring that all critical systems are effectively monitored for optimal operation across the IT environment.

The post Monitoring a Complex Infrastructure Environment with Zabbix appeared first on Zabbix Blog.
Monitoring Failed Jobs in NetBackup with Zabbix

Post Syndicated from Patrik Uytterhoeven original https://blog.zabbix.com/monitoring-failed-jobs-in-netbackup-with-zabbix/28539/

Monitoring backup solutions can be an arduous task – especially since many backup tools don’t provide APIs and simply are not easy to work with. One such solution – NetBackup – provides its own set of challenges, but fortunately we have Zabbix, with its low-level discovery (LLD) features and the possibility to leverage user parameters to extend Zabbix agent.

How does LLD work ?

For those not familiar with LLD, Zabbix is able to create items, triggers, graphs, and other entities based on LLD rules. JSON is used to detect those entities by Zabbix.

https://www.zabbix.com/documentation/current/en/manual/discovery/low_level_discovery/custom_rules

If we create a script that returns this information to Zabbix, then we can automatically create items based on the received low-level discovery macros and their values. In this example from the Zabbix website, Zabbix will map {#FSNAME} to one of the detected logical volumes.

[    
{ "{#FSNAME}":"/",                           "{#FSTYPE}":"rootfs"   },
{ "{#FSNAME}":"/sys",                        "{#FSTYPE}":"sysfs"    },
{ "{#FSNAME}":"/proc",                       "{#FSTYPE}":"proc"     },
{ "{#FSNAME}":"/dev",                        "{#FSTYPE}":"devtmpfs" },
{ "{#FSNAME}":"/dev/pts",                    "{#FSTYPE}":"devpts"   },
{ "{#FSNAME}":"/lib/init/rw",                "{#FSTYPE}":"tmpfs"    },
{ "{#FSNAME}":"/dev/shm",                    "{#FSTYPE}":"tmpfs"    },
{ "{#FSNAME}":"/home",                       "{#FSTYPE}":"ext3"     },
{ "{#FSNAME}":"/tmp",                        "{#FSTYPE}":"ext3"     },
{ "{#FSNAME}":"/usr",                        "{#FSTYPE}":"ext3"     },
{ "{#FSNAME}":"/var",                        "{#FSTYPE}":"ext3"     },
{ "{#FSNAME}":"/sys/fs/fuse/connections",    "{#FSTYPE}":"fusectl"  }
]

Zabbix can automatically create items with this information. If we then create another script where we sent the values for each of the volumes, then we can return for example the free space for the “/” volume as a value and do this for all other volumes as well.

With this knowledge, we can create a solution to monitor our backups. We will further optimize this approach because we don’t want to rely on multiple scripts, such as a script that sends us a list of failed backups, another script that returns the status codes, etc. We will use the dependent item feature, which allows us to simply create one master item to collect all the values and then process them further in Zabbix.

Monitoring with Python and user parameters

To format our data in JSON, we need to extract it first from the API. For this, we can create a script with the user parameters in our Zabbix agent. The Python script we will use for this can be copied to “/etc/zabbix” or another place that is accessible by the Zabbix user on our system.

https://github.com/Trikke76/Zabbix/blob/master/Netbackup/netbackup-failed-jobs-zabbix.py

Don’t forget to adapt the script and update settings like user name, password, URL, and page limit!


# NetBackup API configuration
BASE_URL = "https://<netbackup-url>:1556/netbackup"
USERNAME = ""
PASSWORD = ""
PAGELIMIT = "100" # adapt to your needs

The page limit will limit the search to the last 100 lines

If you want you can also adapt how many days we have to look back in history standard is 7 days

# Set the time range for job retrieval (last 7 days)
end_time = datetime.utcnow()
start_time = end_time - timedelta(hours=168)


The script will collect errors in backups and the resulting output will display a list of failed backups over the last 100 jobs:

{
  "data": [
    {
      "{#JOBID}": 257086,
      "JOBTYPE": "DBBACKUP",
      "STATUSCODE": 11,
      "STATE": "DONE",
      "POLICYNAME": "NBU-Catalog",
      "CLIENTNAME": "NetBackup-server",
      "STARTTIME": "2024-07-29T12:46:34.000Z",
      "ENDTIME": "2024-07-29T12:47:53.000Z",
      "ELAPSEDTIME": "PT1M19S",
      "KILOBYTESTRANSFERRED": 0
    }
  ]
}

This data is perfect for our LLD rules in Zabbix. Once we have copied our script to the server, we have to define our Zabbix user parameter. You can download an example here:

https://github.com/Trikke76/Zabbix/blob/master/Netbackup/Userparameter-netbackup.conf

Copy this file to your Zabbix agent in the config folder, usually somewhere in:

/etc/zabbix/zabbix_agent2.d/” or “/etc/zabbix/zabbix_agentd.d/” depending if you use Zabbix agent or Zabbix agent 2.

Don’t forgot to modify the file permissions so that only the agent can read it, and restart Zabbix agent. Also, make sure that the user parameter points are at the correct location of the Python script. The last thing we have to do now is create or import our Zabbix template:

https://github.com/Trikke76/Zabbix/blob/master/Netbackup/Templates_Netbackup.yaml

How does it work?

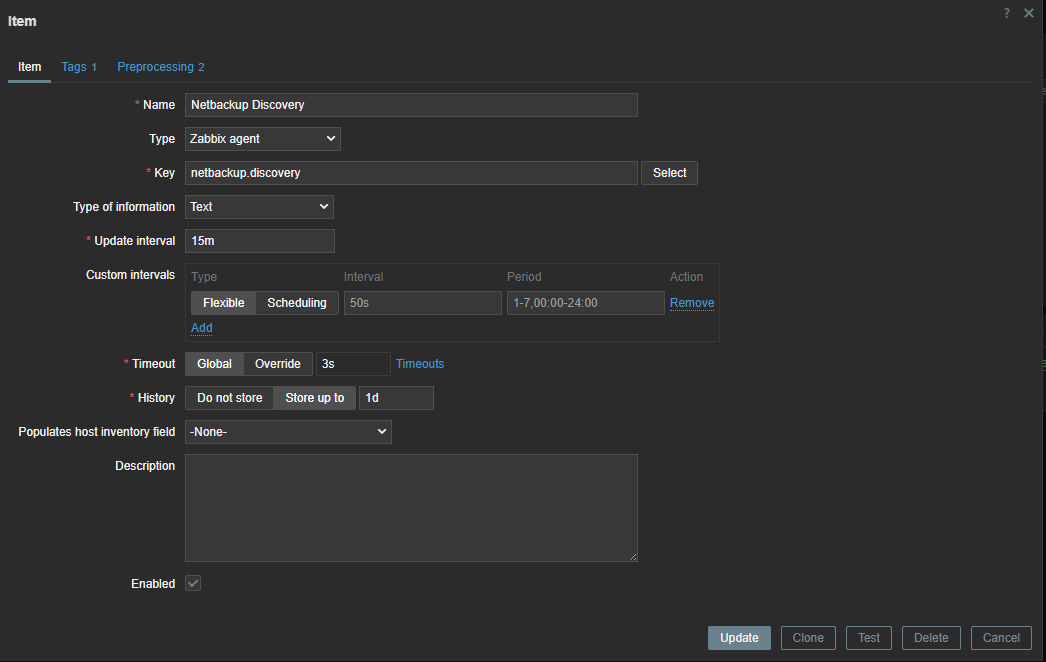
The first thing we have to do is create a master item that collects the data from our script.


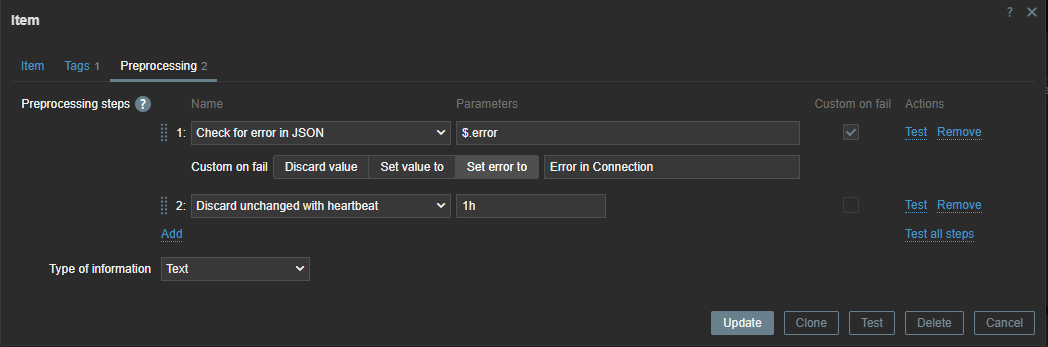
Since the error check is executed every 15 minutes, we can use throttling pre-processing to discard duplicate data, since most of the time there will be no errors in our backups.

Also, if our script fails to connect to the API, our data collection will fail. Therefore, we can use custom on fail pre-processing and set a custom, more human-readable error message.


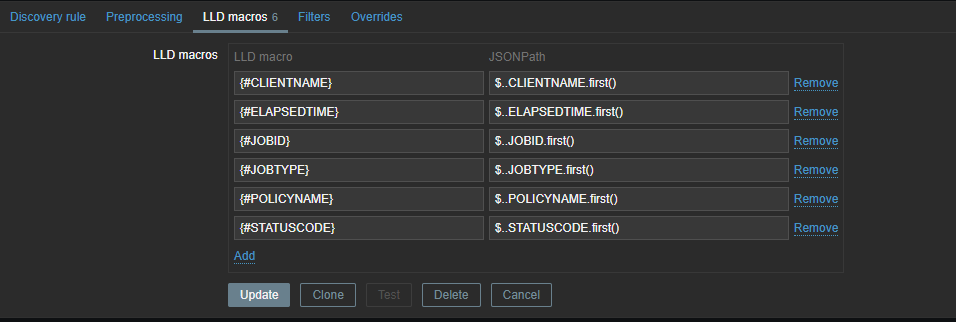
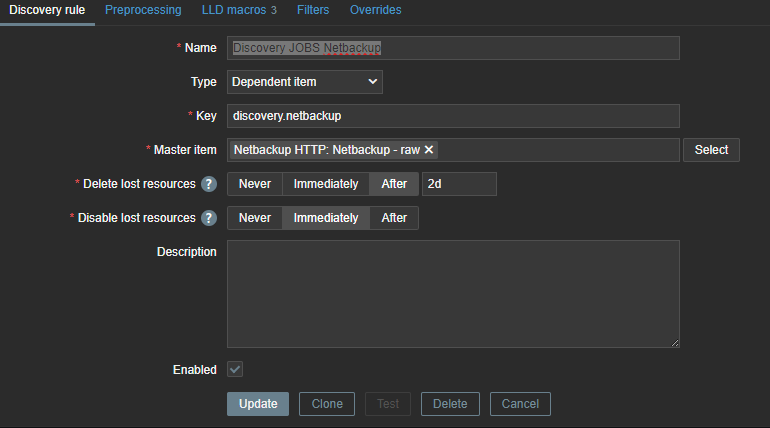
Now we have to create a discovery rule in Zabbix based on this data. In this discovery rule we will extract the required data and map it to custom LLD macros.

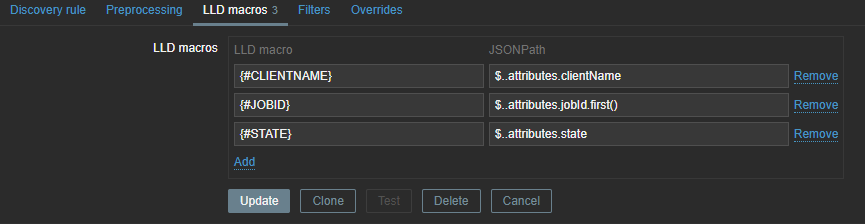
Those macros can be used later in our items. As you can see, we use .first() at the end of our JSONPATH expression – otherwise, we would get all our matching data between the [ ], as our data comes in a list. By making use of .first() we filter out all other data we don’t need.


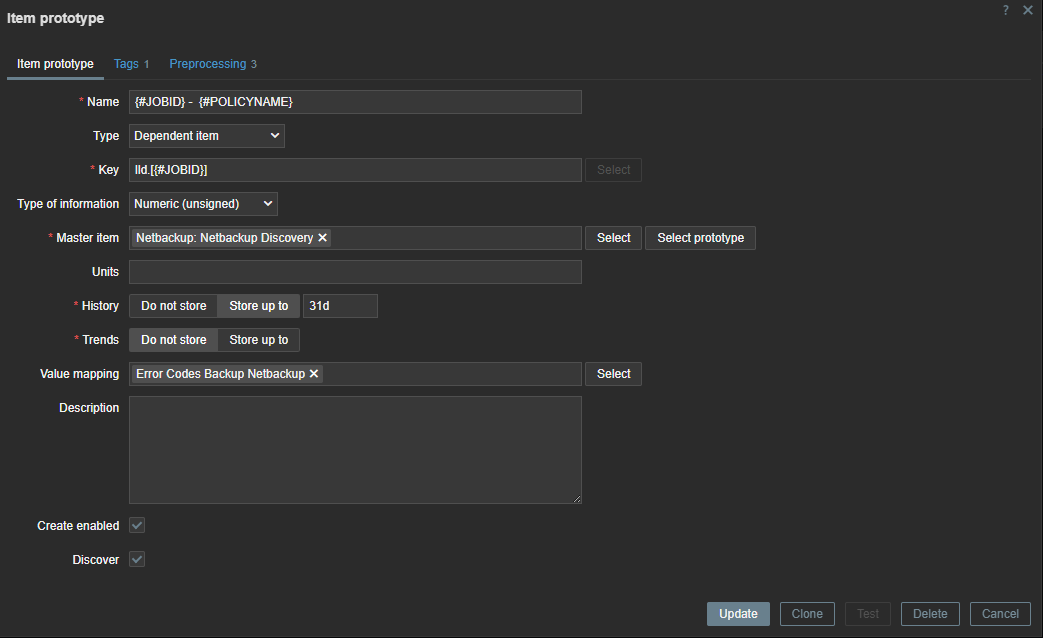
To create our LLD items, we need to create an item prototype so that items can be generated when they are detected. Our item will be a dependent item, so it will get its data from the master item.


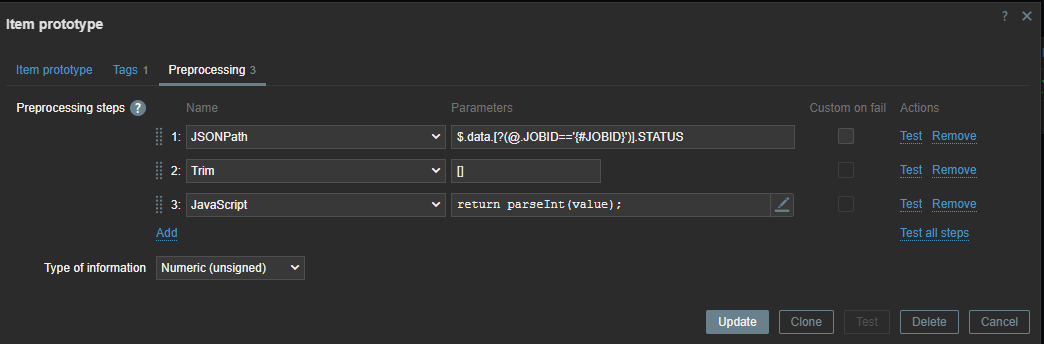
In our item prototype we can make use of the Zabbix LLD macros we created before. To extract the data we need, we have to add a preprocessing rule first to extract the data we want from our master item.


First line will look for the “JOBID” and will use the LLD macro we created before. Remember we used .last() ? If we had not done this our ID here would have been a list [ ] instead of just the ID number.
We also have to remove the [ ] – this we can do with trim. Since our data is returned as text we also add some JS to convert our data to an Integer. This allows us to create triggers based on the error code we have received.

Monitoring with an http item

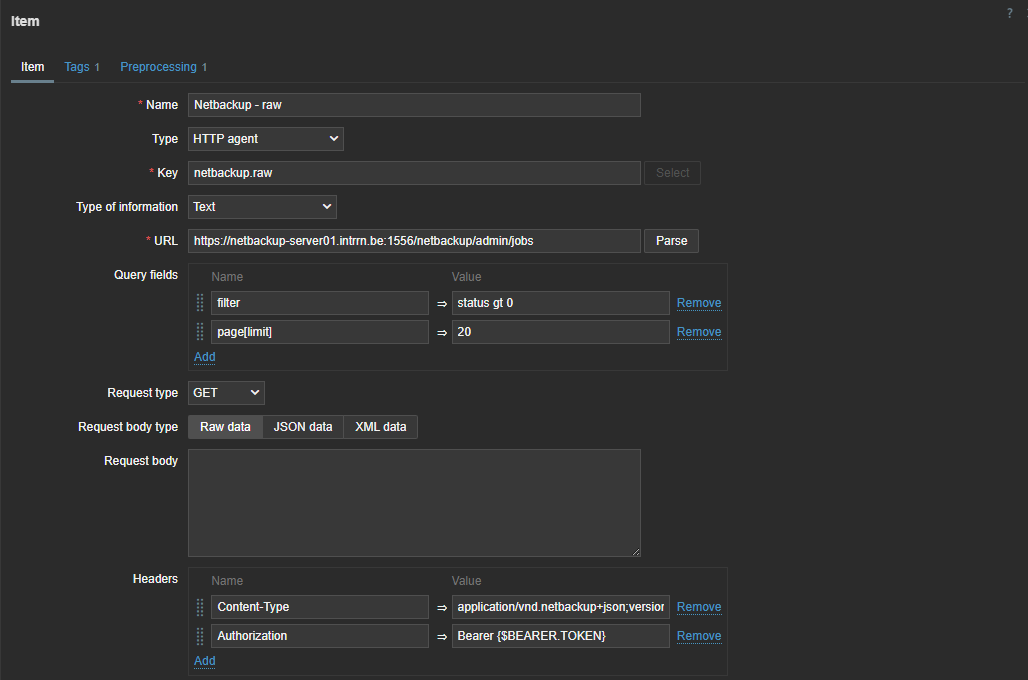
There is another way to do the same thing in Zabbix without writing those complex python scripts. Since Zabbix 4.0 we have “HTTP agent” item type. This allows us to connect to the API and retrieve the required data from the API. Combined with LLD and dependent items this becomes a very powerful way to collect metrics.

First thing we have to do is create a master item to retrieve the data from the API. This item is of the type “HTTP agent” and we have to fill in the URL of the API endpoint. To authenticate we have to pass information like the authentication token in the headers. For this you need to create a token first in NetBackup. As you can see I used a macro {$BEARER.TOKEN} – this is so we can make it secret.


So next step is to add our secret token. Let’s create our macro in the template under the Macros section. Here we can choose to keep it hidden for everyone. An even more secure way to store sensitive information like authentication tokens would be using a secret vault.


The data we get back from our API is a bit different from what we have seen in the output of the Python script we defined previously, but not by much.

{
  "data": [
    {
      "type": "job",
      "id": "260136",
      "attributes": {
          "jobId": 260136,
          "parentJobId": 0,
          "jobType": "DBBACKUP",
          "policyType": "NBU_CATALOG",
          "policyName": "NBU-Catalog",
          "scheduleType": "DIFFERENTIAL_INCREMENTAL_BACKUP",
          "scheduleName": "-",
      …

With this knowledge and what we know from our first try with Python, we can now make a dependent discovery rule.


The same logic applies again – we need to map our data to LLD macros so that we can use them later in our LLD items and triggers.


These LLD macros can later be used in our item prototypes and triggers. We only need JOBID and STATE, but you can create some extra mappings in case you like to use the extra information later. With our JSON path we will once again extract the data from our master item.

The next step is to create the LLD item prototype. Here we can use the macros we extracted earlier.


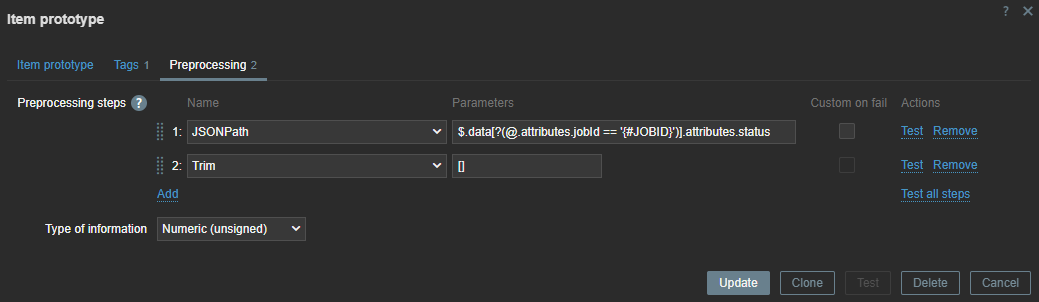
The item is dependent on our master item, so without any pre-processing the data will be exactly the same as in our master item. Therefore, we can add some rules to get the data we need.


Here, we use the JSON path to extract the data. With our LLD macros we can extract the data dynamically for every item we have discovered. With Trim, we remove the [ ] that comes around our data.

If there are backup errors, the end result will look something like this:


The steps can look a bit abstract, so the best thing to do is to try and perform everything step-by-step and use the Test button in Zabbix to test every step before you continue.

Websites like https://jsonpath.com/ and https://jsonformatter.org/ can also be helpful to beautify your data and do some testing with your JSONPath pre-processing.

If you want to test the template, feel free to download it from my github:

https://github.com/Trikke76/Zabbix/blob/master/Netbackup/Templates_Netbackup_HTTP.yaml

In conclusion

That’s it! If you’ve set up everything correctly, you should now get a list of failed jobs collected from NetBackup. Once the failed jobs are gone,  Zabbix will disable the related entities and clean them up after some time.

If  you need help optimizing your Zabbix environment, or you need a support contract, some consultancy, or training, feel free to contact [email protected] or visit us at https://www.open-future.be.

We are always available to help!

The post Monitoring Failed Jobs in NetBackup with Zabbix appeared first on Zabbix Blog.
Monitoring My Home Network with Zabbix

Post Syndicated from Cesar Caceres original https://blog.zabbix.com/monitoring-my-home-network-with-zabbix/28921/

Recently, we reached out to the members of our global community with an invitation to share their dashboards and give us a quick tour of what they do with our product. The response was so incredible that we have decided to highlight a few of the most interesting submissions here on our blog.

First up is Cesar Caceres, an independent IT consultant with nearly 10 years of experience in critical system monitoring within the banking sector. Cesar enjoys being alerted to changes within his home network so much that he composed a custom song to let him know when a new alert arrives!

My environment

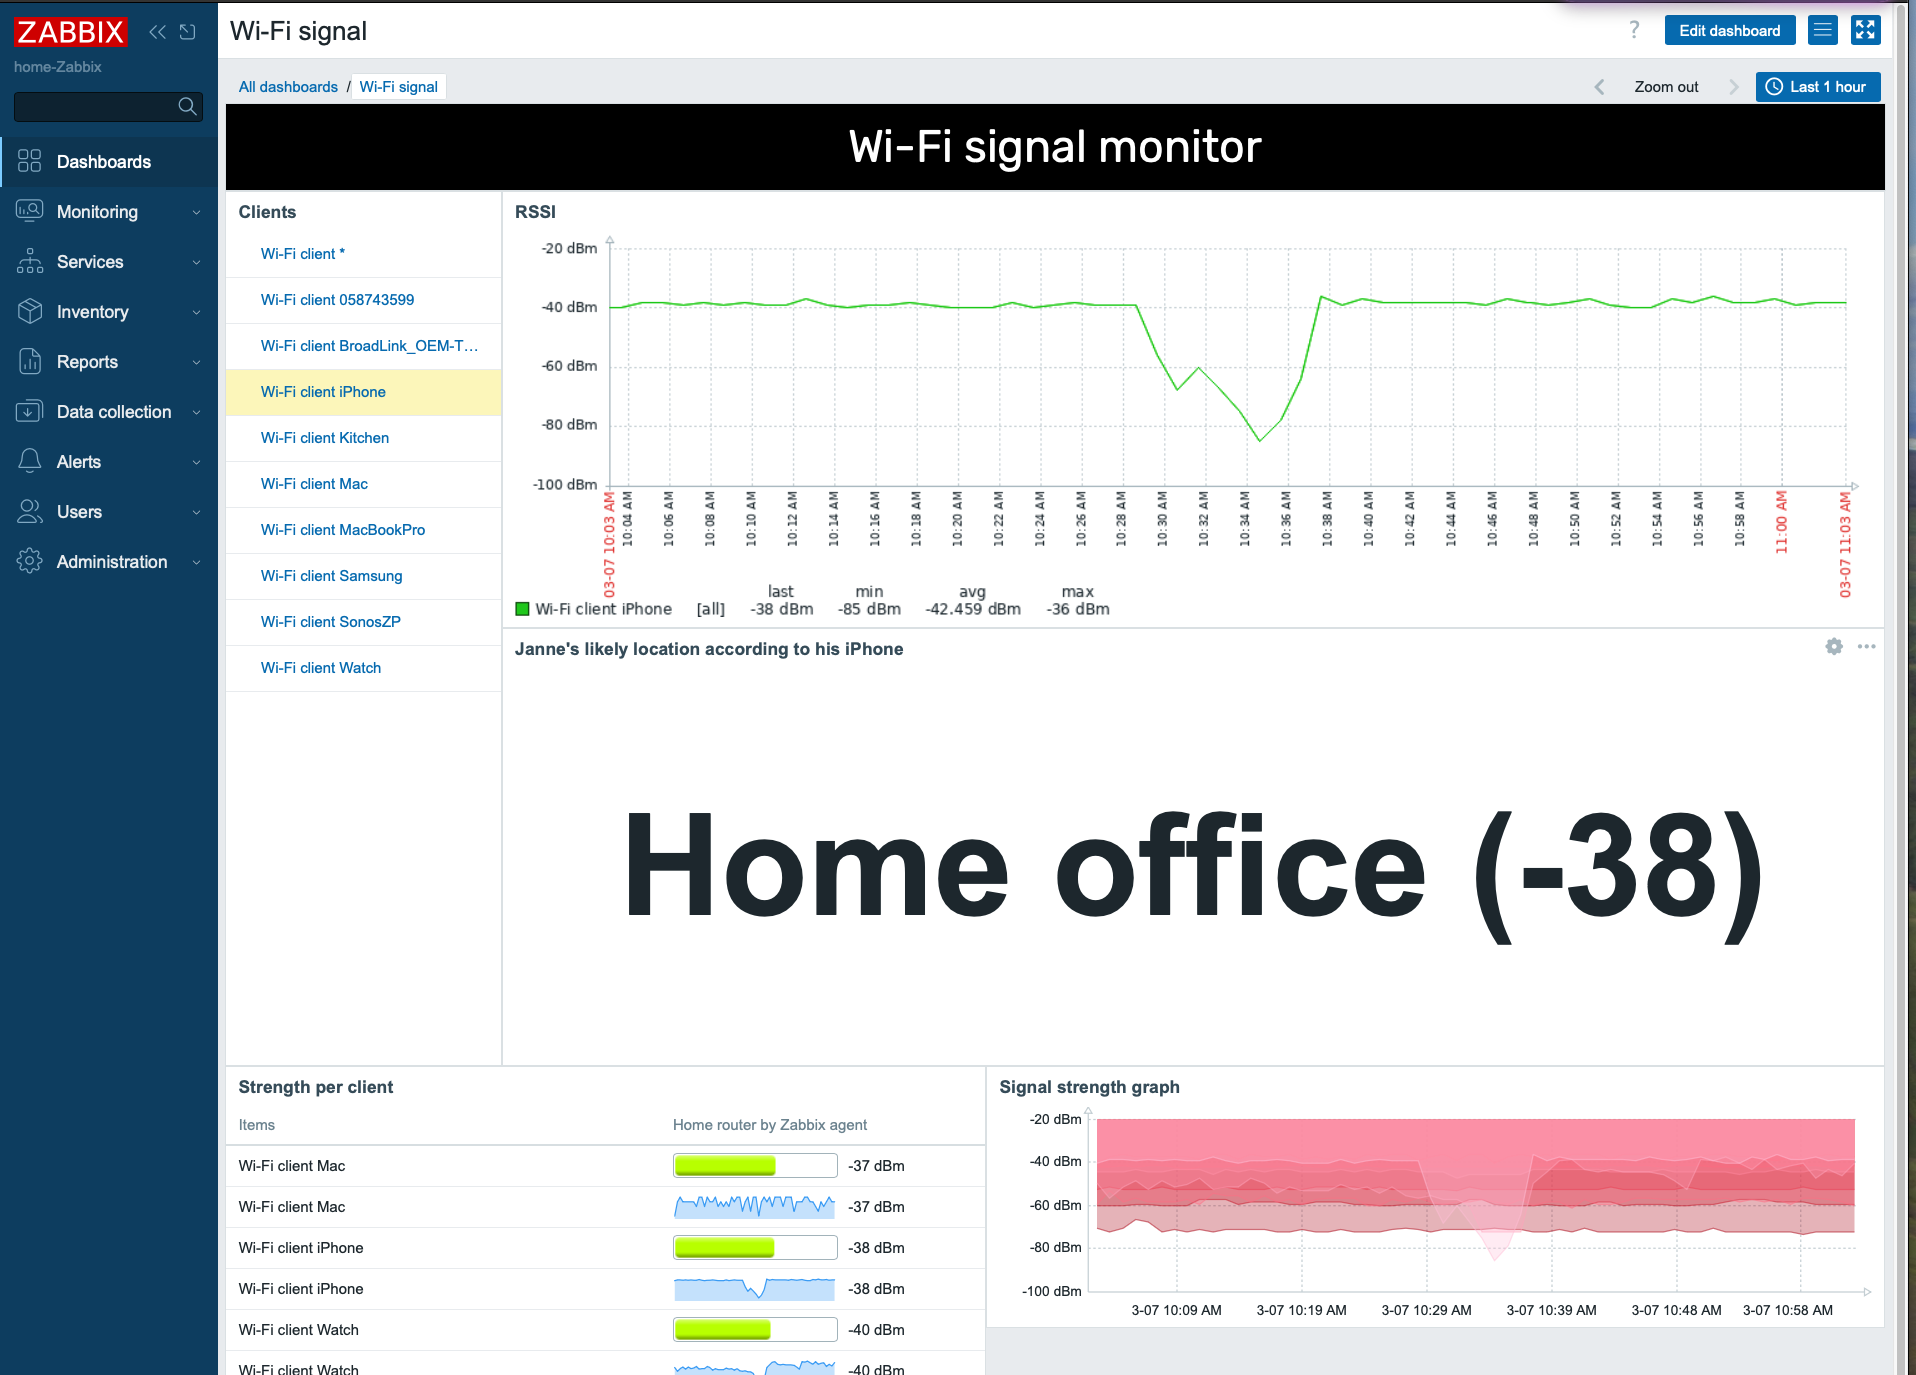
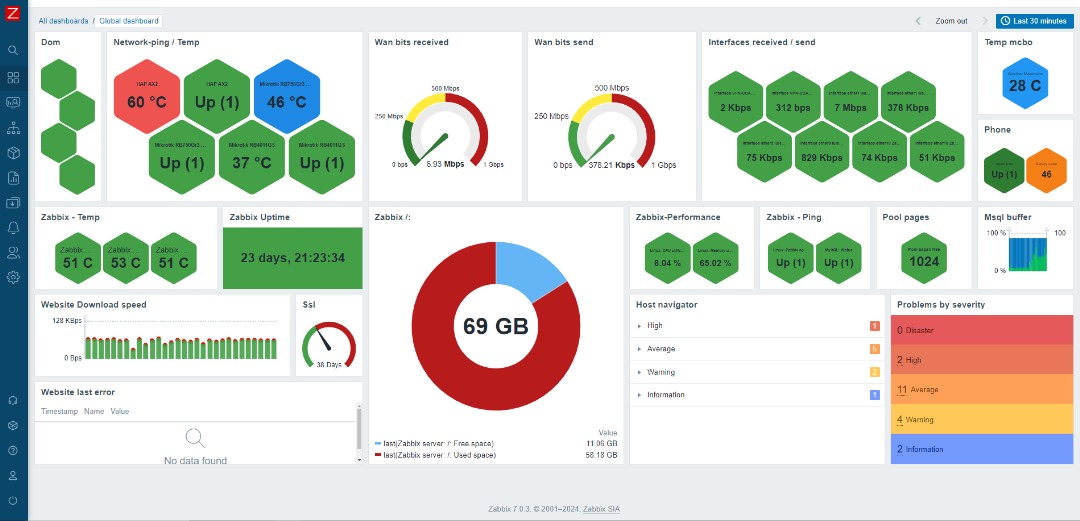
My environment includes ping monitoring for multiple devices (Google Nest, Smart LEDs, Smart Lights, and TV). I also track home network devices: one personal MikroTik router and two belonging to my colleague Alejandro Velasquez, along with the temperature of these devices. Additionally, I monitor WAN consumption from my internet provider, as well as the bandwidth consumption of a connected client, my colleague, and the VPN.

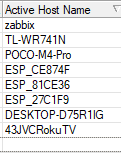
I have a MikroTik and TP-Link router. When I connect the TP-Link to a port on the MikroTik, I can capture information about any devices connected to my home network. Using SNMP v2, I can then retrieve detailed information from these devices. From the WinBox console of the MikroTik router, I can navigate to IP > DHCP Server to locate the active hostnames to monitor.

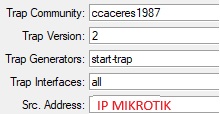
In WinBox, I navigate to IP > SNMP Settings. Here, assign a community name for identification, select SNMP version 2, and enter the IP address of the MikroTik device.

Once configured, I verify from the Zabbix server that communication has been successfully established through the SNMP v2 protocol.

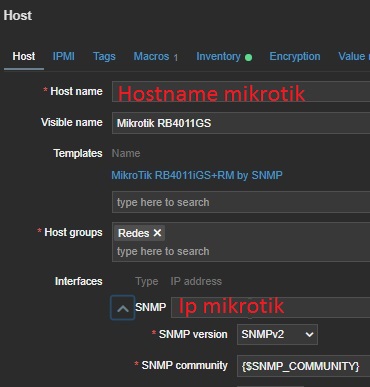
On the Zabbix server, I verify the host name of the device to make sure it’s visible. Since version 6.0, Zabbix includes a template specifically for the RB4011GS device, which simplifies the monitoring process.

Temperature monitoring for my location (Maracaibo, Venezuela) is integrated with OpenWeatherMap. I also monitor my phone using an agent from the Android Play Store. The template for this is available on this GitHub repository, but customization will always depend on individual needs.

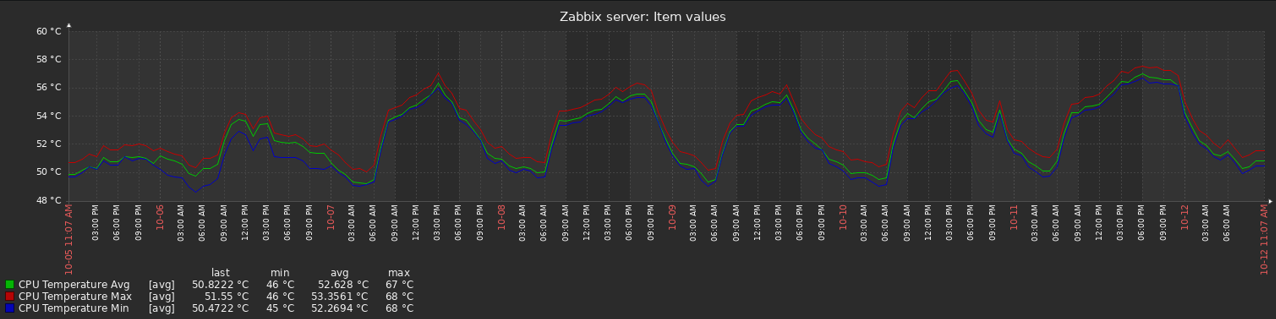
The temperature of my Zabbix Server is monitored using a repository available on GitHub. It’s important to know the operating temperature of the Zabbix server.

If possible, I adjust the default parameters to suit the specific environment.

I also monitor the performance of our Zabbix server and database using the MySQL integration with the Zabbix agent, focusing on key elements like buffer usage.

I track the behavior of my portfolio (ccaceresoln.com) with web scenarios , including certificate monitoring. When querying SSL for my portfolio, I make a folder in the Zabbix server and create a script called checkssl.sh inside it. Then, I grant execution permissions chmod +x to the checkssl.sh script.

In the configuration of these items, the call will be made to the URL. Each hosting provider may automatically generate a new SSL certificate periodically. In my case, I don’t use a trigger for certificate renewal.

On the right side, there is a new widget for navigating based on alerts, which allows me to view more details about these issues.

Alerts

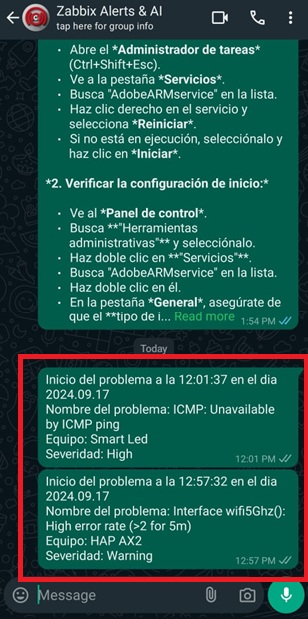
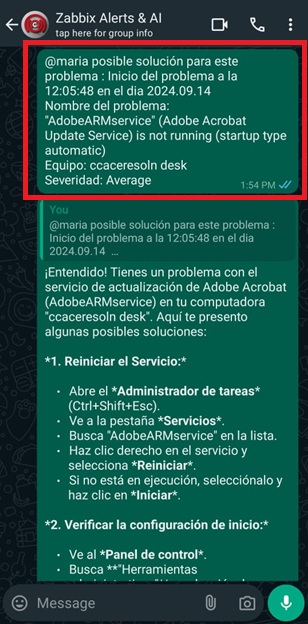
Alerts are delivered through WhatsApp, using a repository available on GitHub. This repository is based on the WhatsApp Web + Multi-Device API library. It’s important to ensure that the Mudslide libraries are up-to-date. Step-by-step instructions can be found in the Zabbix forums.

The assistant is based on a custom GitHub repository, customizing the language model using the Gemini 1.5 API. I chose this because it’s free to use and doesn’t require installation on the server. With the emergence of artificial intelligence, I’m hopeful that this could act as a proof of concept and an idea to help people understand how to resolve such alerts and learn from them. It’s more than just having everything in one place! Why MARIA? MARIA stands for:
M: Machine
A: Assistant
R: Reasoning
I: Intelligence
A: Artificial

Additional features

I had the idea to create a Zabbix song in order to have a sound that greets me every morning. Just a reminder that it’s a new day and Zabbix is here for alerts.
Song with sunoai:

Conclusion

Having a home network monitoring environment offers advantages such as receiving alerts about device status or specific equipment behavior even when you’re away from home. This allows for continuous supervision and proactive issue resolution.

The post Monitoring My Home Network with Zabbix appeared first on Zabbix Blog.
Zabbix Summit 2024 in Review

Post Syndicated from Michael Kammer original https://blog.zabbix.com/zabbix-summit-2024-in-review/28901/

In what has become a highly anticipated annual tradition, Zabbix employees, partners, users, and just plain fans from every corner of the globe showed up in Riga on October 4 and 5 for Zabbix Summit 2024, celebrating a very special open-source monitoring solution that unites us all.

The 12th in-person version of our premier yearly event saw delegates arrive from 48 different countries, and just as every year the atmosphere was like a family reunion, with old friends reconnecting, remote colleagues meeting for the first time in person, and plenty of good vibes all around.

In case you couldn’t manage to make it to Riga and participate, fear not – we’ve put together this post to try to give you a taste of what Zabbix Summit 2024 was all about. As long-time Zabbix veterans say, “There’s nothing like a Zabbix Summit!”

And now, a word from our sponsors

Zabbix Summit 2024 could never have happened without the assistance of our featured sponsors, all part of Zabbix’s official partner network:

initMAX – Diamond Sponsor
IntelliTrend – Platinum Sponsor
IZI-IT – Platinum Sponsor
Quadrata – Platinum Sponsor
Allenta – Gold Sponsor
Metricio – Gold Sponsor
Docomo Business – Gold Sponsor
SRA OSS – Silver Sponsor
Inqbeo – Lunch and coffee break sponsor

Opening doors and minds alike

The day before the Summit, our team welcomed dozens of guests to our office for the traditional pre-Summit Open-Door day. We provided a whiteboard where attendees could leave their thoughts about Zabbix, set up a special Zabbix quiz, and organized a guided tour of the office. Countless questions were asked and answered, endless cups of coffee were poured, and a friendly, welcoming vibe was established that lasted through the end of the Summit and beyond.

Live from the main stage

This year’s Summit hosted 36 speakers who gave 34 speeches. Allowing our audience to ask questions during live Q&A sessions proved so popular last year that there was little doubt we’d continue it this year, as it promotes audience participation and keeps the speakers themselves on their toes. Here are brief recaps of a few of the standout speeches:

Zabbix Cloud and the way forward

Our CEO and Founder Alexei Vladishev kicked off the presentations with a keynote speech that introduced Zabbix Cloud and listed all the features that make it a secure, flexible, and functional alternative to the Zabbix we all know and love. Alexei also gave a short preview of the upcoming Zabbix 7.2 version. Stay tuned!

An intro to Zabbix Cloud

Zabbix Head of Product Dmitrijs Lamberts provided a deeper dive into Zabbix Cloud, sharing detailed information on how Zabbix Cloud works, providing insight into the pricing tiers, and explaining all the features and benefits that have the Zabbix community buzzing with excitement, whetting the audience’s appetite for a live demo he conducted on Day 2 of the Summit.

Using Zabbix to monitor solar energy

Mitsuhiro Ono of the Toyota Motor Corporation and Toshihiro Akamatsu of SRA OSS showed how they achieve distributed monitoring with Zabbix. They also demonstrated a case study that showed exactly how they use their Zabbix dashboard to provide the kind of detailed solar energy oversight that makes the adoption of green power in Japan possible.

Keeping tabs on MariaDB

On Day 2 of the Summit, Anders Karlsson of the MariaDB Corporation discussed how to monitor and manage MariaDB Server Clusters running with the MariaDB MaxScale database proxy. He also demonstrated how MariaDB MaxScale (which also monitors the MariaDB Servers) comes into the picture and touched on topics like managing failover, monitoring database traffic, and routing and load balancing.

Meeting security challenges with Zabbix

Gabriele Minniti and Vincenzo Morrone of Whysecurity demonstrated how the power of the Zabbix API can combine with the APIs of the vendors they work with to create centralized dashbords for controlling the cybersecurity posture of all their customers, no matter what technologies are being used.

The business track

For the first time at Zabbix Summit 2024, we constructed a second stage for slightly less technical, more business-oriented presentations. The speeches delivered there were among the most thought-provoking and fascinating of the Summit, and did much to help us reach new audiences. Here are a few highlights:

An evolving IT monitoring landscape

Zabbix LatAm CEO Luciano Alves gave a well-received talk that focused on the latest trends in the global monitoring market, presenting the results of a survey that took the pulse of over 100 global enterprise organizations.

Zabbix for managed service providers (MSPs)

Andre Morton of AGM Network Consultancy explained why having a flexible and scalable monitoring solution is extremely vital for MSPs and showed how a variety of different features, from authentication mechanisms to automatic remediation and visualization, work together to make Zabbix the perfect monitoring solution for MSPs.

Yes, we still had time for fun!

The Zabbix community works together, innovates together, and when it’s time to let off steam they have fun together at our Summit networking events, of which there were three this year:

  • This year’s welcome event was held at the architecturally stunning National Library of Latvia – or as Latvians call it, “The Castle of Light.” Tasty beverages and delicious food were on the menu, as was a guided tour of the library itself.
  • The main event was held at Riga’s famed Fantadroms Concert and Event Space, where attendees could dance to live music and enjoy more food and drinks as they caught up with friends and forged valuable connections with their counterparts in other organizations.
  • We sent the community on their way with a closing event at the Burzma food hall in Riga’s old town, with a cornucopia of food and music from around the world as well as plenty of opportunities for attendees to relive the Summit, have a few laughs, and wish each other well until next year!

Couldn’t make it this year? No problem!

At this point, you’re probably regretting that you didn’t manage to attend the Summit, but don’t worry – you can recreate the atmosphere in the privacy of your own home or office!

Recordings of both days are available on Zabbix’s YouTube channel:

Streaming – Zabbix Summit 2024 Day 1 
Streaming – Zabbix Summit 2024 Day 2

The slides and texts of the presentations are also available for reference and download here as well.

Whether you attended in person or streamed the Summit online, we hope that you had a great time, learned a lot, and are eager to do it all again in 2025!

The post Zabbix Summit 2024 in Review appeared first on Zabbix Blog.

Blending Zabbix and AI with Tomáš Heřmánek

Post Syndicated from Michael Kammer original https://blog.zabbix.com/blending-zabbix-and-ai-with-tomas-hermanek/28832/

Zabbix Summit 2024 is only a few days away, which means that it’s time for the last of our interviews with Summit speakers. Our final chat this year is with Tomáš Heřmánek, the CEO and Founder of initMAX s.r.o. We asked him about his beginnings in the tech industry, how he got started with Zabbix, and how AI will change the game for monitoring in general and Zabbix in particular.

Please tell us a bit about yourself and the journey that led you to initMAX.

My journey in the IT field started with small ISPs and later took a significant leap into the world of Linux and application management, where the need for effective monitoring became evident. I worked for a company that prioritized high-quality open-source solutions, and it was during this time that we adopted Zabbix version 1.8 as a replacement for Nagios, which we found to be inflexible. Shortly after our deployment, Zabbix 2.0 was released. It introduced JMX monitoring, which was crucial for us. Since then, Zabbix has been our go-to solution for monitoring.

I set a personal goal to master this outstanding monitoring system and participated in the first official Zabbix training in the Czech Republic, where I earned my initial certifications as a Zabbix Specialist and Professional on version 3.0. The training experience drew me deeper into the world of Zabbix, especially after meeting a burgeoning group of enthusiasts in the country. I felt compelled to give back to the community that had supported me.

How long have you been using Zabbix? What kind of Zabbix-related tasks does your team tackle on a daily basis?

When I started my own company, becoming a Zabbix partner was a natural choice. To further contribute to the community, I pursued the Expert and Trainer certifications. It was the most challenging 14 days of my life, but it was worth it. For anyone serious about Zabbix, I highly recommend participating in official training sessions and actively engaging with the community through forums, local groups, Telegram, WhatsApp, blogs, and forums. This commitment to support and strengthen the community further.is also why we created our own wiki, which is accessible to everyone without restrictions.

Can you give us a few clues about what we can expect to hear during your Zabbix Summit presentation?

This year, I have prepared a demonstration for the Zabbix Summit showcasing how we integrate AI into our operations, including various modifications to the web interface that allow us to automate and streamline routine tasks. Besides showcasing these innovations, we will also be making some parts of our work available to the public. The main focus of my presentation will be on problem identification, automating the creation of preprocessing steps, and using a chatbot for creating hosts, reading configurations, and making modifications. Essentially, it’s a smart assistant and guide all in one.

The final section, which we find the most challenging, deals with automated event correlation and the creation of a topology, from which correlations partially derive and evaluate. We are using the new Zabbix 7.0 feature – root cause and symptoms – for visualization in Zabbix. Our goal is to showcase not only the capabilities of Zabbix in combination with AI, but also to contribute back to the community by sharing some of these developments freely.

In your experience, does Zabbix lend itself easily to enhancement via AI?

AI is something that truly fascinates us and is currently shaping the world. From our experience, we believe that the possibilities are limited only by our imagination. In the future, I can envision AI autonomously discovering elements that need to be monitored, integrating them into Zabbix, and configuring everything necessary for effective monitoring.

What changes do you think AI will bring to the world of monitoring in general over the next decade or so?

I foresee a shift in our roles, moving away from traditional IT tasks towards a focus on idea generation, control, and the customization of artificial intelligence. As AI continues to evolve, it will not only enhance automation but also empower us to explore and implement innovative solutions more effectively.

The post Blending Zabbix and AI with Tomáš Heřmánek appeared first on Zabbix Blog.

How a Custom Zabbix Solution Maximized Efficiency for an MSP

Post Syndicated from Kristy Slimmer original https://blog.zabbix.com/how-a-custom-zabbix-solution-maximized-efficiency-for-an-msp/28810/

Discover how our partners at ATS Group designed and implemented a custom Zabbix solution that allowed a large managed service provider (MSP) to monitor and manage a vast array of client devices across multiple data centers.

The Challenge: Addressing Infrastructure Monitoring Complexities

When a federal government contractor specializing in IT managed services secured a contract to manage the infrastructure for a large federal agency, they faced a daunting challenge: how to effectively monitor and manage the vast array of devices under their purview using a single, comprehensive solution.

Real-time monitoring and immediate alerts for any issues were non-negotiable requirements. The sheer scale and complexity of the infrastructure demanded a robust monitoring system capable of providing insights across multiple data centers and diverse technologies.

The MSP, aware of the need for a trusted and experienced partner, turned to ATS Group to tackle the complexities of its observability and management challenge.

The Solution: Architecting a Custom Zabbix Solution

ATS Group, North America’s exclusive Zabbix Premium Partner, brings over two decades of experience in monitoring and optimizing enterprise IT environments. ATS Group architected and implemented a custom solution that leveraged Zabbix’s flexibility and scalability, demonstrating their deep knowledge of the technology and ability to handle complex challenges.

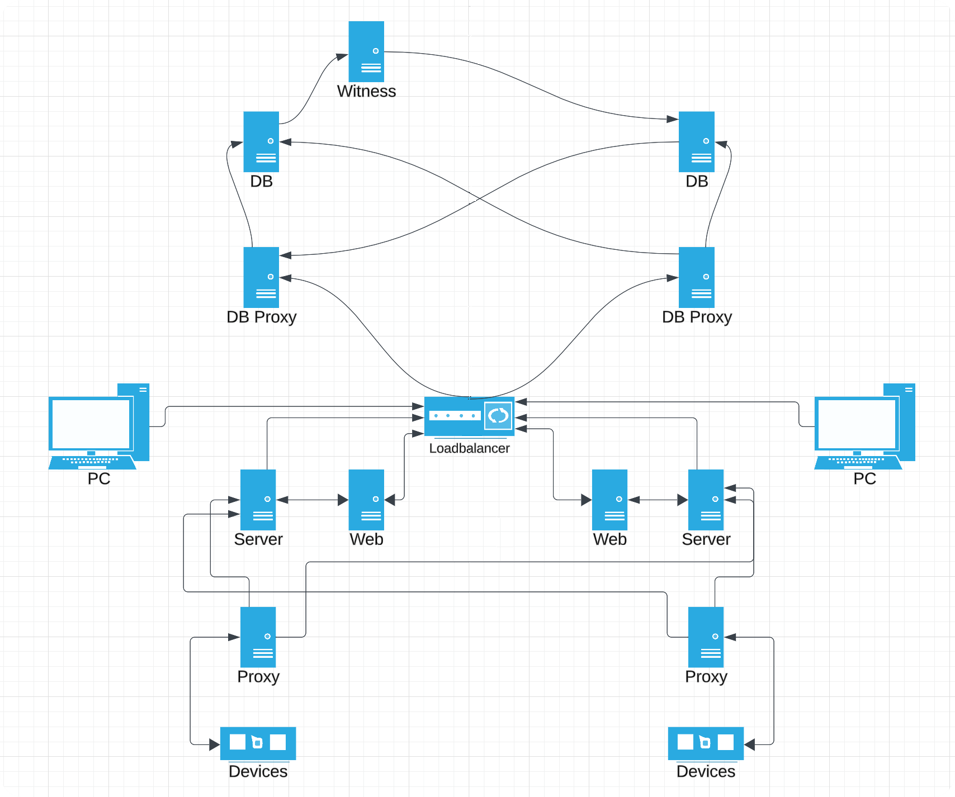
The ATS team deployed an on-premise Zabbix Server, accompanied by Zabbix Proxy Servers placed in each data center. This distributed architecture was a key factor in ensuring seamless monitoring across geographically dispersed environments while minimizing latency, a critical factor in managing such a vast infrastructure.

Custom Zabbix Solutions delivered by the ATS Group

From there, ATS implemented various Zabbix customizations that were integral to meeting the agency’s unique and diverse infrastructure needs, including developing templates and integrations.

Templates. ATS developed numerous templates covering a broad spectrum of technologies (including OpenShift, VMware, Dell, HP, Cisco UCS, Hitachi, NetApp, Pure, Brocade, Commvault, Linux, and Windows) to provide comprehensive monitoring capabilities tailored to the specifics of each component, ensuring a detailed view of the entire infrastructure stack.

Integrations. ATS built customized integrations for several third-party products. An integration with OpenShift allowed for alerts configured within OpenShift to be directly ingested and processed by Zabbix. The integration with VMware allowed Zabbix to detect when an administrator put a host in maintenance in VMware, automatically creating a maintenance period for that host within Zabbix to eliminate unwanted alerts while the host was being serviced.

Finally, integrations with ServiceNow and Operations Bridge Manager (OBM) enabled streamlined incident management workflows, ensuring that issues were promptly detected, triaged, and addressed with minimal manual intervention – and the proper stakeholders were notified within the customer and service provider organizations.

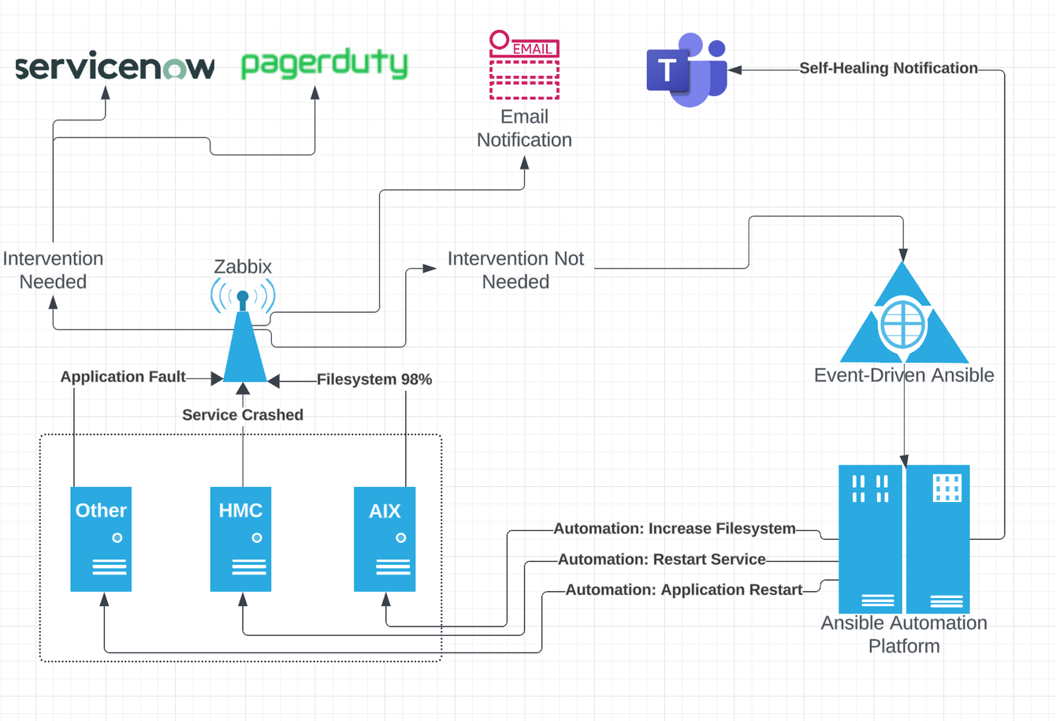
Trigger Actions. ATS implemented custom trigger actions to automate responses to predefined events. Whether restarting a service upon failure or executing remediation scripts, these trigger actions helped maintain system stability, minimize downtime, and reduce the workload (and callouts in the middle of the night!) for system administrators.

Dashboards. ATS designed custom dashboards to provide stakeholders with intuitive, real-time insights into the infrastructure’s health and performance. These dashboards served as a centralized hub, offering a comprehensive view of the entire environment with actionable insights to drive informed decision-making.

The Results

A custom Zabbix solution delivers visibility, streamlined monitoring, proactive management, and enhanced client satisfaction. The impact of the custom Zabbix solution was immediate and profound. By leveraging the power of Zabbix and the expert skill of the ATS team, the MSP gained unprecedented visibility and control over their client’s sprawling infrastructure. The benefits included:

Greater Operational Efficiency. With a unified view of the entire infrastructure and real-time alerts for any issues, our client experienced a significant improvement in operational efficiency. Proactive management and automated responses minimized downtime, allowing resources to be allocated more strategically.

Faster Incident Response. Issues were detected instantaneously, and relevant stakeholders were promptly alerted, enabling swift resolution and minimizing the impact on operations. This streamlined incident response mechanism reduced mean time to resolution (MTTR) and enhanced overall system reliability.

Increased Revenue. Delighted by the efficiency and effectiveness of our client’s management and monitoring capabilities, the end-user federal agency recognized the value of their partnership and expanded the scope of the contract.

This testament to our client’s success underscores the transformative impact of our solution, paving the way for further collaboration and growth opportunities. As a result, ATS Group and the managed services provider continue to expand their partnership and are solving complex infrastructure problems for numerous additional clients.

The post How a Custom Zabbix Solution Maximized Efficiency for an MSP appeared first on Zabbix Blog.

Zabbix for MSPs with Andre Morton

Post Syndicated from Michael Kammer original https://blog.zabbix.com/zabbix-for-msps-with-andre-morton/28748/

To help make sure that everyone’s up to speed with Zabbix Summit 2024 speakers and their topics, we’re continuing our series of interviews with Andre Morton of AGM Network Consultancy LTD. Keep reading to learn how he feels Zabbix can alleviate the typical pain points of managed service providers (MSPs), see how he uses Zabbix to maintain control of his network, and find out what he appreciates most about Zabbix.

Please tell us a bit about yourself and the journey that led you to AGM Network Consultancy LTD.

I started out studying Network Engineering at the University of Greenwich, and then went on to undertake a Masters of Networks and Security at the University of Kent. During my Masters, I was the a one-man IT Team for a Child Care agency spanning the UK. I then went on to work at three small IT companies/MSPs, being the only Network Engineer at each company and managing networks with 80 – 200 customers.

How long have you been using Zabbix? How has it impacted your everyday tasks?

I have been using Zabbix for about 10 years now. At first, I just used it to get insights via SNMP. Then I began using it to create visual troubleshooting aids for myself and non-networking team members. Finally, I began using Zabbix as my main inventory gathering tool for networking and infrastructure devices. When it comes to that, Zabbix has enabled me to control how I want to monitor the network, avoiding vendor limitations and allowing me to build my own scripts to run tests and actions that I would not otherwise be able to do.

Can you give us a few clues about what we can expect to hear during your Zabbix Summit presentation?

I may have to condense some things, as I don’t want to be too technical or take too long! I’ll definitely talk about what drew me to Zabbix, how I used Zabbix to turn problems that require a large amount of attention and time into scripts that can identify the problems and capture the problem states, and how Zabbix dashboards help me to get a clear overview of customer and site problems/general status. I’ll also speak about scripts that we now use to troubleshoot and undertake remote actions, give examples of what the value of the monitoring data is to MSPs before and after the problem, and let everyone in on my upcoming plans for Zabbix, which include webhooks from the map, scripts; Zabbix’s place in our bespoke systems, and network automation.

What, in your opinion, are the biggest pain points MSPs have, and how can Zabbix help alleviate them?

I’d say that there are two big pain points that Zabbix is of assistance with – providing troubleshooting time for big problems, and making sure that historical data is ready for troubleshooting.

What do you appreciate the most about Zabbix in your role?

Zabbix allows me to drastically reduce the amount of administration and troubleshooting that I have to undertake and provides a live inventory of devices (software/firmware details). Thanks to Zabbix, I don’t have to use multiple tools or log into multiple devices to get software and firmware version details.

The post Zabbix for MSPs with Andre Morton appeared first on Zabbix Blog.
Monitoring MariaDB Clusters and MaxScale with Anders Karlsson

Post Syndicated from Michael Kammer original https://blog.zabbix.com/monitoring-mariadb-clusters-and-maxscale-with-anders-karlsson/28718/

The heart and soul of a Zabbix Summit is the wide range of expert speakers who show up each year to share their experience, knowledge, and discoveries. Accordingly, we’re continuing our series of interviews with Summit 2024 speakers by having a chat with MariaDB Sales Engineer Anders Karlsson. He’ll grace our stage at Summit 2024  to talk about his 4 decades of work experience and share how he uses a variety of Zabbix features to monitor MariaDB clusters and MariaDB MaxScale.

Please tell us a bit about yourself and the journey that led you to MariaDB.

I have been working with databases nearly all of my professional life, which is more than 40 years by now. My first IT job was as a system administrator on a development system for Telco equipment running UNIX on a PDP/11 70. This was fun, and I got to use Unix very early (the early 1980’s) and I was also there at the start of the Internet (by emailing through UUCP to the US and then through what was then the Internet).

Following that, I joined another Telco company, which used a rather unknown database technology called Oracle (version 4.1.4). When this company moved their operations from Stockholm (where I lived) to Luxembourg, I decided to leave and look for other opportunities. I heard that Oracle was looking for people and I got a job there as a support engineer. At Oracle I soon got involved with lots of things beyond Tech Support – I was a trainer, a consultant, and eventually a sales engineer.

I left Oracle in the early 1990’s to join a small application development company as a developer, but this really wasn’t for me, so I soon left and joined Informix instead. I was at Informix until 1996 or so and then I worked for some other small companies around the end of the millennium. Next, I joined forces with a couple of old friends to develop a database solution. This wasn’t very successful, and I still needed a job.

I first ended up with TimesTen before they ran out of luck. After a year or so of freelancing, I was approached by an old friend from the Informix days who was now the sales manager for MySQL in Scandinavia. I joined MySQL in 2004 as a sales engineer and was there until Oracle took over. I then worked for a small Swedish startup for a couple of years, but I missed sales engineering, so when I got an offer to join MariaDB in 2012 I said yes.

How long have you been using Zabbix? What kind of Zabbix tasks do you get up to on a daily basis?

I have known about Zabbix and used it occasionally for a while, but while preparing for Zabbix Summit 2024 I have gotten to use it “in anger” a bit more. There are pros and cons to it, but in general I like it. It does have a lot of “Open Source” feel to it, but that is not really an issue for me.

Can you give us a few clues about what we can expect to hear during your Zabbix Summit presentation?

I will focus on monitoring MariaDB Clusters running Galera Cluster and the MariaDB MaxScale database proxy. Monitoring individual MariaDB servers is easy out of the box with Zabbix, but when you have a cluster you have to monitor certain cluster-wide attributes. MariaDB MaxScale keeps track of the state of the server in the cluster in detail and the cluster as whole, and I will show how to pull cluster-wide data from MaxScale using the MaxScale REST/JSON API and how to use that to build triggers and graphs in Zabbix. I will finish up by doing a demo of this with MariaDB MaxScale and a Galera Cluster.

What led you to the topic of Monitoring MariaDB Clusters and MariaDB MaxScale with Zabbix?

The main thing was that although there are community provided Zabbix templates for MariaDB MaxScale, and Galera can be monitored largely by the Zabbix agent, using these typically does not provide as much in terms of cluster-wide monitoring as I would like. It’s important to know how the reads and writes are distributed, what the state of the database cluster is, etc.

How do you see the role of Zabbix in MariaDB in the near future? Are you planning to use it for any other new tasks?

My next goal is to see if I can write a blog for MariaDB on Zabbix monitoring with some emphasis on MariaDB MaxScale.

The post Monitoring MariaDB Clusters and MaxScale with Anders Karlsson appeared first on Zabbix Blog.

Providing Best-in-Class Security with Heather Diaz of fTLD Registry

Post Syndicated from Michael Kammer original https://blog.zabbix.com/providing-best-in-class-security-with-heather-diaz-of-ftld-registry/28585/

As the Vice President of Compliance and Policy at fTLD Registry Services, Heather Diaz is a security expert with over a decade of experience in ensuring the legal, compliance, and strategic alignment of the top-level domains .Bank and .Insurance. She is a compliance and ethics professional and leads the policy and security compliance functions at fTLD.

We sat down with her to learn more about how Zabbix makes her job easier, why she appreciates the inherent flexibility of our solutions, and how she works with our team to help make sure fTLD’s domains are as secure as they can possibly be.

Can you give us a bit of background on fTLD and what it does? What makes your business proposition stand out?

fTLD Registry is the domain authority for .Bank and .Insurance – the most trusted and exclusive domain extensions for banks, insurers, and producers. Our mission is to offer these industry-created and governed domains a shield against cyberattacks and fraud, delivering peace of mind with website and email security.

Since 2011, fTLD Registry has collaborated with experts in cybersecurity, domain security, and the banking and insurance sectors to develop Security Requirements that mitigate cyber threats such as phishing, spoofing, cybersquatting, and man-in-the-middle attacks.

Why is monitoring especially important for fTLD?

Security monitoring is a key value for .Bankers (banks who have switched to .Bank) and our .Insurance customers as well. They receive reporting from our customized Zabbix monitoring system whenever security vulnerabilities are detected. This ensures we provide proactive compliance security monitoring, which allows them to address any findings and keep their .Bank and .Insurance websites and email channels secure.

Are there any specific points you were looking to address with a new monitoring approach?

fTLD has continued to enhance our security requirements for .Bank and .Insurance to address new and evolving cybersecurity threats and provide more secure and trusted online interactions for the financial services sector and their customers. We do this by partnering with Zabbix’s security experts and engineers to make sure our security requirements and monitoring continue to provide best-in-class domain security for .Bank and .Insurance.

Can you please share any business or operational areas that have seen improvements since implementing Zabbix?

Our compliance area has enjoyed having time to engage with .Bank and .Insurance customers to educate them about how to address any security vulnerabilities, as the Zabbix system takes care of sending notifications and warnings to our customers. Not only that, the Zabbix system gives us a dashboard with easy-to-interpret metrics, the ability to generate ad-hoc reporting, and with a number of important data elements integrated, such as customer contact information and their domain status (e.g., live), so our team can always have secure employee access to security monitoring data no matter where in the world we are working. Here are just some of the external interfaces, Agent2 plugins, and custom notifications we developed together with the Zabbix team.

External interfaces:

  • ICANN CZDS (to get a list of zones)
  • Whois (to get zone and registrar details)
  • CRM (to get a list of verification contacts)
  • Marketing system (to get a list of additional zone details)
  • Subdomain discoverer (to discover zone records)

Agent2 plugins

  • DNSSEC plugin (for DNSSEC-related checks)
  • Nameservers plugin (to perform nameserver-related checks)
  • Certificate plugin (to validate TLS ciphers and certificates)
  • Port check plugin (to check what ports are open and verify the security of opened ports)
  • DMARC/SPF plugin (to check presence and validity of DMARC and SPF records)
  • Web redirect plugin (to check validity of HTTP headers and redirects)

Notifications

  • Media types to send compliance reports

Is there anything else you’d like to share about Zabbix and our capabilities?

Zabbix is a great partner for security monitoring, as they’re willing to develop new features to provide a service that meets our exacting business requirements and their support is highly responsive. Most solutions come as they are. With Zabbix, we were able to customize and adapt their solution when new needs came up. My favorite feature is how we provide automated reporting to our customers and key stakeholders – it’s all automated and handled by the Zabbix platform.

The post Providing Best-in-Class Security with Heather Diaz of fTLD Registry appeared first on Zabbix Blog.

Reducing Alert Noise with Birol Yildiz

Post Syndicated from Michael Kammer original https://blog.zabbix.com/reducing-alert-noise-with-birol-yildiz/28643/

Zabbix Summit 2024 is almost here, and we’re giving you a sneak peek into what you can expect to see on our main stage this year via a series of short interviews with a few of the eminent speakers who will grace us with their presence. First up is Birol Yildiz, the CEO and Co-founder of ilert GmbH and a man who is deeply passionate about keeping alert noise and fatigue to a minimum.

Please tell us a bit about yourself and the journey that led you to ilert GmbH.

My journey in the tech industry began with a deep passion for creating solutions that simplify and improve the lives of IT professionals. Before co-founding ilert GmbH, I spent over a decade working in various IT roles, ranging from software development to operations. I noticed that while monitoring systems were becoming increasingly sophisticated, the process of alert management and incident response was lagging behind.

This gap inspired me to create ilert, a platform focused on bridging that divide by optimizing alerting processes and reducing response times. Our goal at ilert has always been to empower teams with the tools they need to stay ahead of incidents, ensuring that their systems run smoothly and efficiently.

How long have you been using Zabbix? What kind of Zabbix-related tasks are you involved in on a daily basis?

Zabbix has been an integral part of ilert since 2018, when we first developed one of our early integrations with the platform. Recognizing its popularity among our customer base, we enhanced this integration in 2020, transforming it into a native integration and solidifying our partnership with Zabbix as a technology partner. Since then, Zabbix has become one of the most popular integrations within ilert.

On a daily basis, my involvement with Zabbix includes overseeing the continued optimization of our integration, ensuring that it meets the evolving needs of our users. I work closely with our development and support teams to identify and implement improvements based on user feedback and the latest developments from Zabbix.

Can you give us a few clues about what we can expect to hear during your Zabbix Summit presentation?

Alert fatigue has long been a significant challenge for the DevOps community, often leading to decreased efficiency and increased stress among professionals. In my presentation, we will explore innovative strategies that leverage AI to mitigate alert noise.

I’ll be discussing how to maximize the efficiency of your incident response process by leveraging Zabbix with advanced alerting and on-call management tools like ilert. I’ll share insights on reducing alert fatigue, improving incident response times, and ensuring that critical alerts reach the right people at the right time.

This talk will be particularly valuable for DevOps engineers looking to optimize their alert management systems and reduce the cognitive load caused by alert fatigue. Zabbix administrators will find it insightful, especially if they are interested in integrating advanced AI techniques into their monitoring workflows to achieve better performance and reliability.

Moreover, AI and machine learning enthusiasts will gain practical knowledge about applying AI in IT monitoring and alerting, making this session a comprehensive resource for anyone looking to advance their alert management strategies.

Reducing alert noise is something that’s on almost everyone’s wish list, but was there any particular incident or aspect of your professional life that made you want to focus on this topic?

Absolutely. There was a specific incident early in my career that left a lasting impact on me. We were using a monitoring system that generated a significant number of alerts, most of which were non-critical. One weekend, a critical issue was buried in a flood of low-priority alerts, leading to a delayed response and significant downtime for the business.

This incident underscored the importance of not just having a monitoring system in place but ensuring that it was configured to minimize noise and prioritize what truly matters. That experience drove me to focus on creating solutions that help teams filter out the noise and respond quickly to what’s really important, which is a core principle behind ilert’s offerings.

Are there any other similar issues that you can envision tackling with Zabbix?

Yes, beyond reducing alert noise, there’s a lot of potential in enhancing the collaboration between teams during incidents. For example, automating incident communication and resolution processes is an area where I see great value. By integrating Zabbix with incident management platforms like ilert, teams can not only reduce noise but also streamline communication, ensuring that the right people are involved at the right time and that resolution steps are clear and actionable.

Another area is optimizing the way multiple on-call teams work together using Zabbix and incident response platforms like ilert. In many organizations, different teams are responsible for specific sets of host groups in Zabbix, and it’s crucial that each team only receives alerts for the services they are directly responsible for. These are just a few examples of how we can continue to evolve our approach to incident management in conjunction with Zabbix.

The post Reducing Alert Noise with Birol Yildiz appeared first on Zabbix Blog.
What’s in Store at Summit ‘24?

Post Syndicated from Michael Kammer original https://blog.zabbix.com/whats-in-store-at-summit-24/28649/

October means different things to different people – it’s springtime in the Southern Hemisphere, autumn in the Northern Hemisphere, and Summit time if you’re a member of the Zabbix community! Summit time, of course, means the biggest of all Zabbix events, gathering the global Zabbix community in one place to have fun together and learn as much as we can from each other. Zabbix Summit 2024 will take place on October 3-5 in Riga at the Radisson Blu Hotel Latvija. Keep reading to find out more about what you can expect this year.

All new main stage presentations

During Zabbix Summit 2024, you’ll be able to catch a variety of presentations from top industry thought leaders. You’ll learn all about the latest Zabbix features, explore use cases from multiple industries, check out the latest integrations, and have the chance to get your questions answered during live Q&A sessions.

The Summit agenda will feature speeches on nearly any Zabbix-related topic that you can imagine, but this year we’ll also have a fresh focus on the potential of artificial intelligence, with presentations on topics like “New Approaches to Reduce Alert Noise with Zabbix and AIOps” and “Leveraging AI for Synthetic Web Monitoring” as well as a more business-focused group of speeches covering topics related to open-source integration and Zabbix for MSPs.

Hands-on learning in Zabbix Summit workshops

Zabbix Summit workshops are the ideal place to put the theory you learn during presentations into practice. You can check out the latest features and use cases in action, while performing a variety of real-world tasks under the guidance of workshop hosts and their assistants – many of whom are also featured presenters at this year’s Summit.

All you’ll need to do is bring your own laptop – depending on the topic covered in the particular workshop, an SSH client and a web browser may also be required. All workshop sessions will take place on the morning of October 5 (Day 2 of the Summit) and will begin at 10AM.

Zabbix Certified Training sessions and exams

Do you have a lifetime of monitoring experience, but are too shy to let everyone know it? When you attend Zabbix Summit 2024, you’ll be able to prove your skills as a Zabbix specialist or professional by taking part in Zabbix Certified Training sessions and exams. If you’re looking for more specific topics to dive into, the following one-day courses will also be held from October 2 through October 4:

  • Automation and Integration with Zabbix API
  • Advanced Problem and Anomaly Detection with Zabbix
  • Advanced Zabbix Data Pre-Processing
  • Advanced Zabbix SNMP Monitoring

If you don’t mind extending your stay in Riga just a bit longer (and seriously, why would you?), you’ll also be able to take the full Zabbix Certified Specialist or Professional courses scheduled for October 9-13. Please remember that you can choose more than one training course, and it’s possible to attend the courses (without the 10% Summit discount) even if you’re not attending the Summit.

You can sign up for all training sessions and exams here.

The Zabbix Summit Feedback and Testimonial corner

Just as at last year’s Summit, you’ll be able to share your Zabbix story with the rest of the Zabbix community at our Feedback and Testimonial corner. Sharing a testimonial or leaving a review will give you a chance to collect a piece of exclusive Zabbix Summit 2024 merchandise!

Exclusive items, cool new designs, and unique gadgets at our merchandise shop

Speaking of merch, you’ll be pleased to know that not only will exclusive Zabbix Summit merchandise be available at a special stand throughout the event, but we’ll also have an online platform that will allow you to pre-order your merchandise and pick it up at the Summit. We’ve got 5 exclusive new t-shirt designs, 4 fresh sock designs, brand-new beanies, and the usual assortment of gadgets, hoodies, and other merch that our fans have come to know and love – most of which has also gotten a new look for this year’s Summit as well.

Three incredible Zabbix Summit 2024 networking events

There’s a lot to take in and consider at a Zabbix Summit, but don’t worry – we’ve also made sure to give you plenty of time to network with your fellow Zabbix fans by organizing three big events that you won’t want to miss!

  • The Zabbix Summit 2024 welcome event will be held at the famous National Library of Latvia – or as Latvians call it, “The Castle of Light.” You’ll enjoy tasty beverages, delicious food, and a guided tour of the library as you mingle with fellow Zabbix enthusiasts and industry experts, making this the perfect way to kick off this year’s Summit.
  • You’ll want to prepare yourself for a truly unforgettable experience as the Zabbix Summit main event unfolds. We’re sure that you’ll find Riga’s famous Fantadroms Concert and Event Space to be the ideal place to forge valuable connections with like-minded professionals – while indulging in a unique array of culinary delights, refreshing beverages, and great music.
  • After all that, we’ll send you on your way with a closing event that will be the perfect grand finale to a Summit that you won’t soon forget! Located in the heart of Old Riga, Burzma is a food hall that spans 1,500 square meters across the entire fourth floor of a bustling shopping mall. With stunning rooftop views to inspire your dining experience, Burzma offers 10 restaurants and a bar serving up a diverse range of culinary delights.

A chance to see where the magic happens during our Open-Door day

In what has become a popular tradition, Zabbix will host an Open-Door day on Thursday, October 3 from 1PM to 3PM local time. You’ll be able to chat with Zabbix team members, tour our headquarters, and take part in a fun activity designed to help you learn more about Zabbix.

Booths galore!

As usual, the Zabbix team will have multiple booths in the conference hall where you can meet our engineers and developers and get your questions answered by the people who know best. Our Summit sponsors will have booths of their own as well, where you can enjoy a unique opportunity to interact with them on a personal level and get the lowdown on the solutions they offer.

Special events for support customers

All Zabbix support customers are invited to meet our team at a special Zabbix client lunch on October 3 at 14:00 (EEST), with the exact location to be announced at a later date. What’s more, Enterprise and Global support customers are also invited to the Zabbix roadmap Q&A session with Zabbix CEO and Founder Alexei Vladishev on October 5 at 10AM. You’ll learn about our software development plans and be able to raise questions or make suggestions based on your experience – definitely an opportunity you won’t want to miss!

Which Zabbix Summit ticket is right for you?

If you want to enjoy the full Zabbix Summit experience (conference, accommodation, food, even airport transfers), the Full Participation ticket package is definitely for you.

For loyal users who have contributed so much to our product over the years, the Zabbix Fan package is definitely the way to go – it includes everything you’ll get with the Full Participation package, plus a special official fan package that will guarantee you bragging rights in your office once you return from Riga.

If you’re only there for the sessions, the Hall only pass is ideal. If you enjoy both learning and networking with our team and enthusiasts from around the world, we think you’ll find the Hall and Networking pass to be perfect for your needs.

Want to bring a friend or partner along to the summit? No problem — get a Zabbix Summit Travel Companion pass for them so you can stay together and attend networking events, while we handle the rest of their Riga experience.

The Companion pass includes 3 nights’ accommodation in the Radisson Blu Latvija hotel (in the same room as the Summit attendee), 3 breakfasts, and 3 networking events, but that’s not all – we’ll also include an exclusive tour of Riga on October 4 with an English-speaking guide.

The tour features a visit to the Ethnographic Open-Air Museum of Latvia, and runs from approximately 10AM to 4PM, including lunch and some workshop activities at the museum. You can learn more about the museum here.

Visit this page to sign up for the ticket package of your choice.

Livestreaming on YouTube

We hope to see you soon in Riga, but if you can’t make it, don’t worry – as in previous years, we’re going to be livestreaming the speeches on our YouTube channel! Stay tuned for more details.

The post What’s in Store at Summit ‘24? appeared first on Zabbix Blog.
Celebrating the community: Isabel

Post Syndicated from Sophie Ashford original https://www.raspberrypi.org/blog/celebrating-the-community-isabel/

One of our favourite things is sharing the stories of amazing young people, volunteers, and educators who are using their passion for technology to create positive change in the world around them.

Recently, we had the pleasure of speaking with Isabel, a computer science teacher at Barton Peveril Sixth Form College in Eastleigh, England. She told us her fascinating journey from industry to education, along with how she is helping to make the tech space inviting to all.

From industry to the classroom: Isabel’s journey to encourage diversity in tech

Isabel’s path to working in the tech sector started with her early exposure to engineering thanks to her father’s career in telecoms.

“I find this is true for a lot of female engineers my age: you will find that their dad or their uncle was an engineer. I remember that when I made the decision to study engineering, my teachers asked me if I was sure that it was something I wanted to do.”

Isabel pursued a degree in engineering because she loved the technical aspects, and during her studies she found a passion for programming. She went to work as a software engineer in Hampshire, contributing to the development of 3G mobile phone technology.

Despite enjoying her career in tech, Isabel felt a strong pull towards teaching due to her long-standing involvement with youth groups and a desire to give back to the community.

“While I was at university in London, I took part in a scheme where we could go into local primary schools and help with their science teaching. At the time, I just thought this was my way of giving back, I hadn’t really thought of it as a career. But actually, after a while, I thought ‘I’m enjoying this programming, but I really liked helping the young kids as well’.”

The transition wasn’t easy, as Computer Science was not widely taught in schools at the time, but Isabel persevered, teaching IT and Media to her classes as well.

Once Isabel settled into her teaching role, she began thinking about how she could tackle a problem she noticed in the STEM field.

Championing diversity in tech

Having experienced first-hand what it was like to be the only woman in STEM spaces, Isabel’s commitment to diversity in technology is at the core of her teaching philosophy. She works hard to create an inclusive environment and a diversity of opportunities in her classroom, making sure girls feel encouraged to pursue careers in tech through exploring various enrichment activities.

Two educators at a desk using their computers.

Isabel focuses on enrichment activities that bridge the gap between academic learning and real-world application. She runs various projects and competitions, ensuring a balanced representation of girls in these initiatives, and gives her students the opportunity to participate in programs like the Industrial Cadets, Student Robotics, and Coolest Projects

Isabel told us that she feels these opportunities provide essential soft skills that are crucial for success in any career.

“The A level environment is so academic; it is heavily focused on working on your own on very abstract topics. Having worked in industry and knowing the need to collaborate, I found that really hard. So I’ve always made sure to do lots of projects with my students where we actually work with real engineers, do real-world projects. I believe strongly in teaching soft skills like team working, project management, and time management.”

Harnessing trusted resources

A key resource in Isabel’s teaching toolkit is the Ada Computer Science platform. She values its reliability and the timely updates to the topics, which are crucial in a rapidly evolving subject like Computer Science.

She said she encourages both her students and fellow teachers, especially those who have retrained in Computer Science, to use the platform as a resource. 

“Ada Computer Science is amazing. We know we can rely on saying to the students ‘look on Ada, the information will be correct’ because I trust the people creating the resources. And we even found ourselves as teachers double-checking things on there. We struggle to get Computer science teachers, so actually only two of us are Computer Science teachers, and the other three are Maths teachers we have trained up. To be able to say ‘if you are not sure about something, look on Ada’ is a really nice thing to have.”

A large group of educators at a workshop.

The ongoing challenge and hope for the future

Despite her efforts, Isabel acknowledges that progress in getting more girls to pursue tech careers is slow. Many girls still view tech as an uninviting space and feel like they don’t belong when they find themselves as one of a few girls — if not the only one — in a class. But Isabel remains hopeful that continuous exposure and positive experiences can change these perceptions.

“I talk to students who are often the only girl in the class and they find that really hard. So, if at GCSE they are the only girl in the class, they won’t do [the subject] at A level. So, if we leave it until A level, it is almost too late. Because of this, I try as much as I can to get as many girls as possible onto my engineering enrichment projects to show them as many opportunities in engineering as possible early on.”

Her work with organisations like the UK Electronics Skills Foundation reflects her commitment to raising awareness about careers in electronics and engineering. Through her outreach and enrichment projects, Isabel educates younger students about the opportunities in these fields, hoping to inspire more girls to consider them as viable career paths.

Looking ahead

As new technology continues to be built, Isabel recognises the challenges in keeping up with rapid changes, especially with fields like artificial intelligence (AI). She stays updated through continuous learning and collaborating with her peers, and encourages her students to be adaptable and open to new developments. “The world of AI is both exciting and daunting,” she admits. “We need to prepare our students for a future that we can hardly predict.”

Isabel’s dedication to teaching, her advocacy for diversity, and her efforts to provide real-world learning opportunities make her an inspiring educator. Her commitment was recognised by the Era Foundation in 2023: Isabel was named as one of their David Clark Prize recipients. The award recognises those who “have gone above and beyond the curriculum to inspire students and showcase real-world engineering in the classroom”.

A woman receives a certificate of recognition.

Isabel not only imparts technical knowledge — she inspires her students to believe in their potential, encouraging a new generation of diverse tech professionals. 

If Isabel’s story has inspired you to encourage the next generation of young tech creators, check out the free teaching and training resources we provide to support your journey.

If you are working in Computer Science teaching for learners age 14 and up, take a look at how Ada Computer Science will support you. 

The post Celebrating the community: Isabel appeared first on Raspberry Pi Foundation.

Open-Source Security: The Zabbix Advantage

Post Syndicated from Michael Kammer original https://blog.zabbix.com/open-source-security-the-zabbix-advantage/28523/

At Zabbix, we’ve championed the open-source movement, with its emphasis on openness, transparency, and cooperation, from day one. Because of this, prospective customers and partners often have questions about the security of our product – the fear being that open-source software is somehow less secure than proprietary software.

In this post, we’ll provide a bit of background regarding how open-source software works, explain why fears about the security of open-source software are largely unfounded, and provide an overview of how the Zabbix team works to make sure that our product is as secure as it can possibly be.

A short open-source primer

At its most basic, open-source software is code that is available for anyone to modify and share in either its original or modified forms. It lets developers share their work without the restrictions of a proprietary license. The open-source movement is based on collaborative development and encourages the creation of high-quality software by tapping into the creativity and enthusiasm of a global community of developers.

Zabbix itself is an open-source solution covered by the GNU Affero General Public License version 3 (AGPLv3). The Zabbix source code is readily available and can be redistributed or modified – anyone with a great idea can create their own version of Zabbix. Apart from Zabbix, many well-known and widely used software solutions have emerged from the open-source movement, including Mozilla’s Firefox browser, the WordPress content management system, VLC Media Player, and the Linux operating system.

Open-source software and security

Data security is an issue that unites every company (and therefore every potential partner or client). Developers are constantly on the lookout for solutions that follow up-to-the-minute data and application security best practices in order to reduce risk and give users the most secure experience possible.

A common debate among both users and developers is whether open-source software is secure enough when compared to closed source alternatives. The good news is that there are massive efforts underway to help make sure that the open-source community is as safe as possible.

The Linux Foundation’s Community Health Analytics Open Source Software (CHAOSS) is a project that’s focused on creating a standard set of metrics and software to help define open source community health, and its GrimoireLab tool in particular makes it much easier for open-source projects to analyze and report their community health metrics.

Opinions vary regarding what makes for a truly secure environment, but quite possibly the biggest security advantage of open-source software is its transparency.

If you see something, say something

Open-source code is available for anyone to review, modify, and distribute. “Hold up,” you may be thinking – “If someone can see the whole code, can’t they just take advantage of a vulnerability if they see it?” The answer is that someone could certainly exploit a vulnerability, but because everybody can also see the code, there’s a far higher probability that someone else has also noticed the vulnerability in question and taken steps to correct it.

With open-source code, it’s usually much easier to get in touch with the developers and report issues directly to them than it is with a closed source project. This means a faster resolution of most security issues. Not only that, because the public is often allowed and encouraged to submit code improvements directly to the developers, anyone could submit the code to fix a vulnerability as a part of them reporting an issue. This leads to rigorous security scrutiny, with many eyes on the code, identifying and reporting vulnerabilities.

Think of it as the equivalent of a “neighborhood watch” program, in which organized groups of civilians devote themselves to crime and vandalism prevention within a neighborhood, ultimately making it safer and more secure for everyone.

No “waiting game” for updates

With standard closed source (or proprietary) software, users are completely at the mercy of the companies behind the software when it comes to getting software updates. Updates and fixes for high-profile closed source applications usually involve a great deal of complicated planning, and if there’s no budget or resources available, users might go months or even years before they see a new update, whether there are glaring security flaws or not.

Open-source solutions are also more agile when it comes to iterating and releasing new versions. This is down to any number of reasons, including the fact that open-source software has more eyes on the source code at any given time, plus a community-driven interest in making the product as good as it can be.

The Zabbix advantage

At Zabbix, we’ve long benefited from the inherent security advantages of being open-source. Because we’re enterprise-level open-source software, we’ve been able to adopt a “best of both worlds” approach that combines the flexibility and community policing of open-source with the knowledge that only a dedicated team of in-house security experts and robust security policies can provide.

If a member of our community notices a security vulnerability, the best way to make sure that it gets fixed as quickly as possible if for them to create a new issue in the Zabbix Security Reports (ZBXSEC) section of the public bug tracker, describing the problem (and a proposed solution if possible) in detail. This helps us make sure that only the Zabbix security team and the reporter have access to the case.

At that point, the Zabbix Security team reviews the issue and evaluates its potential impact. The team then works on the issue to provide a solution, creating new packages and making them available for download. Clients with support agreements are informed about security vulnerabilities that have been addressed and fixed, and given a window of opportunity to upgrade before the issue becomes known to the public. After that, a public announcement for the community is made.

Another potential security risk involves complex dependencies on other open-source libraries, where each dependency can introduce vulnerabilities if not properly managed. A perfect example of this is 2023’s repojacking attack on GitHub, in which a critical vulnerability in an open-source repository led to the exposure of over 4,000 other repositories.

To minimize the possibility of these supply chain attacks, we use tools that can generate an SBOM (Software Bill of Materials), which is basically a list of ingredients that make up software components. This makes it easy to keep track of each individual ingredient and take appropriate actions in the event of a red flag. What’s more, the fact that our clients are the sole owners of their data eliminates another potential source of security issues – unlike with other software vendors, there is no risk of an attacker accessing systems running Zabbix.

As an additional line of defense, we work with HackerOne, the world’s leading platform for ethical hackers, to maintain a Zabbix-specific bug bounty program that challenges the world’s most elite ethical hackers to find the weak spots in our code and let us know about them in time to fix them. We’re proud of the way that our community has done their part to help us make Zabbix as secure as possible, and we’re confident that with a few refinements we can pay out even more bug bounties in the future.

To learn more about the Zabbix approach to open-source security, please visit our website or get in touch with us.

The post Open-Source Security: The Zabbix Advantage appeared first on Zabbix Blog.

Elevating Code Quality: Real-Time Insights with Zabbix Integration and SonarQube

Post Syndicated from Benyamine Elmahir original https://blog.zabbix.com/elevating-code-quality-real-time-insights-with-zabbix-and-sonarqube/28452/

The objective of this project was to establish a robust and integrated environment for the continuous monitoring of code quality and performance metrics. To achieve this, SonarQube, an open-source platform for the continuous inspection of code quality, was installed on AlmaLinux. Following its setup, SonarQube was seamlessly integrated with Zabbix, an enterprise-class open-source distributed monitoring solution, to enable the dynamic monitoring of various projects. This integration aimed to provide our team at Zen Networks with real-time visibility into key metrics such as bugs, vulnerabilities, and code smells for ongoing projects.

Installing SonarQube on AlmaLinux

1. Pre-installation Requirements:
  • We conducted a detailed review to ensure that the server met the minimum hardware requirements for running SonarQube effectively.
  • Necessary dependencies, including Java Development Kit (JDK) and a supported database system, were installed and configured.
2. SonarQube Installation Steps:
  • The SonarQube server was downloaded from the official website.
  • Following best practices, a dedicated SonarQube user account was created for running the service.
  • The SonarQube service was configured to start on boot, ensuring high availability.
3. Configuration:
  • The sonar.properties file was meticulously edited to connect SonarQube to the chosen database, optimizing for performance and security.
  • Network settings were adjusted to allow SonarQube to run on the desired port (9000) and be accessible from the developer’s workstations.
  • Additional plugins were installed to extend the functionality of SonarQube and to support the languages used in our projects.

Project Setup in SonarQube

Upon successful installation and configuration of SonarQube on the AlmaLinux server, the next phase involved setting up projects for code analysis. Five test projects were created to demonstrate the capabilities of SonarQube and serve as a baseline for quality assessment.

Creation of Test Projects:
  • We created a series of five distinct projects, namely app-java, backup-code, erp-app, test-app, and web-app, each configured within SonarQube.
  • The projects were configured to assess various aspects of code quality, including reliability, security, and maintainability.
  • We enabled the automated scanning of code to identify bugs, vulnerabilities, and code smells within each project.
Analysis and Metrics:
  • Each project underwent a thorough analysis, with results indicating varying levels of bugs and vulnerabilities alongside code smells.
  • Metrics such as coverage and duplication were configured to be monitored, though the initial test runs reflected 0.0% coverage, indicating a scope for further CI/CD integration.
  • The test-app project notably showed a substantial number of bugs and a significant code smell count, highlighting areas for immediate improvement.
Quality Gate Status:
  • All projects were set against predefined quality gates to ensure they met the organization’s standards for code quality.
  • Despite some projects having bugs and code smells, all projects passed the quality gates, suggesting that non-critical issues were identified, which would be addressed in an ongoing manner.

Integration with Zabbix

The integration of SonarQube with Zabbix was aimed at leveraging Zabbix’s robust monitoring capabilities to keep a close eye on the projects’ health status in terms of code quality.

Zabbix Template Creation:

Our team built a Zabbix template dedicated to interfacing with the SonarQube API and designed to auto-discover SonarQube projects and their key metrics. For integrating Zabbix with the SonarQube API and enabling the auto-discovery of projects and key metrics, the following API calls and configurations were used:

Authentication:
    • Example API call to authenticate:
    • curl -u token: “http://sonarqube_ip/api/authentication/validate”
Project Discovery:
    • Example API call to list projects:
    • curl -u token: “http://sonarqube_ip/api/projects/search”
Metrics Retrieval:
    • Example API call to get project metrics:
    • curl -u token: “http://sonarqube_ip/api/measures/component?component=project_key&metricKeys=bugs,vulnerabilities,code_smells”
Zabbix Template Configuration:
    • A customized Zabbix template was created to interface with the SonarQube API. The template includes discovery rules, item prototypes, and preprocessing steps to extract relevant metrics.
    • Example of a discovery rule and item prototype in the Zabbix template:
<discovery_rule>
<name>sonarqube_project_discovery</name>
<type>HTTP_AGENT</type>
<key>sonarqube.project.discovery</key>
<delay>1h</delay>
<lifetime>3d</lifetime>
<item_prototypes>
<item_prototype>
<name>{#PROJECTNAME}: Metrics</name>
<type>HTTP_AGENT</type>
<key>sonarqube.project.metrics['{#PROJECTNAME}']</key>
<delay>5m</delay>
<url>{$PROTO}://{HOST.IP}:{$PORT}/api/measures/component?
component={#PROJECTNAME}&metricKeys=bugs,vulnerabilities,
code_smells,ncloc,complexity,violations</url>
<headers>
<header>
<name>Authorization</name>
<value>Basic YOUR_BASE64_ENCODED_TOKEN</value>
</header>
</headers>
</item_prototype>
</item_prototypes>
</discovery_rule>

In addition, our team set up items within Zabbix to track the number of bugs, vulnerabilities, and code smells, as presented in the SonarQube dashboard. We also configured triggers within Zabbix to alert the team when certain thresholds were reached, facilitating prompt action to maintain code quality.

Automation and Dynamic Monitoring:

We enabled the dynamic discovery of projects in SonarQube, allowing for new projects to be automatically detected and monitored without manual intervention. To enable the dynamic discovery of projects in SonarQube and ensure they are automatically detected and monitored by Zabbix, we implemented the following configurations:

  • SonarQube Configuration:
    • Webhooks: Configured SonarQube webhooks to notify Zabbix whenever a new project is created or updated.
    • Project Tags: Used consistent tagging for SonarQube projects to facilitate easy identification in Zabbix.
  • Zabbix Configuration:
    • Discovery Rules: Created discovery rules in Zabbix that periodically query the SonarQube API to check for new projects.
    • Low-Level Discovery (LLD): Implemented LLD in Zabbix to automate the creation of items, triggers, and graphs for each new SonarQube project.
    • We also established a data flow between SonarQube and Zabbix, ensuring that updates in the code quality metrics were reflected in real time on the Zabbix dashboard.
Validation and Testing:
      • We conducted a series of tests to ensure that the integration was functioning correctly.
      • Our team verified that metrics reported in SonarQube matched those displayed in Zabbix, confirming the accuracy and reliability of the monitoring setup.

With the projects and metrics being actively monitored, the focus shifted to presenting the data effectively. A custom dashboard was created in Zabbix to aggregate and display the information gleaned from SonarQube.

Design and Layout:

We created a user-friendly dashboard to provide a quick overview of the status of all projects.

  • The dashboard was organized to show metrics such as the number of bugs, vulnerabilities, code smells, and the Quality Gate status of each project at a glance.
  • Particular attention was paid to visual hierarchy and layout, ensuring that the most critical metrics were immediately visible.

Custom Widgets and Visualizations:

Widgets were customized for each key metric to enhance readability and instant understanding of the project statuses.
Visual indicators, such as color-coded status icons and progress bars, were incorporated to give a clear visual cue about the health of each project.

Real-time Data Representation:

W configured the dashboard to refresh at regular intervals, providing real-time updates to the development team.
Ensured that the most current data was always available, enabling a proactive approach to quality assurance and code health.

Results and Benefits

The integration of SonarQube with Zabbix and the creation of a dedicated dashboard yielded significant benefits for development workflow and project management.

Improved Code Quality Monitoring:
  • The real-time monitoring of code quality metrics allowed for quicker identification and resolution of issues.
  • Developers received immediate feedback on the quality of their code, fostering a culture of quality-first in the development process.
Enhanced Visibility:
  • The Zabbix dashboard provided a centralized view of the health status of all projects, enhancing visibility for both developers and management.
  • Critical issues could be identified at a glance, allowing for prioritization and resource allocation to address the most pressing problems.
Streamlined Workflow:
  • Automated project discovery and monitoring reduced manual overhead, allowing developers to focus on coding rather than reporting.
  • Alerts and notifications from Zabbix ensured that no critical issues went unnoticed.
Decision-making Support:
  • The collected data and trends visible on the dashboard supported informed decision-making regarding code quality improvements and technical debt management.
  • The ability to track historical data enabled the team to measure the impact of implemented changes over time.
Proactive Issue Management:
  • The early detection of bugs and vulnerabilities allowed the team to address issues before they escalated, reducing potential risks to project timelines and quality.
  • The Quality Gate statuses helped maintain a consistent standard of code quality across all projects.

Special thanks to the team at Zen Networks (Oumaima Naami, Karim Chadil, and Fayçal Noushi) for their work on this project.


The post Elevating Code Quality: Real-Time Insights with Zabbix Integration and SonarQube appeared first on Zabbix Blog.
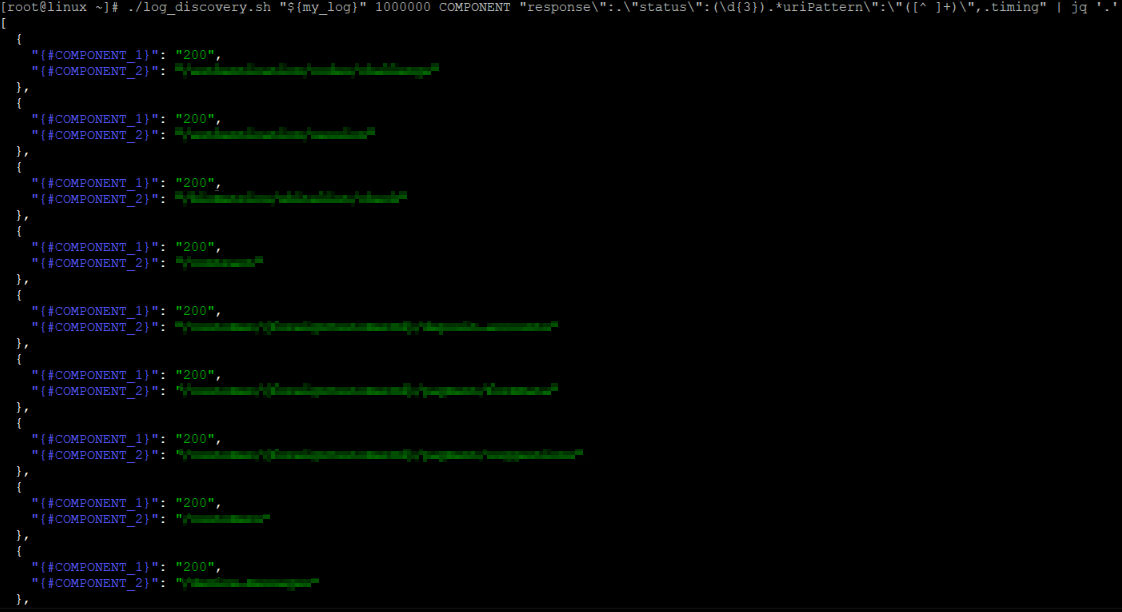
Monitoring Self-Service Markets with Zabbix and IoT

Post Syndicated from Aurea Araujo original https://blog.zabbix.com/monitoring-self-service-markets-with-zabbix-and-iot/28422/

QU!CK Scan & Go, a startup specializing in self-service markets, required a monitoring system that could allow a comprehensive view of operations. Read on to see how Zabbix provided them with a solution that positively impacted their operations as well as their finances.

The convenience of having access to an establishment supplying staple foods around the clock is the motivating factor behind the rise of QU!CK Scan & Go. Since 2021, QU!CK Scan & Go has been developing self-service mini market systems, available in residential complexes and corporate buildings.

Available 24 hours a day, 7 days a week, the technology developed by QU!CK Scan & Go allows markets to be open at all times, with 100% self-service. Customers select the products they want, confirm the price by scanning a barcode, and complete the purchase in their own app with a credit card or virtual wallet.

QU!CK Scan & Go was the first company in the self-service market segment to operate in Argentina. As of this writing, they have 25 self-service stores located in Argentina and 2 in the United States.

The challenge

With the rapid growth in their business, QU!CK Scan & Go needed to be able to easily visualize operations in order to handle environmental issues and avoid product loss due to external factors. In the event of a power outage, for instance, refrigerators and freezers will fail to function, a problem that may take considerable time and effort to fix.

This scenario  isn’t an abstract hypothetical – power outages are a recurring issue in Argentina. In 2021 and 2022, the average length of a power outage was 5 hours. For freezers storing products such as ice cream, frozen processed foods, and other perishable items, that’s more than enough time for the products to thaw and become unusable, resulting in severe financial losses.

The solution

QU!CK Scan & Go’s search for a solution led them to Zabbix by way of CTL Information Technology, a Zabbix Certified Partner in Argentina.  Juan Guido Camaño, CEO of CTL, immediately grasped the fact that Zabbix provided the perfect solution for what QU!CK Scan & Go needed to monitor.

“Zabbix was our first, second and third choice, due to our extensive experience with the tool. We did not believe that there would be any better alternative.”

– Juan Guido Camaño, CEO of CTL

At the beginning of the implementation project, CTL identified all possible variables necessary for monitoring that should generate alarms in the case of an extraordinary event. These included:

  • Power outages
  • Internet connection status
  • Opened doors
  • Ambient and air conditioning temperatures
  • Refrigerator and freezer temperatures

In 2021 and 2022, the team at CTL carried out the proof of concept and the implementation of the tool in the first self-service markets, following a stage-by-stage plan.

First, they had to configure the Zabbix Agent on the monitoring device. After that, we created a standard monitoring model to be used in all establishments, according to data collection and alarm triggering needs. The alarms were subsequently adjusted, with possible responses implemented according to each variable identified. At that point, data visualization was organized in an external system just for reviewing the integrated dashboards.

Thanks to the implementation of IoT devices to control the temperature and the opening and closing of doors, alerts are sent to Zabbix in the event of unusual activity, such as very high or low temperatures, doors opened without supervision, and refrigerator doors open longer than the stipulated time, among other issues.

The results

Since the implementation of Zabbix project in QU!CK Scan & Go’s self-service markets, a variety of benefits have been apparent, including:

  • Increased control of self-service establishments
  • Faster resolution of incidents
  • Improved visualization of operations
  • Increased availability of services

However, the biggest returns on investment were observed at the financial level. With power outage monitoring and quick corrective actions, losses of perishable products have decreased by 75%.

“Losses of refrigerated products ceased to be an issue due to constant monitoring and immediate alerts in case of incidents during power outages.” – Juan Guido Camaño, CEO of CTL

Additionally, with real-time visualization of operations and business monitoring, the profitability of refrigerated products during power outage incidents has increased by 100%. Currently, QU!CK Scan & Go is the leading company in the self-service market segment in Argentina in terms of turnover, with a rapidly increased brand value.

“In a 100% self-service business model, investments made in incident identification technologies have a direct impact on the company’s results.” – Marcos Acuña, QU!CK Scan & Go

What’s next

While successful, the Zabbix project carried out by CTL and QU!CK Scan & Go is far from finished. The implementation of Zabbix in the company is accelerating at the same rate that new establishments are opened, and the proposal is to continue expanding this monitoring project by completely migrating data visualization to Zabbix.

“Having already managed to ensure the availability of the services associated with QU!CK operations, we are now focusing on the continuous infrastructure optimization.” – Juan Guido Camaño, CEO of CTL

For QU!CK Scan & Go, Zabbix has become much more than an IT infrastructure monitoring provider. Our solutions have improved their business and brought added value to their brand.

“With Zabbix, the return on investment after opening a new location is achieved 50% faster than it used to be.” – Marcos Acuña, Founder of QU!CK Scan & Go

Our goal of promoting seamless services to the technology market together with our partners is most visible in situations like this one, when we’re able to go beyond basic monitoring and position Zabbix as a vital support service for strategic decision making. To find out more about what Zabbix can do for customers in the retail sector, visit us here.

The post Monitoring Self-Service Markets with Zabbix and IoT appeared first on Zabbix Blog.

Case Study: Enhancing Security with Zabbix and fTLD Registry

Post Syndicated from Michael Kammer original https://blog.zabbix.com/case-study-enhancing-security-with-zabbix-and-ftld-registry/28415/

A top-level domain (TLD) is the part of a URL that comes after the last dot in a domain name. While most are familiar with the first TLDs of .com, .net, and .org, there are more than 1,400 TLDs. fTLD Registry (fTLD) is a global coalition of banks, insurance companies, and financial services trade associations who ensure the .Bank and .Insurance TLDs are governed in the best interests of the financial sector and their customers.

The challenge

In 2011, fTLD was formed to secure and manage .Bank and .Insurance. Due to the high risk of fraud in the financial sector, keeping domains (websites and email) secure and out of the hands of malicious actors was paramount – and that can’t be done without close, careful security monitoring. Unfortunately, fTLD was initially dependent on a monitoring solution that required manual compliance work, which made it difficult to get actionable information to its customers and partners. When they began to seek out a replacement solution, fTLD realized that Zabbix promised exactly the features they required, which prompted them to make the switch.

The solution

For every domain in .Bank and .Insurance that meets minimum technical requirements, Zabbix’s system performs multiple security compliance checks. These checks cover a range of domain security features to ensure .Bank and .Insurance websites and email services have implemented a multi-layered domain defense by way of the Security Requirements required by fTLD. Specifically, Zabbix checks and monitors for:

  • Authoritative name servers, which guarantee that the name servers for .Bank and .Insurance websites have the required security features.
  • Enhanced DNS security, which involves the proper validation of DNS Security Extensions (DNSSEC) with strong cryptographic algorithms to prevent unauthorized changes to domain data and cyberattacks, including domain spoofing and domain hijacking.
  • Digital identity and robust encryption, which confirm TLS certificates and TLS version requirements for secure web connections and encrypts all communications for the safe and secure transmission of personal information and financial transactions.
  • Email security, which increases the deliverability of email and checks for the deployment of DMARC and SPF to protect against phishing and spoofing.

When Zabbix detects an issue, it automatically notifies involved parties, including the registrar and the customer using the domain. As a client, fTLD has access to all the security monitoring data via a custom dashboard. Zabbix puts critical compliance security monitoring information at fTLD’s fingertips, helping them make good on their promise of airtight security for banks, insurers, and producers and their customers through .Bank and .Insurance domains.

The results

Heather Diaz, Vice President, Compliance and Policy, leads the security function for fTLD and attests that:

“With Zabbix as a partner, we have peace of mind knowing that domain security is closely monitored. We can then focus on engaging with customers to help them get the full cyber benefits of using .Bank and .Insurance to protect their brand and their customer data.”

By entrusting Zabbix with security monitoring, fTLD has seen a variety of benefits, including:

  • Considerable growth in overall security compliance, as Zabbix monitoring has provided better, more accessible, and more reliable security information.
  • A tangible boost in productivity, thanks to automated customer and partner notifications.
  • A bird’s-eye view of stats across all domains as well as detailed information for individual domains.
  • Adaptive compliance security monitoring through daily checks, which help maintain a proactive defense against cyberattacks.
  • Security expertise from Zabbix to ensure that fTLD’s Security Requirements represent best practices and security measures to ensure the security of .Bank and .Insurance domains and their customers’ well-placed trust.

In conclusion

fTLD is changing the way banks, insurers, and producers around the world interact with their customers by offering trusted, verified, more secure domains. They trust Zabbix to guarantee a multi-layered domain defense strategy by alerting fTLD and its customers to detected anomalies or security issues.

To learn more about what Zabbix can do for customers in banking and finance, visit us here.

The post Case Study: Enhancing Security with Zabbix and fTLD Registry appeared first on Zabbix Blog.
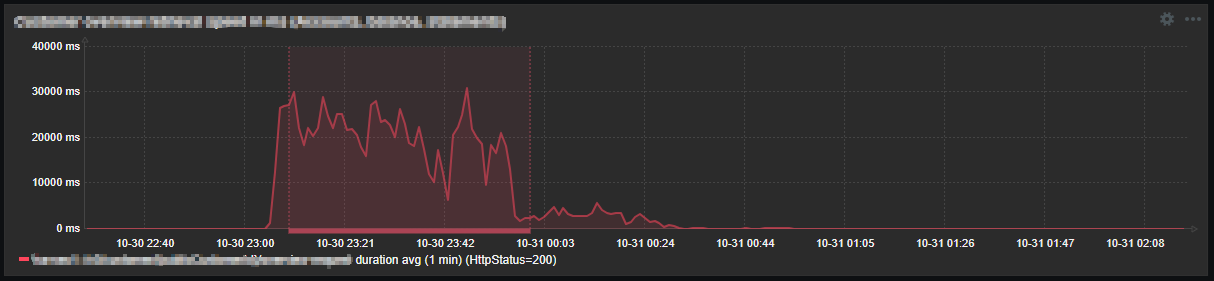
Celebrating the community: Yang

Post Syndicated from Sophie Ashford original https://www.raspberrypi.org/blog/celebrating-the-community-yang/

We love hearing from members of the community and sharing the stories of amazing young people, volunteers, and educators who are using their passion for technology to create positive change in the world around them.

A woman is pictured sitting in the office. There's a window behind her with a view of the London skyline.

In our latest story, we’re heading to London to meet Yang, a Manager in Technology Consulting at EY specialising in Microsoft Business Applications, whose commitment to CoderDojo is truly inspiring. Yang’s passion for volunteering has grown since she first volunteered at a CoderDojo club at a local museum. In recent years, she has actively searched for ways to bring the CoderDojo movement to more children, and encouraged her colleagues to come along on the journey too.
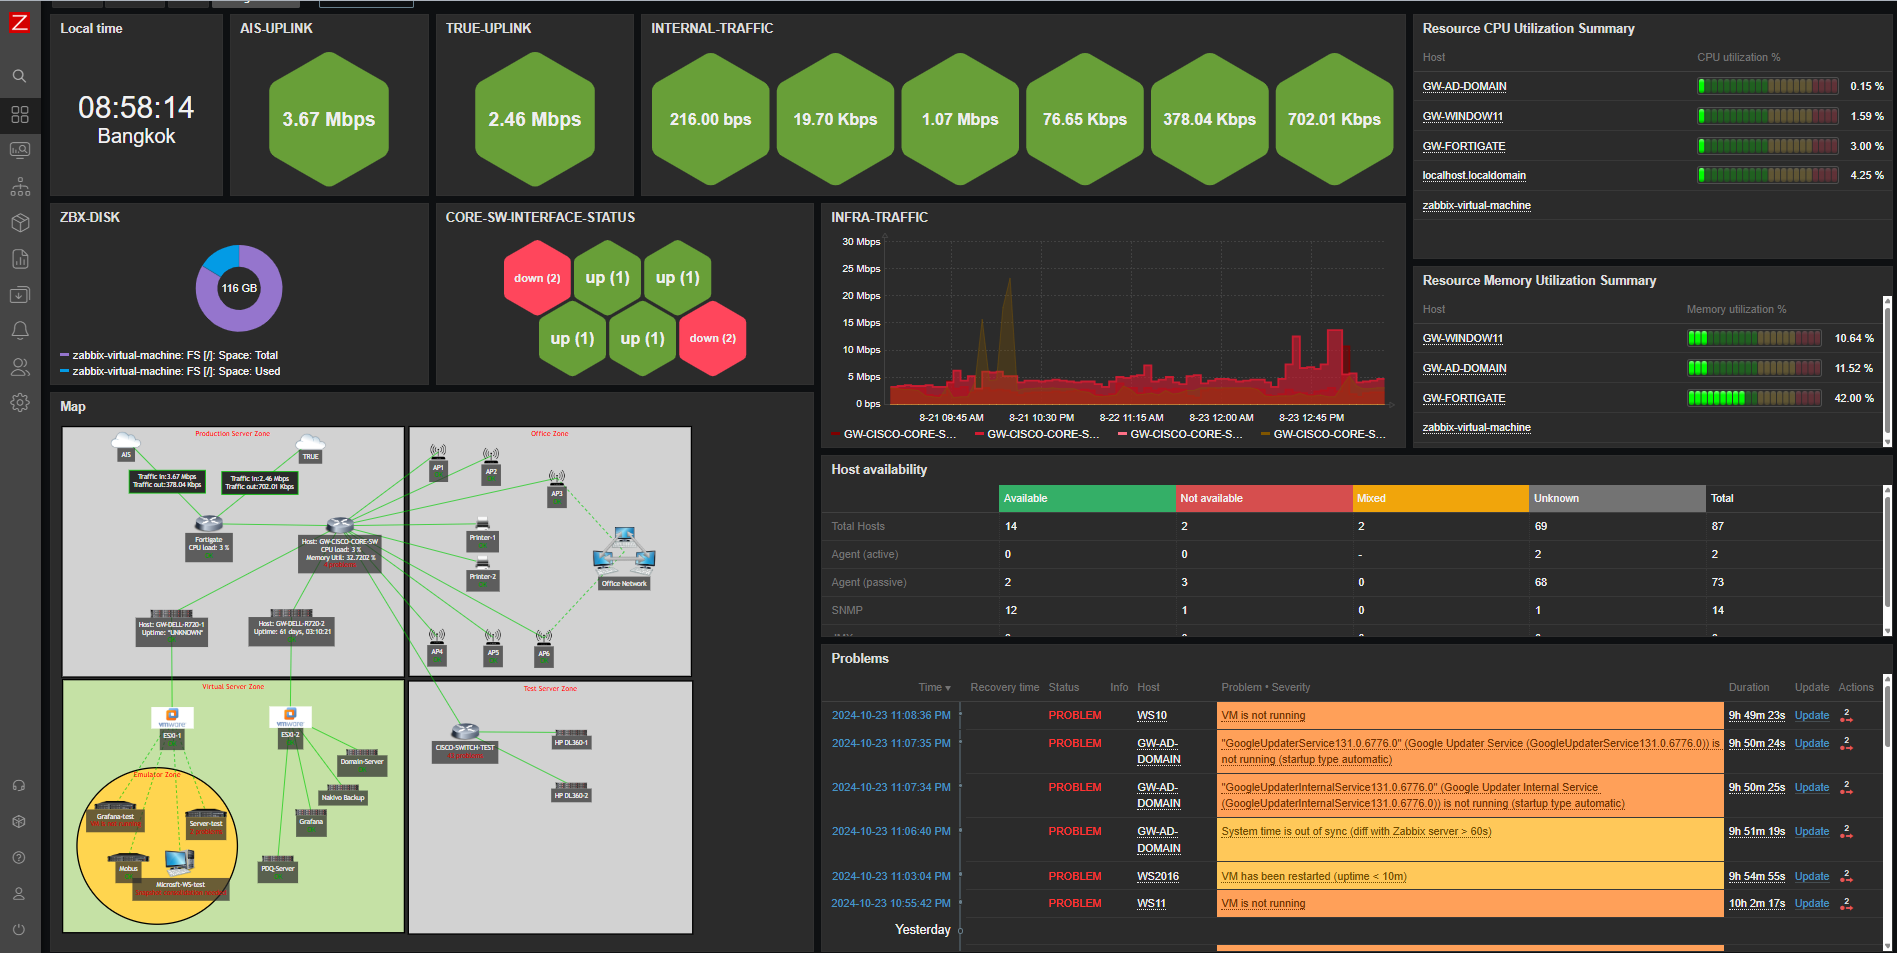
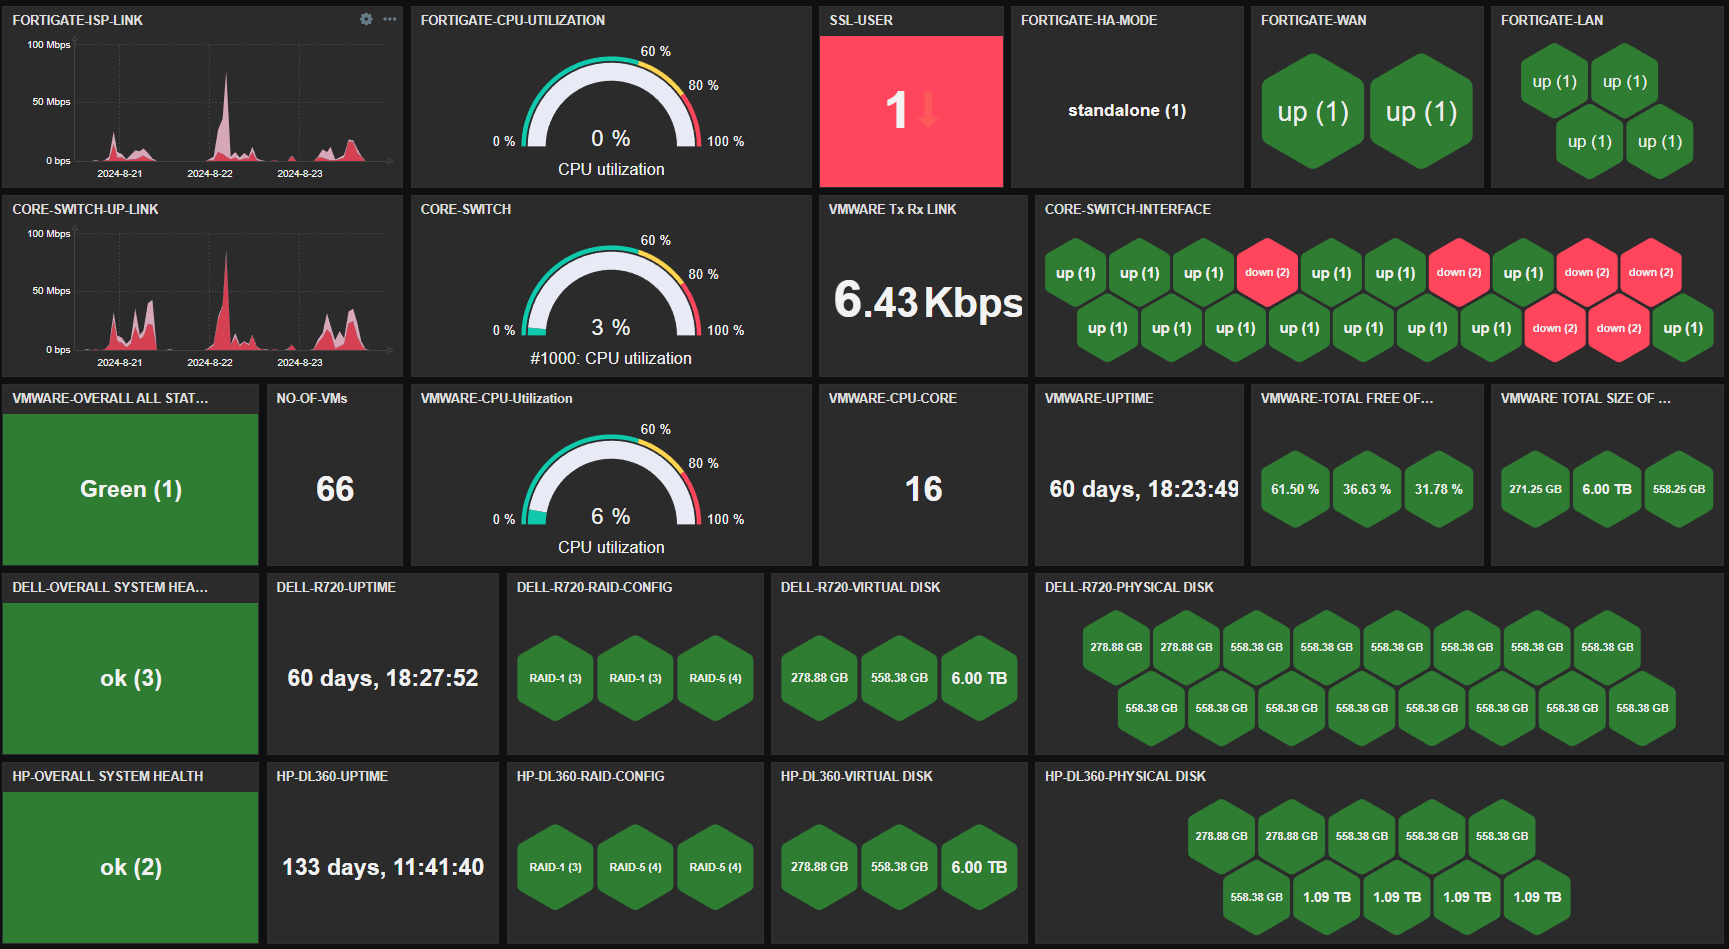
Introducing Yang

When Yang was growing up, both of her parents worked in STEM, but her own journey into a career in technology took a varied route. After initially studying journalism in China, her path shifted when she pursued a Master’s in Digital Humanities at UCL, London, broadening her digital skills and paving the way for her current role.

On a weekend visit to a museum, Yang found the opportunity to volunteer at their CoderDojo. This experience sparked an enthusiasm to create more opportunities for young people to explore the world of computing, and this soon evolved into a plan to implement clubs at the EY offices. 

Building a community of mentors

With support from the EY Corporate Responsibility team, and fellow colleagues, Yang started to deliver Dojo sessions at the EY office in London. From the very first session, Yang was blown away by the level of enthusiasm among her colleagues, and their willingness to volunteer their time to support the club. She soon realised it was possible to roll this initiative out to other offices around the country, expanding the volunteer network and increasing their impact.

Yang mentors two young learners during a CoderDojo session.

Clubs have now been run in four EY offices across the UK, and the team has even seen the first international club take place, at the EY office in Baku, Azerbaijan. In total, EY clubs have seen around 350 young people attend and give coding a go.

Championing diversity in tech

As a woman in tech, Yang is all too aware of the gender imbalance in the industry, and this is something she wanted the clubs at the EY offices to address. 

“If there are some female role models, I think for a little girl grow up that means so much. Because if they can see somebody thrive in this industry, they will see themselves there one day. And that’s the inspiration.” – Yang

Yang actively encourages female participation in Dojo sessions, for example through holding sessions with a focus on engaging girls to mark International Women’s Day and Ada Lovelace Day. Through her leadership, she creates an inclusive environment where girls can envision themselves as future leaders. 

Yang mentors a young person during a CoderDojo session.

Yang’s motivation doesn’t only inspire the young people attending her clubs, but also resonates with those who work with her on a daily basis, including colleagues like Iman and Elizabeth, who shared how much they admire Yang’s dedication and energy.

“I would love to have had a role model like [Yang] when I was younger. She’s just so inspiring. She’s so full of energy. I mean, from my personal experience, when I was younger, we didn’t have anything to do with coding.

There were situations where I was vaguely interested [in computing] but was told that it wasn’t for girls. And now with Yang running these events, seeing the girls come here and being so interested and wanting to learn, it really opens up so many more doors for them that they don’t even realise.” – Elizabeth, colleague and CoderDojo volunteer

Seeing the impact of her mentorship and the enthusiasm of young participants has fueled Yang’s passion even further. 

This has been a great opportunity to set up CoderDojo sessions for young people. I’ve had a lot of support from colleagues and other volunteers who have helped to run the sessions […] I feel super proud of what we’ve achieved so far.” – Yang

For Yang, mentorship isn’t just about teaching technical skills; it’s about helping young people develop confidence and resilience, and letting everyone know there is a place for them in computing should they want one.

Two mentors deliver a presentation during a CoderDojo session.

Continuing to make a difference in her community and beyond, Yang recently participated in the 68th annual UN Women’s Commission on the Status of Women, which is the UN’s largest annual gathering on gender equality and women’s empowerment. 

We’re delighted to be part of Yang’s journey, and can’t wait to see what she contributes to the world of tech next.

Help us celebrate Yang and her inspiring journey by sharing her story on X, LinkedIn, and Facebook.

The post Celebrating the community: Yang appeared first on Raspberry Pi Foundation.