Post Syndicated from Sophie Ashford original https://www.raspberrypi.org/blog/code-karaoke-and-creativity-meet-matthew/
We love hearing from members of the community and sharing stories of amazing young people, volunteers, and educators who are using their passion for technology to create positive change in the world around them.
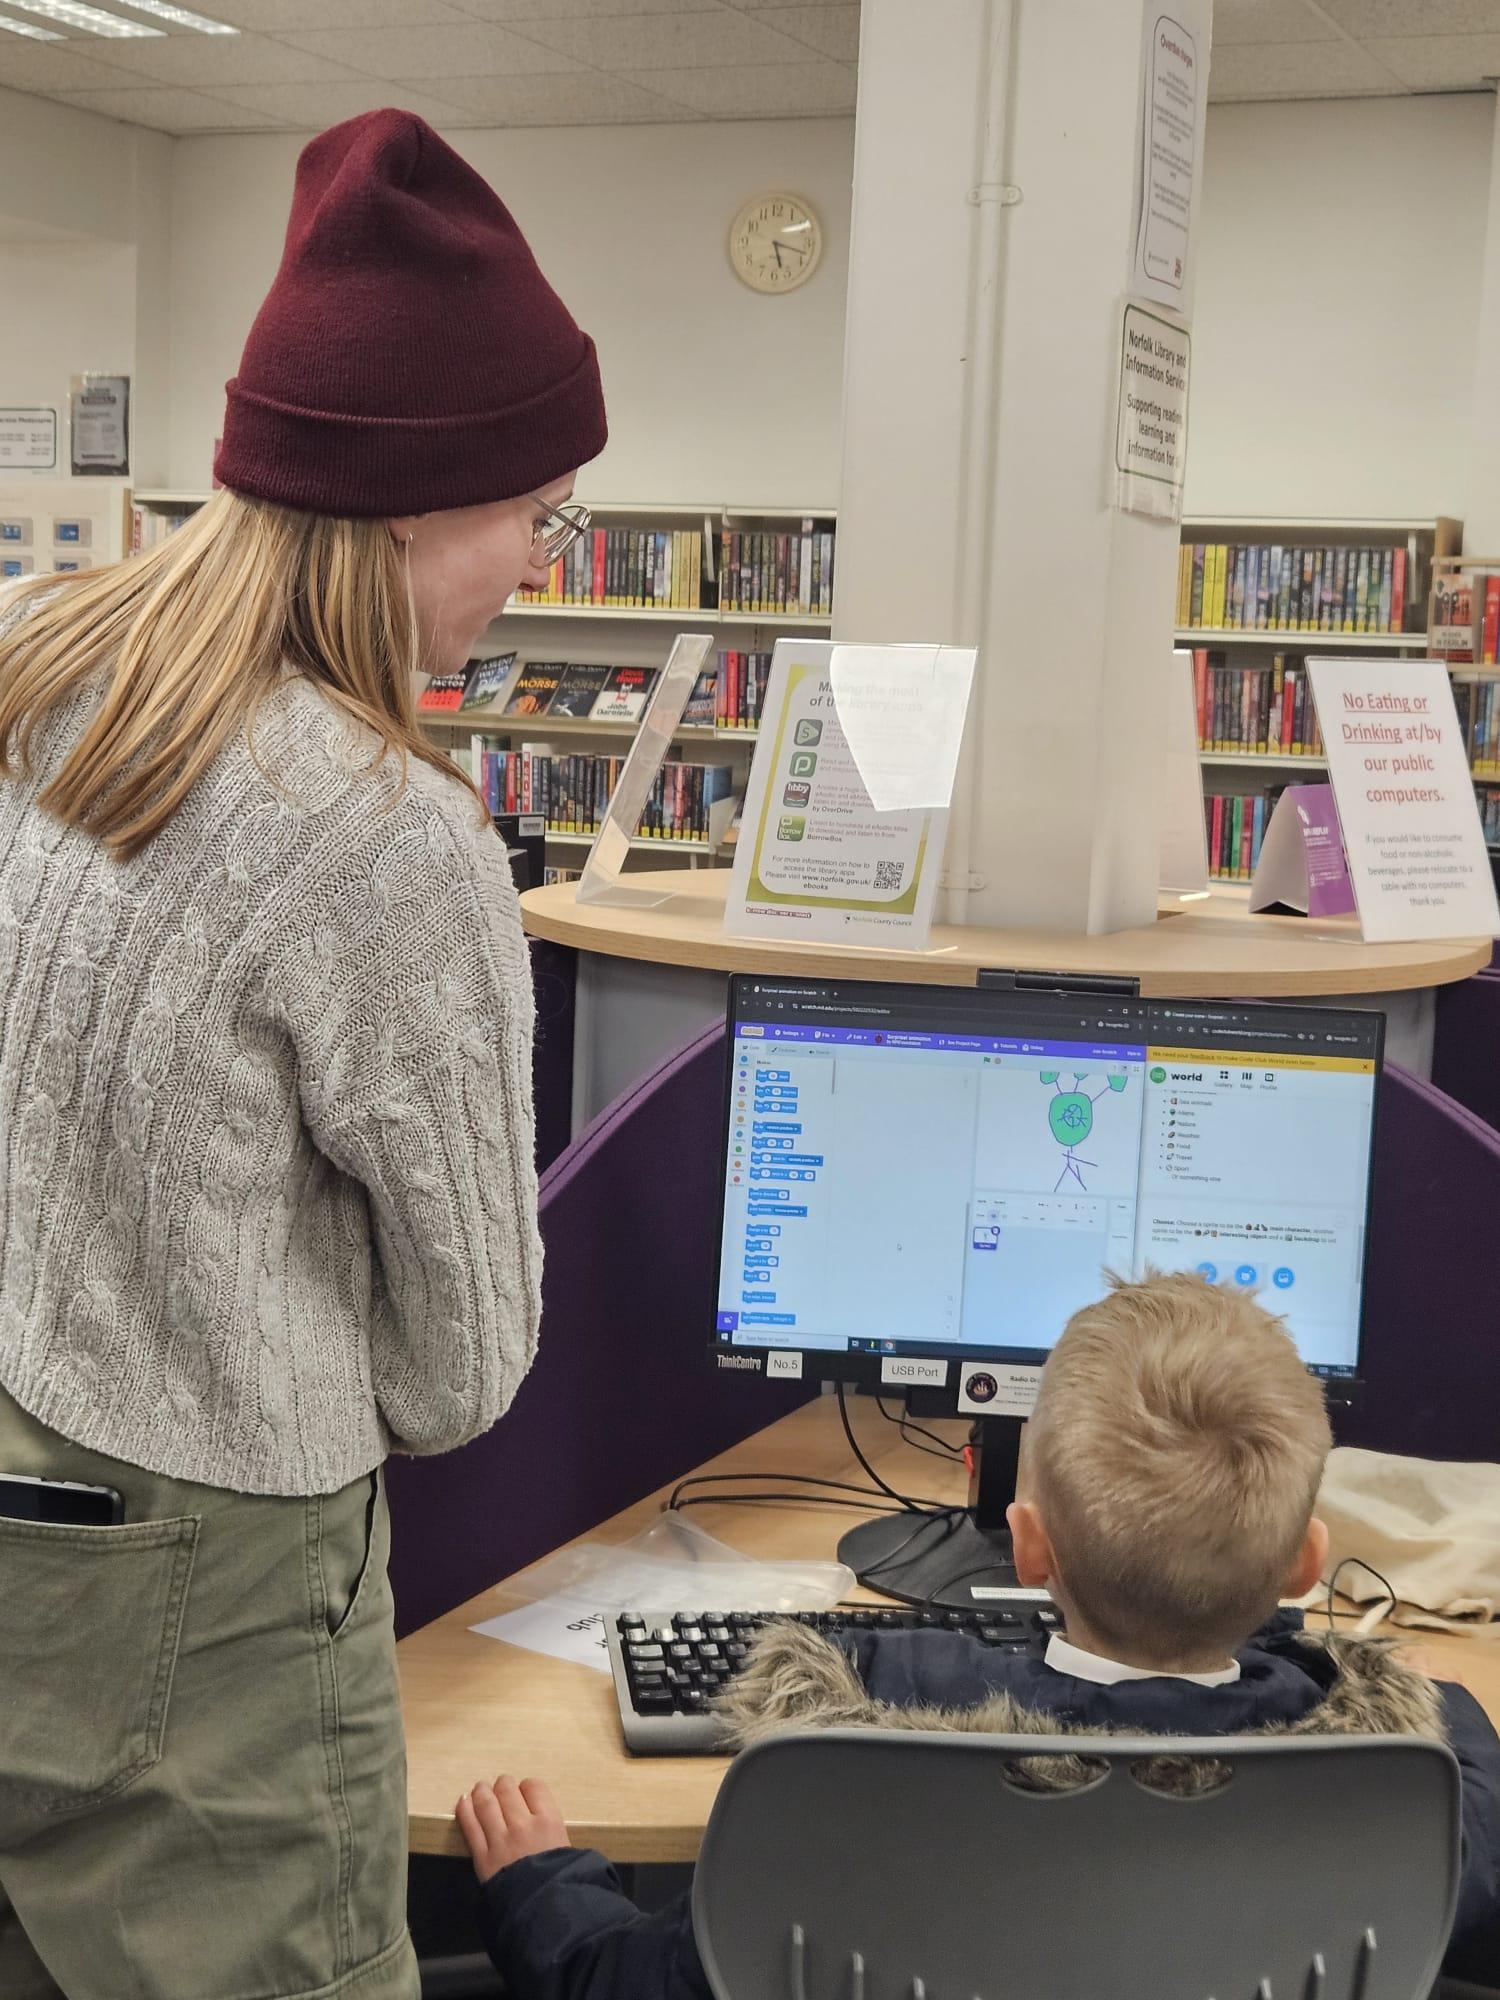
It’s especially inspiring to hear about young people who are not only passionate about technology, but who are also driven to share that passion with others. Meet Matthew, a 15-year-old creator and youth mentor at Code Club, who builds his own projects and inspires peers by organising hackathons.
Matthew’s early experience with coding
Matthew’s journey into the world of coding began at a young age. His initial exposure was through Scratch at school in Singapore. From there, he began exploring self-learn platforms in his own time, getting to grips with HTML and basic web development.
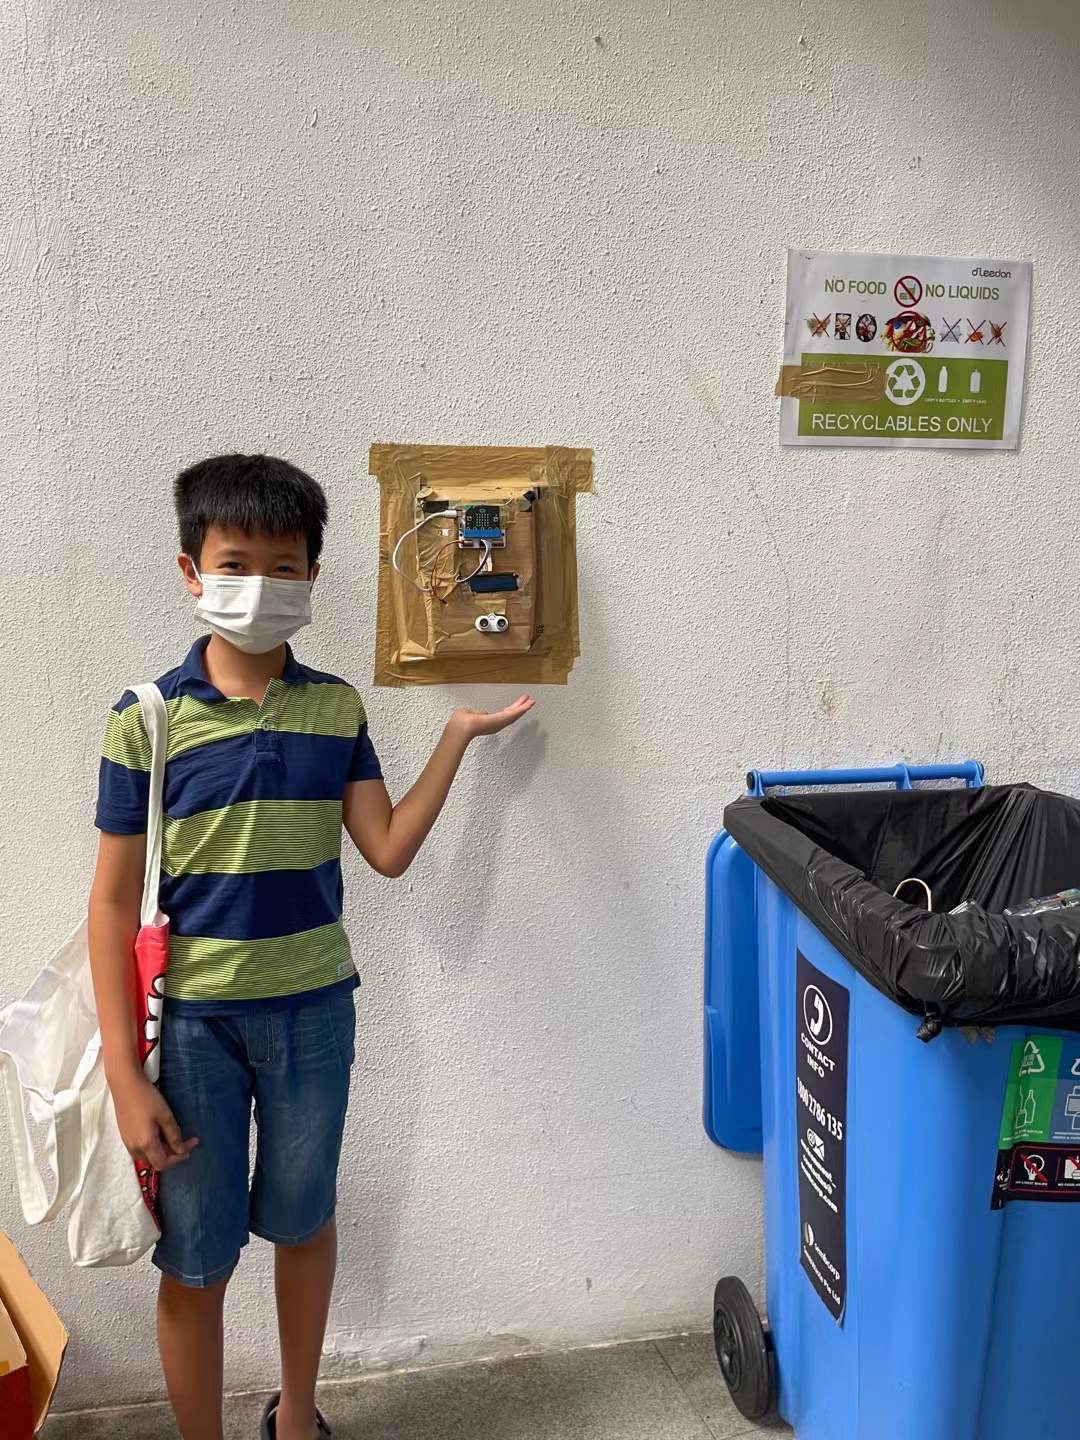
His enthusiasm for creating led him to participate in a technology week in Year 6, where he took on a BBC micro:bit challenge. He dedicated his summer holiday to developing a token system that encouraged community recycling, using an ultrasonic sensor to award points for good behaviour. This early project showcased his knack for problem-solving and innovation.
What truly captivated Matthew was the possibility of combining the logical challenges of competitive programming with the joy of project creation.
Connecting with the community
Through YouthHacks, an initiative he co-founded to support teenage hackathon organisers, Matthew aims to expand access to hackathons across the UK (a hackathon is an event where individuals or teams work intensively over a relatively short time period to build software, hardware, or other kinds of technology). Matthew wants to offer advice and support, making it easier for young people to run their own hackathons. He puts a lot of time into ensuring that the content and atmosphere truly resonate with the participants.
“So, we made YouthHacks basically as an idea to be able to support these teenage organisers, you know, like hackathons for teenagers by teenagers.”
Matthew’s connection with the Raspberry Pi Foundation came from his keen interest in the hackathon community and a need for a local venue. Having previously toured the Foundation’s offices for a school robotics club, he decided to reach out when organising a satellite hackathon called Counterspell.
This initial collaboration led to further events at the Foundation, including Scrapyard Cambridge and, more recently, Cool as Hack.
Coolest Projects hackathon: A new approach to collaborative coding
Cool as Hack was Matthew’s third event held at the Raspberry Pi Foundation offices. Unlike traditional hackathons with intense time pressure, this event, inspired by the spirit of Coolest Projects, aimed to be more relaxed and collaborative.
“For this, people could bring in their own project scraps and then they could put it together with a team, finalise it, and then enter it to Coolest Projects.”
The focus was on showcasing creativity and sharing projects globally, rather than competitive prizes. Everyone then entered their creations into the Coolest Projects online showcase.
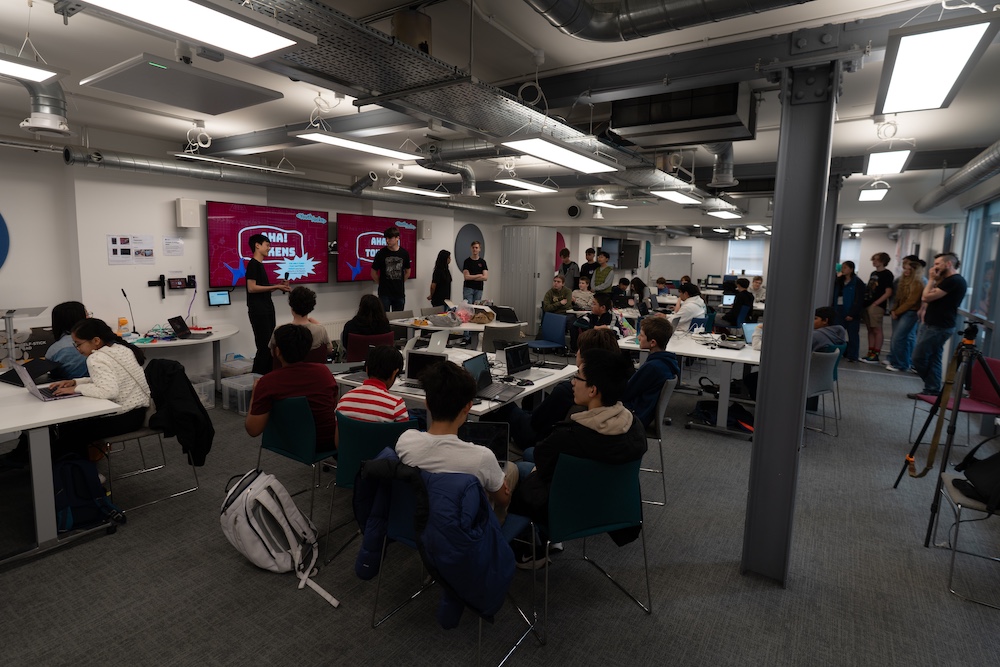
Cool as Hack was a huge success. The atmosphere was incredible — there was even a karaoke session and a “swag shop” where participants could exchange tokens earned for innovative ideas or project milestones. This token system, designed by Matthew and harking back to his own recycling project from years ago, created a fun and engaging reward system.
Inspiring the next generation
Matthew’s drive to organise these events and encourage other young people to code stems from his enjoyment of project creation and the community aspect of hackathons.
“Well, I suppose it links back to me enjoying making projects and when you attend a hackathon, it’s not a competition really. It’s more of a social event. So, you’re making a project and then you’re meeting quite a lot of coders, or even artists and musicians, and so many other people.”
Now a regular volunteer at the Raspberry Pi Foundation’s monthly Code Club in Cambridge, Matthew remains focused on encouraging others into tech. For aspiring young coders, he says that coding is far more diverse and creative than many might initially perceive, encompassing art, storytelling, and problem-solving. Matthew’s advice is simple:
“Enjoy the process and as you learn new things you’ll realise that all of this is like super interesting, and that there are so many ways to make what you want. Just enjoy it and continue meeting new people and, yeah, be creative.”
Matthew’s journey shows how an intro to computing at a young age can lead to an incredible amount of impact. With his continued dedication, he’s sure to inspire many more young minds to start on their own coding adventures.
If you would like to explore coding, you can get started at home with over 250 free projects.
Looking for a little extra support in your own coding journey or open to mentoring others? Join a Code Club near you to meet a like-minded and supportive community.
The post Code, karaoke, and creativity: Meet Matthew appeared first on Raspberry Pi Foundation.