We’re excited to announce that the ability to prebuild codespaces is now generally available. As a quick recap, a prebuilt codespace serves as a “ready-to-go” template where your source code, editor extensions, project dependencies, commands, and configurations have already been downloaded, installed, and applied, so that you don’t have to wait for these tasks to finish each time you create a new codespace. This helps significantly speed up codespace creations–especially for complex or large codebases.
Codespaces prebuilds entered public beta earlier this year, and we received a ton of feedback around experiences you loved, as well as areas we could improve on. We’re excited to share those with you today.
How Vanta doubled its engineering team with Codespaces
With Codespaces prebuilds, Vanta was able to significantly reduce the time it takes for a developer to onboard. This was important, because Vanta’s Engineering Team doubled in size in the last few months. When a new developer joined the company, they would need to manually set up their dev environment; and once it was stable, it would diverge within weeks, often making testing difficult.
“Before Codespaces, the onboarding process was tedious. Instead of taking two days, now it only takes a minute for a developer to access a pristine, steady-state environment, thanks to prebuilds,” said Robbie Ostrow, Software Engineering Manager at Vanta. “Now, our dev environments are ephemeral, always updated and ready to go.”
Scheduled prebuilds to manage GitHub Actions usage
Repository admins can now decide how and when they want to update prebuild configurations based on their team’s needs. While creating or updating prebuilds for a given repository and branch, admins can choose from three available triggers to initiate a prebuild refresh:
Every push (default): Prebuild configurations are updated on every push made to the given branch. This ensures that new Codespaces always contain the latest configuration, including any recently added or updated dependencies.
On configuration change: Prebuild configurations are updated every time configuration files change. This ensures that the latest configuration changes appear in new Codespaces. The Actions workflow that generates the prebuild template will run less often, so this option will use fewer Actions minutes.
Scheduled: With this setting, you can have your prebuild configurations update on a custom schedule. This can help further reduce the consumption of Actions minutes.
With increased control, repository admins can make more nuanced trade-offs between “environment freshness” and Actions usage. For example, an admin working in a large organization may decide to update their prebuild configuration every hour rather than on every push to get the most economy and efficiency out of their Actions usage.
Failure notifications for efficient monitoring
Many of you shared with us the need to be notified when a prebuild workflow fails, primarily to be able to watch and fix issues if and when they arise. We heard you loud and clear and have added support for failure notifications within prebuilds. With this, repository admins can specify a set of individuals or teams to be informed via email in case a workflow associated with that prebuild configuration fails. This will enable team leads or developers in charge of managing prebuilds for their repository to stay up to date on any failures without having to manually monitor them. This will also enable them to make fixes faster, thus ensuring developers working on the project continue getting prebuilt codespaces.
To help with investigating failures, we’ve also added the ability to disable a prebuild configuration in the instance repository admins would like to temporarily pause the update of a prebuild template while fixing an underlying issue.
Improved ‘prebuild readiness’ indicators
Lastly, to help you identify prebuild-enabled machine types to avail fast creations, we have introduced a ‘prebuild in progress’ label in addition to the ‘prebuild ready’ label in cases where a prebuild template creation for a given branch is in progress.
Billing for prebuilds
With general availability, organizations will be billed for Actions minutes required to run prebuild associated workflows and storage of templates associated with each prebuild configuration for a given repository and region. As an admin, you can download the usage report for your organization to get a detailed view of prebuild-associated Actions and storage costs for your organization-owned repositories to help you manage usage.
Alongside enabling billing, we’ve also added a functionality to help manage prebuild-associated storage costs based on the valuable feedback that you shared with us.
Template retention to manage storage costs
Repository administrators can now specify the number of prebuild template versions to be retained with a default template retention setting of two. A default of two means that the codespace service will retain the latest and one previous prebuild template version by default, thus helping you save on storage for older versions.
How to get started
Prebuilds are generally available for the GitHub Enterprise Cloud and GitHub Team plans as of today.
As an organization or repository admin, you can head over to your repository’s settings page and create prebuild configurations under the “Codespaces” tab. As a developer, you can create a prebuilt codespace by heading over to a prebuild-enabled branch in your repository and selecting a machine type that has the “prebuild ready” label on it.
Post general availability, we’ll continue working on functionalities to enable prebuilds on monorepos and multi-repository scenarios based on your feedback. If you have any feedback to help improve this experience, be sure to post it on our GitHub Discussions forum.
Dark mode is no longer a nice-to-have feature. It’s an expectation. Yet, for many teams, implementing dark mode is still a daunting task.
Creating a palette for dark interfaces is not as simple as inverting colors and complexity increases if your team is planning multiple themes. Many people find themselves using a combination of disjointed color tools, which can be a painful experience.
GitHub dark mode (unveiled at GitHub Universe in December 2020) was the result of trial and error, copy and paste, as well as back and forth in a Figma file (with more than 370,000 layers!).
A screenshot of the Figma file we made while designing GitHub dark mode
A few months after shipping dark mode, we began working on a dark high contrast theme to provide an option that maximizes legibility. While we were designing this new theme, we set out to improve our workflow by building an experimental tool to solve some of the challenges we encountered while designing the original dark color palette.
We’re calling our experimental color tool Primer Prism.
A sneak peek of Primer Prism
Part of GitHub’s Primer ecosystem, Primer Prism is a tool for creating and maintaining cohesive, consistent, and accessible color palettes. It allows us to:
In Primer Prism, we start a new color palette by creating a new color scale and adjusting the lightness curve. In this phase, we’re only concerned with lightness and contrast. We’ll revisit hue and saturation later.
As we change the lightness of each color, Primer Prism checks the contrast of potential color pairings in the scale using the WCAG 2 standard.
Dragging lightness sliders up and down to adjust the lightness curve of a scale
Primer Prism also allows us to share curves across multiple color scales. So, when we have more scales, we can quickly change the tonal character of the entire color palette by adjusting a single lightness curve.
Adjusting the lightness curve of all color scales at once
Primer Prism uses the HSLuv color space to ensure that the lightness values are perceptually uniform across the entire palette. In the HSLuv color space, two colors with the same lightness value will look equally bright.
Choosing colors
Next, we define the overall color character of our palette:
What hues do we need (for example: red, blue, green, etc.)?
How vibrant do we want the colors to be?
We create a color scale for every hue using the same lightness curve we made earlier. Then, we compare and adjust the base color (the fifth step in the scale) across all the color scales until the palette feels cohesive and consistent.
A side-by-side comparison of every color scale
After deciding on the base color for each scale, we fine-tune the tints (lighter colors) and shades (darker colors). Blue, for example, shifts towards green hues in the tints and purple hues in the shades.
The hue, saturation, and lightness curves of the blue color scale
Fine-tuning color scales is more of an art than a science and often requires many micro-adjustments before the colors “feel right.” Check out Color in UI Design: A (Practical) Framework by Eric D. Kennedy to learn more about the fundamentals of designing color scales.
Testing colors
To test our colors in real-world scenarios, we export the palette from Primer Prism as a JSON object and add it to Primer Primitives, our repository of design tokens. We use pre-releases of the Primer Primitives package to test new color palettes on GitHub.com.
The dark color palette applied to GitHub.com
What’s next
We used Primer Prism to design several new color palettes, accelerating the creation of dark high contrast, light high contrast, and colorblind themes for GitHub. Next, we plan to improve our tooling to support the following key workflows.
Visual testing workflow
We plan to integrate visual testing directly into Primer Prism. Currently, visual testing of color palettes happens outside of Primer Prism, typically in Figma or production applications. However, we want a more convenient way to visualize how the colors will look when mapped to functional variables and used in actual user interfaces.
GitHub workflow
We plan to integrate GitHub into Primer Prism. Right now, it’s a hassle to edit existing color palettes because Primer Prism is not connected to the GitHub repository where we store color variables (Primer Primitives). A GitHub integration will allow us to directly pull from and push to the Primer Primitives repository.
Figma workflow
Our designers use Figma to explore and test new design ideas. We plan to create a Figma plugin to seamlessly integrate Primer Prism into their workflow.
At GitHub, we believe it’s not fully shipped until it’s fast. JavaScript makes a big impact on how pages perform. One way we work to improve JavaScript performance is to make changes to the native syntax and polyfills we ship. For example, in January of this year, we updated our compiler to output native ES2019 code, shipping native syntax for optional catch binding.
JavaScript doesn’t get executed on very old browsers when native syntax for new language features is encountered. However, thanks to GitHub being built following the principle of progressive enhancement, users of older browsers still get to interact with basic features of GitHub, while users with more capable browsers get a faster experience.
GitHub will soon be serving JavaScript using syntax features found in the ECMAScript 2020 standard, which includes the optional chaining and nullish coalescing operators. This change will lead to a 10kb reduction in JavaScript across the site.
We want to take this opportunity to go into detail about how we think about browser support. We will share data about our customers’ browser usage patterns and introduce you to some of the tools we use to make sure our customers are getting the best experience, including our recently open-sourced browser support library.
What browsers do our customers use?
To monitor the performance of pages, we collect some usage information. We parse User-Agent headers as part of our analytics, which lets us make informed decisions based on the browsers our users are running. Some of these decisions include, what browsers we execute automated tests on, the configuration of our static analysis tools, and even what features we ship. Around 95% of requests to our web services come from browsers with an identifying user agent string. Another 1% of requests have no User-Agent header, and the remaining 4% make up scripts, like Python (2%) or programs like cURL (0.5%).
The above graph shows two dimensions: market share across browser vendors, and market share across versions. Looking at traffic with a branded user-agent string shows that roughly 95% of requests are coming from one of seven browsers. It also shows us that—perhaps unsurprisingly—the majority of requests come from Google Chrome (more than 70%), 12% from Firefox, 7% from Edge, 4.2% from Safari, and 1.4% from Opera (all other browser vendors represent significantly less than 1% of traffic).
The fall-off for outdated versions of browsers is very steep. While over 70% of requests come from the latest release of a browser, 18% come from the previous release. Requests coming from three versions behind the latest fall to less than 1%. These numbers tell us that we can make the most impact by concentrating on Chrome, Firefox, Edge, and Safari, in that order. That’s not the whole story, though. Another vector to look at is over time:
15.4
15.3
15.2
15.1
15.0
14.1
14.0
13.1
13.0
12.1
12.0
<12
2022-01-01
0.2130%
1.9933%
31.9792%
25.3472%
6.1477%
11.5005%
3.9045%
2.3446%
0.5210%
0.9379%
0.0336%
15.0773%
2022-01-02
0.2548%
2.0334%
32.8731%
25.9360%
6.4715%
12.0837%
3.7401%
2.4652%
0.5292%
0.8598%
0.0297%
12.7235%
2022-01-03
0.3078%
1.6285%
34.9256%
27.0666%
7.3738%
13.7125%
3.7582%
2.1204%
0.4217%
0.6152%
0.0238%
8.0459%
2022-01-04
0.3637%
1.4860%
35.6528%
26.9236%
7.6980%
14.2046%
3.6510%
2.0938%
0.3804%
0.5613%
0.0305%
6.9543%
2022-01-05
0.3519%
1.4723%
35.8533%
26.3673%
7.6227%
14.5006%
3.7131%
2.1403%
0.3793%
0.5682%
0.0254%
7.0055%
2022-01-06
0.3575%
1.5431%
36.6670%
25.8058%
7.5075%
14.2149%
3.7570%
2.1580%
0.3888%
0.6040%
0.0242%
6.9722%
2022-01-07
0.4123%
1.6277%
37.4426%
25.2663%
7.3924%
13.8618%
3.6753%
2.0874%
0.4024%
0.5904%
0.0270%
7.2144%
2022-01-08
0.3237%
1.9625%
35.9640%
24.3500%
6.2977%
12.0691%
3.7139%
2.3841%
0.5170%
0.8028%
0.0266%
11.5885%
2022-01-09
0.2964%
1.9599%
36.0700%
24.2496%
6.3270%
12.0979%
3.7857%
2.3146%
0.4816%
0.8567%
0.0242%
11.5363%
2022-01-10
0.3488%
1.5101%
39.0599%
24.5018%
7.2861%
14.0757%
3.6064%
2.0192%
0.3818%
0.5383%
0.0285%
6.6433%
2022-01-11
0.4108%
1.5541%
39.4265%
24.3465%
7.3778%
14.1840%
3.5905%
1.9870%
0.3366%
0.5555%
0.0253%
6.2052%
2022-01-12
0.3743%
1.5182%
40.0054%
23.9508%
7.3054%
14.1456%
3.5695%
2.0163%
0.3643%
0.5105%
0.0308%
6.2090%
2022-01-13
0.3380%
1.5659%
40.3951%
23.5803%
7.2104%
14.1495%
3.6099%
1.9705%
0.3716%
0.5117%
0.0229%
6.2743%
2022-01-14
0.3709%
1.6172%
40.8321%
23.4113%
6.9690%
13.5323%
3.5354%
1.9806%
0.3559%
0.5424%
0.0251%
6.8279%
2022-01-15
0.2870%
2.0547%
39.7351%
22.0067%
5.9847%
11.7234%
3.6011%
2.2909%
0.4668%
0.7720%
0.0287%
11.0489%
2022-01-16
0.2964%
2.0923%
40.8441%
20.6853%
5.9118%
11.8049%
3.6625%
2.3851%
0.4599%
0.8312%
0.0294%
10.9970%
2022-01-17
0.3043%
1.6554%
43.8724%
20.6116%
6.6334%
13.7081%
3.5519%
2.0195%
0.3721%
0.5356%
0.0287%
6.7071%
2022-01-18
0.3448%
1.5978%
45.3308%
19.6763%
6.7137%
13.6977%
3.5498%
1.9990%
0.3478%
0.5166%
0.0289%
6.1968%
2022-01-19
0.3490%
1.6179%
46.3810%
19.0037%
6.5909%
13.7031%
3.4676%
1.9497%
0.3358%
0.4847%
0.0264%
6.0901%
2022-01-20
0.3410%
1.6362%
47.2639%
18.3797%
6.4656%
13.3978%
3.3907%
1.9803%
0.3393%
0.5244%
0.0245%
6.2566%
2022-01-21
0.3553%
1.7170%
48.0184%
17.4454%
6.3012%
13.1411%
3.3914%
2.0109%
0.3696%
0.4934%
0.0230%
6.7332%
2022-01-22
0.2929%
2.3538%
46.1479%
16.4726%
5.4806%
11.2732%
3.4515%
2.1378%
0.4547%
0.7435%
0.0291%
11.1624%
2022-01-23
0.2595%
2.3385%
47.0822%
15.5800%
5.4940%
11.0466%
3.5465%
2.2365%
0.4565%
0.7749%
0.0233%
11.1614%
2022-01-24
0.3607%
1.7504%
50.7307%
15.3784%
6.1093%
12.9047%
3.4166%
2.0184%
0.3442%
0.4872%
0.0225%
6.4769%
2022-01-25
0.3654%
1.7706%
51.9246%
14.6195%
6.0739%
12.9834%
3.3441%
1.9226%
0.3283%
0.4742%
0.0197%
6.1736%
2022-01-26
0.3465%
2.1688%
52.4595%
14.0287%
5.9250%
12.4463%
3.3065%
1.9205%
0.3530%
0.5013%
0.0244%
6.5195%
2022-01-27
0.3628%
7.7522%
47.3489%
13.5902%
5.8790%
12.5425%
3.2687%
1.9584%
0.3513%
0.4820%
0.0285%
6.4356%
2022-01-28
0.8512%
12.2593%
43.2173%
12.7719%
5.7684%
12.2779%
3.2807%
1.8948%
0.3661%
0.4896%
0.0249%
6.7981%
2022-01-29
1.5324%
15.5746%
37.9759%
11.4900%
5.0904%
10.8157%
3.2414%
2.2146%
0.4751%
0.7246%
0.0226%
10.8425%
2022-01-30
1.8095%
17.1024%
36.5444%
11.5112%
5.0038%
10.5058%
3.3404%
2.2842%
0.4604%
0.7569%
0.0187%
10.6623%
2022-01-31
1.5814%
17.6461%
38.7703%
12.5933%
5.6880%
12.0274%
3.1897%
1.8416%
0.3408%
0.4923%
0.0240%
5.8050%
2022-02-01
1.7441%
19.2814%
37.2947%
12.3450%
5.5508%
11.9390%
3.1856%
1.8109%
0.3369%
0.4689%
0.0228%
6.0199%
2022-02-02
1.8425%
20.6234%
36.1439%
12.2229%
5.5517%
11.8100%
3.0868%
1.7966%
0.3369%
0.4872%
0.0285%
6.0697%
2022-02-03
1.8914%
21.5787%
34.9534%
12.0932%
5.4199%
11.7927%
3.1686%
1.8609%
0.3504%
0.4656%
0.0240%
6.4013%
2022-02-04
1.9648%
22.7768%
34.0393%
11.7468%
5.2886%
11.4763%
3.0458%
1.8618%
0.3508%
0.5207%
0.0221%
6.9061%
2022-02-05
2.3963%
23.4144%
30.8252%
10.7756%
4.6826%
10.0675%
3.2277%
2.1561%
0.4480%
0.7145%
0.0214%
11.2706%
2022-02-06
2.3912%
24.0953%
30.5678%
10.4257%
4.7046%
10.0236%
3.3234%
2.1215%
0.4327%
0.7056%
0.0193%
11.1893%
2022-02-07
2.0336%
24.6938%
32.2185%
11.5380%
5.1985%
11.8112%
3.1986%
1.9324%
0.3535%
0.4776%
0.0249%
6.5194%
2022-02-08
2.0578%
25.5825%
31.5513%
11.4319%
5.1997%
11.8368%
3.1809%
1.8839%
0.3255%
0.4600%
0.0220%
6.4678%
2022-02-09
2.1357%
26.4126%
31.2722%
11.3999%
5.2737%
11.9741%
3.1823%
1.9032%
0.2298%
0.2883%
0.0204%
5.9077%
2022-02-10
2.1586%
27.2403%
30.8552%
11.3862%
5.2045%
11.8815%
3.1880%
1.5341%
0.2342%
0.2931%
0.0234%
6.0009%
2022-02-11
2.3263%
28.7838%
30.1344%
11.3683%
5.1761%
11.6652%
3.1655%
0.8880%
0.1781%
0.2133%
0.0214%
6.0796%
2022-02-12
2.7622%
28.4764%
26.9469%
9.7973%
4.4372%
9.9020%
3.1473%
2.1256%
0.4193%
0.7154%
0.0241%
11.2464%
2022-02-13
2.6300%
28.9074%
26.5648%
9.9005%
4.4070%
9.9237%
3.1472%
2.2069%
0.4375%
0.7176%
0.0234%
11.1339%
2022-02-14
2.2108%
30.1253%
28.0680%
10.8367%
5.0225%
11.6307%
3.1060%
1.7727%
0.3190%
0.4699%
0.0230%
6.4155%
2022-02-15
2.2626%
31.0756%
27.6637%
10.8023%
4.9224%
11.5579%
3.0697%
1.7311%
0.3060%
0.4568%
0.0263%
6.1257%
2022-02-16
2.3030%
31.5893%
27.2155%
10.7267%
4.8788%
11.4932%
2.9605%
1.7814%
0.3026%
0.4668%
0.0264%
6.2558%
2022-02-17
2.3139%
32.1564%
26.7888%
10.6523%
4.7749%
11.4135%
3.0497%
1.8037%
0.3309%
0.4543%
0.0254%
6.2362%
2022-02-18
2.3419%
33.8505%
25.1471%
10.3232%
4.6872%
11.2973%
2.9507%
1.8080%
0.3524%
0.4658%
0.0234%
6.7524%
2022-02-19
2.8255%
35.4968%
21.2425%
9.0705%
4.3585%
9.6129%
3.0839%
2.1391%
0.4321%
0.7214%
0.0240%
10.9927%
2022-02-20
2.7597%
37.2786%
19.6970%
9.0995%
4.3411%
9.6230%
3.0634%
2.1577%
0.4466%
0.6930%
0.0223%
10.8180%
2022-02-21
2.2972%
39.5270%
20.2617%
9.8308%
4.5785%
11.0922%
3.0427%
1.8432%
0.3359%
0.4971%
0.0203%
6.6735%
2022-02-22
2.3285%
41.6072%
18.8362%
9.5382%
4.5626%
11.1426%
3.0037%
1.8037%
0.3116%
0.4570%
0.0206%
6.3882%
2022-02-23
2.3564%
42.9442%
17.7843%
9.3653%
4.5609%
11.0347%
2.8992%
1.7738%
0.3189%
0.4421%
0.0198%
6.5005%
2022-02-24
2.3331%
43.8819%
16.9144%
9.1178%
4.5580%
11.1665%
2.9641%
1.7680%
0.3063%
0.4369%
0.0224%
6.5306%
2022-02-25
2.3644%
45.0140%
15.8175%
8.8273%
4.4317%
10.9711%
2.9355%
1.7624%
0.3324%
0.4556%
0.0238%
7.0641%
2022-02-26
2.9596%
44.4252%
13.1945%
7.6195%
3.9776%
9.4234%
3.1355%
2.0300%
0.5206%
0.7039%
0.0223%
11.9878%
2022-02-27
2.8501%
45.0292%
12.5025%
7.7242%
4.0507%
9.4992%
3.0954%
2.1008%
0.4980%
0.6989%
0.0251%
11.9258%
2022-02-28
2.3807%
47.0753%
14.2634%
8.4807%
4.2220%
10.9576%
3.0524%
1.8148%
0.3434%
0.4632%
0.0242%
6.9222%
2022-03-01
2.3748%
48.2034%
13.7801%
8.3157%
4.2605%
10.7307%
2.9418%
1.8095%
0.3259%
0.4437%
0.0224%
6.7913%
2022-03-02
2.3629%
48.7995%
13.5339%
8.1894%
4.2284%
10.7893%
2.9092%
1.7475%
0.3293%
0.4560%
0.0220%
6.6327%
2022-03-03
2.4486%
49.7154%
12.6928%
8.1700%
4.1801%
10.6387%
2.8873%
1.7340%
0.3109%
0.4497%
0.0246%
6.7479%
2022-03-04
2.5373%
50.2026%
12.4981%
7.7686%
4.1271%
10.5053%
2.8372%
1.7236%
0.3080%
0.4493%
0.0255%
7.0174%
2022-03-05
3.0231%
49.3317%
10.5426%
6.5147%
3.7707%
9.0290%
3.0784%
2.0464%
0.4182%
0.6288%
0.0208%
11.5956%
2022-03-06
3.0723%
49.6284%
10.0200%
6.7391%
3.7704%
9.0282%
3.0924%
2.1063%
0.4288%
0.6881%
0.0213%
11.4046%
2022-03-07
2.4667%
51.7157%
11.7176%
7.6974%
4.1000%
10.2989%
2.8448%
1.7253%
0.3185%
0.4412%
0.0236%
6.6503%
2022-03-08
2.4190%
52.4292%
11.3917%
7.3946%
4.1027%
10.3559%
2.8335%
1.7378%
0.3259%
0.4500%
0.0230%
6.5368%
2022-03-09
2.4744%
52.9758%
11.0708%
7.4840%
4.0474%
10.3307%
2.8409%
1.6682%
0.3015%
0.4183%
0.0210%
6.3667%
2022-03-10
2.5404%
53.2418%
10.8388%
7.3800%
3.9569%
10.2019%
2.8462%
1.7425%
0.3027%
0.4212%
0.0254%
6.5022%
2022-03-11
2.6346%
53.8851%
10.3123%
7.1008%
3.8969%
9.8746%
2.7686%
1.6714%
0.2988%
0.4224%
0.0252%
7.1092%
2022-03-12
3.2418%
52.4146%
8.4171%
6.0948%
3.5575%
8.6494%
3.0048%
2.0180%
0.3927%
0.7005%
0.0251%
11.4838%
2022-03-13
3.2069%
52.3926%
8.5002%
6.1721%
3.5239%
8.4507%
2.9757%
2.1148%
0.3755%
0.7167%
0.0254%
11.5456%
2022-03-14
3.2185%
54.3662%
9.8584%
7.0464%
3.8492%
9.8257%
2.7413%
1.6965%
0.2680%
0.4273%
0.0270%
6.6756%
2022-03-15
11.1192%
47.4059%
9.5438%
6.8719%
3.7611%
9.7005%
2.7719%
1.6308%
0.2637%
0.4211%
0.0250%
6.4849%
2022-03-16
17.9069%
41.3967%
9.1987%
6.6590%
3.7184%
9.5772%
2.6822%
1.6273%
0.2877%
0.4349%
0.0197%
6.4914%
2022-03-17
21.7348%
38.1323%
8.8607%
6.5819%
3.6503%
9.4056%
2.6279%
1.6295%
0.2814%
0.4449%
0.0250%
6.6258%
2022-03-18
24.4165%
35.7041%
8.5482%
6.3399%
3.5433%
9.0851%
2.5852%
1.6362%
0.2685%
0.4610%
0.0258%
7.3863%
2022-03-19
26.2368%
31.9489%
6.8779%
5.5836%
3.3195%
7.9382%
2.7793%
1.9717%
0.3594%
0.6485%
0.0219%
12.3144%
2022-03-20
27.3687%
30.7753%
7.0252%
5.5489%
3.3195%
7.9491%
2.8717%
1.9881%
0.3587%
0.6629%
0.0231%
12.1088%
2022-03-21
28.2620%
32.3271%
8.3673%
6.3448%
3.4783%
9.2887%
2.6006%
1.6620%
0.2865%
0.4242%
0.0238%
6.9347%
2022-03-22
29.5670%
31.4166%
8.2768%
6.3061%
3.4969%
9.2905%
2.5700%
1.5872%
0.2591%
0.4296%
0.0227%
6.7774%
2022-03-23
30.6539%
30.6544%
8.0608%
6.2326%
3.4798%
9.1248%
2.5844%
1.6372%
0.2534%
0.4191%
0.0235%
6.8761%
2022-03-24
32.0481%
29.9540%
8.0759%
6.0714%
3.4595%
9.0259%
2.5544%
1.5634%
0.2705%
0.4064%
0.0225%
6.5478%
2022-03-25
32.7566%
28.9962%
7.7413%
5.9692%
3.3709%
8.7142%
2.5446%
1.5842%
0.2667%
0.4180%
0.0235%
7.6147%
2022-03-26
32.5970%
26.7095%
6.2462%
5.0950%
3.2226%
7.6540%
2.7770%
1.8228%
0.3847%
0.6553%
0.0210%
12.8149%
2022-03-27
33.0257%
26.3003%
6.3665%
5.3195%
3.2245%
7.8100%
2.8208%
1.8248%
0.3827%
0.6404%
0.0235%
12.2614%
2022-03-28
34.6919%
27.5399%
7.6902%
5.9742%
3.3578%
8.8958%
2.5193%
1.6230%
0.2658%
0.3997%
0.0232%
7.0192%
2022-03-29
35.6580%
27.0895%
7.6128%
5.9695%
3.3326%
8.7237%
2.4484%
1.5631%
0.2741%
0.3802%
0.0223%
6.9258%
2022-03-30
36.0933%
26.8011%
7.4668%
5.9183%
3.3682%
8.6179%
2.4670%
1.5698%
0.2556%
0.4017%
0.0195%
7.0208%
2022-03-31
36.7627%
26.3586%
7.4152%
5.8338%
3.2992%
8.6070%
2.5025%
1.5928%
0.2742%
0.4120%
0.0184%
6.9235%
2022-04-01
37.7935%
25.6391%
7.0944%
5.6951%
3.3207%
8.4395%
2.3936%
1.5895%
0.2895%
0.4032%
0.0177%
7.3242%
2022-04-02
36.7583%
23.8424%
6.0495%
4.9378%
3.1161%
7.6109%
2.7326%
1.8943%
0.3616%
0.6358%
0.0209%
12.0398%
2022-04-03
38.0555%
23.4329%
5.9867%
5.0717%
3.1091%
7.4917%
2.6295%
1.8512%
0.3456%
0.6151%
0.0185%
11.3926%
2022-04-04
39.5734%
24.4753%
7.2343%
5.6909%
3.1580%
8.4157%
2.4270%
1.5334%
0.2433%
0.4101%
0.0237%
6.8149%
2022-04-05
40.1999%
24.3237%
7.1533%
5.5920%
3.2204%
8.3465%
2.3998%
1.4640%
0.2627%
0.3814%
0.0251%
6.6309%
2022-04-06
40.3972%
23.9005%
7.0750%
5.5978%
3.4175%
8.4546%
2.3345%
1.5084%
0.2411%
0.4040%
0.0226%
6.6467%
2022-04-07
40.6483%
23.5724%
6.9376%
5.5906%
3.5983%
8.4082%
2.3696%
1.5432%
0.2714%
0.3932%
0.0221%
6.6452%
2022-04-08
41.0291%
23.0447%
6.7669%
5.3345%
3.7167%
8.1355%
2.3707%
1.5204%
0.2979%
0.4360%
0.0227%
7.3250%
2022-04-09
39.0096%
21.5707%
5.5139%
4.6910%
3.8459%
7.1101%
2.6170%
1.8408%
0.3681%
0.6555%
0.0163%
12.7611%
2022-04-10
38.9654%
21.5612%
5.7157%
4.7531%
3.9948%
7.0060%
2.6146%
1.9593%
0.3643%
0.6320%
0.0189%
12.4146%
2022-04-11
41.7134%
22.3259%
6.8796%
5.4925%
3.8380%
8.2313%
2.3455%
1.5951%
0.2604%
0.3967%
0.0202%
6.9013%
2022-04-12
42.9776%
21.4756%
6.6304%
5.3460%
3.9136%
8.1430%
2.3224%
1.4970%
0.2704%
0.4073%
0.0232%
6.9935%
2022-04-13
44.8529%
19.5508%
6.5201%
5.2781%
3.9081%
8.1321%
2.3117%
1.4651%
0.2597%
0.3798%
0.0203%
7.3213%
2022-04-14
47.2604%
18.5562%
6.3329%
5.0969%
3.9568%
7.8447%
2.2326%
1.4409%
0.2660%
0.3694%
0.0195%
6.6238%
2022-04-15
46.1738%
17.2112%
5.7005%
4.8802%
4.1301%
7.6028%
2.4450%
1.5947%
0.3140%
0.4888%
0.0221%
9.4369%
2022-04-16
45.0816%
15.9900%
4.9427%
4.2670%
4.3097%
6.9089%
2.5115%
1.7646%
0.3776%
0.6567%
0.0196%
13.1700%
2022-04-17
45.9303%
15.1178%
4.8665%
4.3033%
4.3275%
6.9231%
2.6406%
1.7807%
0.3541%
0.6456%
0.0216%
13.0890%
2022-04-18
48.5945%
15.2044%
5.8556%
4.8611%
4.2658%
7.9850%
2.4404%
1.6419%
0.2887%
0.4655%
0.0209%
8.3763%
2022-04-19
50.8857%
14.9250%
5.8652%
5.0294%
3.9808%
7.8429%
2.2999%
1.4581%
0.2670%
0.3945%
0.0178%
7.0337%
2022-04-20
51.9700%
14.2590%
5.8156%
4.8890%
4.0109%
7.6977%
2.2176%
1.4981%
0.2546%
0.4005%
0.0209%
6.9662%
2022-04-21
52.5838%
13.5549%
5.7156%
4.8685%
3.9548%
7.6767%
2.3164%
1.4839%
0.2606%
0.4122%
0.0211%
7.1515%
2022-04-22
53.0145%
12.8874%
5.4692%
4.7749%
4.0399%
7.5126%
2.2910%
1.4816%
0.2738%
0.3989%
0.0203%
7.8361%
2022-04-23
51.2057%
11.0804%
4.4180%
4.1472%
4.4620%
6.6022%
2.4416%
1.8031%
0.3768%
0.5984%
0.0245%
12.8400%
2022-04-24
51.2867%
10.9186%
4.6488%
4.1452%
4.2797%
6.9482%
2.6263%
1.8961%
0.3964%
0.6026%
0.0243%
12.2271%
2022-04-25
54.1650%
12.3169%
5.5367%
4.7520%
4.0855%
7.5898%
2.2639%
1.4719%
0.2677%
0.4090%
0.0216%
7.1201%
2022-04-26
55.1848%
11.9726%
5.3847%
4.6786%
4.0406%
7.4071%
2.2462%
1.4609%
0.2643%
0.3727%
0.0237%
6.9636%
2022-04-27
55.9856%
11.5124%
5.3171%
4.5683%
3.9992%
7.3195%
2.2536%
1.4565%
0.2617%
0.3671%
0.0254%
6.9336%
2022-04-28
56.1709%
11.2112%
5.3278%
4.5597%
4.0453%
7.2469%
2.1800%
1.4478%
0.2588%
0.3927%
0.0223%
7.1366%
2022-04-29
56.4630%
10.8456%
5.0356%
4.3545%
4.1464%
7.2195%
2.1173%
1.4117%
0.2479%
0.4089%
0.0203%
7.7295%
2022-04-30
53.9976%
8.9824%
4.1147%
3.7867%
4.3880%
6.3945%
2.5134%
1.7417%
0.3505%
0.6254%
0.0265%
13.0786%
Safari releases a major version each year alongside macOS and iOS. The above shows the release cadence from January-April for Safari traffic on GitHub.com. While we see older versions used quite heavily, we also see regular upgrade cadence from Safari users, especially 15.x releases, with peak-to-peak usage approximately every eight weeks.
101
100
99
98
97
96
<90
95
94
93
92
91
90
2022-01-01
0.0000%
0.3491%
0.1468%
0.2108%
0.3386%
86.6783%
5.1358%
2.2244%
1.7838%
0.5934%
1.5257%
0.5474%
0.4658%
2022-01-02
0.0000%
0.3455%
0.1363%
0.1842%
0.3181%
88.7497%
3.2558%
2.2186%
1.8004%
0.5739%
1.4336%
0.5302%
0.4538%
2022-01-03
0.0000%
0.2731%
0.0937%
0.1450%
0.2434%
90.4934%
2.1269%
2.5113%
1.5836%
0.5793%
1.0352%
0.5289%
0.3861%
2022-01-04
0.0000%
0.2561%
0.0908%
0.1459%
0.2757%
90.3926%
2.2204%
2.5350%
1.5445%
0.5799%
1.0151%
0.5280%
0.4160%
2022-01-05
0.0000%
0.2556%
0.0899%
0.1520%
4.1497%
86.6672%
2.2260%
2.4636%
1.5101%
0.5757%
0.9840%
0.5220%
0.4042%
2022-01-06
0.0000%
0.2508%
0.0815%
0.1412%
10.7723%
80.2589%
2.1902%
2.3842%
1.4689%
0.5581%
0.9913%
0.5089%
0.3937%
2022-01-07
0.0000%
0.1932%
0.0962%
0.1629%
21.5610%
69.5394%
2.2636%
2.2909%
1.4494%
0.5384%
1.0015%
0.5018%
0.4017%
2022-01-08
0.0000%
0.1744%
0.1480%
0.2586%
33.5510%
56.3914%
2.9587%
2.0026%
1.7096%
0.5449%
1.3334%
0.5045%
0.4230%
2022-01-09
0.0000%
0.1518%
0.1521%
0.2564%
37.8032%
52.5723%
2.8295%
1.8732%
1.6458%
0.5064%
1.3001%
0.4884%
0.4208%
2022-01-10
0.0000%
0.1330%
0.1059%
0.1782%
36.7369%
54.4084%
2.4167%
2.1394%
1.4727%
0.5493%
0.9584%
0.5085%
0.3927%
2022-01-11
0.0000%
0.1219%
0.1051%
0.2332%
45.4664%
46.0626%
2.2293%
2.0457%
1.4169%
0.5245%
0.9212%
0.4878%
0.3853%
2022-01-12
0.0000%
0.1134%
0.1468%
0.2459%
57.1392%
34.5425%
2.1934%
1.9506%
1.3772%
0.5162%
0.9154%
0.4807%
0.3786%
2022-01-13
0.0000%
0.1046%
0.1624%
0.2693%
65.4838%
26.4436%
2.0266%
1.8866%
1.3646%
0.4987%
0.9004%
0.4861%
0.3733%
2022-01-14
0.0000%
0.1031%
0.1829%
0.3063%
70.0467%
21.6414%
2.2699%
1.8110%
1.3665%
0.4882%
0.9326%
0.4758%
0.3755%
2022-01-15
0.0000%
0.1537%
0.2627%
0.4051%
74.7938%
15.8317%
2.8385%
1.6009%
1.5320%
0.4885%
1.2465%
0.4664%
0.3802%
2022-01-16
0.0000%
0.1602%
0.2558%
0.3909%
76.5597%
14.3898%
2.7115%
1.5114%
1.5108%
0.4653%
1.2131%
0.4474%
0.3840%
2022-01-17
0.0000%
0.1317%
0.1893%
0.2867%
76.2164%
15.8049%
2.0853%
1.6876%
1.3236%
0.4815%
0.9184%
0.4969%
0.3777%
2022-01-18
0.0000%
0.1289%
0.1898%
0.2709%
77.6409%
14.7878%
1.9411%
1.6397%
1.2295%
0.4692%
0.8660%
0.4755%
0.3606%
2022-01-19
0.0000%
0.1319%
0.1909%
0.2707%
79.0723%
13.6180%
1.9163%
1.5781%
1.0862%
0.4649%
0.8503%
0.4634%
0.3568%
2022-01-20
0.0000%
0.1221%
0.1687%
0.2831%
80.3988%
12.5592%
1.8927%
1.4921%
1.0036%
0.4499%
0.8351%
0.4446%
0.3500%
2022-01-21
0.0000%
0.1234%
0.1599%
0.2858%
81.4219%
11.6477%
1.9316%
1.3819%
0.9494%
0.4453%
0.8615%
0.4436%
0.3480%
2022-01-22
0.0000%
0.1797%
0.2379%
0.3808%
82.0847%
9.9598%
2.6312%
1.2211%
0.9332%
0.4429%
1.1404%
0.4392%
0.3493%
2022-01-23
0.0000%
0.1942%
0.2317%
0.3695%
82.6698%
9.5777%
2.5169%
1.1724%
0.9056%
0.4432%
1.1244%
0.4327%
0.3617%
2022-01-24
0.0000%
0.1529%
0.1677%
0.2628%
83.1674%
10.2728%
1.8032%
1.2686%
0.8822%
0.4320%
0.8178%
0.4349%
0.3377%
2022-01-25
0.0000%
0.1588%
0.1748%
0.2607%
83.9039%
9.7041%
1.7497%
1.2257%
0.8594%
0.4230%
0.7947%
0.4221%
0.3230%
2022-01-26
0.0000%
0.1649%
0.1919%
0.2684%
84.5595%
9.1948%
1.7411%
1.1326%
0.8188%
0.4088%
0.7871%
0.4108%
0.3213%
2022-01-27
0.0000%
0.1706%
0.1723%
0.2653%
85.0102%
8.7534%
1.7195%
1.1492%
0.8218%
0.4177%
0.7826%
0.4201%
0.3175%
2022-01-28
0.0000%
0.1863%
0.1721%
0.2998%
85.4656%
8.3345%
1.7354%
1.1011%
0.7879%
0.4023%
0.7755%
0.4212%
0.3184%
2022-01-29
0.0000%
0.2432%
0.2524%
0.4486%
85.0456%
7.6439%
2.4780%
0.9756%
0.7196%
0.4008%
1.0169%
0.4348%
0.3406%
2022-01-30
0.0000%
0.2498%
0.2378%
0.4736%
85.6022%
7.4084%
2.3117%
0.9470%
0.6814%
0.3705%
0.9848%
0.4109%
0.3219%
2022-01-31
0.0000%
0.1921%
0.1645%
0.3336%
86.8529%
7.5929%
1.4485%
0.9938%
0.7046%
0.3647%
0.6753%
0.4006%
0.2765%
2022-02-01
0.0000%
0.1961%
0.1595%
0.4035%
87.0774%
7.3390%
1.4790%
0.9652%
0.6843%
0.3597%
0.6694%
0.3948%
0.2720%
2022-02-02
0.0000%
0.1956%
0.1629%
4.0875%
83.8040%
7.0391%
1.4431%
0.9144%
0.6703%
0.3552%
0.6702%
0.3885%
0.2692%
2022-02-03
0.0000%
0.1961%
0.1534%
10.7877%
77.4577%
6.7343%
1.4876%
0.8727%
0.6411%
0.3440%
0.6779%
0.3804%
0.2672%
2022-02-04
0.0000%
0.2091%
0.2088%
19.5037%
68.9628%
6.4236%
1.5359%
0.8393%
0.6403%
0.3368%
0.6862%
0.3818%
0.2718%
2022-02-05
0.0000%
0.3378%
0.2795%
27.7997%
59.7330%
6.1880%
2.2839%
0.7829%
0.5944%
0.3307%
0.9933%
0.3800%
0.2968%
2022-02-06
0.0000%
0.3490%
0.2758%
30.7760%
56.9533%
6.0346%
2.2841%
0.7652%
0.5892%
0.3248%
0.9688%
0.3856%
0.2937%
2022-02-07
0.0000%
0.2698%
0.2073%
31.2145%
57.4092%
6.0665%
1.6698%
0.8326%
0.6459%
0.3355%
0.6748%
0.3836%
0.2905%
2022-02-08
0.0000%
0.2835%
0.2034%
39.6256%
49.2262%
5.8524%
1.7011%
0.8005%
0.6267%
0.3329%
0.6700%
0.3867%
0.2913%
2022-02-09
0.0000%
0.2854%
0.2040%
51.7434%
37.4438%
5.5967%
1.6149%
0.7902%
0.6179%
0.3346%
0.6811%
0.3886%
0.2994%
2022-02-10
0.0000%
0.3035%
0.2056%
64.1751%
25.4399%
5.1914%
1.6026%
0.7773%
0.6148%
0.3323%
0.6678%
0.3856%
0.3042%
2022-02-11
0.0000%
0.3200%
0.2123%
70.9156%
18.9909%
4.9838%
1.4181%
0.7774%
0.6214%
0.3416%
0.7113%
0.3908%
0.3168%
2022-02-12
0.0001%
0.4216%
0.2739%
75.8758%
12.7559%
4.8394%
2.5110%
0.7159%
0.6017%
0.3329%
0.9718%
0.3929%
0.3072%
2022-02-13
0.0000%
0.4237%
0.2763%
77.6752%
11.3726%
4.6607%
2.3649%
0.6861%
0.5655%
0.3140%
0.9684%
0.3837%
0.3091%
2022-02-14
0.0000%
0.3152%
0.2083%
76.9611%
13.1654%
4.6464%
1.7167%
0.7342%
0.5899%
0.3201%
0.6560%
0.3933%
0.2934%
2022-02-15
0.0000%
0.3124%
0.2021%
79.1282%
11.3529%
4.4636%
1.6466%
0.7071%
0.5653%
0.3201%
0.6274%
0.3832%
0.2912%
2022-02-16
0.0000%
0.3243%
0.2038%
80.6639%
9.9946%
4.2701%
1.6595%
0.7158%
0.5658%
0.3122%
0.6302%
0.3760%
0.2838%
2022-02-17
0.0000%
0.3285%
0.2009%
81.8338%
8.9708%
4.1527%
1.6762%
0.6951%
0.5514%
0.3076%
0.6269%
0.3747%
0.2814%
2022-02-18
0.0008%
0.3497%
0.2078%
82.6826%
8.0582%
4.0522%
1.7689%
0.6878%
0.5474%
0.3209%
0.6655%
0.3684%
0.2897%
2022-02-19
0.0334%
0.3962%
0.3184%
83.4303%
6.2674%
4.0039%
2.4328%
0.6835%
0.5080%
0.3128%
0.9336%
0.3811%
0.2987%
2022-02-20
0.0797%
0.3311%
0.3194%
84.0234%
5.9904%
3.8715%
2.3334%
0.6594%
0.5073%
0.3056%
0.9356%
0.3620%
0.2810%
2022-02-21
0.0587%
0.2598%
0.2468%
84.1764%
6.8024%
3.8159%
1.8127%
0.6649%
0.5265%
0.3067%
0.6597%
0.3832%
0.2862%
2022-02-22
0.0632%
0.2399%
0.2450%
84.9382%
6.4595%
3.6142%
1.7137%
0.6378%
0.5159%
0.3049%
0.6299%
0.3638%
0.2741%
2022-02-23
0.0752%
0.2359%
0.2761%
85.3787%
6.0287%
3.5009%
1.7839%
0.6317%
0.5087%
0.3049%
0.6374%
0.3672%
0.2707%
2022-02-24
0.0705%
0.2362%
0.2634%
85.9954%
5.6871%
3.4246%
1.7009%
0.5988%
0.4996%
0.2919%
0.6033%
0.3600%
0.2683%
2022-02-25
0.0768%
0.2443%
0.2955%
86.3641%
5.2829%
3.3680%
1.7568%
0.5657%
0.4905%
0.2913%
0.6322%
0.3625%
0.2695%
2022-02-26
0.0986%
0.3235%
0.4231%
85.9440%
4.4333%
3.3909%
2.5171%
0.5412%
0.4798%
0.2909%
0.9168%
0.3703%
0.2705%
2022-02-27
0.1076%
0.2852%
0.4442%
86.3178%
4.2554%
3.3355%
2.4455%
0.5217%
0.4657%
0.2732%
0.8975%
0.3688%
0.2820%
2022-02-28
0.0805%
0.2264%
0.3290%
87.0944%
4.7665%
3.2002%
1.7667%
0.5552%
0.4824%
0.2741%
0.6065%
0.3504%
0.2676%
2022-03-01
0.0823%
0.2243%
0.4175%
87.4211%
4.5314%
3.0594%
1.7720%
0.5578%
0.4607%
0.2697%
0.5930%
0.3512%
0.2596%
2022-03-02
0.0813%
0.2251%
3.9680%
84.2254%
4.3094%
3.0111%
1.6974%
0.5485%
0.4639%
0.2678%
0.6025%
0.3420%
0.2575%
2022-03-03
0.0860%
0.2245%
11.9552%
76.5380%
4.1113%
2.9298%
1.6869%
0.5471%
0.4651%
0.2670%
0.5852%
0.3437%
0.2603%
2022-03-04
0.1481%
0.2362%
22.5161%
66.1485%
3.8667%
2.8832%
1.7433%
0.5229%
0.4527%
0.2609%
0.6226%
0.3430%
0.2558%
2022-03-05
0.2483%
0.3164%
33.6288%
54.2056%
3.4509%
3.0747%
2.3631%
0.4963%
0.4430%
0.2635%
0.8942%
0.3452%
0.2699%
2022-03-06
0.2651%
0.3227%
37.2905%
50.9078%
3.3400%
2.9203%
2.2912%
0.4958%
0.4426%
0.2506%
0.8726%
0.3363%
0.2644%
2022-03-07
0.1837%
0.2660%
36.9753%
52.3521%
3.5951%
2.6073%
1.6510%
0.4961%
0.4436%
0.2591%
0.5845%
0.3299%
0.2562%
2022-03-08
0.1921%
0.2728%
46.1578%
43.5044%
3.4375%
2.5065%
1.5931%
0.4913%
0.4273%
0.2568%
0.5841%
0.3277%
0.2486%
2022-03-09
0.1910%
0.2750%
58.6384%
31.1182%
3.3291%
2.5030%
1.5923%
0.4941%
0.4443%
0.2631%
0.5759%
0.3217%
0.2541%
2022-03-10
0.1983%
0.2759%
66.6023%
23.3853%
3.1888%
2.4334%
1.6060%
0.4924%
0.4216%
0.2532%
0.5752%
0.3215%
0.2462%
2022-03-11
0.2169%
0.2953%
71.2820%
18.7575%
3.0712%
2.4137%
1.6315%
0.4822%
0.4248%
0.2533%
0.6013%
0.3233%
0.2471%
2022-03-12
0.3178%
0.3579%
75.0959%
13.7713%
2.8331%
2.6181%
2.3502%
0.5067%
0.4230%
0.2547%
0.8853%
0.3329%
0.2531%
2022-03-13
0.2925%
0.3544%
76.5015%
12.4441%
2.7972%
2.6467%
2.3365%
0.5097%
0.4227%
0.2400%
0.8676%
0.3224%
0.2645%
2022-03-14
0.2183%
0.2980%
76.5209%
13.9213%
2.8796%
2.3086%
1.5790%
0.4721%
0.4184%
0.2446%
0.5742%
0.3196%
0.2454%
2022-03-15
0.2178%
0.2821%
78.3268%
12.3836%
2.7799%
2.2183%
1.5574%
0.4742%
0.4004%
0.2423%
0.5740%
0.3035%
0.2396%
2022-03-16
0.2279%
0.2746%
79.9200%
11.0179%
2.6655%
2.1855%
1.5131%
0.4623%
0.3887%
0.2386%
0.5568%
0.3099%
0.2394%
2022-03-17
0.2330%
0.2813%
81.1027%
9.9678%
2.5655%
2.1601%
1.5065%
0.4504%
0.3991%
0.2343%
0.5593%
0.3033%
0.2366%
2022-03-18
0.2561%
0.2912%
82.1716%
9.0172%
2.4236%
2.0762%
1.5907%
0.4408%
0.3820%
0.2322%
0.5850%
0.3003%
0.2331%
2022-03-19
0.3151%
0.3508%
82.1984%
7.4544%
2.3516%
2.4225%
2.3421%
0.4546%
0.4032%
0.2363%
0.8967%
0.3170%
0.2574%
2022-03-20
0.2713%
0.3462%
82.7299%
7.2246%
2.2897%
2.3687%
2.3127%
0.4359%
0.4056%
0.2296%
0.8447%
0.2944%
0.2466%
2022-03-21
0.1971%
0.2725%
83.3152%
8.0553%
2.3554%
2.0378%
1.6154%
0.4333%
0.3793%
0.2315%
0.5662%
0.3034%
0.2376%
2022-03-22
0.1822%
0.2902%
84.1726%
7.4951%
2.2640%
1.9560%
1.5519%
0.4160%
0.3707%
0.2215%
0.5526%
0.3038%
0.2235%
2022-03-23
0.1787%
0.2905%
84.8110%
7.0357%
2.1387%
1.9110%
1.5677%
0.3992%
0.3727%
0.2213%
0.5465%
0.2992%
0.2279%
2022-03-24
0.1816%
0.2881%
85.3078%
6.6819%
2.0346%
1.8871%
1.5665%
0.4017%
0.3653%
0.2162%
0.5431%
0.2961%
0.2300%
2022-03-25
0.1850%
0.3259%
85.5512%
6.3257%
1.9862%
1.8161%
1.6912%
0.3979%
0.3712%
0.2314%
0.5782%
0.3023%
0.2376%
2022-03-26
0.2513%
0.4347%
84.9980%
5.7174%
1.8887%
1.8396%
2.4636%
0.3976%
0.3775%
0.2233%
0.8562%
0.3074%
0.2447%
2022-03-27
0.2380%
0.4364%
85.5432%
5.6370%
1.7971%
1.7317%
2.3124%
0.3832%
0.3692%
0.2104%
0.8099%
0.2877%
0.2441%
2022-03-28
0.1666%
0.3208%
86.8461%
5.7222%
1.8063%
1.5579%
1.5932%
0.3879%
0.3505%
0.2161%
0.5225%
0.2842%
0.2257%
2022-03-29
0.1513%
0.5652%
87.1876%
5.3979%
1.7323%
1.4451%
1.5669%
0.3681%
0.3506%
0.2009%
0.5336%
0.2811%
0.2194%
2022-03-30
0.1576%
5.5490%
82.6303%
5.1355%
1.6597%
1.3612%
1.5718%
0.3627%
0.3415%
0.2026%
0.5277%
0.2815%
0.2187%
2022-03-31
0.1559%
14.2487%
74.3161%
4.9095%
1.5865%
1.3213%
1.5609%
0.3582%
0.3308%
0.1997%
0.5151%
0.2800%
0.2173%
2022-04-01
0.1813%
25.5917%
63.0197%
4.6924%
1.5348%
1.3091%
1.7270%
0.3518%
0.3366%
0.2027%
0.5498%
0.2824%
0.2208%
2022-04-02
0.2617%
36.0589%
50.8073%
4.7315%
1.5903%
1.4032%
2.7742%
0.3796%
0.3699%
0.2150%
0.8255%
0.3100%
0.2731%
2022-04-03
0.2696%
40.1393%
47.6733%
4.5903%
1.4216%
1.2821%
2.3981%
0.3682%
0.3410%
0.1911%
0.8276%
0.2667%
0.2313%
2022-04-04
0.2050%
40.4830%
49.2044%
4.2831%
1.3593%
1.1840%
1.5060%
0.3320%
0.3082%
0.1899%
0.5062%
0.2527%
0.1862%
2022-04-05
0.2067%
43.9099%
46.1357%
4.0916%
1.3287%
1.1513%
1.4396%
0.3215%
0.3041%
0.1849%
0.4934%
0.2481%
0.1847%
2022-04-06
0.2187%
45.9304%
43.8938%
3.9022%
1.3749%
1.1920%
1.6659%
0.3339%
0.3118%
0.1924%
0.5080%
0.2672%
0.2089%
2022-04-07
0.2248%
55.3760%
34.7892%
3.6035%
1.3432%
1.1667%
1.6971%
0.3292%
0.3116%
0.1860%
0.5093%
0.2567%
0.2067%
2022-04-08
0.2437%
65.3241%
24.9055%
3.4441%
1.3174%
1.1591%
1.7565%
0.3383%
0.3080%
0.1865%
0.5392%
0.2649%
0.2129%
2022-04-09
0.3552%
72.6629%
16.1023%
3.4380%
1.3360%
1.2065%
2.6180%
0.3881%
0.3343%
0.2036%
0.8520%
0.2712%
0.2320%
2022-04-10
0.3588%
75.0152%
14.1712%
3.3374%
1.2959%
1.1573%
2.4802%
0.3769%
0.3273%
0.1896%
0.8174%
0.2547%
0.2182%
2022-04-11
0.2514%
75.1833%
15.7071%
3.0419%
1.2542%
1.1076%
1.6913%
0.3187%
0.3001%
0.1846%
0.5052%
0.2561%
0.1983%
2022-04-12
0.2525%
77.6105%
13.5018%
2.8775%
1.2313%
1.0921%
1.6838%
0.3182%
0.2940%
0.1846%
0.4997%
0.2535%
0.2004%
2022-04-13
0.2515%
79.3135%
11.8381%
2.7657%
1.1999%
1.1073%
1.7596%
0.3188%
0.2942%
0.1894%
0.4959%
0.2597%
0.2064%
2022-04-14
0.2638%
81.6428%
10.2230%
2.6689%
1.0457%
1.0041%
1.5028%
0.2964%
0.2720%
0.1751%
0.4884%
0.2337%
0.1832%
2022-04-15
0.3107%
82.1871%
8.7132%
2.6720%
1.0914%
1.0746%
2.0693%
0.3225%
0.2960%
0.1897%
0.6075%
0.2495%
0.2165%
2022-04-16
0.4049%
82.9440%
6.8725%
2.7691%
1.0718%
1.0948%
2.6616%
0.3438%
0.3227%
0.1963%
0.8405%
0.2559%
0.2221%
2022-04-17
0.4047%
83.4272%
6.5785%
2.7740%
1.0408%
1.0796%
2.5529%
0.3526%
0.3187%
0.1759%
0.8376%
0.2427%
0.2149%
2022-04-18
0.2857%
83.8299%
7.5944%
2.5342%
1.0325%
1.0743%
1.8479%
0.3261%
0.2894%
0.1820%
0.5436%
0.2572%
0.2028%
2022-04-19
0.2766%
84.8091%
7.2881%
2.3503%
0.9702%
0.9922%
1.6394%
0.3148%
0.2756%
0.1719%
0.4804%
0.2454%
0.1860%
2022-04-20
0.2799%
85.4701%
6.7614%
2.2479%
0.9362%
0.9852%
1.6643%
0.3012%
0.2773%
0.1684%
0.4834%
0.2422%
0.1825%
2022-04-21
0.2973%
86.0018%
6.2328%
2.2261%
0.9132%
0.9700%
1.7047%
0.2971%
0.2696%
0.1666%
0.4986%
0.2399%
0.1823%
2022-04-22
0.3213%
86.3868%
5.7889%
2.1593%
0.9105%
0.9627%
1.7757%
0.2977%
0.2819%
0.1722%
0.5237%
0.2371%
0.1822%
2022-04-23
0.4968%
85.8966%
4.7296%
2.4019%
0.8974%
0.9904%
2.5055%
0.3403%
0.3033%
0.1721%
0.8126%
0.2451%
0.2084%
2022-04-24
0.4777%
85.4802%
4.7939%
2.3608%
0.9737%
1.0529%
2.7088%
0.3398%
0.3156%
0.1795%
0.7897%
0.2788%
0.2486%
2022-04-25
0.3257%
87.3284%
5.1208%
2.0780%
0.8546%
0.9471%
1.6892%
0.2974%
0.2703%
0.1654%
0.5006%
0.2404%
0.1822%
2022-04-26
0.4103%
87.7223%
4.8262%
2.0045%
0.8395%
0.9266%
1.6524%
0.2915%
0.2682%
0.1640%
0.4741%
0.2361%
0.1842%
2022-04-27
4.8221%
83.6717%
4.5406%
1.9638%
0.8197%
0.9201%
1.6594%
0.2805%
0.2673%
0.1625%
0.4782%
0.2347%
0.1792%
2022-04-28
10.2662%
78.5895%
4.2556%
1.9180%
0.8044%
0.9025%
1.6505%
0.2883%
0.2675%
0.1639%
0.4822%
0.2347%
0.1769%
2022-04-29
14.2843%
74.6277%
3.9706%
1.9208%
0.8075%
0.9010%
1.8151%
0.2902%
0.2755%
0.1664%
0.5181%
0.2346%
0.1882%
2022-04-30
18.8788%
69.1757%
3.2994%
2.1357%
0.8096%
0.9441%
2.6950%
0.3253%
0.2932%
0.1724%
0.8318%
0.2364%
0.2026%
Chrome, Edge, and Firefox all have similar release cycles with releases every four weeks. Graphing Chrome traffic by version from January through April shows us how quickly older versions of these evergreen browsers fall off. We see peak-to-peak traffic around every four weeks, with a two week period where a single version represents more than 80% of all traffic for that browser.
This shows us that the promise of evergreen browsers is here today. The days of targeting one specific version of one browser are long gone. In fact, trying to do so today would be untenable. The Web Systems Team at GitHub removed the last traces of conditionals based on the user agent header in January 2020, and recorded an internal ADR explicitly disallowing this pattern due to how hard it is to maintain code that relies on user agent header parsing.
With that said, we still need to ensure some compatibility for user agents, which do not fall into the neat box of evergreen browsers. Universal access is important, and 1% of 73 million users is still 730,000 users.
Older browsers
When looking at the remaining 4% of browser traffic, we not only see very old versions of the most popular browsers, but also a diverse array of other branded user agents. Alongside older versions of Chrome (80-89 make up 1%, and 70-79 make up 0.2%), there are also Chromium forks, like QQ Browser (0.085%), Naver Whale (0.065%), and Silk (0.003%). Alongside older versions of Firefox (80-89 make up 0.12%, and 70-79 at 0.09%) there are Firefox forks, like IceWeasel (0.0002%) and SeaMonkey (0.0004%). The data also contains lots of esoteric user agents too, such as those from TVs, e-readers, and even refrigerators. In total, we’ve seen close to 20 million unique user agent strings visiting GitHub in 2022 alone.
Another vector we look at is logged-in vs. logged-out usage. As a whole, around 20% of the visits to GitHub come from browsers with logged-out sessions, but when looking at older browsers, the proportion of logged-out visits is much higher. For example, requests coming from Amazon Silk make up around 0.003% of all visits, but 80% of those visits are with logged-out sessions. Meaning, the number of logged-in visits on Silk is closer to 0.0006%. Users making requests with forked browsers also tend to make requests from evergreen browsers. For example, users making requests with SeaMonkey do so for 37% of their usage, while the other 63% come from Chrome or Firefox user agents.
We consider logged-in vs. logged-out, and main vs. a secondary browser to be important distinctions, because the usage patterns are quite different. Actions that a logged-out user takes (reading issues and pull requests, cloning repositories, and browsing files) are quite different to the actions a logged-in user takes (replying to issues and reviewing pull requests, starring repositories, editing files, and looking at their dashboard). Logged-out activities tend to be more “read only” actions, which means they hit very few paths that require JavaScript to run. Whereas logged-in users tend to perform the kind of rich interactions that require JavaScript.
With JavaScript disabled, you’re still able to log in, comment on issues and pull requests (although our rich markdown toolbar won’t work), browse source code (with syntax highlighting), search for repositories, and even star, watch, or fork them. Popover menus even work, thanks to the clever use of the HTML <details> element.
How we engineer for older browsers
With such a multitude of browsers, with various levels of standards compliance, we cannot expect our engineers to know the intricacies of each. We also don’t have the resources to test on the hundreds of browsers across thousands of operating system and version combinations we see, while 0.0002% of you are using your Tesla to merge pull requests, a Model 3 won’t fit into our testing budget!
Instead, we use a few industry standard practices, like linting and polyfills, to make sure we’re delivering a good baseline experience:
Static code analysis (linting) to catch browser compatibility issues:
We love ESLint. It’s great at catching classes of bugs, as well as enforcing style, for which we have extensive configurations, but it can also be useful for catching cross-browser bugs. We use amilajack/eslint-plugin-compat for guarding against use of features that aren’t well supported, and we’re not prepared to polyfill (for example, ResizeObserver). We also use keithamus/eslint-plugin-escompat for catching use of syntax that browsers do not support, and we don’t polyfill or transpile. These plugins are incredibly useful for catching quirks, for example, older versions of Edge supported destructuring, but in some instances these caused a SyntaxError. By linting for this corner case, we were able to ship native destructuring syntax to all browsers with a lint check to prevent engineers from hitting SyntaxErrors. Shipping native destructuring syntax allowed us to remove multiple kilobytes of transpiled code and helper functions, while linting kept code stable for older versions of Edge.
Polyfills to patch browsers with modern features
Past iterations of our codebase made liberal use of polyfills, such as mdn-polyfills, es6-promise, template-polyfill, and custom-event-polyfill, to name a few. Managing polyfills was burdensome and in some cases hurt performance. We were restricted in certain ways. For example, we postponed adoption of ShadowDOM due to the poor performance of polyfills available at the time.
More recently, our strategy has been to maintain a small list of polyfills for code features that are easy enough to polyfill with low impact. These polyfills are open sourced in our browser-support repository. In this repository, we also maintain a function that checks if a browser has a base set of functionality necessary to run GitHub’s JavaScript. This check expects variables, like Blob, globalThis, and MutationObserver to exist. If a browser doesn’t pass this check, JavaScript still executes, but any uncaught exceptions will not be reported to our error reporting library that we call failbot. By preventing browsers that don’t meet our minimum requirements, we reduce the amount of noise in our error reporting systems, which increases the value of error reporting software dramatically. Here’s some relevant code from failbot.ts:
import{isSupported}from'@github/browser-support'constextensions=/(chrome|moz|safari)-extension:\/\//// Does this stack trace contain frames from browser extensions?functionisExtensionError(stack: PlatformStackframe[]): boolean{returnstack.some(frame=>extensions.test(frame.filename)||extensions.test(frame.function))}leterrorsReported=0functionreportable(){returnerrorsReported<10&&isSupported()}exportasyncfunctionreport(context: PlatformReportBrowserErrorInput){if(!reportable())returnif(isExtensionError())returnerrorsReported++// ... }
Safari 12.1 doesn’t support String.matchAll, which isn’t something we polyfill, but it is something we consider “base level support.” So, while GitHub may work in Safari 12.1, it isn’t something we test for, and uncaught exceptions from this browser aren’t sent to our error reporting systems.
Shipping changes and validating data
When it comes to making a change, like shipping native optional chaining syntax, one tool we reach for is an internal CLI that lets us quickly generate Markdown tables that can be added to pull requests introducing new native syntax or features that require polyfilling. This internal CLI tool uses mdn/browser-compat-data and combines it with the data we have to generate a Can I Use-style feature table, but tailored to our usage data and the requested feature. For example:
We can then take this table and paste it into a pull request description to help provide data at the fingertips of whoever is reviewing the pull request, to ensure that we’re making decisions that are inline with our principles.
This CLI tool has a few more features. It actually generated all the tables in this post, which we could then easily generate graphs with. For quick glances at feature tables, it also allows for exporting of our analytics table into a JSON format that we can import into Can I Use.
browser-support-cli $ ./browsers.js
Usage:
node browsers.js <query>
Examples:
node browsers.js --stats [--csv] # Show usage stats by browser+version
node browsers.js --last-ten [--csv] # Show usage stats of the last 10 major versions, by vendor
node browsers.js --cadence [--csv] # Show release cadence stats
node browsers.js --caniuse # Output a `simple.json` for import into caniuse.com
node browsers.js --html <query># Output html for github.github.io/browser-support
Wrap-up
This is how GitHub thinks about our users and the browsers they use. We back up our principles with tooling and data to make sure we’re delivering a fast and reliable service to as many users as possible.
Concepts like progressive enhancement allow us to deliver the best experience possible to the majority of customers, while delivering a useful experience to those using older browsers.
Facial recognition technology is one of the many modern technologies that previously only appeared in science fiction movies. The roots of this technology can be traced back to the 1960s and have since grown dramatically due to the rise of deep learning techniques and accelerated digital transformation in recent years.
In this blog post, we will talk about the various applications of facial recognition technology in Grab, as well as provide details of the technical components that build up this technology.
Application of facial recognition technology
At Grab, we believe in prevention, protection, and action to create a safer every day for our consumers, partners, and the community as a whole. All selfies collected by Grab are handled according to Grab’s Privacy Policy and securely protected under privacy legislation in the countries in which we operate. We will elaborate in detail in a section further below.
One key incident prevention method is to verify the identity of both our consumers and partners:
From the perspective of protecting the safety of passengers, having a reliable driver authentication process can avoid unauthorized people from delivering a ride. This ensures that trips on Grab are only completed by registered licensed driver-partners that have passed our comprehensive background checks.
From the perspective of protecting the safety of driver-partners, verifying the identity of new passengers using facial recognition technology helps to deter crimes targeting our driver-partners and make incident investigations easier.
Safety incidents that arise from lack of identity verification
Facial recognition technology is also leveraged to improve Grab digital financial services, particularly in facilitating the “electronic Know Your Customer” (e-KYC) process. KYC is a standard regulatory requirement in the financial services industry to verify the identity of customers, which commonly serves to deter financial crime, such as money laundering.
Traditionally, customers are required to visit a physical counter to verify their government-issued ID as proof of identity. Today, with the widespread use of mobile devices, coupled with the maturity of facial recognition technologies, the process has become much more seamless and can be done entirely digitally.
Figure 1: GrabPay wallet e-KYC regulatory requirements in the Philippines
Overview of facial recognition technology
Figure 2: Face recognition flow
The typical facial recognition pipeline involves multiple stages, which starts with image preprocessing, face anti-spoof, followed by feature extraction, and finally the downstream applications – face verification or face search.
The most common image preprocessing techniques for face recognition tasks are face detection and face alignment. The face detection algorithm locates the face region in an image, and is usually followed by face alignment, which identifies the key facial landmarks (e.g. left eye, right eye, nose, etc.) and transforms them into a standardised coordinate space. Both of these preprocessing steps aim to ensure a consistent quality of input data for downstream applications.
Face anti-spoof refers to the process of ensuring that the user-submitted facial image is legitimate. This is to prevent fraudulent users from stealing identities (impersonating someone else by using a printed photo or replaying videos from mobile screens) or hiding identities (e.g. wearing a mask). The main approach here is to extract low-level spoofing cues, such as the moiré pattern, using various machine learning techniques to determine whether the image is spoofed.
After passing the anti-spoof checks, the user-submitted images are sent for face feature extraction, where important features that can be used to distinguish one person from another are extracted. Ideally, we want the feature extraction model to produce embeddings (i.e. high-dimensional vectors) with small intra-class distance (i.e. faces of the same person) and large inter-class distance (i.e. faces of different people), so that the aforementioned downstream applications (i.e. face verification and face search) become a straightforward task – thresholding the distance between embeddings.
Face verification is one of the key applications of facial recognition and it answers the question, “Is this the same person?”. As previously alluded to, this can be achieved by comparing the distance between embeddings generated from a template image (e.g. government-issued ID or profile picture) and a query image submitted by the user. A short distance indicates that both images belong to the same person, whereas a large distance indicates that these images are taken from different people.
Face search, on the other hand, tackles the question, “Who is this person?”, which can be framed as a vector/embedding similarity search problem. Image embeddings belonging to the same person would be highly similar, thus ranked higher, in search results. This is particularly useful for deterring criminals from re-onboarding to our platform by blocking new selfies that match a criminal profile in our criminal denylist database.
Face anti-spoof
For face anti-spoof, the most common methods used to attack the facial recognition system are screen replay and printed paper. To distinguish these spoof attacks from genuine faces, we need to solve two main challenges.
The first challenge is to obtain enough data of spoof attacks to enable the training of models. The second challenge is to carefully train the model to focus on the subtle differences between spoofed and genuine cases instead of overfitting to other background information.
Figure 3: Original face (left), screen replay attack (middle), synthetic data with a moiré pattern (right)
Collecting large volumes of spoof data is naturally hard since spoof cases in product flows are very rare. To overcome this problem, one option is to synthesise large volumes of spoof data instead of collecting the real spoof data. More specifically, we synthesise moiré patterns on genuine face images that we have, and use the synthetic data as the screen replay attack data. This allows our model to use small amounts of real spoof data and sufficiently identify spoofing, while collecting more data to train the model.
Figure 4: Data preparation with patch data
On the other hand, a spoofed face image contains lots of information with subtle spoof cues such as moiré patterns that cannot be detected by the naked eye. As such, it’s important to train the model to identify spoof cues instead of focusing on the possible domain bias between the spoof data and genuine data. To achieve this, we need to change the way we prepare the training data.
Instead of using the entire selfie image as the model input, we firstly detect and crop the face area, then evenly split the cropped face area into several patches. These patches are used as input to train the model. During inference, images are also split into patches the same way and the final result will be the average of outputs from all patches. After this data preprocessing, the patches will contain less global semantic information and more local structure features, making it easier for the model to learn and distinguish spoofed and genuine images.
Face verification
“Data is food for AI.” – Andrew Ng, founder of Google Brain
The key success factors of artificial intelligence (AI) models are undoubtedly driven by the volume and quality of data we hold. At Grab, we have one of the largest and most comprehensive face datasets, covering a wide range of demographic groups in Southeast Asia. This gives us a strong advantage to build a highly robust and unbiased facial recognition model that serves the region better.
As mentioned earlier, all selfies collected by Grab are securely protected under privacy legislation in the countries in which we operate. We take reasonable legal, organisational and technical measures to ensure that your Personal Data is protected, which includes measures to prevent Personal Data from getting lost, or used or accessed in an unauthorised way. We limit access to these Personal Data to our employees on a need to know basis. Those processing any Personal Data will only do so in an authorised manner and are required to treat the information with confidentiality.
Also, selfie data will not be shared with any other parties, including our driver, delivery partners or any other third parties without proper authorisation from the account holder. They are strictly used to improve and enhance our products and services, and not used as a means to collect personal identifiable data. Any disclosure of personal data will be handled in accordance with Grab Privacy Policy.
Other than data, model architecture also plays an important role, especially when handling less common face verification scenarios, such as ”selfie to ID photo” and “selfie to masked selfie” verifications.
The main challenge of “selfie to ID photo” verification is the shallow nature of the dataset, i.e. a large number of unique identities, but a low number of image samples per identity. This type of dataset lacks representation in intra-class diversity, which would commonly lead to model collapse during model training. Besides, “selfie to ID photo” verification also poses numerous challenges that are different from general facial recognition, such as aging (old ID photo), attrited ID card (normal wear and tear), and domain difference between printed ID photo and real-life selfie photo.
To address these issues, we leveraged a novel training method named semi-Siamese training (SST) 2, which is proposed by Du et al. (2020). The key idea is to enlarge intra-class diversity by ensuring that the backbone Siamese networks have similar parameters, but are not entirely identical, hence the name “semi-Siamese”.
Just like typical Siamese network architecture, feature vectors generated by the subnetworks are compared to compute the loss functions, such as Arc-softmax, Triplet loss, and Large margin cosine loss, all of which aim to reduce intra-class distance while increasing the inter-class distances. With the usage of the semi-Siamese backbone network, intra-class diversity is further promoted as it is guaranteed by the difference between the subnetworks, making the training convergence more stable.
Figure 6: Masked face verification
Another type of face verification problem we need to solve these days is the “selfie to masked selfie” verification. To pass this type of face verification, users are required to take off their masks as previous face verification models are unable to verify people with masks on. However, removing face masks to do face verification is inconvenient and risky in a crowded environment, which is a pain for many of our driver-partners who need to do verification from time to time.
To help ease this issue, we developed a face verification model that can verify people even while they are wearing masks. This is done by adding masked selfies into the training data and training the model with both masked and unmasked selfies. This not only enables the model to perform verification for people with masks on, but also helps to increase the accuracy of verifying those without masks. On top of that, masked selfies act as data augmentation and help to train the model with stronger ability of extracting features from the face.
Face search
As previously mentioned, once embeddings are produced by the facial recognition models, face search is fundamentally no different from face verification. Both processes use the distance between embeddings to decide whether the faces belong to the same person. The only difference here is that face search is more computationally expensive, since face verification is a 1-to-1 comparison, whereas face search is a 1-to-N comparison (N=size of the database).
In practice, there are many ways to significantly reduce the complexity of the search algorithm from O(N), such as using Inverted File Index (IVF) and Hierarchical Navigable Small World (HNSW) graphs. Besides, there are also various methods to increase the query speed, such as accelerating the distance computation using GPU, or approximating the distances using compressed vectors. This problem is also commonly known as Approximate Nearest Neighbor (ANN). Some of the great open-sourced vector similarity search libraries that can help to solve this problem are ScaNN3 (by Google), FAISS4(by Facebook), and Annoy (by Spotify).
What’s next?
In summary, facial recognition technology is an effective crime prevention and reduction tool to strengthen the safety of our platform and users. While the enforcement of selfie collection by itself is already a strong deterrent against fraudsters misusing our platform, leveraging facial recognition technology raises the bar by helping us to quickly and accurately identify these offenders.
As technologies advance, face spoofing patterns also evolve. We need to continuously monitor spoofing trends and actively improve our face anti-spoof algorithms to proactively ensure our users’ safety.
With the rapid growth of facial recognition technology, there is also a growing concern regarding data privacy issues. At Grab, consumer privacy and safety remain our top priorities and we continuously look for ways to improve our existing safeguards.
In May 2022, Grab was recognised by the Infocomm Media Development Authority in Singapore for its stringent data protection policies and processes through the award of Data Protection Trustmark (DPTM) certification. This recognition reinforces our belief that we can continue to draw the benefits from facial recognition technology, while avoiding any misuse of it. As the saying goes, “Technology is not inherently good or evil. It’s all about how people choose to use it”.
Join us
Grab is the leading superapp platform in Southeast Asia, providing everyday services that matter to consumers. More than just a ride-hailing and food delivery app, Grab offers a wide range of on-demand services in the region, including mobility, food, package and grocery delivery services, mobile payments, and financial services across 428 cities in eight countries.
Powered by technology and driven by heart, our mission is to drive Southeast Asia forward by creating economic empowerment for everyone. If this mission speaks to you, join our team today!
References
Niu, D., Guo R., and Wang, Y. (2021). Moiré Attack (MA): A New Potential Risk of Screen Photos. Advances in Neural Information Processing Systems. https://papers.nips.cc/paper/2021/hash/db9eeb7e678863649bce209842e0d164-Abstract.html ↩
Du, H., Shi, H., Liu, Y., Wang, J., Lei, Z., Zeng, D., & Mei, T. (2020). Semi-Siamese Training for Shallow Face Learning. European Conference on Computer Vision, 36–53. Springer. ↩
Guo, R., Sun, P., Lindgren, E., Geng, Q., Simcha, D., Chern, F., & Kumar, S. (2020). Accelerating Large-Scale Inference with Anisotropic Vector Quantization. International Conference on Machine Learning. https://arxiv.org/abs/1908.10396 ↩
Johnson, J., Douze, M., & Jégou, H. (2019). Billion-scale similarity search with GPUs. IEEE Transactions on Big Data, 7(3), 535–547. ↩
When we formally introduced Atom in 2014, we set out to give developers a text editor that was deeply customizable but also easy to use—one that made it possible for more people to build software. While that goal of growing the software creator community remains, we’ve decided to retire Atom in order to further our commitment to bringing fast and reliable software development to the cloud via Microsoft Visual Studio Code and GitHub Codespaces.
Today, we’re announcing that we are sunsetting Atom and will archive all projects under the organization on December 15, 2022.
Why are we doing this now?
Atom has not had significant feature development for the past several years, though we’ve conducted maintenance and security updates during this period to ensure we’re being good stewards of the project and product. As new cloud-based tools have emerged and evolved over the years, Atom community involvement has declined significantly. As a result, we’ve decided to sunset Atom so we can focus on enhancing the developer experience in the cloud with GitHub Codespaces.
This is a tough goodbye. It’s worth reflecting that Atom has served as the foundation for the Electron framework, which paved the way for the creation of thousands of apps, including Microsoft Visual Studio Code, Slack, and our very own GitHub Desktop. However, reliability, security, and performance are core to GitHub, and in order to best serve the developer community, we are archiving Atom to prioritize technologies that enable the future of software development.
What happens next?
We recognize that Atom is still used by the community and want to acknowledge that migrating to an alternative solution takes time and energy. We are committed to helping users and contributors plan for their migration.
Today, we’re announcing the sunset date six months out.
Over the next six months, we’ll continue to inform Atom users of the sunset in the product and on atom.io.
On December 15, 2022, we will archive the atom/atom repository and all other repositories remaining in the Atom organization.
Thank you
GitHub and our community have benefited tremendously from those who have filed issues, created extensions, fixed bugs, and built new features on Atom. Atom played an integral part in many developers’ journeys, and we look forward to building and shaping the next chapter of software development together.
If you’re like me, you’re still excited by last week’s news that Dependabot is generally available on GitHub Enterprise Server (GHES). Developers using GHES can now let Dependabot secure their dependencies and keep them up-to-date. You know who would have loved that? Me at my last job.
Before joining GitHub, I spent five years working on teams that relied on GHES to host our code. As a GHES user, I really, really wanted Dependabot. Here’s why.
Dependencies
One constant pain point for my previous teams was staying on top of dependencies. Creating a Rails project with rails new results in an app with 74 dependencies, Django apps start with 88 dependencies, and a project initialized with Create React App will have 1,432 dependencies!
Unfortunately, security vulnerabilities happen, and they can expose your customers to existential risk, so it’s important they are handled as soon as they’re published.
As I’m most familiar with the Ruby ecosystem, I’ll use Nokogiri, a gem for parsing XML and HTML, to illustrate the process of manually resolving a vulnerability. Nokogiri has been a dependency of every Rails app I’ve maintained. It’s also seen seven vulnerabilities since 2019. To fix these manually, we’ve had to:
Patch Nokogiri in `my_rails_app` to a non-vulnerable version
Push the changes and open a pull request
Wait for CI to pass
Get the necessary reviews
Deploy, observe, and merge
This is just one of (at least) 74 dependencies in one Rails app. My team maintained 14 Rails apps in our microservices-based architecture, so we needed to repeat the process for each app. A single vulnerability would eat up days of engineering time. That’s just one dependency in one ecosystem. We also worked on apps written in Elixir, Python, JavaScript, and PHP.
If an engineer was patching vulnerabilities, they couldn’t pursue feature work, the thing our customers could actually see. This would, understandably, lead to conversations about which vulnerabilities were most likely to be exploited and which we could tolerate for now.
If we had Dependabot security updates, that process would have started with a pull request. What took an engineer days to complete on their own could have been done before lunch.
We could have invested in keeping all of our dependencies up-to-date. Incremental upgrades are typically easier to perform and pose less risk. They also give bad actors less time to find and exploit vulnerabilities. One of my previous teams was still running Rails 3.2, which was no longer maintained when Rails 6 was released six years later. As support phased out, we had to apply our own security patches to our codebase instead of getting them from the framework. This made upgrading even harder. We spent years trying to get to a supported version, but other product priorities always won out.
If my team had Dependabot version updates, Dependabot would have opened pull requests each time a new version of Rails was released. We’d still need to make changes to ensure our apps were compliant with the new versions, but the changes would be made incrementally, making the lift much lighter. But we didn’t have Dependabot. We had to upgrade manually, and that meant upgrading didn’t happen until it became a P0.
A new home
I joined GitHub in 2021 to work on Dependabot. Being intimately familiar with the challenges Dependabot could help address, I wanted to be part of the solution. Little did I know, the team was just starting the process of bringing Dependabot to GHES. Call it serendipity, a dream come true, or tea leaves arranged just so.
I quickly realized why Dependabot wasn’t already on GHES. GitHub acquired Dependabot in 2019, and it took some time to scale Dependabot to be able to secure GitHub’s millions of repositories. To achieve this, we ported the service’s backend to run on Moda, GitHub’s internal Kubernetes-based platform. The dependency update jobs that result in pull requests were updated to run on lightweight Firecracker VMs, allowing Dependabot to create millions of pull requests in just hours. It was an impressive effort by a small team.
That effort, however, didn’t lend itself to the architecture of GHES, where everything runs on a single server with limited resources. An auto-scaling backend and network of VMs wasn’t an option. Instead, we needed to port Dependabot’s backend to run on Nomad, the container orchestration option on GHES. The jobs running on Firecracker VMs needed to run on our customers’ hardware. Fortunately, organizations can self-host GitHub Actions runners in GHES, so we adapted them to run on GitHub Actions. We also had to adjust our development processes to support continuous delivery in the cloud and less frequent GHES releases.
The result is that developers relying on GHES now have the option to have their dependencies updated for them. Now, my former teammates can update their dependencies by:
Viewing the already opened pull request
Reviewing the pull request and the included release notes
Deploying, observing, and merging
We’re really proud of that. As for me, I get the immense satisfaction of knowing that I built something that will directly benefit my former teammates. It doesn’t get much better than that!
Guess what? GitHub is hiring. What would you like to make better?
If you’re inspired to work at GitHub, we’d love for you to join us. Check out our Careers page to see all of our current job openings.
Dedicated remote-first company with flexible hours
Building great products used by tens of millions of people and companies around the world
Committed to nurturing a diverse and inclusive workplace
In an introductory article, we talked about the importance of Graph Networks in fraud detection. In this article, we will be adding some further context on graphs, graph technology and some common use cases.
Connectivity is the most prominent feature of today’s networks and systems. From molecular interactions, social networks and communication systems to power grids, shopping experiences or even supply chains, networks relating to real-world systems are not random. This means that these connections are not static and can be displayed differently at different times. Simple statistical analysis is insufficient to effectively characterise, let alone forecast, networked system behaviour.
As the world becomes more interconnected and systems become more complex, it is more important to employ technologies that are built to take advantage of relationships and their dynamic properties. There is no doubt that graphs have sparked a lot of attention because they are seen as a means to get insights from related data. Graph theory-based approaches show the concepts underlying the behaviour of massively complex systems and networks.
What are graphs?
Graphs are mathematical models frequently used in network science, which is a set of technological tools that may be applied to almost any subject. To put it simply, graphs are mathematical representations of complex systems.
Origin of graphs
The first graph was produced in 1736 in the city of Königsberg, now known as Kaliningrad, Russia. In this city, there were two islands with two mainland sections that were connected by seven different bridges.
Famed mathematician Euler wanted to plot a journey through the entire city by crossing each bridge only once. Euler proceeded to abstract the four regions of the city and the seven bridges into edges but he demonstrated that the problem was unsolvable. A simplified abstract graph is shown in Fig 1.
Fig 1 Abstraction graph
The graph’s four dots represent Königsberg’s four zones, while the lines represent the seven bridges that connect them. Zones connected by an even number of bridges is clearly navigable because several paths to enter and exit are available. Zones connected by an odd number of bridges can only be used as starting or terminating locations because the same route can only be taken once.
The number of edges associated with a node is known as the node degree. If two nodes have odd degrees and the rest have even degrees, the Königsberg problem could be solved. For example, exactly two regions must have an even number of bridges while the rest have an odd number of bridges. However, as illustrated in Fig 1, no Königsberg location has an even number of bridges, rendering this problem unsolvable.
Definition of graphs
A graph is a structure that consists of vertices and edges. Vertices, or nodes, are the objects in a problem, while edges are the links that connect vertices in a graph.
Vertices are the fundamental elements that a graph requires to function; there should be at least one in a graph. Vertices are mathematical abstractions that refer to objects that are linked by a condition.
On the other hand, edges are optional as graphs can still be defined without any edges. An edge is a link or connection between any two vertices in a graph, including a connection between a vertex and itself. The idea is that if two vertices are present, there is a relationship between them.
We usually indicate V={v1, v2, …, vn} as the set of vertices, and E = {e1, e2, …, em} as the set of edges. From there, we can define a graph G as a structure G(V, E) which models the relationship between the two sets:
Fig 2 Graph structure
It is worth noting that the order of the two sets within parentheses matters, because we usually express the vertices first, followed by the edges. A graph H(X, Y) is therefore a structure that models the relationship between the set of vertices X and the set of edges Y, not the other way around.
Graph data model
Now that we have covered graphs and their typical components, let us move on to graph data models, which help to translate a conceptual view of your data to a logical model. Two common graph data formats are Resource Description Framework (RDF) and Labelled Property Graph (LPG).
Resource Description Framework (RDF)
RDF is typically used for metadata and facilitates standardised exchange of data based on their relationships. RDFs typically consist of a triple: a subject, a predicate, and an object. A collection of such triples is an RDF graph. This can be depicted as a node and a directed edge diagram, with each triple representing a node-edge-node graph, as shown in Fig 3.
Literals – data type value, i.e. text, integer, etc.
Blank nodes – have no identification; similar to anonymous or existential variables.
Let us use an example to illustrate this. We have a person with the name Art and we want to plot all his relationships. In this case, the IRI is http://example.org/art and this can be shortened by defining a prefix like ex.
In this example, the IRI http://xmlns.com/foaf/0.1/knows defines the relationship knows. We define foaf as the prefix for http://xmlns.com/foaf/0.1/. The following code snippet shows how a graph like this will look.
In the last two lines, you can see how a literal and blank node would be depicted in an RDF graph. The variable foaf:age is a literal node with the integer value of 23, while foaf:based_near is an anonymous spatial entity with a node identifier of underscore. Outside the context of this graph, o1 is a data identifier with no meaning.
Multiple IRIs, intended for use in RDF graphs, are typically stored in an RDF vocabulary. These IRIs often begin with a common substring known as a namespace IRI. In some cases, namespace IRIs are also associated with a short name known as a namespace prefix. In the example above, http://xmlns.com/foaf/0.1/ is the namespace IRI and foaf and ex are namespace prefixes.
Note: RDF graphs are considered atemporal as they provide a static snapshot of data. They can use appropriate language extensions to communicate information about events or other dynamic properties of entities.
An RDF dataset is a set of RDF graphs that includes one or more named graphs as well as exactly one default graph. A default graph is one that can be empty, and has no associated IRI or name, while each named graph has an IRI or a blank node corresponding to the RDF graph and its name. If there is no named graph specified in a query, the default graph is queried (hence its name).
Labelled Property Graph (LPG)
A labelled property graph is made up of nodes, links, and properties. Each node is given a label and a set of characteristics in the form of arbitrary key-value pairs. The keys are strings, and the values can be any data type. A relationship is then defined by adding a directed edge that is labelled and connects two nodes with a set of properties.
In Fig 4, we have an LPG that shows two nodes: art and bea. The bea node has two characteristics, age and proximity, that are connected by a known edge. This edge has the attribute since because it commemorates the year that art and bea first met.
Fig 4 Labelled Property Graph: Example 1
Nodes, edges and properties must be defined when designing an LPG data model. In this scenario, based_near might not be applicable to all vertices, but they should be defined. You might be wondering, why not represent the city Seattle as a node and add an edge marked as based_near that connects a person and the city?
In general, if there is a value linked to a large number of other nodes in the network and it requires additional properties to correlate with other nodes, it should be represented as a node. In this scenario, the architecture defined in Fig 5 is more appropriate for traversing based_near connections. It also gives us the ability to link any new attributes to the based_near relationship.
Fig 5 Labelled Property Graph: Example 2
Now that we have the context of graphs, let us talk about graph databases, how they help with large data queries and the part they play in Graph Technology.
Graph database
A graph database is a type of NoSQL database that stores data using network topology. The idea is derived from LPG, which represents data sets with vertices, edges, and attributes.
Vertices are instances or entities of data that represent any object to be tracked, such as people, accounts, locations, etc.
Edges are the critical concepts in graph databases which represent relationships between vertices. The connections have a direction that can be unidirectional (one-way) or bidirectional (two-way).
Properties represent descriptive information associated with vertices. In some cases, edges have properties as well.
Graph databases provide a more conceptual view of data that is closer to reality. Modelling complex linkages becomes simpler because interconnections between data points are given the same weight as the data itself.
Graph database vs. relational database
Relational databases are currently the industry norm and take a structured approach to data, usually in the form of tables. On the other hand, graph databases are agile and focus on immediate relationship understanding. Neither type is designed to replace the other, so it is important to know what each database type has to offer.
Fig 6 Graph database vs relational database
There is a domain for both graph and relational databases. Graph databases outperform typical relational databases, especially in use cases involving complicated relationships, as they take a more naturalistic and flowing approach to data.
The key distinctions between graph and relational databases are summarised in the following table:
Type
Graph
Relational
Format
Nodes and edges with properties
Tables with rows and columns
Relationships
Represented with edges between nodes
Created using foreign keys between tables
Flexibility
Flexible
Rigid
Complex queries
Quick and responsive
Requires complex joins
Use case
Systems with highly connected relationships
Transaction focused systems with more straightforward relationships
Table. 1 Graph vs. Relational Databases
Advantages and disadvantages
Every database type has its advantages and disadvantages; knowing the distinctions as well as potential options for specific challenges is crucial. Graph databases are a rapidly evolving technology with improved functions compared with other database types.
Advantages
Some advantages of graph databases include:
Agile and flexible structures.
Explicit relationship representation between entities.
Real-time query output – speed depends on the number of relationships.
Disadvantages
The general disadvantages of graph databases are:
No standardised query language; depends on the platform used.
Not suitable for transactional-based systems.
Small user base, making it hard to find troubleshooting support.
Graph technology
Graph technology is the next step in improving analytics delivery. Traditional analytics is insufficient to meet complicated business operations, distribution, and analytical concerns as data quantities expand.
Graph technology aids in the discovery of unknown correlations in data that would otherwise go undetected or unanalysed. When the term graph is used to describe a topic, three distinct concepts come to mind: graph theory, graph analytics, and graph data management.
Graph theory – A mathematical notion that uses stack ordering to find paths, linkages, and networks of logical or physical objects, as well as their relationships. Can be used to model molecules, telephone lines, transport routes, manufacturing processes, and many other things.
Graph analytics – The application of graph theory to uncover nodes, edges, and data linkages that may be assigned semantic attributes. Can examine potentially interesting connections in data found in traditional analysis solutions, using node and edge relationships.
Graph database – A type of storage for data generated by graph analytics. Filling a knowledge graph, which is a model in data that indicates a common usage of acquired knowledge or data sets expressing a frequently held notion, is a typical use case for graph analytics output.
While the architecture and terminology are sometimes misunderstood, graph analytics’ output can be viewed through visualisation tools, knowledge graphs, particular applications, and even some advanced dashboard capabilities of business intelligence tools. All three concepts above are frequently used to improve system efficiency and even to assist in dynamic data management. In this approach, graph theory and analysis are inextricably linked, and analysis may always rely on graph databases.
Graph-centric user stories
Fraud detection
Traditional fraud prevention methods concentrate on discrete data points such as individual accounts, devices, or IP addresses. However, today’s sophisticated fraudsters avoid detection by building fraud rings using stolen and fake identities. To detect such fraud rings, we need to look beyond individual data points to the linkages that connect them.
Graph technology greatly transcends the capabilities of a relational database, by revealing hard-to-find patterns. Enterprise businesses also employ Graph technology to supplement their existing fraud detection skills to tackle a wide range of financial crimes, including first-party bank fraud, fraud, and money laundering.
Real-time recommendations
An online business’s success depends on systems that can generate meaningful recommendations in real time. To do so, we need the capacity to correlate product, customer, inventory, supplier, logistical, and even social sentiment data in real time. Furthermore, a real-time recommendation engine must be able to record any new interests displayed during the consumer’s current visit in real time, which batch processing cannot do.
Graph databases outperform relational and other NoSQL data stores in terms of delivering real-time suggestions. Graph databases can easily integrate different types of data to get insights into consumer requirements and product trends, making them an increasingly popular alternative to traditional relational databases.
Supply chain management
With complicated scenarios like supply chains, there are many different parties involved and companies need to stay vigilant in detecting issues like fraud, contamination, high-risk areas or unknown product sources. This means that there is a need to efficiently process large amounts of data and ensure transparency throughout the supply chain.
To have a transparent supply chain, relationships between each product and party need to be mapped out, which means there will be deep linkages. Graph databases are great for these as they are designed to search and analyse data with deep links. This means they can process enormous amounts of data without performance issues.
Identity and access management
Managing multiple changing roles, groups, products and authorisations can be difficult, especially in large organisations. Graph technology integrates your data and allows quick and effective identity and access control. It also allows you to track all identity and access authorisations and inheritances with significant depth and real-time insights.
Network and IT operations
Because of the scale and complexity of network and IT infrastructure, you need a configuration management database (CMDB) that is far more capable than relational databases. Neptune is an example of a CMDB and graph database that allows you to correlate your network, data centre, and IT assets to aid troubleshooting, impact analysis, and capacity or outage planning.
A graph database allows you to integrate various monitoring tools and acquire important insights into the complicated relationships that exist between various network or data centre processes. Possible applications of graphs in network and IT operations range from dependency management to automated microservice monitoring.
Risk assessment and monitoring
Risk assessment is crucial in the fintech business. With multiple sources of credit data such as ecommerce sites, mobile wallets and loan repayment records, it can be difficult to accurately assess an individual’s credit risk. Graph Technology makes it possible to combine these data sources, quantify an individual’s fraud risk and even generate full credit reviews.
One clear example of this is IceKredit, which employs artificial intelligence (AI) and machine learning (ML) techniques to make better risk-based decisions. With Graph technology, IceKredit has also successfully detected unreported links and increased efficiency of financial crime investigations.
Social network
Whether you’re using stated social connections or inferring links based on behaviour, social graph databases like Neptune introduce possibilities for building new social networks or integrating existing social graphs into commercial applications.
Having a data model that is identical to your domain model allows you to better understand your data, communicate more effectively, and save time. By decreasing the time spent data modelling, graph databases increase the quality and speed of development for your social network application.
Artificial intelligence (AI) and machine learning (ML)
AI and ML use statistical and analytical approaches to find patterns in data and provide insights. However, there are two prevalent concerns that arise – the quality of data and effectiveness of the analytics. Some AI and ML solutions have poor accuracy because there is not enough training data or variants that have a high correlation to the outcome.
These ML data issues can be solved with graph databases as it’s possible to connect and traverse links, as well as supplement raw data. With Graph technology, ML systems can recognise each column as a “feature” and each connection as a distinct characteristic, and then be able to identify data patterns and train themselves to recognise these relationships.
Conclusion
Graphs are a great way to visually represent complex systems and can be used to easily detect patterns or relationships between entities. To help improve graphs’ ability to detect patterns early, businesses should consider using Graph technology, which is the next step in improving analytics delivery.
Graph technology typically consists of:
Graph theory – Used to find paths, linkages and networks of logical or physical objects.
Graph analytics – Application of graph theory to uncover nodes, edges, and data linkages.
Graph database – Storage for data generated by graph analytics.
Although predominantly used in fraud detection, Graph technology has many other use cases such as making real-time recommendations based on consumer behaviour, identity and access control, risk assessment and monitoring, AI and ML, and many more.
Check out our next blog article, where we will be talking about how our Graph Visualisation Platform enhances Grab’s fraud detection methods.
Grab is the leading superapp platform in Southeast Asia, providing everyday services that matter to consumers. More than just a ride-hailing and food delivery app, Grab offers a wide range of on-demand services in the region, including mobility, food, package and grocery delivery services, mobile payments, and financial services across 428 cities in eight countries.
Powered by technology and driven by heart, our mission is to drive Southeast Asia forward by creating economic empowerment for everyone. If this mission speaks to you, join our team today!
In May, we experienced three distinct incidents that resulted in significant impact and degraded state of availability to multiple services across GitHub.com. This report also sheds light into the billing incident that impacted GitHub Actions and Codespaces users in April.
May 20 09:44 UTC (lasting 49 minutes)
During this incident, our alerting systems detected increased CPU utilization on one of the GitHub Container registry databases. When we received the alert we immediately began investigating. Due to this preemptive monitoring added from the last incident in April at 8:59 UTC, the on-call was readily monitoring and prepared to run mitigation for this incident.
As CPU utilization on the database continued to rise, the Container registry began responding to requests with increased latency, followed by an internal server error for a percentage of requests. At this point we knew there was customer impact and changed the public status of the service. This increased CPU activity was due to a high volume of the “Put Manifest” command. Other package registries were not impacted.
The reason for the CPU utilization was that the throttling criteria configured at the API side for this command was too permissive, and a database query was found to be non-performant under that degree of scale. This caused an outage for anyone using the GitHub Container registry. Users were experiencing latency issues when pushing or pulling packages, as well as getting slow access to the packages UI.
In order to limit impact we throttled the requests from all organizations/users and to restore normal operation, we had to reset our database state by restarting our front-end servers and then the database.
To avoid this in the future, we have added separate rate limiting for operation types from specific organizations/users and will continue working on performance improvements for SQL queries.
May 27 04:26 UTC (lasting 21 minutes)
Our alerting systems detected degraded availability for API requests during this time. Due to the recency of these incidents, we are still investigating the contributing factors and will provide a more detailed update on the causes and remediations in the June Availability Report, which will be published the first Wednesday of July.
May 27 07:36 UTC (lasting 1 hour and 21 minutes)
During this incident, services including GitHub Actions, API Requests, Codespaces, Git Operations, Issues, GitHub Packages, GitHub Pages, Pull Requests, and Webhooks were impacted. As we continue to investigate the contributing factors, we will provide a more detailed update in the June Availability Report. We will also share more about our efforts to minimize the impact of similar incidents in the future.
Follow up to April 14 20:35 UTC (lasting 4 hours and 53 minutes)
As we mentioned in the April Availability Report, we are now providing a more detailed update on this incident following further investigation.
On April 14, GitHub Actions and Codespaces customers started reporting incorrect charges for metered services shown in their GitHub billing settings. As a result, customers were hitting their GitHub spending limits and unable to run new Actions or create new Codespaces. We immediately started an incident bridge. Our first step was to unblock all customers by giving unlimited Actions and Codespaces usage for no additional charge during the time of this incident.
From looking at the timing and list of recently pushed changes, we determined that the issue was caused by a code change in the metered billing pipeline. When attempting to improve performance of our metered usage processor, Actions and Codespaces minutes were mistakenly multiplied by 1,000,000,000 to convert gigabytes into bytes when this was not necessary for these products. This was due to a change to shared metered billing code that was not thought to impact these products.
To fix the issue, we reverted the code change and started repairing the corrupted data recorded during the incident. We did not re-enable metered billing for GitHub products until we had repaired the incorrect billing data, which happened 24 hours after this incident.
To prevent this incident in the future, we added a Rubocop (Ruby static code analyzer) rule to block pull requests containing non-safe billing code updates. In addition, we added anomaly monitoring for the billed quantity, so next time we are alerted before impacted customers. We also tightened the release process to require a feature flag and end-to-end test when shipping such changes.
In summary
We will continue to keep you updated on the progress and investments we’re making to ensure the reliability of our services. To receive real-time updates on status changes, please follow our status page. You can also learn more about what we’re working on on the GitHub Engineering Blog.
Trustworthy experiments are key to making sound decisions, so analysts and data scientists put a lot of effort into analysing them and making business impacts. An extension of Grab’s Experimentation (GrabX) platform, Automated Experiment Analysis is one of Grab’s data products that helps automate statistical analyses of experiments. It also provides automatic experimental data pipelines and customised tests for different types of experiments.
Designed to help Grab in its journey of innovation and data-driven decision making, the data product helps to:
Standardise and automate the basic experiment analysis process on Grab experiments.
Ensure post-experiment results are reproducible under a company-wide standard, and easily reviewed by each other.
Democratise the institutional knowledge of experimentation across functions.
Background
Today, the GrabX platform provides the ability to define, configure, and execute online controlled experiments (OCEs), often called A/B tests, to gather trustworthy data and make data-driven decisions about how to improve our products.
Before the automated analysis, each experiment was analysed manually on an ad-hoc basis. This manual and federated model brings in several challenges at the company level:
Inefficiency: Repetitive nature of data pipeline building and basic post-experiment analyses incur large costs and deplete the analysts’ bandwidth from running deeper analyses.
Lack of quality control: Risk of unstandardised, inaccurate or late results as the platform cannot exercise data-governance/control or extend offerings to Grab’s other entities.
Lack of scalability and availability: GrabX users have varied backgrounds and skills, making their approaches to experiments different and not easily transferable/shared. E.g. Some teams may use more advanced techniques to speed up their experiments without using too much resources but these techniques are not transferable without considerable training.
Solution
Architecture details
Architecture diagram
When users set up experiments on GrabX, they can configure the success metrics they are interested in. These metrics configurations are then stored in the metadata as “bronze”, “silver”, and “gold” datasets depending on the corresponding step in the automated data pipeline process.
Metrics configuration and “bronze” datasets
In this project, we have developed a metrics glossary that stores information about what the metrics are and how they are computed. The metrics glossary is stored in CosmoDB and serves as an API Endpoint for GrabX so users can pick from the list of available metrics. If a metric is not available, users can input their custom metrics definition.
This metrics selection, as an analysis configuration, is then stored as a “bronze” dataset in Azure Data Lake as metadata, together with the experiment configurations. Once the experiment starts, the data pipeline gathers all experiment subjects and their assigned experiment groups from our clickstream tracking system.
In this case, the experiment subject refers to the facets of the experiment. For example, if the experiment subject is a user, then the user will go through the same experience throughout the entire experimentation period.
Metrics computation and “silver” datasets
In this step, the metrics engine gathers all metrics data based on the metrics configuration and computes the metrics for each experiment subject. This computed data is then stored as a “silver” dataset and is the foundation dataset for all statistical analyses.
“Silver” datasets are then passed through the “Decision Engine” to get the final “gold” datasets, which contain the experiment results.
Results visualisation and ”gold” datasets
In “gold” datasets, we have the result of the experiment, along with some custom messages we want to show our users. These are saved in sets of fact and dim tables (typically used in star schemas).
For users to visualise the result on GrabX, we leverage the embedded Power BI visualisation. We build the visualisation using a “gold” dataset and embed it to each experiment page with a fixed filter. By doing so, users can experience the end-to-end flow directly from GrabX.
Implementation
The implementation consists of four key engineering components:
Analysis configuration setup
A data pipeline
Automatic analysis
Results visualisation
Analysis configuration is part of the experiment setup process where users select success metrics they are interested in. This is an essential configuration for post-experiment analysis, in addition to the usual experiment configurations (e.g. sampling strategies).
It ensures that the reported experiment results will align with the hypothesis setup, which helps avoid one of the common pitfalls in OCEs 1.
There are three types of metrics available:
Pre-defined metrics: These metrics are already defined in the Scribe datamart, e.g. Gross Merchandise Value (GMV) per pax.
Event-based metrics: Users can specify an ad-hoc metric in the form of a funnel with event names for funnel start and end.
Build your own metrics: Users have the flexibility to define a metric in the form of a SQL query.
A data pipeline here mainly consists of data sourcing and data processing. We use Azure Data Factory to schedule ETL pipelines so we can calculate the metrics and statistical analysis. ETL jobs are written in spark and run using Databricks.
Data pipelines are streamlined to the following:
Load experiments and metrics metadata, defined at the experiment creation stage.
Load experiment and clickstream events.
Load experiment assignments. An experiment assignment maps a randomisation unit ID to the corresponding experiment or variant IDs.
Merge the data mentioned above for each experiment variant, and obtain sufficient data to do a deeper results analysis.
Automatic analysis uses an internal python package “Decision Engine”, which decouples the dataset and statistical tests, so that we can incrementally improve applications of advanced techniques. It provides a comprehensive set of test results at the variant level, which include statistics, p-values, confidence intervals, and the test choices that correspond to the experiment configurations. It’s a crowdsourced project which allows all to contribute what they believe should be included in fundamental post-experiment analysis.
Results visualisation leverages PowerBI, which is embedded in the GrabX UI, so users can run the experiments and review the results on a single platform.
Impact
At the individual user level, Automated Experiment Analysis is designed to enable analysts and data scientists to associate metrics with experiments, and present the experiment results in a standardised and comprehensive manner. It speeds up the decision-making process and frees up the bandwidths of analysts and data scientists to conduct deeper analyses.
At the user community level, it improves the efficiency of running experimental analysis by capturing all experiments, their results, and the launch decision within a single platform.
Learnings/Conclusion
Automated Experiment Analysis is the first building block to boost the trustworthiness of OCEs in Grab. Not all types of experiments are fully onboard, and they might not need to be. Through this journey, we believe these key learnings would be useful for experimenters and platform teams:
To standardise and simplify several experimental analysis steps, there needs to be automation data pipelines, analytics tools, and a metrics store in the infrastructure.
The “Decision Engine” analytics tool should be decoupled from the other engineering components, so that it can be incrementally improved in future.
To democratise knowledge and ensure service coverage, many components need to have a crowdsourcing feature, e.g. the metrics store has a BYOM function, and “Decision Engine” is an open-sourced internal python package.
Tracking implementation is important. To standardise data pipelines and achieve scalability, we need to standardise the way we implement tracking.
What’s next?
A centralised metric store – We built a metric calculation dictionary, which currently contains around 30-40 basic business metrics, but its functionality is limited to GrabX Experimentation use case.
If the metric store is expected to serve more general uses, it needs to be further enriched by allowing some “smarts”, e.g. fabric-agnostic metrics computations 2, other types of data slicing, and some considerations with real-time metrics or signals.
An end-to-end experiment guide rail – Currently, we provide automatic data analysis after an experiment is done, but no guardrail features at multiple experiment stages, e.g. sampling strategy choices, sample size recommendation from the planning stage, and data quality check during/after the experiment windows. Without the end-to-end guardrails, running experiments will be very prone to pitfalls. We therefore plan to add some degree of automation to ensure experiments adhere to the standards used by the post-experimental analysis.
A more comprehensive analysis toolbox – The current state of the project mainly focuses on infrastructure development, so it starts with basic frequentist’s A/B testing approaches. In future versions, it can be extended to include sequential testing, CUPED 3, attribution analysis, Causal Forest, heterogeneous treatment effects, etc.
Join us
Grab is the leading superapp platform in Southeast Asia, providing everyday services that matter to consumers. More than just a ride-hailing and food delivery app, Grab offers a wide range of on-demand services in the region, including mobility, food, package and grocery delivery services, mobile payments, and financial services across 428 cities in eight countries.
Powered by technology and driven by heart, our mission is to drive Southeast Asia forward by creating economic empowerment for everyone. If this mission speaks to you, join our team today!
References
Dmitriev, P., Gupta, S., Kim, D. W., & Vaz, G. (2017, August). A dirty dozen: twelve common metric interpretation pitfalls in online controlled experiments. In Proceedings of the 23rd ACM SIGKDD international conference on knowledge discovery and data mining (pp. 1427-1436). ↩
Deng, A., Xu, Y., Kohavi, R., & Walker, T. (2013, February). Improving the sensitivity of online controlled experiments by utilising pre-experiment data. In Proceedings of the sixth ACM international conference on Web search and data mining (pp. 123-132). ↩
Due to the updated format of GitHub authentication tokens, GitHub Connect will no longer support instances running GitHub Enterprise Server (GHES) 3.1 or older after June 3, 2022. To continue using GitHub Connect, an upgrade to GHES 3.2 or newer will be required by June 3. GitHub Connect is necessary in order to use the latest features, such as Dependabot updates, license sync, GitHub.com Actions synchronization, and unified contributions.
Prior to 2021, Grab’s search architecture was designed to only support textual matching, which takes in a user query and looks for exact matches within the ecosystem through an inverted index. This legacy system meant that only textual matching results could be fetched.
In the second half of 2021, the Deliveries search team worked on improving this architecture to make it smarter, more scalable and also unlock future growth for different search use cases at Grab. The figure below shows a simplified overview of the legacy architecture.
Legacy architecture
Problem statement
With the legacy system, we noticed several problems.
Search results were textually matched without considering intention and context
If a user types in a query “Roti Prata” (flatbread), he is likely looking for Roti Prata dishes and those matches with the dish name should be prioritised compared with matches with the merchant-partner’s name or matches with other entities.
In the legacy system, all entities whose names partially matched “Roti Prata” were displayed and ranked according to hard coded weights, and matches with merchant-partner names were always prioritised, even if the user intention was clearly to search for the “Roti Prata” dish itself.
This problem was more common in Mart, as users often intended to search for items instead of shops. Besides the lack of intention recognition, the search system was also unable to take context into consideration; users searching the same keyword query at different times and locations could have different objectives. E.g. if users search for “Bread” in the day, they may be likely to look for cafes while searches at night could be for breakfast the next day.
Search results from multiple business verticals were not blended effectively
In Grab’s context, results from multiple verticals were often merged. For example, in Mart searches, Ads and Mart organic search results were displayed together; in Food searches, Ads, Food and Mart organic results were blended together.
In the legacy architecture, multiple business verticals were merged on the Deliveries API layer, which resulted in the leak of abstraction and loss of useful data as data from the search recall stage was also not taken into account during the merge stage.
Inability to quickly scale to new search use cases and difficulty in reusing existing components
The legacy code base was not written in a structured way that could scale to new use cases easily. If new search use cases cannot be built on top of an existing system, it can be rather tedious to keep rebuilding the function every time there is a new search use case.
Solution
In this section, solutions from both architecture and implementation perspectives are presented to address the above problem statements.
Architecture
In the new architecture, the flow is extended from lexical recall only to multi-layer including boosting, multi-recall, and ranking. The addition of boosting enables capabilities like intent recognition and query expansion, while the change from single lexical recall to multi-recall opens up the potential for other recall methods, e.g. embedding based and graph based.
These help address the first problem statement. Furthermore, the multi-recall framework enables fetching results from multiple business verticals, addressing the second problem statement. In the new framework, results from different verticals and different recall methods were grouped and ranked together without any leak of abstraction or loss of useful data from search recall stage in ranking.
Upgraded architecture
Implementation
We believe that the key to a platform’s success is modularisation and flexible assembling of plugins to enable quick product iteration. That is why we implemented a combination of a framework defined by the platform and plugins provided by service teams. In this implementation, plugins are assembled through configurations, which addresses the third problem statement and has two advantages:
Separation of concern. With the main flow abstracted and maintained by the platform, service team developers could focus on the application logic by writing plugins and fitting them into the main flow. In this case, developers without search experience could quickly enable new search flows.
Reusing plugins and economies of scale. With more use cases onboarded, more plugins are written by service teams and these plugins are reusable assets, resulting in scale effect. For example, an Ads recall plugin could be reused in Food keyword or non-keyword searches, Mart keyword or non-keyword searches and universal search flows as all these searches contain non-organic Ads. Similarly, a Mart recall plugin could be reused in Mart keyword or non-keyword searches, universal search and Food keyword search flows, as all these flows contain Mart results. With more plugins accumulated on our platform, developers might be able to ship a new search flow by just reusing and assembling the existing plugins.
Conclusion
Our platform now has a smart search with intent recognition and semantic (embedding-based) search. The process of adding new modules is also more straightforward and adds intention recognition to the boosting step as well as embedding as an additional recall to the multi-recall step. These modules can be easily reused by other use cases.
On top of that, we also have a mixed Ads and an organic framework. This means that data in the recall stage is taken into consideration and Ads can now be ranked together with organic results, e.g. text relevance.
With a modularised design and plugins provided by the platform, it is easier for clients to use our platform with a simple onboarding process. Furthermore, plugins can be reused to cater to new use cases and achieve a scale effect.
Join us
Grab is the leading superapp platform in Southeast Asia, providing everyday services that matter to consumers. More than just a ride-hailing and food delivery app, Grab offers a wide range of on-demand services in the region, including mobility, food, package and grocery delivery services, mobile payments, and financial services across 428 cities in eight countries.
Powered by technology and driven by heart, our mission is to drive Southeast Asia forward by creating economic empowerment for everyone. If this mission speaks to you, join our team today!
In this post, I’m going to share how we’ve been utilizing the new projects experience across our team (from an engineer like myself all the way to our VPs and team leads). We love working so closely with developers to ship requested features and updates (all of which roll up into the Changelogs you see), and using the new projects helps us stay consistent in our shipping cadence.
How we think about shipping
Our core team consists of members of the product, engineering, design, and user research teams. We recognize that good ideas can come from anywhere. Our process is designed to inspire, surface, and implement those ideas, whether they come from users, individual contributors, managers, directors, or VPs. To get the proper alignment for this group, we’ve agreed on a few guiding principles that drive what our roadmap will look like:
The pitch: When it comes to what we’re going to work on (outside of the big pieces of work on our roadmap) people within our team can pitch ideas in our team’s repository for upcoming cycles (which we define as 6-8 weeks of work, inclusive of planning, engineering work, and an unstructured passion project week); these can be features, fixes, or even maintenance work. Every pitch must clearly state the problem it’s solving and why it’s important for us to prioritize. Some features that have come from this process include live updates, burn up charts for insights, and more. Note: these are all the changes you see as a developer, but we also have a lot of pitches come in from my fellow engineers focused around the developer experience. For example, a couple successful pitches have included reducing our CI time to 10 minutes, and streamlining our release process by switching to a ring deployment model and adding ChatOps.
In addition to using issues to propose and converse on pitches from the team, we use the new projects experience to track and manage all the pitches from the team so we can see them in an all-up table or board view.
Keep it small: We knew for ourselves, and for developers, that we didn’t want to lock them into a specific planning methodology and over-complicate a team’s planning and tracking process. For us, we wanted to plan shorter cycles for our team to increase our tempo and focus, so we opted for six-week cycles to break up and build features. Check out how we recommend getting started with this approach in a recent blog post.
Ship to learn: Similar to how we ship a lot of our products, we knew developers and customers were going to be heavily intertwined with each and every ship, giving us immediate feedback in both the private and public beta. Their feedback both influenced what we built and then how we iterated and continued to better the experience once something did ship. While there are so many people to thank, we’re extremely grateful for all our customers along the way for being our partners in building GitHub Issues into the place for developers to project plan.
How we used projects to do it
We love that the product we’re building doesn’t tool a specific project management methodology, but equips users with powerful primitives that they can compose into their preferred experiences and workflows. This allows for many people (not just us engineers) involved in building and developing products at GitHub (team leads, marketing, design, sales, etc.) the ability to use the product in a way that makes sense for them.
With the above principles in mind, once a pitch has been agreed upon to move forward on building, that pitch issue becomes a tracking issue in a project table or board that we convert into pieces of work that fit into an upcoming cycle. A great example of this was when we updated the GitHub Issues icons to lessen confusion among developers. This came in as a pitch from a designer on the team, and was soon accepted and moved into epic planning in which the team responsible began to track the individual pieces of work needed to make this happen.
IC approach
Let’s start with how my fellow engineers, individual contributors and I use projects for day-to-day development within cycles. From our perspective on any given day, we’re hyper-focused on tackling what issues and pull requests are assigned to us (fun fact: we recently added the assignee:me filter to make this even easier) in a given cycle, so we work from more individually scoped project tables or boards that stem from the larger epic and iteration tracking. Because of this, we can easily zoom out from our individual tasks to see how our work fits into a given cycle, and then even zoom out more into how it fits into larger initiatives.
In addition to scoping more specifically a given table or board, engineers across our organization utilize a personal project table or board to track all the things specific to themselves like what issues are assigned to them—even work not connected to a given cycle, like open source work.
EM approach
If we pull back to engineering managers overseeing those smaller cycles, they’re focused on kicking off an accepted pitch’s work, breaking it first into cycles and then into smaller iterations in which they can assign out work. A given cycle’s table or board view allows the managers to have a whole look at all members of their team and look specifically at things that are important to them, like all the pull requests that are open and quickly seeing which engineers are assigned, what pull requests have been merged, deployed, etc.
Check out what this looks like in our team board.
Team lead approach
Now, if we put ourselves in the shoes of our team leads and Directors/VPs, we see that they’re using the new projects experience to primarily get the full picture of where product and feature development currently sit. They told me the main team roadmap and backlog is where they can get questions answered like:
Which projects do we have in flight in which product area right now?
Who’s the key decision maker for this project?
Which engineers are working on which projects?
Which projects are at risk and need help (progress/status)?
What’s great about this is that they can quickly glance at what’s in motion and then click into any cycles or status to get more context on open issues, pull requests, and how everything is connected.
Outside of being able to check in on what’s being worked on and where the organization’s current focus is, our leads have found additional use cases that may not be applicable for an engineer like me. They use private projects for more sensitive tasks, like managing our team’s hiring, tracking upcoming start dates, making sure they’re staying on top of career development, organizational change management, and more.
Wrap-up
This is how we as the planning and tracking team at GitHub are using the very product we’re building for you to build the new projects experience. There are many other teams across GitHub that utilize the new project tables and boards, but we hope this gives you a little bit of inspiration about how to think about project planning on GitHub and how to optimize for all the stakeholders involved in building and shipping products.
What’s great about project planning on GitHub is that our focus on powerful primitives approach to project management means that there is an unlimited amount of flexibility for you and your team to play around with, and likely many, many ways we haven’t even thought about how to use the product. So, please let us know how you’re using it and how we can improve the experience!
In April, we experienced three distinct incidents resulting in significant impact and degraded state of availability for Codespaces and GitHub Packages.
April 01 7:07 UTC (lasting 5 hours and 32 minutes)
Our alerting detected an increase in failures to create new Codespaces and start existing stopped Codespaces in the US West region. We immediately updated the GitHub status page and began to investigate.
Upon further investigation, we determined that some secrets that are used by the Codespaces service had expired. Codespaces maintains warm pools of resources to protect our users from intermittent failures in our dependent services. However, in the US West region, those pools were empty of resources due to the expired secret. In this case, we didn’t have an early enough warning on pools reaching low thresholds and didn’t have time to react until we ran out of capacity. As we worked to mitigate the incident, the pools in other regions also emptied due to the expired secret, and those regions began to see failures as well.
A limited number of GitHub engineers had access to rotate the secret, and communication issues delayed the start of the secret refresh process. The expired secret was eventually refreshed and rolled out to all regions, and the service was returned to full operation.
To prevent this failure pattern in the future, we now verify resources that expire and have monitors in place that alert well in advance if pool resources are not being maintained. We’ve also added monitors to notify us earlier when we approach resource exhaustion limits. In addition, we’ve initiated migrating the service to use a mechanism that doesn’t rely on secrets or the need to rotate credentials.
April 14 20:35 UTC (lasting 4 hours and 53 minutes)
We are still investigating the contributing factors and will provide a more detailed update in the May Availability Report, which will be published the first Wednesday of June. We will also share more about our efforts to minimize the impact of future incidents.
April 25 8:59 UTC (lasting 5 hours and 8 minutes)
During this incident, our alerting systems detected increased CPU utilization on one of the GitHub Packages Registry databases, which started approximately one hour before any customer impact occurred. The threshold for this alert was relatively low, and it was not a paging alert, so we did not immediately investigate. CPU continued to rise on the database causing the Package Registry to start responding to requests with internal server errors, eventually causing customer impact. This increased activity was due to a high volume of the “Create Manifest” command used in an unexpected manner.
The throttling criteria configured at the database level wasn’t enough to limit the above command, and this caused an outage for anyone using the GitHub Packages Registry. Users were unable to push or pull packages, as well as being unable to access the packages UI or the repository landing page.
After investigating, we determined there was a performance bug related to the high volume of “Create Manifest” commands. In order to limit impact and restore normal operation, we blocked the activity causing this problem. We are actively following up on this issue by improving the rate limiting in packages and fixing the performance problem that was uncovered. We’ve also modified database alerting thresholds and severity so we get alerted to unexpected issues more quickly (rather than after customer impact).
During this incident, we also discovered that the repository home page has a hard dependency on the packages infrastructure. When the package registry is down, the home pages for repositories that list packages also fail to load. We decoupled the package listing from the repository home page, but that required manual intervention during the outage. We are working on a fix that loosely binds the packages listing, so if it fails, it does not take down the repository home pages for repositories that list packages.
In summary
We will continue to keep you updated on the progress and investments we’re making to ensure the reliability of our services. Please follow our status page for real-time updates. To learn more about what we’re working on, check out the GitHub Engineering Blog.
The Docs-as-Code concept has been gaining traction in the past few years as more tech companies start implementing this approach. One of the most widely-known examples is Spotify, that uses Docs-as-Code to publish documentation in an internal developer portal.
Since the start of 2021, Grab has also adopted a Docs-as-Code approach to improve our technical documentation. Before we talk about how this is done at Grab, let’s explain what this concept really means.
What is Docs-as-Code?
Docs-as-Code is a mindset of creating and maintaining technical documentation. The goal is to empower engineers to write technical documentation frequently and keep it up to date by integrating with their tools and processes.
This means that technical documentation is placed in the same repository as the code, making it easier for engineers to write and update. Next, we’ll go through the motivations behind this initiative.
Why embark on this journey?
After speaking to Grab engineers, we found that some of their biggest challenges are around finding and writing documentation. Like many other companies on the same journey, Grab is rather big and our engineers are split into many different teams. Within each team, technical documentation can be stored on different platforms and in different formats, e.g. Google drive documents, text files, etc. This makes it hard to find relevant information, especially if you are trying to find another team’s documentation.
On top of that, we realised that the documentation process is disconnected from an engineer’s everyday activities, making technical documentation an awkward afterthought. This means that even if people could find the information, there was a good chance that it would not be up to date.
To address these issues, we need a centralised platform, a single source of truth, so that people can find and discover technical documentation easily. But first, we need to change how we write technical documentation. This is where Docs-as-Code comes in.
How does Docs-as-Code solve the problem?
With Docs-as-Code, technical documentation is:
Written in plaintext.
Editable in a code editor.
Stored in the same repository as the source code so it’s easier to update docs whenever a code change is committed.
Published on a central platform.
The idea is to consolidate all technical documentation on a central platform, making it easier to discover and find content by using an easy-to-navigate information architecture and targeted search.
How is Grab embracing Docs-as-Code?
We’ve developed an internal developer portal that simplifies the process of writing, reviewing and publishing technical documentation.
Here’s a brief overview of the process:
Create a dedicated docs folder in a Git repository.
Push Markdown files into the docs folder.
Configure the developer portal to publish docs from the respective code repository.
The latest version of the documentation will automatically be built and published in the developer portal.
Simplified documentation process
This way, technical documentation is closer to the source code and integrated into the code development process. Writing and updating technical documentation becomes part of writing code, and this encourages engineers to keep documentation updated.
Measuring success
Whenever there’s a change throughout big organisations like Grab, it can be tough to implement. But thankfully, our engineers recognised the importance of improving documentation and making it easier to maintain or update.
We surveyed our users and here’s what some have said about our Docs-as-Code initiative:
“[W]ith the doc and source code in one place, test backend engineers can now make doc changes via standard code review process and re-use the same content for CLI helper message and documentation.” – Kang Yaw Ong, Test Automation – Engineering Manager
“[Docs-as-Code] is a great initiative, as it keeps documentation in line and up-to-date with the development of a project. Managing documentation using a version control system and the same tools to handle merges and conflicts reduces overhead and friction in an engineer’s workflow.” – Eugene Chiang, Foundations – Engineering Manager
Progress and future optimisations
Since we first started the Docs-as-Code initiative in Grab, we’ve made a lot of progress in terms of adoption – approximately 80% of Grab services will have their technical documentation on the internal portal by April 2022.
We’ve also improved overall user experience by enhancing stability and performance, improving navigation and content formatting, and enabling feedback. But it doesn’t stop there; we are continuously improving the internal portal and providing more features for our engineers.
Apart from technical documentation, we are also applying the Docs-as-Code approach to our technical training content. This means moving both self-paced and workshop training content to a centralised repository and providing engineers a single platform for all their learning needs.
Special thanks to the Tech Learning – Documentation team for their contributions to this blog post.
We are hiring!
We are looking for more technical content developers to join the team. If you’re keen on joining our Docs-as-Code journey and improving developer experience, check out our open listings in Singapore and Malaysia.
Join us in driving this initiative forward and making documentation more approachable for everyone!
Join us
Grab is the leading superapp platform in Southeast Asia, providing everyday services that matter to consumers. More than just a ride-hailing and food delivery app, Grab offers a wide range of on-demand services in the region, including mobility, food, package and grocery delivery services, mobile payments, and financial services across 428 cities in eight countries.
Powered by technology and driven by heart, our mission is to drive Southeast Asia forward by creating economic empowerment for everyone. If this mission speaks to you, join our team today!
This is the second and final post in a series describing friendly forks and alternative strategies for managing them. Make sure to check out Being friendly: friendly forks 101 for general information on friendly forks and background on the three forks on which we center this post’s discussion.
In the first post in this series, we discussed what friendly forks are and learned about three GitHub-managed friendly forks of git/git, git-for-windows/git, microsoft/git, and github/git. In this post, we deep dive into the management strategies we employ for each of these forks and provide scenarios to help you select the appropriate management strategy for your own friendly fork.
The importance of friendly fork management
While the basics of friendly forks could make for mildly interesting cocktail party conversation , it takes a deeper understanding to successfully manage a fork once you have it. Management (or lack thereof) can make or break friendly forks for the following reasons:
Contributions taken by the upstream project are also generally valuable to the fork.
The number of changes to the upstream project since the last merge is correlated with the difficulty of merging those changes into the fork.
When security patches are pushed upstream, it is critical to be able to easily apply them (without other conflicts getting in the way).
Although there is no one-size-fits-all approach to friendly fork management, our goal for the remainder of this post is to provide a solid starting point for your management journey that will help your friendly fork remain securely in the friend zone.
Our management strategies
We employ a different management strategy for each of the forks discussed in the previous post based on that fork’s unique needs. These strategies are illustrated in the graphic below.
If the above image makes you feel slightly dizzy, don’t worry! We know it’s a lot, so we’re going to break it down into detailed descriptions of how each fork works. Take a deep breath, and prepare to dive in.
git-for-windows/git
Git for Windows uses a custom merging rebase strategy to take changes from upstream. A merging rebase is just what it sounds like-a combination of a merge and a rebase. Merging rebases are executed at a predictable cadence that follows the git/git release cycle.
When it is time for a new release, git/git creates a series of release candidate tags (typically rc0, rc1, rc2, and final) on its default branch. As soon as each new candidate is released, we execute a merging rebase of the main branch on top of it. The merge portion comes first, with this command:
$ git merge -s ours -m "Start the merging-rebase to <version>" HEAD@{1}
This creates what we call a “fake merge” since it uses the “ours” strategy to discard all the changes from main. While this may seem odd, it actually provides the benefits of a clean slate for rebasing and the ability to fast forward from previous states of the branch.
After the merge is complete, the rebase commences. This portion of the process helps us resolve merge conflicts that occur when upstream changes conflict with changes that have been made in git-for-windows/git. One type of conflict in particular is worth discussing in more depth: commits that have been added to git-for-windows/git and subsequently upstreamed.
When these commits are submitted upstream, the community supporting git/git usually requests changes before they are accepted. Additionally, since git/git only accepts patches sent via mailing list (instead of pull requests), commit IDs inevitably change when applied upstream. This means there will be conflicts when git-for-windows/git is rebased on top of a new release. Running the following command helps us identify commits that have been upstreamed when we encounter conflicts:
This command compares the differences between the below ranges of commits, dropping any that are not in the first specified range:
From the commit before the commit you are checking to the commit you are checking (this will only contain the commit you are checking).
The upstream commits that are not in the commit history of <commit>.
If there is a matching commit in upstream, it will be shown in the command’s output. In this case, we use git rebase --skip to bypass the commit (and implicitly accept the upstream version).
Because git-for-windows/git begins its merging rebase immediately after the creation of each release candidate, we classify it as proactive-it ensures all new git/git features are integrated and released as soon as possible. The merging rebase is generally executed for each release candidate by one developer, but is reviewed by multiple other developers with the help of range-diff comparisons. You can find an example of such a review here. When complete, the changes are pushed directly to the main branch, and a new release is created.
microsoft/git
Like git-for-windows/git, microsoft/git is proactive, executing rebases immediately following the creation of each new git/git release candidate. It also uses the same strategies for identifying commits that have made it upstream. However, there are a few key differences between the git-for-windows/git approach and the microsoft/git approach. These are:
Since microsoft/git is a fork of git-for-windows/git, it does not take commits directly from git/git. Instead, we wait for the git-for-windows/git merging rebase to complete for each candidate then rebase on top of the resulting tag.
Instead of repeatedly rebasing a designated main branch, we cut a brand new branch for each version with the naming scheme vfs-2.X.Y (see the current default as an example). This branch is based off the initial git-for-windows/git release candidate tag and is updated with the rebase for each new release candidate. We based this strategy on release branches in Azure DevOps to make hotfixing easier and to clarify which commits are released with each new version.
Once the rebases are complete, we designate vfs-2.X.Y, as the new default branch, and create a new release.
github/git
github/git integrates new git/git releases using a traditional merge strategy. It is cautious in its cadence for taking releases; for this fork, we prefer to allow new features to “simmer” for some time before integration. This means that github/git is typically one or two versions behind the latest release of git/git.
To ensure merges are high-quality and accurate, the merge of a new git/git version is carried out by at least two developers in parallel. For commits that began in github/git and subsequently made it upstream, we generally accept the upstream version when resolving resulting conflicts. Occasionally, however, there are reasons to take the github/git version (or, some parts of both versions). It is up to the developers executing the merge to decide the correct strategy for a particular commit. When each merge is complete, the trees at the tip of each merge are compared, and the different approaches to conflict resolution are reviewed. The outcome of this review is merged and deployed as a new release.
Note that there are tradeoffs to the decision to use a traditional merge strategy to manage this fork. Merging is more straightforward than rebasing or rebase merging. However, merges in github/git can become somewhat tricky when it has drifted far from upstream or when a sweeping change in upstream affects many parts of its custom code. Additionally, this strategy requires all commits to be preserved (as opposed to git-for-windows/git and microsoft/git, which use the autosquash feature of the rebase command to remove squash and fixup commits), which means more commits are involved in github/git merges.
Comparison
Below is a side-by-side summary of the key similarities and differences in the management strategies discussed above.
Fork
Management Strategy
# of developers executing
Proactive or cautious
Long-running main branch
Integrates release candidates
git-for-windows/git
merging rebase
1
Proactive
Yes
Yes
microsoft/git
merging rebase
1
Proactive
No
Yes
github/git
merge
>=2
Cautious
Yes
No
As shown in the table, git-for-windows/git and microsoft/git have a lot in common. They are both proactive, executed by one developer, and use a form of rebase to integrate new releases (and release candidates). github/git is a bit different in its choice of a merge management strategy, the number of developers that simultaneously execute this strategy, and its cautious approach to integrating new releases (and in that release candidates are not considered).
As lovely as the above table is, you may still be scratching your head, wondering which strategy is right for you or your organization. Never fear! Our final section provides a series of scenarios with the goal of making this decision easier for you.
Finding your perfect match
Well done! You’ve successfully made it through our deep dive into three alternatives for friendly fork management.
However, now comes the really important part! It’s time to take a good look at each of the above strategies to understand which one is the best fit for you. We’ve organized this section as a series of scenarios to help you frame the above in the context of your own needs. Keep reading if you’re ready to choose your own friendly fork adventure!
Scenario 1: You have many contributors working simultaneously.
Constantly creating new default branches can leave developers with open pull requests in a bad state; obviously, this is particularly problematic when there’s a healthy amount of active development in your repository. Consider a merge or merging rebase strategy to avoid changing default branches and requiring your developers to constantly rebase.
Scenario 2: You need to support multiple versions with security releases or other bug fixes.
Consider the rebase model to have an easy story for cherry-picking fixes to supported versions.
Note: it is also possible to cherry-pick features from upstream with a merge-based workflow. However, if you later merge the commits containing the cherry-picked features, you may have to resolve some trivial conflicts depending on your merge strategy.
Scenario 3: You don’t (or do!) want to take new features immediately.
You can apply a cautious or proactive approach to any of the above strategies. Work with your team/management to find a cadence everyone is comfortable with and stick to it.
Scenario 4: You’re new to the fork game and want to keep it simple.
If this is your (or, your team’s) first time managing a fork and/or you’re just learning your way around Git, the merge strategy may be the most straightforward place for you to start.
Still not sure which strategy to use? Consider getting in touch with the maintainers of one of the friendly forks listed above (for example, via the appropriate mailing list(s) or a GitHub discussion) to get input from the experts!
Wrapping up
A friendly fork can help accelerate development and increase developer productivity and satisfaction. Additionally, managing a friendly fork carefully to stay in the friend zone can lead to successful collaboration between different communities and improved project quality for all parties involved. We hope this series has helped you understand whether a friendly fork is right for you or your organization and, if so, empowered you to create and begin managing your friendly fork successfully.
We’re proud to announce the availability of search-based code navigation for the Elixir programming language. Yet this is more than just new functionality. It’s the first example of a language community writing and submitting their own code for search-based code navigation.
Since GitHub introduced code navigation, we’ve received enthusiastic feedback from users. However, we hear one question over and over again: “When will my favorite language be supported?” We believe that every programming language deserves best-in-class support in GitHub. However, GitHub hosts code written in thousands of different programming languages, and we at GitHub can commit to supporting only a small subset of these languages ourselves. To this end, we’ve been working hard to empower language communities to integrate with our code navigation systems. After all, nobody understands a programming language better than the people who build it!
Community contributions welcome!
Would you like to develop and contribute search-based code navigation for a language? If a Tree-sitter grammar tool exists for your language, you can do so using Tree-sitter’s tree query language. This language describes how our code navigation systems scan through syntax trees and how to extract the important parts of a declaration or reference. This process is known as tagging, and it’s integrated with the tree-sitter command-line tool so that you can run and test tag queries locally. When a user pushes new commits or creates a pull request, the GitHub code navigation systems use tag queries to extract jump-to-definition and find-all-references information. Note: If you’re interested in how search-based code navigation works, you can read a technical report that describes the architecture and evolution of GitHub’s implementation of code navigation.
How do I get started?
Complete documentation, including how to write unit tests for your tags queries, can be found here. For examples of tag queries, you can check out the Elixir tags implementation, or those written for Python or Ruby. Once you’ve implemented tag queries for a language, have written unit tests, and are satisfied with the output from tree-sitter tags, you can submit a request on the Code Search and Navigation Feedback discussion page in the GitHub Discussions page in the GitHub feedback repository. The Code Navigation team will add this to their roadmap. When we’re confident in the quality of yielded tags and the load on the back-end systems that handle code navigation, we can enable it in testing for a subset of contributors, eventually rolling it out to all GitHub users, on both private and public repositories.
Please note that search-based code navigation is distinct from GitHub code search. Code search provides a view across all of the corpus of code on GitHub, whereas search-based code navigation is a part of the experience of reading code within a single repository. Search-based code navigation is also distinct from our support for precise code navigation. However, we hope to empower language communities to inform and contribute to the development of and support for these and other features in the future.
We’re committed to working with language maintainers and contributors to keep these rules as useful and up-to-date as possible. Whether you’re a longtime language contributor or someone seeking to enter the community for the first time, we encourage you to take a look at adding support for search-based code navigation, and join the community on the GiHub Discussions Page.
As a leading superapp in Southeast Asia, Grab serves millions of consumers daily. This naturally makes us a target for fraudsters and to enhance our defences, the Integrity team at Grab has launched several hyper-scaled services, such as the Griffin real-time rule engine and Advanced Feature Engineering. These systems enable data scientists and risk analysts to develop real-time scoring, and take fraudsters out of our ecosystems.
Apart from individual fraudsters, we have also observed the fast evolution of the dark side over time. We have had to evolve our defences to deal with professional syndicates that use advanced equipment such as device farms and GPS spoofing apps to perform fraud at scale. These professional fraudsters are able to camouflage themselves as normal users, making it significantly harder to identify them with rule-based detection.
Since 2020, Grab’s Integrity team has been advancing fraud detection with more sophisticated techniques and experimenting with a range of graph network technologies such as graph visualisations, graph neural networks and graph analytics. We’ve seen a lot of progress in this journey and will be sharing some key learnings that might help other teams who are facing similar issues.
What are Graph-based Prediction Platforms?
“You can fool some of the people all of the time, and all of the people some of the time, but you cannot fool all of the people all of the time.” – Abraham Lincoln
A Graph-based Prediction Platform connects multiple entities through one or more common features. When such entities are viewed as a macro graph network, we uncover new patterns that are otherwise unseen to the naked eye. For example, when investigating if two users are sharing IP addresses or devices, we might not be able to tell if they are fraudulent or just family members sharing a device.
However, if we use a graph system and look at all users sharing this device or IP address, it could show us if these two users are part of a much larger syndicate network in a device farming operation. In operations like these, we may see up to hundreds of other fake accounts that were specifically created for promo and payment fraud. With graphs, we can identify fraudulent activity more easily.
Grab’s Graph-based Prediction Platform
Leveraging the power of graphs, the team has primarily built two types of systems:
Graph Database Platform: An ultra-scalable storage system with over one billion nodes that powers:
Graph Visualisation: Risk specialists and data analysts can review user connections real-time and are able to quickly capture new fraud patterns with over 10 dimensions of features (see Fig 1).
Fig 1: Graph visualisation
Network-based feature system: A configurable system for engineers to adjust machine learning features based on network connectivity, e.g. number of hops between two users, numbers of shared devices between two IP addresses.
Graph-based Machine Learning: Unlike traditional fraud detection models, Graph Neural Networks (GNN) are able to utilise the structural correlations on the graph and act as a sustainable foundation to combat many different kinds of fraud. The data science team has built large-scale GNN models for scenarios like anti-money laundering and fraud detection.
Fig 2 shows a Money Laundering Network where hundreds of accounts coordinate the placement of funds, layering the illicit monies through a complex web of transactions making funds hard to trace, and consolidate funds into spending accounts.
Fig 2: Money Laundering Network
What’s next?
In the next article of our Graph Network blog series, we will dive deeper into how we develop the graph infrastructure and database using AWS Neptune. Stay tuned for the next part.
Join us
Grab is the leading superapp platform in Southeast Asia, providing everyday services that matter to consumers. More than just a ride-hailing and food delivery app, Grab offers a wide range of on-demand services in the region, including mobility, food, package and grocery delivery services, mobile payments, and financial services across 428 cities in eight countries.
Powered by technology and driven by heart, our mission is to drive Southeast Asia forward by creating economic empowerment for everyone. If this mission speaks to you, join our team today!
This is the first post in a two-part series describing friendly forks and alternative strategies for managing them. Stay tuned for part two coming in May!
This post covers what a friendly fork is, why they are beneficial, and how they differ from a divergent fork. We’ll also look at some examples from the wild and provide details on three of our favorite friendly forks of the git/git repository.
To fork or not to fork
Most developers are familiar with the concept of working with source code in repositories. However, what should you do when you want to make one or more major changes to a repository that you do not own? Two options are to submit feature requests or to contribute the features you need yourself. This is a very common approach in open source software, and, when it goes well, it can lead to productive collaboration and useful results for all parties.
But what if the proposed features are not accepted into the repository? What if they were never intended to be contributed back to the original project? If you (or your company) have a strong need for these features, creating a friendly fork of the repository could be the right choice.
What is a friendly fork?
A friendly fork is a long-lived fork that complements its upstream repository (i.e., the repository from which it was forked) with customizations targeted to a subset of users. Typically, features from the friendly fork are contributed back to the upstream repository through a process known as upstreaming. If that is the case, developers working in the friendly fork sustain relationships with the maintainers of the upstream repository (this is the friend zone we’re so fond of!) to facilitate this flow of features and to improve the software for both user bases. It is also possible, however, for a friendly fork to simply take regular updates from its upstream repository with no maintainer interaction. Friendly forks may or may not eventually re-merge with the upstream repository.
Below are some examples of existing friendly forks of the git/git repository (which are maintained by folks at GitHub) and their purposes.
git-for-windows/git: hosts Windows-specific features of Git. It also sometimes receives early features which are subsequently upstreamed into git/git.
microsoft/git: focuses on features to support monorepos, some of which are subsequently upstreamed into git/git.
github/git: powers GitHub’s backend. It includes GitHub-specific changes, like extra instrumentation specific to GitHub’s infrastructure, but also serves as a staging ground for new features before they are submitted upstream.
git/git is definitely not the only repository with friendly forks. Examples of friendly forks created from other repos include:
MSYS2: a fork of Cygwin that provides an environment for building, installing, and running native Windows software.
CentOS: a fork of Red Hat Enterprise Linux (RHEL) created in 2004 to offer a RHEL-like experience for the community. (Interestingly, Red Hat now owns the CentOS trademarks).
It is important to note that not all forks can be considered friendly. There are also divergent forks, which are typically created due to insurmountable disagreements in a community caused by disparate goals or personality conflicts. Divergent forks often become so different from their upstream repositories that sharing code becomes difficult, if not impossible. While it is good to know that divergent forks are a thing you may encounter in the wild, we emphatically believe in the power of the friend zone and will center our focus for the rest of this series on getting and keeping forks there.
A tale of three forks
Three of the friendly fork examples provided above are based off of git/git, git-for-windows/git, microsoft/git, and github/git. Each of these forks has a unique history that contributes to the strategy used to maintain it. We will dedicate the remainder of this post to describing the history and purpose of each fork.
git-for-windows/git
git-for-windows/git is the oldest of our forks for discussion. It was created in 2007 to provide the required adjustments to Git for it to run on Windows. While it may seem odd that Windows-specific features weren’t just added to the git/git repository, forking was deemed necessary because the git/git project was (and, still is) run by experts in the Unix systems domain. And Windows, of course, falls outside the scope of that expertise.
Although this fork was originally intended to be short-lived, it soon became clear that Windows support would be an ongoing community need that would require a permanent fork. Thus, development in git-for-windows/git continues in earnest today.
Because it was created to give Windows users the option of using Git for version control, the main purposes of git-for-windows/git are:
Provide a seamless, pain-free experience for Windows users.
Separation of concerns (in other words, Windows-specific and Unix-specific features are contributed in different repositories, while shared features can easily flow between the repositories).
As with each fork we discuss in this post, there are some use cases for which it makes sense for new features to be contributed to the fork before they are added upstream. FS Monitor is an example of this in which the Request for Comments went to the git/git mailing list, but early implementations of the feature were merged into git-for-windows/git for rapid testing.
microsoft/git
microsoft/git began as a private fork of git-for-windows/git, with the initial purpose of supporting Microsoft-internal products. However, it was open-sourced in 2017, and, as a result, its goals today are much more general and community-oriented:
Facilitate easy dogfooding/quick releases of new features for GitHub’s monorepo customers.
As with git-for-windows/git, determine which of these features make sense to contribute back upstream and submit/monitor them on the mailing list.
An example feature that was introduced to microsoft/git prior to upstreaming is the sparse index. This was done to speedily get this new feature into the hands of monorepo customers who needed it most. After that was done, the feature was gradually introduced and refined upstream.
github/git
github/git, our final fork for discussion, actually did not begin as a fork. In the early days of GitHub, we carried a handful of changes on top of new Git releases. Because there were only a few, we stored them as *.patch files that got applied on top of each new release before deployment. Over time, however, our custom changes became both more numerous and more applicable to being contributed to git/git. It became clear that a full-fledged fork would be beneficial to improve management, workflows, and our ability to contribute back to upstream. Thus, in 2012, the official github/git fork was born.
Note that github/git differs from the above forks in that it is a private friendly fork, while the other two are public. Private friendly forks can be very beneficial to organizations. For example, they can be an excellent testing ground for new features, as they allow you to be confident code has been battle-tested internally and works before submitting publicly upstream. They can also be less beholden to the upstream release cadence, which helps ensure stability for the product.
To this day, this fork serves the same purpose of powering GitHub’s infrastructure. It fulfills our need to support features specialized to this infrastructure and is also used as a “staging ground” for new features before submitting them to the open source git/git repository. Specific examples of the latter use include bitmaps and multi-pack bitmaps.
That’s all for now!
In this post, we’ve discussed what a friendly fork is and how friendly forks differ from divergent forks. We’ve learned about three different friendly forks of the git/git repository and their purposes for existing. Thanks for sticking with us this far, and be sure to keep your peeled for our second post in the “friend zone” series, in which we’ll talk about how these forks are managed and how you can adapt their strategies to your very own friendly fork!
At GitHub, we relentlessly pursue performance. Join me now for the tale of how we dropped a P99 time by 95% on code that runs for every single Git push operation.
Every time you push to GitHub, we run a set of checks to validate your push before accepting it. If you ever tried to push an object larger than 100MB, you are already familiar with them, as these pre-receive hooks contain that logic. Similarly, they do other checks, such as verifying that LFS objects have been successfully uploaded. These hooks help keep our servers healthy and improve the user experience.
We recently rewrote these hooks from their original Ruby implementation into Go. This rewrite was something we had in mind for a while, but what really sold us on the effort was the potential performance improvement.
Today, we’ll talk about the history of these hooks, how we discovered that the performance was problematic, and how we went about safely replacing them.
How did we get here?
We created the first hook in 2013 to warn users that a repository was renamed. The only action was a database check for a previous name and to send a warning to the user to update their remote URL. At the time, almost all of GitHub was part of one Ruby on Rails application, so it was the logical choice for hooks as well. As time passed, more and more functionality was added to the hooks, requiring additional configuration, exception reporting, and logging.
This meant that hooks imported the same dependencies as the Ruby application. Over time, the number of dependencies, and therefore startup time, only increased. In a Rails application, these dependencies are loaded only once at startup time, and then each request has them available, making the startup time not important for the user experience. However, these hooks are run as subprocesses underneath the Git executable, so they are loaded for each request, making the startup time critical to performance. When we investigated, loading these dependencies took a rather long time. Hooks took about 880 milliseconds to execute on average, and almost all of that time was spent loading dependencies. In addition, there are two sets of hooks: one with the new data under quarantine and a second set once the data is available in the repository. Especially with this double execution, this startup time significantly affects each push. An empty push could take more than two seconds, which was unacceptable.
Why rewrite?
Since the performance issues were related to startup time, we had a few options. We could reduce the number of dependencies, we could change the architecture so that hooks only started up once, or we could rewrite the hooks to run independently of the monolith. Rewrites and changing the architecture carry risk, so we tried the simplest alternative first.
Loading fewer dependencies while staying within the Rails monolith proved quite tricky. There were a lot of dependencies (more than 450 gems leading to over 1,000 require calls), and they were all quite tangled up in the app’s configuration, because they were not designed to be used outside of the GitHub Rails monolith. However, careful use of the debugger and strace revealed a few outliers that we could avoid loading when running the hooks. This removal dropped 350-400 milliseconds from the startup time.
While this was already a decent improvement for a small tweak, the startup time was still quite slow, and we weren’t satisfied yet. Additionally, new dependencies are frequently added to the Rails application, which means that the startup time would creep up again over time even if our hook code did not change.
How did we rewrite?
We could not ignore the configuration from the Rails app as that is how we know how to connect to the database, send stats, etc. Some of that could be duplicated at the risk of having two parallel configuration paths that would almost certainly end up diverging.
To pass configuration along that only the app knows about, we were able to use an existing mechanism, which was already in use to pass along information, such as the name of a repository and whether it is over its quota. This comes alongside other information necessary to perform updates so it gets called for every push, and adding some more data there adds very little overhead. We identified the information necessary to perform the checks and added this information.
For the past few years, the Git Systems Team has been extracting more and more of our service code from the Rails monolith and rewriting it as a dedicated service written in Go. Based on this experience with Go, and given what we learned about the Ruby hooks, moving the hooks into this Go service seemed like a natural fit as well. Just extracting the hooks to run independently of the Rails apps would have removed most of the boot time, but Go gives us the last few milliseconds and lets us make them part of the service in which the backend code increasingly lives. We expected such a significant rewrite to be worth the risk, because afterwards the hooks should be much faster.
Further, as we commonly do for high-impact changes, we put these rewritten hooks behind a feature flag. This gave us the ability to enable them for individual repositories or groups of them. We started with a few internal GitHub repositories to confirm the effect in production.
The results were so impressive that we had to double check that the hooks were still running. It was hard to distinguish between really fast hooks and completely disabled hooks. The median time was now 10ms, compared to roughly 880ms when we started the project. This made pushes noticeably faster for everyone. We even got unprompted questions about whether pushing had become faster after someone noticed it on their own.
Lessons learned
This is a project we had in mind for a long time. We had wanted to rewrite these hooks outside of the monolith to separate our area of responsibility better. However, merely having a better architecture often isn’t enough to make something a business priority. By tying the change to its impact on users we could prioritize this work. We came away with the dual benefits of a much better user experience and an architectural improvement.
This change has now been live on github.com for a couple of months, and has been shipped in GHES 3.4, so everyone now saves some time pushing to their GitHub repositories.
The collective thoughts of the interwebz
Manage Consent
To provide the best experiences, we use technologies like cookies to store and/or access device information. Consenting to these technologies will allow us to process data such as browsing behavior or unique IDs on this site. Not consenting or withdrawing consent, may adversely affect certain features and functions.
Functional
Always active
The technical storage or access is strictly necessary for the legitimate purpose of enabling the use of a specific service explicitly requested by the subscriber or user, or for the sole purpose of carrying out the transmission of a communication over an electronic communications network.
Preferences
The technical storage or access is necessary for the legitimate purpose of storing preferences that are not requested by the subscriber or user.
Statistics
The technical storage or access that is used exclusively for statistical purposes.The technical storage or access that is used exclusively for anonymous statistical purposes. Without a subpoena, voluntary compliance on the part of your Internet Service Provider, or additional records from a third party, information stored or retrieved for this purpose alone cannot usually be used to identify you.
Marketing
The technical storage or access is required to create user profiles to send advertising, or to track the user on a website or across several websites for similar marketing purposes.


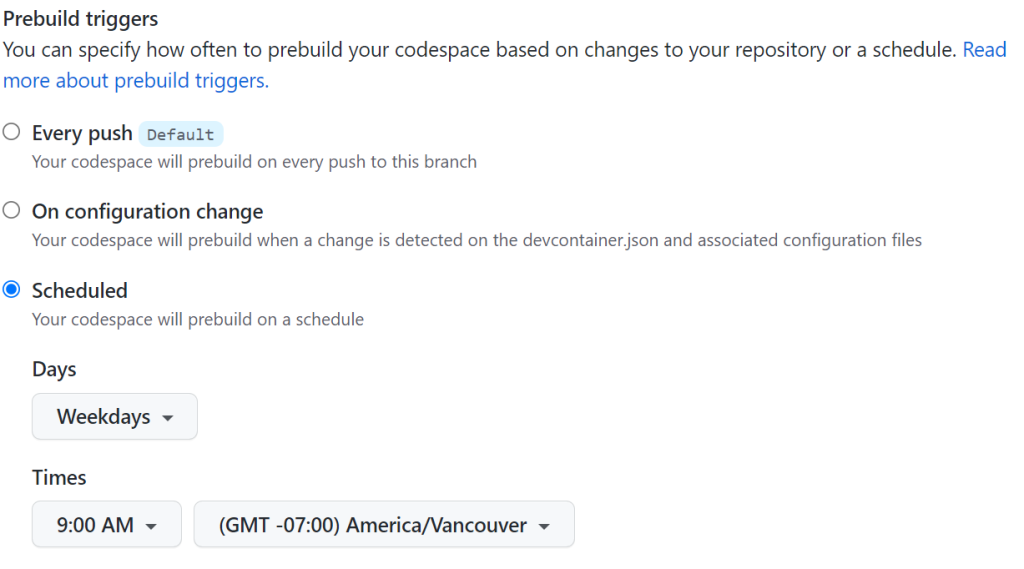
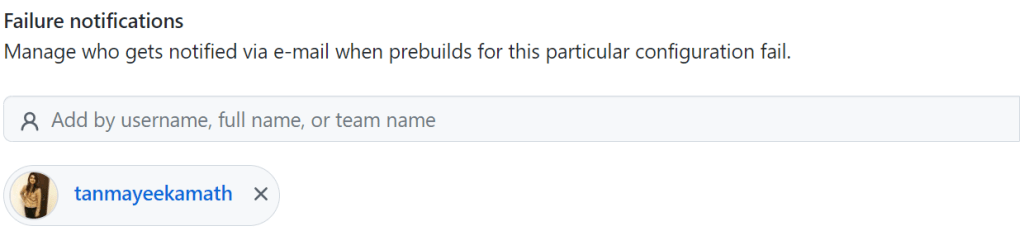

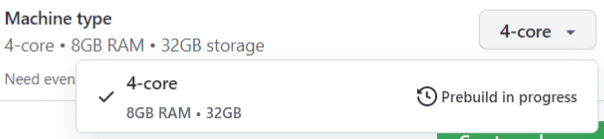



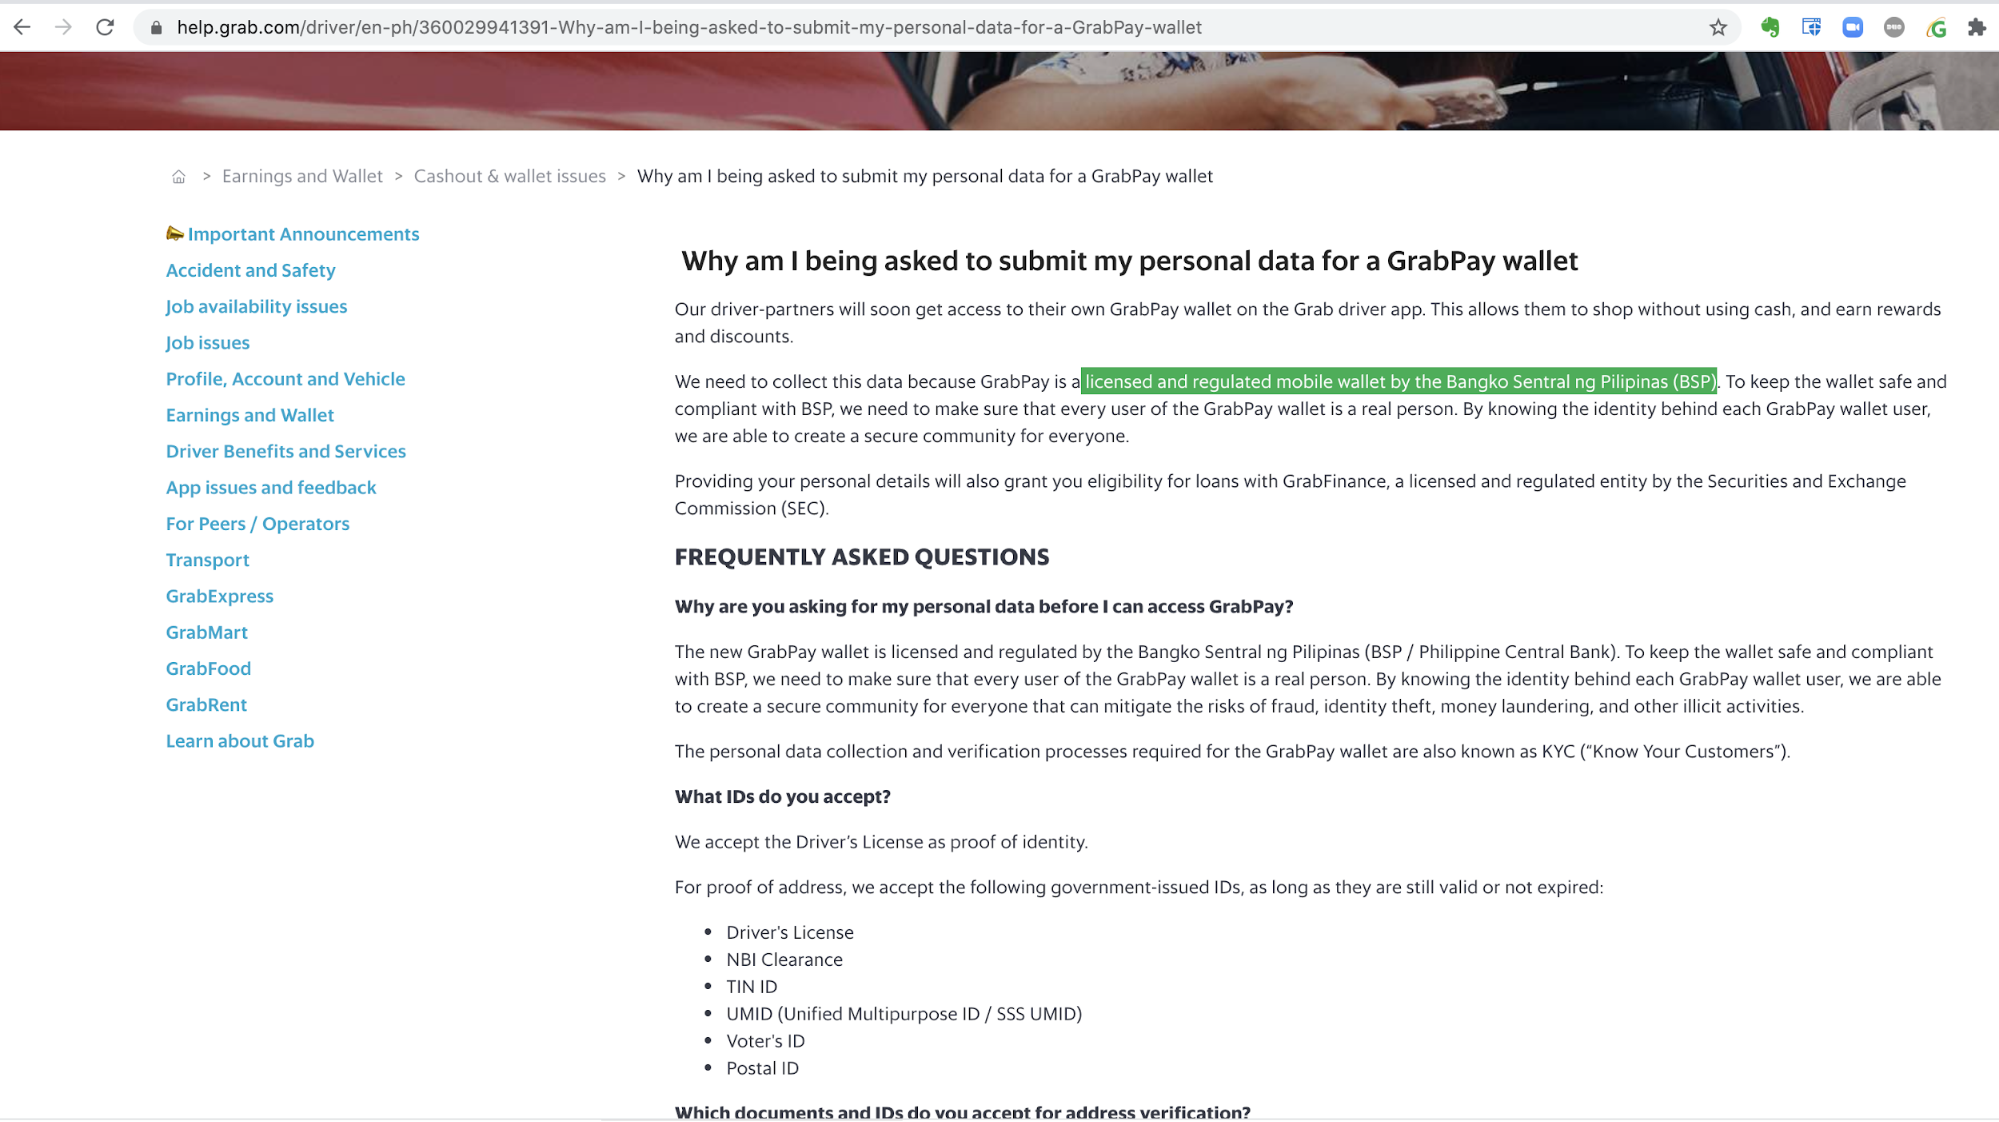
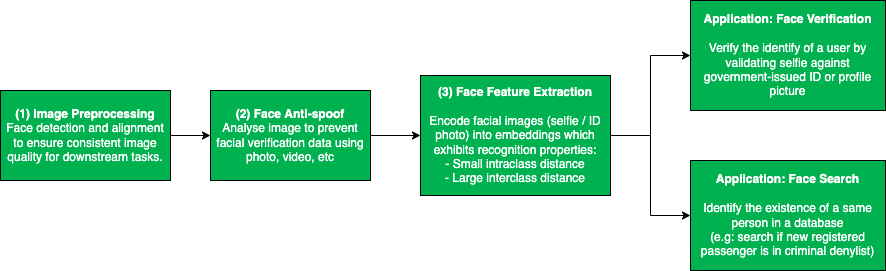

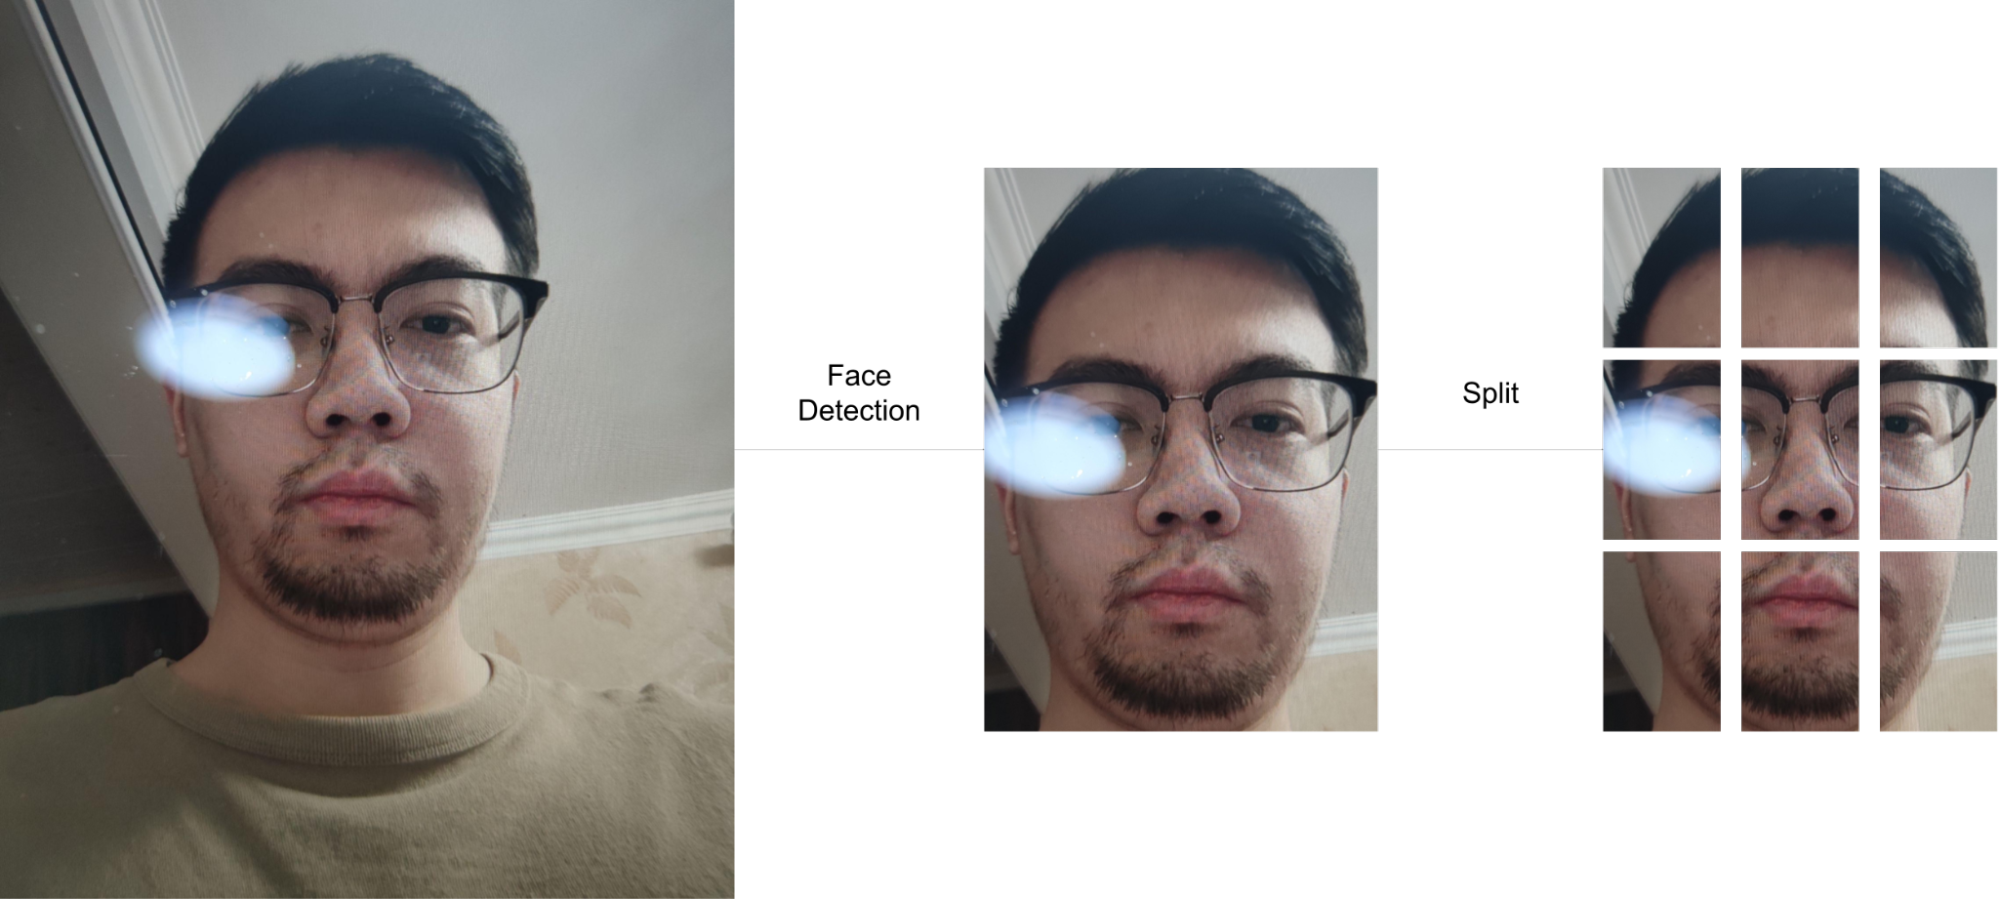
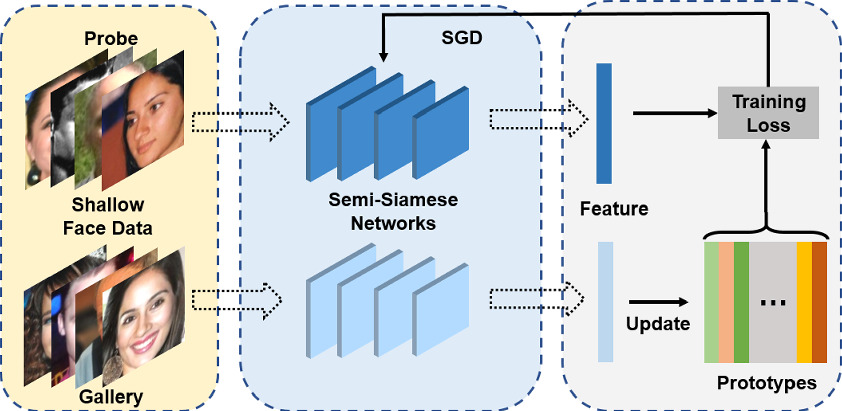
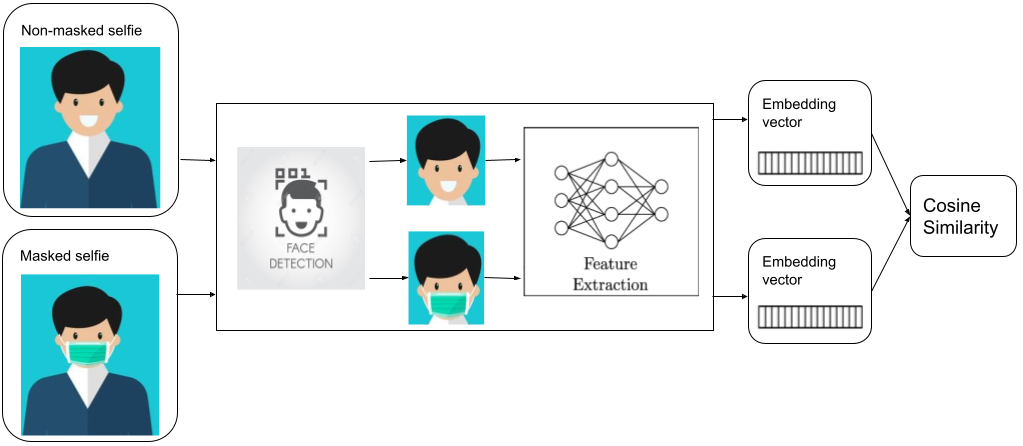
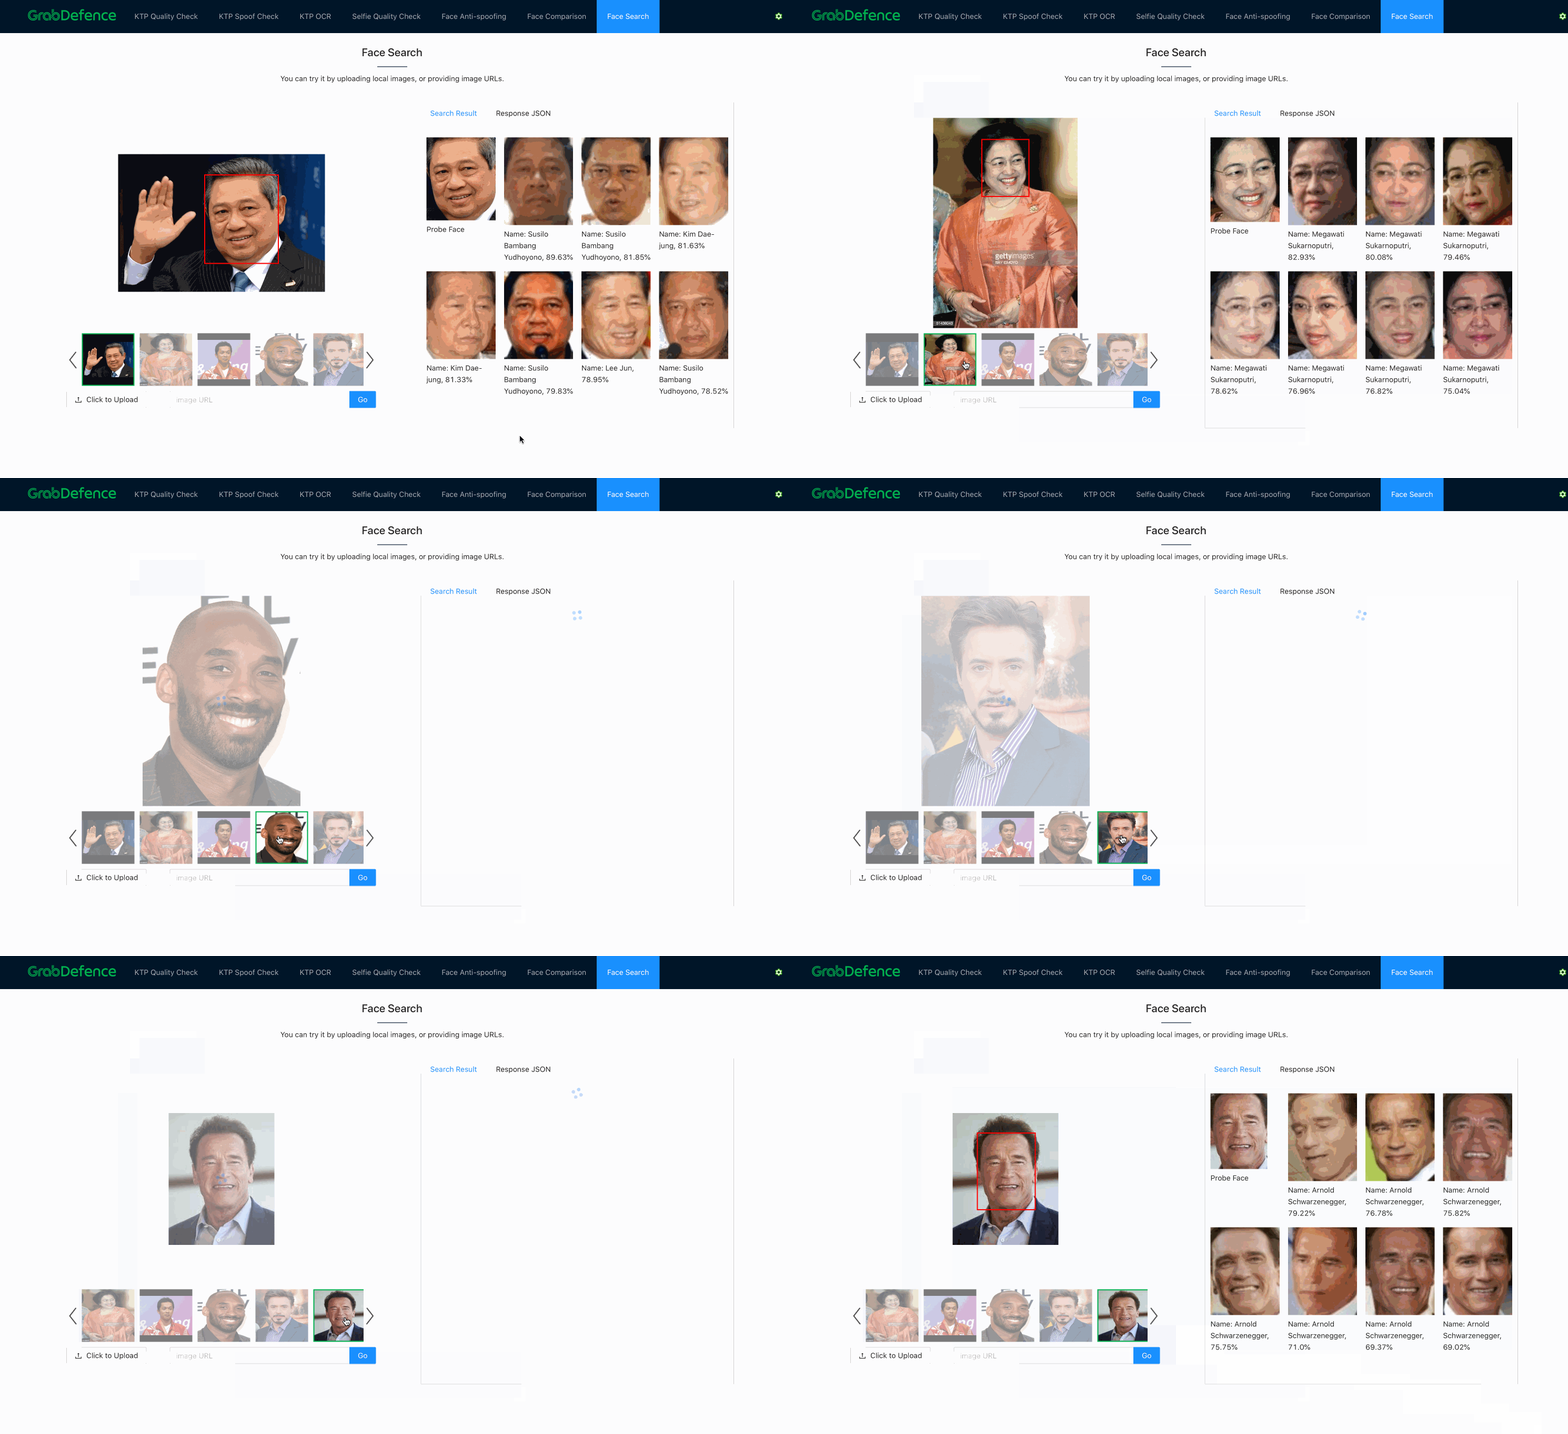
 Dependencies
 A new home


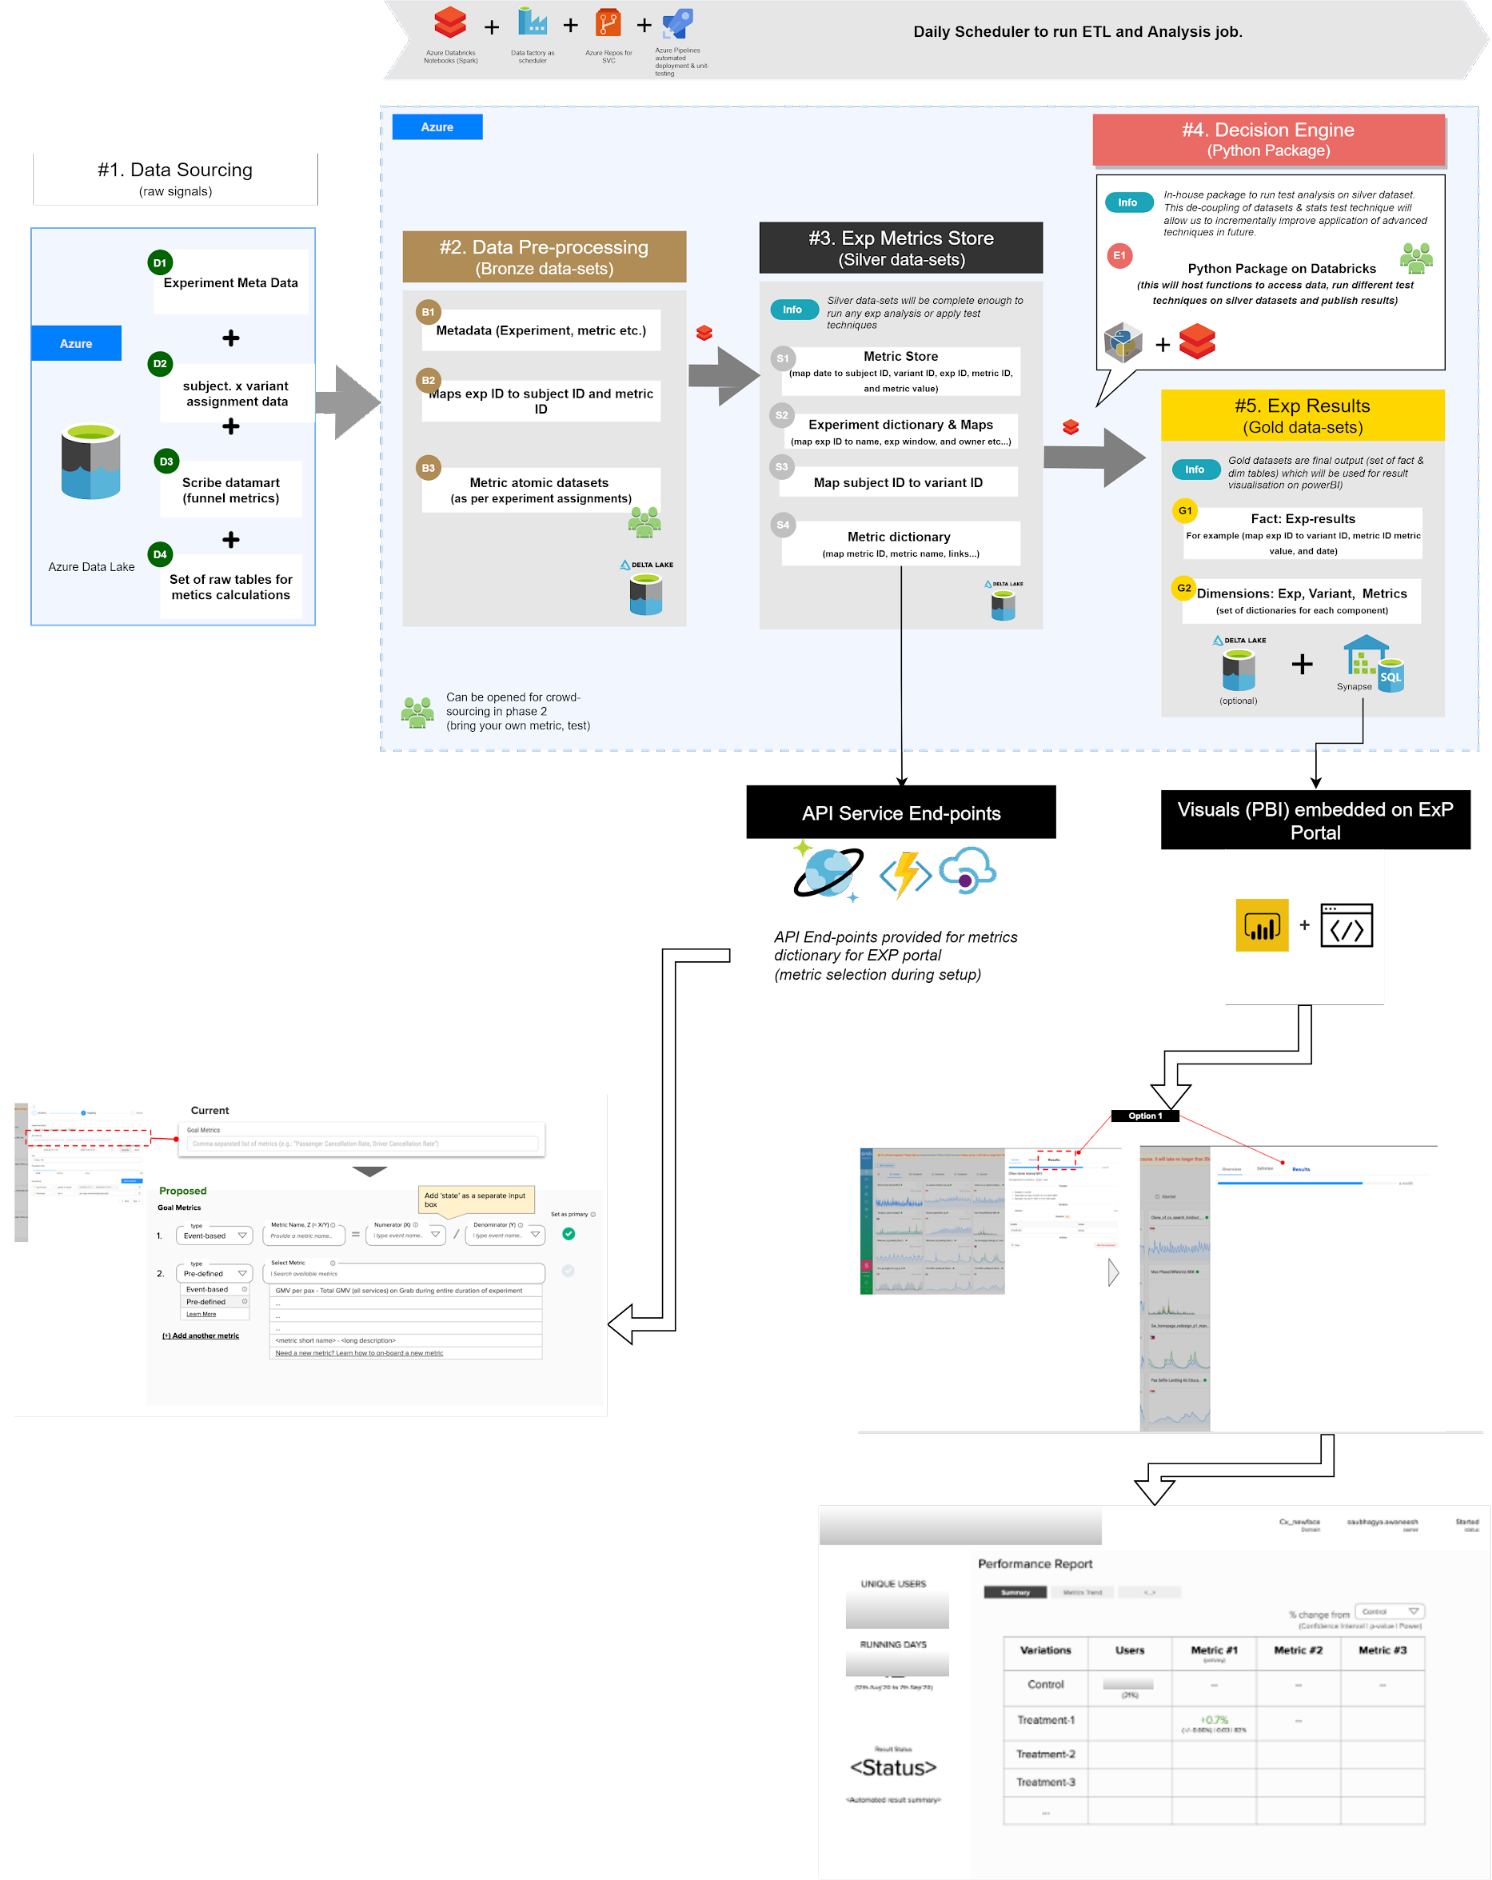


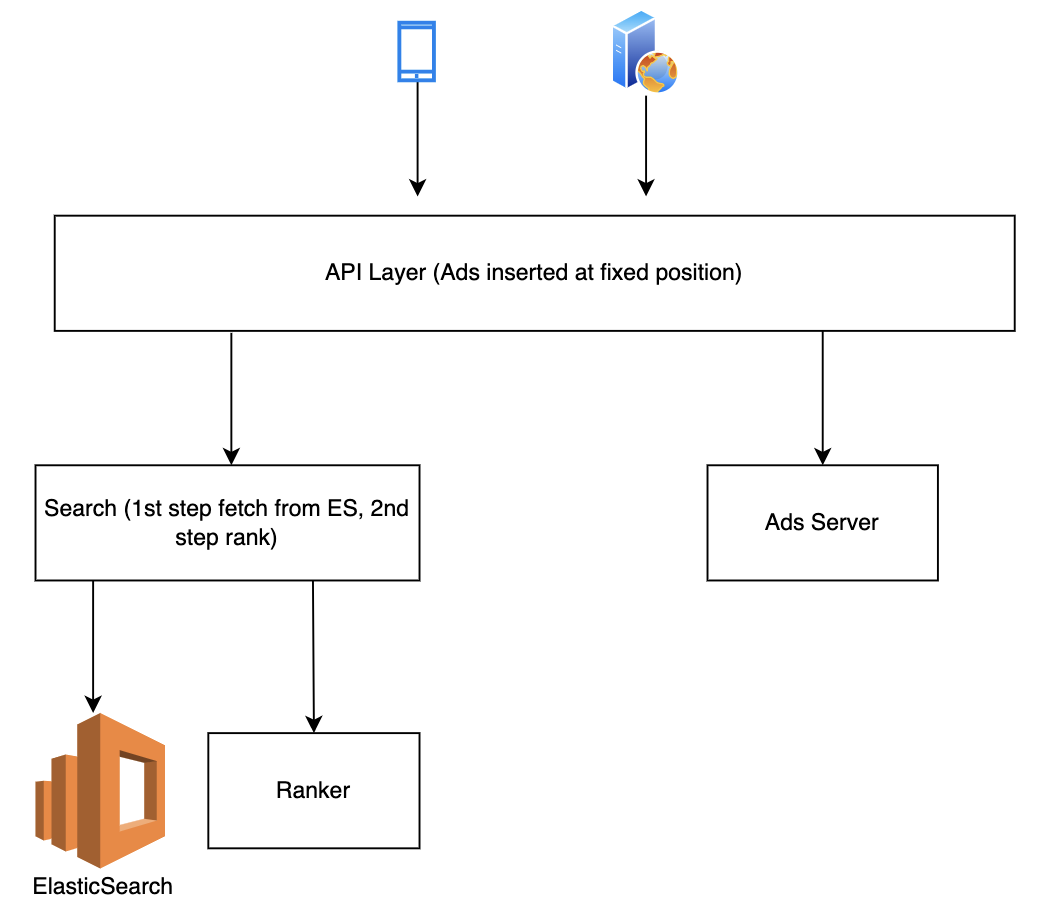
 The pitch: When it comes to what we’re going to work on (outside of the big pieces of work on
 In addition to using issues to propose and converse on pitches from the team, we use the new projects experience to track and manage all the pitches from the team so we can see them in an all-up table or board view.
 Keep it small: We knew for ourselves, and for developers, that we didn’t want to lock them into a specific planning methodology and over-complicate a team’s planning and tracking process. For us, we wanted to plan shorter cycles for our team to increase our tempo and focus, so we opted for six-week cycles to break up and build features. Check out how we recommend getting started with this approach in a
 Ship to learn: Similar to how we ship a lot of our products, we knew developers and customers were going to be heavily intertwined with each and every ship, giving us immediate feedback in both the private and public beta. Their


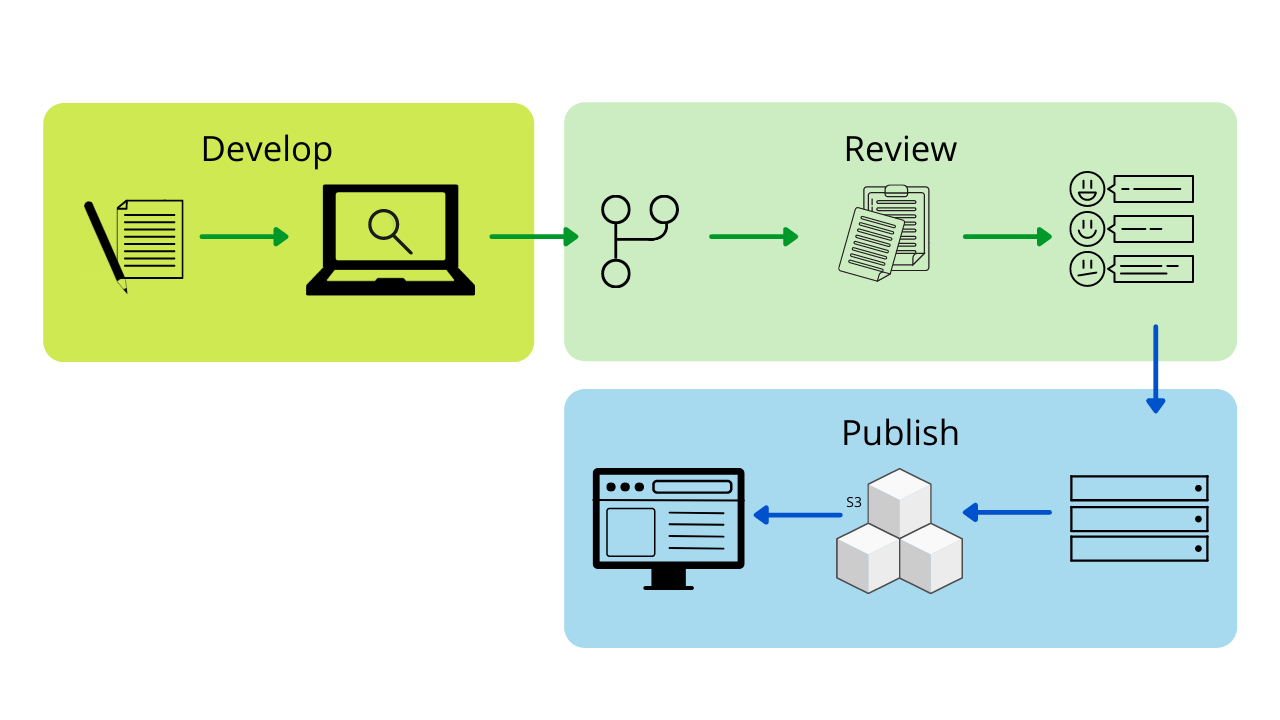
 The importance of friendly fork management
 , it takes a deeper understanding to successfully manage a fork once you have it. Management (or lack thereof) can make or break friendly forks for the following reasons:
 Our management strategies
 Finding your perfect match

 Wrapping up

 To fork or not to fork
 What is a friendly fork?
 A tale of three forks



 That’s all for now!
 peeled for our second post in the “friend zone” series, in which we’ll talk about how these forks are managed and how you can adapt their strategies to your very own friendly fork!